

Compact Muon Solenoid
LHC, CERN
| CMS-PAS-FTR-18-031 | ||
| Expected sensitivities for $\mathrm{ t \bar{t} } \mathrm{ t \bar{t} }$ production at HL-LHC and HE-LHC | ||
| CMS Collaboration | ||
| December 2018 | ||
| Abstract: The CMS searches for the production of four top quarks ($\mathrm{ t \bar{t} } \mathrm{ t \bar{t} }$) are used to provide projections for the High-Luminosity LHC and High-Energy LHC. Final states with same sign leptons or three or more leptons as well as multiple b-tagged jets are used in these projections. Several different scenarios for the systematic uncertainties are considered. For proton-proton collisions at $\sqrt{s}= $ 14 TeV, the existing analysis strategies are expected to become dominated by systematic uncertainties. Evidence for $\mathrm{ t \bar{t} }\mathrm{ t \bar{t} }$ in a single analysis will become possible with around 300 fb$^{-1}$ of High-Luminosity LHC data at 14 TeV center-of-mass energy. With these datasets the uncertainty on the measured cross section will be of the order of 33 to 43%, depending on the systematic uncertainty. With 3 ab$^{-1}$ of High-Luminosity LHC data, the cross section can be constrained to 9% statistical uncertainty and 18 to 28% total uncertainty. At High-Energy LHC it would be possible to constrain the $\mathrm{ t \bar{t} }\mathrm{ t \bar{t} }$ cross section to within 1 to 2% statistical uncertainty. | ||
| Links: CDS record (PDF) ; inSPIRE record ; CADI line (restricted) ; | ||
| Figures | |

png pdf |
Figure 1:
Summary of the branching fractions of $ {{\mathrm {t}\overline {\mathrm {t}}}} {{\mathrm {t}\overline {\mathrm {t}}}} $ production. |
png pdf |
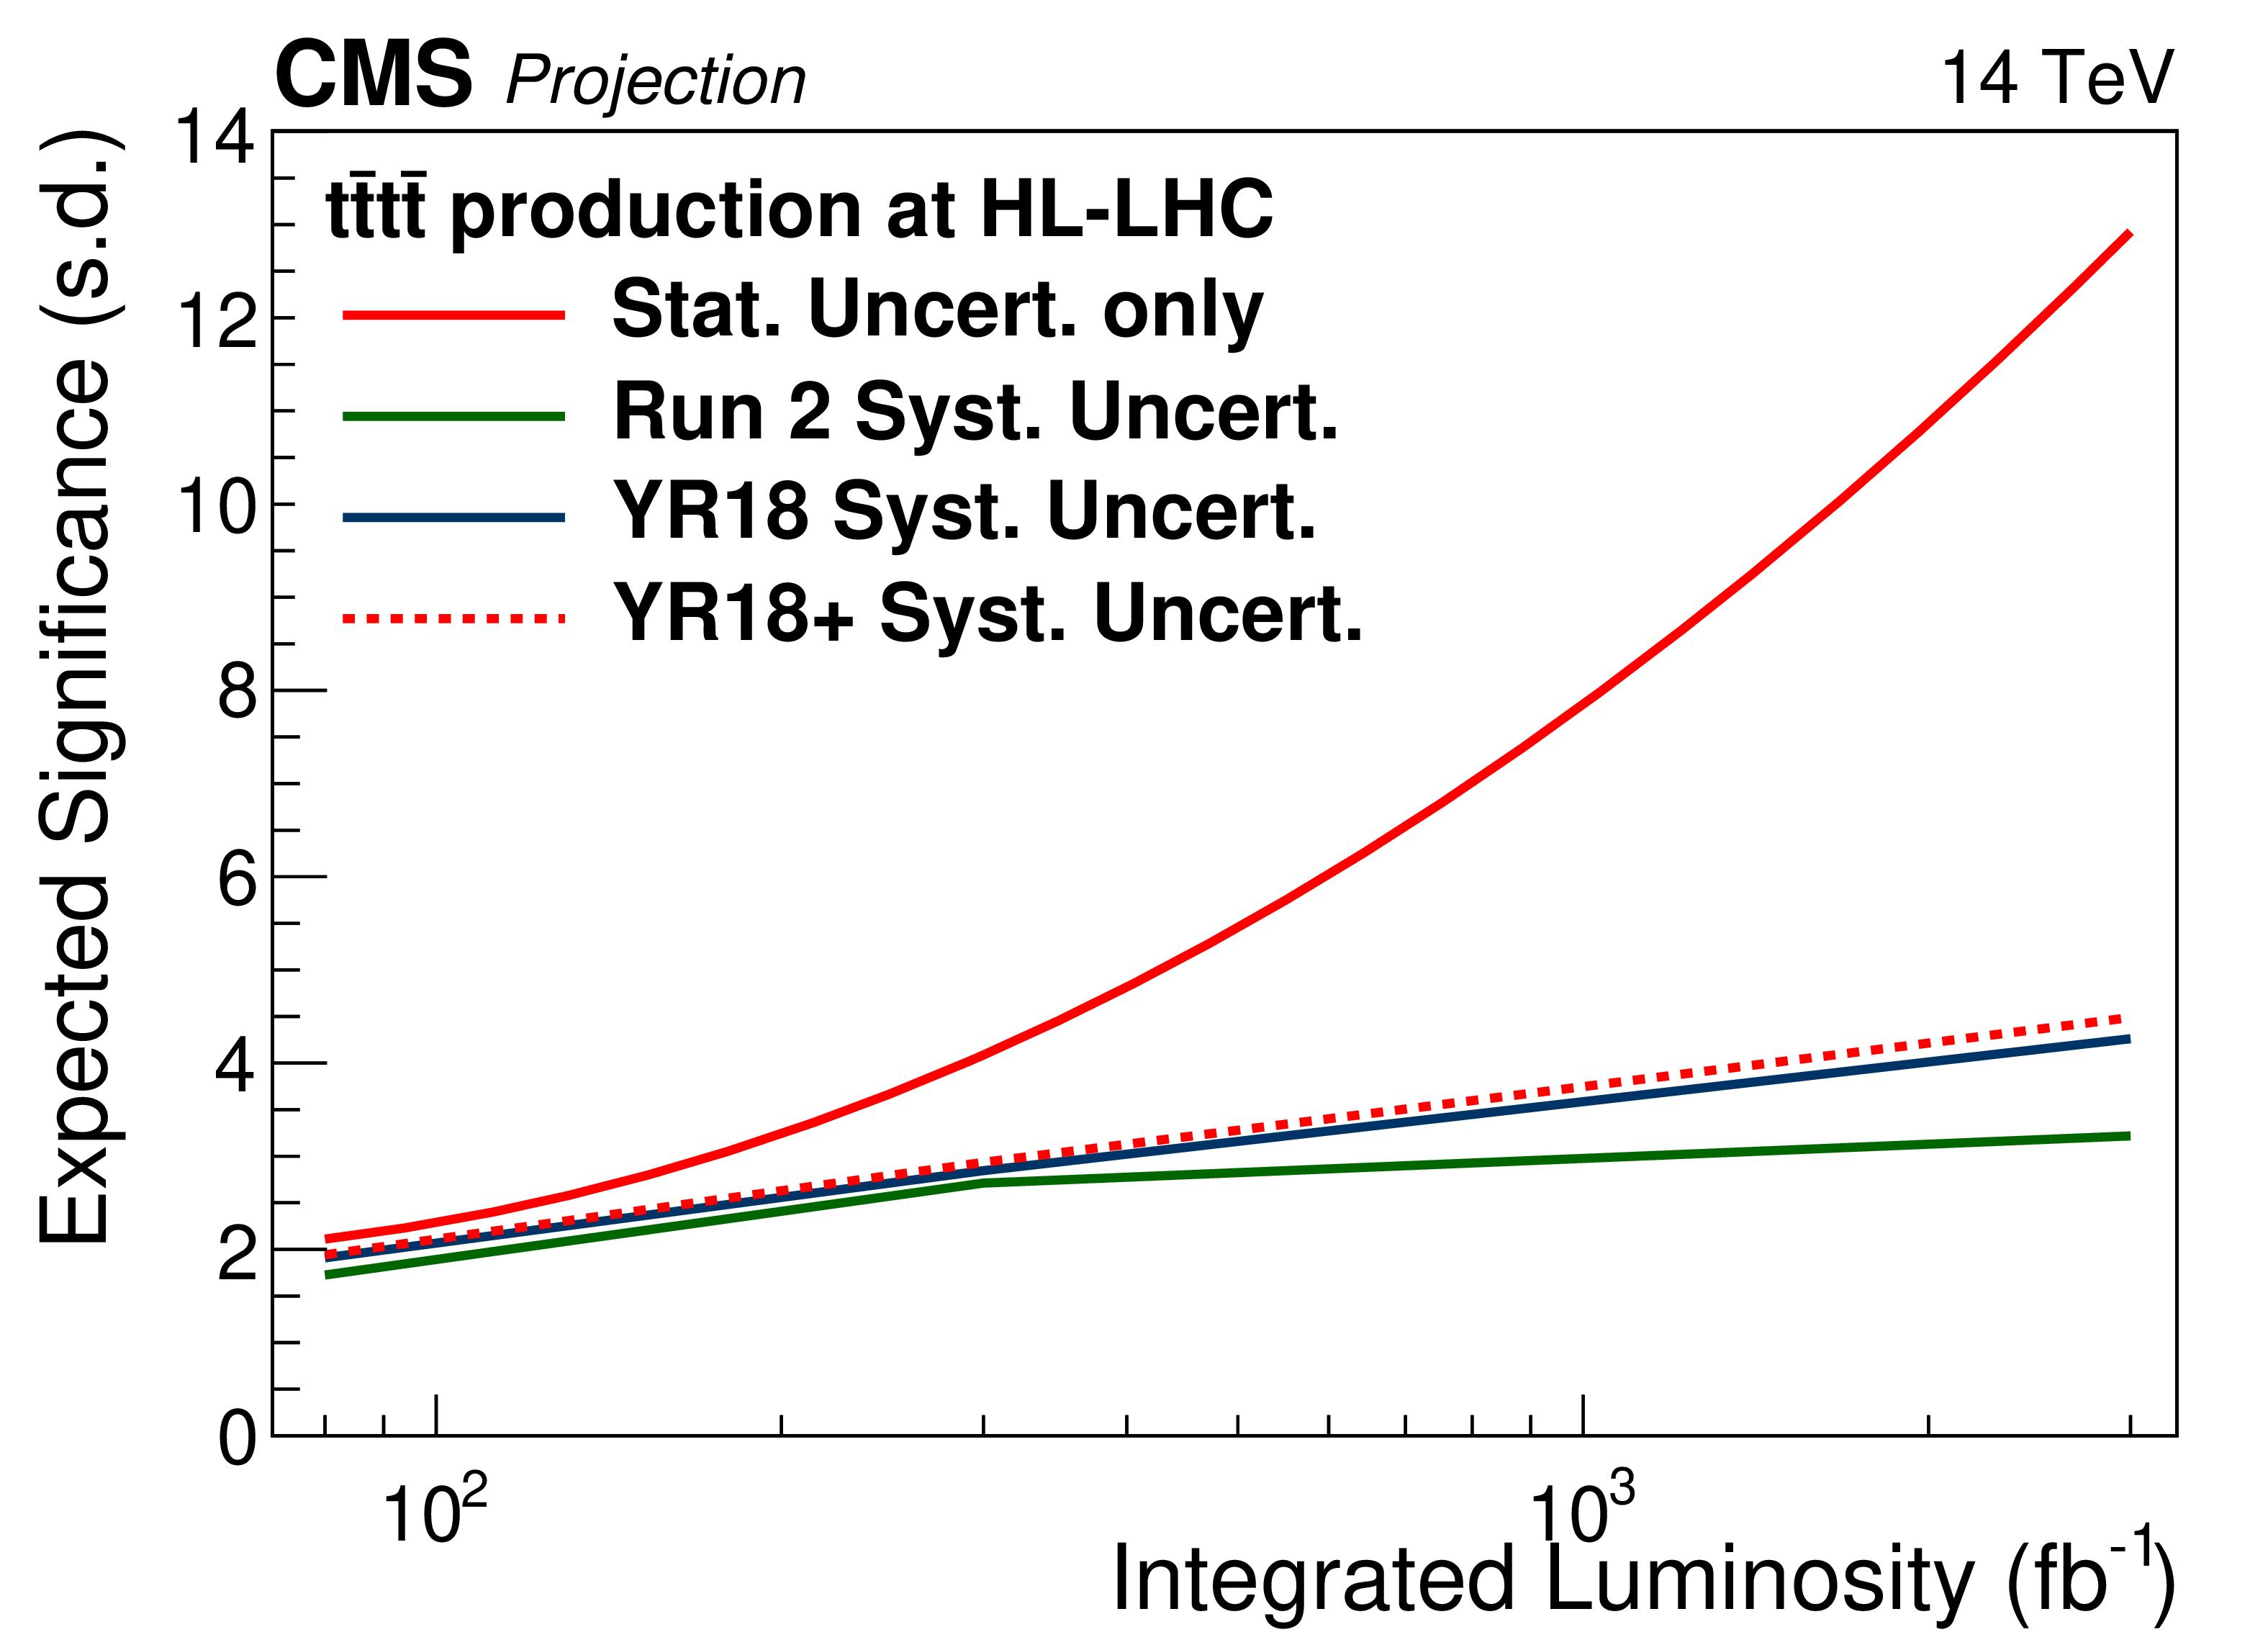
Figure 2:
Expected significance of a search for $ {{\mathrm {t}\overline {\mathrm {t}}}} {{\mathrm {t}\overline {\mathrm {t}}}} $ production with CMS at HL-LHC. The expected significance of $ {{\mathrm {t}\overline {\mathrm {t}}}} {{\mathrm {t}\overline {\mathrm {t}}}} $ signal over a background-only hypothesis in standard deviations (s.d.) is given for various HL-LHC systematic uncertainty scenarios. |

png pdf |
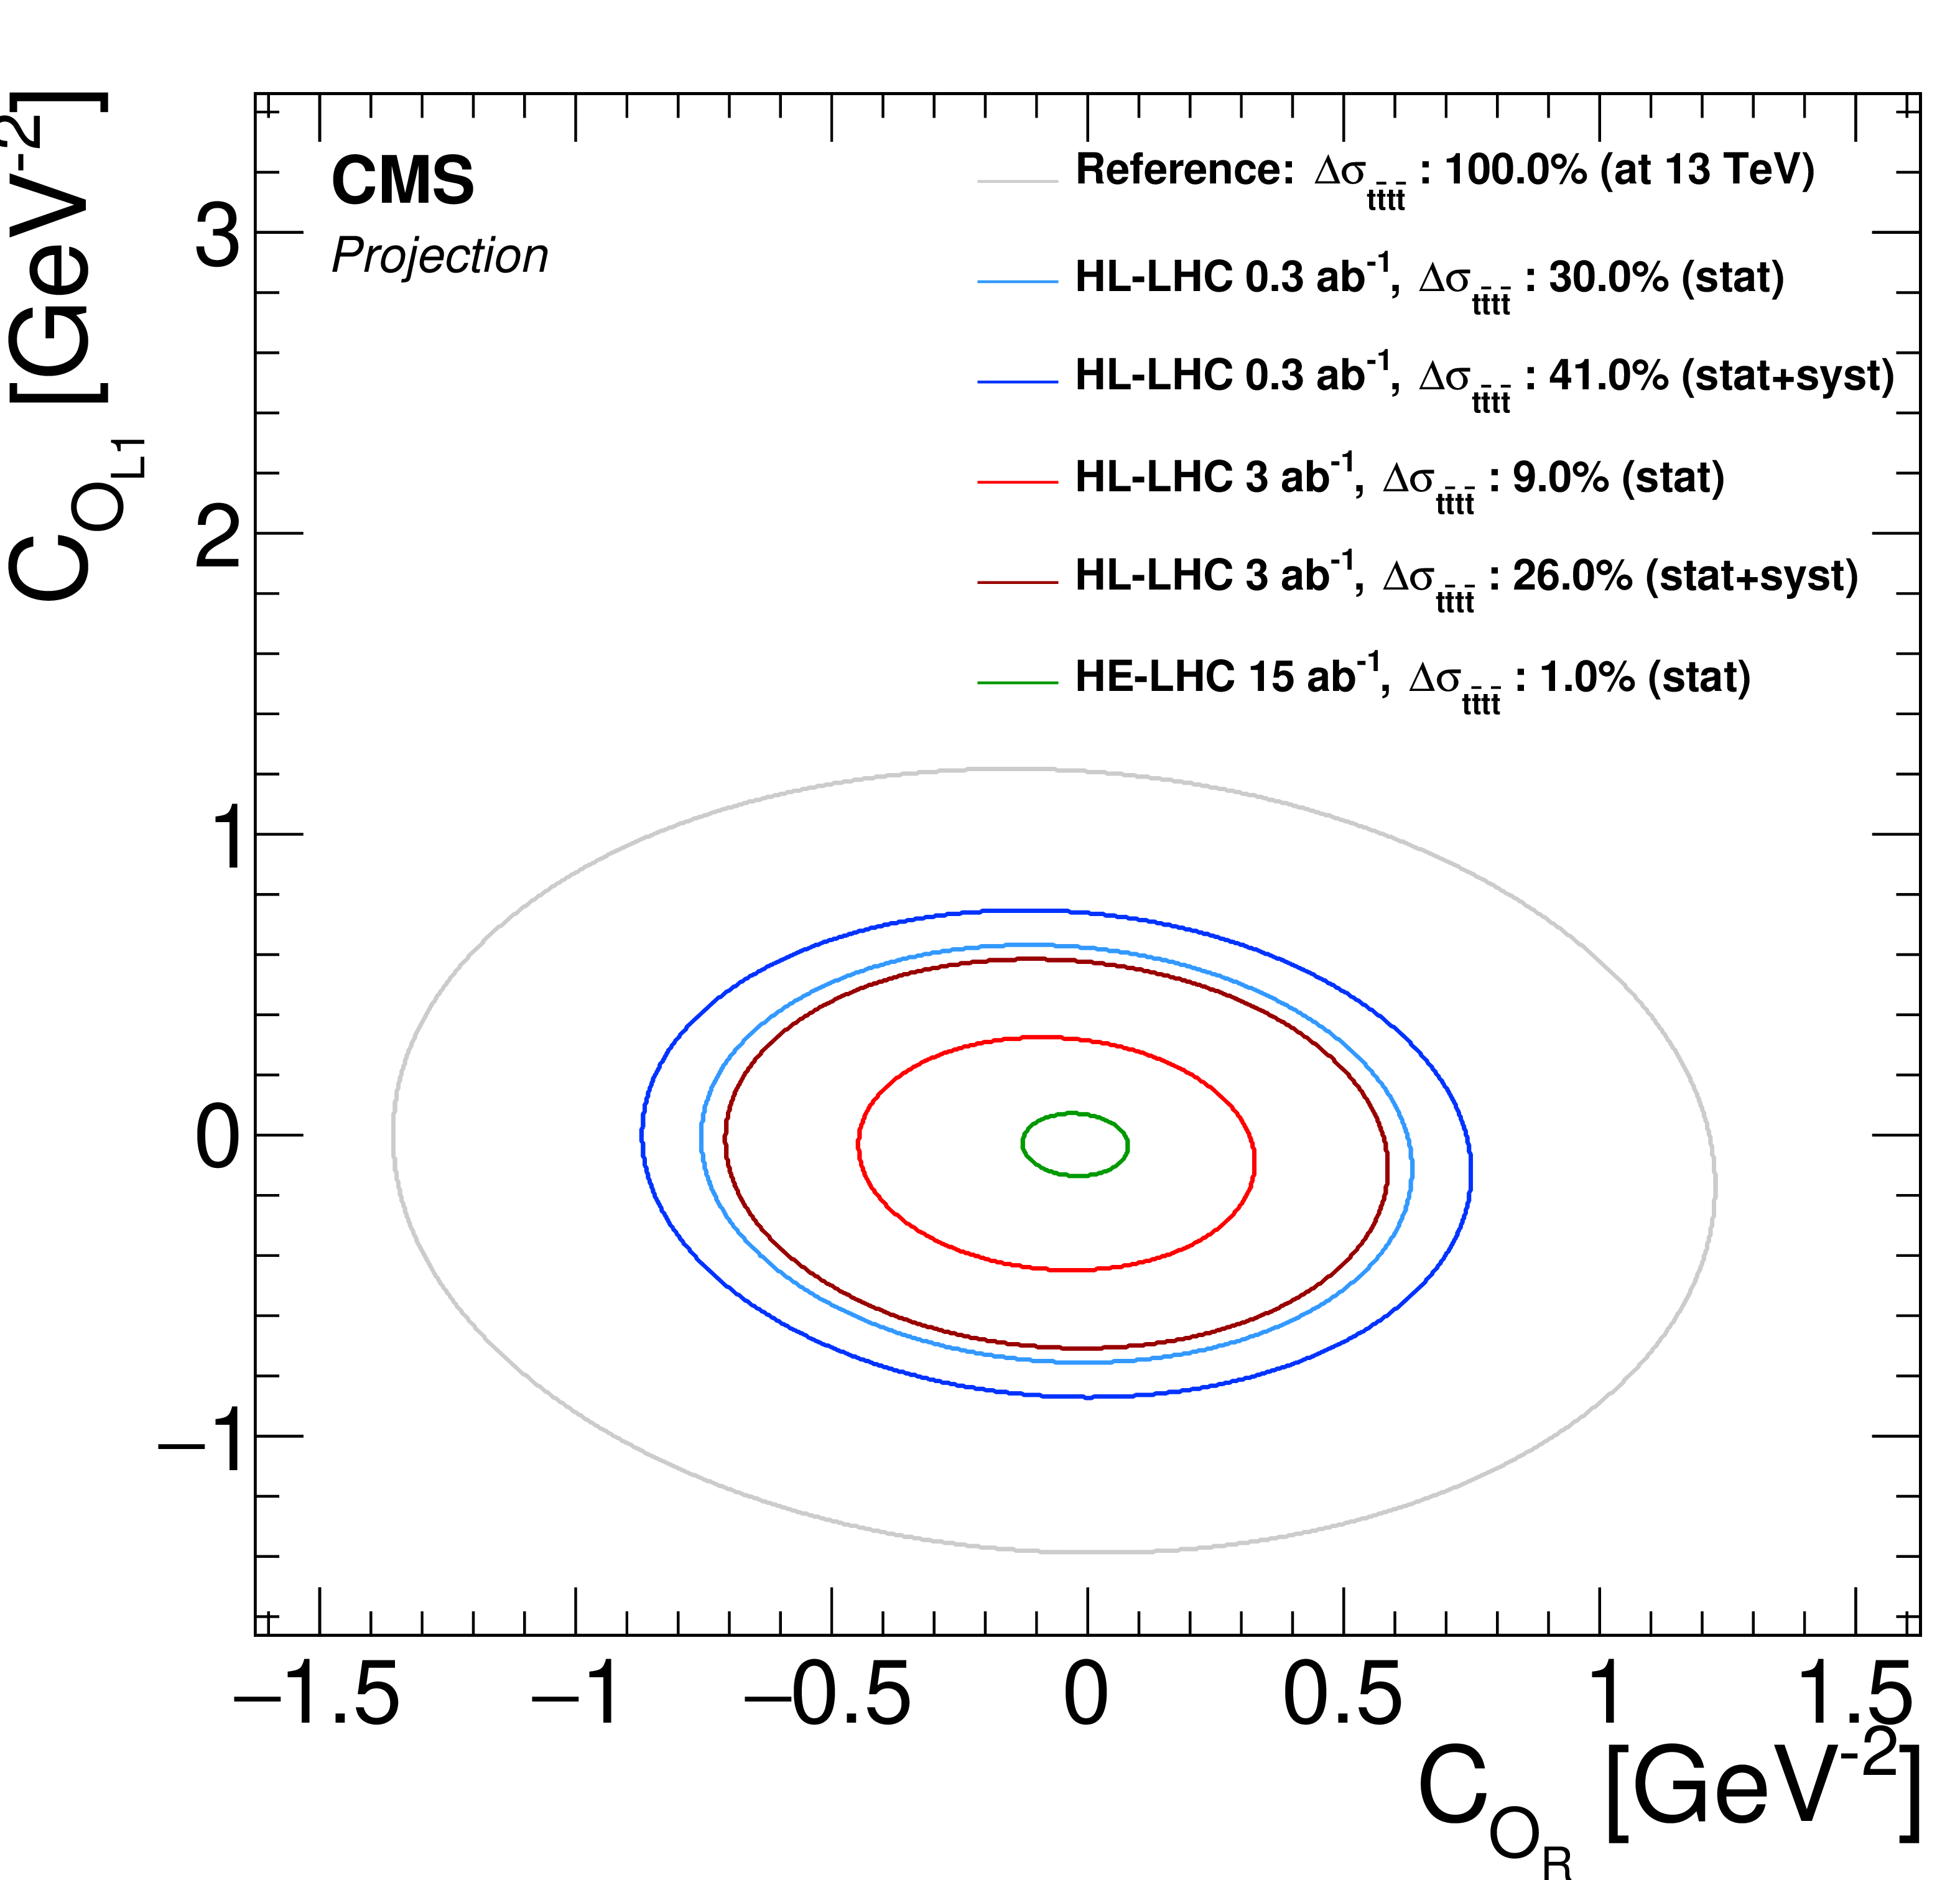
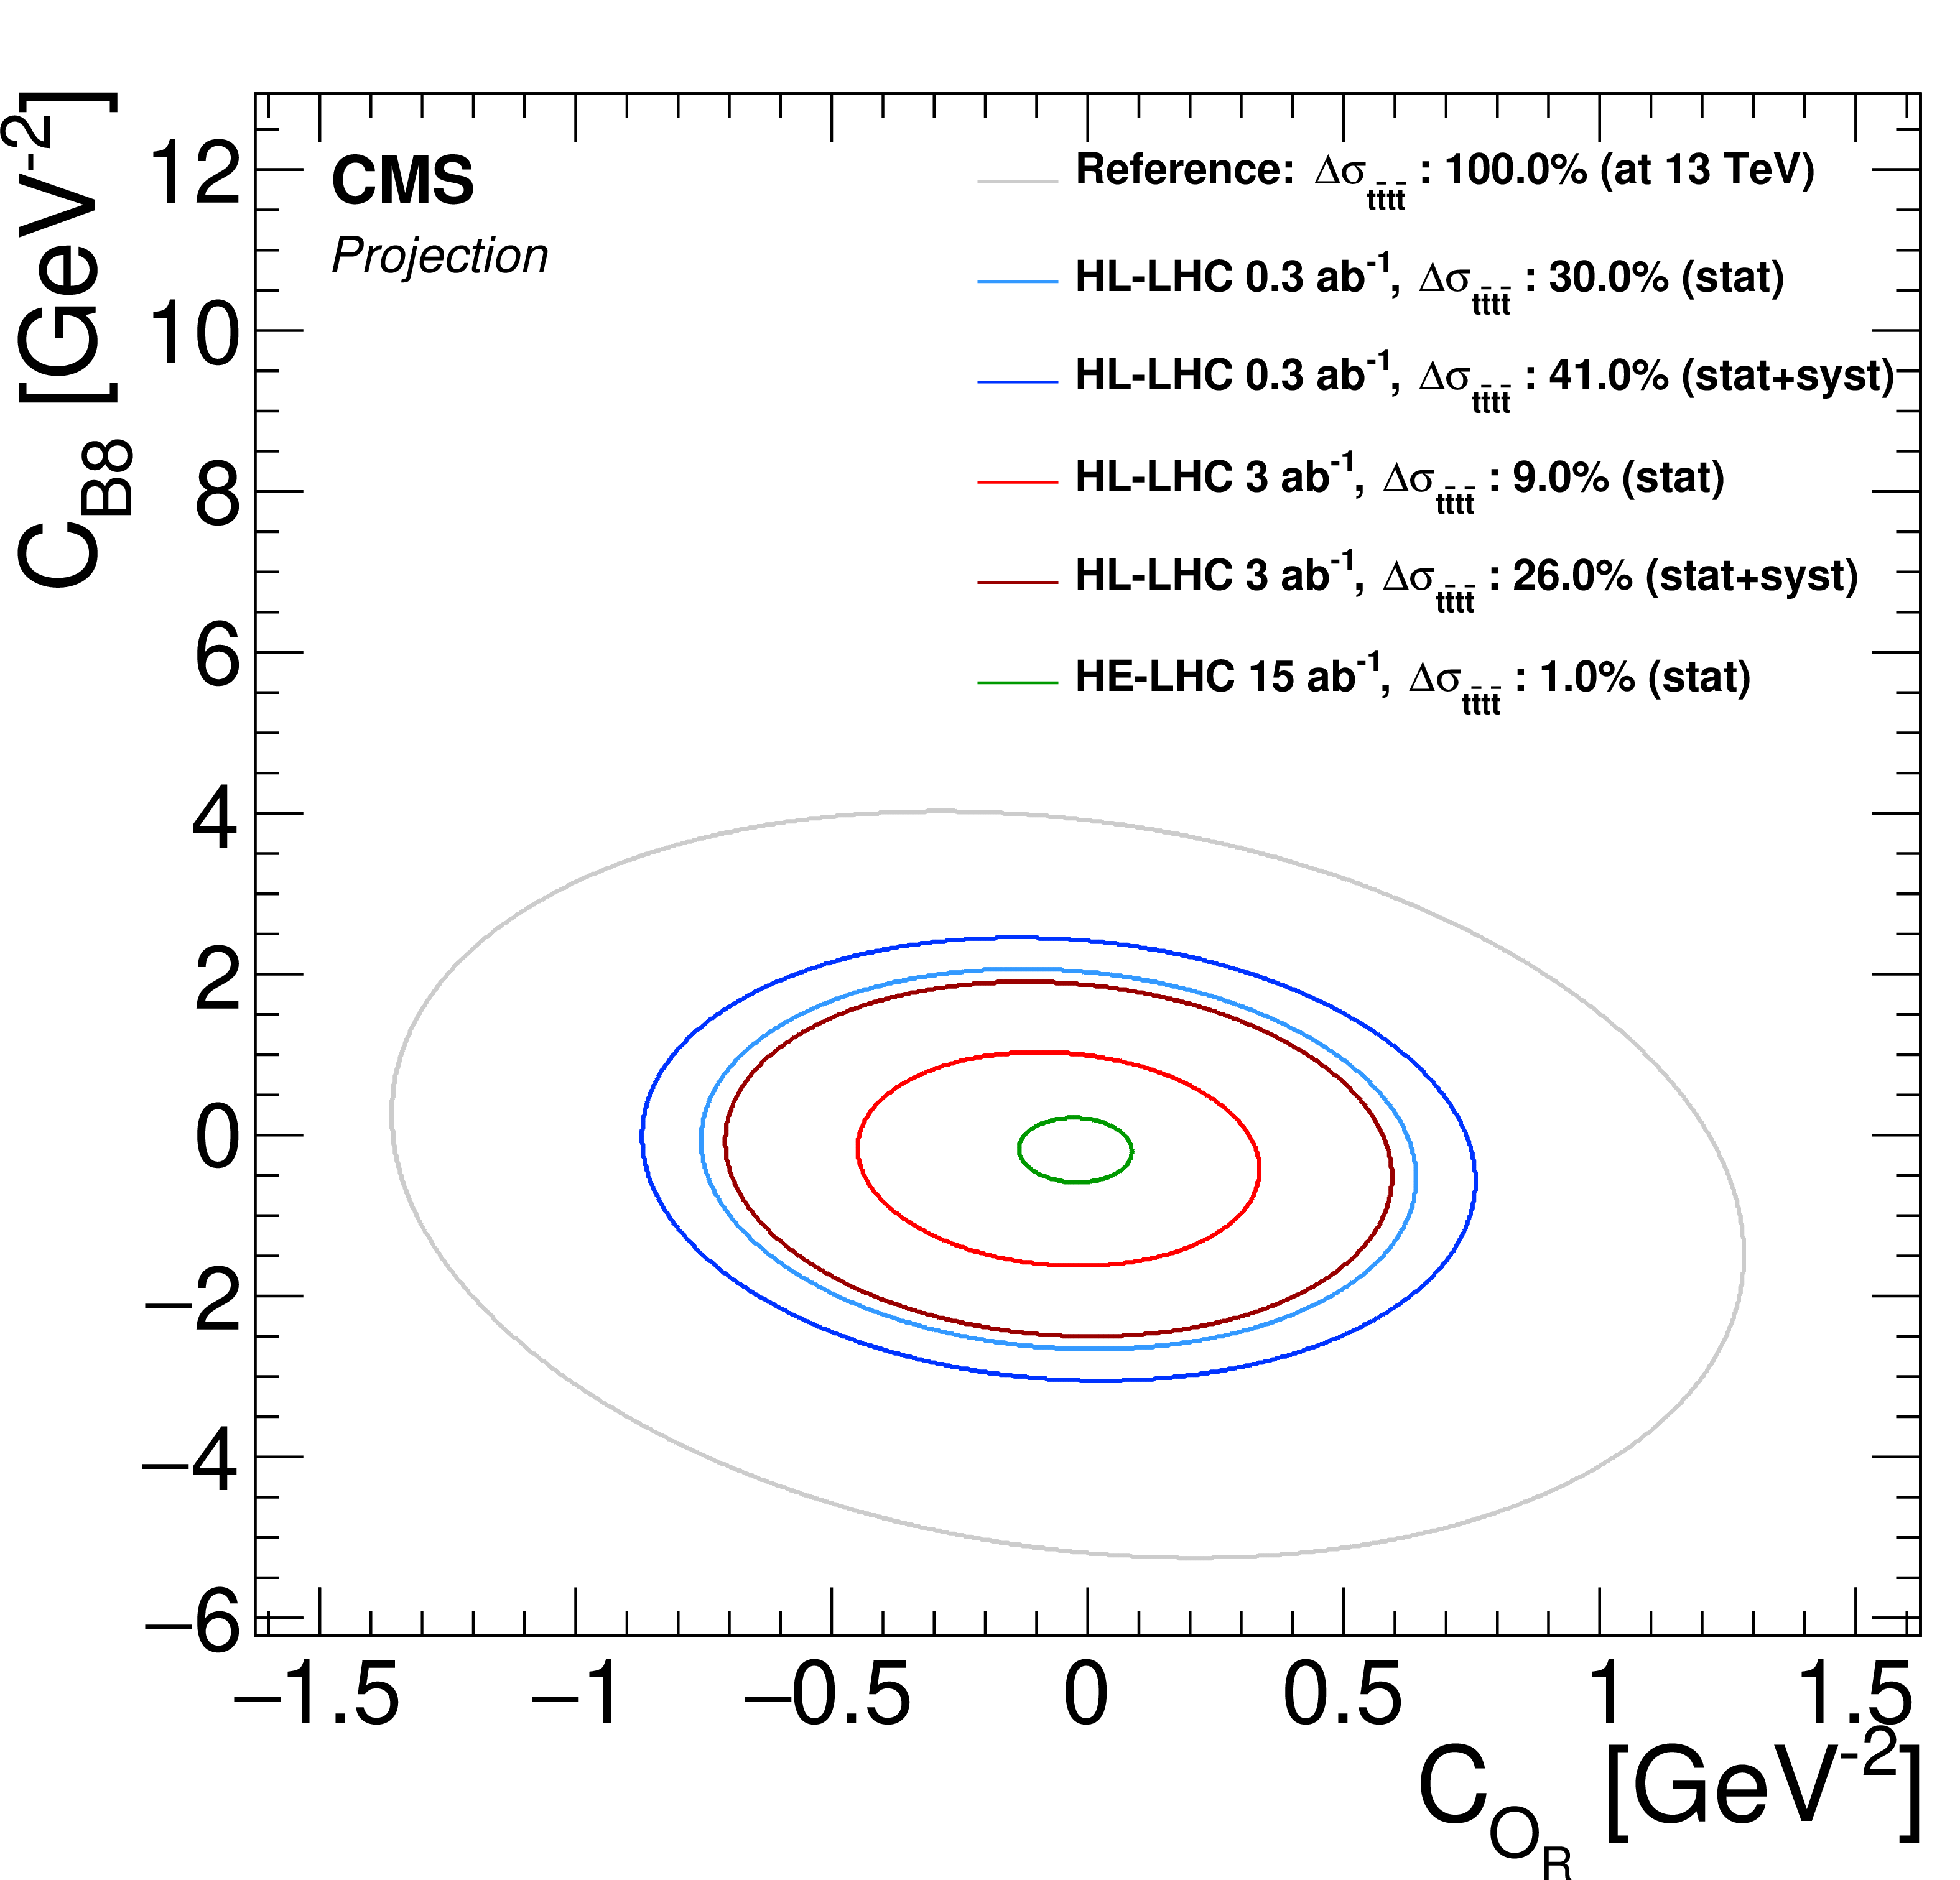
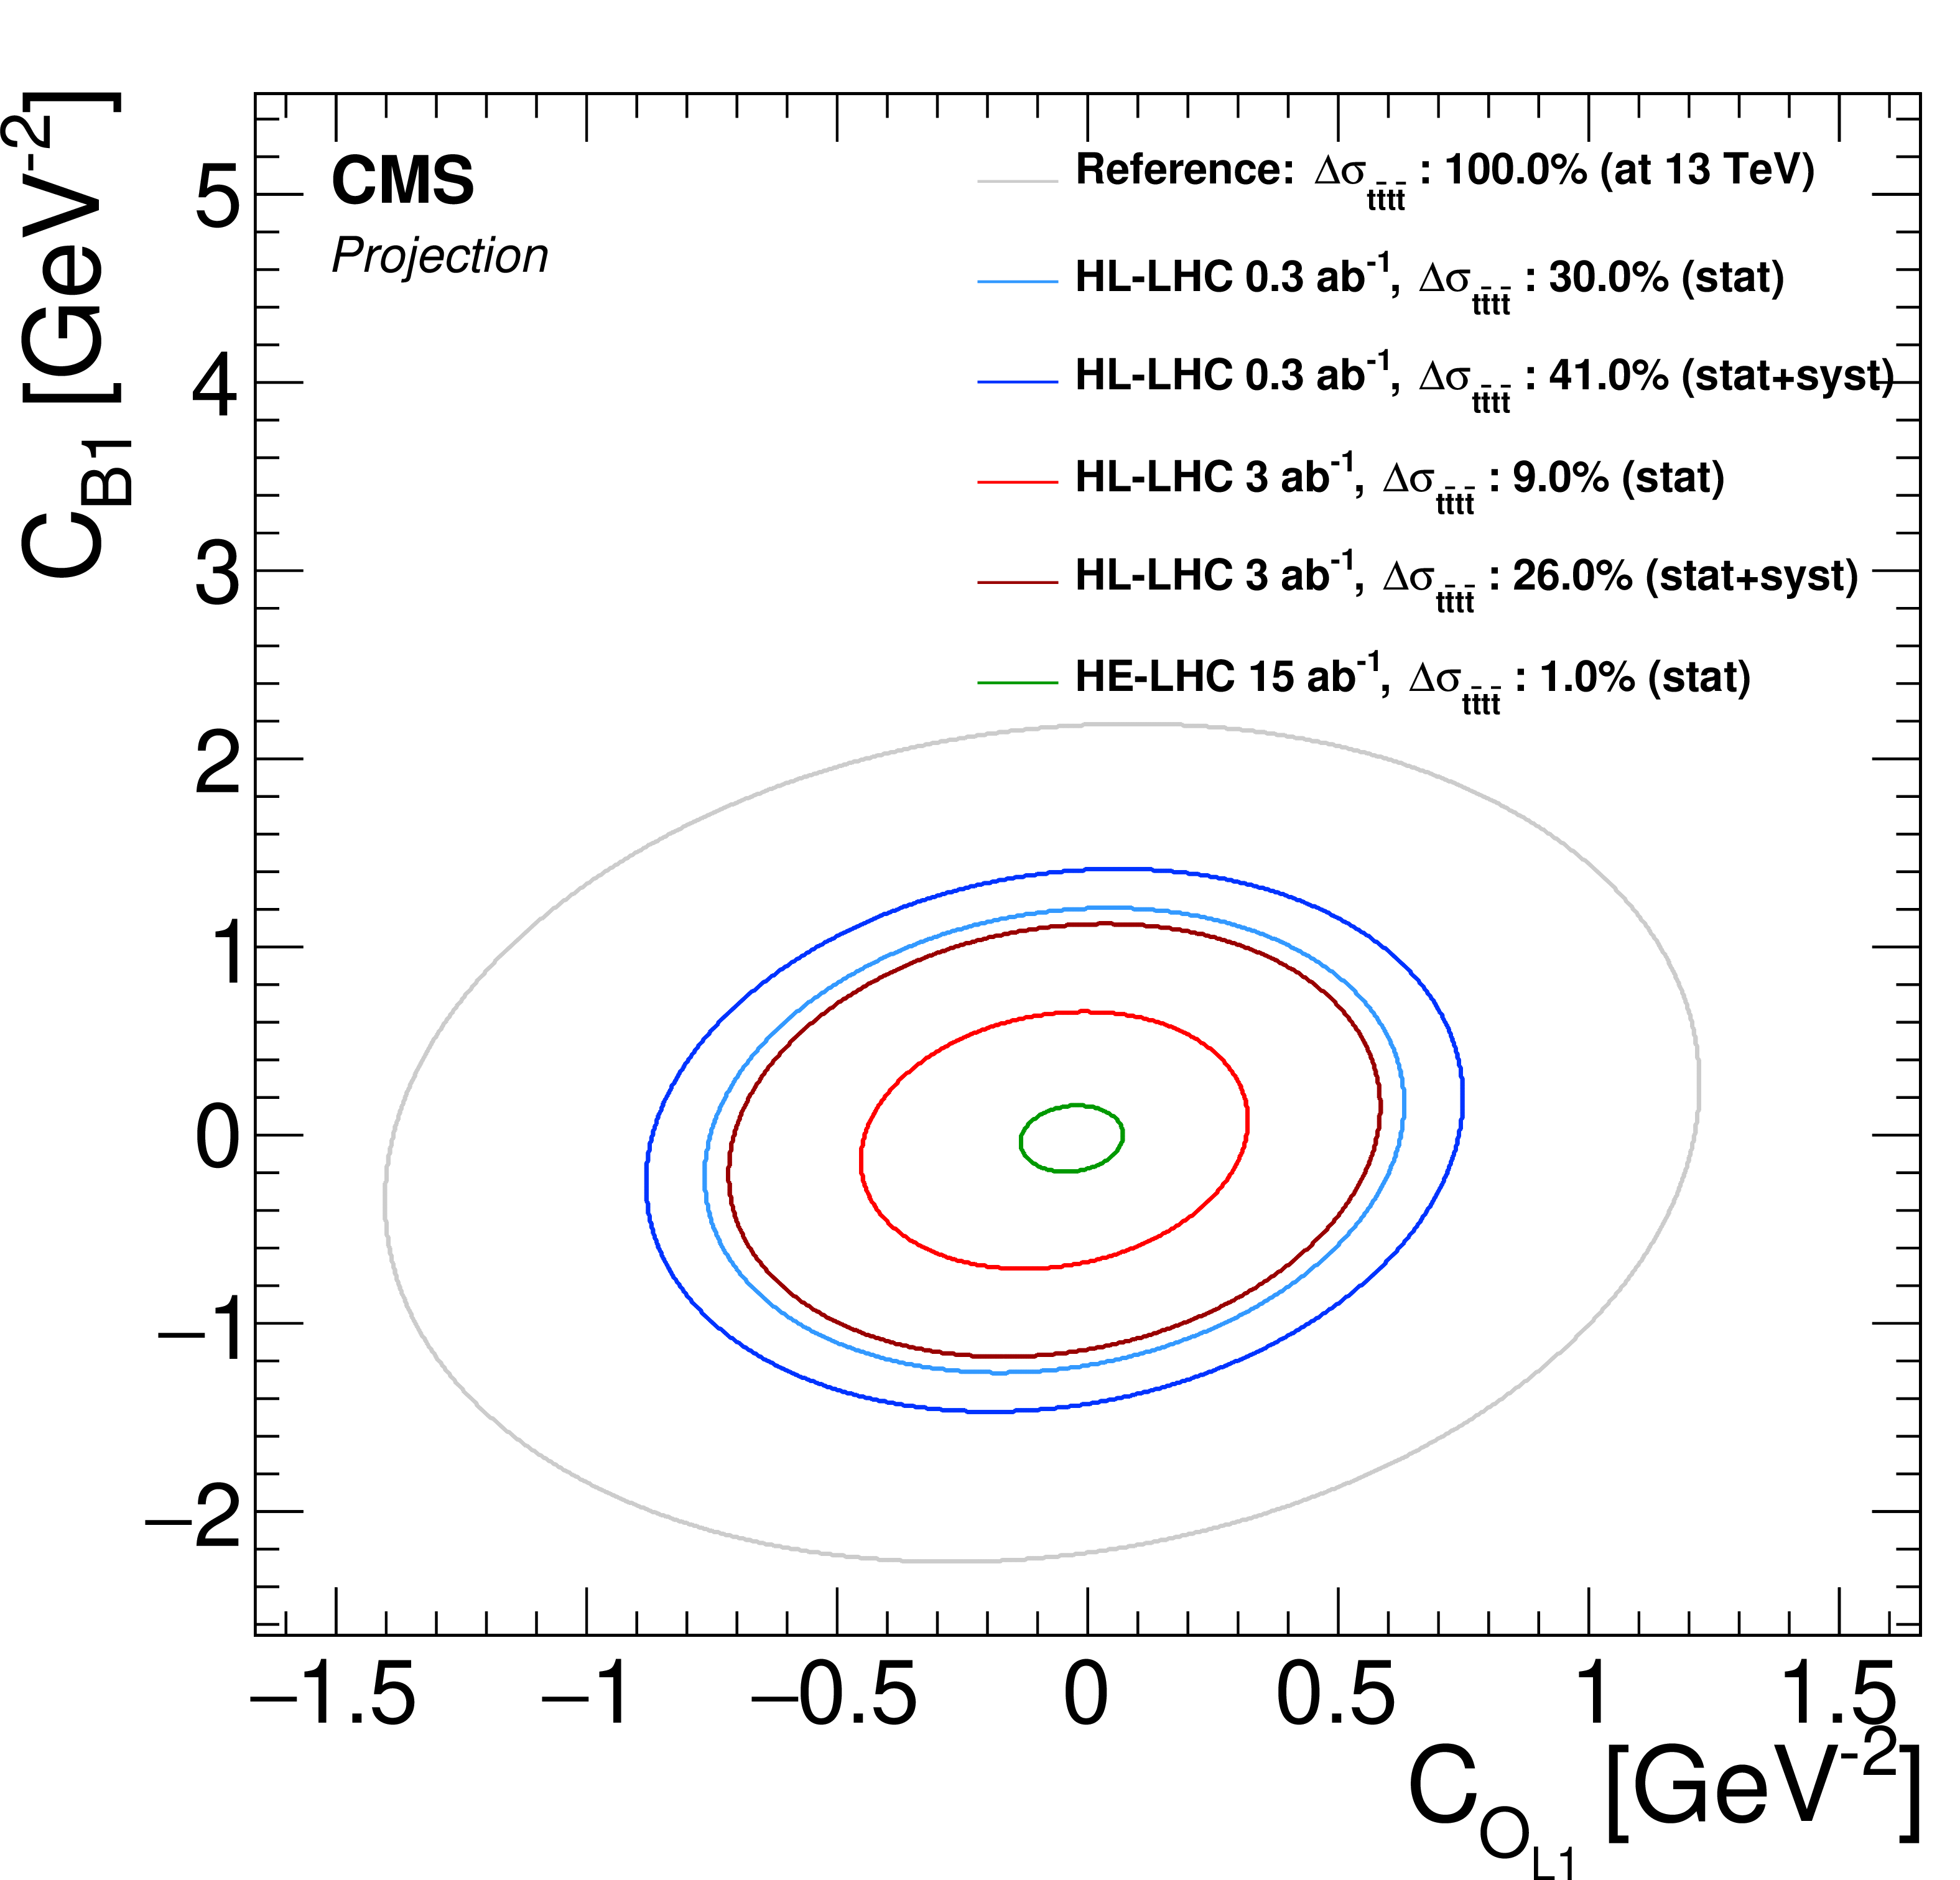
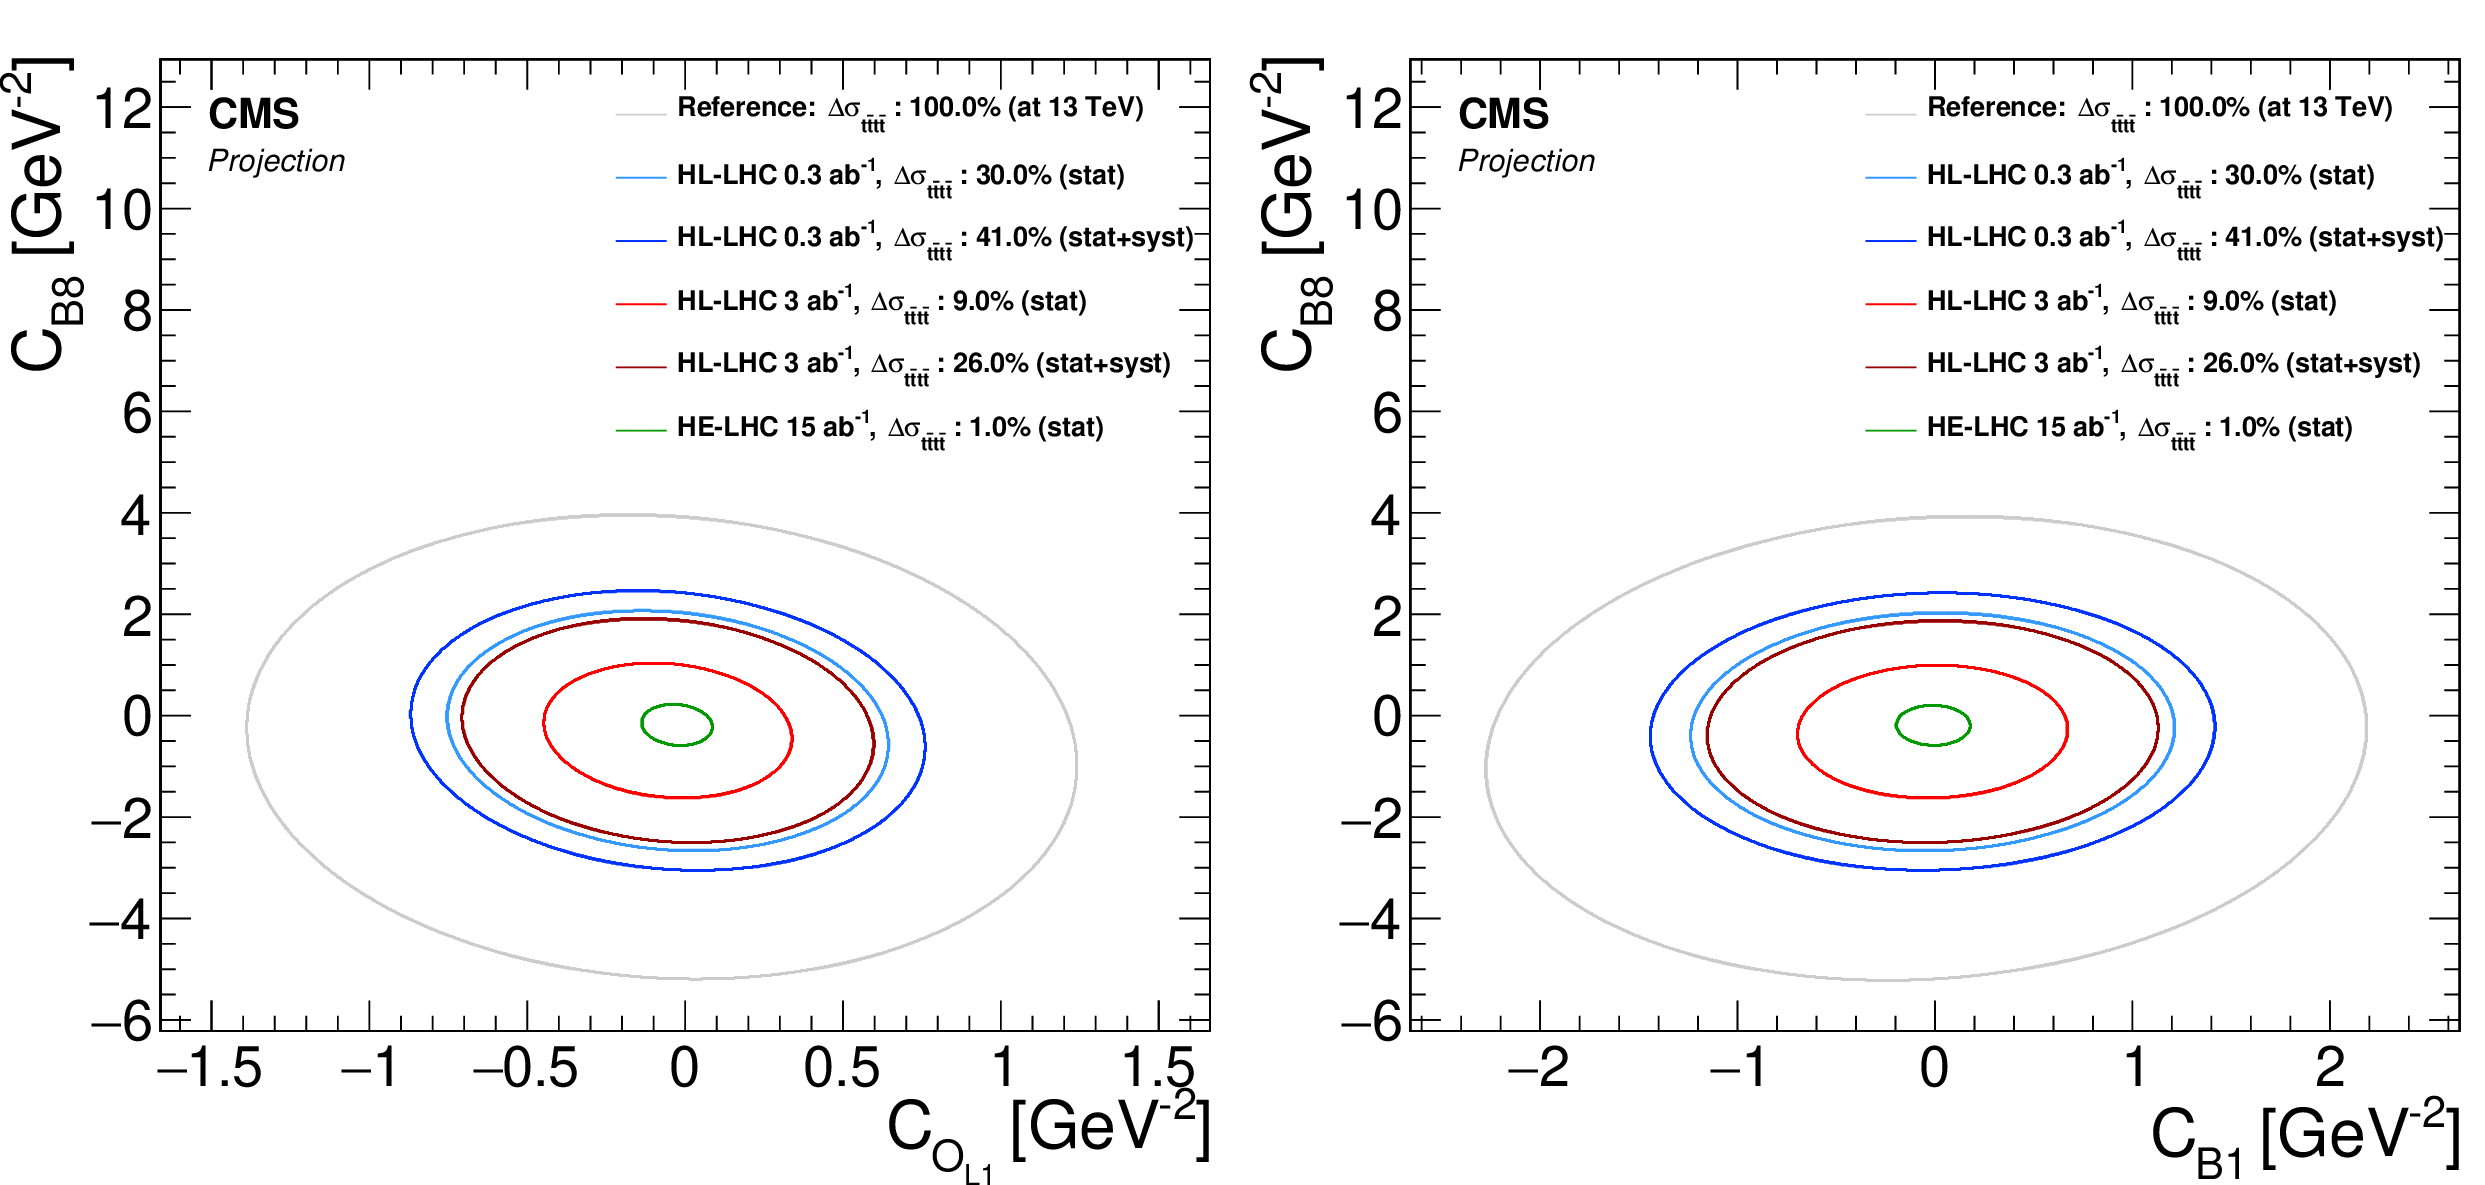
Figure 3:
EFT interpretation plots in two dimensions. The shown ellipses are equivalent to the $ {{\mathrm {t}\overline {\mathrm {t}}}} {{\mathrm {t}\overline {\mathrm {t}}}} $ cross section changing by one standard deviation of its statistical uncertainty from the projection. For reference, a curve with 100% expected uncertainty determined at $\sqrt {s}= $ 13 TeV is shown. Only (expected) statistical uncertainties are considered unless explicitly mentioned. |
png pdf |
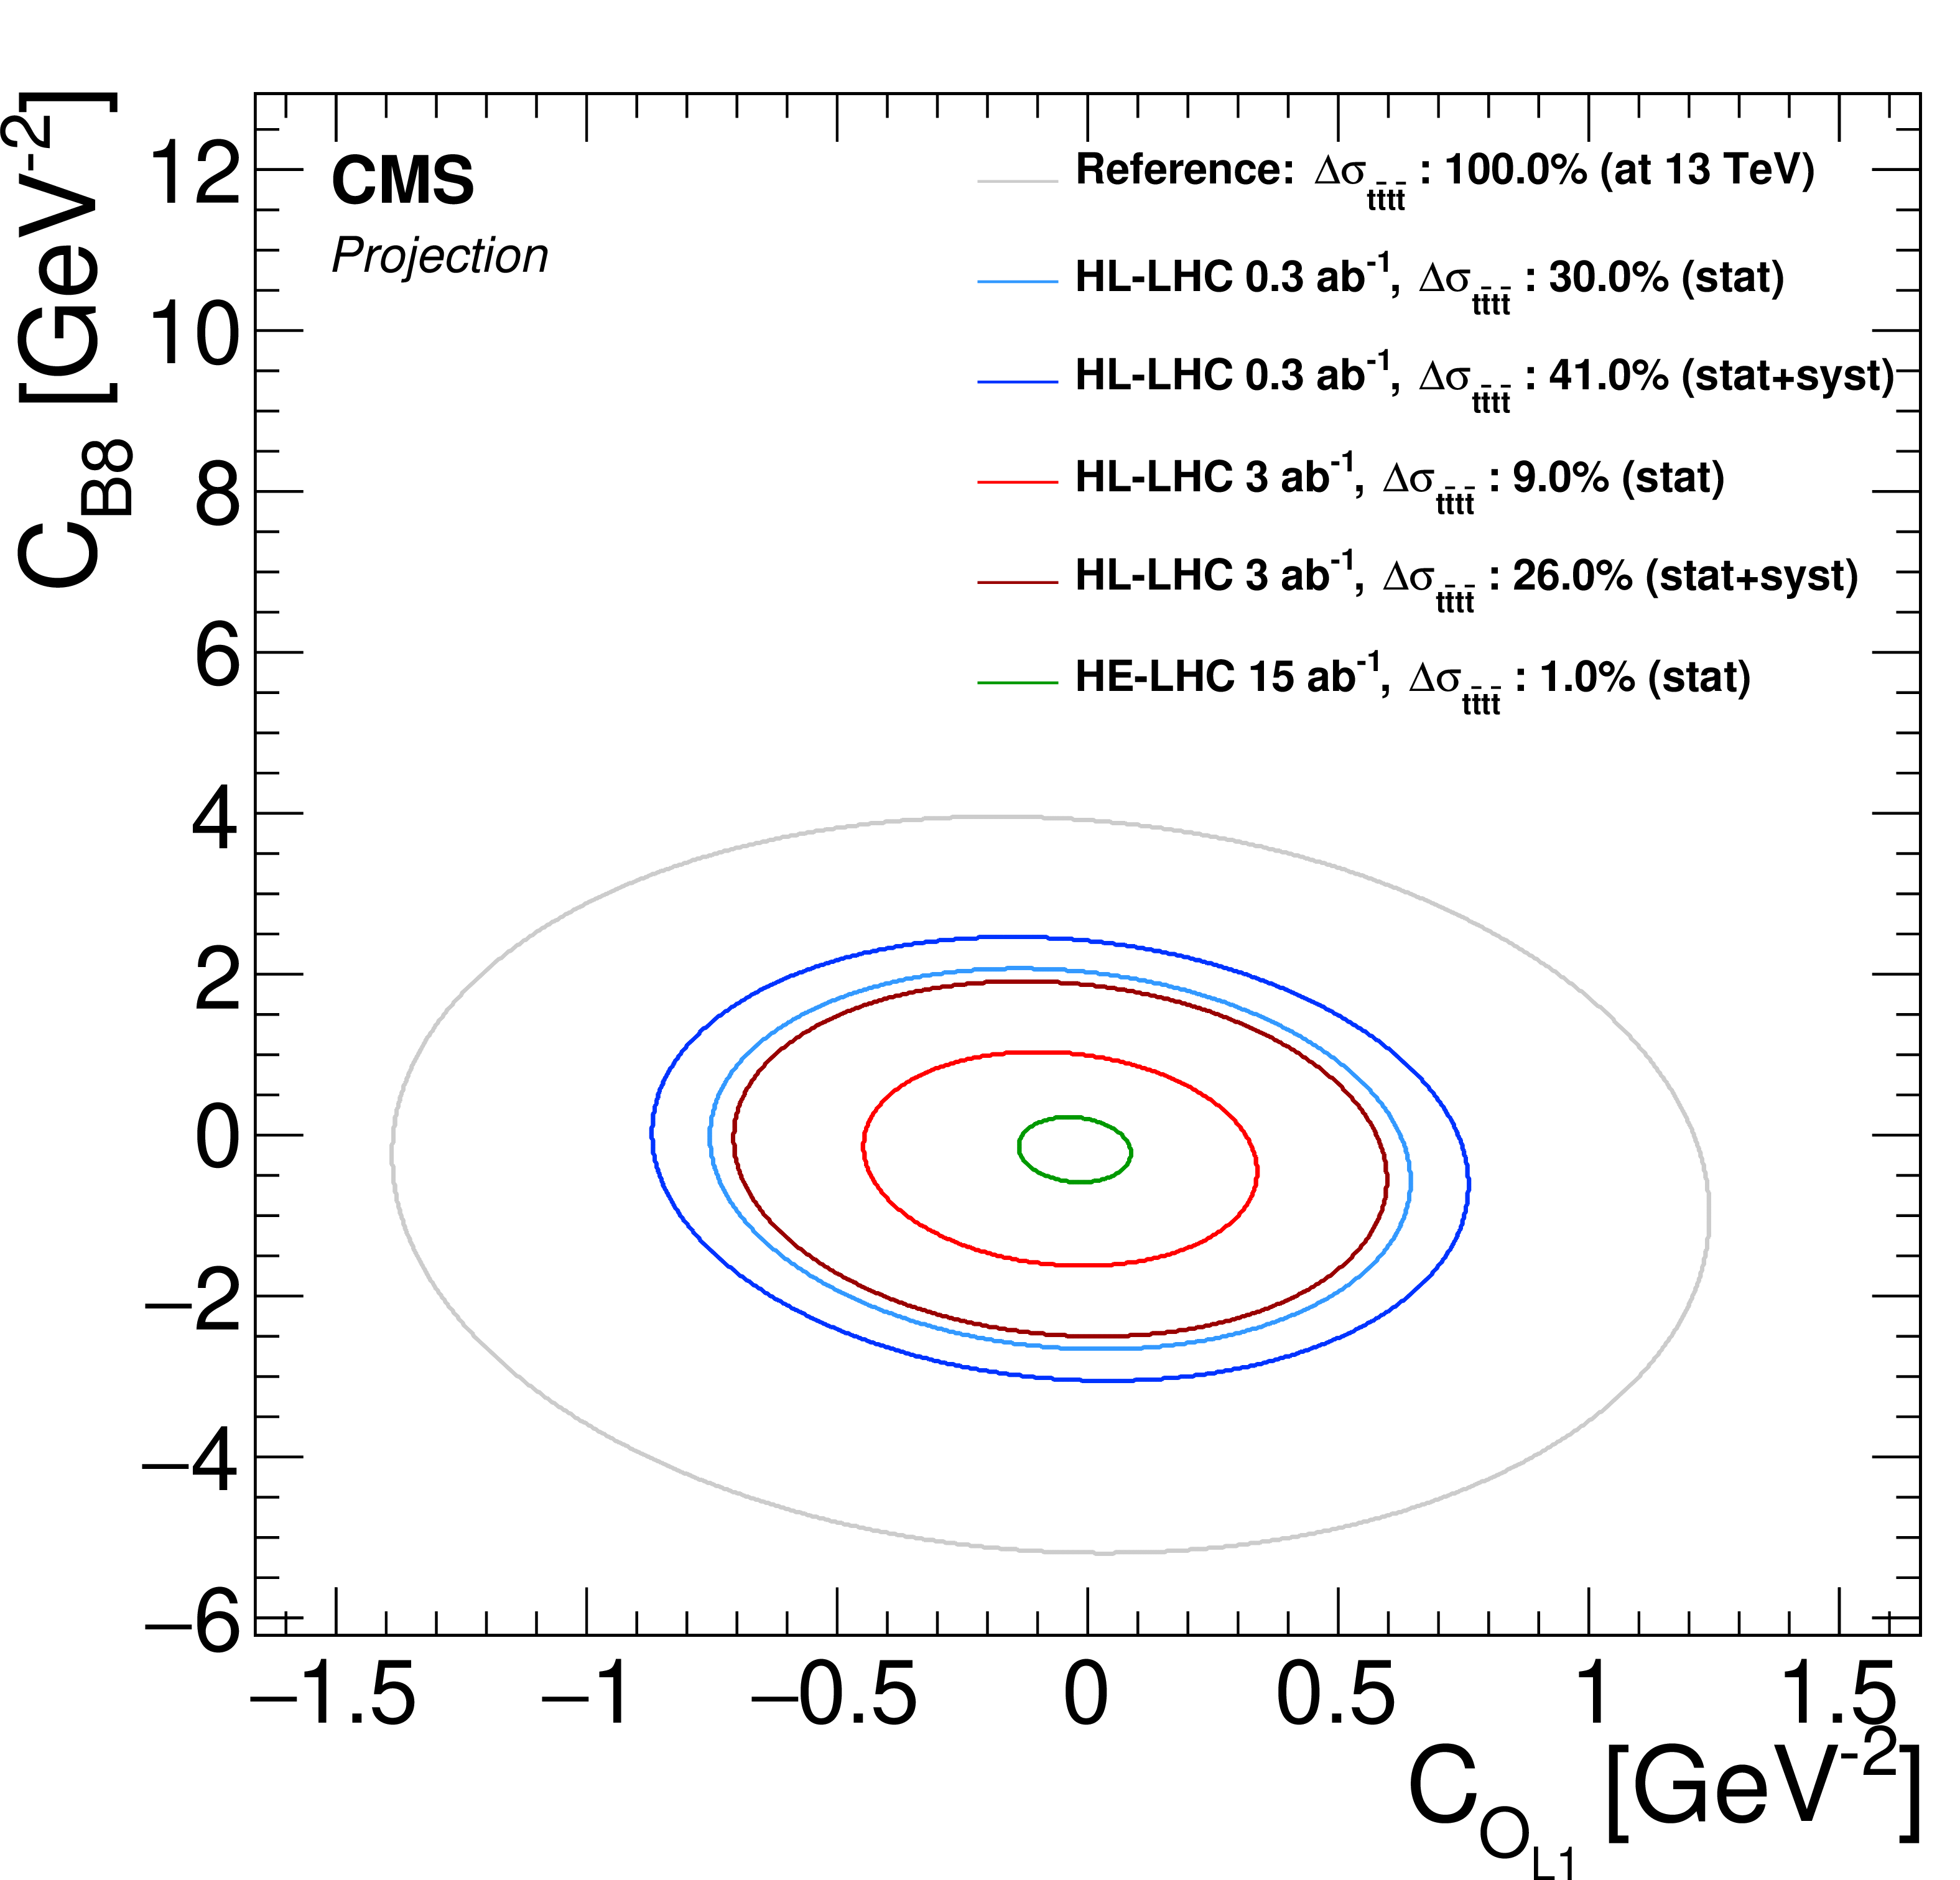
Figure 3-a:
EFT interpretation plots in two dimensions. The shown ellipses are equivalent to the $ {{\mathrm {t}\overline {\mathrm {t}}}} {{\mathrm {t}\overline {\mathrm {t}}}} $ cross section changing by one standard deviation of its statistical uncertainty from the projection. For reference, a curve with 100% expected uncertainty determined at $\sqrt {s}= $ 13 TeV is shown. Only (expected) statistical uncertainties are considered unless explicitly mentioned. |

png pdf |
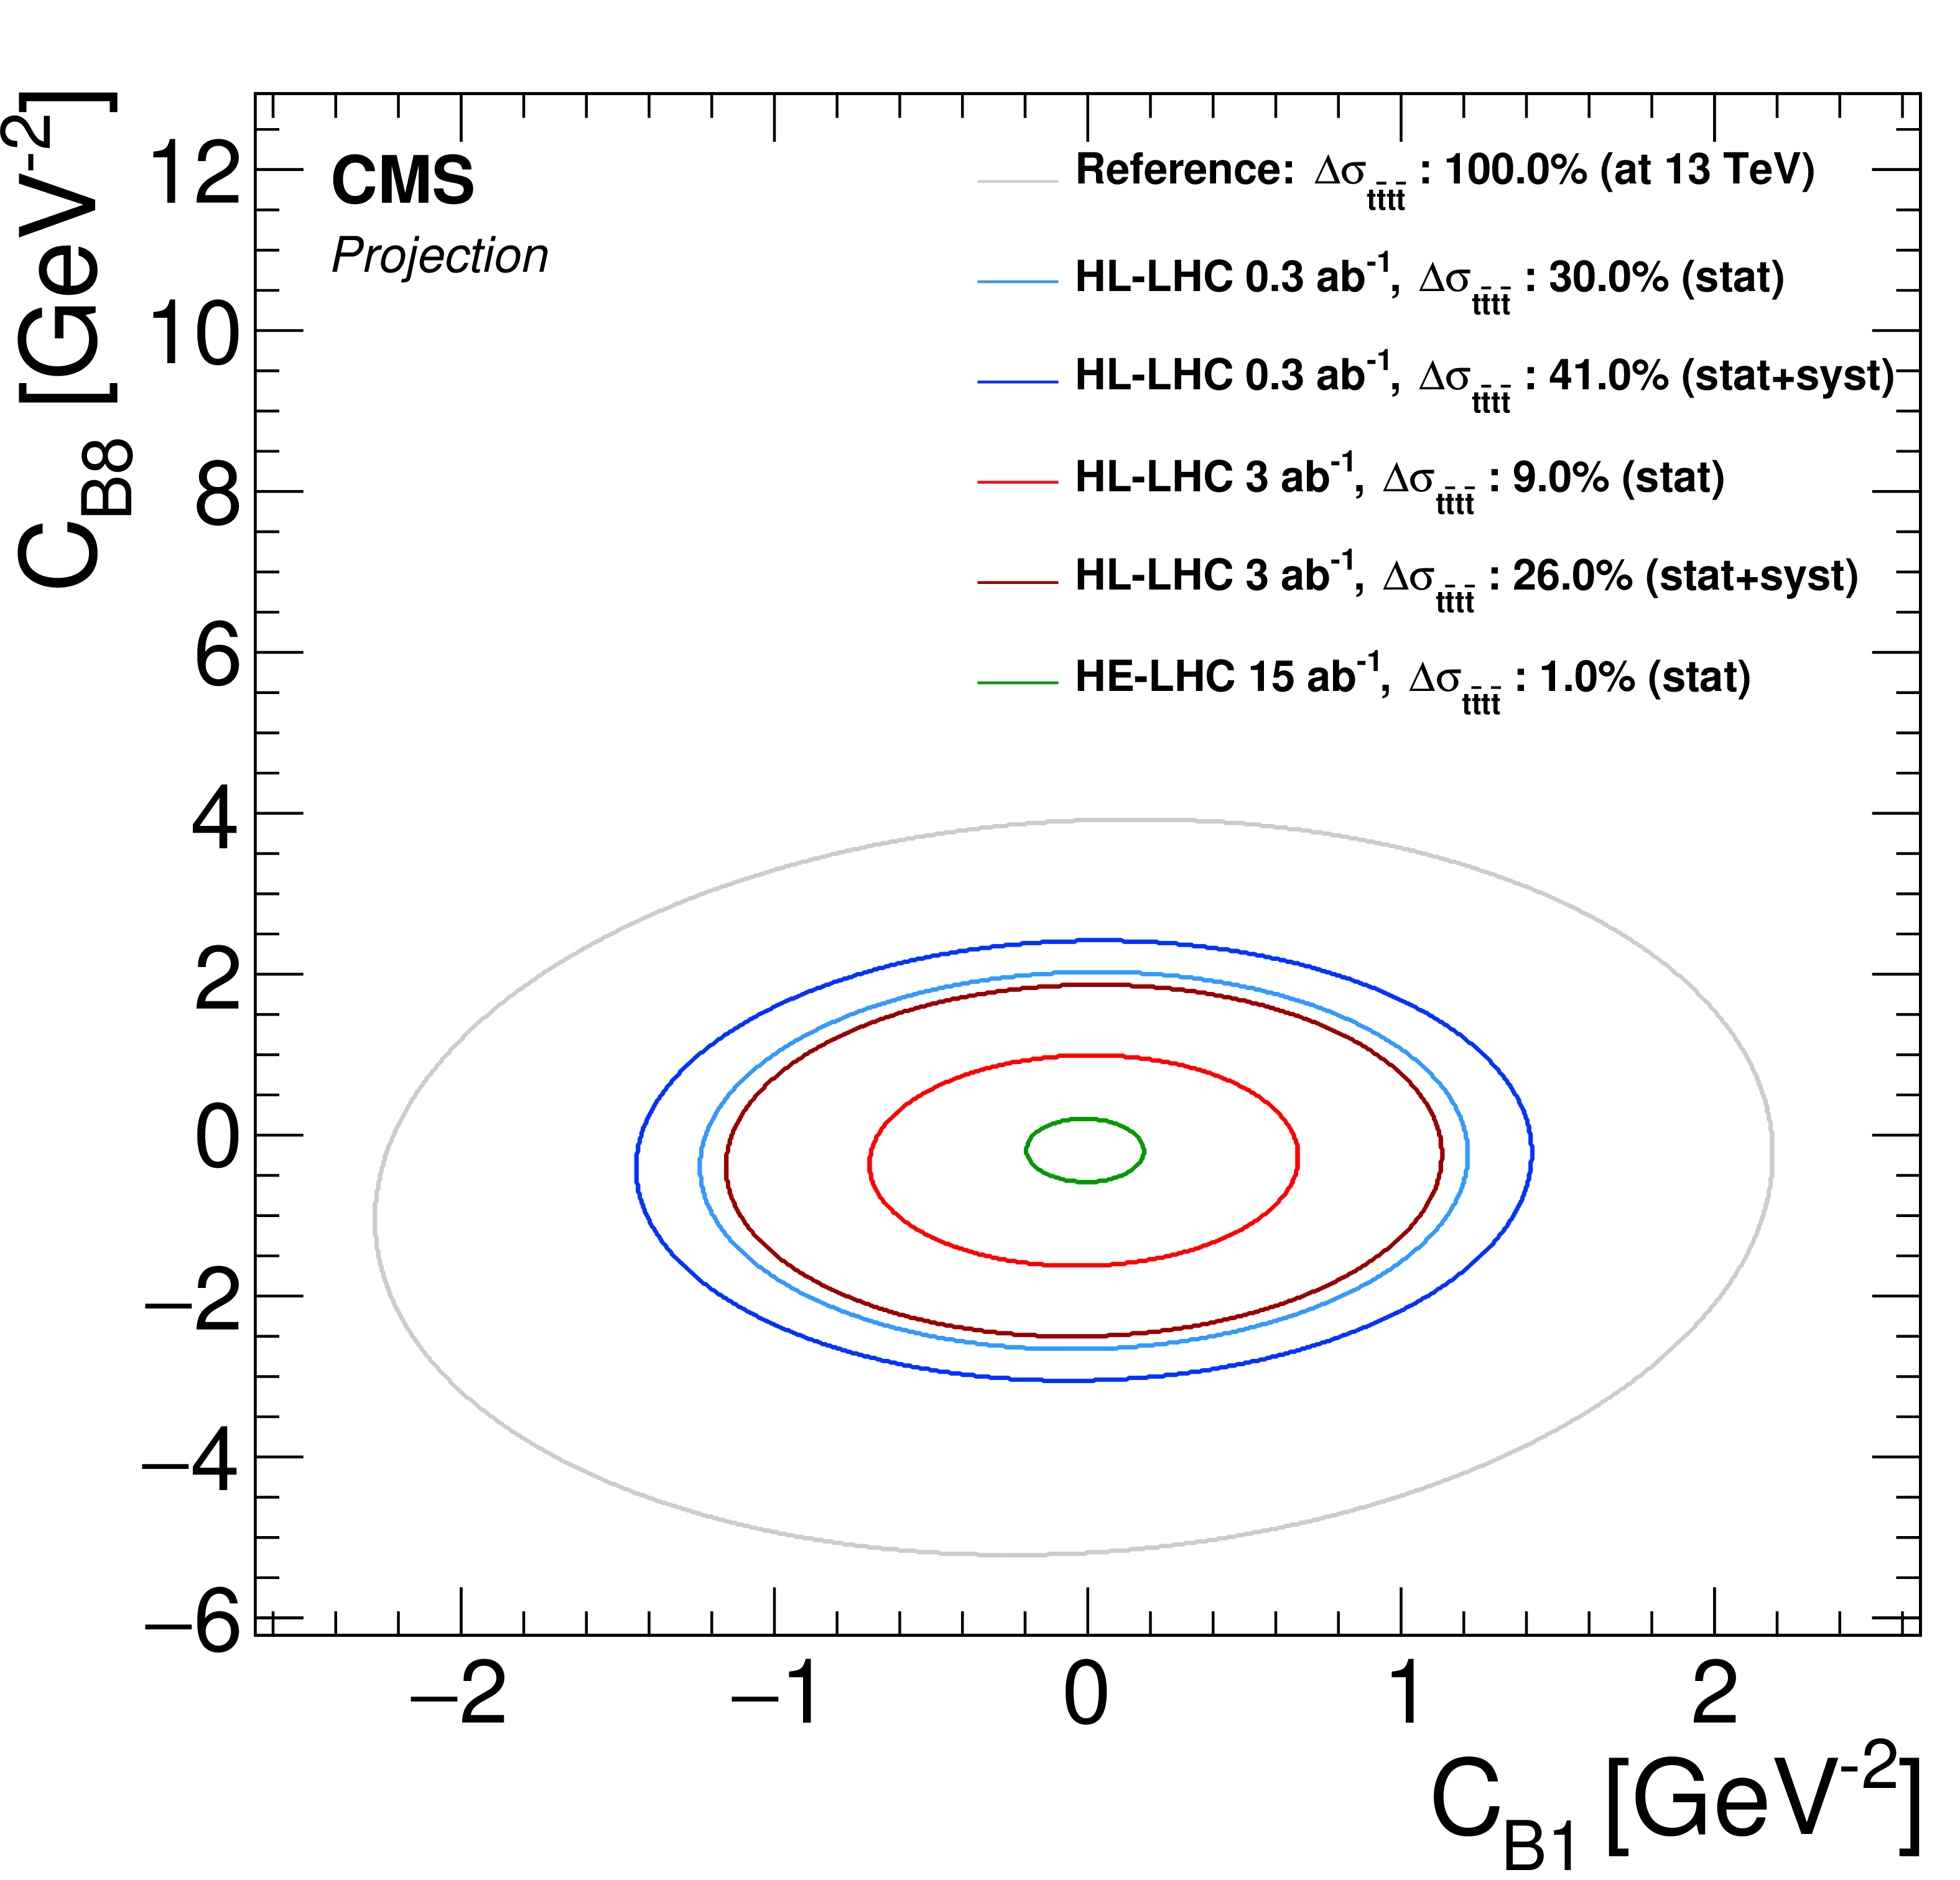
Figure 3-b:
EFT interpretation plots in two dimensions. The shown ellipses are equivalent to the $ {{\mathrm {t}\overline {\mathrm {t}}}} {{\mathrm {t}\overline {\mathrm {t}}}} $ cross section changing by one standard deviation of its statistical uncertainty from the projection. For reference, a curve with 100% expected uncertainty determined at $\sqrt {s}= $ 13 TeV is shown. Only (expected) statistical uncertainties are considered unless explicitly mentioned. |
png pdf |
Figure 3-c:
EFT interpretation plots in two dimensions. The shown ellipses are equivalent to the $ {{\mathrm {t}\overline {\mathrm {t}}}} {{\mathrm {t}\overline {\mathrm {t}}}} $ cross section changing by one standard deviation of its statistical uncertainty from the projection. For reference, a curve with 100% expected uncertainty determined at $\sqrt {s}= $ 13 TeV is shown. Only (expected) statistical uncertainties are considered unless explicitly mentioned. |
png pdf |
Figure 3-d:
EFT interpretation plots in two dimensions. The shown ellipses are equivalent to the $ {{\mathrm {t}\overline {\mathrm {t}}}} {{\mathrm {t}\overline {\mathrm {t}}}} $ cross section changing by one standard deviation of its statistical uncertainty from the projection. For reference, a curve with 100% expected uncertainty determined at $\sqrt {s}= $ 13 TeV is shown. Only (expected) statistical uncertainties are considered unless explicitly mentioned. |
png pdf |
Figure 4:
EFT interpretation plots in two dimensions. The shown ellipses are equivalent to the $ {{\mathrm {t}\overline {\mathrm {t}}}} {{\mathrm {t}\overline {\mathrm {t}}}} $ cross section changing by one standard deviation of its statistical uncertainty from the projection. For reference, a curve with 100% expected uncertainty determined for $\sqrt {s}= $ 13 TeV is shown. Only (expected) statistical uncertainties are considered unless explicitly mentioned. |
png pdf |
Figure 4-a:
EFT interpretation plots in two dimensions. The shown ellipses are equivalent to the $ {{\mathrm {t}\overline {\mathrm {t}}}} {{\mathrm {t}\overline {\mathrm {t}}}} $ cross section changing by one standard deviation of its statistical uncertainty from the projection. For reference, a curve with 100% expected uncertainty determined for $\sqrt {s}= $ 13 TeV is shown. Only (expected) statistical uncertainties are considered unless explicitly mentioned. |
png pdf |
Figure 4-b:
EFT interpretation plots in two dimensions. The shown ellipses are equivalent to the $ {{\mathrm {t}\overline {\mathrm {t}}}} {{\mathrm {t}\overline {\mathrm {t}}}} $ cross section changing by one standard deviation of its statistical uncertainty from the projection. For reference, a curve with 100% expected uncertainty determined for $\sqrt {s}= $ 13 TeV is shown. Only (expected) statistical uncertainties are considered unless explicitly mentioned. |
| Tables | |

png pdf |
Table 1:
Definitions and expected yields with total uncertainties of the eight signal regions and the two control regions for $ {{\mathrm {t}\overline {\mathrm {t}}}} {\mathrm {W}}$ (CRW) and $ {{\mathrm {t}\overline {\mathrm {t}}}} {\mathrm {Z}} $ (CRZ), for a dataset of 35.9 fb$^{-1}$ at 13 TeV centre-of-mass. Adapted from Ref. [4]. |
png pdf |
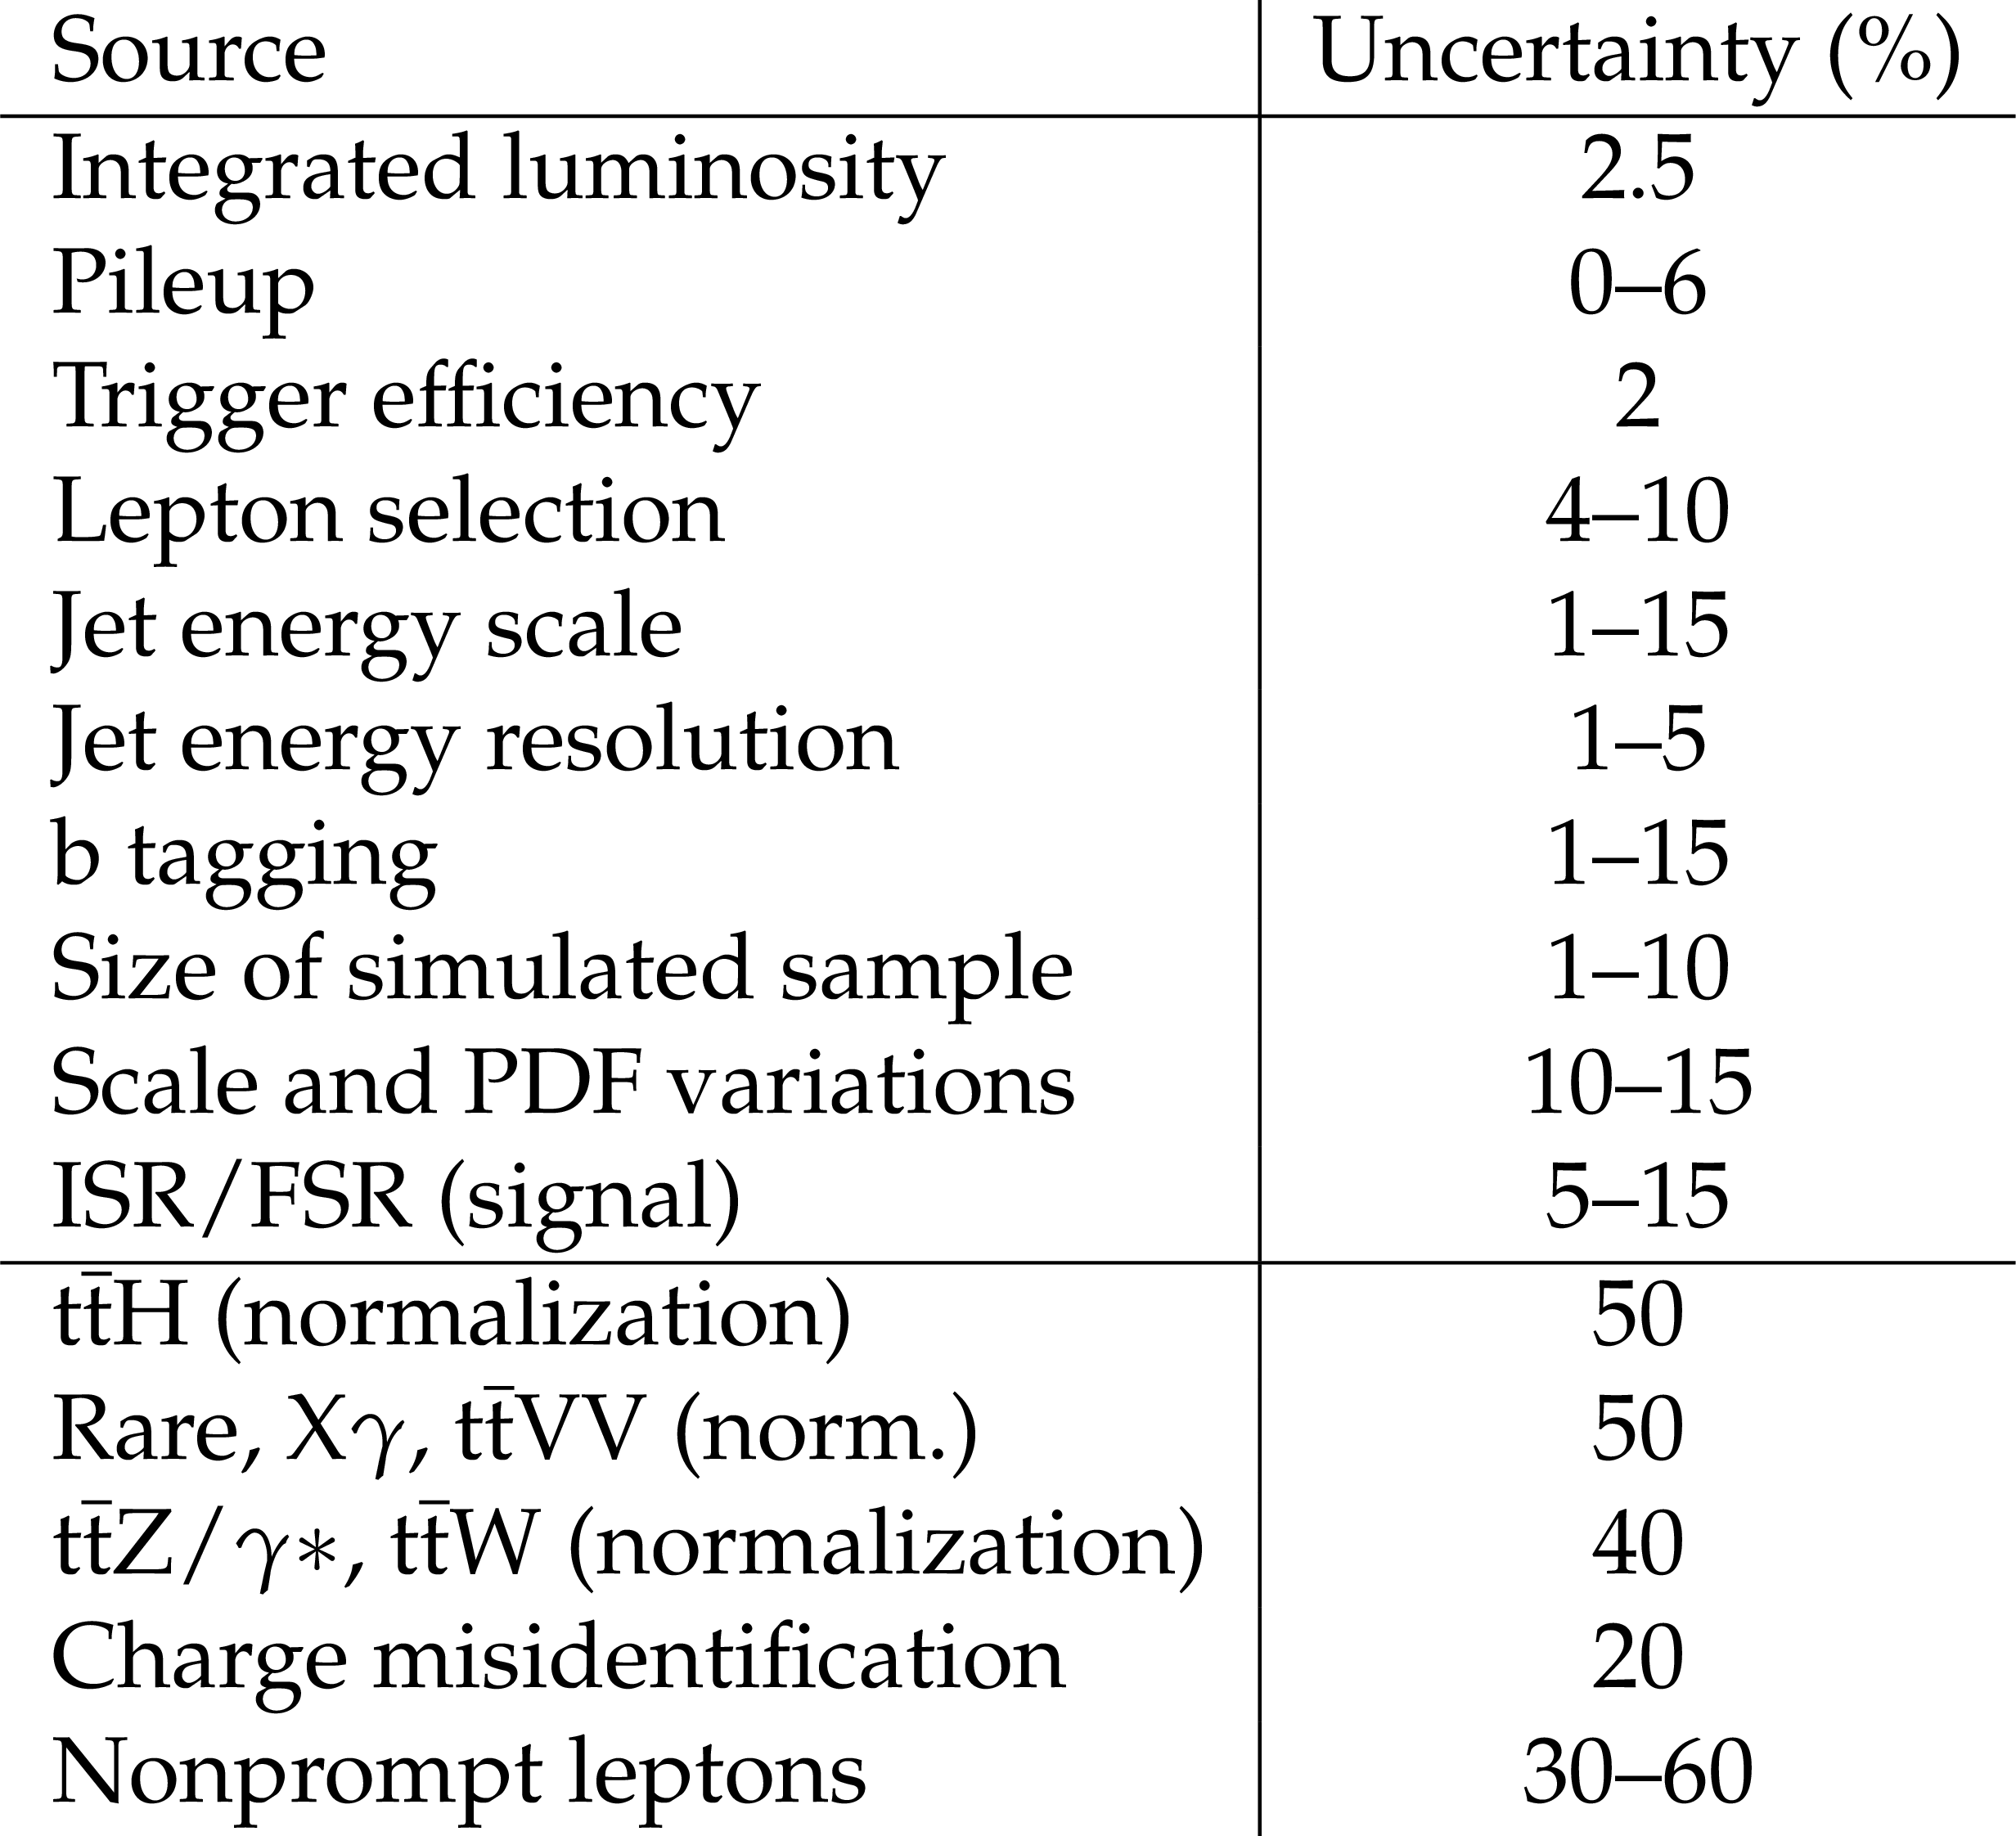
Table 2:
Summary of the sources of uncertainty in the Run 2 (dataset collected in 2016) analysis, and their effect on signal and background yields. The first group lists experimental and theoretical uncertainties in simulated signal and background processes. The second group lists normalisation uncertainties of the estimated backgrounds. As reported in Tab. 3 from [4]. |
png pdf |
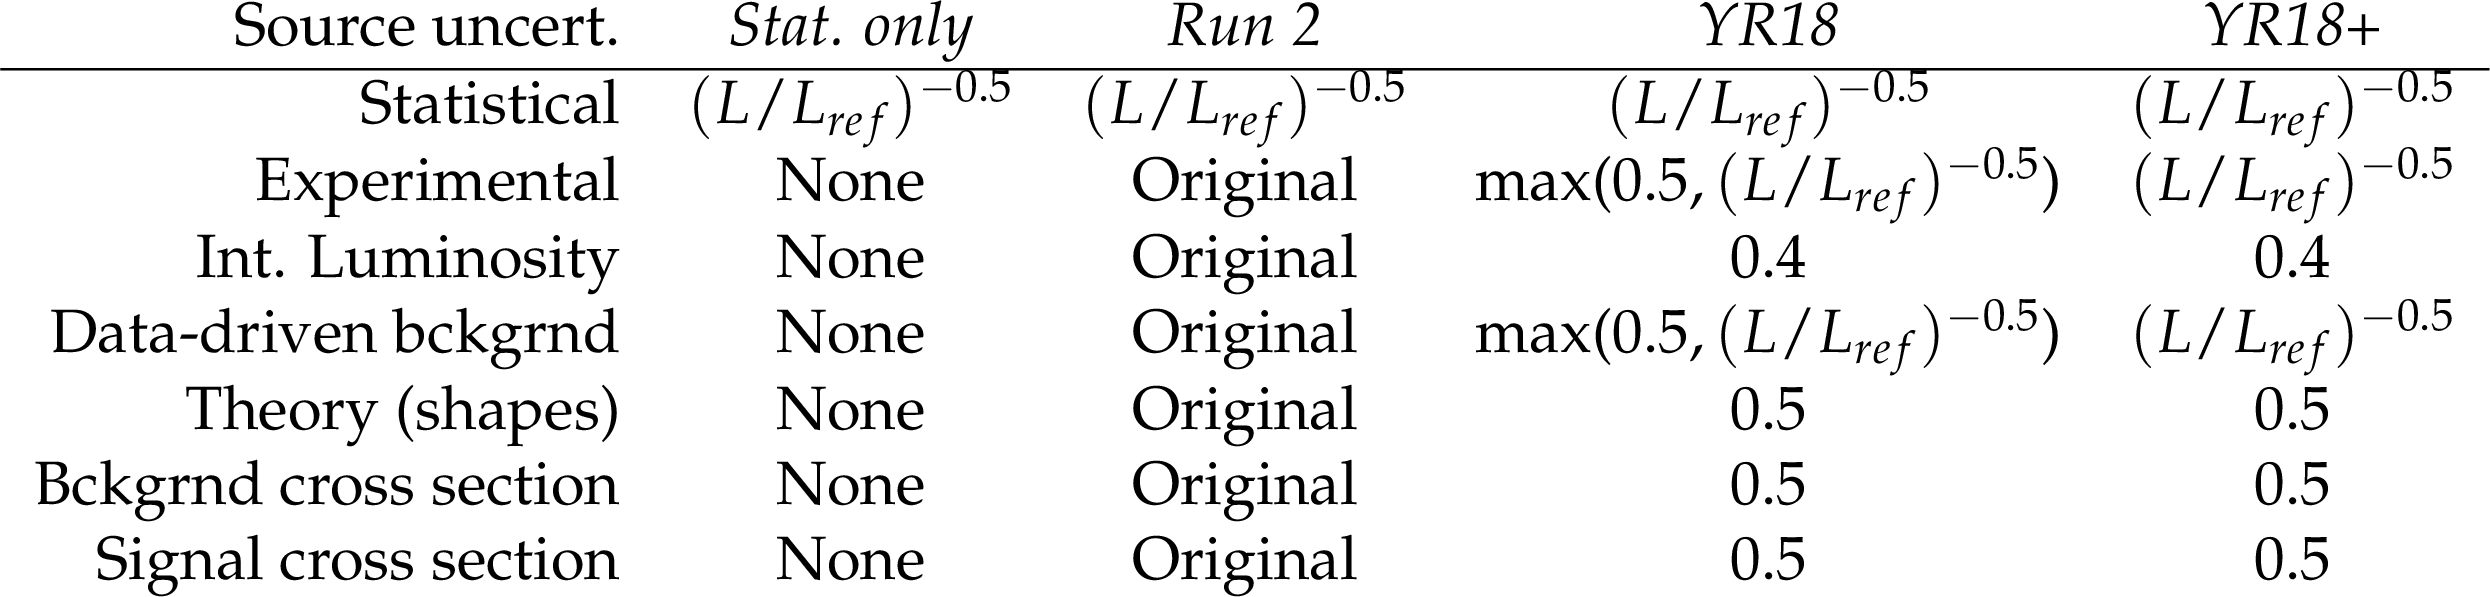
Table 3:
Considered systematic uncertainty scenarios, described in detail in the text. The table reports the scale factor multiplied to the uncertainties taken from the published CMS analysis as reported in Tab. 2. |
png pdf |
Table 4:
The expected significance of $ {{\mathrm {t}\overline {\mathrm {t}}}} {{\mathrm {t}\overline {\mathrm {t}}}} $ signal over a background-only hypothesis in standard deviations (s.d.), is given for various CMS upgrade scenarios for sqrt(s)=14 TeV. |
png pdf |
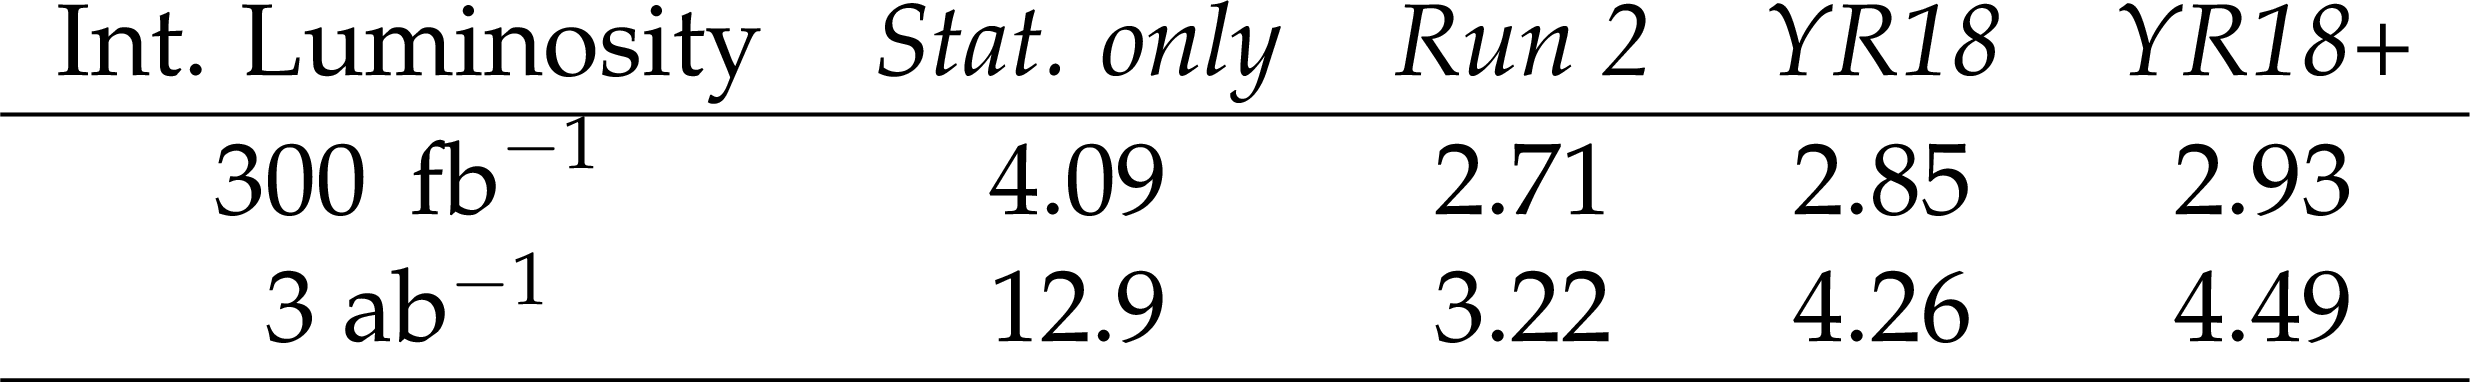
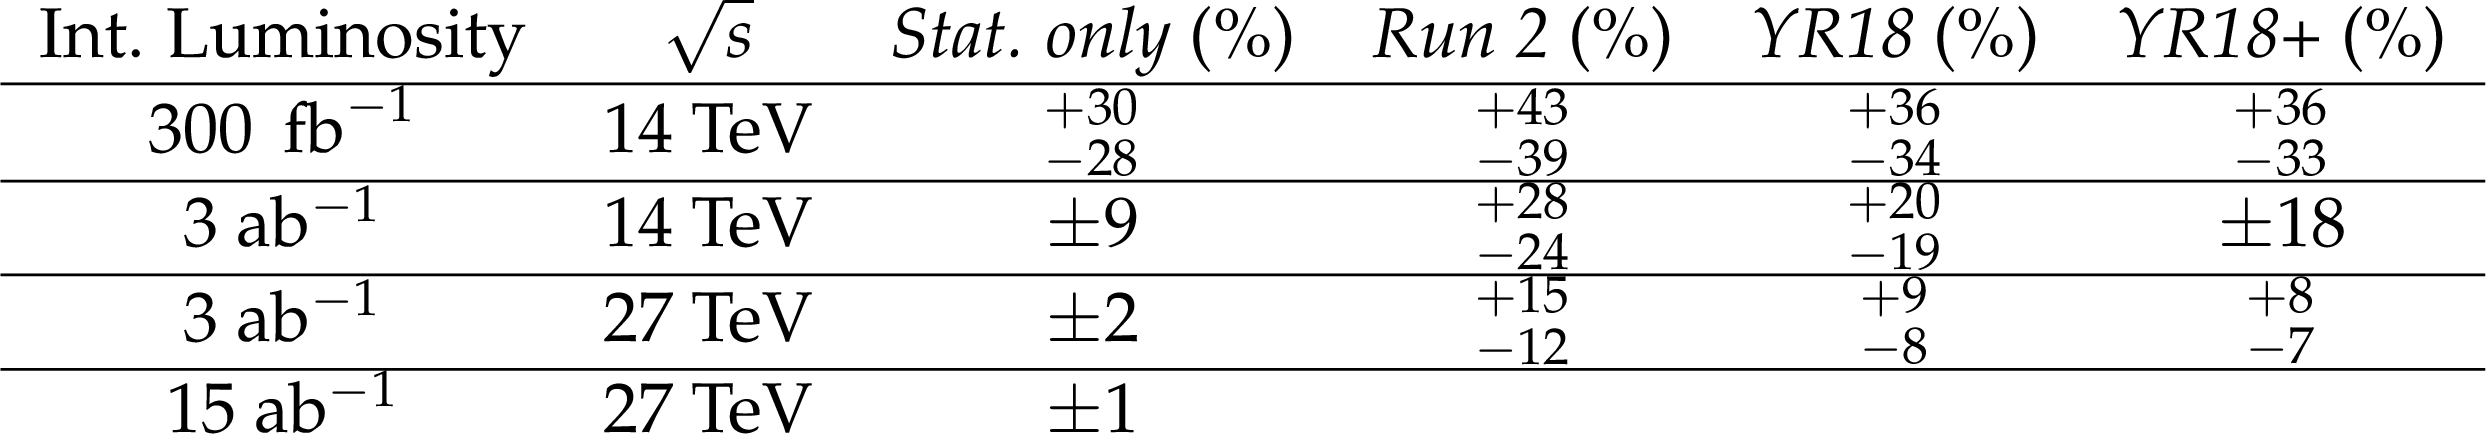
Table 5:
Expected sensitivity for the production cross section of $ {{\mathrm {t}\overline {\mathrm {t}}}} {{\mathrm {t}\overline {\mathrm {t}}}} $ production, in percent, at 68% confidence level. The fractional uncertainty on the cross section signal strength is given for various LHC upgrade scenarios. Cross sections are corrected for the changes expected by $\sqrt {s}$. For the 15 ab$^{-1}$ 27 TeV scenario, the systematic uncertainty extrapolation is no longer valid, so only the statistical uncertainty is provided. |
png pdf |
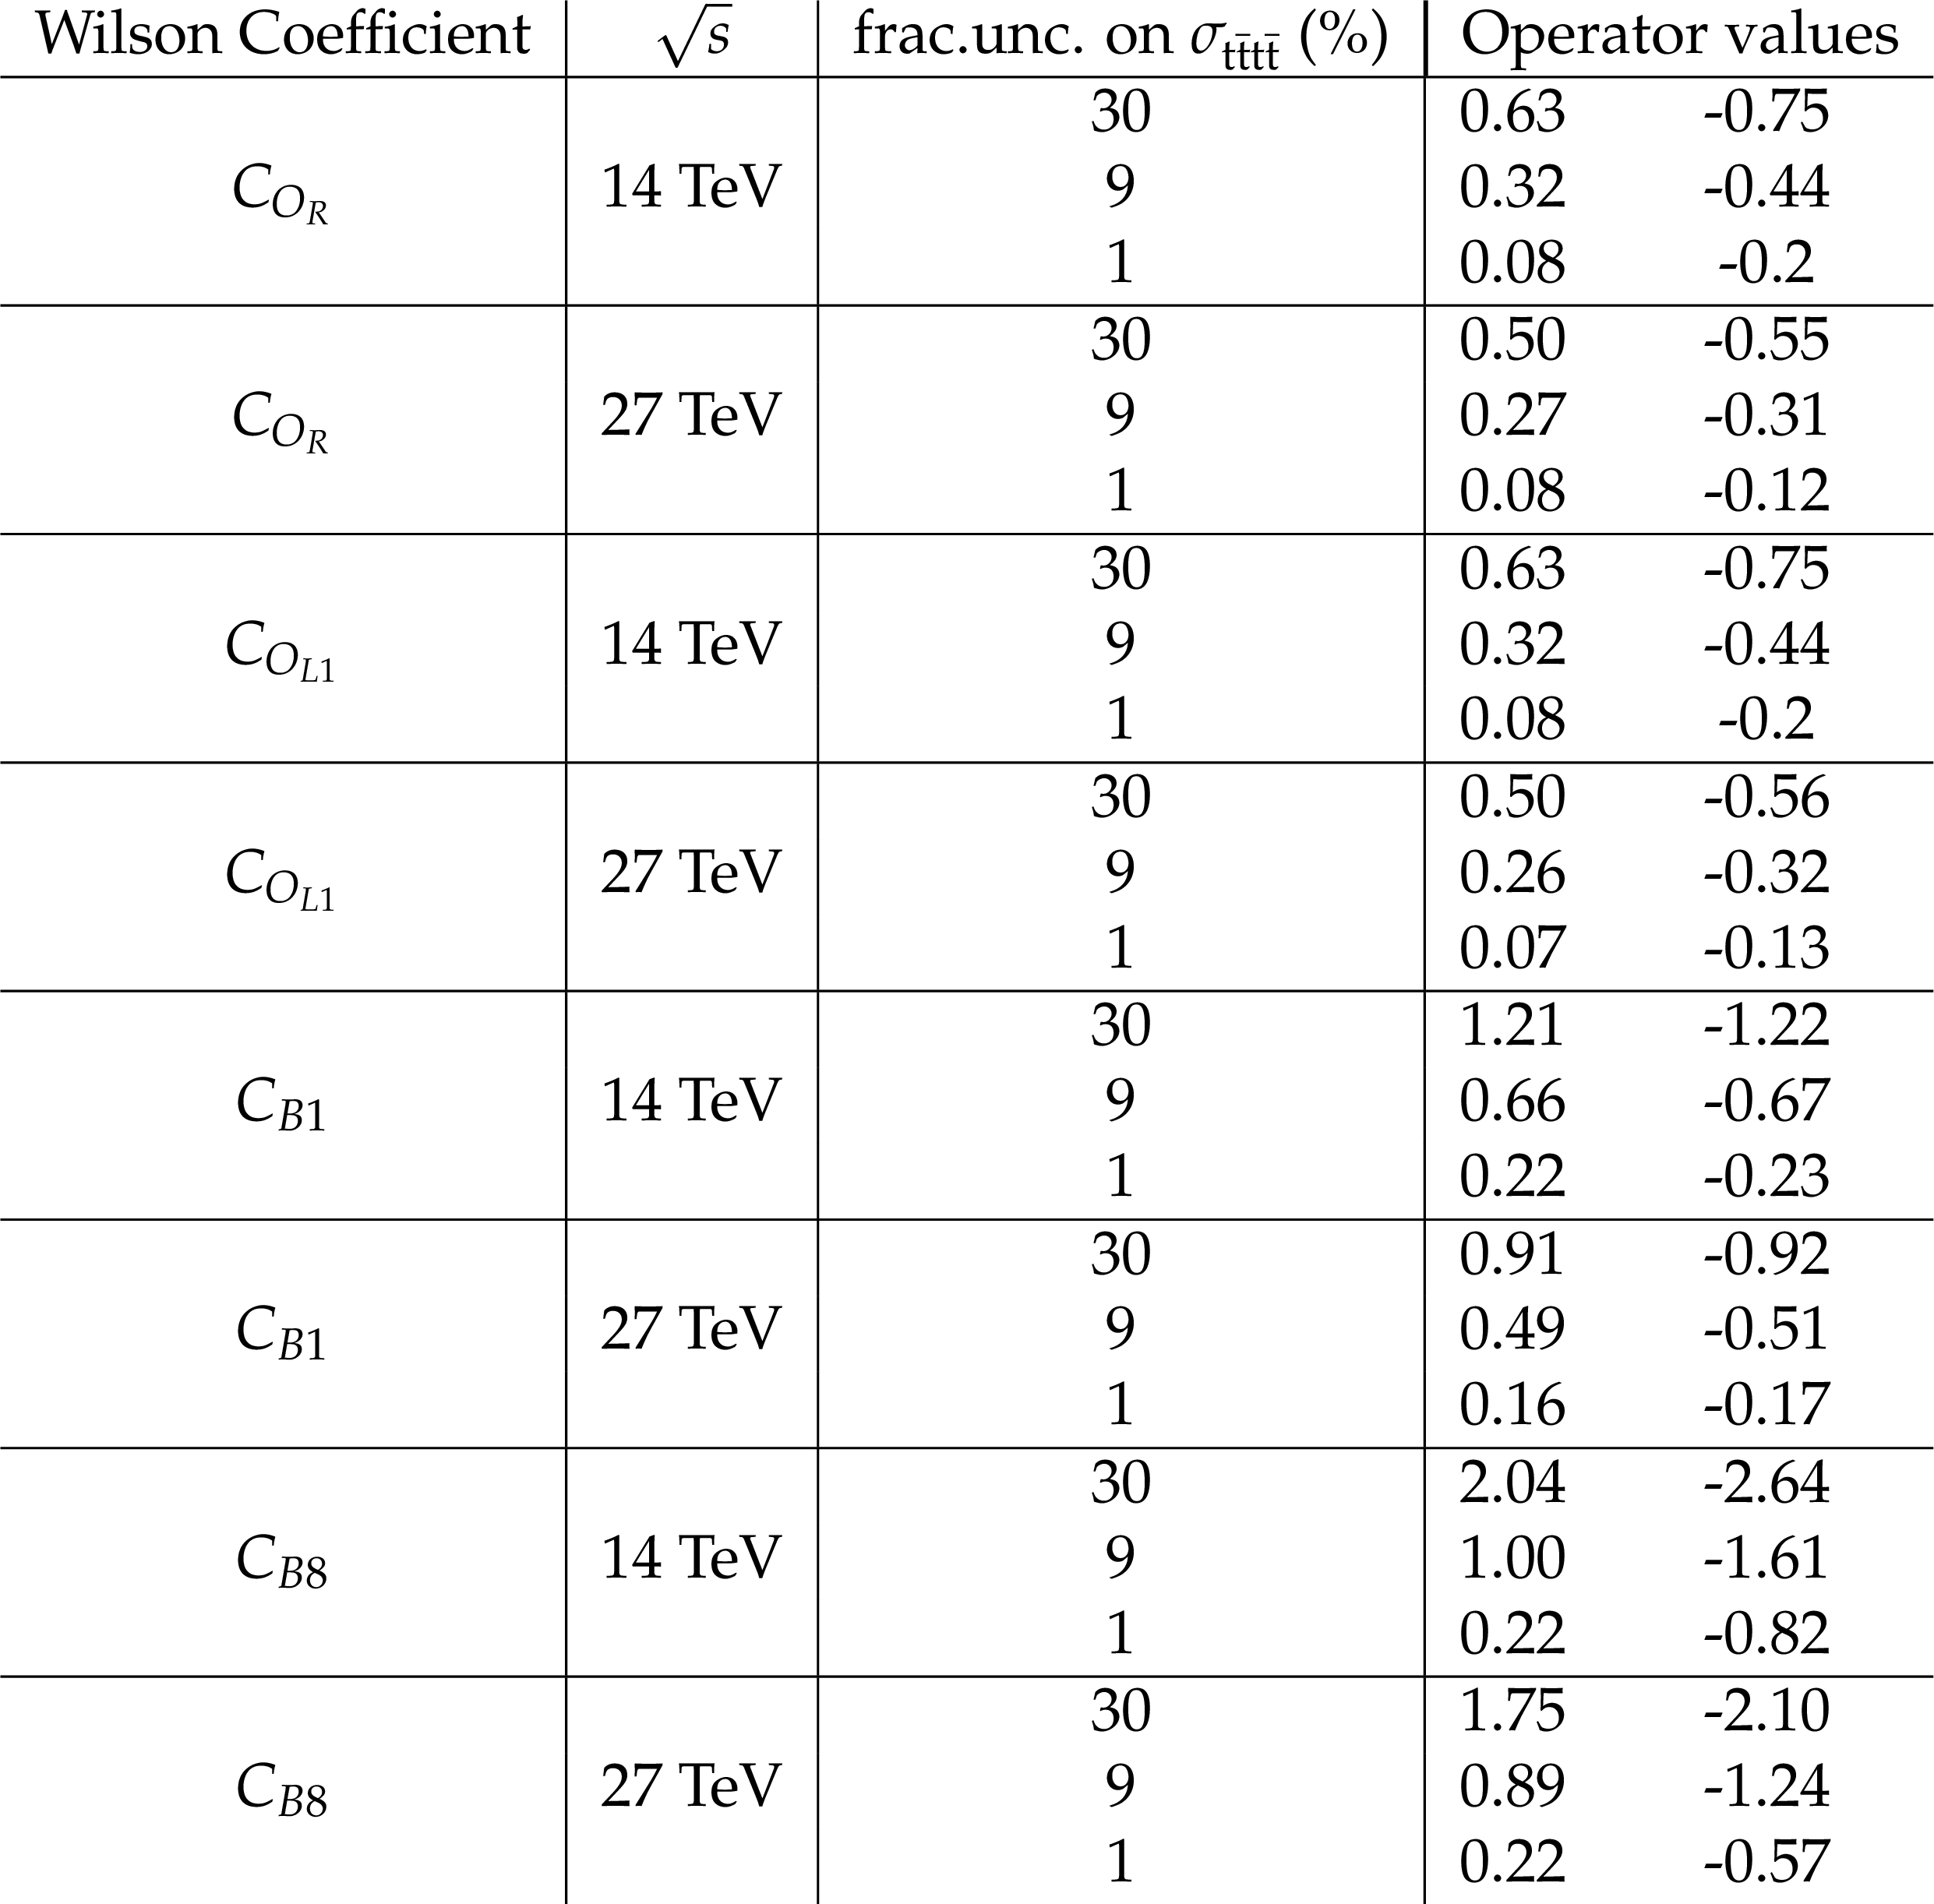
Table 6:
One-dimensional one-standard-deviation intervals for 14 and 27 TeV scenarios, for different fractional uncertainties on the measurement of $\sigma _{{{\mathrm {t}\overline {\mathrm {t}}}} {{\mathrm {t}\overline {\mathrm {t}}}}}$. Only total uncertainties are considered, allowing comparison to the uncertainties in Tab. 5. |
| Summary |
| The production of four top quarks has large sensitivity to new new physics effects and is interesting as a standard model QCD process. This note describes the reinterpretation of an analysis using 2016 data focusing on four top quark production using the same-sign dilepton and multilepton final states [4]. Multiple evaluation scenarios for the systematic uncertainties are considered. Evidence for $\mathrm{ t \bar{t} } \mathrm{ t \bar{t} }$ production will become possible with around 300 fb$^{-1}$ of HL-LHC data at $\sqrt{s}= $ 14 TeV, at which point the statistical uncertainty on the measured cross section will be of the order of 30% and the measurement will have a total uncertainty of around 33-43%, depending on the systematic uncertainty scenario considered. For larger datasets at HL-LHC, all scenarios considered become dominated by systematic uncertainties. With 3 ab$^{-1}$ the cross section can be constrained to 9% statistical uncertainty, and the total uncertainty of a measurement ranges between 18% and 28% depending on the considered systematic uncertainties. At HE-LHC the $\mathrm{ t \bar{t} } \mathrm{ t \bar{t} }$ cross section is expected to be constrained to within a 1-2% statistical uncertainty. |
| References | ||||
| 1 | J. Alwall et al. | The automated computation of tree-level and next-to-leading order differential cross sections, and their matching to parton shower simulations | JHEP 07 (2014) 079 | 1405.0301 |
| 2 | R. Frederix, D. Pagani, and M. Zaro | Large NLO corrections in $ t\bar{t}W^{\pm} $ and $ t\bar{t}t\bar{t} $ hadroproduction from supposedly subleading EW contributions | JHEP 02 (2018) 031 | 1711.02116 |
| 3 | G. Bevilacqua and M. Worek | Constraining BSM Physics at the LHC: Four top final states with NLO accuracy in perturbative QCD | JHEP 07 (2012) 111 | 1206.3064 |
| 4 | CMS Collaboration | Search for standard model production of four top quarks with same-sign and multilepton final states in proton-proton collisions at $ \sqrt{s} = $ 13 TeV | EPJC 78 (2018), no. 2, 140 | CMS-TOP-17-009 1710.10614 |
| 5 | CMS Collaboration | Search for standard model production of four top quarks in proton-proton collisions at $ \sqrt{s} = $ 13 TeV | PLB 772 (2017) 336 | CMS-TOP-16-016 1702.06164 |
| 6 | CMS Collaboration | Search for Standard Model Production of Four Top Quarks in the Lepton + Jets Channel in pp Collisions at $ \sqrt{s} = $ 8 TeV | JHEP 11 (2014) 154 | CMS-TOP-13-012 1409.7339 |
| 7 | CMS Collaboration | Search for new physics in same-sign dilepton events in proton-proton collisions at $ \sqrt{s} = $ 13 TeV | EPJC 76 (2016) 439 | CMS-SUS-15-008 1605.03171 |
| 8 | ATLAS Collaboration | Search for supersymmetry at $ \sqrt{s} = $ 8 TeV in final states with jets and two same-sign leptons or three leptons with the ATLAS detector | JHEP 06 (2014) 035 | 1404.2500 |
| 9 | ATLAS Collaboration | Search for production of vector-like quark pairs and of four top quarks in the lepton-plus-jets final state in pp collisions at $ \sqrt{s}= $ 8 TeV with the ATLAS detector | JHEP 08 (2015) 105 | 1505.04306 |
| 10 | ATLAS Collaboration | Search for pair production of up-type vector-like quarks and for four-top-quark events in final states with multiple $ b $-jets with the ATLAS detector | JHEP 07 (2018) 089 | 1803.09678 |
| 11 | ATLAS Collaboration | Search for new phenomena in events with same-charge leptons and $ b $-jets in $ pp $ collisions at $ \sqrt{s}= $ 13 TeV with the ATLAS detector | 1807.11883 | |
| 12 | ATLAS Collaboration | Search for four-top-quark production in the single-lepton and opposite-sign dilepton final states in pp collisions at $ \sqrt{s} = $ 13 TeV with the ATLAS detector | 1811.02305 | |
| 13 | CMS Collaboration | Performance of Electron Reconstruction and Selection with the CMS Detector in Proton-Proton Collisions at $ \sqrt{s}= $ 8 TeV | JINST 10 (2015), no. 06, P06005 | CMS-EGM-13-001 1502.02701 |
| 14 | CMS Collaboration | Performance of the CMS muon detector and muon reconstruction with proton-proton collisions at $ \sqrt{s}= $ 13 TeV | JINST 13 (2018), no. 06, P06015 | CMS-MUO-16-001 1804.04528 |
| 15 | CMS Collaboration | Heavy flavor identification at CMS with deep neural networks | CMS-PAS-TOP-16-008 | CMS-PAS-TOP-16-008 |
| 16 | W. Buchmuller and D. Wyler | Effective Lagrangian Analysis of New Interactions and Flavor Conservation | NPB268 (1986) 621--653 | |
| 17 | B. Grzadkowski et al. | Dimension-Six Terms in the Standard Model Lagrangian | JHEP 10 (2010) 085 | 1008.4884 |
| 18 | C. Zhang | Constraining $ qqtt $ operators from four-top production: a case for enhanced EFT sensitivity | CPC 42 (2018), no. 2, 023104 | 1708.05928 |
| 19 | J. Aguilar-Saavedra et al. | Interpreting top-quark LHC measurements in the standard-model effective field theory | 1802.07237 | |
| 20 | A. Alloul et al. | FeynRules 2.0 - A complete toolbox for tree-level phenomenology | CPC 185 (2014) 2250--2300 | 1310.1921 |
| 21 | NNPDF Collaboration | Parton distributions for the LHC Run II | JHEP 04 (2015) 040 | 1410.8849 |
|
|
Compact Muon Solenoid LHC, CERN |
|

|

|

|

|

|