

Compact Muon Solenoid
LHC, CERN
| CMS-PAS-EXO-18-006 | ||
| Search for high mass resonances in the dielectron final state | ||
| CMS Collaboration | ||
| March 2018 | ||
| Abstract: A search for high mass resonances in the dielectron final state is performed using proton-proton collision data at a center-of-mass energy of 13 TeV collected by the CMS experiment at the LHC in 2017. The integrated luminosity corresponds to 41 fb$^{-1}$. No evidence for a significant deviation from standard model expectation is observed. The sensitivity of the search is increased by combining these data with a previously analysed set of data obtained in 2016 and corresponding to a luminosity of 36 fb$^{-1}$. Upper bounds are set on the masses of hypothetical particles that arise in new-physics scenarios. | ||
| Links: CDS record (PDF) ; inSPIRE record ; CADI line (restricted) ; | ||
| Figures | |
png pdf |
Figure 1:
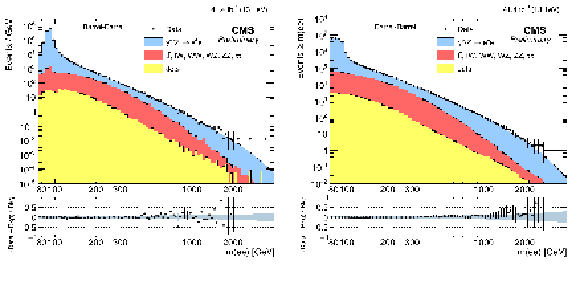
The invariant mass spectrum (left) and cumulative distribution (right) of $ {\mathrm {e}} {\mathrm {e}}$ events in the barrel-barrel category. The points with error bars represent the data. The histograms represent the expectations from SM processes: $ {\mathrm {Z}}{/}\gamma ^*$, $ {\mathrm {t}} {\overline {\mathrm {t}}}$ and other sources of prompt leptons ($ {\mathrm {t}} {\mathrm {W}}$, diboson production, $ {\mathrm {Z}}\rightarrow {\tau} {\tau}$), and from multijet events. The simulated backgrounds are normalised to the data in the region of 60 $ < m_{{\mathrm {e}} {\mathrm {e}}} < $ 120 GeV. The shaded band in the lower panels illustrates the total uncertainty on the background predictions. |

png |
Figure 1-a:
The invariant mass spectrum (left) and cumulative distribution (right) of $ {\mathrm {e}} {\mathrm {e}}$ events in the barrel-barrel category. The points with error bars represent the data. The histograms represent the expectations from SM processes: $ {\mathrm {Z}}{/}\gamma ^*$, $ {\mathrm {t}} {\overline {\mathrm {t}}}$ and other sources of prompt leptons ($ {\mathrm {t}} {\mathrm {W}}$, diboson production, $ {\mathrm {Z}}\rightarrow {\tau} {\tau}$), and from multijet events. The simulated backgrounds are normalised to the data in the region of 60 $ < m_{{\mathrm {e}} {\mathrm {e}}} < $ 120 GeV. The shaded band in the lower panels illustrates the total uncertainty on the background predictions. |
png |
Figure 1-b:
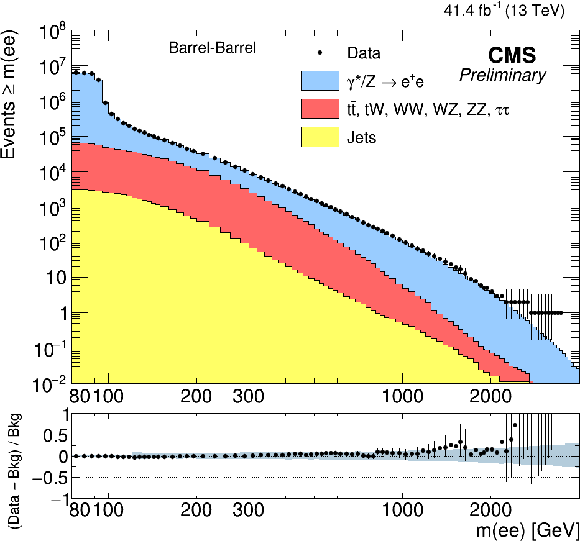
The invariant mass spectrum (left) and cumulative distribution (right) of $ {\mathrm {e}} {\mathrm {e}}$ events in the barrel-barrel category. The points with error bars represent the data. The histograms represent the expectations from SM processes: $ {\mathrm {Z}}{/}\gamma ^*$, $ {\mathrm {t}} {\overline {\mathrm {t}}}$ and other sources of prompt leptons ($ {\mathrm {t}} {\mathrm {W}}$, diboson production, $ {\mathrm {Z}}\rightarrow {\tau} {\tau}$), and from multijet events. The simulated backgrounds are normalised to the data in the region of 60 $ < m_{{\mathrm {e}} {\mathrm {e}}} < $ 120 GeV. The shaded band in the lower panels illustrates the total uncertainty on the background predictions. |

png pdf |
Figure 2:
The invariant mass spectrum (left) and cumulative distribution (right) of $ {\mathrm {e}} {\mathrm {e}}$ events in the barrel-endcap category. The points with error bars represent the data. The histograms represent the expectations from SM processes: $ {\mathrm {Z}}{/}\gamma ^*$, $ {\mathrm {t}} {\overline {\mathrm {t}}}$ and other sources of prompt leptons ($ {\mathrm {t}} {\mathrm {W}}$, diboson production, $ {\mathrm {Z}}\rightarrow {\tau} {\tau}$), and from multijet events. The simulated backgrounds are normalised to the data in the region of 60 $ < m_{{\mathrm {e}} {\mathrm {e}}} < $ 120 GeV. The shaded band in the lower panels illustrates the total uncertainty on the background predictions. |
png |
Figure 2-a:
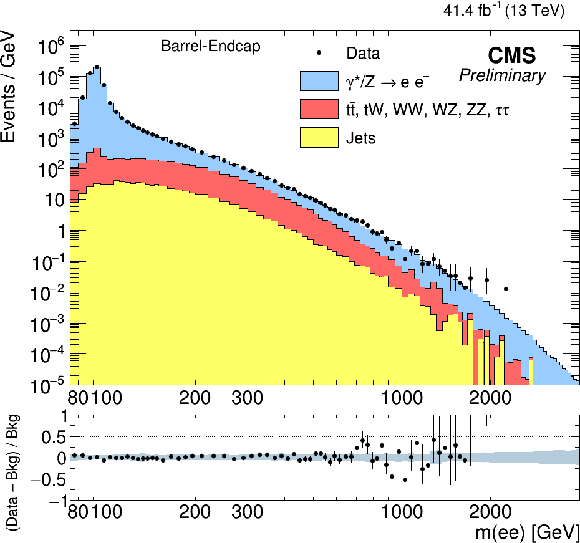
The invariant mass spectrum (left) and cumulative distribution (right) of $ {\mathrm {e}} {\mathrm {e}}$ events in the barrel-endcap category. The points with error bars represent the data. The histograms represent the expectations from SM processes: $ {\mathrm {Z}}{/}\gamma ^*$, $ {\mathrm {t}} {\overline {\mathrm {t}}}$ and other sources of prompt leptons ($ {\mathrm {t}} {\mathrm {W}}$, diboson production, $ {\mathrm {Z}}\rightarrow {\tau} {\tau}$), and from multijet events. The simulated backgrounds are normalised to the data in the region of 60 $ < m_{{\mathrm {e}} {\mathrm {e}}} < $ 120 GeV. The shaded band in the lower panels illustrates the total uncertainty on the background predictions. |
png |
Figure 2-b:
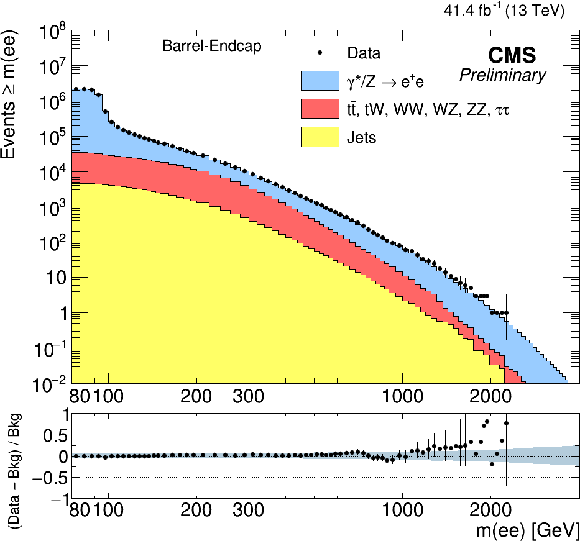
The invariant mass spectrum (left) and cumulative distribution (right) of $ {\mathrm {e}} {\mathrm {e}}$ events in the barrel-endcap category. The points with error bars represent the data. The histograms represent the expectations from SM processes: $ {\mathrm {Z}}{/}\gamma ^*$, $ {\mathrm {t}} {\overline {\mathrm {t}}}$ and other sources of prompt leptons ($ {\mathrm {t}} {\mathrm {W}}$, diboson production, $ {\mathrm {Z}}\rightarrow {\tau} {\tau}$), and from multijet events. The simulated backgrounds are normalised to the data in the region of 60 $ < m_{{\mathrm {e}} {\mathrm {e}}} < $ 120 GeV. The shaded band in the lower panels illustrates the total uncertainty on the background predictions. |

png pdf |
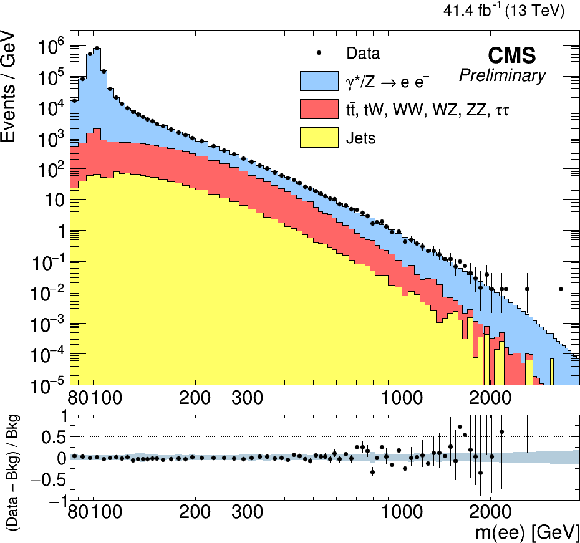
Figure 3:
The invariant mass spectrum (left) and cumulative distribution (right) of the dielectron events in the barrel-barrel and barrel-endcap categories. The points with error bars represent the data. The histograms represent the expectations from SM processes: $ {\mathrm {Z}}{/}\gamma ^*$, $ {\mathrm {t}} {\overline {\mathrm {t}}}$ and other sources of prompt leptons ($ {\mathrm {t}} {\mathrm {W}}$, diboson production, $ {\mathrm {Z}}\rightarrow {\tau} {\tau}$), and from multijet events. The simulated backgrounds are normalised to the data in the region of 60 $ < m_{{\mathrm {e}} {\mathrm {e}}} < $ 120 GeV. The shaded band in the lower panels illustrates the total uncertainty on the background predictions. |
png |
Figure 3-a:
The invariant mass spectrum (left) and cumulative distribution (right) of the dielectron events in the barrel-barrel and barrel-endcap categories. The points with error bars represent the data. The histograms represent the expectations from SM processes: $ {\mathrm {Z}}{/}\gamma ^*$, $ {\mathrm {t}} {\overline {\mathrm {t}}}$ and other sources of prompt leptons ($ {\mathrm {t}} {\mathrm {W}}$, diboson production, $ {\mathrm {Z}}\rightarrow {\tau} {\tau}$), and from multijet events. The simulated backgrounds are normalised to the data in the region of 60 $ < m_{{\mathrm {e}} {\mathrm {e}}} < $ 120 GeV. The shaded band in the lower panels illustrates the total uncertainty on the background predictions. |

png |
Figure 3-b:
The invariant mass spectrum (left) and cumulative distribution (right) of the dielectron events in the barrel-barrel and barrel-endcap categories. The points with error bars represent the data. The histograms represent the expectations from SM processes: $ {\mathrm {Z}}{/}\gamma ^*$, $ {\mathrm {t}} {\overline {\mathrm {t}}}$ and other sources of prompt leptons ($ {\mathrm {t}} {\mathrm {W}}$, diboson production, $ {\mathrm {Z}}\rightarrow {\tau} {\tau}$), and from multijet events. The simulated backgrounds are normalised to the data in the region of 60 $ < m_{{\mathrm {e}} {\mathrm {e}}} < $ 120 GeV. The shaded band in the lower panels illustrates the total uncertainty on the background predictions. |
png pdf |
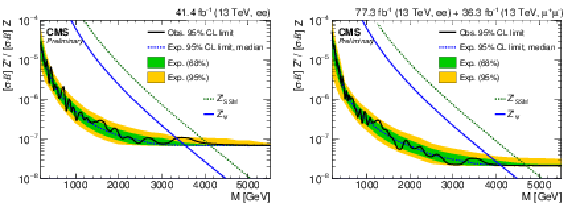
Figure 4:
The 95% CL upper limits on the production cross section times branching fraction for a spin-1 resonance with a width equal to 0.6% of the resonance mass, relative to the production cross section times branching fraction for a Z boson, for the dielectron channel using the 2017 dataset (left) and for its combination with the 2016 dataset (dielectron and dimuon channels) (right). The shaded bands correspond to the 68 and 95% quantiles for the expected limits. Theoretical predictions for the spin-1 $ {{\mathrm {Z}'}_\mathrm {SSM}} $ and $ {{\mathrm {Z}'}_\psi} $ resonances are shown for comparison. |

png pdf |
Figure 4-a:
The 95% CL upper limits on the production cross section times branching fraction for a spin-1 resonance with a width equal to 0.6% of the resonance mass, relative to the production cross section times branching fraction for a Z boson, for the dielectron channel using the 2017 dataset (left) and for its combination with the 2016 dataset (dielectron and dimuon channels) (right). The shaded bands correspond to the 68 and 95% quantiles for the expected limits. Theoretical predictions for the spin-1 $ {{\mathrm {Z}'}_\mathrm {SSM}} $ and $ {{\mathrm {Z}'}_\psi} $ resonances are shown for comparison. |

png pdf |
Figure 4-b:
The 95% CL upper limits on the production cross section times branching fraction for a spin-1 resonance with a width equal to 0.6% of the resonance mass, relative to the production cross section times branching fraction for a Z boson, for the dielectron channel using the 2017 dataset (left) and for its combination with the 2016 dataset (dielectron and dimuon channels) (right). The shaded bands correspond to the 68 and 95% quantiles for the expected limits. Theoretical predictions for the spin-1 $ {{\mathrm {Z}'}_\mathrm {SSM}} $ and $ {{\mathrm {Z}'}_\psi} $ resonances are shown for comparison. |
| Tables | |

png pdf |
Table 1:
The number of dielectron events in various invariant mass ranges. The total background contribution is the sum of the events for the SM processes listed. The sum of the backgrounds is normalized to the observed yield in the invariant mass region of 60-120 GeV. Uncertainties on the background contributions include both statistical and systematic components, summed in quadrature. |

png pdf |
Table 2:
The observed and expected 95% CL lower limits on masses of the spin-1 $ {{\mathrm {Z}'}_\mathrm {SSM}} $ and $ {{\mathrm {Z}'}_\psi} $ bosons for the dielectron channel in the 2017 dataset and for its combination with the 2016 dataset (dielectron and dimuon channels). The limits are rounded to the nearest 50 GeV. |
| Summary |
| A search for high mass resonances decaying to the dielectron final state has been performed using the proton-proton collision dataset at a center-of-mass energy of 13 TeV collected by CMS in 2017, and corresponding to an integrated luminosity of 41.4 fb$^{-1}$. The observations are consistent with the expectations of the standard model. The results of the search are combined statistically with those obtained in similar searches based on the CMS dataset recorded in 2016. Upper limits at 95% CL are set on the cross section times branching fraction for new boson production relative to standard model $\mathrm{Z}$ boson production. For the $\mathrm{Z}'_{SSM}$ and $\mathrm{Z}'_{\psi}$ bosons, mass lower limits of 4.7 TeV and 4.1 TeV are obtained, respectively. |
| References | ||||
| 1 | J. Ellis | Outstanding questions: physics beyond the standard model | Phil. Trans. R. Soc. A 370 (2012) 818 | |
| 2 | G. Altarelli, B. Mele, and M. Ruiz-Altaba | Searching for new heavy vector bosons in $ {\mathrm{p}}\mathrm{\bar{p}} $ colliders | Z. Phys. C 45 (1989) 109 | |
| 3 | A. Leike | The phenomenology of extra neutral gauge bosons | PR 317 (1999) 143 | hep-ph/9805494 |
| 4 | J. L. Hewett and T. G. Rizzo | Low-energy phenomenology of superstring-inspired E$ _6 $ models | PR 183 (1989) 193 | |
| 5 | ATLAS Collaboration | Search for high-mass new phenomena in the dilepton final state using proton-proton collisions at $ \sqrt{s}= $ 13 TeV with the ATLAS detector | PLB761 (2016) 372--392 | 1607.03669 |
| 6 | ATLAS Collaboration | Search for new high-mass phenomena in the dilepton final state using 36 fb$ ^{-1} $ of proton-proton collision data at $ \sqrt{s}= $ 13 TeV with the ATLAS detector | JHEP 10 (2017) 182 | 1707.02424 |
| 7 | CMS Collaboration | Search for narrow resonances in dilepton mass spectra in proton-proton collisions at $ \sqrt{s} = $ 13 TeV and combination with 8 TeV data | PLB768 (2017) 57--80 | CMS-EXO-15-005 1609.05391 |
| 8 | CMS Collaboration | Search for high-mass resonances in dilepton final states using proton-proton collisions at $ \sqrt{s} = $ 13 TeV | CMS-PAS-EXO-15-005 | CMS-PAS-EXO-15-005 |
| 9 | CMS Collaboration | The CMS experiment at the CERN LHC | JINST 3 (2008) S08004 | CMS-00-001 |
| 10 | P. Nason | A New method for combining NLO QCD with shower Monte Carlo algorithms | JHEP 11 (2004) 040 | hep-ph/0409146 |
| 11 | S. Frixione, P. Nason, and C. Oleari | Matching NLO QCD computations with Parton Shower simulations: the POWHEG method | JHEP 11 (2007) 070 | 0709.2092 |
| 12 | S. Alioli, P. Nason, C. Oleari, and E. Re | A general framework for implementing NLO calculations in shower Monte Carlo programs: the POWHEG BOX | JHEP 06 (2010) 043 | 1002.2581 |
| 13 | S. Alioli, P. Nason, C. Oleari, and E. Re | NLO vector-boson production matched with shower in POWHEG | JHEP 07 (2008) 060 | 0805.4802 |
| 14 | Y. Li and F. Petriello | Combining QCD and electroweak corrections to dilepton production in FEWZ | PRD 86 (2012) 094034 | 1208.5967 |
| 15 | A. Manohar, P. Nason, G. P. Salam, and G. Zanderighi | How bright is the proton? A precise determination of the photon parton distribution function | PRL 117 (2016), no. 24, 242002 | 1607.04266 |
| 16 | S. Frixione, P. Nason, and G. Ridolfi | A Positive-weight next-to-leading-order Monte Carlo for heavy flavour hadroproduction | JHEP 09 (2007) 126 | 0707.3088 |
| 17 | E. Re | Single-top Wt-channel production matched with parton showers using the POWHEG method | EPJC 71 (2011) 1547 | 1009.2450 |
| 18 | T. Sjostrand et al. | An Introduction to PYTHIA 8.2 | CPC 191 (2015) 159 | 1410.3012 |
| 19 | NNPDF Collaboration | Parton distributions from high-precision collider data | EPJC77 (2017) 663 | 1706.00428 |
| 20 | CMS Collaboration | Performance of Electron Reconstruction and Selection with the CMS Detector in Proton-Proton Collisions at $ \sqrt{s}= $ 8 ~TeV | JINST 10 (2015), no. 06, P06005 | CMS-EGM-13-001 1502.02701 |
| 21 | E. Accomando et al. | Z' at the LHC: Interference and Finite Width Effects in Drell-Yan | JHEP 10 (2013) 153 | 1304.6700 |

|
Compact Muon Solenoid LHC, CERN |

|

|

|

|

|

|