

Compact Muon Solenoid
LHC, CERN
| CMS-PAS-EXO-16-049 | ||
| Search for dark matter produced in association with a top quark pair at $\sqrt{s} = $ 13 TeV | ||
| CMS Collaboration | ||
| April 2018 | ||
| Abstract: A search is performed for dark matter produced in association with a top quark pair in proton-proton collisions at $\sqrt{s} = $ 13 TeV recorded by the CMS detector at the LHC in 2016. The data correspond to an integrated luminosity of 35.9 fb$^{-1}$. Combined results of final states involving zero, one, or two leptons (electrons or muons) are presented. No significant excess is observed, and the results are interpreted in the context of simplified models of dark matter production via spin-0 mediators. Scalar (pseudoscalar) mediators with masses below 165 (223) GeV are excluded at 95% confidence level. These are the most stringent limits at the LHC on dark matter models involving a scalar mediator. Constraints on the coupling strength between dark matter and standard model quarks are also presented. | ||
|
Links:
CDS record (PDF) ;
inSPIRE record ;
CADI line (restricted) ;
These preliminary results are superseded in this paper, PRL 122 (2019) 011803. The superseded preliminary plots can be found here. |
||
| Figures | Summary | Additional Figures | References | CMS Publications |
|---|
| Figures | |
png pdf |
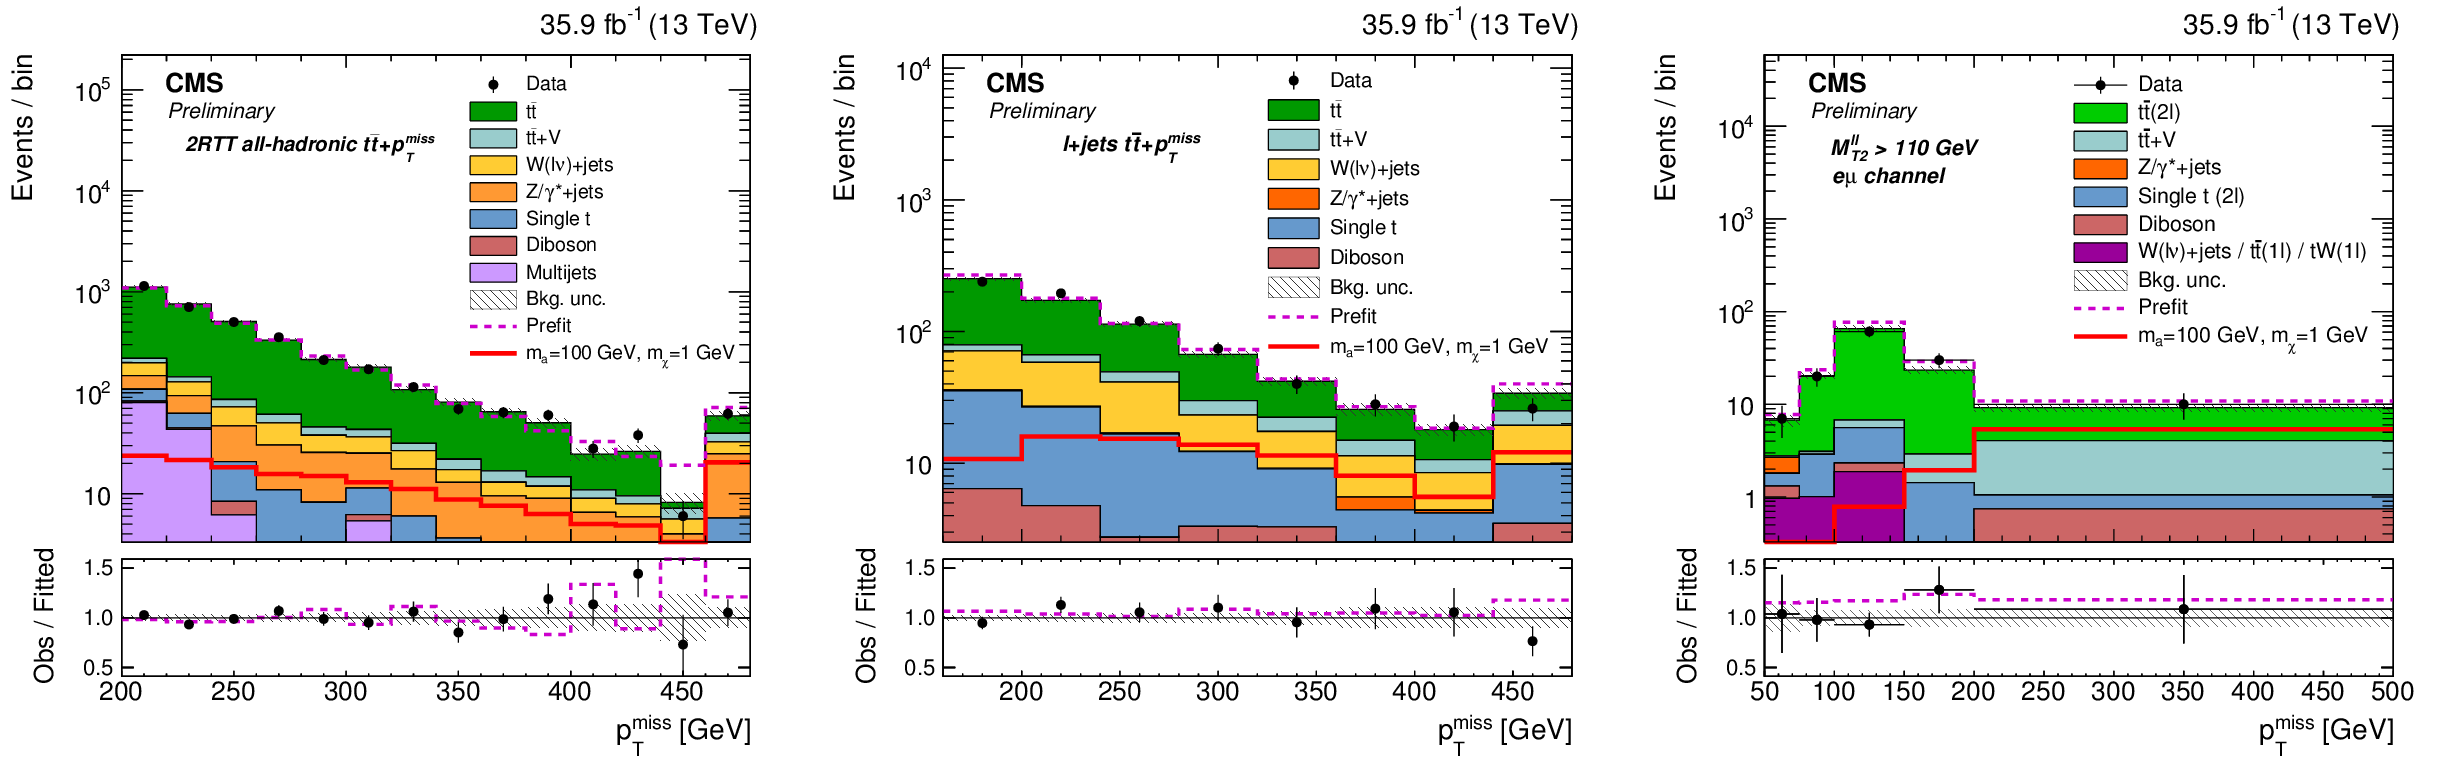
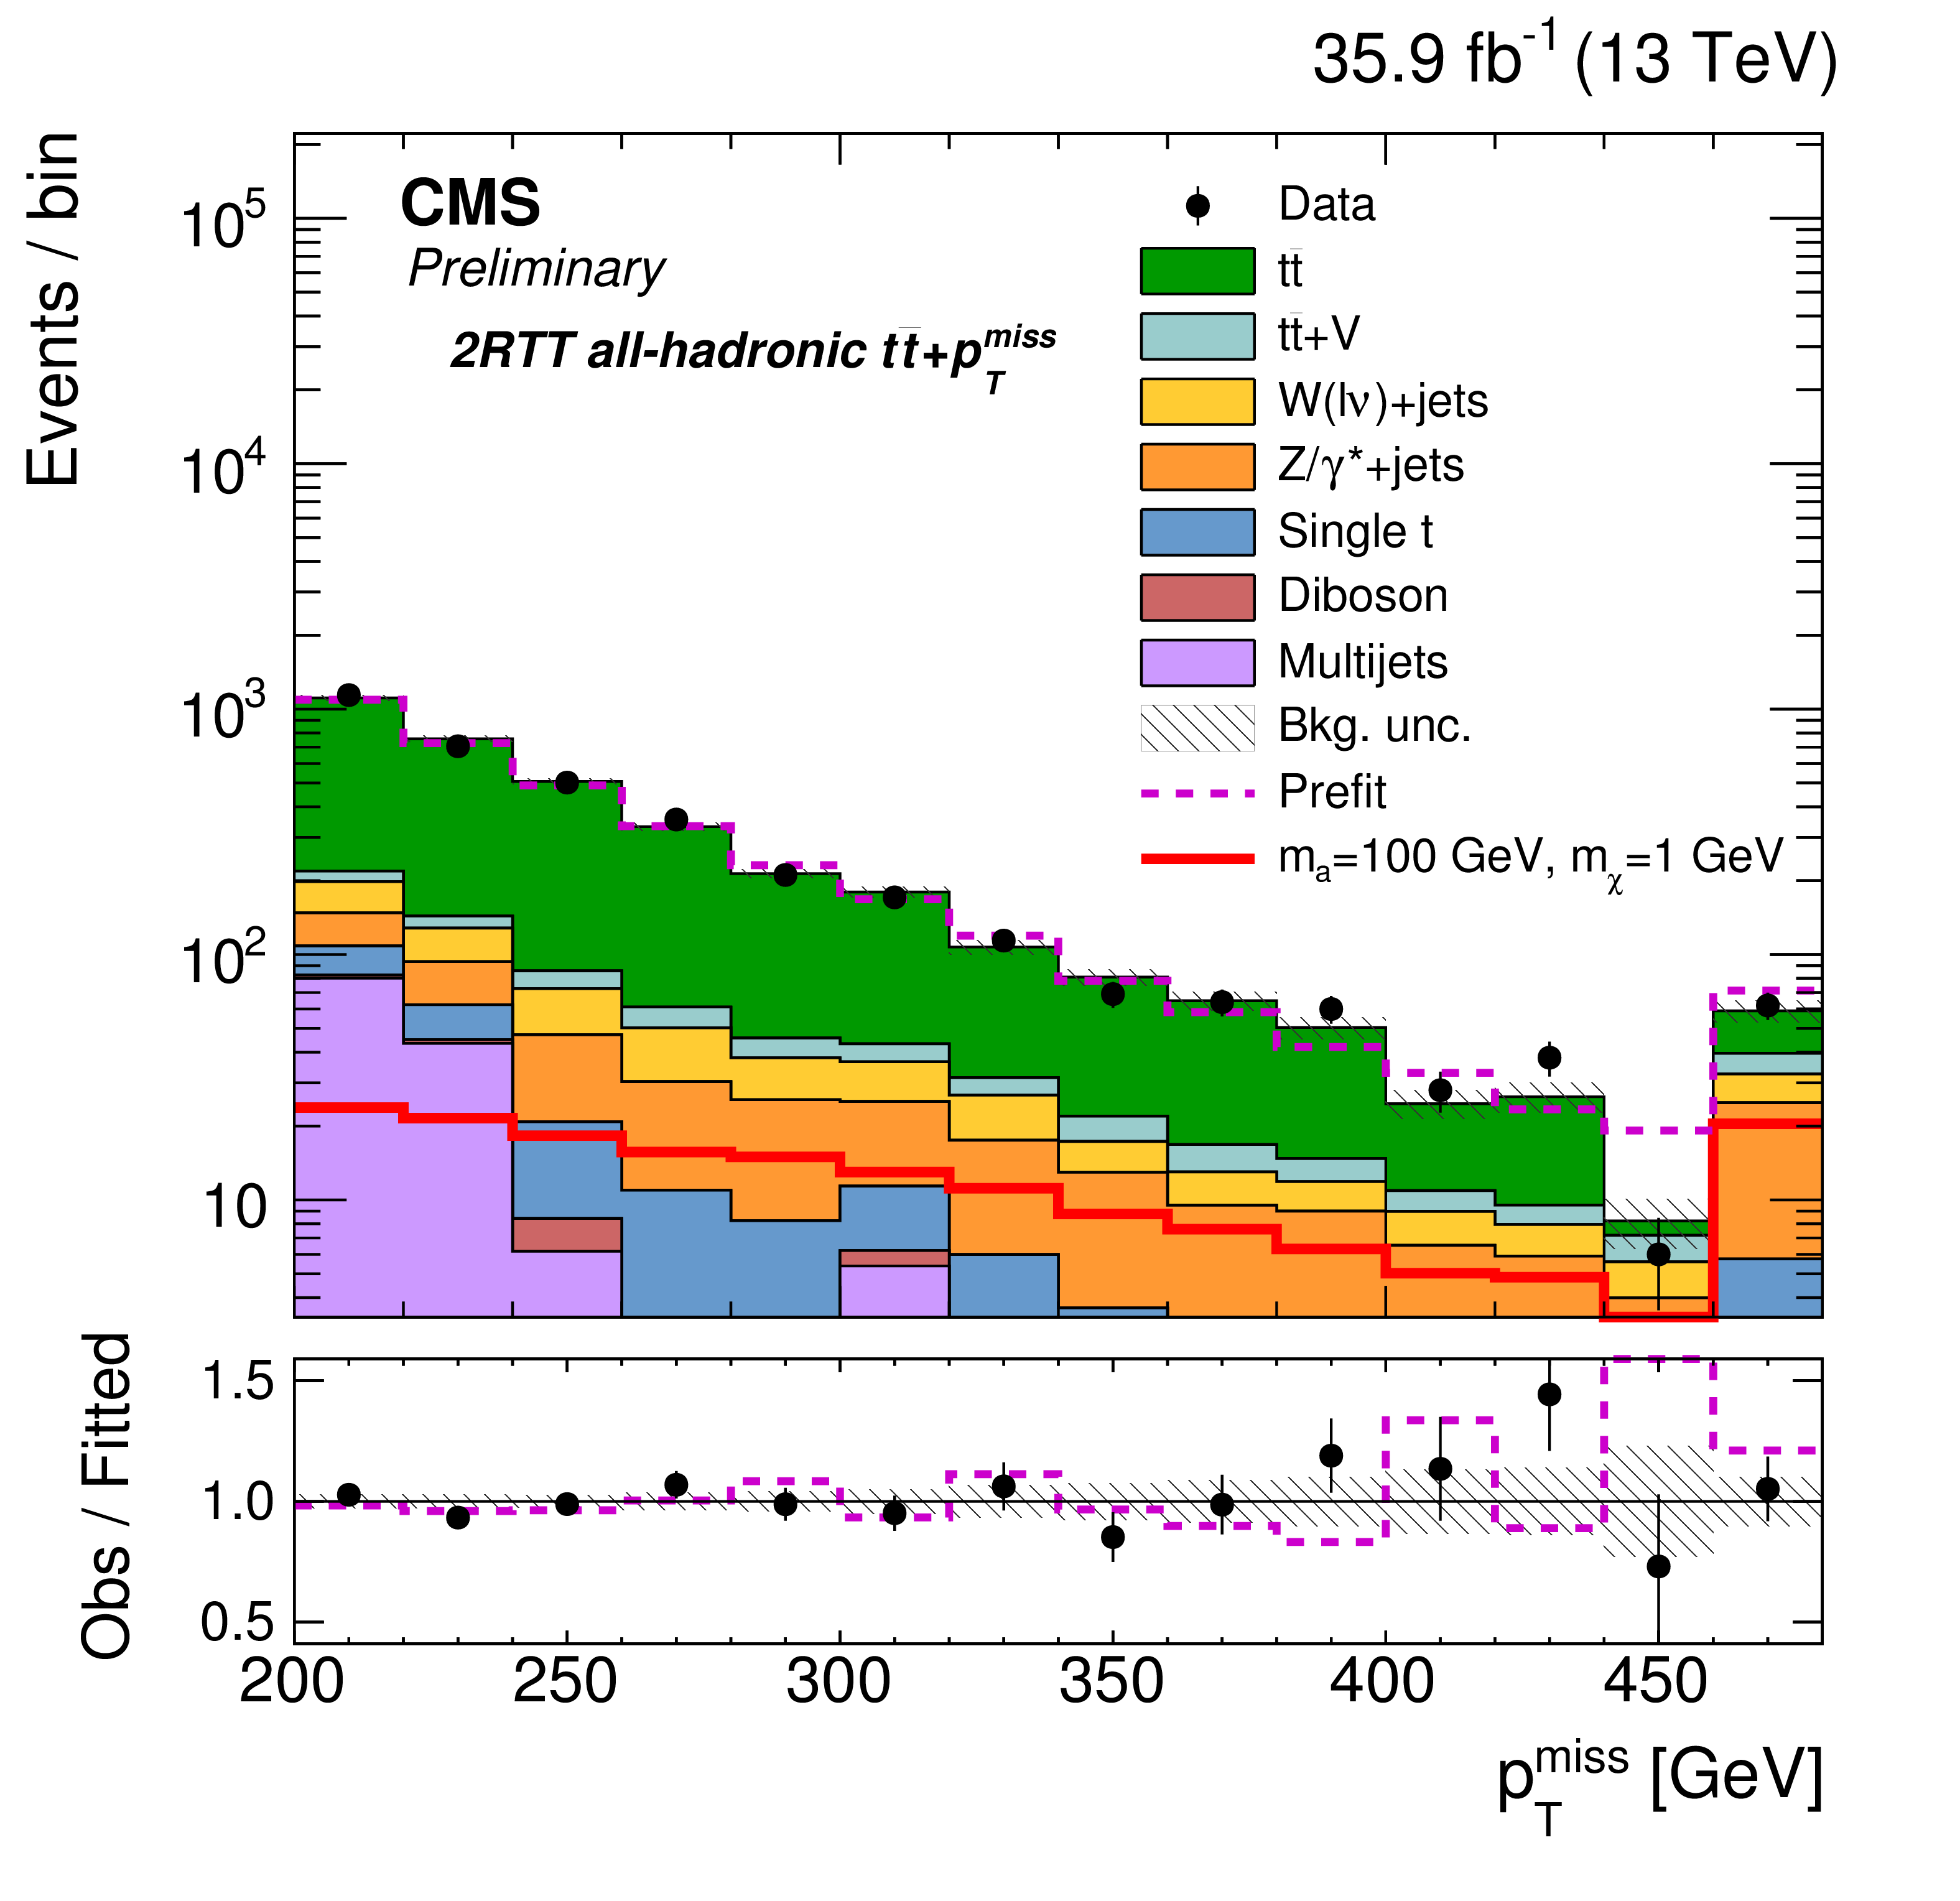
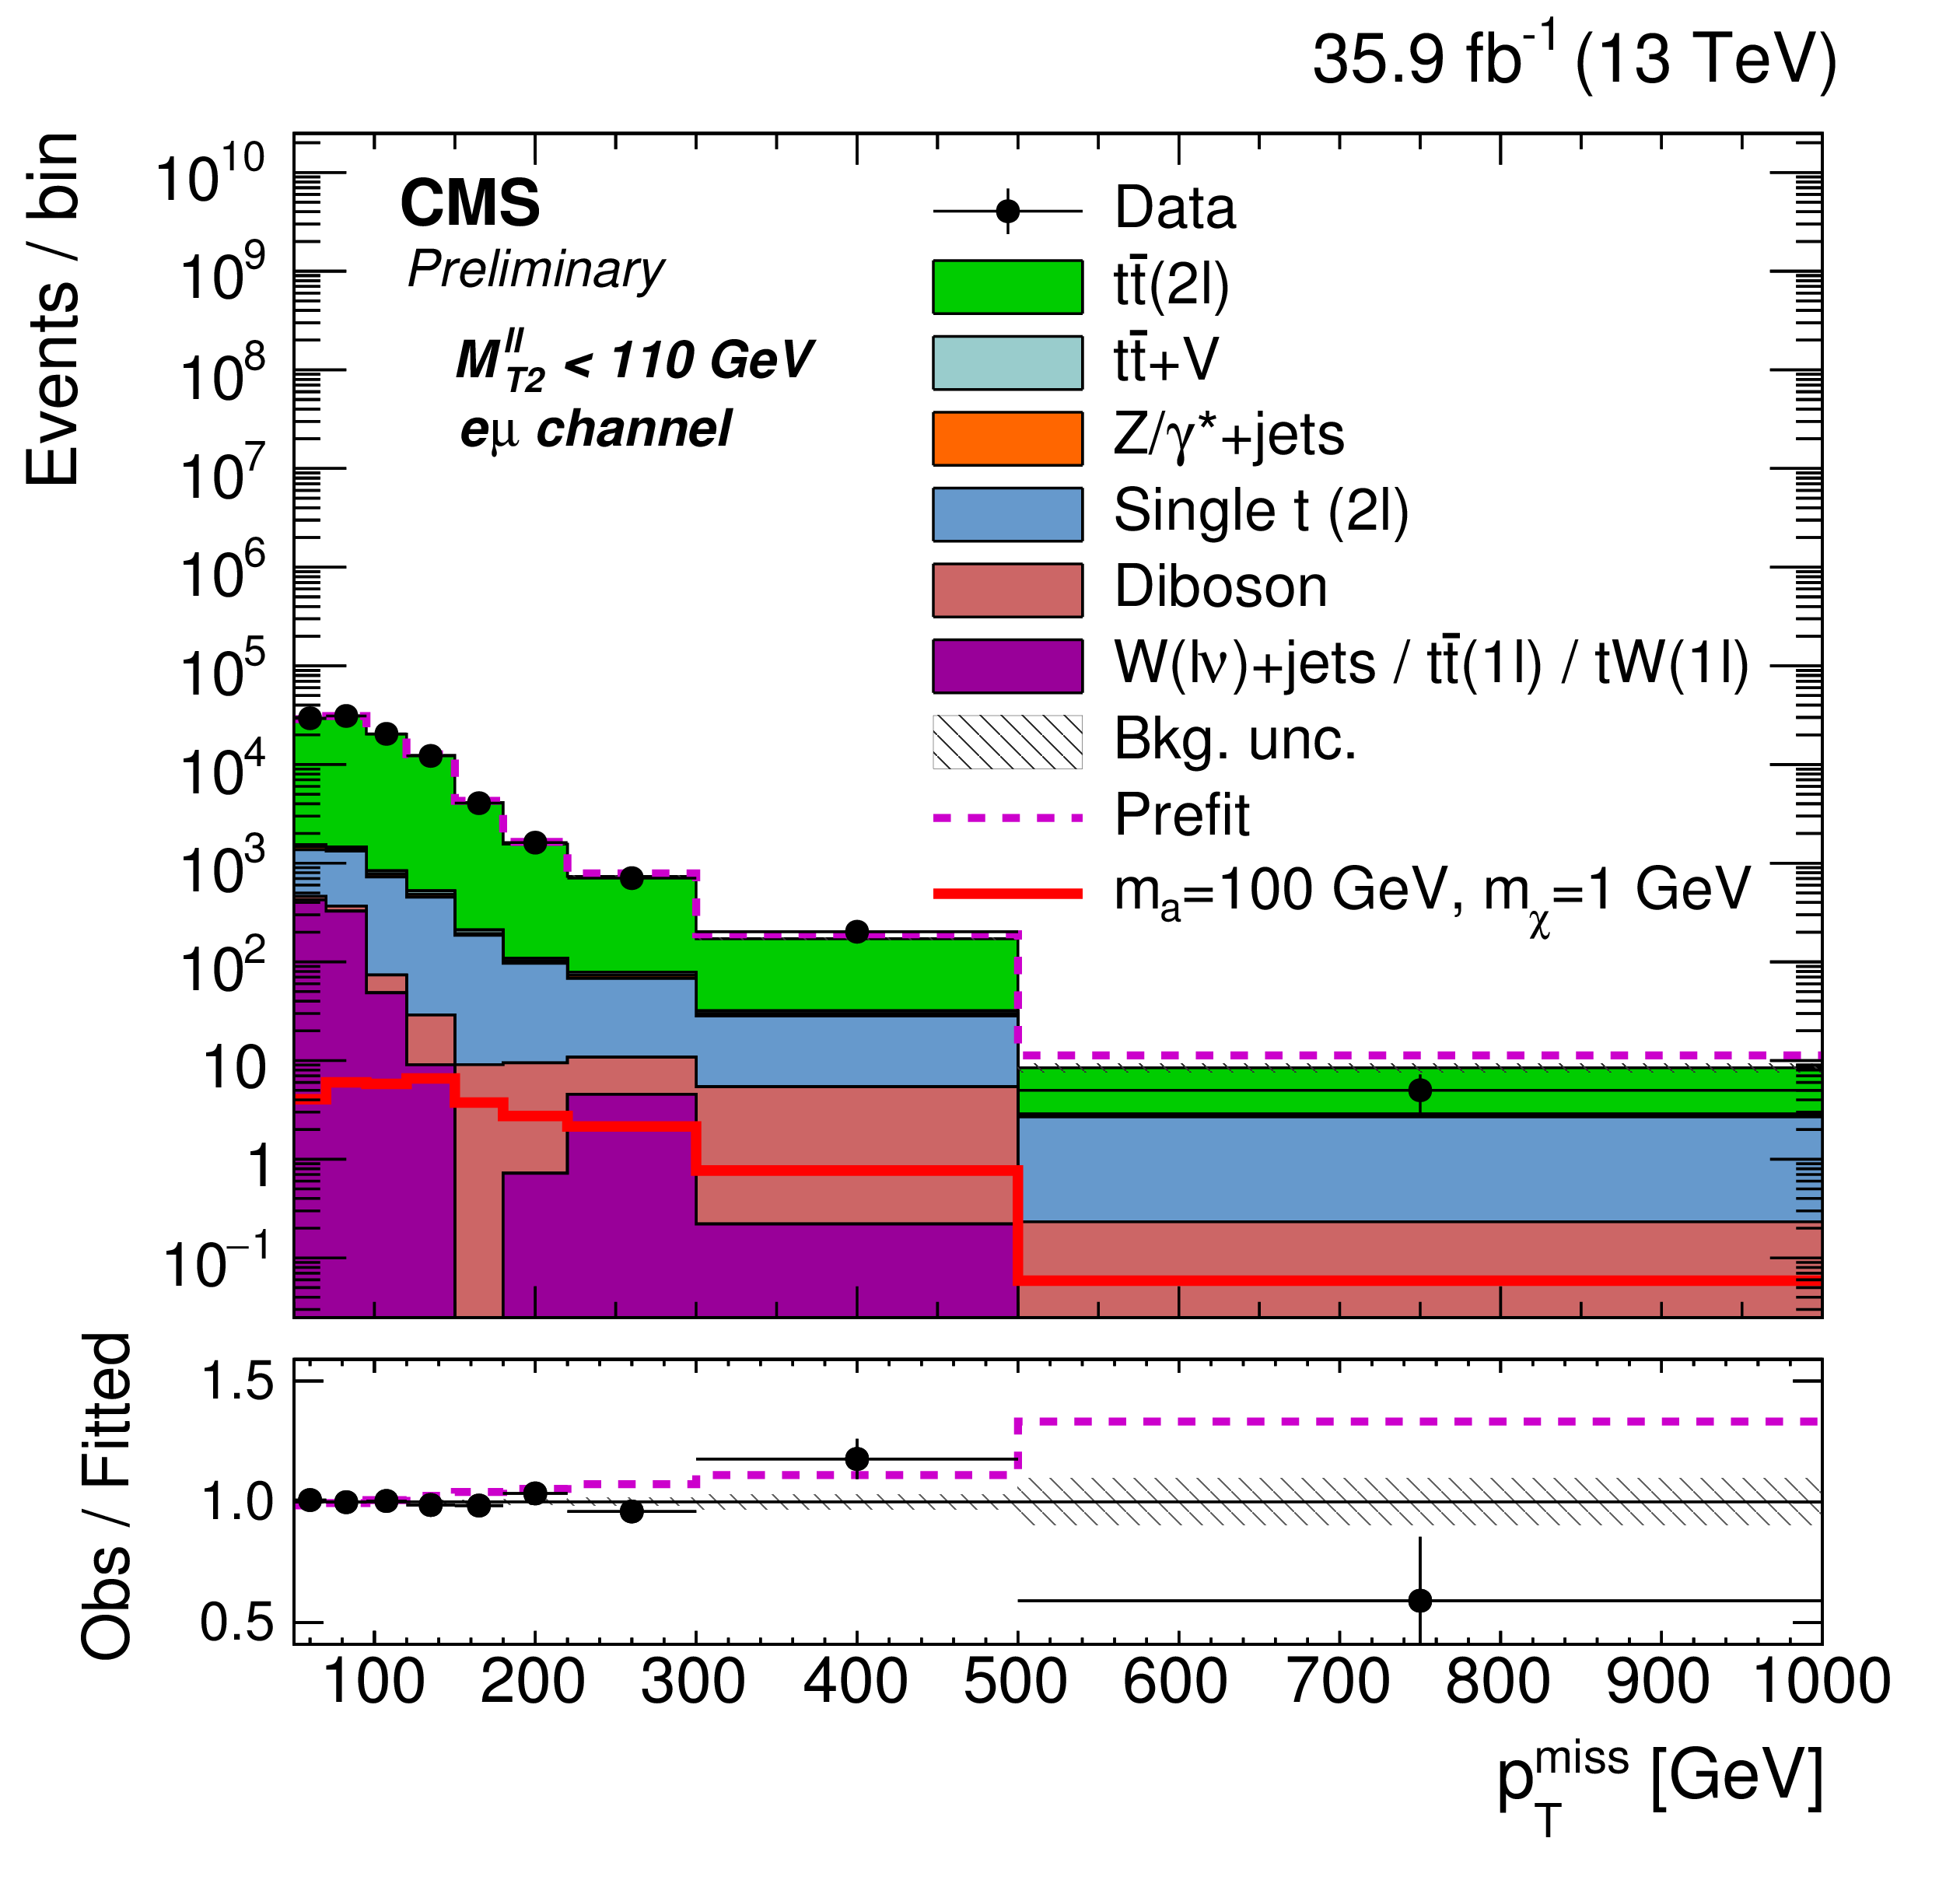
Figure 1:
Selected $ {{p_{\text {T}}^{\text {miss}}}}$ distributions in SRs: 2RTT SR for the all-hadronic (left), the $\ell +$jets (middle), and the different flavor, $ {M^{\ell \ell}_{{\text {T2}}}} > $ 110 GeV SR in dileptonic channel (right). The background distributions (filled histograms) are obtained after a background-only fit. The expected $ {{p_{\text {T}}^{\text {miss}}}}$ distribution for a signal corresponding to a 100 GeV pseudoscalar is overlaid (solid red line). The last bin contains overflow events. The lower panel shows the ratio of the observed data to the fitted distribution (points), and the ratio of the pre-fit background expectation to the fitted distribution (dashed magenta line). The horizontal bars indicate the bin width. |
png pdf |
Figure 1-a:
Selected $ {{p_{\text {T}}^{\text {miss}}}}$ distribution in the 2RTT SR for the all-hadronic. The background distributions (filled histograms) are obtained after a background-only fit. The expected $ {{p_{\text {T}}^{\text {miss}}}}$ distribution for a signal corresponding to a 100 GeV pseudoscalar is overlaid (solid red line). The last bin contains overflow events. The lower panel shows the ratio of the observed data to the fitted distribution (points), and the ratio of the pre-fit background expectation to the fitted distribution (dashed magenta line). The horizontal bars indicate the bin width. |

png pdf |
Figure 1-b:
Selected $ {{p_{\text {T}}^{\text {miss}}}}$ distribution in the $\ell +$jets SR. The background distributions (filled histograms) are obtained after a background-only fit. The expected $ {{p_{\text {T}}^{\text {miss}}}}$ distribution for a signal corresponding to a 100 GeV pseudoscalar is overlaid (solid red line). The last bin contains overflow events. The lower panel shows the ratio of the observed data to the fitted distribution (points), and the ratio of the pre-fit background expectation to the fitted distribution (dashed magenta line). The horizontal bars indicate the bin width. |

png pdf |
Figure 1-c:
Selected $ {{p_{\text {T}}^{\text {miss}}}}$ distribution in the different flavor, $ {M^{\ell \ell}_{{\text {T2}}}} > $ 110 GeV SR in dileptonic channel. The background distributions (filled histograms) are obtained after a background-only fit. The expected $ {{p_{\text {T}}^{\text {miss}}}}$ distribution for a signal corresponding to a 100 GeV pseudoscalar is overlaid (solid red line). The last bin contains overflow events. The lower panel shows the ratio of the observed data to the fitted distribution (points), and the ratio of the pre-fit background expectation to the fitted distribution (dashed magenta line). The horizontal bars indicate the bin width. |
png pdf |
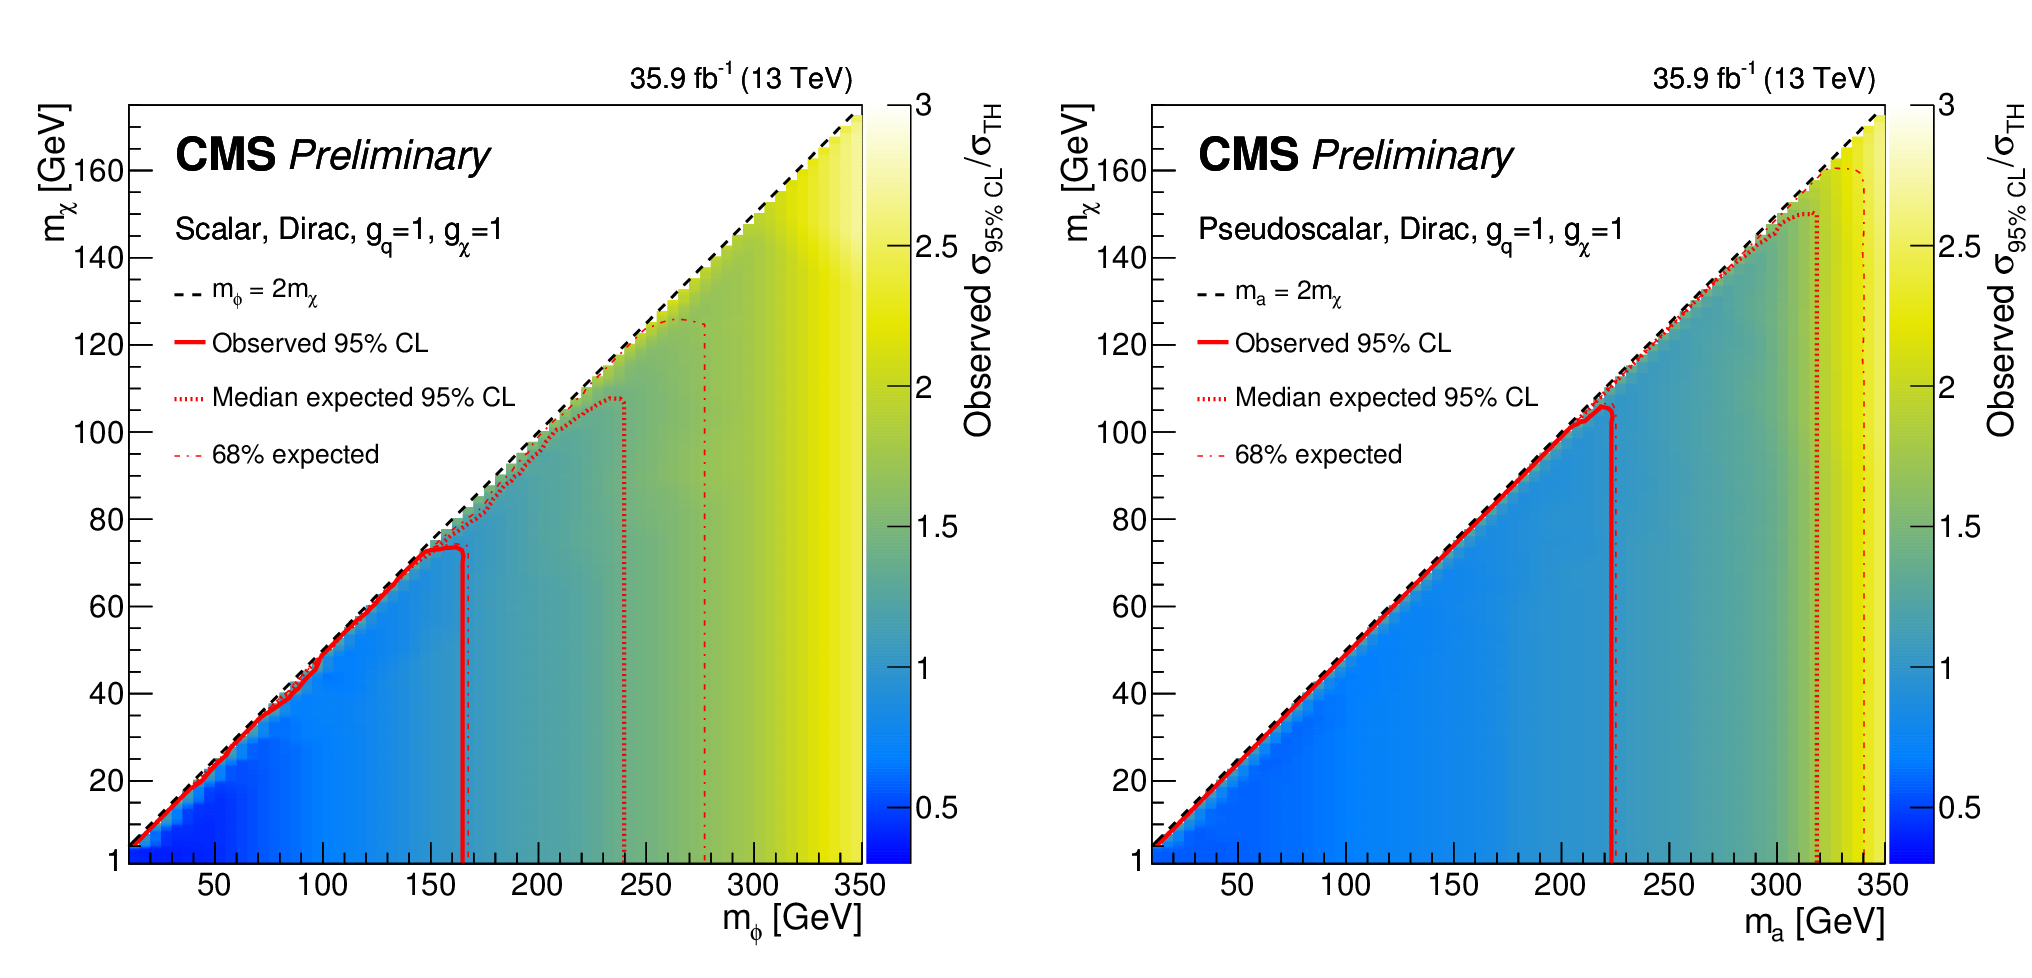
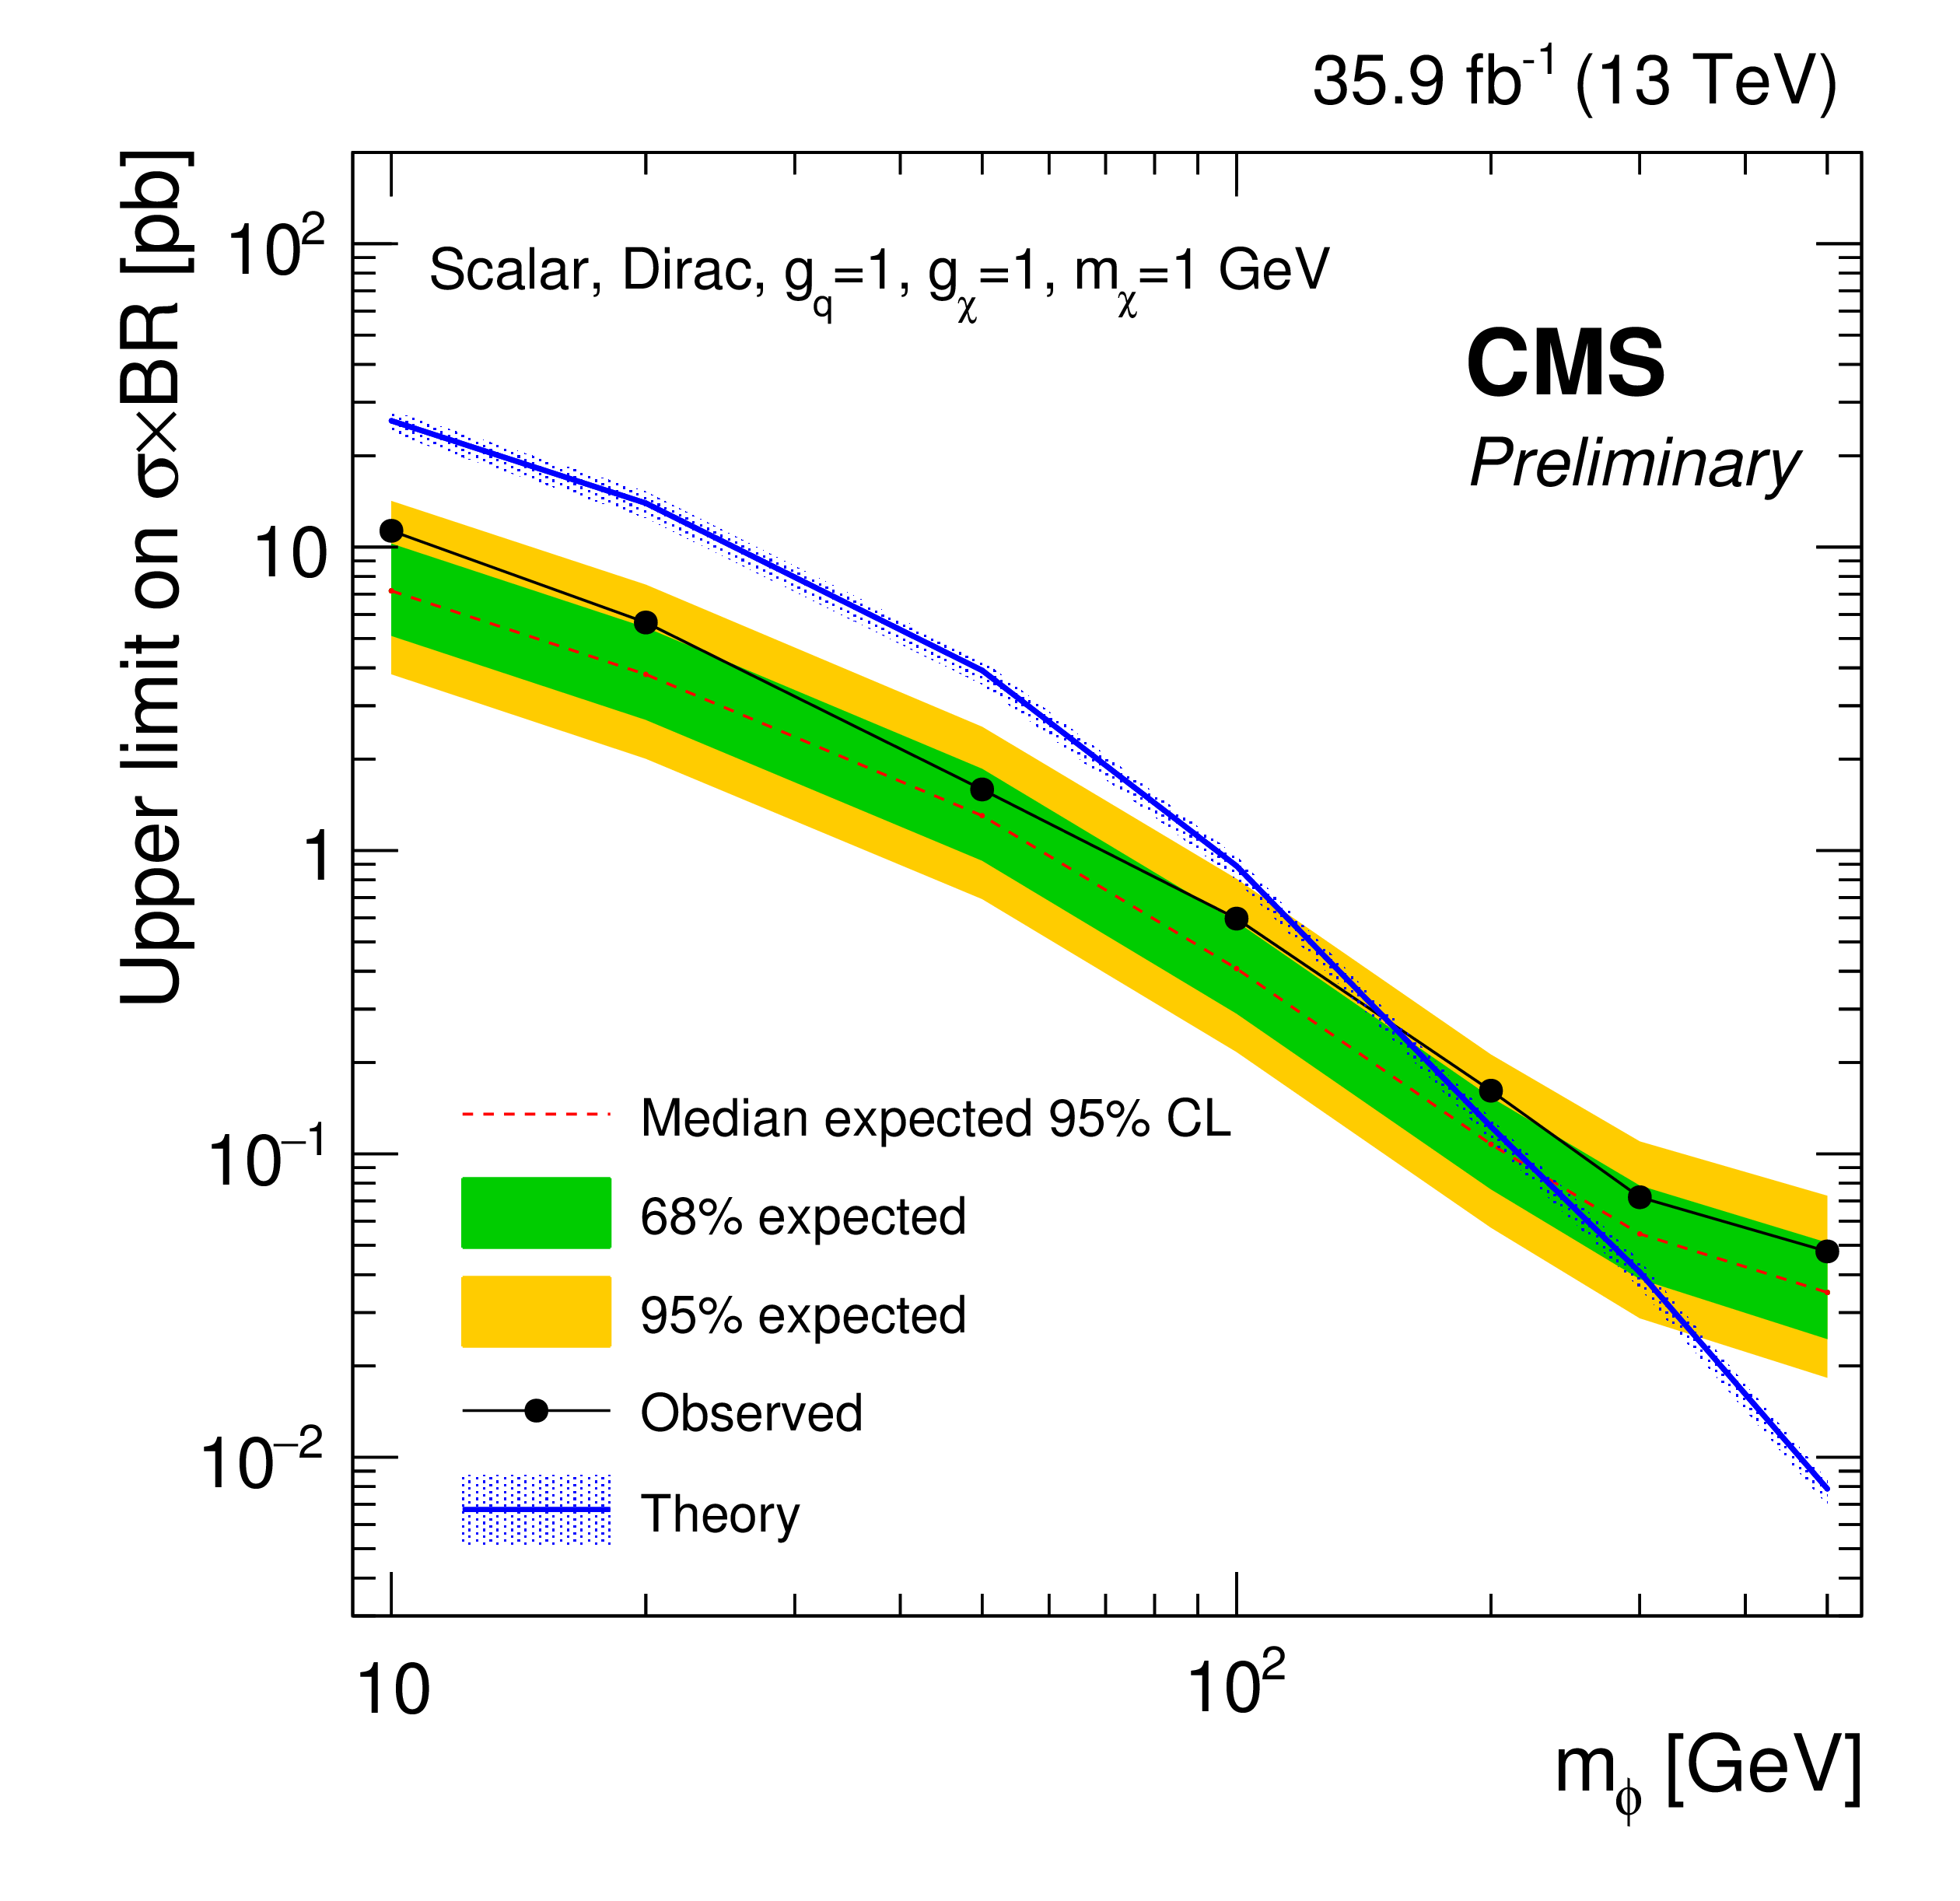
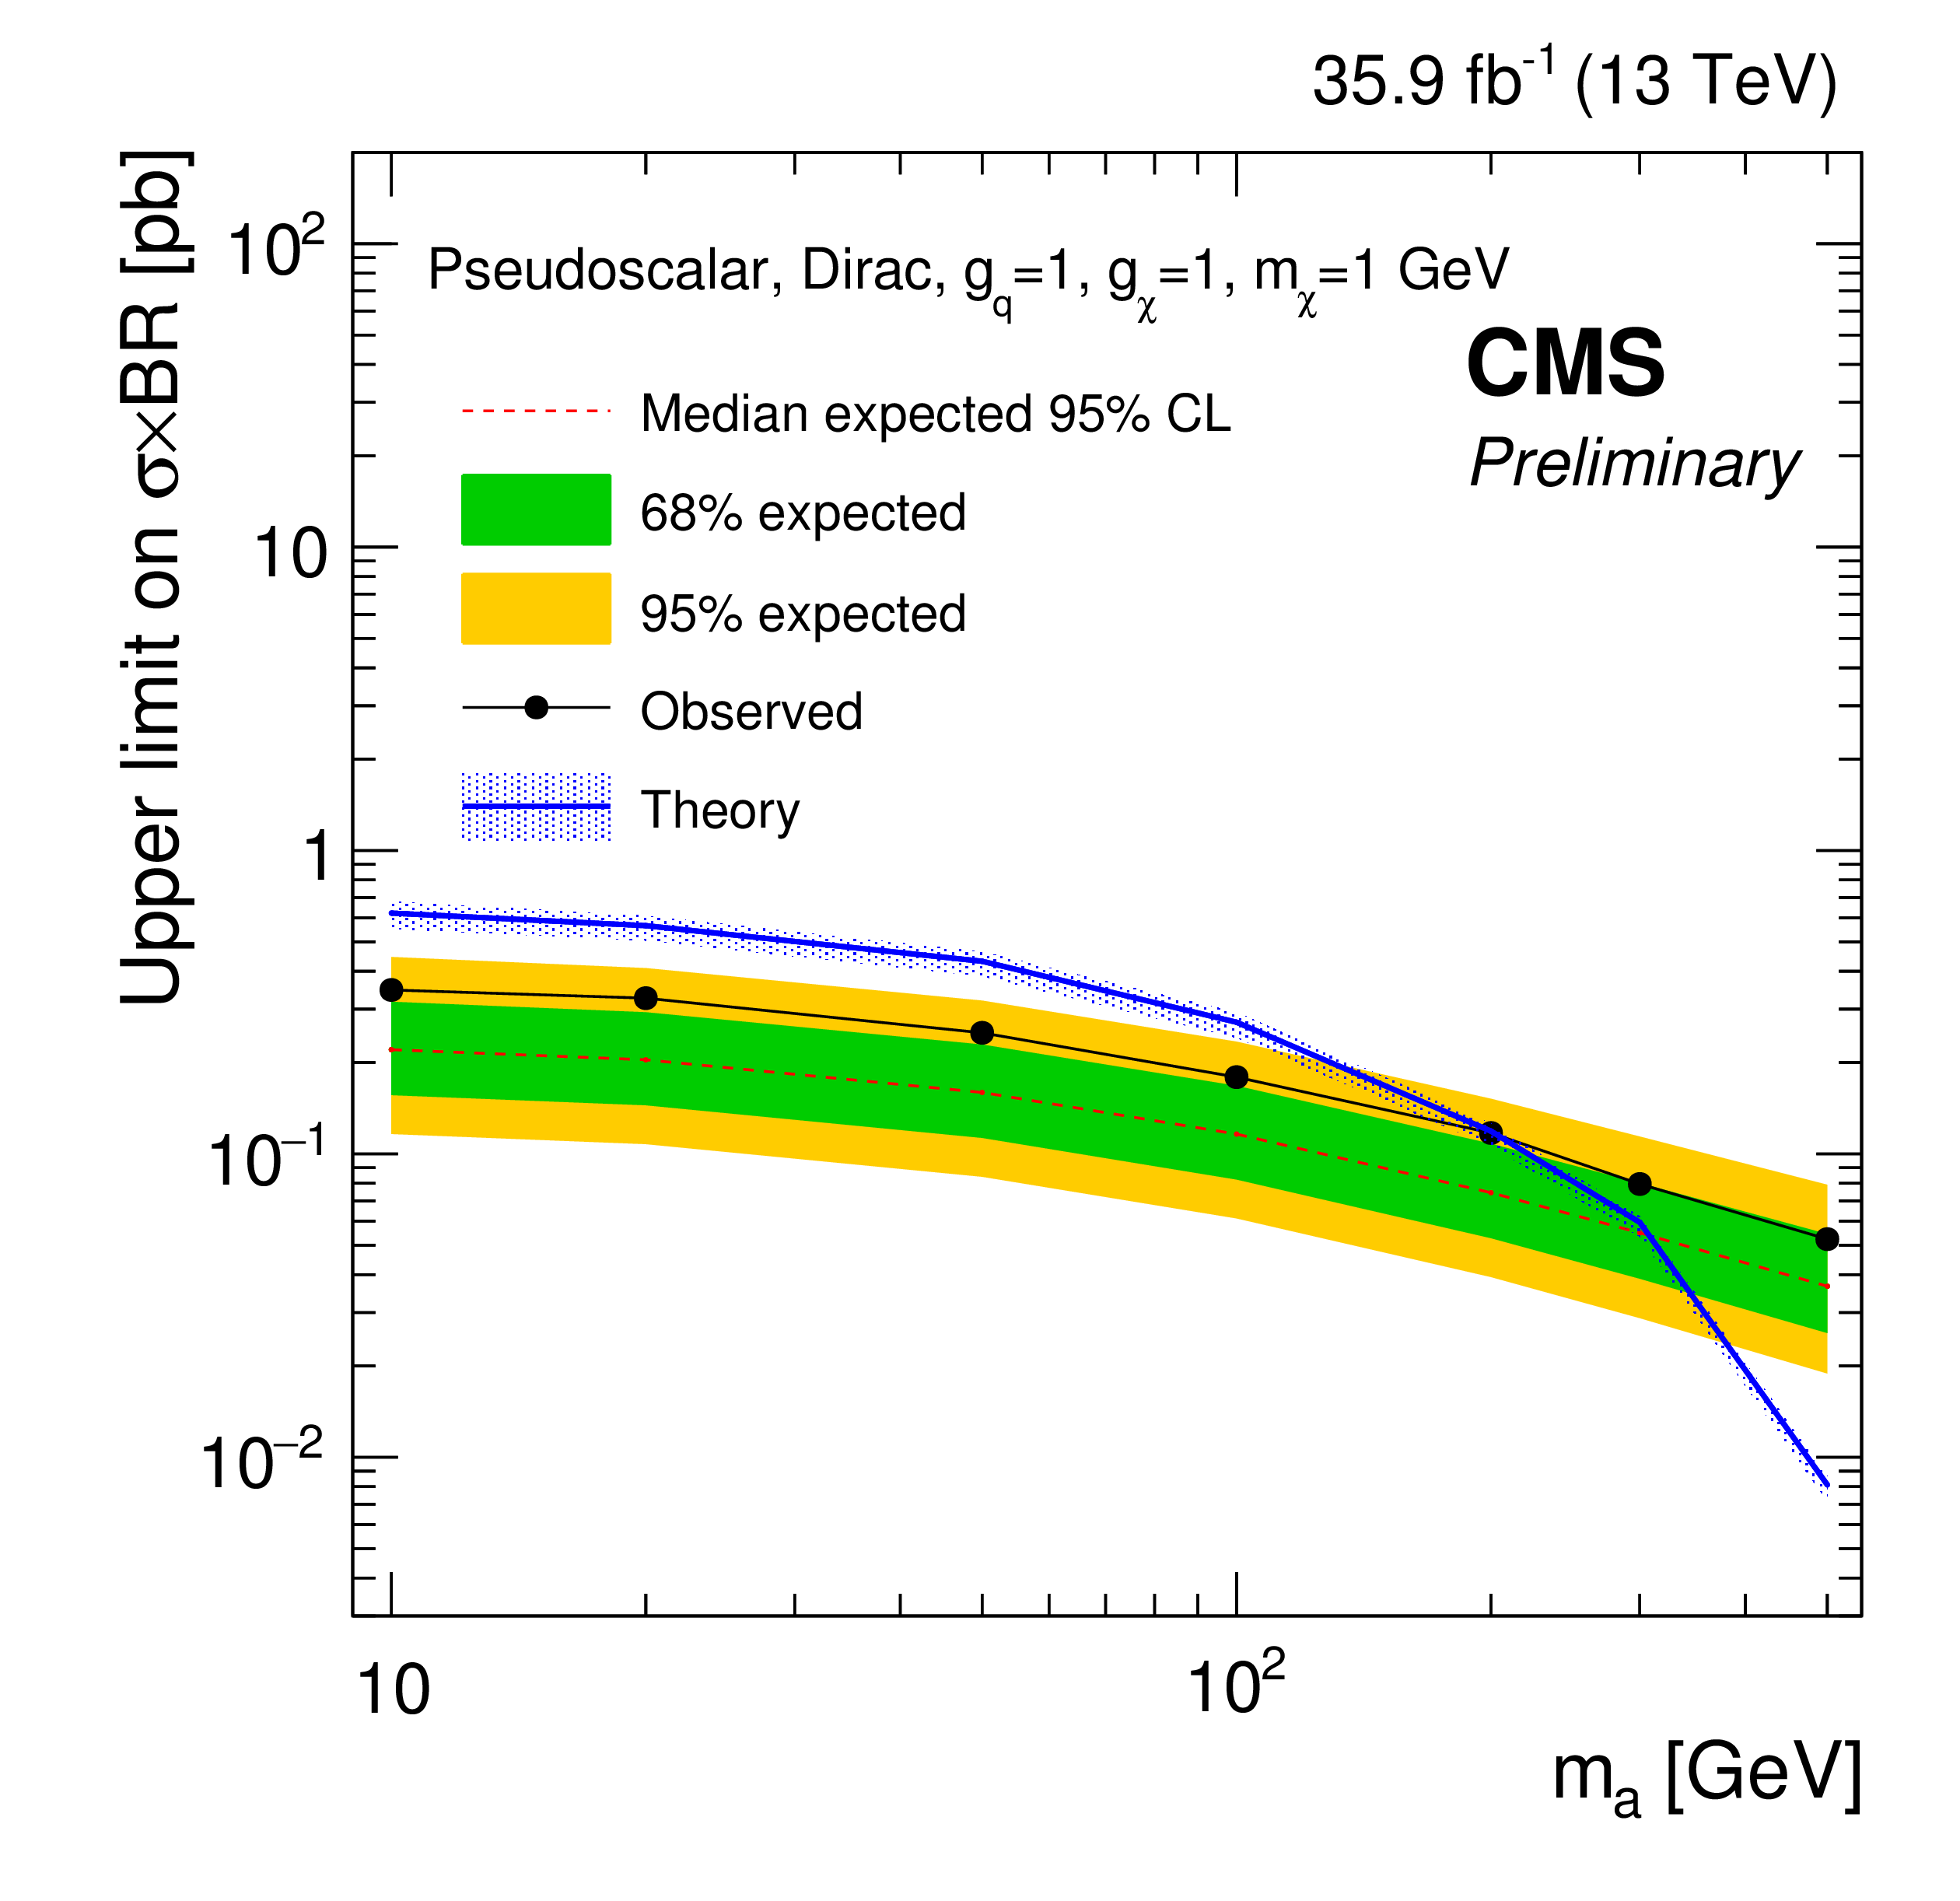
Figure 2:
The exclusion limits at 95% CL on the signal strength $\mu $ computed as a function of the mediator and DM mass, assuming a scalar (left) and pseudoscalar (right) mediator. The mediator couplings are assumed to be $ {g_{\text {q}}}=g_{\chi}= $ 1. |

png pdf |
Figure 2-a:
The exclusion limits at 95% CL on the signal strength $\mu $ computed as a function of the mediator and DM mass, assuming a scalar mediator. The mediator couplings are assumed to be $ {g_{\text {q}}}=g_{\chi}= $ 1. |

png pdf |
Figure 2-b:
The exclusion limits at 95% CL on the signal strength $\mu $ computed as a function of the mediator and DM mass, assuming a pseudoscalar mediator. The mediator couplings are assumed to be $ {g_{\text {q}}}=g_{\chi}= $ 1. |
png pdf |
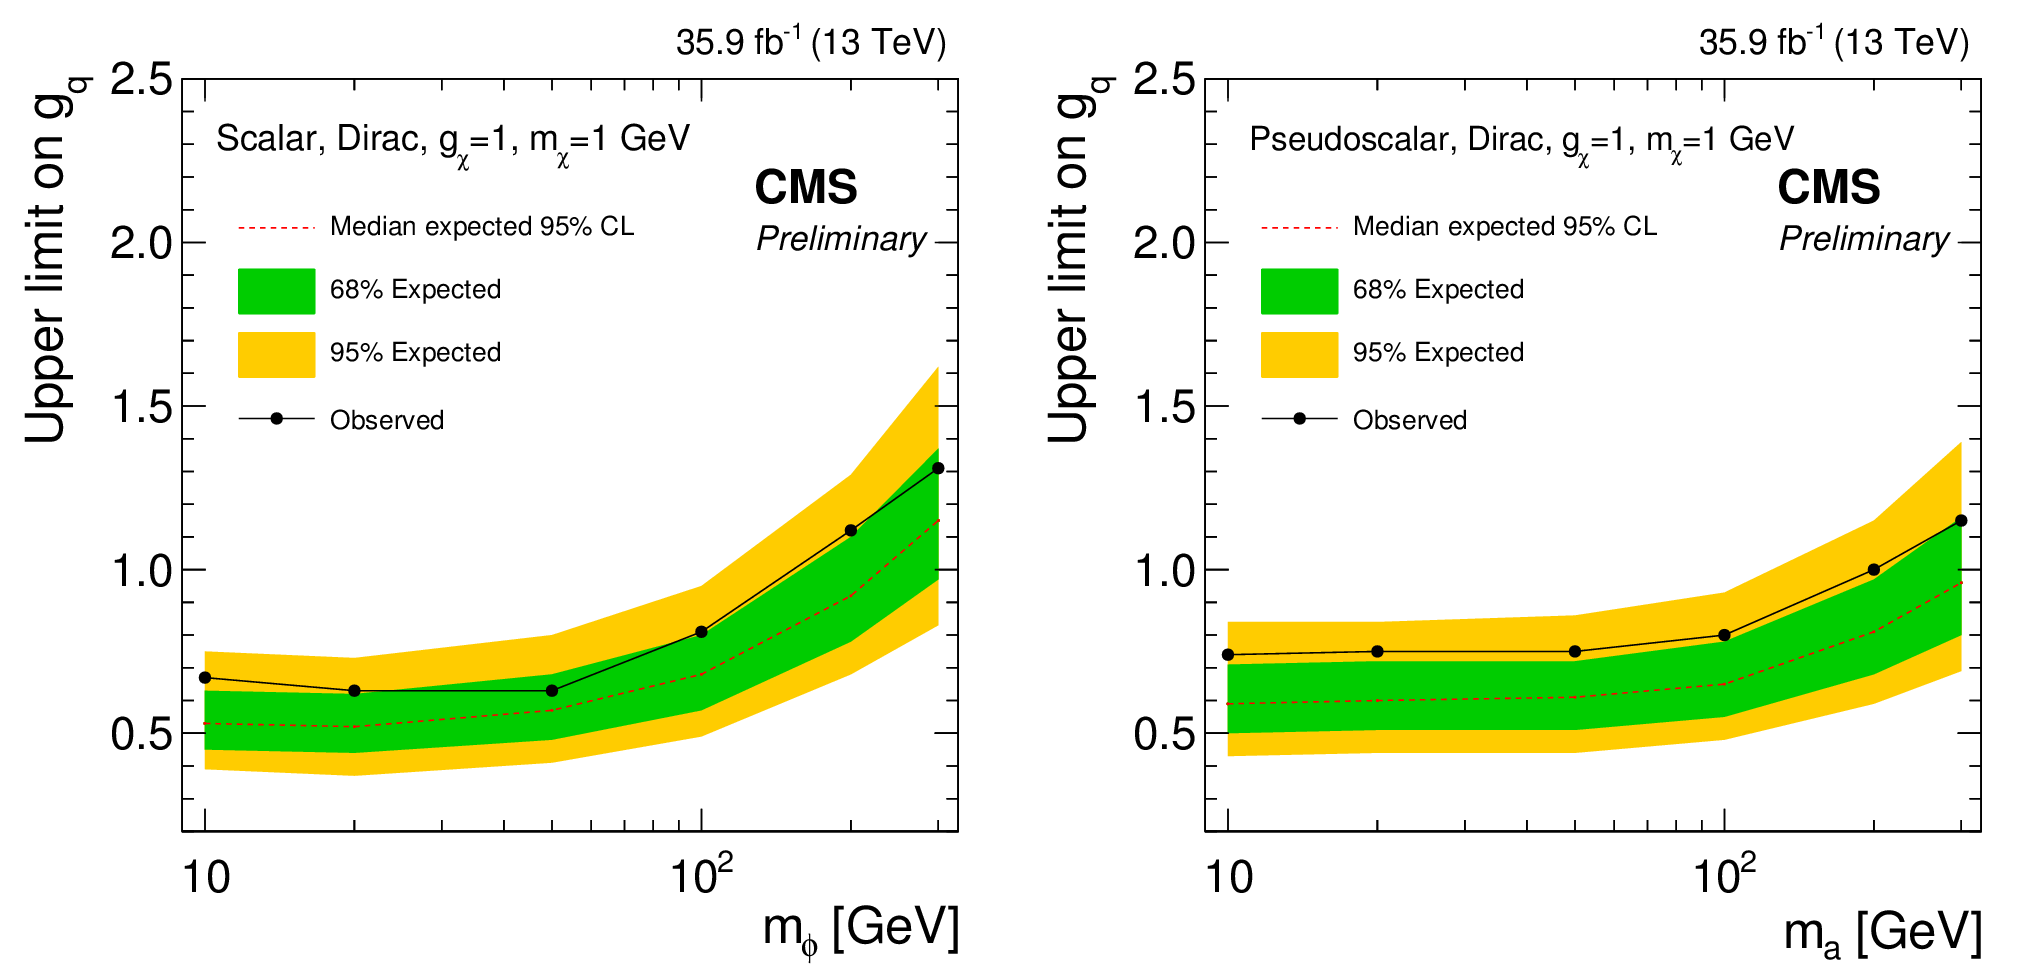
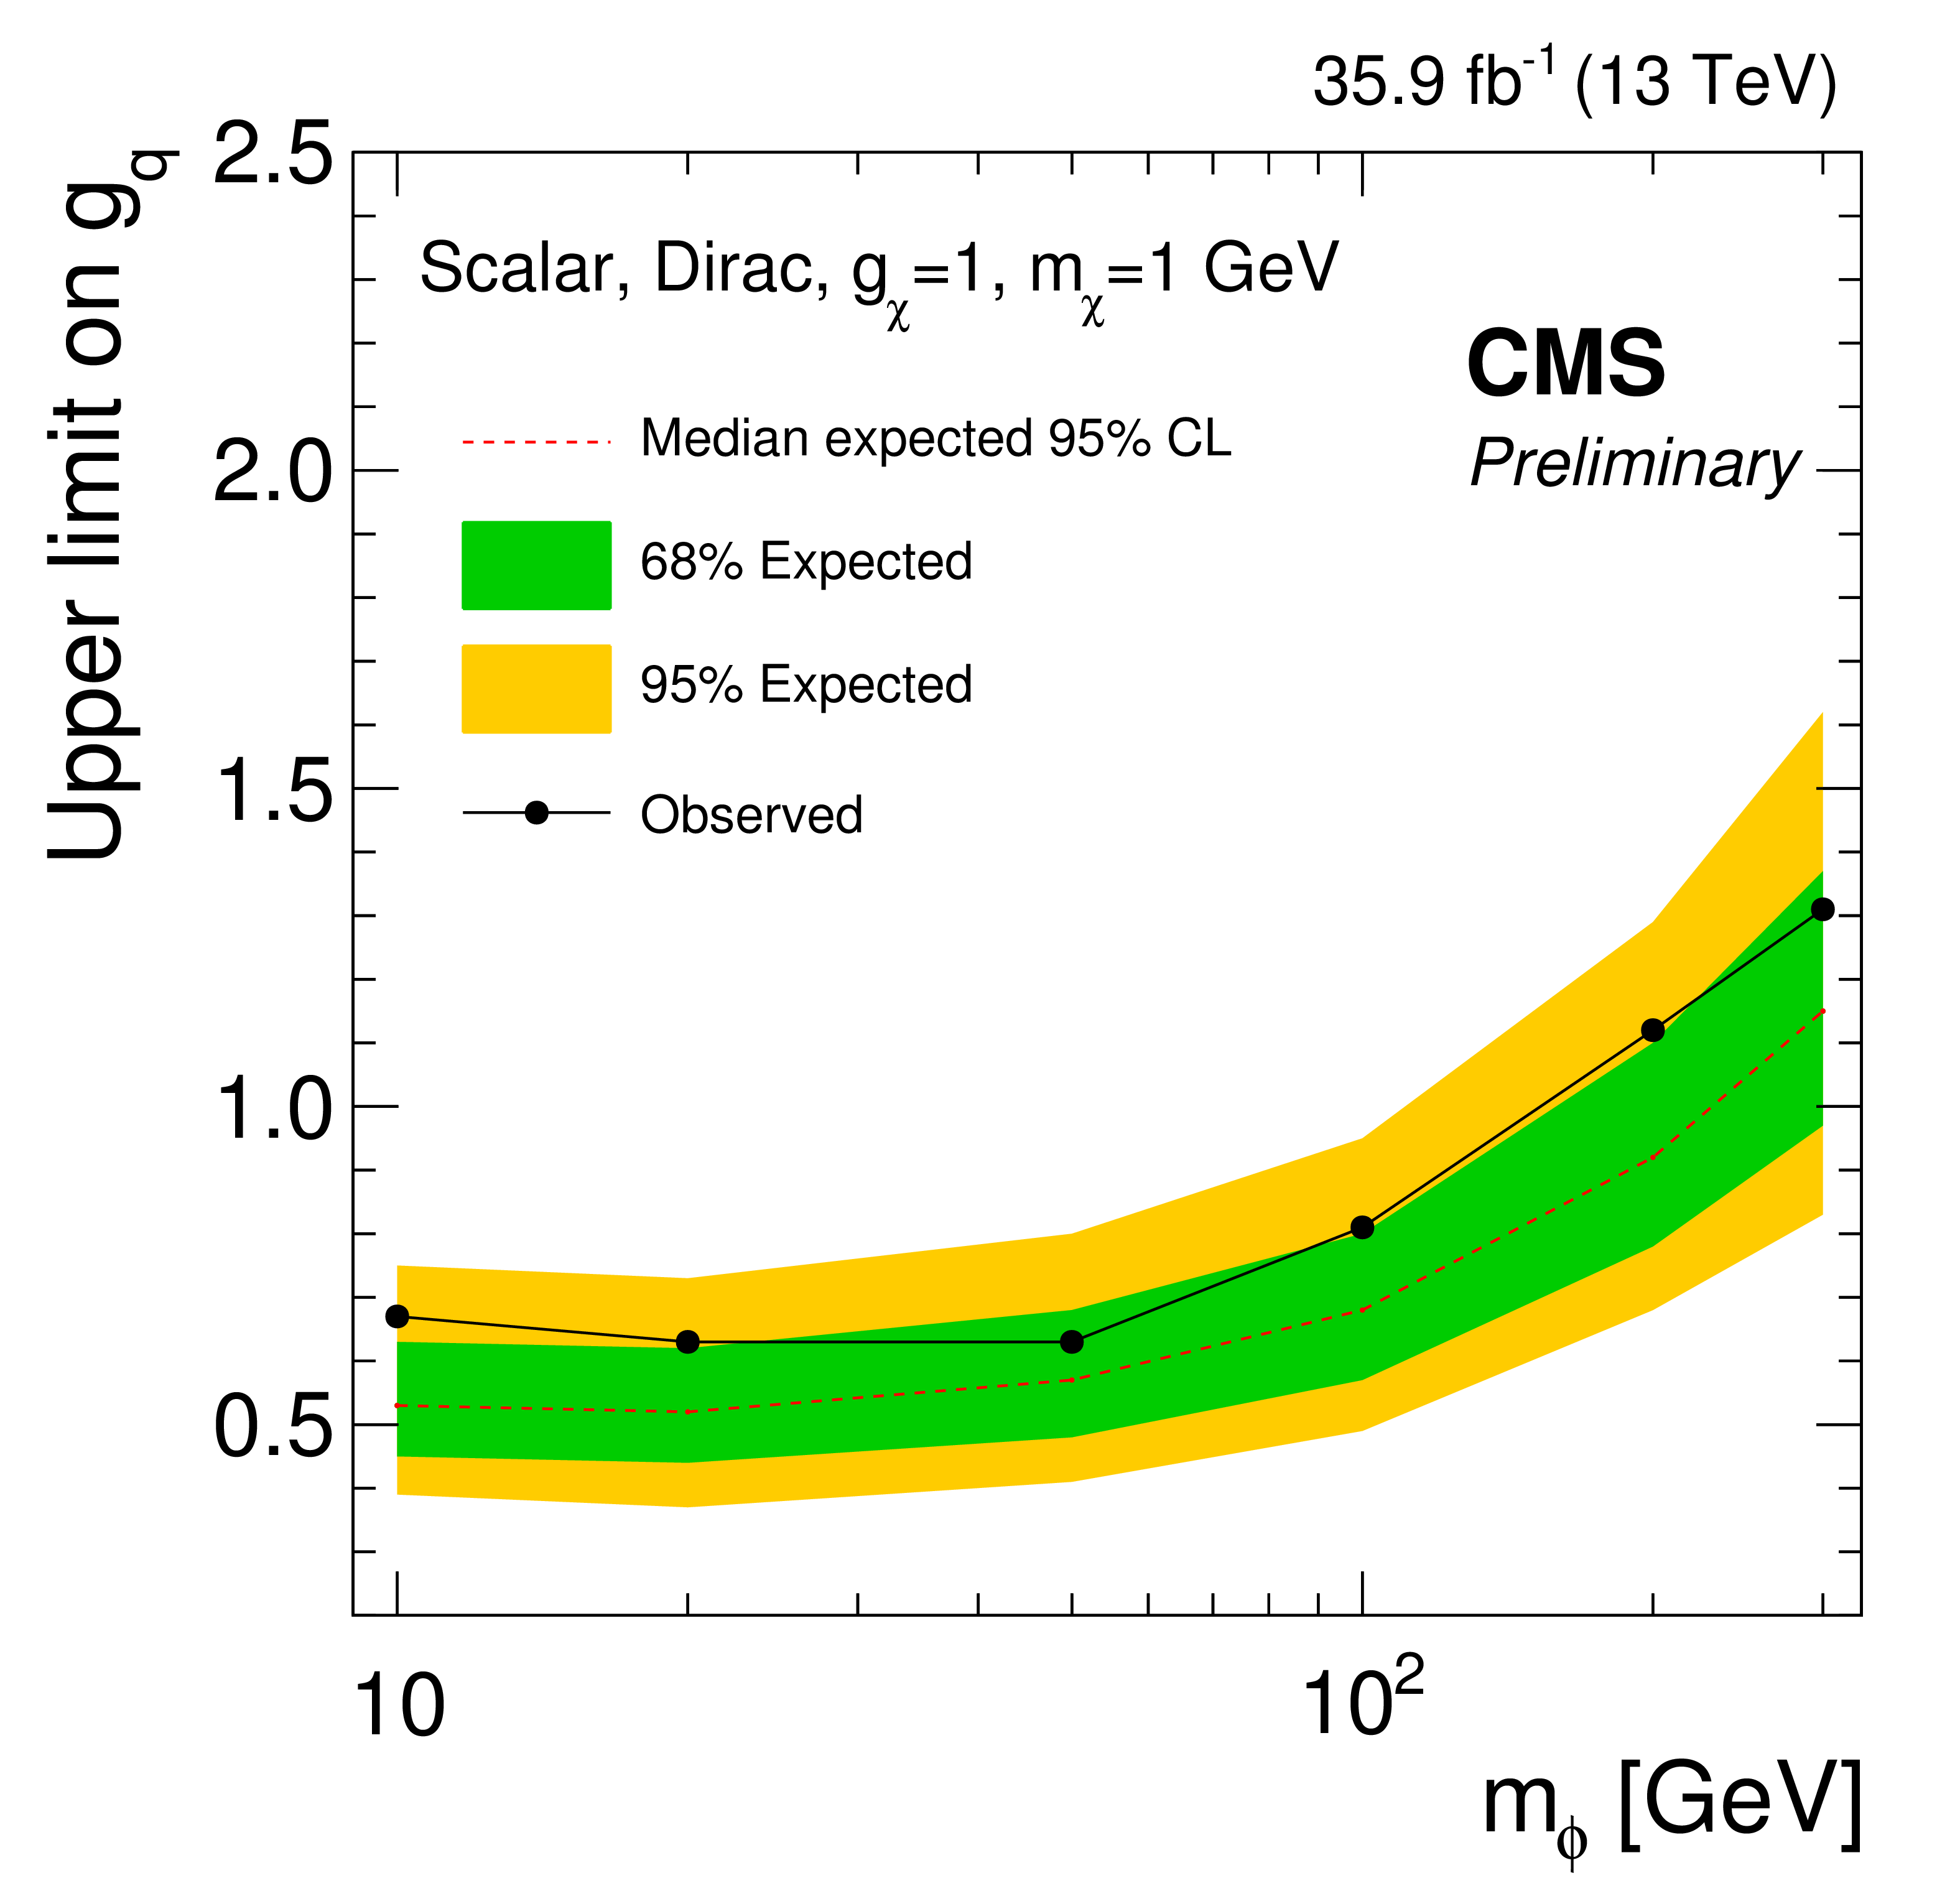
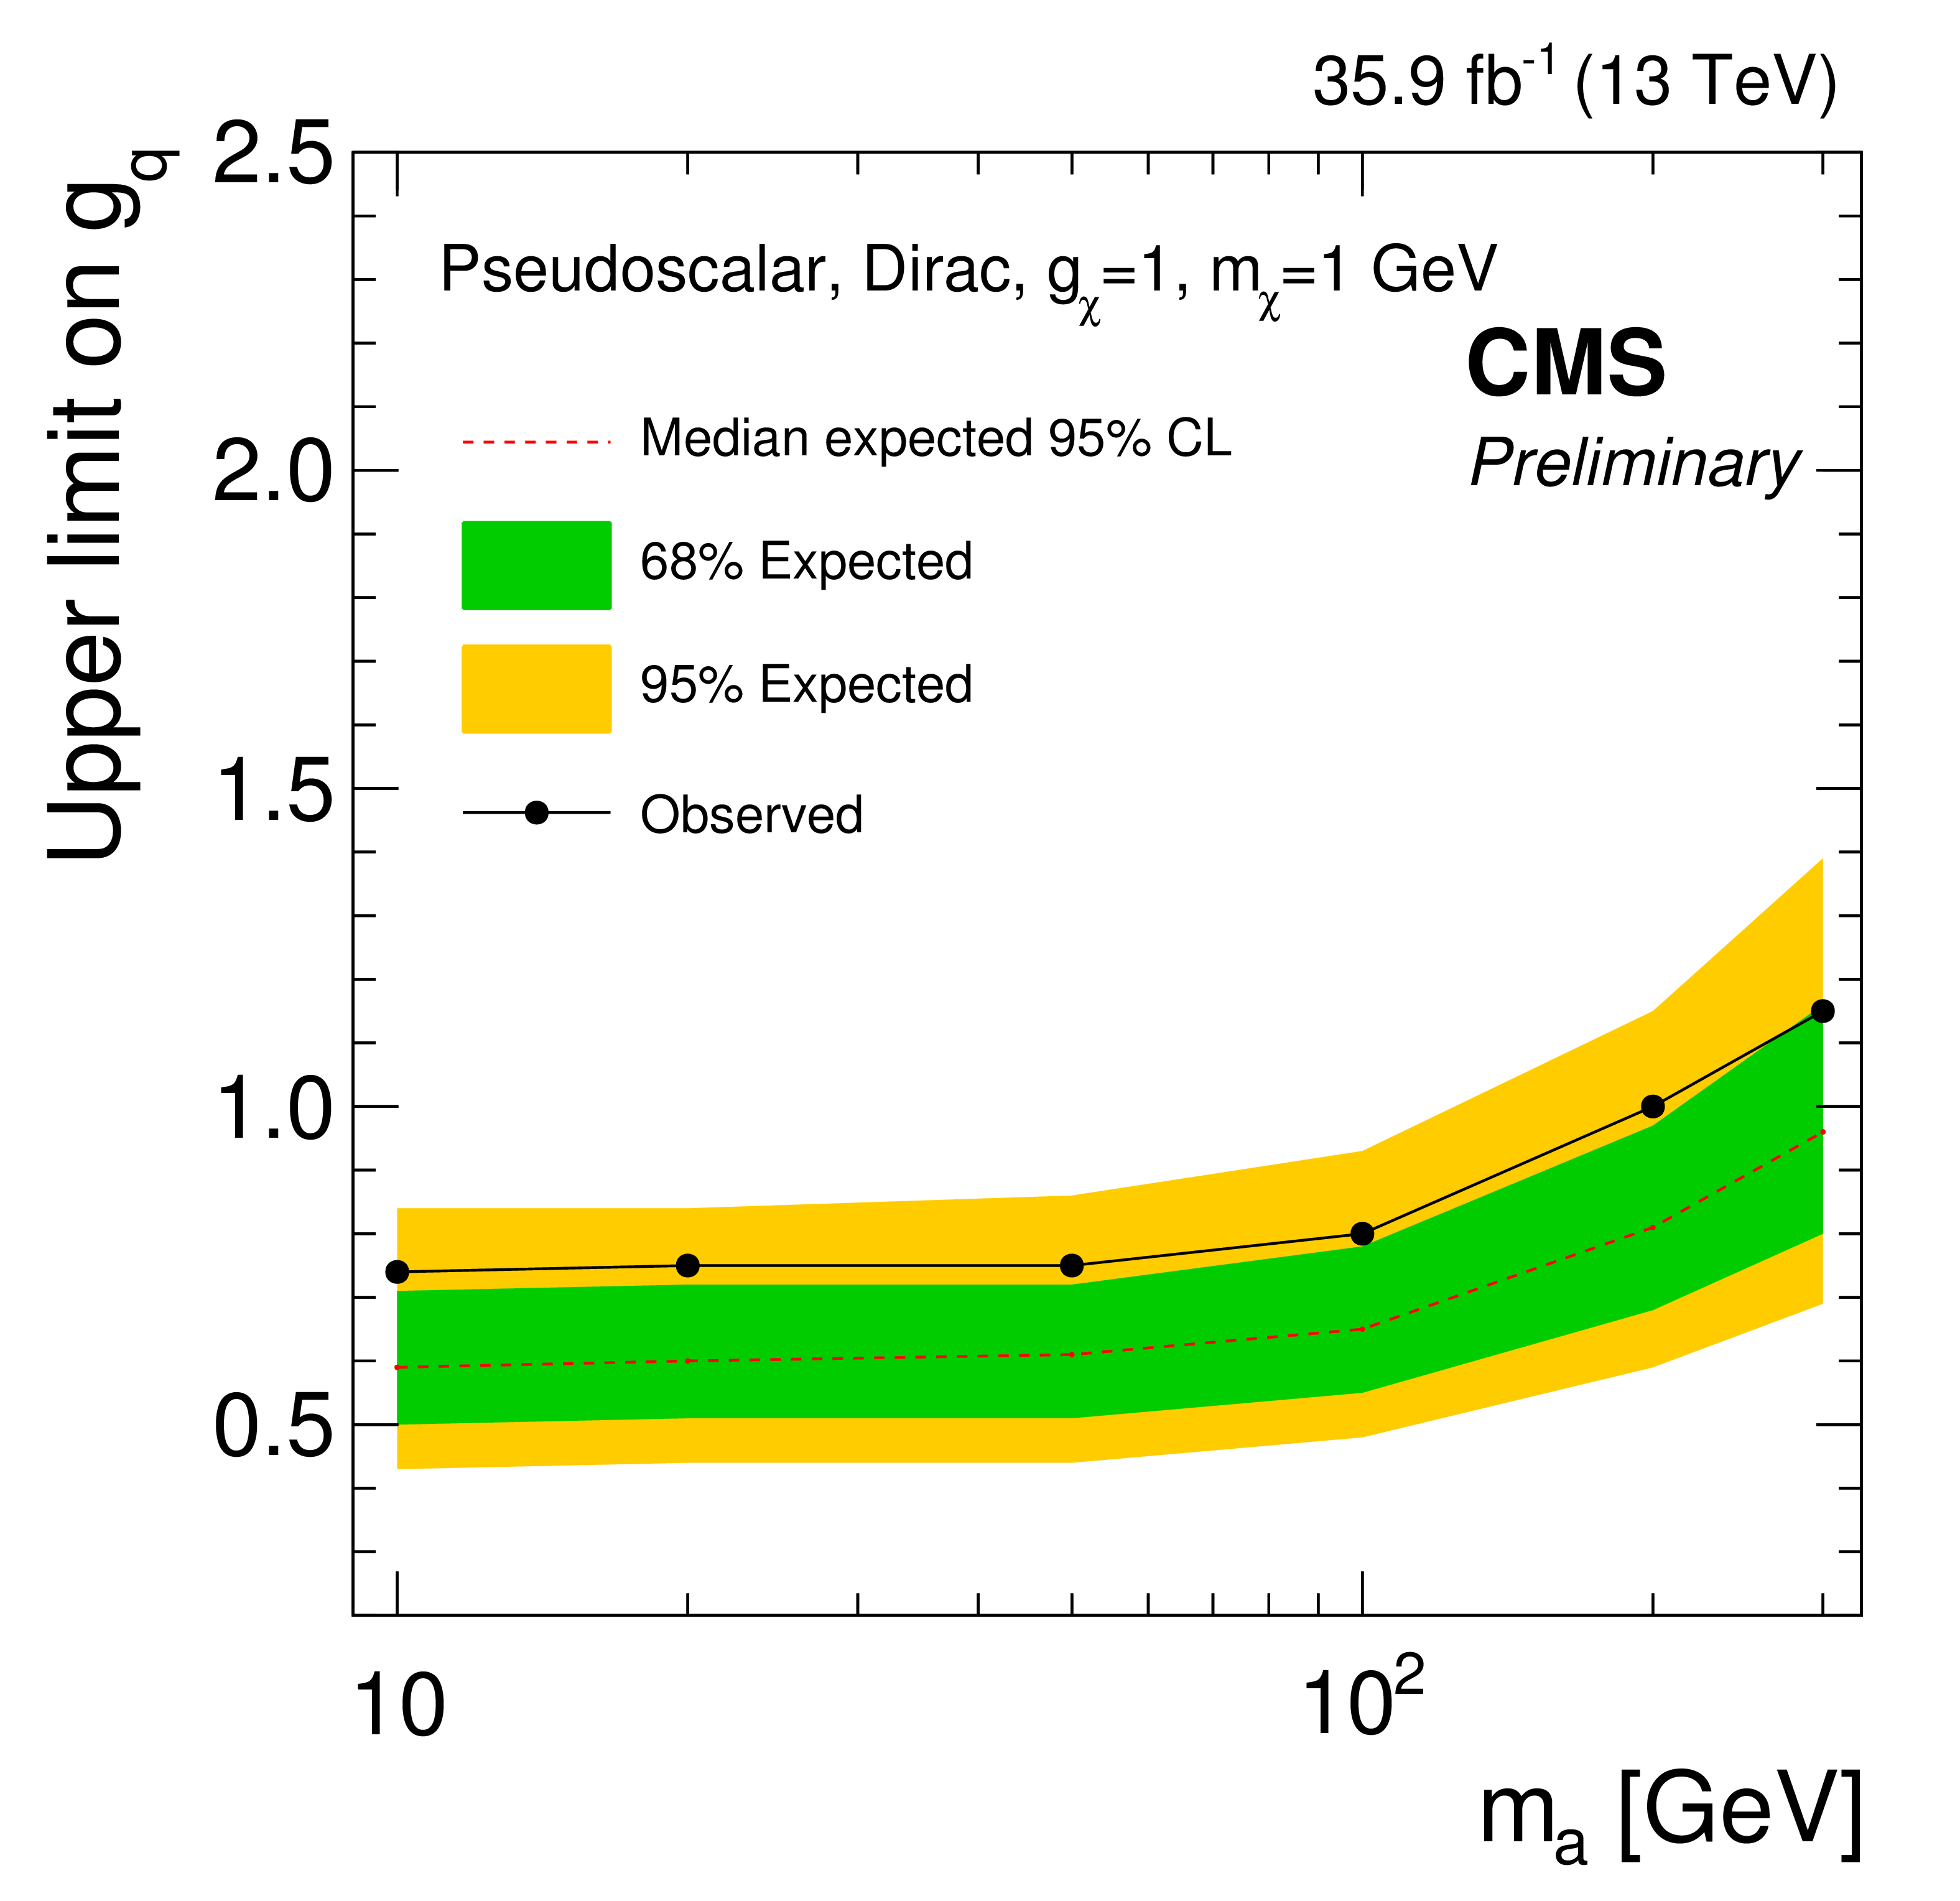
Figure 3:
The 95% CL upper limits on the coupling strength of the mediator to the SM quarks under the assumption that $g_{\chi}= $ 1. A DM particle with mass of 1 GeV is assumed. |
png pdf |
Figure 3-a:
The 95% CL upper limits on the coupling strength of the (scalar) mediator to the SM quarks under the assumption that $g_{\chi}= $ 1. A DM particle with mass of 1 GeV is assumed. |
png pdf |
Figure 3-b:
The 95% CL upper limits on the coupling strength of the (pseudoscalar) mediator to the SM quarks under the assumption that $g_{\chi}= $ 1. A DM particle with mass of 1 GeV is assumed. |
| Summary |
| In summary, a comprehensive search for dark matter produced in association with a top quark pair yields no significant excess over the predicted background. The results presented in this article significantly extend the reach of the previous CMS result [15], and provide 30-60% better sensitivity compared to earlier searches targeting the same signature [51,52,53]. |
| Additional Figures | |
png pdf |
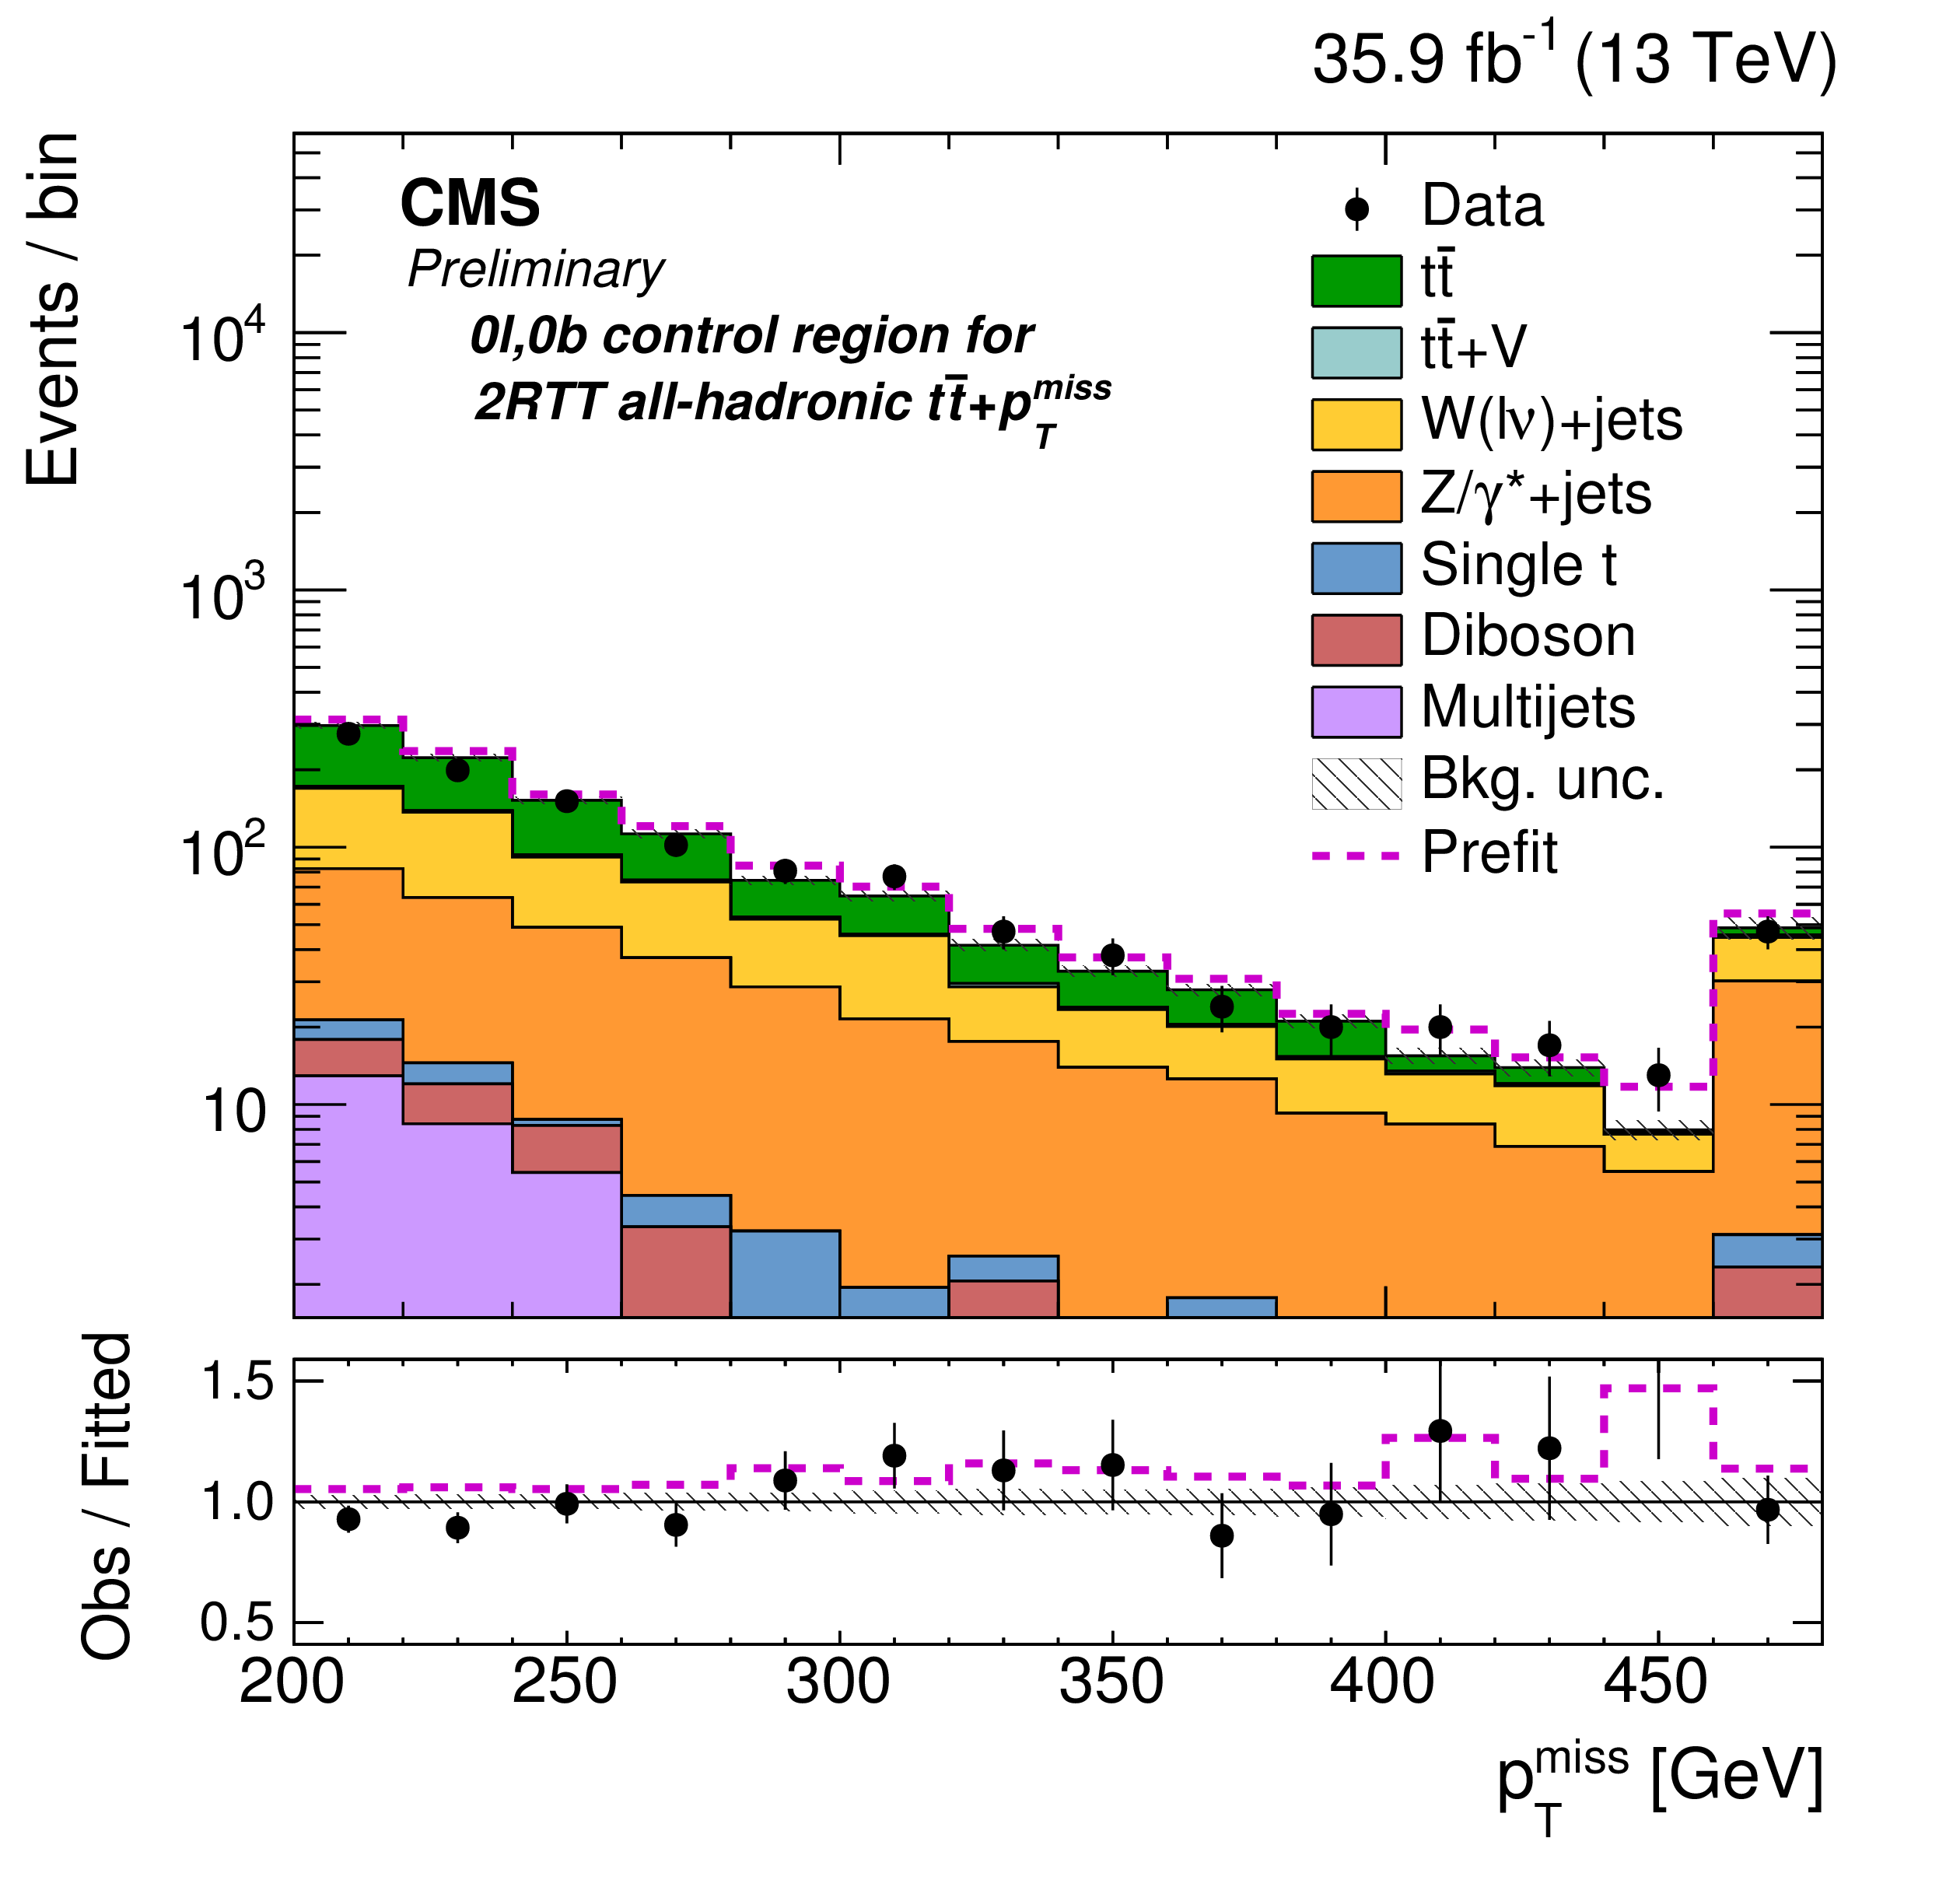
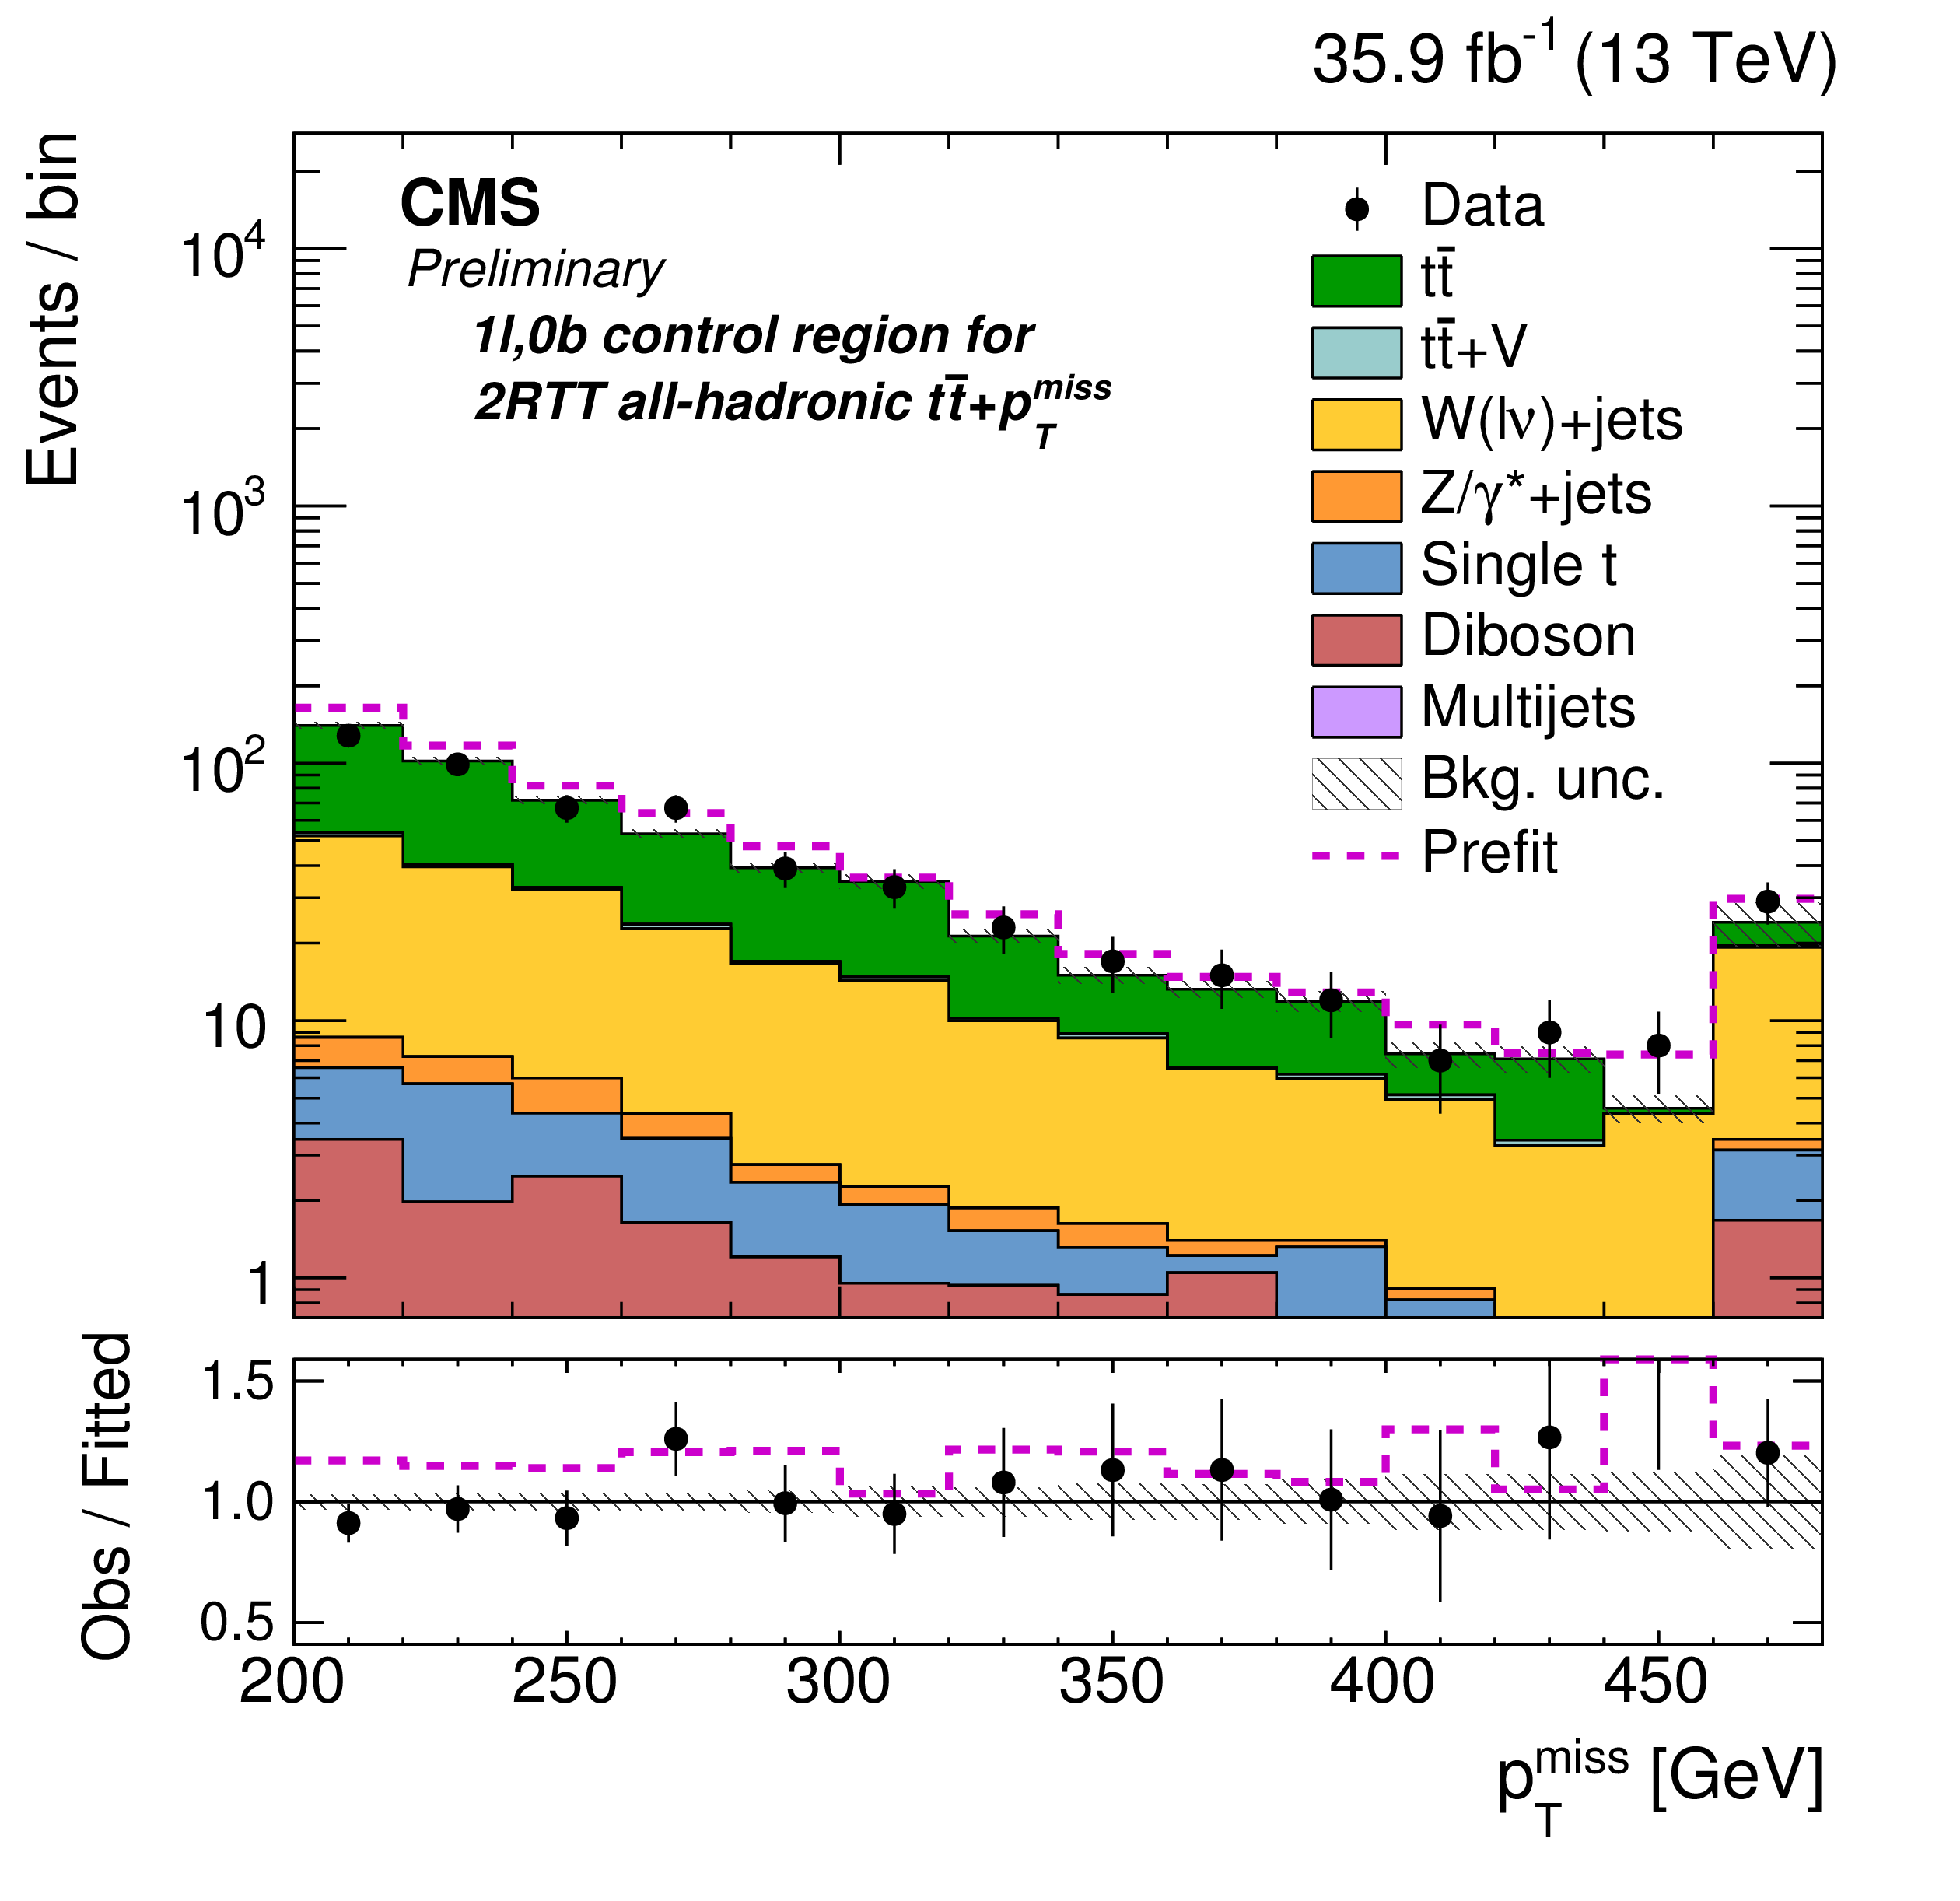
Additional Figure 1:
The $p_{\text {T}}^{\text {miss}}$ distribution for the 0-lepton, 0-b-tag control region in the all-hadronic channel 2RTT category. This control region is enriched in $\text {W} +$jets and $\text {Z}(\nu \bar{\nu}) +$jets. The distributions correspond to the background-only fit, while the magenta histogram is the pre-fit estimate of the overall background. The last bin contains overflow events. The uncertainty band shown in the observed data/fitted background ratio panel are the fit values, while the magenta lines correspond to the ratio of prefit expectations to fitted background. |
png pdf |
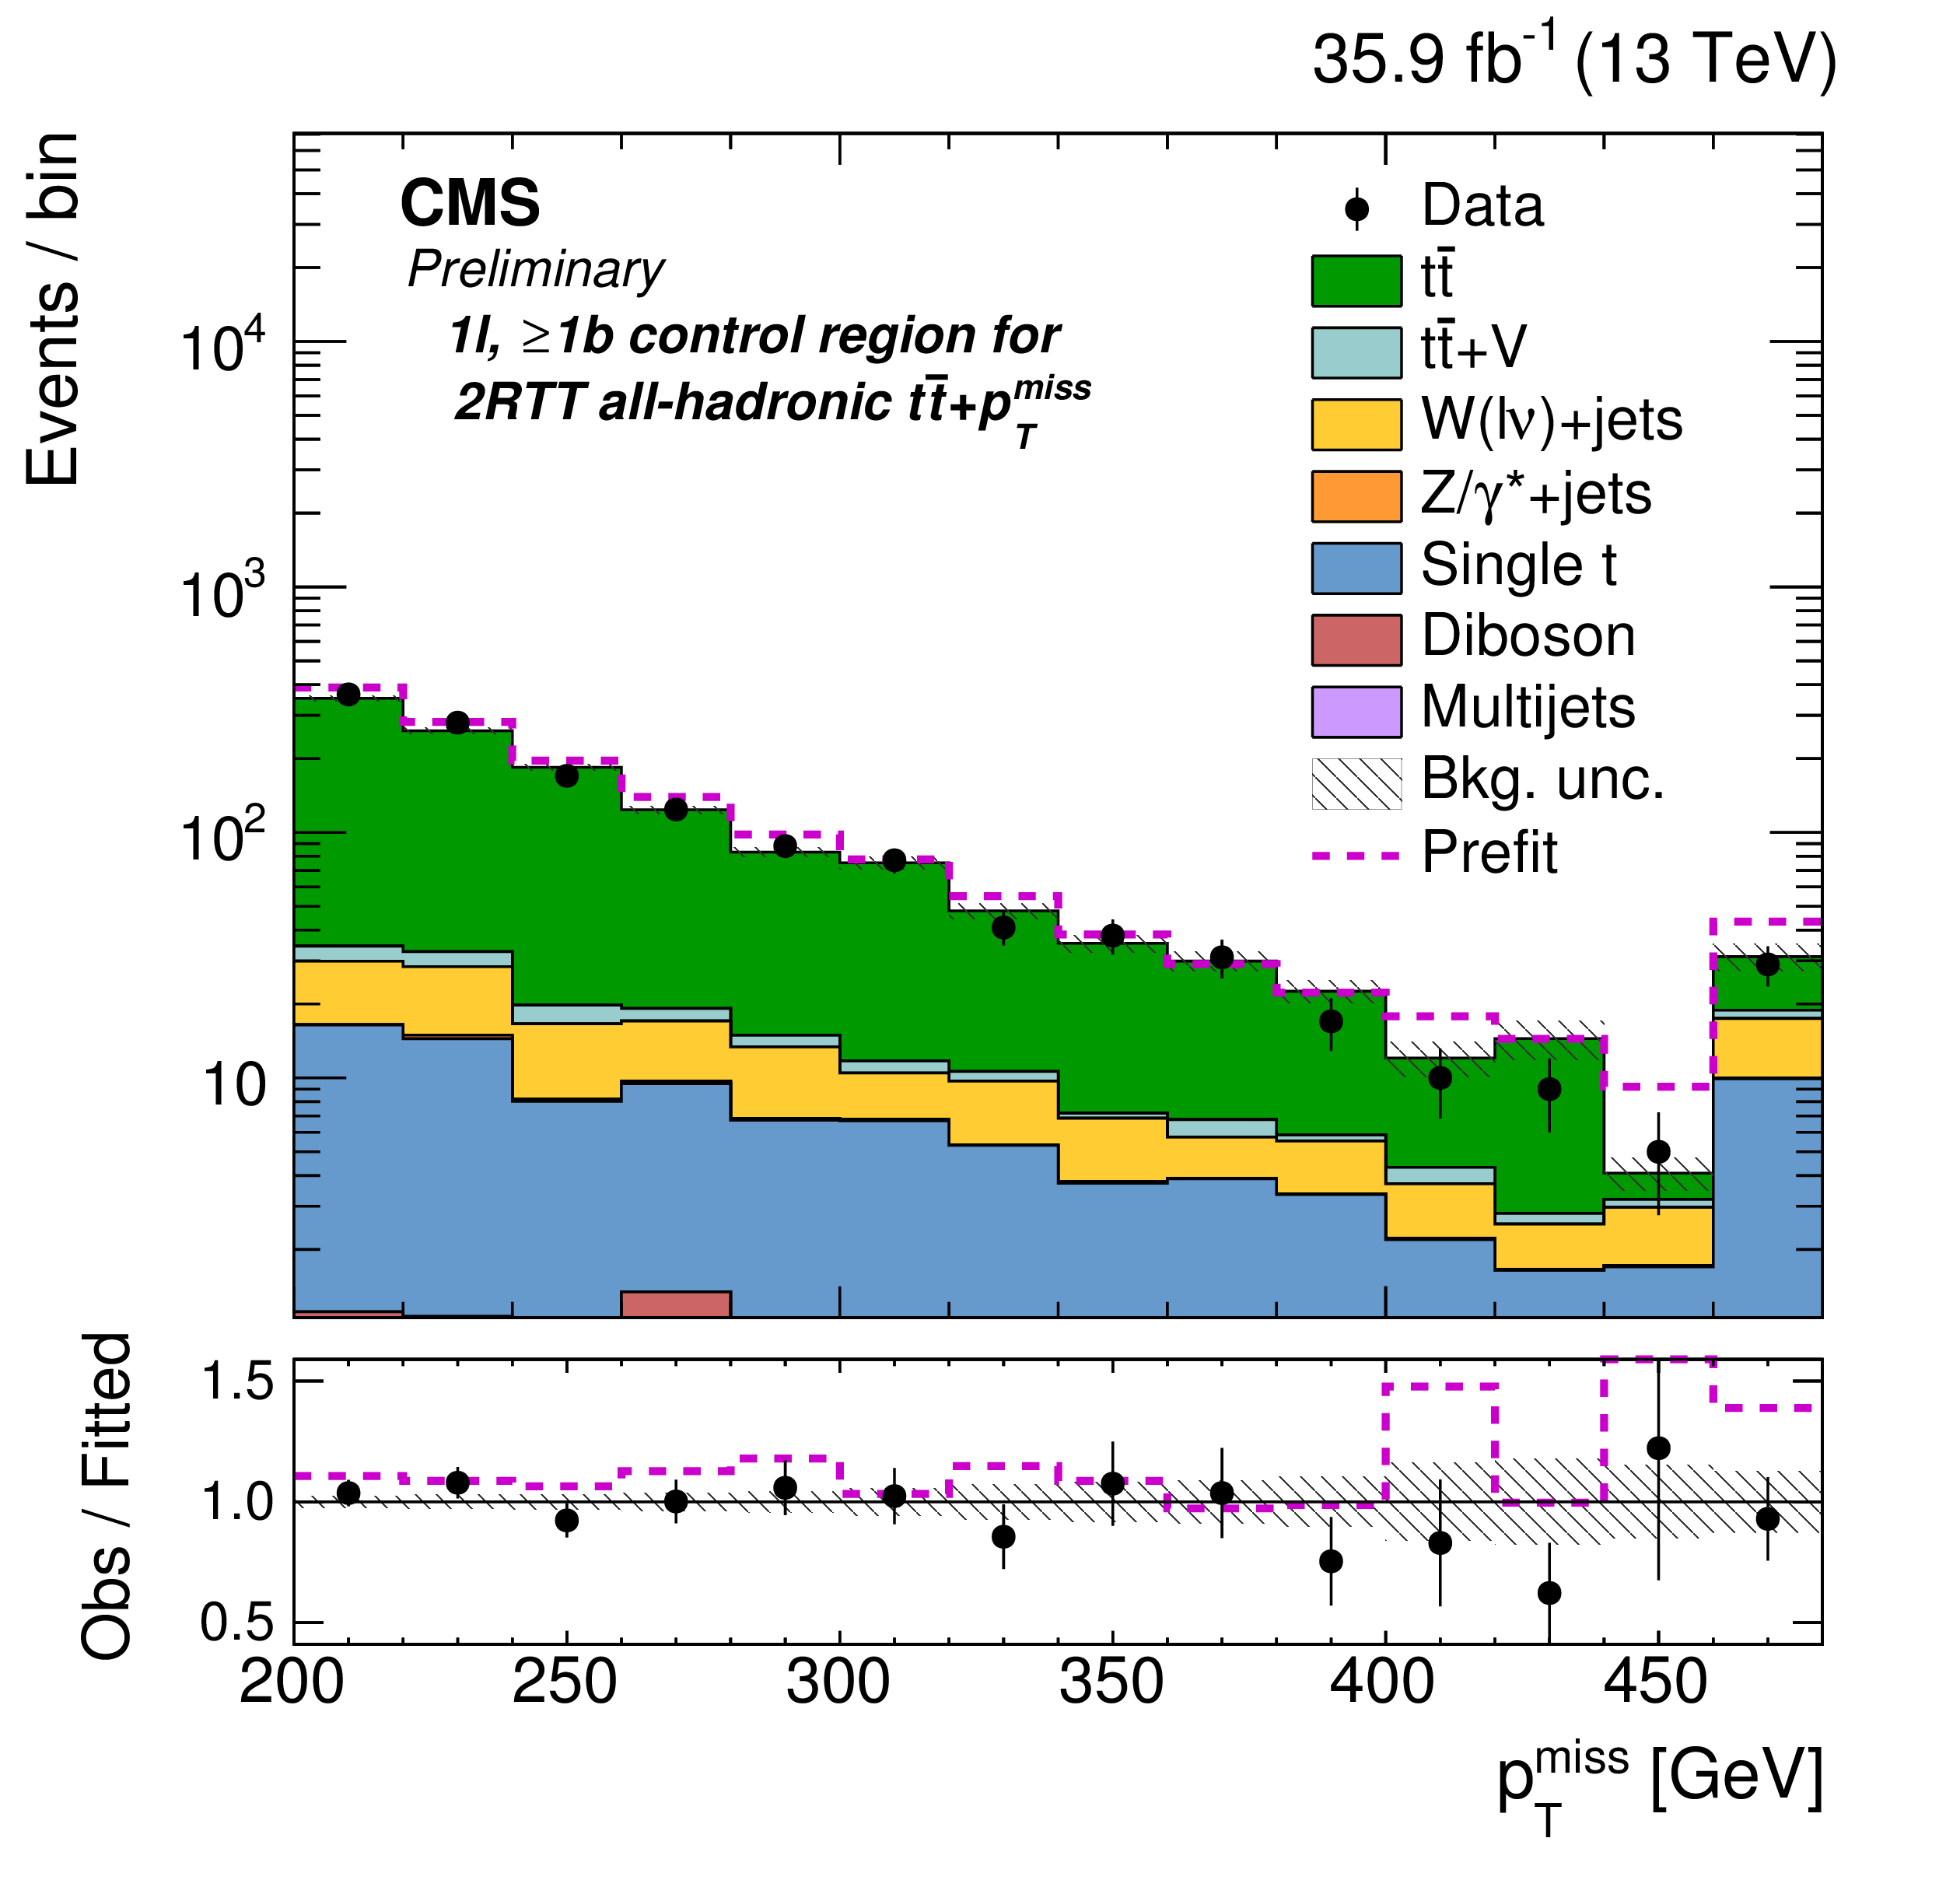
Additional Figure 2:
The $p_{\text {T}}^{\text {miss}}$ distribution for the 1-lepton, $\geq $1-b-tag control region in the all-hadronic channel 2RTT category. This control region is enriched in $\ell +$jets $\mathrm{t\bar{t}}$. The distributions correspond to the background-only fit, while the magenta histogram is the pre-fit estimate of the overall background. The last bin contains overflow events. The uncertainty band shown in the observed data/fitted background ratio panel are the fit values, while the magenta lines correspond to the ratio of prefit expectations to fitted background. |
png pdf |
Additional Figure 3:
The $p_{\text {T}}^{\text {miss}}$ distribution for the 1-lepton, 0-b-tag control region in the all-hadronic channel 2RTT category. This control region is enriched in $\text {W} +$jets. The distributions correspond to the background-only fit, while the magenta histogram is the pre-fit estimate of the overall background. The last bin contains overflow events. The uncertainty band shown in the observed data/fitted background ratio panel are the fit values, while the magenta lines correspond to the ratio of prefit expectations to fitted background. |

png pdf |
Additional Figure 4:
The $p_{\text {T}}^{\text {miss}}$ distribution for the signal region in the all-hadronic channel 01RTT category. The background distributions correspond to the background-only fit, while the magenta histogram is the pre-fit estimate of the overall background. The prefit $p_{\text {T}}^{\text {miss}}$ distribution of pseudoscalar $m_a = $ 100 GeV is overlayed. The last bin contains overflow events. The uncertainty band shown in the observed data/fitted background ratio panel are the fit values, while the magenta lines correspond to the ratio of prefit expectations to fitted background. |
png pdf |
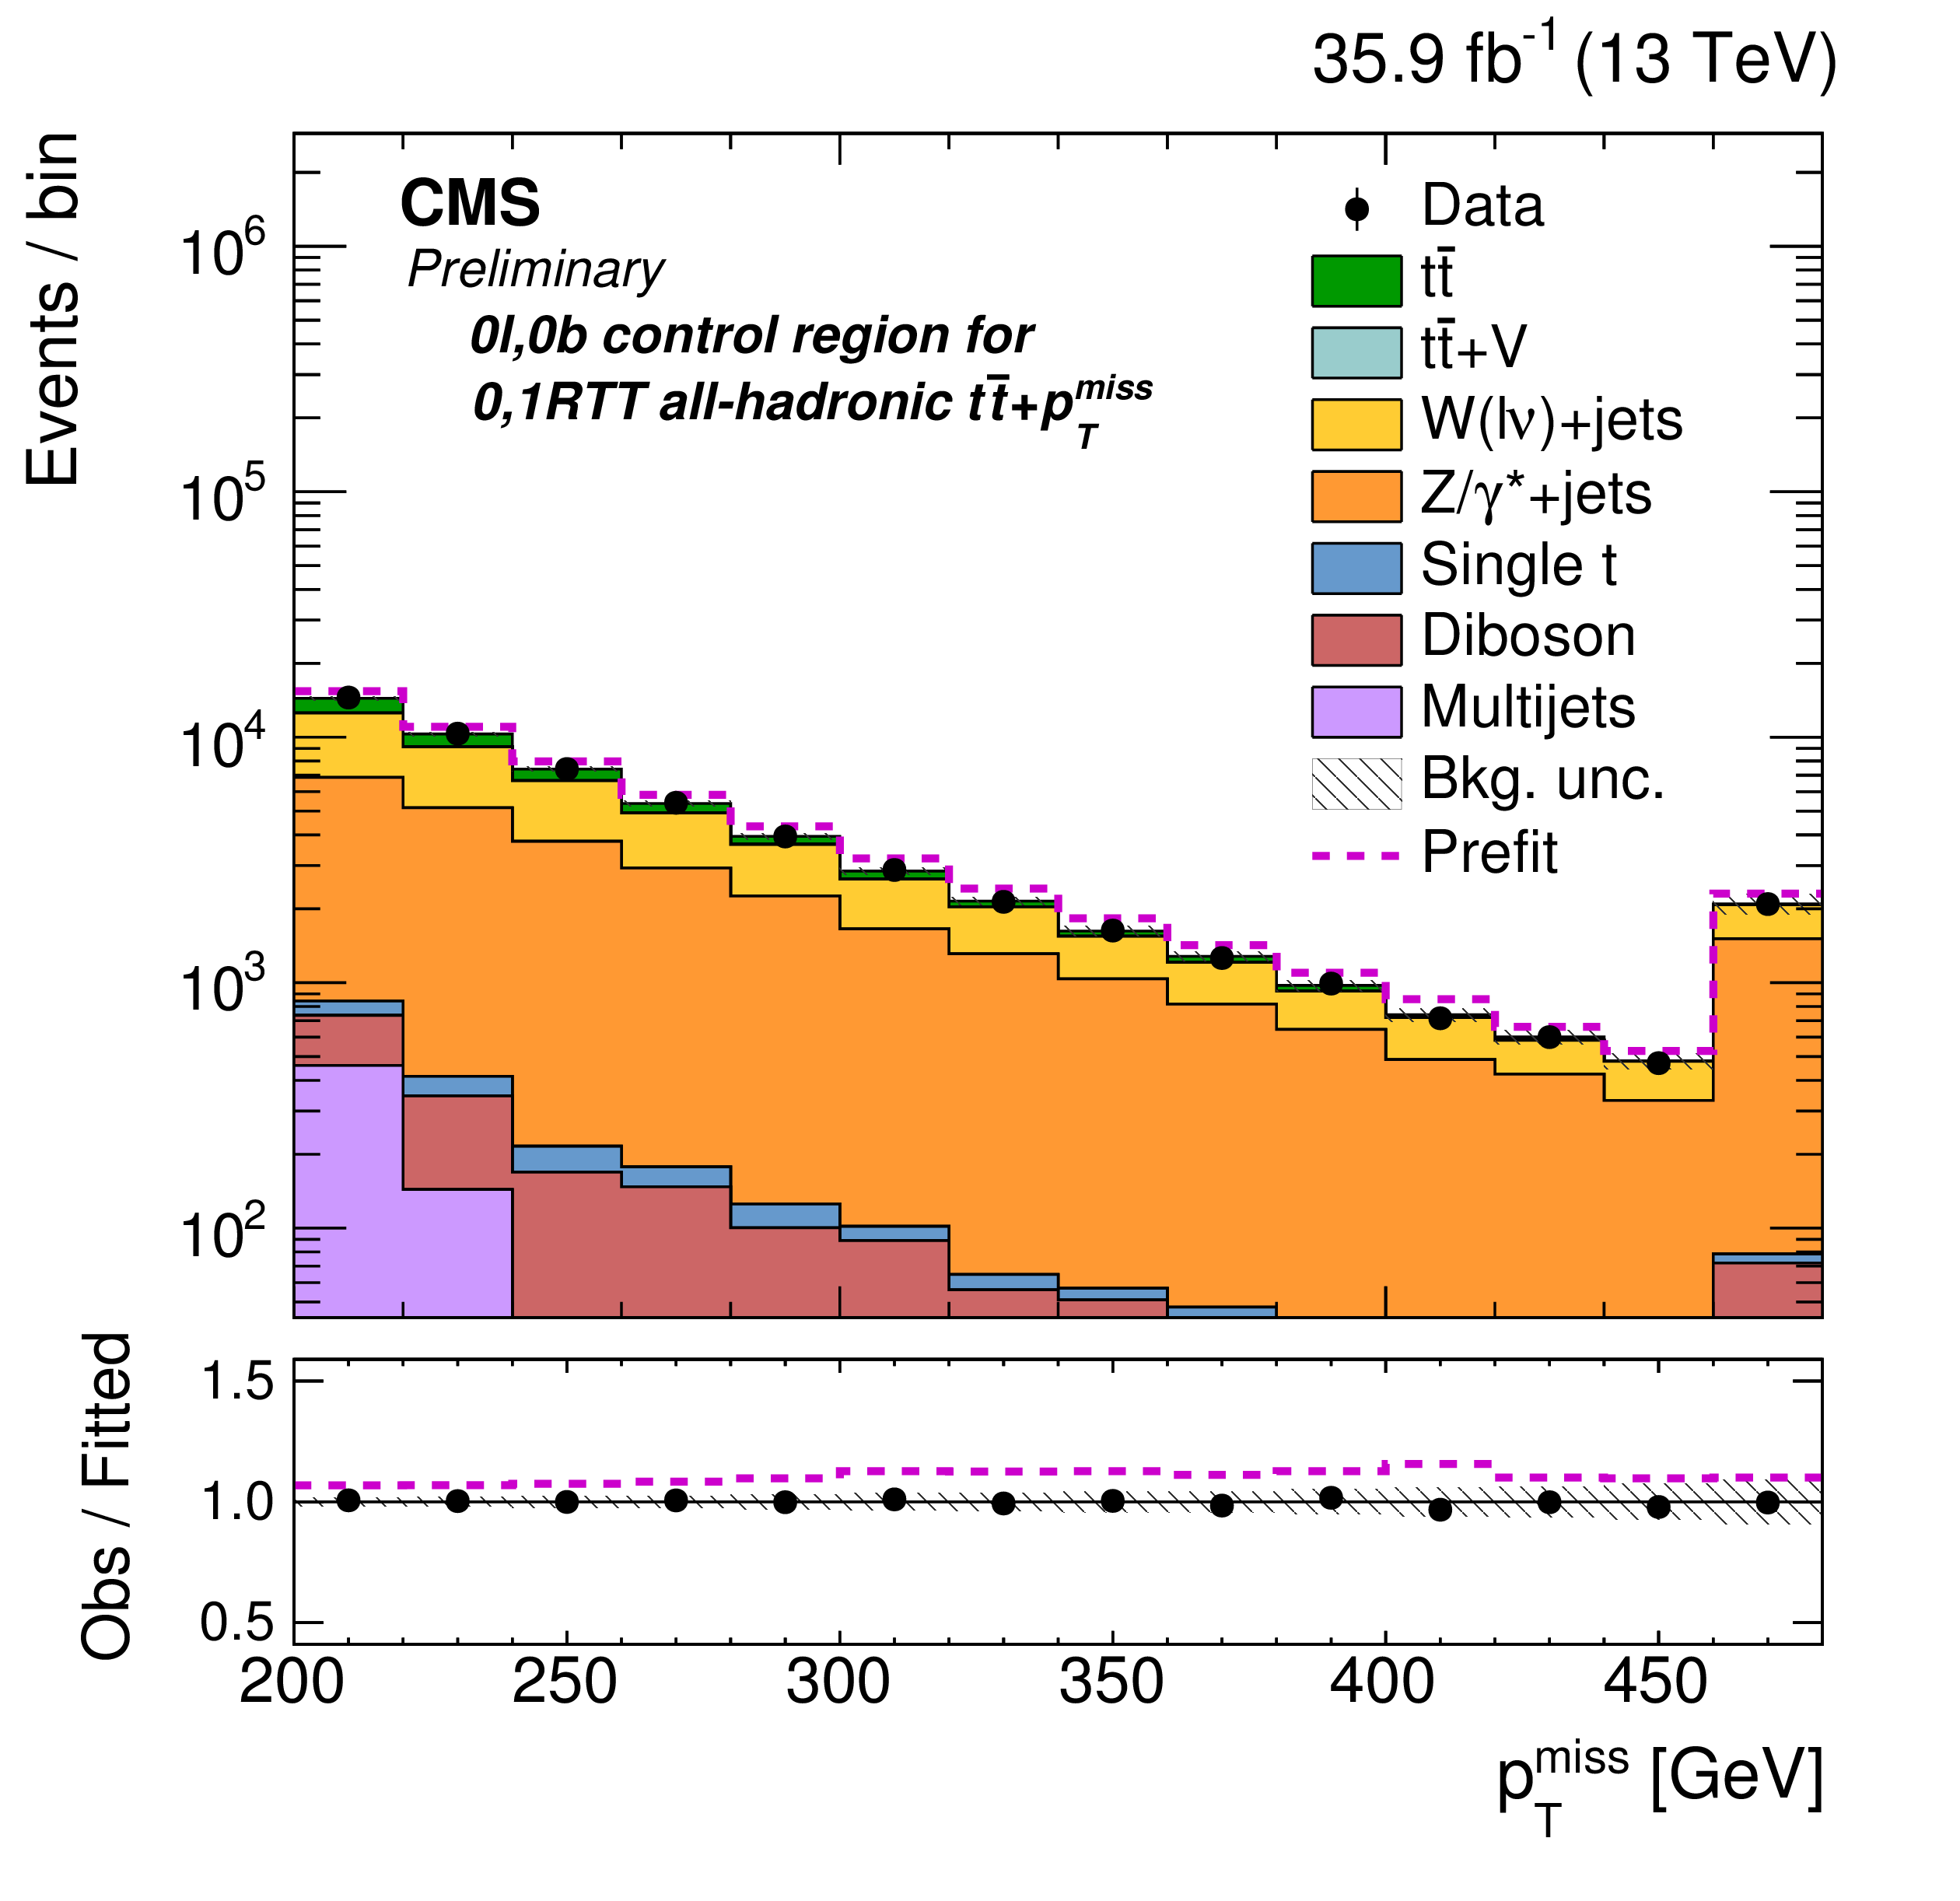
Additional Figure 5:
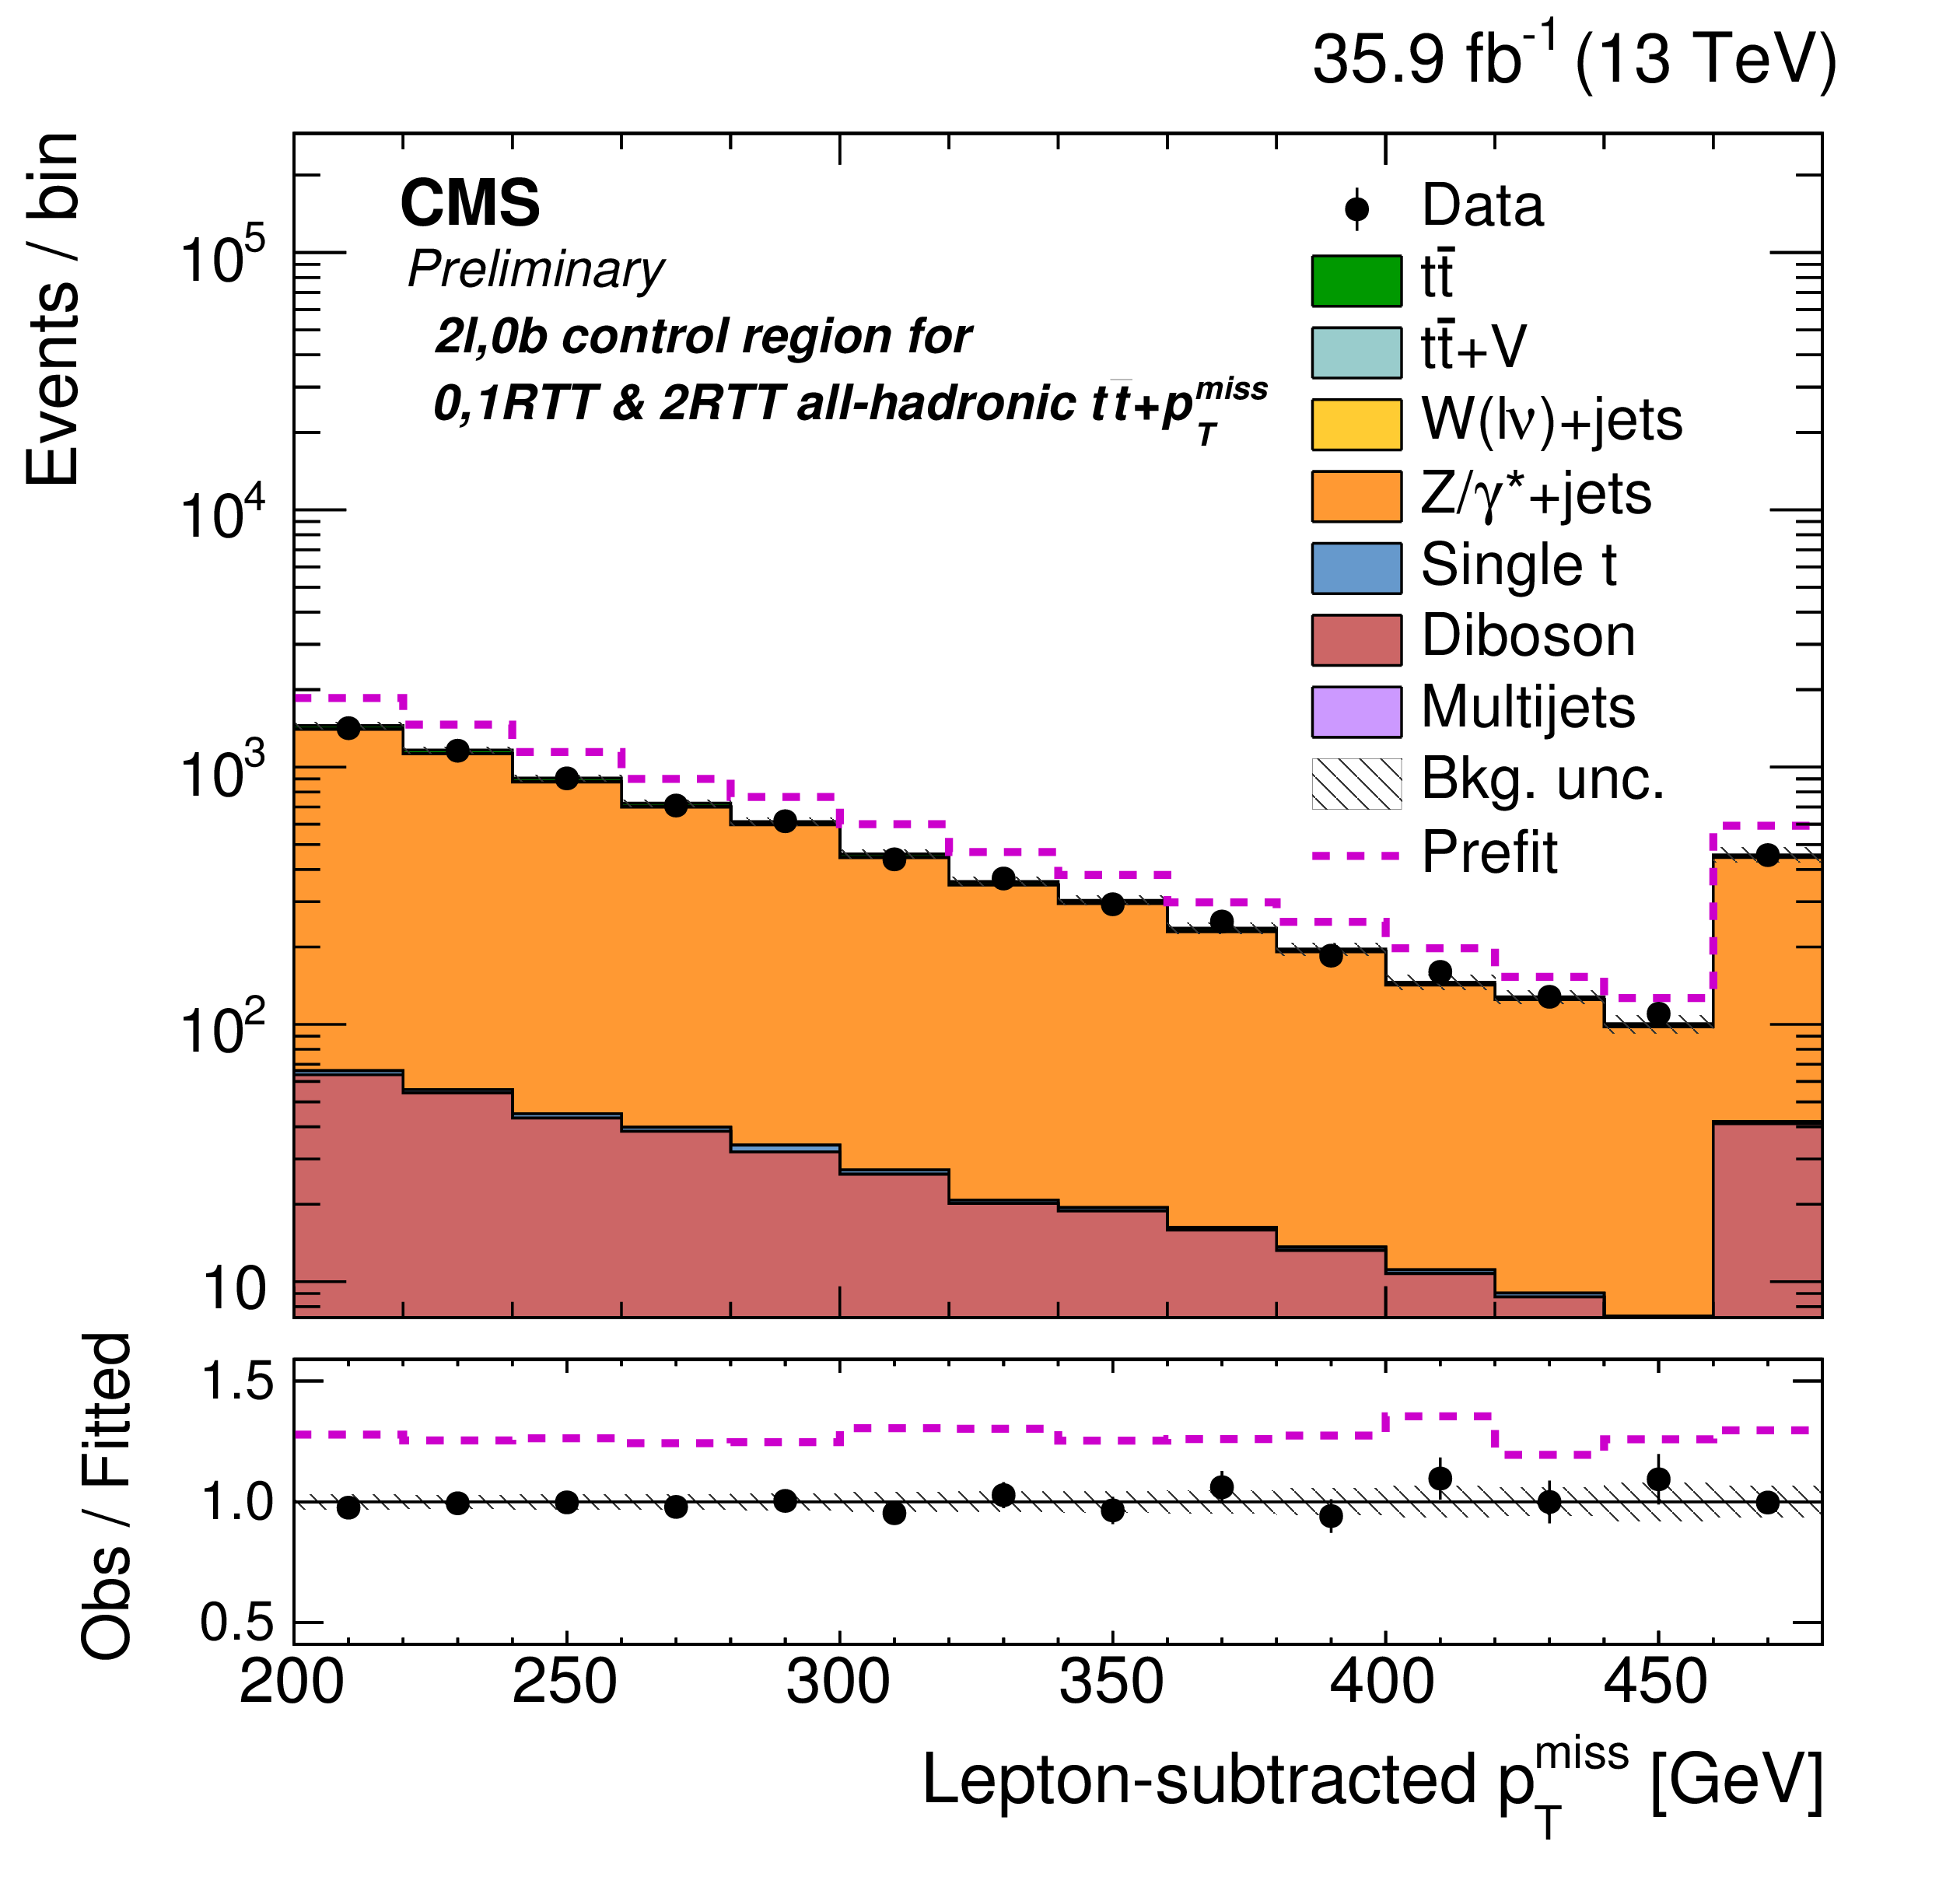
The $p_{\text {T}}^{\text {miss}}$ distribution for the 0-lepton, 0-b-tag control region in the all-hadronic channel 01RTT category. This control region is enriched in $\text {W} +$jets and $\text {Z}(\nu \bar{\nu}) +$jets. The distributions correspond to the background-only fit, while the magenta histogram is the pre-fit estimate of the overall background. The last bin contains overflow events. The uncertainty band shown in the observed data/fitted background ratio panel are the fit values, while the magenta lines correspond to the ratio of prefit expectations to fitted background. |
png pdf |
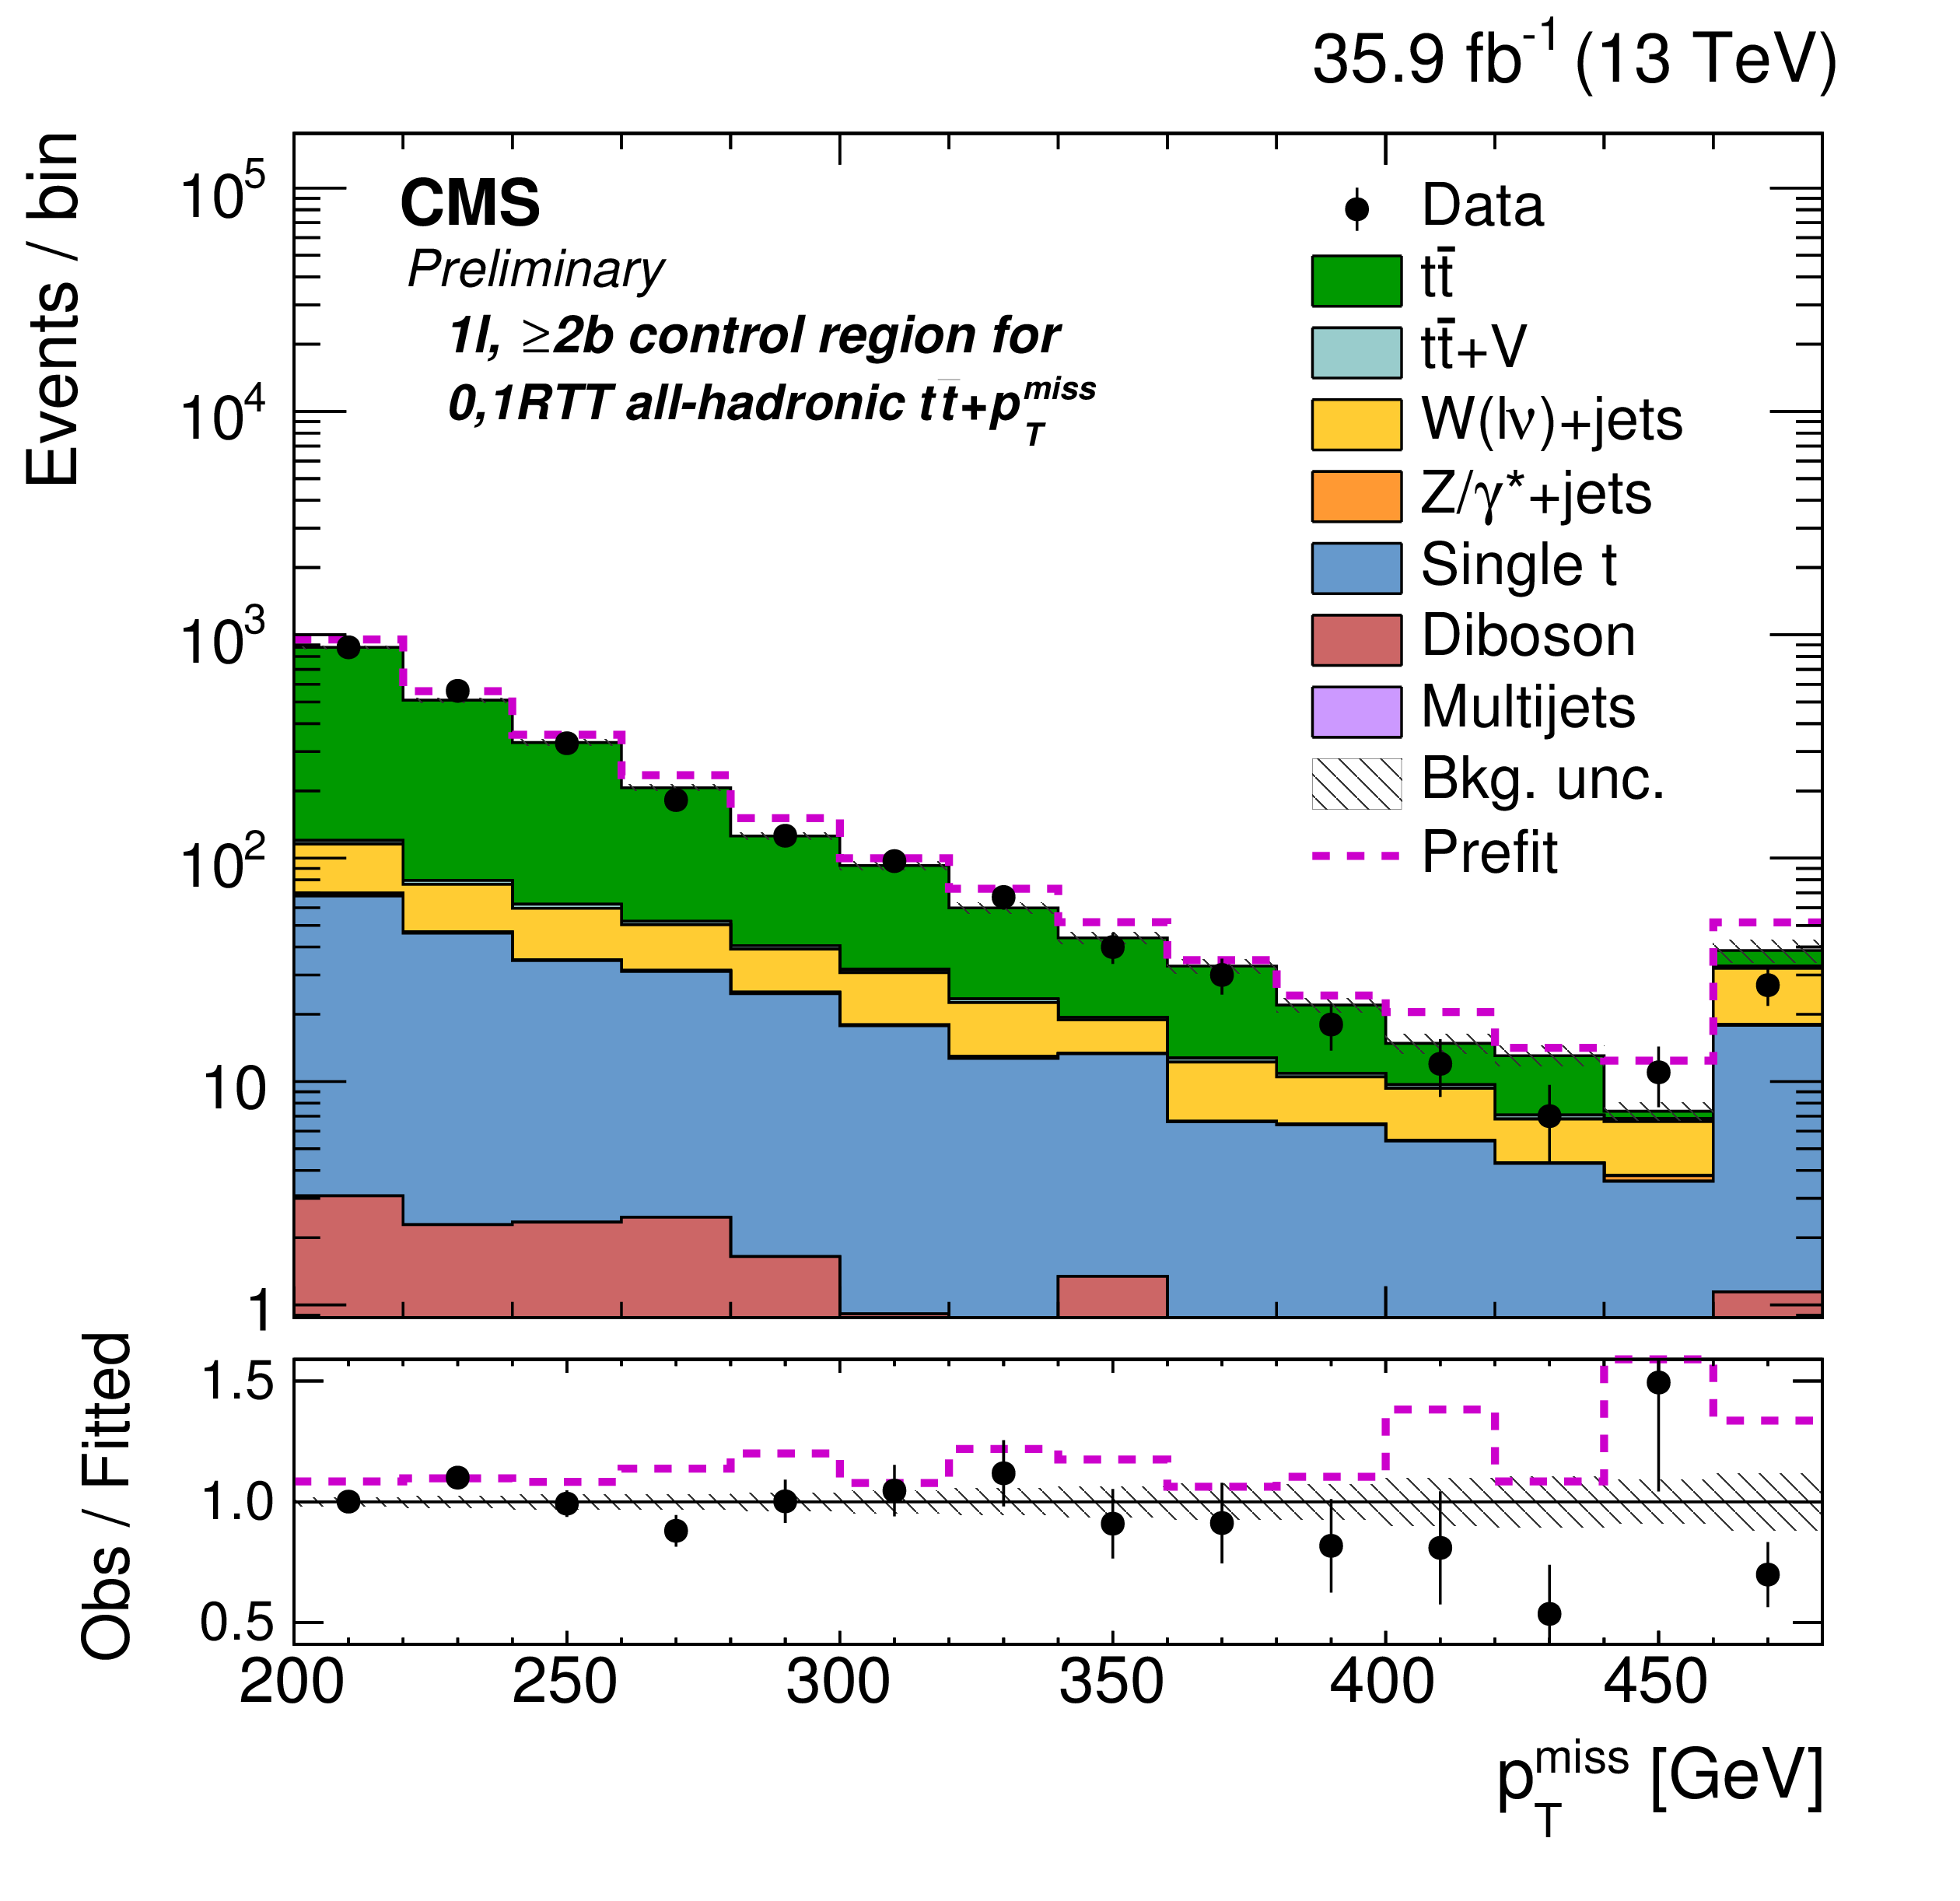
Additional Figure 6:
The $p_{\text {T}}^{\text {miss}}$ distribution for the 1-lepton, $\geq $2-b-tag control region in the all-hadronic channel 01RTT category. This control region is enriched in $\ell +$jets $\mathrm{t\bar{t}}$. The distributions correspond to the background-only fit, while the magenta histogram is the pre-fit estimate of the overall background. The last bin contains overflow events. The uncertainty band shown in the observed data/fitted background ratio panel are the fit values, while the magenta lines correspond to the ratio of prefit expectations to fitted background. |
png pdf |
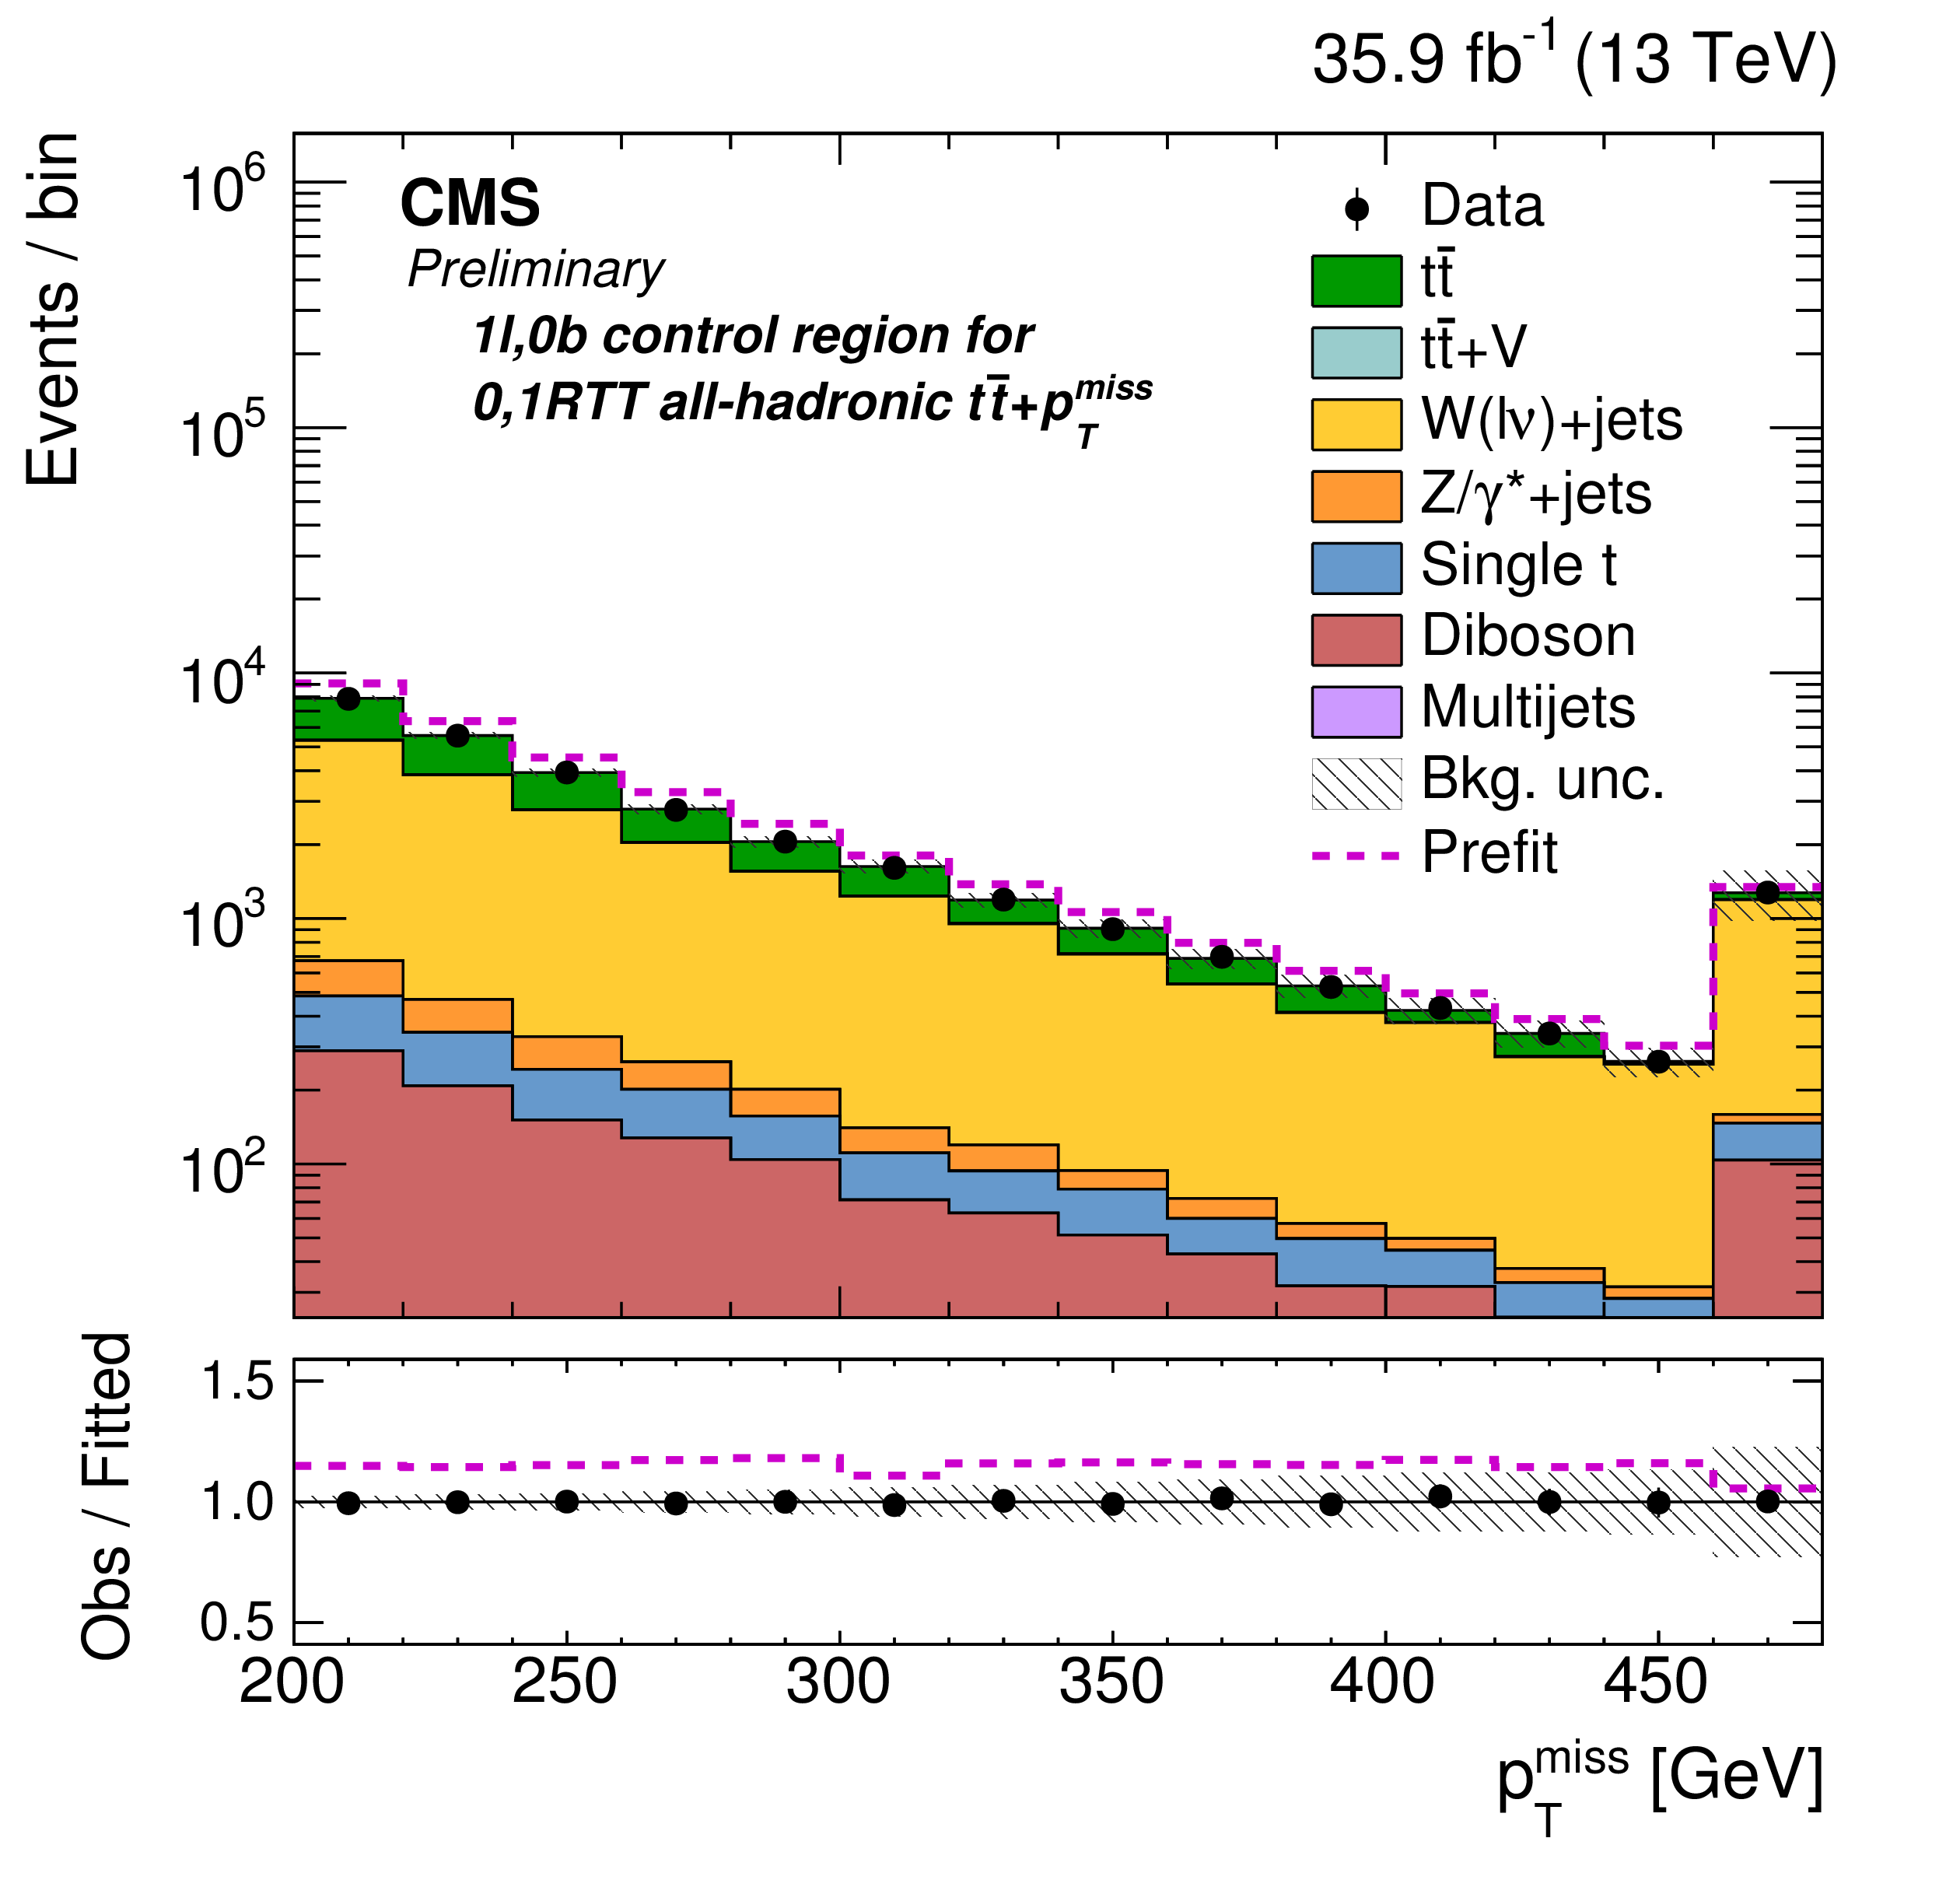
Additional Figure 7:
The $p_{\text {T}}^{\text {miss}}$ distribution for the 1-lepton, 0-b-tag control region in the all-hadronic channel 01RTT category. This control region is enriched in $\text {W} +$jets. The distributions correspond to the background-only fit, while the magenta histogram is the pre-fit estimate of the overall background. The last bin contains overflow events. The uncertainty band shown in the observed data/fitted background ratio panel are the fit values, while the magenta lines correspond to the ratio of prefit expectations to fitted background. |
png pdf |
Additional Figure 8:
Hadronic recoil distribution for the 2-lepton, 0-b-tag control region in the all-hadronic channel. This control region uses $\text {Z}(\ell \ell) +$jets to constrain the estimate of $\text {Z}(\nu \bar{\nu}) +$jets in the signal region. The distributions correspond to the background-only fit, while the magenta histogram is the pre-fit estimate of the overall background. The last bin contains overflow events. The uncertainty band shown in the observed data/fitted background ratio panel are the fit values, while the magenta lines correspond to the ratio of prefit expectations to fitted background. |
png pdf |
Additional Figure 9:
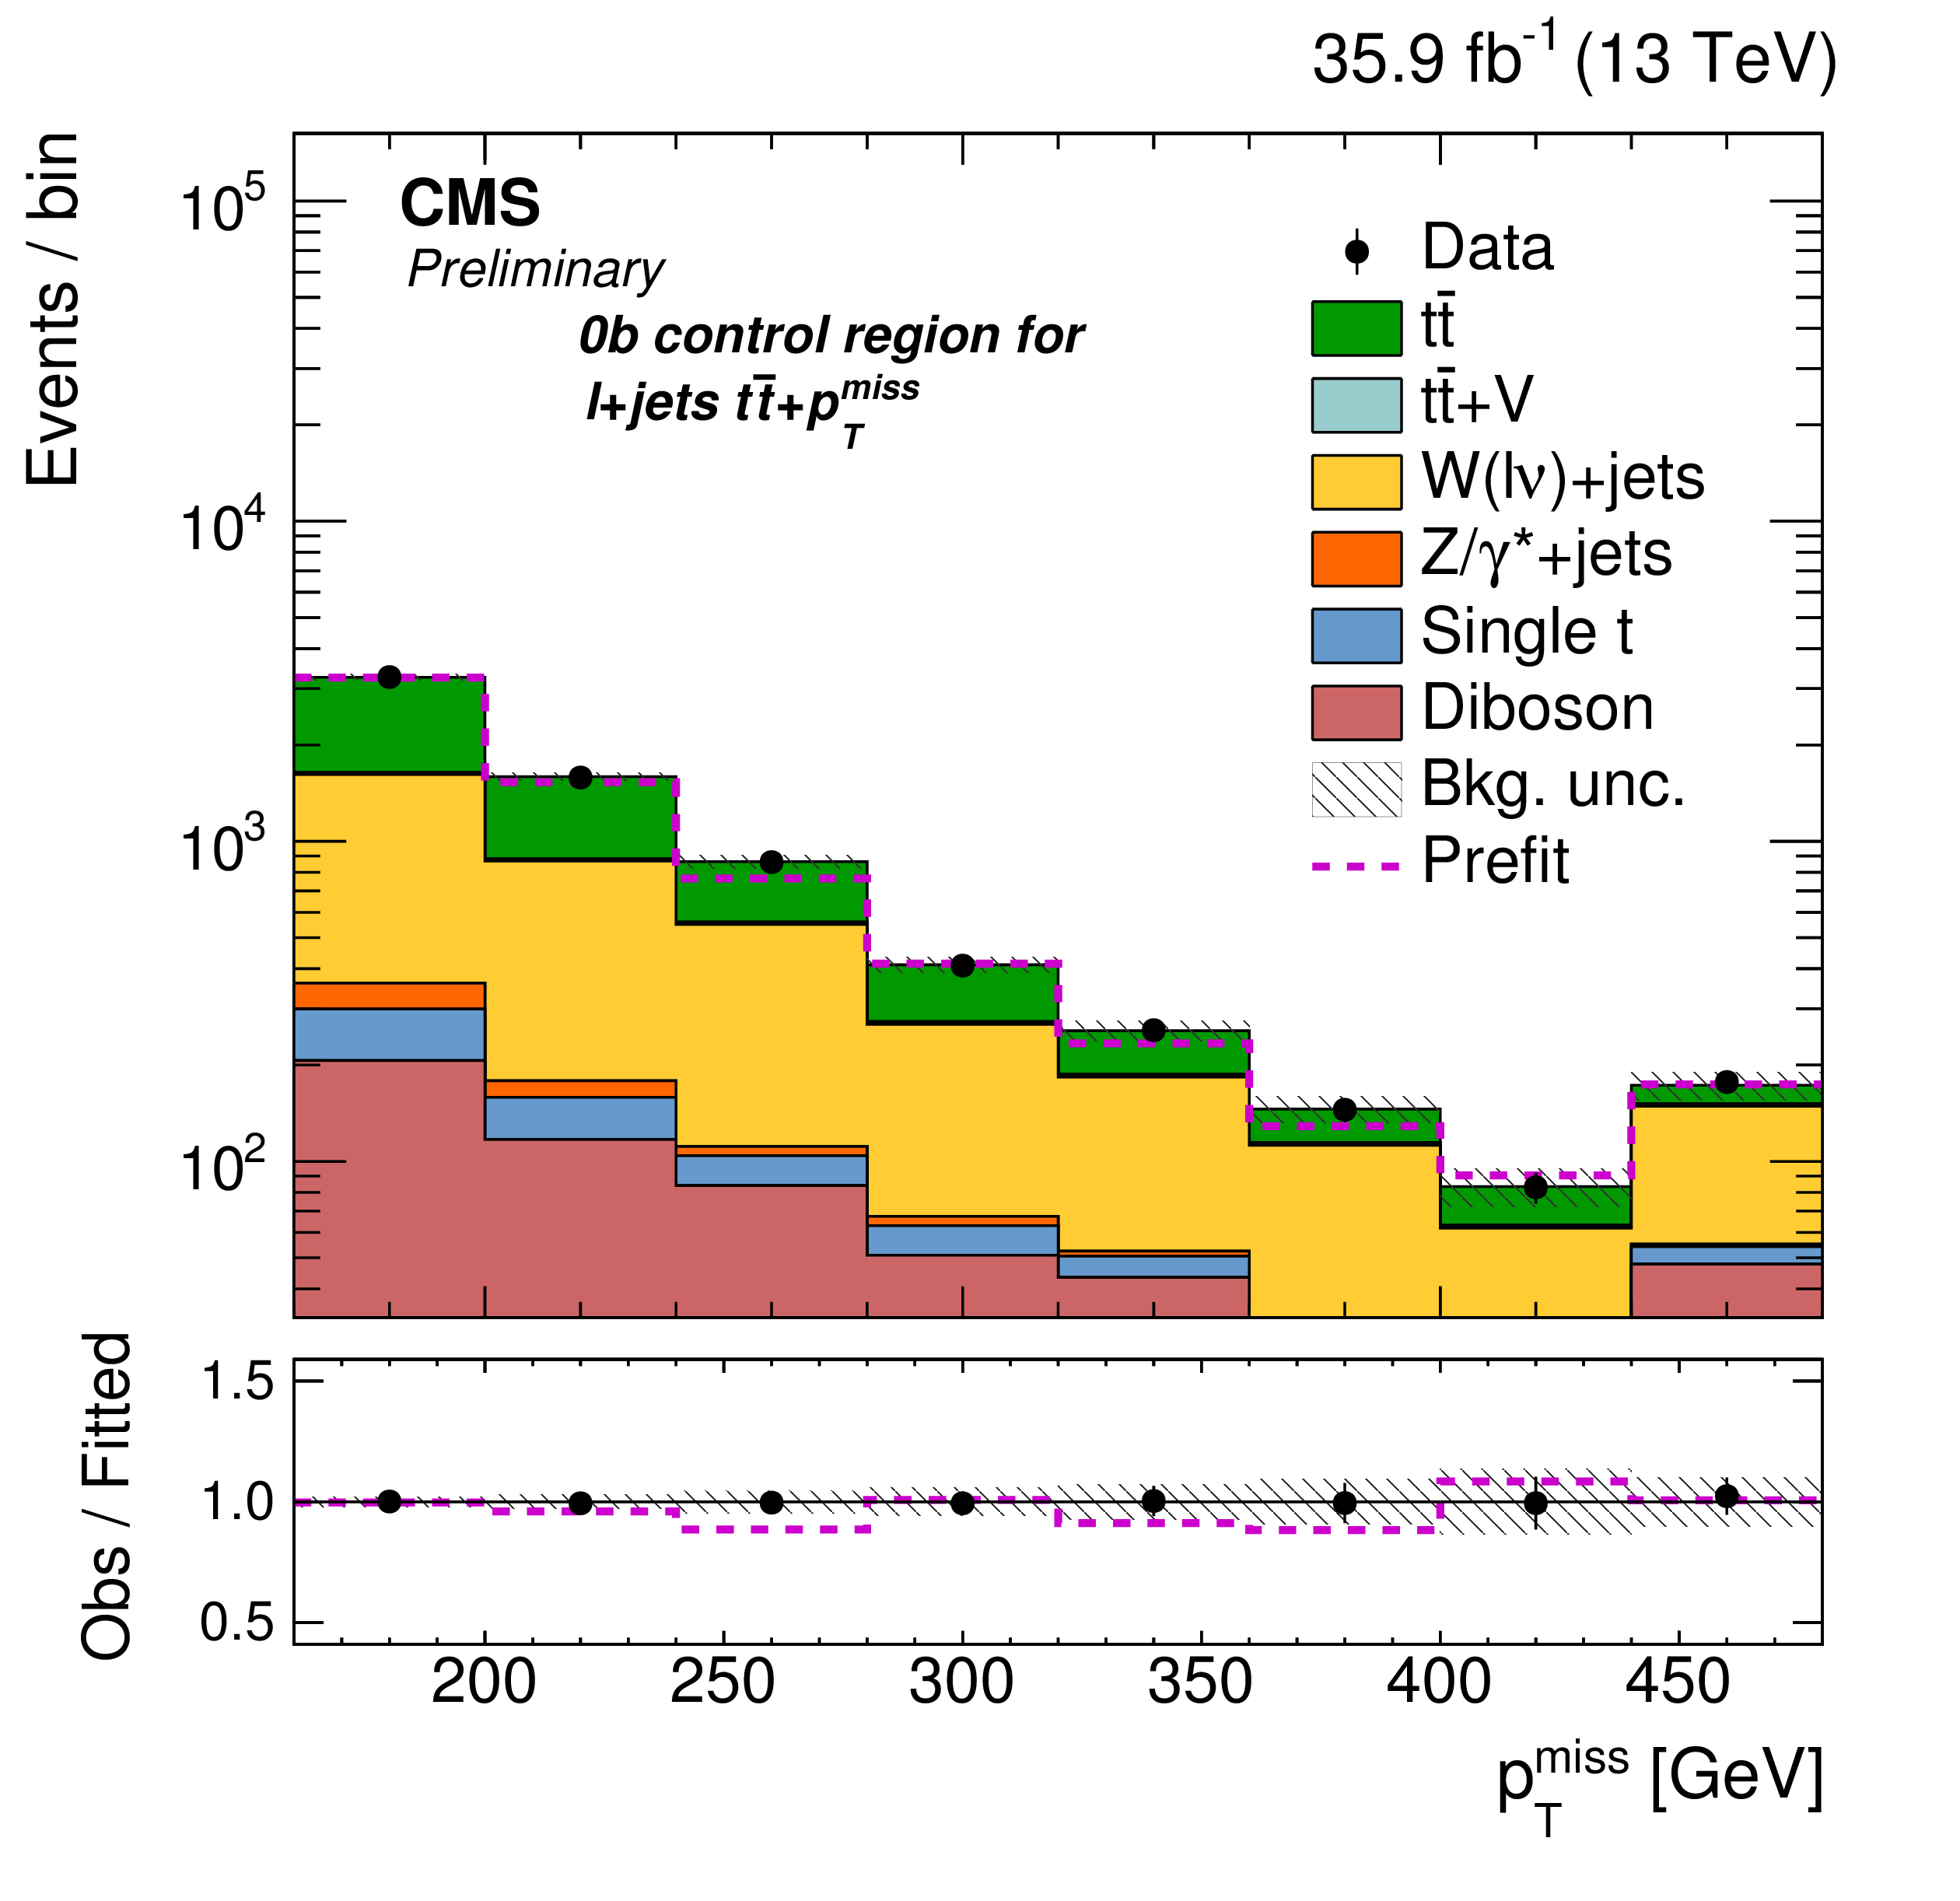
The $p_{\text {T}}^{\text {miss}}$ distribution for the 0-b-tag control region in the $\ell +$jets channel. This control region is enriched in $\text {W} +$jets. The distributions correspond to the background-only fit, while the magenta histogram is the pre-fit estimate of the overall background. The last bin contains overflow events. The uncertainty band shown in the observed data/fitted background ratio panel are the fit values, while the magenta lines correspond to the ratio of prefit expectations to fitted background. |
png pdf |
Additional Figure 10:
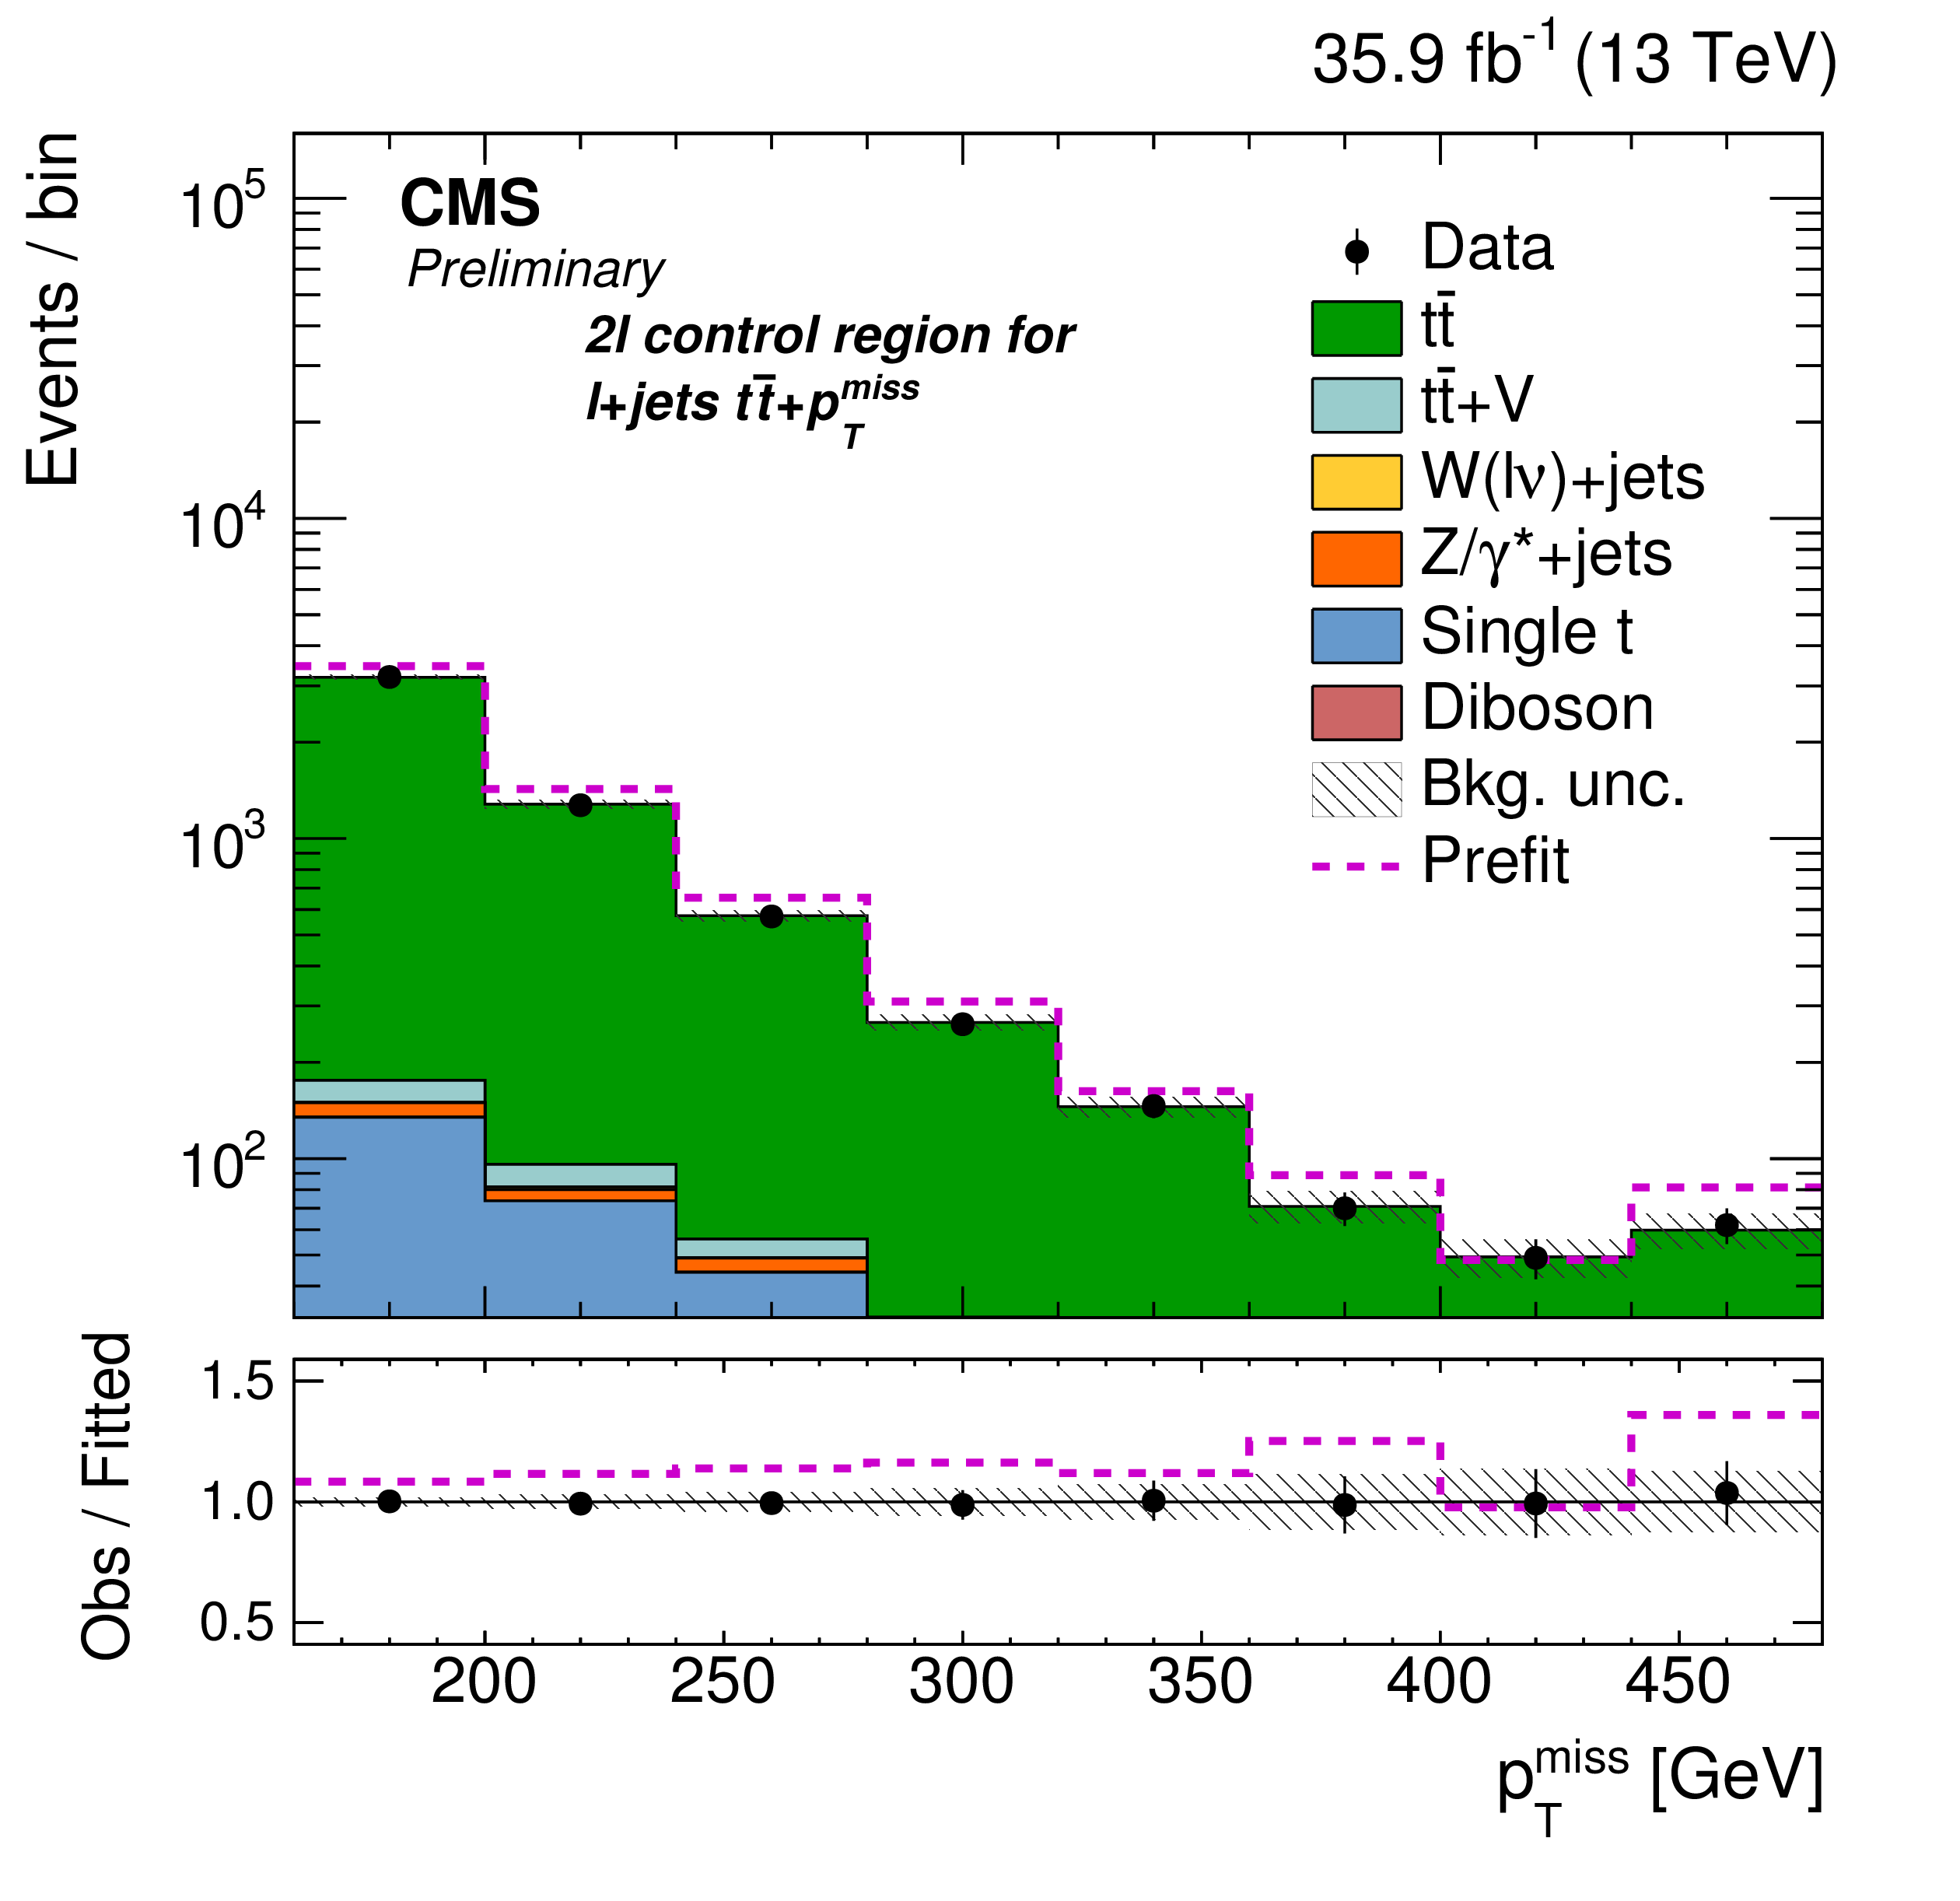
The $p_{\text {T}}^{\text {miss}}$ distribution for the 2-lepton control region in the $\ell +$jets channel. This control region is enriched in dileptonic $\mathrm{t\bar{t}}$. The distributions correspond to the background-only fit, while the magenta histogram is the pre-fit estimate of the overall background. The last bin contains overflow events. The uncertainty band shown in the observed data/fitted background ratio panel are the fit values, while the magenta lines correspond to the ratio of prefit expectations to fitted background. The horizontal error bars indicate the bin width. |

png pdf |
Additional Figure 11:
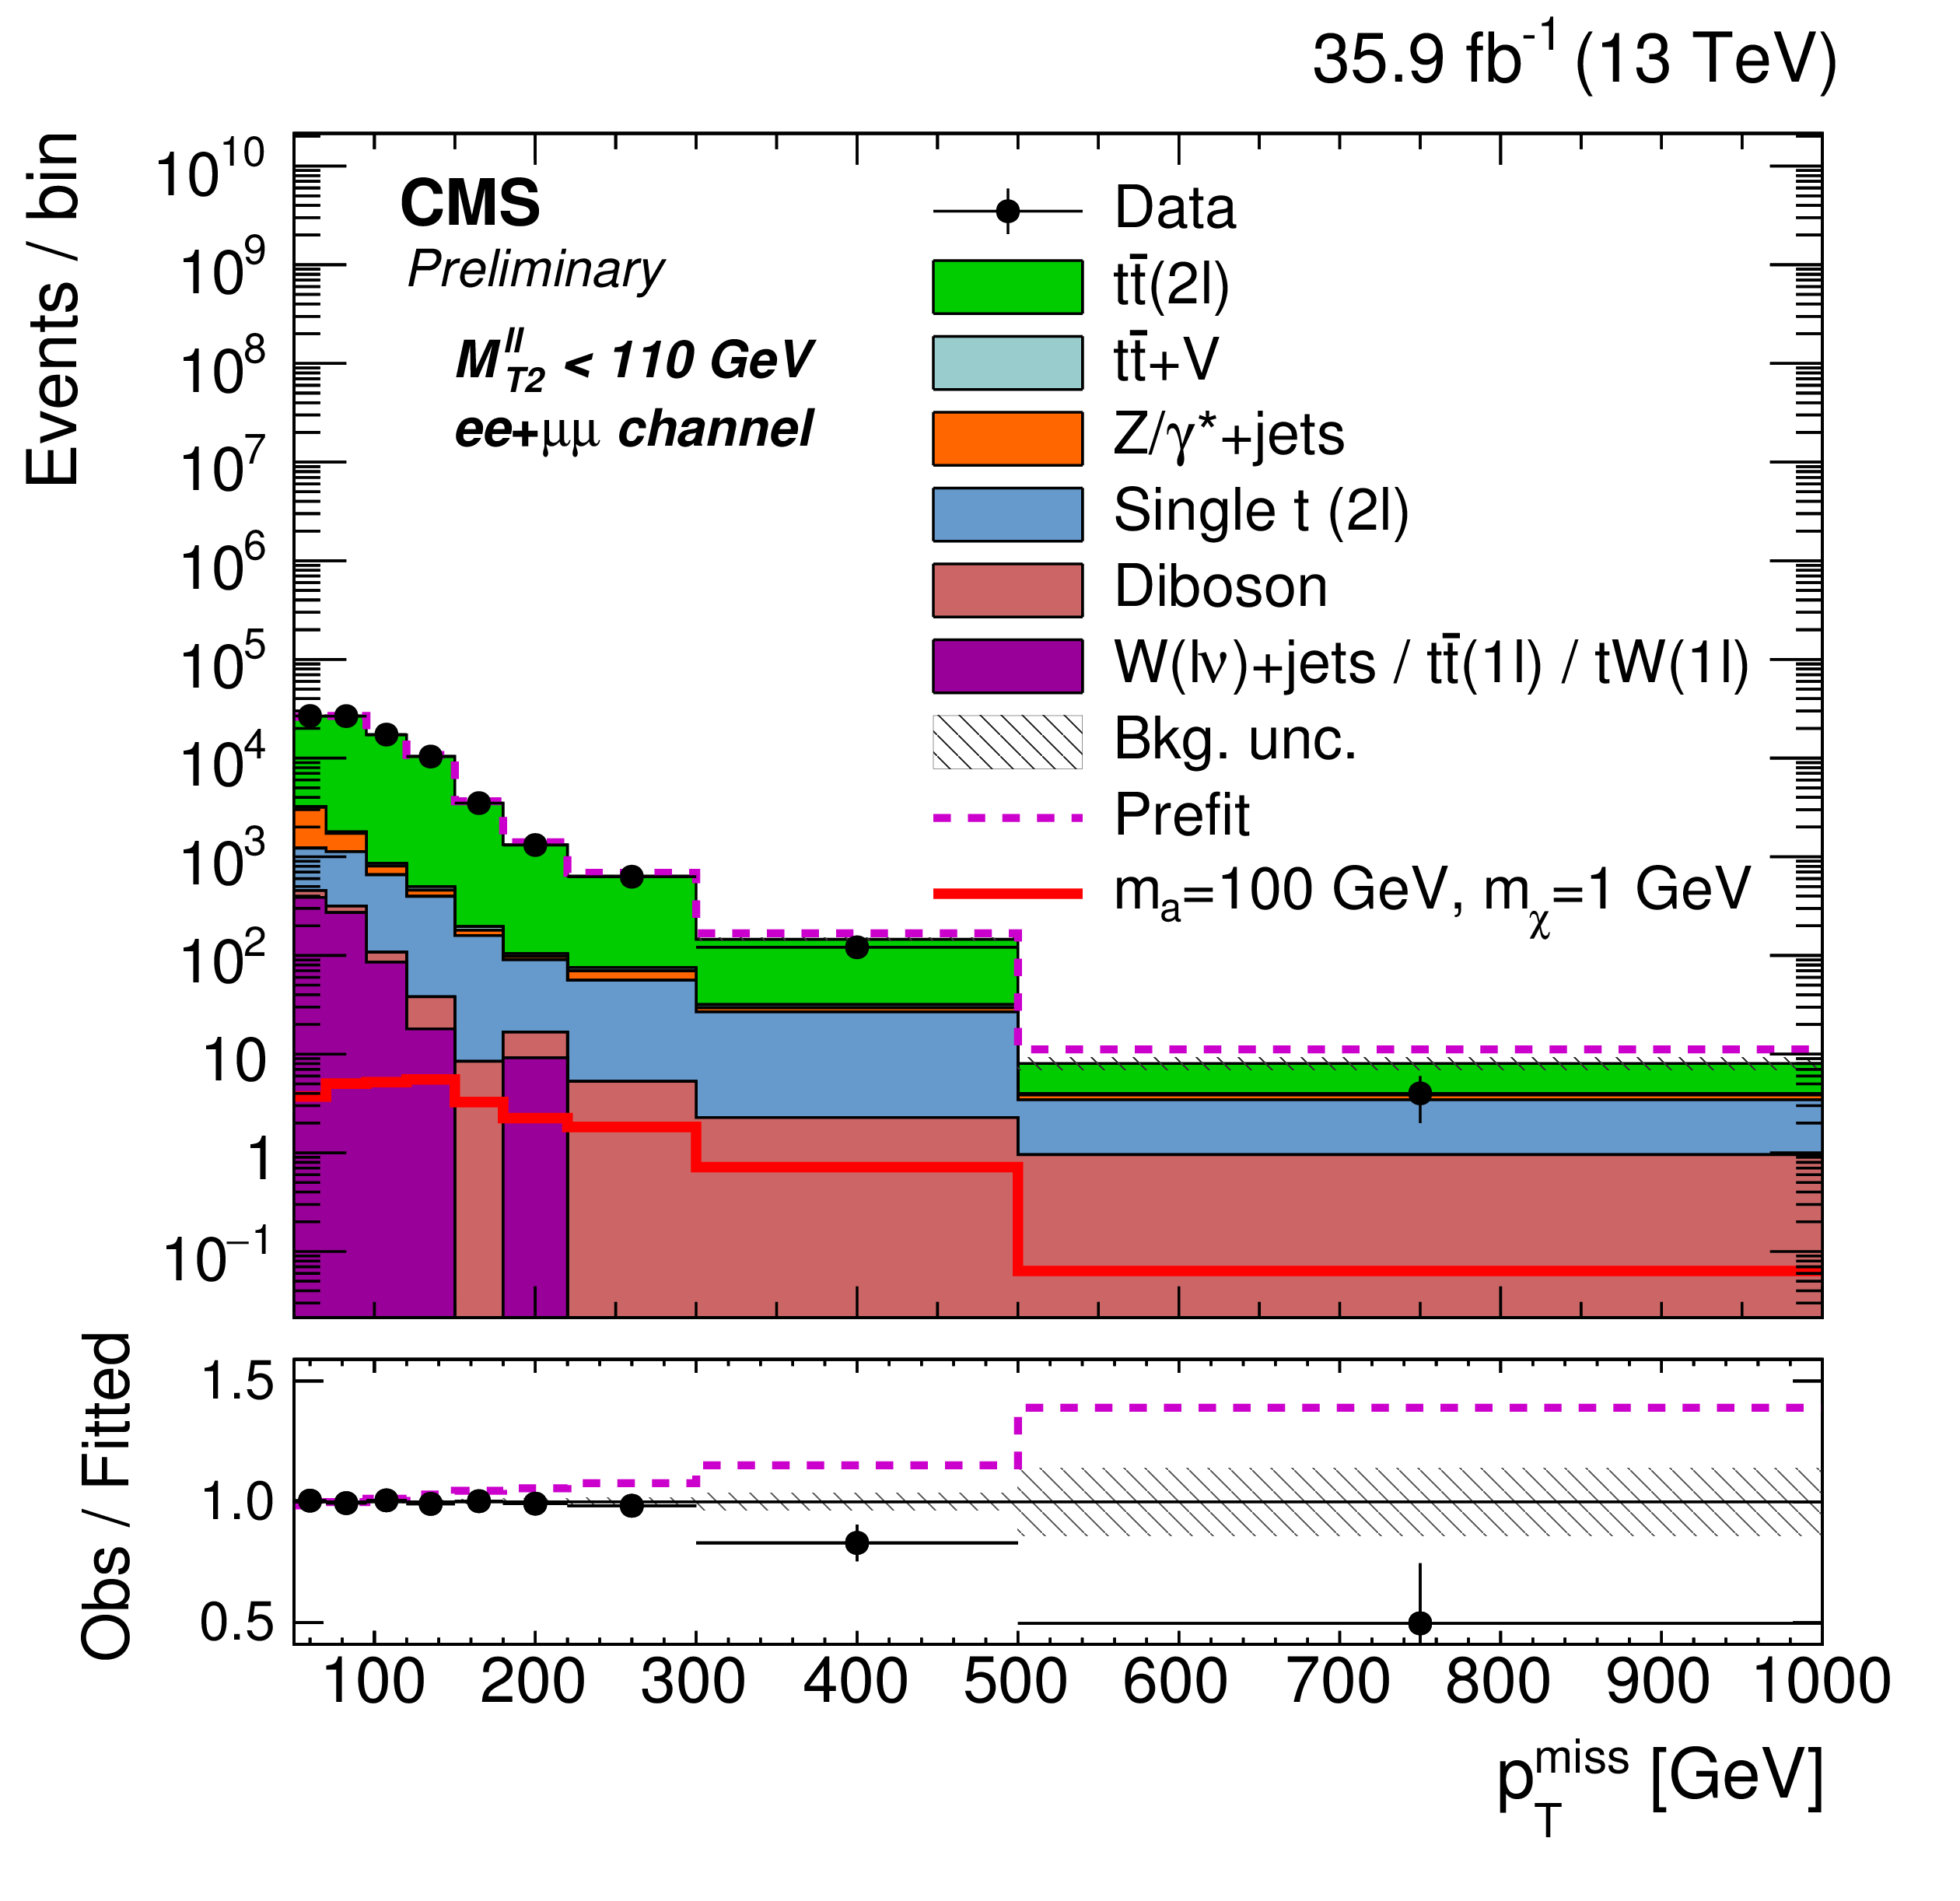
The $p_{\text {T}}^{\text {miss}}$ distribution for same-flavor events in the dileptonic channel $M_{T2}^{\ell \ell} > $ 110 GeV category. The background distributions correspond to the background-only fit, while the magenta histogram is the pre-fit estimate of the overall background. The prefit $p_{\text {T}}^{\text {miss}}$ distribution of pseudoscalar $m_a = $ 100 GeV is overlayed. The last bin contains overflow events. The uncertainty band shown in the observed data/fitted background ratio panel are the fit values, while the magenta lines correspond to the ratio of prefit expectations to fitted background. The horizontal error bars indicate the bin width. |
png pdf |
Additional Figure 12:
The $p_{\text {T}}^{\text {miss}}$ distribution for same-flavor events in the dileptonic channel $M_{T2}^{\ell \ell} < $ 110 GeV category. The background distributions correspond to the background-only fit, while the magenta histogram is the pre-fit estimate of the overall background. The prefit MET distribution of pseudoscalar $m_a = $ 100 GeV is overlayed. The last bin contains overflow events. The uncertainty band shown in the observed data/fitted background ratio panel are the fit values, while the magenta lines correspond to the ratio of prefit expectations to fitted background. The horizontal error bars indicate the bin width. |
png pdf |
Additional Figure 13:
The $p_{\text {T}}^{\text {miss}}$ distribution for opposite-flavor events in the dileptonic channel $M_{T2}^{\ell \ell} < $ 110 GeV category. The background distributions correspond to the background-only fit, while the magenta histogram is the pre-fit estimate of the overall background. The prefit MET distribution of pseudoscalar $m_a = $ 100 GeV is overlayed. The last bin contains overflow events. The uncertainty band shown in the observed data/fitted background ratio panel are the fit values, while the magenta lines correspond to the ratio of prefit expectations to fitted background. |
png pdf |
Additional Figure 14:
The 95% CL upper limits on production rate of a scalar mediator decaying to dark matter pair. A DM particle with mass of 1 GeV is assumed. The theory cross section is computed at NLO in QCD. |
png pdf |
Additional Figure 15:
The 95% CL upper limits on production rate of a pseudoscalar mediator decaying to dark matter pair. A DM particle with mass of 1 GeV is assumed. The theory cross section is computed at NLO in QCD. |
png pdf |
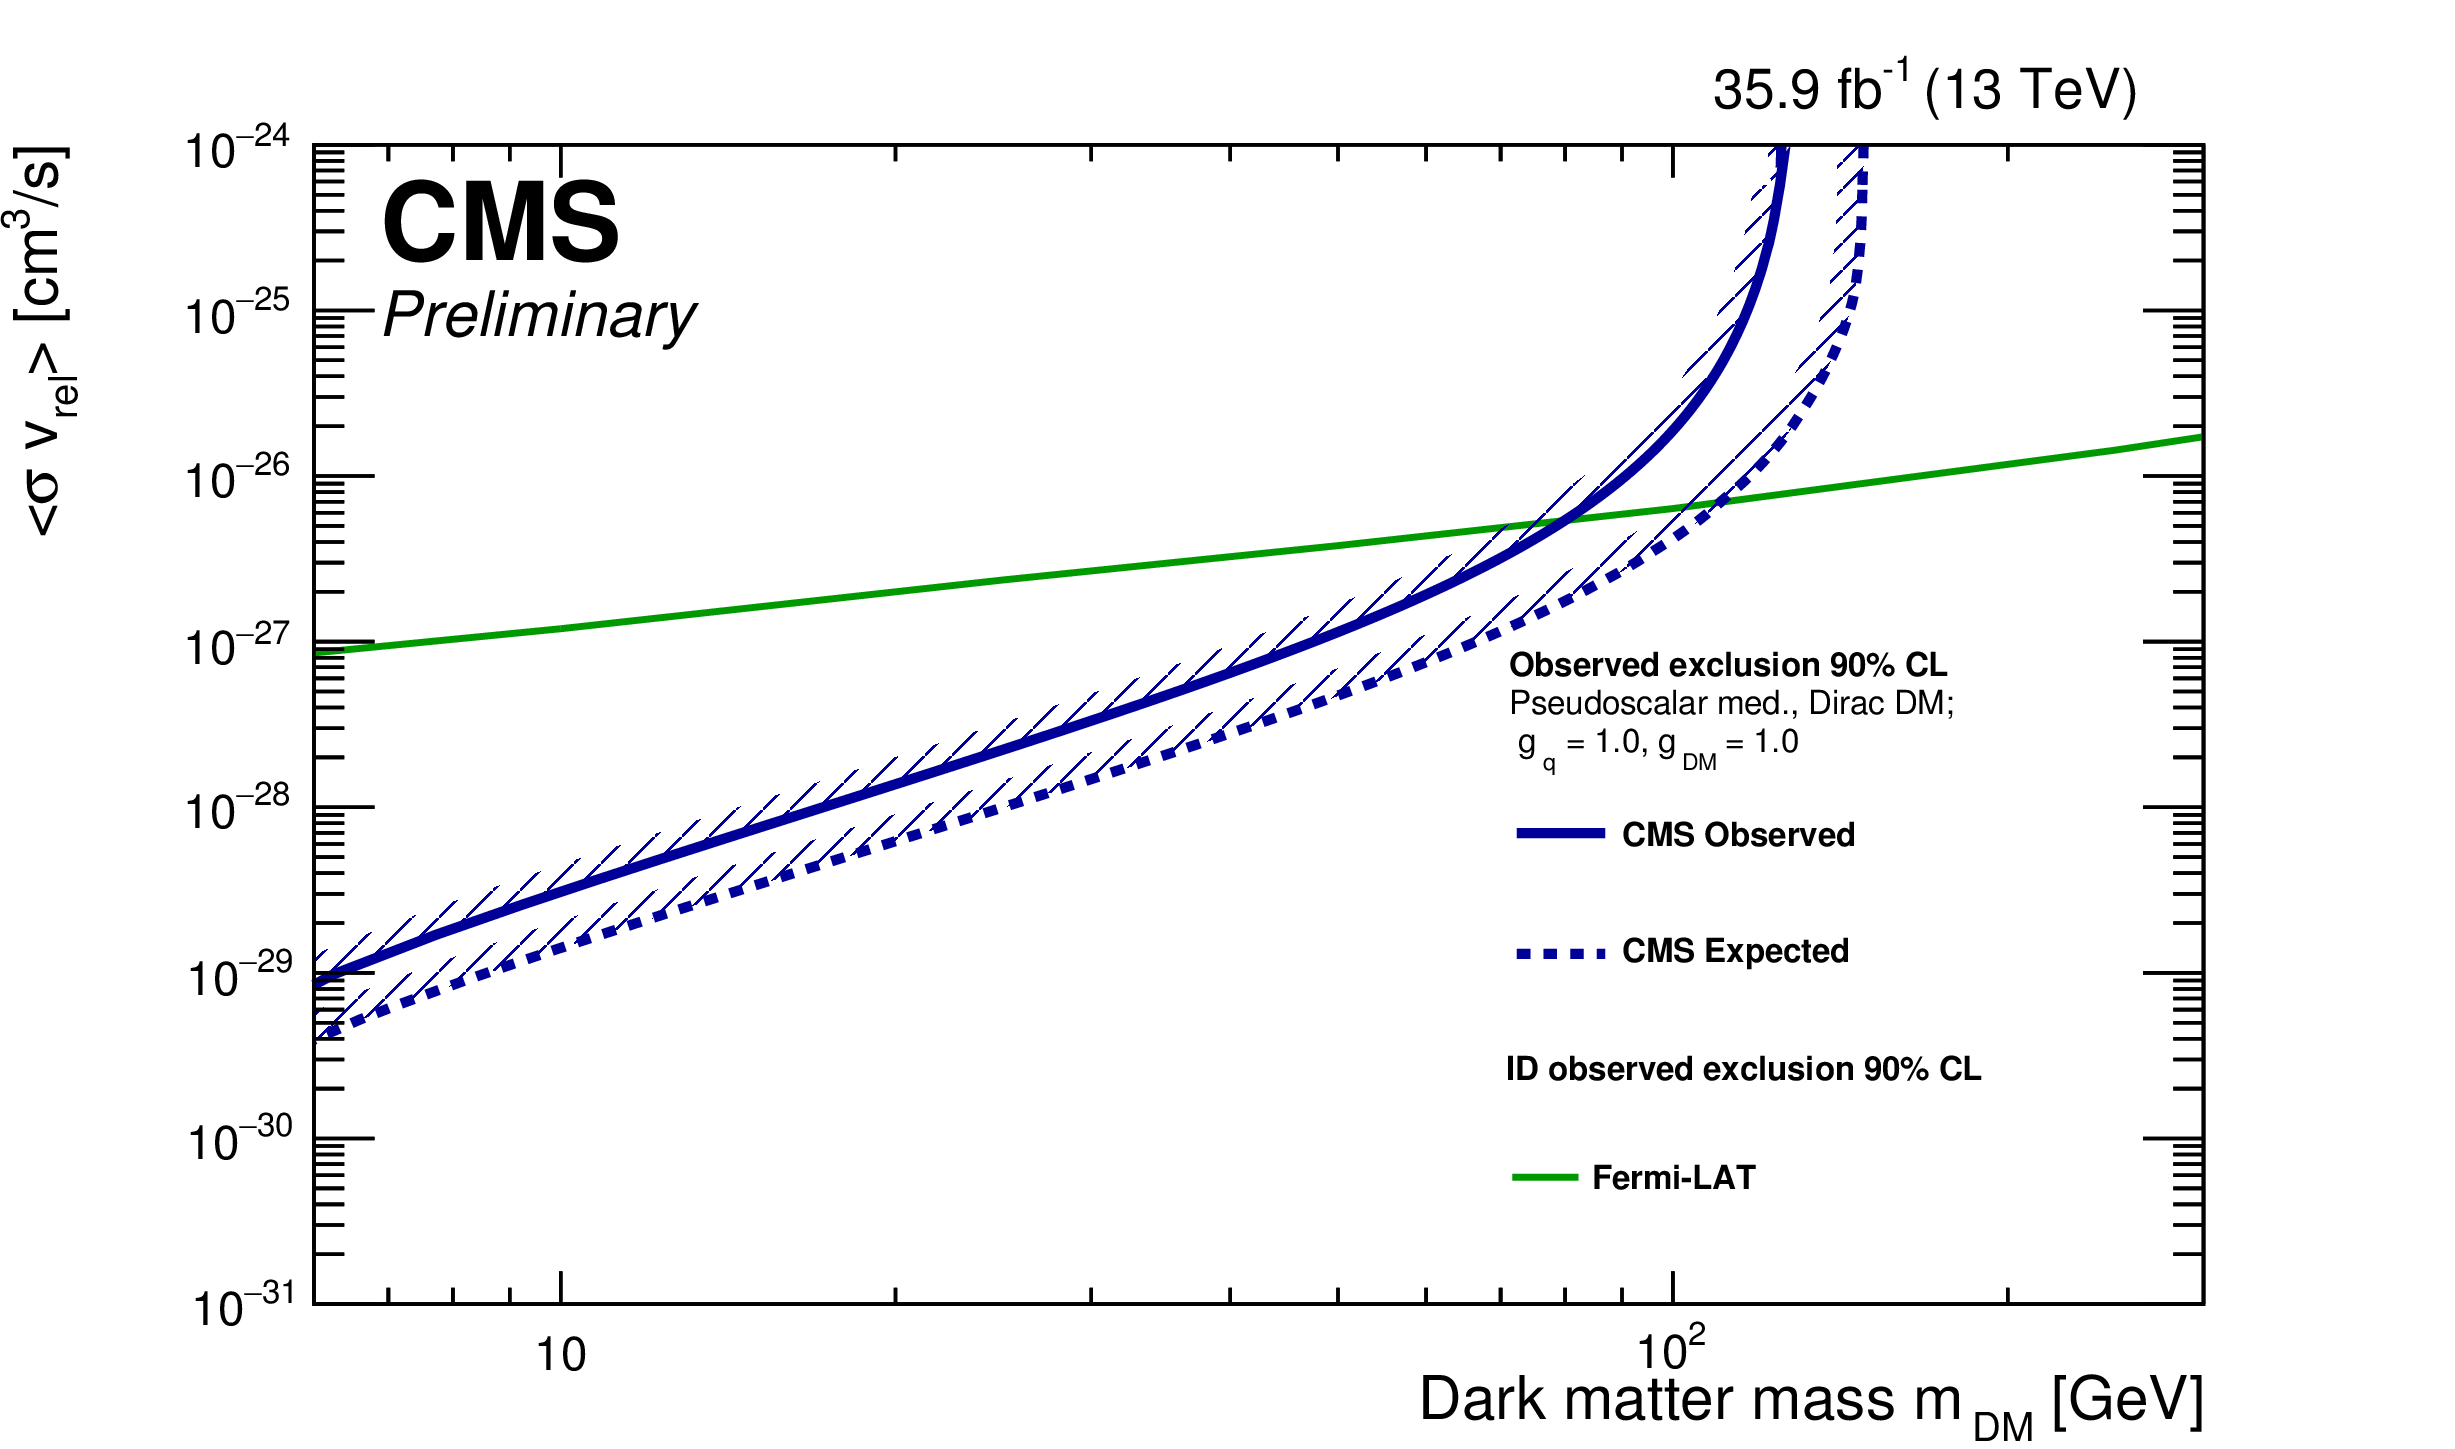
Additional Figure 16:
Exclusion Limits at 90% CL for pseudoscalar mediators are compared to the velocity averaged DM annihilation cross section upper limits from Fermi-LAT. |
png pdf |
Additional Figure 17:
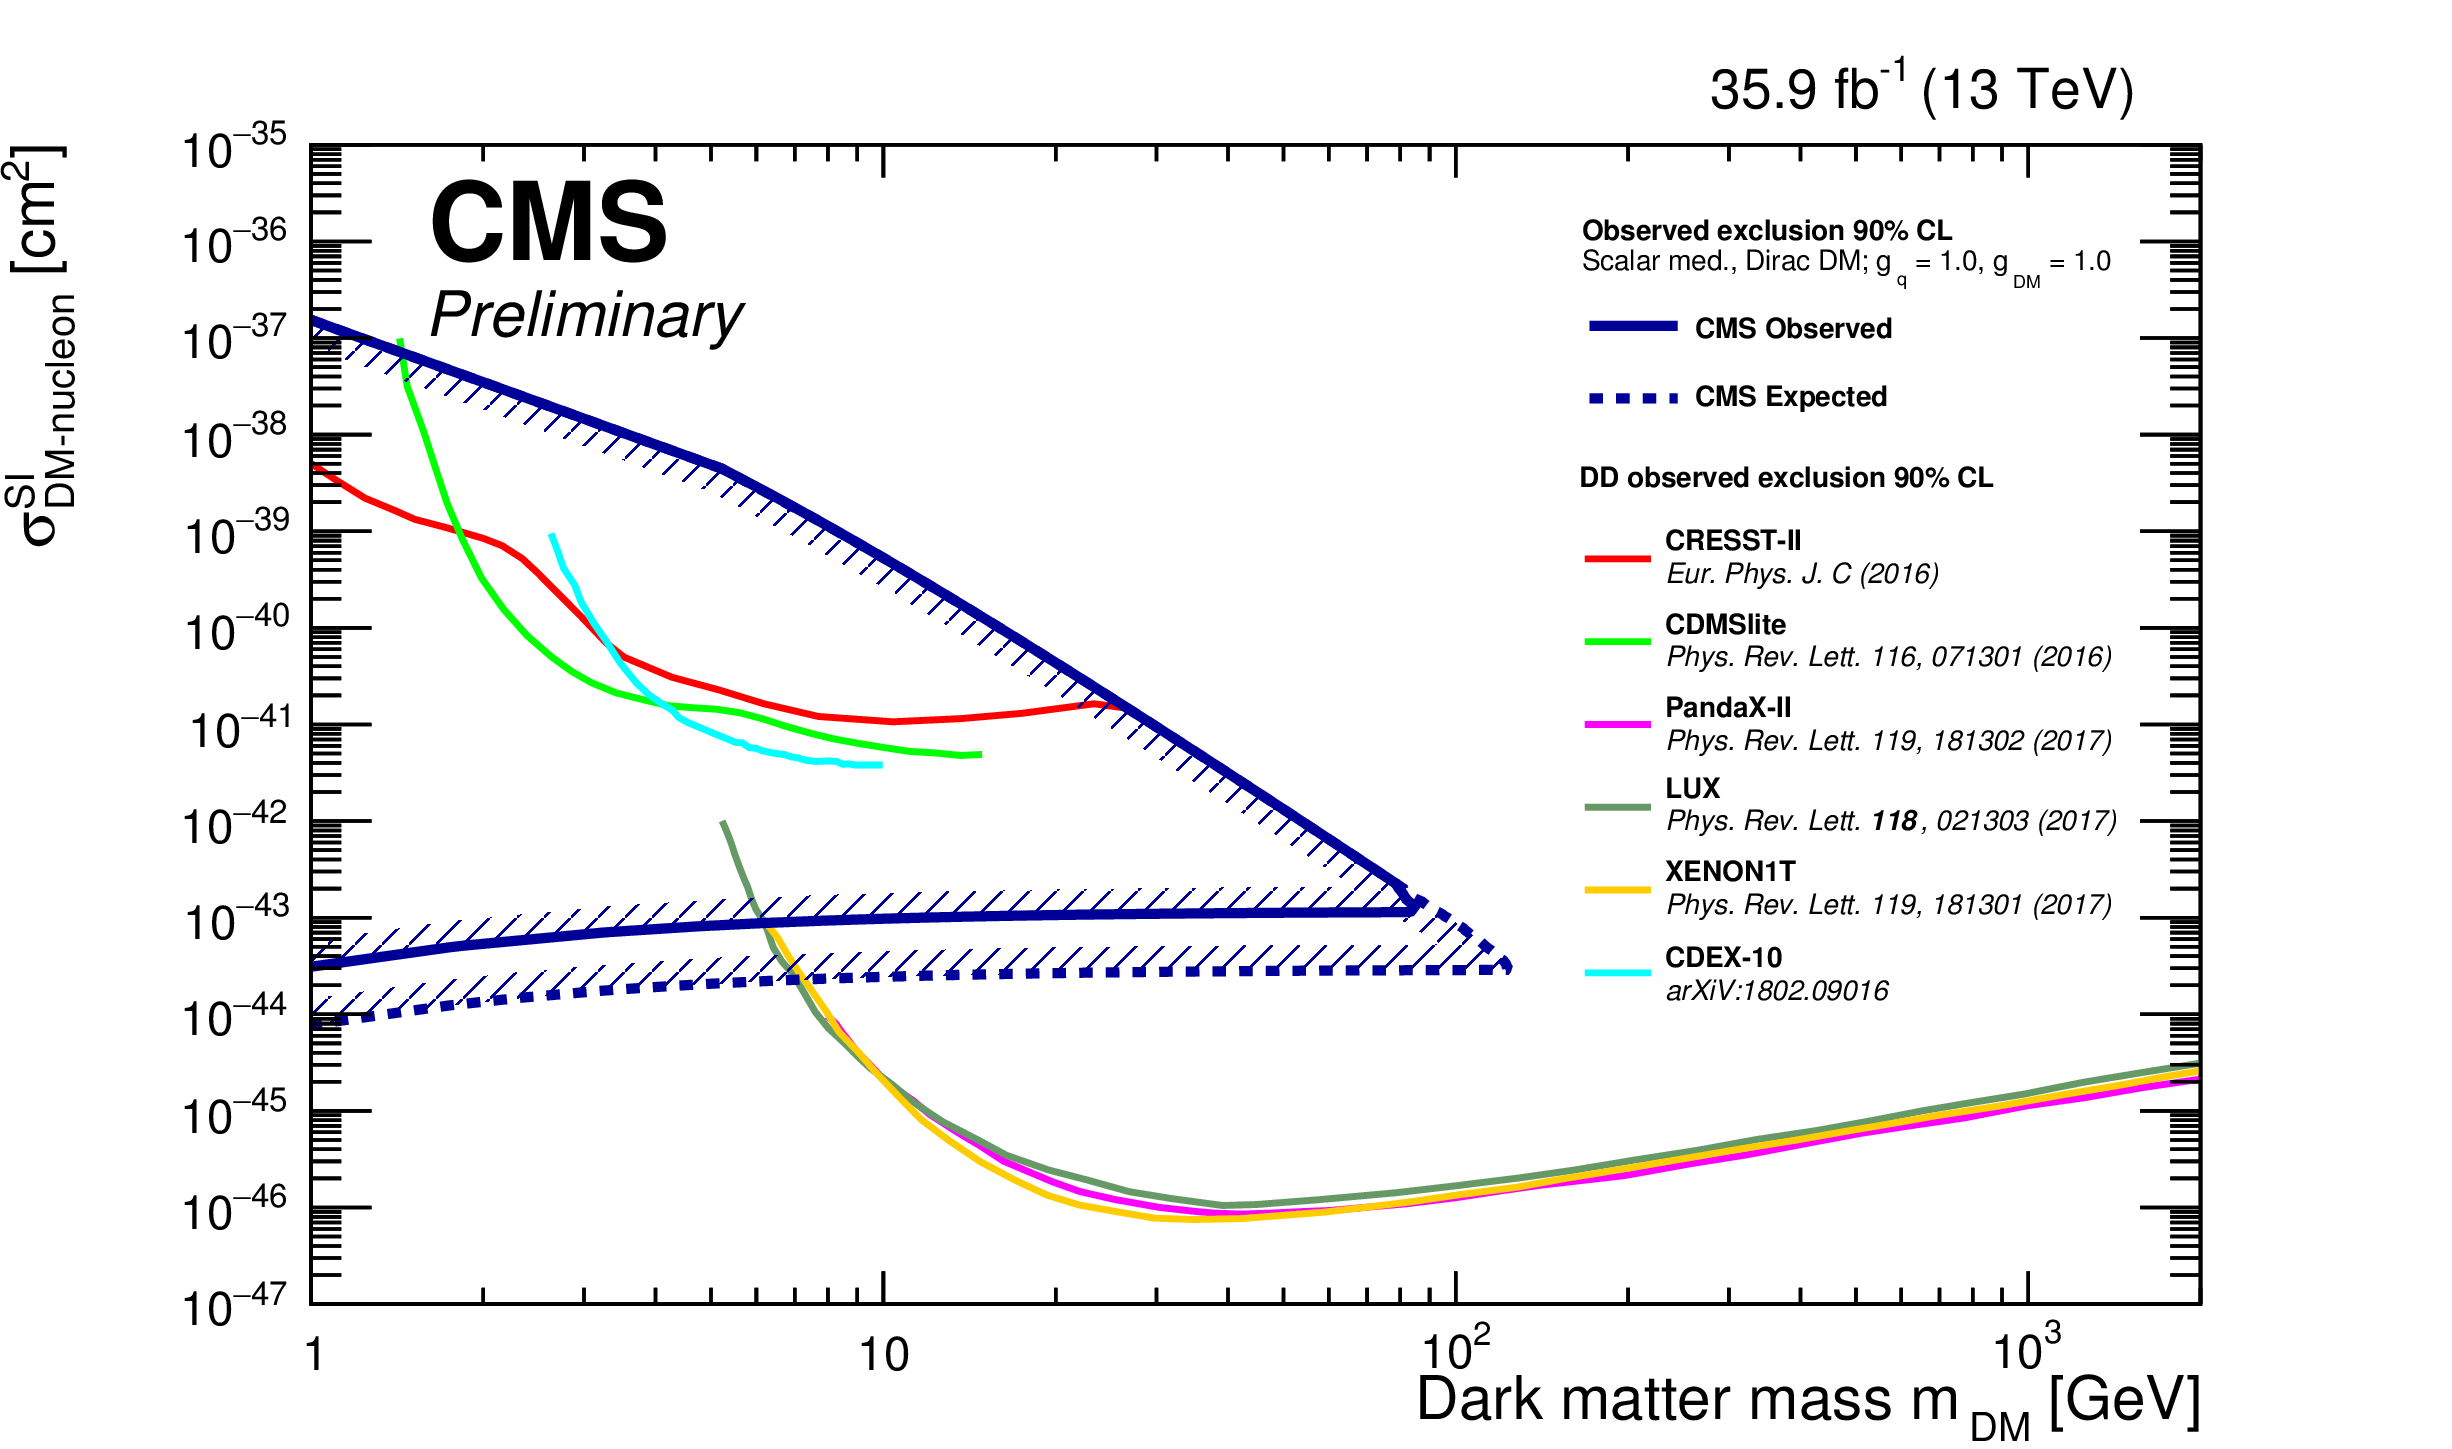
Exclusion limits at 90% CL in the $m_{DM}$ vs $\sigma _{SI}$ plane for the scalar mediator hypothesis. The observed exclusion in this search is compare to the direct detection (DD) results from the CRESST-II, CDMSLite, PandaX-II, LUX, XENON1T, and CDX-10 experiments. |
| References | ||||
| 1 | G. Bertone, D. Hooper, and J. Silk | Particle dark matter: evidence, candidates and constraints | PR 405 (2005) 279 | hep-ph/0404175 |
| 2 | J. L. Feng | Dark matter candidates from particle physics and methods of detection | Ann. Rev. Astron. Astrophys. 48 (2010) 495 | 1003.0904 |
| 3 | T. A. Porter, R. P. Johnson, and P. W. Graham | Dark matter searches with astroparticle data | Ann. Rev. Astron. Astrophys. 49 (2011) 155 | 1104.2836 |
| 4 | U. Haisch, F. Kahlhoefer, and J. Unwin | The impact of heavy-quark loops on LHC dark matter searches | JHEP 07 (2013) 125 | 1208.4605 |
| 5 | T. Lin, E. W. Kolb, and L.-T. Wang | Probing dark matter couplings to top and bottom quarks at the LHC | PRD 88 (2013) 063510 | 1303.6638 |
| 6 | M. R. Buckley, D. Feld, and D. Gon\ifmmode \mbox\cc\else \cc\fialves | Scalar simplified models for dark matter | PRD 91 (2015) 015017 | 1410.6497 |
| 7 | U. Haisch and E. Re | Simplified dark matter top-quark interactions at the LHC | JHEP 06 (2015) 078 | 1503.00691 |
| 8 | C. Arina et al. | A comprehensive approach to dark matter studies: exploration of simplified top-philic models | JHEP 11 (2016) 111 | 1605.09242 |
| 9 | ATLAS Collaboration | Search for new phenomena in final states with an energetic jet and large missing transverse momentum in pp collisions at $ \sqrt{s}= $ 8 TeV with the ATLAS detector | EPJC 75 (2015) 299 | 1502.01518 |
| 10 | CMS Collaboration | Search for dark matter in proton-proton collisions at 8 TeV with missing transverse momentum and vector boson tagged jets | JHEP 12 (2016) 083 | CMS-EXO-12-055 1607.05764 |
| 11 | ATLAS Collaboration | Search for new phenomena in final states with an energetic jet and large missing transverse momentum in $ pp $ collisions at $ \sqrt{s}= $ 13 TeV using the ATLAS detector | PRD 94 (2016) 032005 | 1604.07773 |
| 12 | CMS Collaboration | Search for dark matter produced with an energetic jet or a hadronically decaying W or Z boson at $ \sqrt{s} = $ 13 TeV | JHEP 07 (2017) 14 | CMS-EXO-16-037 1703.01651 |
| 13 | CMS Collaboration | Search for the production of dark matter in association with top-quark pairs in the single-lepton final state in proton-proton collisions at $ \sqrt{s} = $ 8 TeV | JHEP 06 (2015) 121 | CMS-B2G-14-004 1504.03198 |
| 14 | ATLAS Collaboration | Search for dark matter in events with heavy quarks and missing transverse momentum in pp collisions with the ATLAS detector | EPJC 75 (2015) 92 | 1410.4031 |
| 15 | CMS Collaboration | Search for dark matter produced in association with heavy-flavor quark pairs in proton-proton collisions at $ \sqrt{s}= $ 13 TeV | EPJC 77 (2017) 845 | |
| 16 | CMS Collaboration | The CMS experiment at the CERN LHC | JINST 3 (2008) S08004 | CMS-00-001 |
| 17 | CMS Collaboration | Particle-flow reconstruction and global event description with the CMS detector | JINST 12 (2017) P10003 | CMS-PRF-14-001 1706.04965 |
| 18 | M. Cacciari, G. P. Salam, and G. Soyez | The anti-$ {k_{\mathrm{T}}} $ jet clustering algorithm | JHEP 04 (2008) 063 | 0802.1189 |
| 19 | M. Cacciari, G. P. Salam, and G. Soyez | FastJet user manual | EPJC 72 (2012) 1896 | 1111.6097 |
| 20 | CMS Collaboration | Determination of jet energy calibration and transverse momentum resolution in CMS | JINST 6 (2011) 11002 | CMS-JME-10-011 1107.4277 |
| 21 | M. Cacciari, G. P. Salam, and G. Soyez | The catchment area of jets | JHEP 04 (2008) 005 | 0802.1188 |
| 22 | CMS Collaboration | Jet algorithms performance in 13 TeV data | CMS-PAS-JME-16-003 | CMS-PAS-JME-16-003 |
| 23 | CMS Collaboration | Identification of b-quark jets with the CMS experiment | JINST 8 (2013) P04013 | CMS-BTV-12-001 1211.4462 |
| 24 | CMS Collaboration | Identification of heavy-flavour jets with the CMS detector in pp collisions at 13 TeV | Submitted to \it JINST | CMS-BTV-16-002 1712.07158 |
| 25 | C. Oleari | The POWHEG-BOX | NPPS 205-206 (2010) 36 | 1007.3893 |
| 26 | J. Alwall et al. | The automated computation of tree-level and next-to-leading order differential cross sections, and their matching to parton shower simulations | JHEP 07 (2014) 079 | 1405.0301 |
| 27 | A. Denner, S. Dittmaier, T. Kasprzik, and A. Muck | Electroweak corrections to W+jet hadroproduction including leptonic W-boson decays | JHEP 08 (2009) 075 | 0906.1656 |
| 28 | A. Denner, S. Dittmaier, T. Kasprzik, and A. Muck | Electroweak corrections to dilepton+jet production at hadron colliders | JHEP 06 (2011) 069 | 1103.0914 |
| 29 | A. Denner, S. Dittmaier, T. Kasprzik, and A. Maeck | Electroweak corrections to monojet production at the LHC | EPJC 73 (2013) 2297 | 1211.5078 |
| 30 | J. H. Kuhn, A. Kulesza, S. Pozzorini, and M. Schulze | Electroweak corrections to hadronic photon production at large transverse momenta | JHEP 03 (2006) 059 | hep-ph/0508253 |
| 31 | S. Kallweit et al. | NLO electroweak automation and precise predictions for W+multijet production at the LHC | JHEP 04 (2015) 012 | 1412.5157 |
| 32 | S. Kallweit et al. | NLO QCD+EW predictions for V+jets including off-shell vector-boson decays and multijet merging | JHEP 04 (2016) 021 | 1511.08692 |
| 33 | NNPDF Collaboration | Parton distributions for the LHC Run II | JHEP 04 (2015) 040 | 1410.8849 |
| 34 | T. Sjostrand, S. Mrenna, and P. Z. Skands | A brief introduction to PYTHIA 8.1 | CPC 178 (2008) 852 | 0710.3820 |
| 35 | CMS Collaboration | Event generator tunes obtained from underlying event and multiparton scattering measurements | EPJC 76 (2016) 155 | CMS-GEN-14-001 1512.00815 |
| 36 | GEANT4 Collaboration | GEANT4: A simulation toolkit | NIMA 506 (2003) 250 | |
| 37 | D. Abercrombie et al. | Dark matter benchmark models for early LHC run-2 searches: report of the ATLAS/CMS Dark Matter Forum | 1507.00966 | |
| 38 | A. Albert et al. | Towards the next generation of simplified dark matter models | Physics of the Dark Universe 16 (2017) 49 | 1607.06680 |
| 39 | P. Harris, V. V. Khoze, M. Spannowsky, and C. Williams | Constraining dark sectors at colliders: Beyond the effective theory approach | PRD 91 (2015) 055009 | 1411.0535 |
| 40 | CMS Collaboration | Performance of CMS muon reconstruction in pp collision events at $ \sqrt{s}= $ 7 TeV | JINST 7 (2012) 10002 | CMS-MUO-10-004 1206.4071 |
| 41 | CMS Collaboration | Performance of electron reconstruction and selection with the CMS detector in proton-proton collisions at $ \sqrt{s} = $ 8 TeV | JINST 10 (2015) 6005 | CMS-EGM-13-001 1502.02701 |
| 42 | Y. Bai et al. | Stop the top background of the stop search | JHEP 07 (2012) 110 | 1203.4813 |
| 43 | C. G. Lester and D. J. Summers | Measuring masses of semi-invisibly decaying particles pair produced at hadron colliders | PLB 463 (1999) 99 | hep-ph/9906349 |
| 44 | M. Burns, K. Kong, K. T. Matchev, and M. Park | Using subsystem $ M_{T2} $ for complete mass determinations in decay chains with missing energy at hadron colliders | JHEP 03 (2009) 143 | 0810.5576 |
| 45 | H.-C. Cheng and Z. Han | Minimal kinematic constraints and $ m_{T2} $ | JHEP 12 (2008) 063 | 0810.5178 |
| 46 | L. Moneta et al. | The RooStats Project | PoS ACAT (2010) 057 | 1009.1003 |
| 47 | CMS Collaboration | Measurement of differential cross sections for top quark pair production using the $ \text{lepton}+\text{jets} $ final state in proton-proton collisions at 13 TeV | PRD 95 (2017) 092001 | CMS-TOP-16-008 1610.04191 |
| 48 | T. Junk | Confidence level computation for combining searches with small statistics | Nucl. Instrum. Methods A 434 (1999) 435 | |
| 49 | A. L. Read | Presentation of search results: the $ CL_s $ technique | JPG 28 (2002) 2693 | |
| 50 | G. Cowan, K. Cranmer, E. Gross, and O. Vitells | Asymptotic formulae for likelihood-based tests of new physics | EPJC 71 (2011) 1554 | |
| 51 | CMS Collaboration | Search for top squarks and dark matter particles in opposite-charge dilepton final states at $ \sqrt{s}= $ 13 TeV | PRD 97 (2018) 032009 | CMS-SUS-17-001 1711.00752 |
| 52 | ATLAS Collaboration | Search for top-squark pair production in final states with one lepton, jets, and missing transverse momentum using 36.1 fb$ ^{-1} $ of $ \sqrt{s}= $ 13 TeV pp collision data with the ATLAS detector | Submitted to \it JHEP | 1711.11520 |
| 53 | ATLAS Collaboration | Search for dark matter produced in association with bottom or top quarks in $ \sqrt{s}= $ 13 TeV pp collisions with the ATLAS detector | EPJC 78 (2018) 18 | 1710.11412 |
|
|
Compact Muon Solenoid LHC, CERN |
|

|

|

|

|

|