

Compact Muon Solenoid
LHC, CERN
| CMS-PAS-BPH-24-010 | ||
| Search for the lepton flavor violating $ \tau^{-}\to\mu^{-}\mu^{+}\mu^{-} $ decay in proton-proton collisions at $ \sqrt{s}= $ 13.6 TeV | ||
| CMS Collaboration | ||
| 2026-03-26 | ||
| Abstract: This work presents a search for lepton flavor violating decay of a tau lepton into three muons ($ \tau^{-}\to\mu^{-}\mu^{+}\mu^{-} $) in proton-proton collisions at a center-of-mass energy of 13.6 TeV collected by the CMS experiment in 2022 and 2023, corresponding to an integrated luminosity of up to 63 fb$ ^{-1} $. Two sources of tau leptons are considered: heavy-flavor hadrons and vector boson decays. No significant excess above the expectation from combinatorial backgrounds is observed in the mass spectrum of three muons. Observed (expected) upper limits on the branching fraction $ \mathcal{B}(\tau^{-} \to \mu^{-}\mu^{+}\mu^{-}) $ at 90% confidence level are 6.7 (4.7)$ \times 10^{-8} $. | ||
| Links: CDS record (PDF) ; CADI line (restricted) ; | ||
| Figures & Tables | Summary | Additional Figures | References | CMS Publications |
|---|
| Figures | |
png pdf |
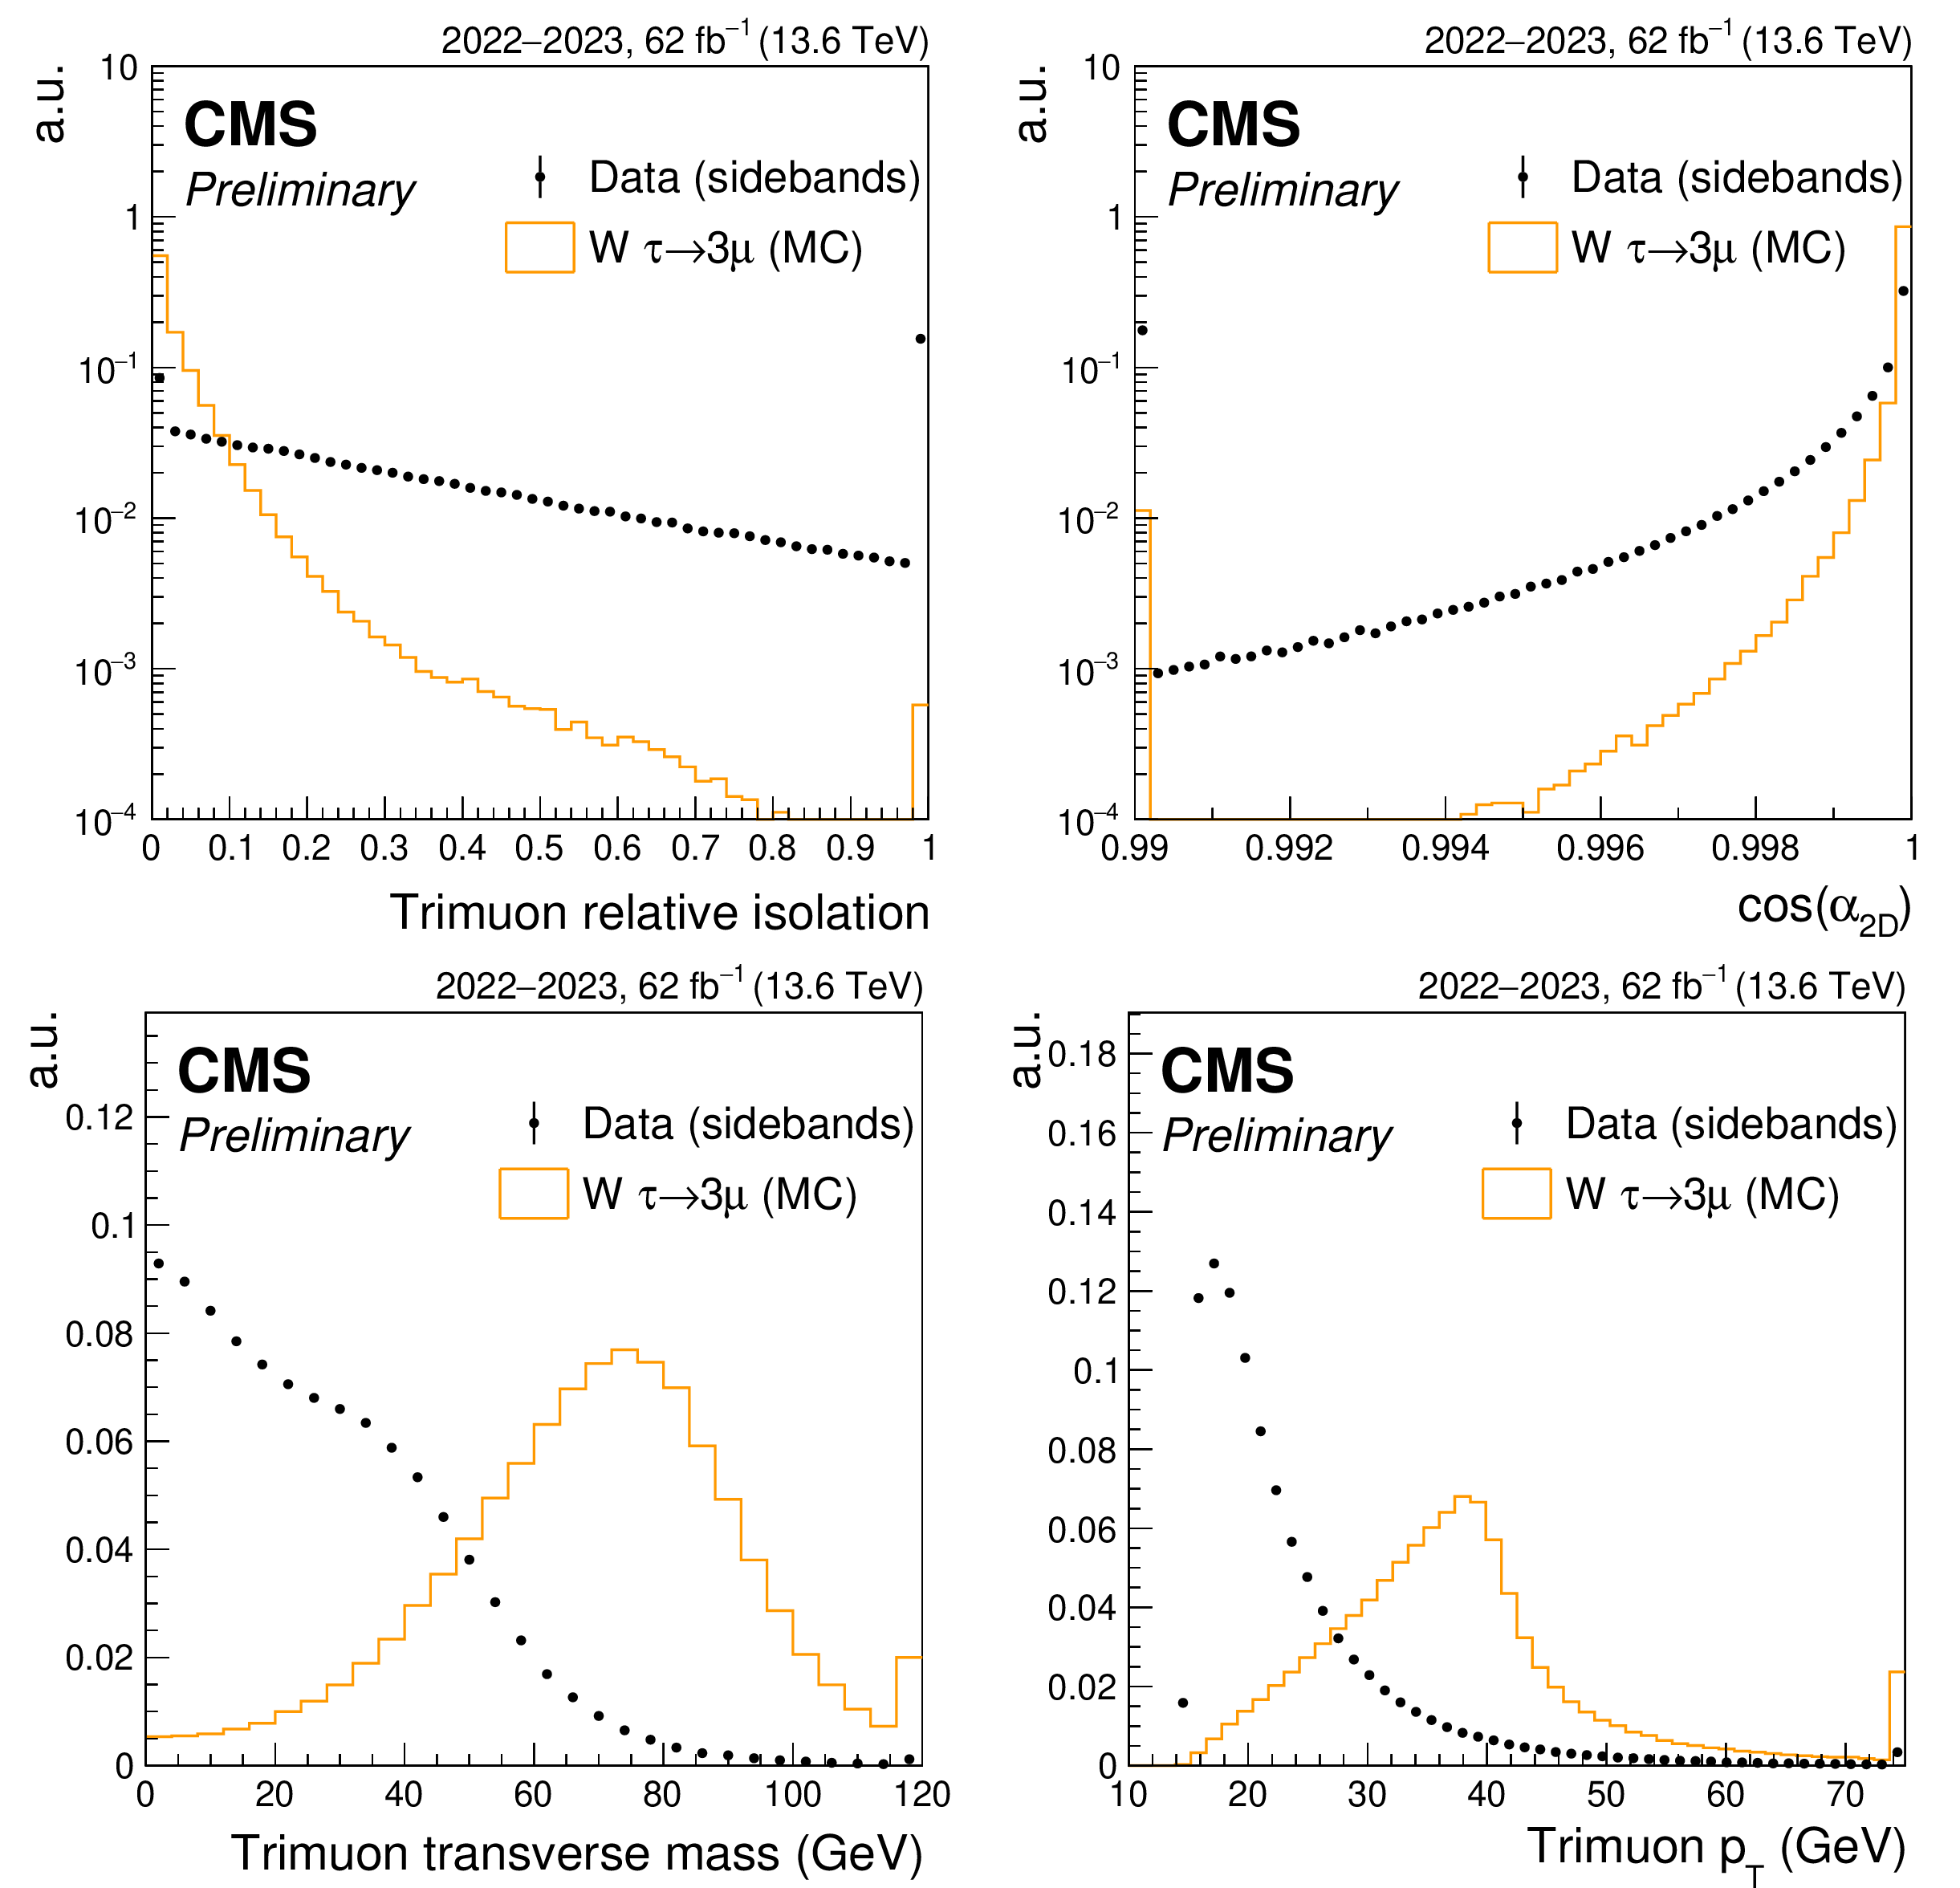
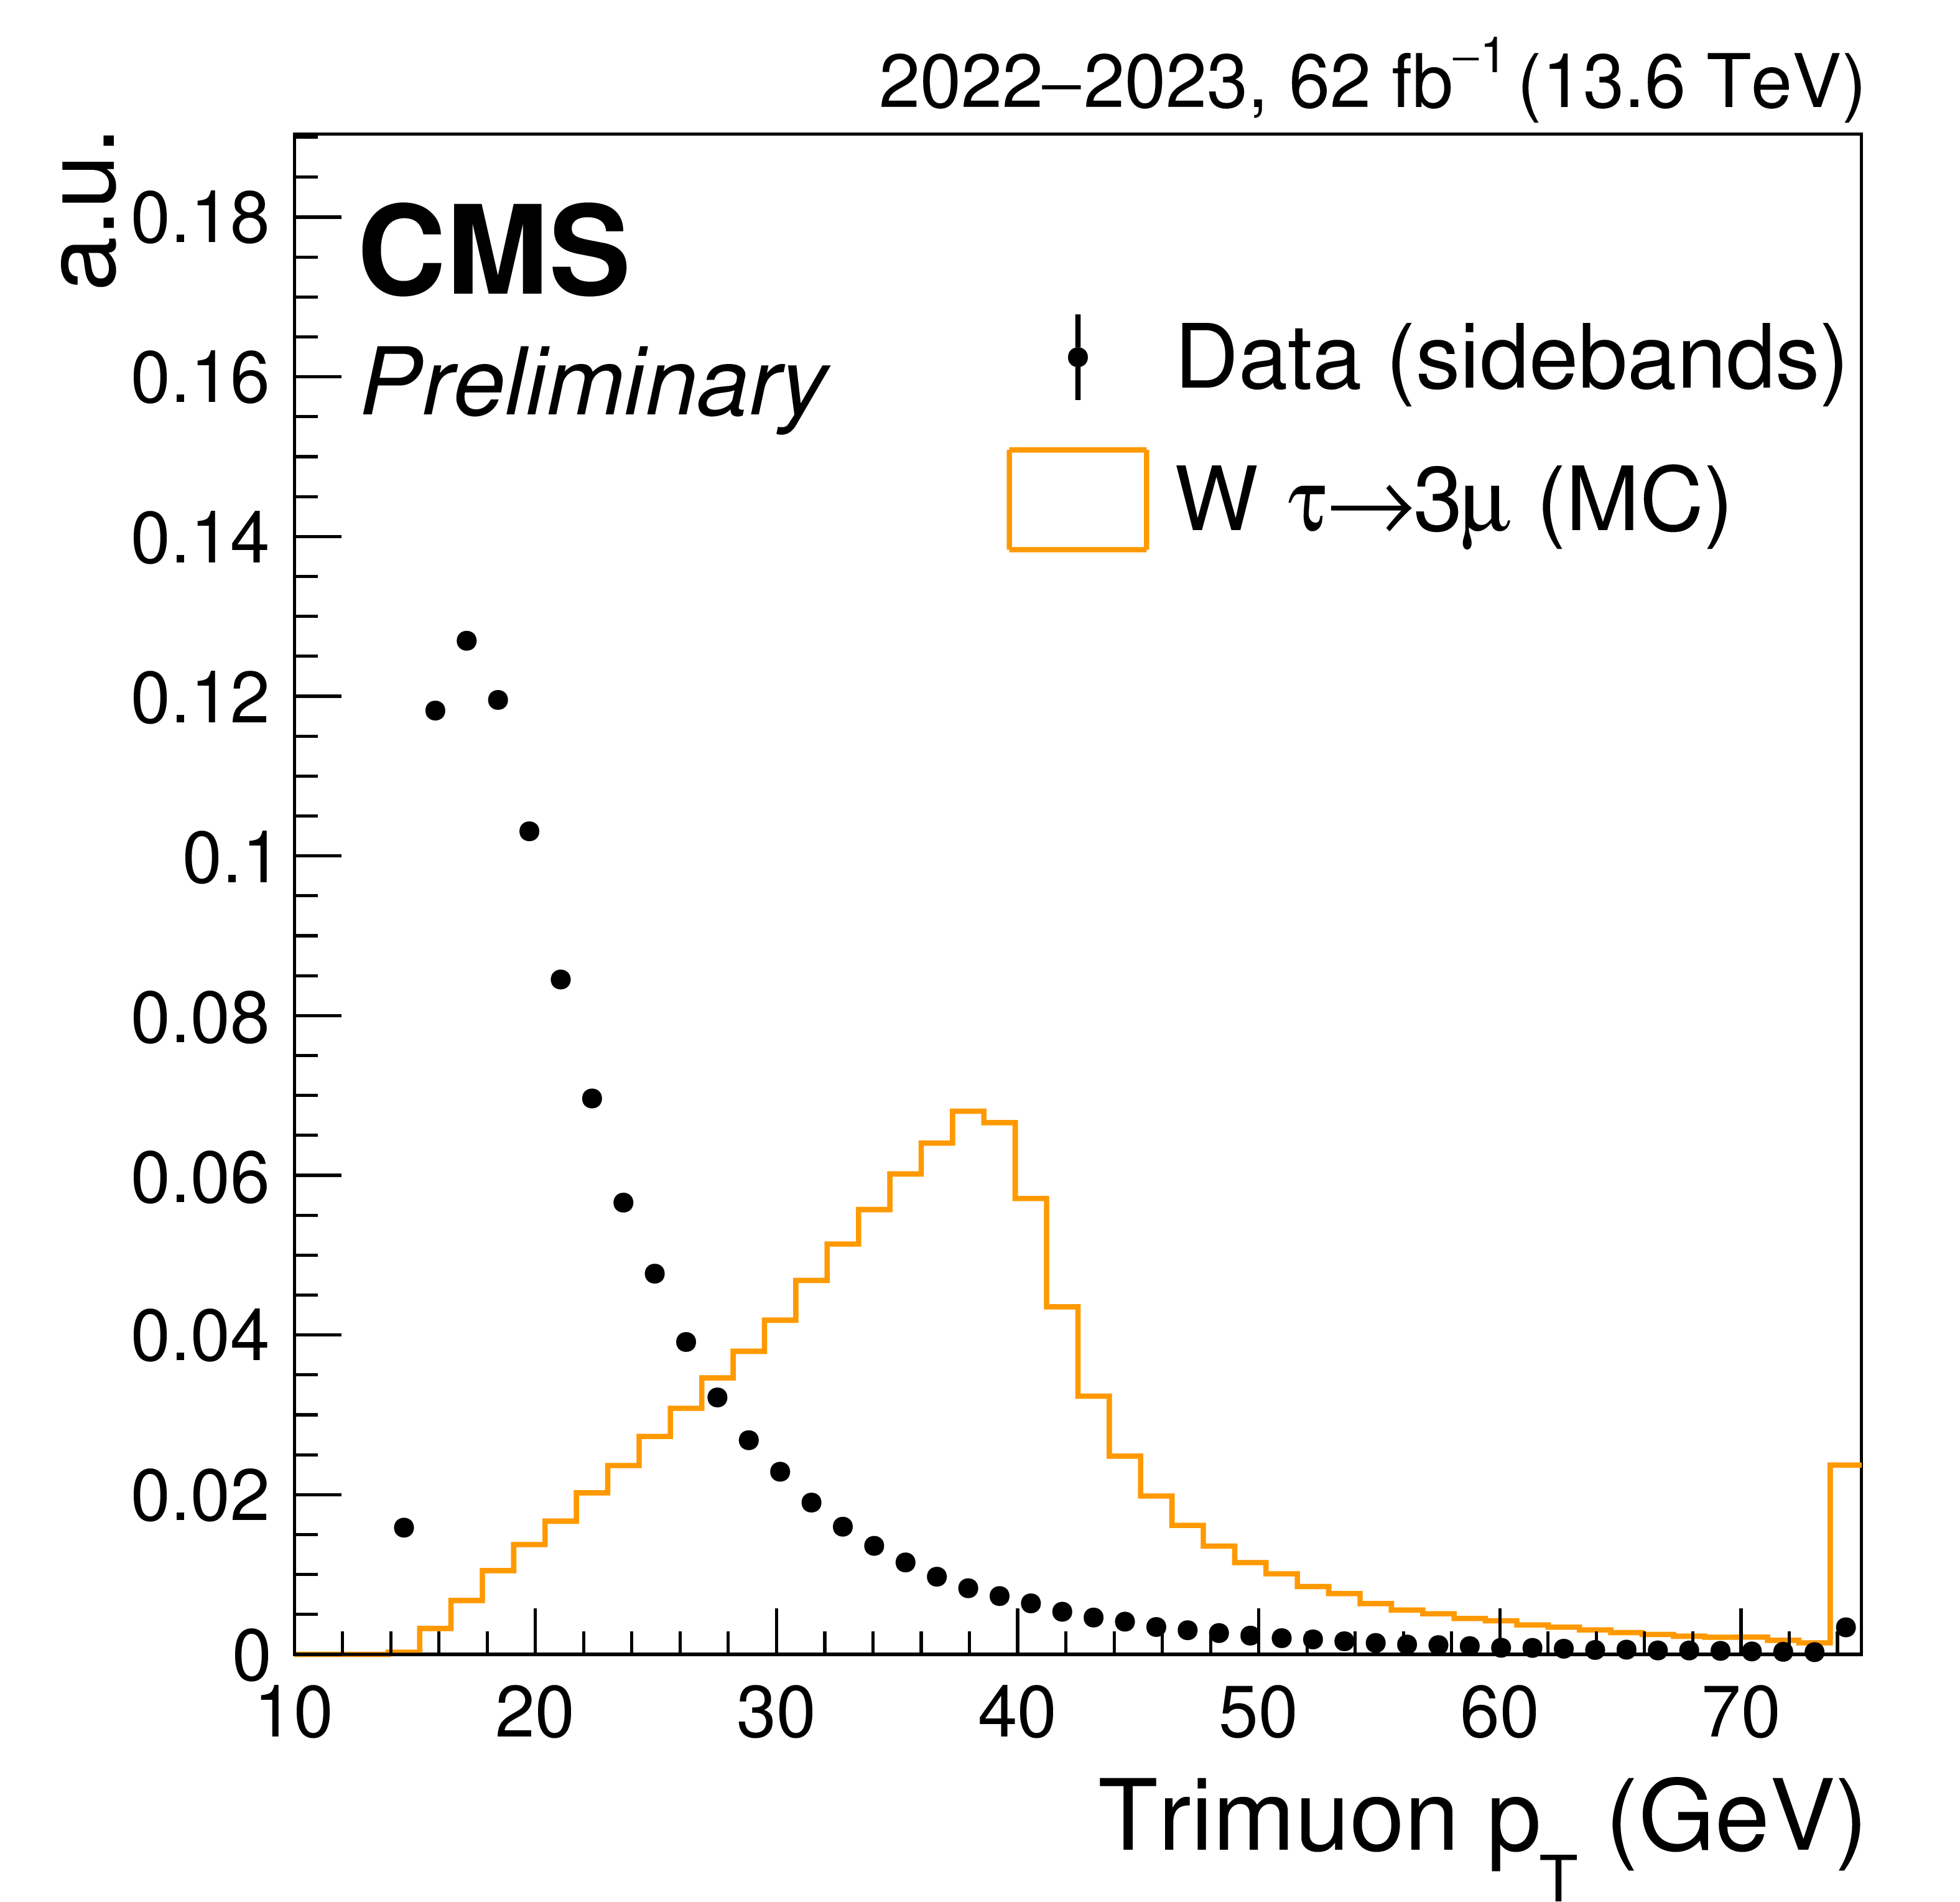
Figure 1:
Signal and background distributions for the four observables with the highest impact on the V channel BDT performance: the relative tau isolation (upper left), the $ \cos(\alpha_{\text{2D}}) $ (upper right), the transverse mass $ m_T $ (lower left), and the muon triplet total transverse momentum $ p_{\mathrm{T}}(3\mu) $ (lower right). The signal and background distribution are obtained respectively from simulated events in W boson decay and from data in mass sidebands, and normalized to unity. The first and last bins contain the underflow and overflow events, respectively. |
png pdf |
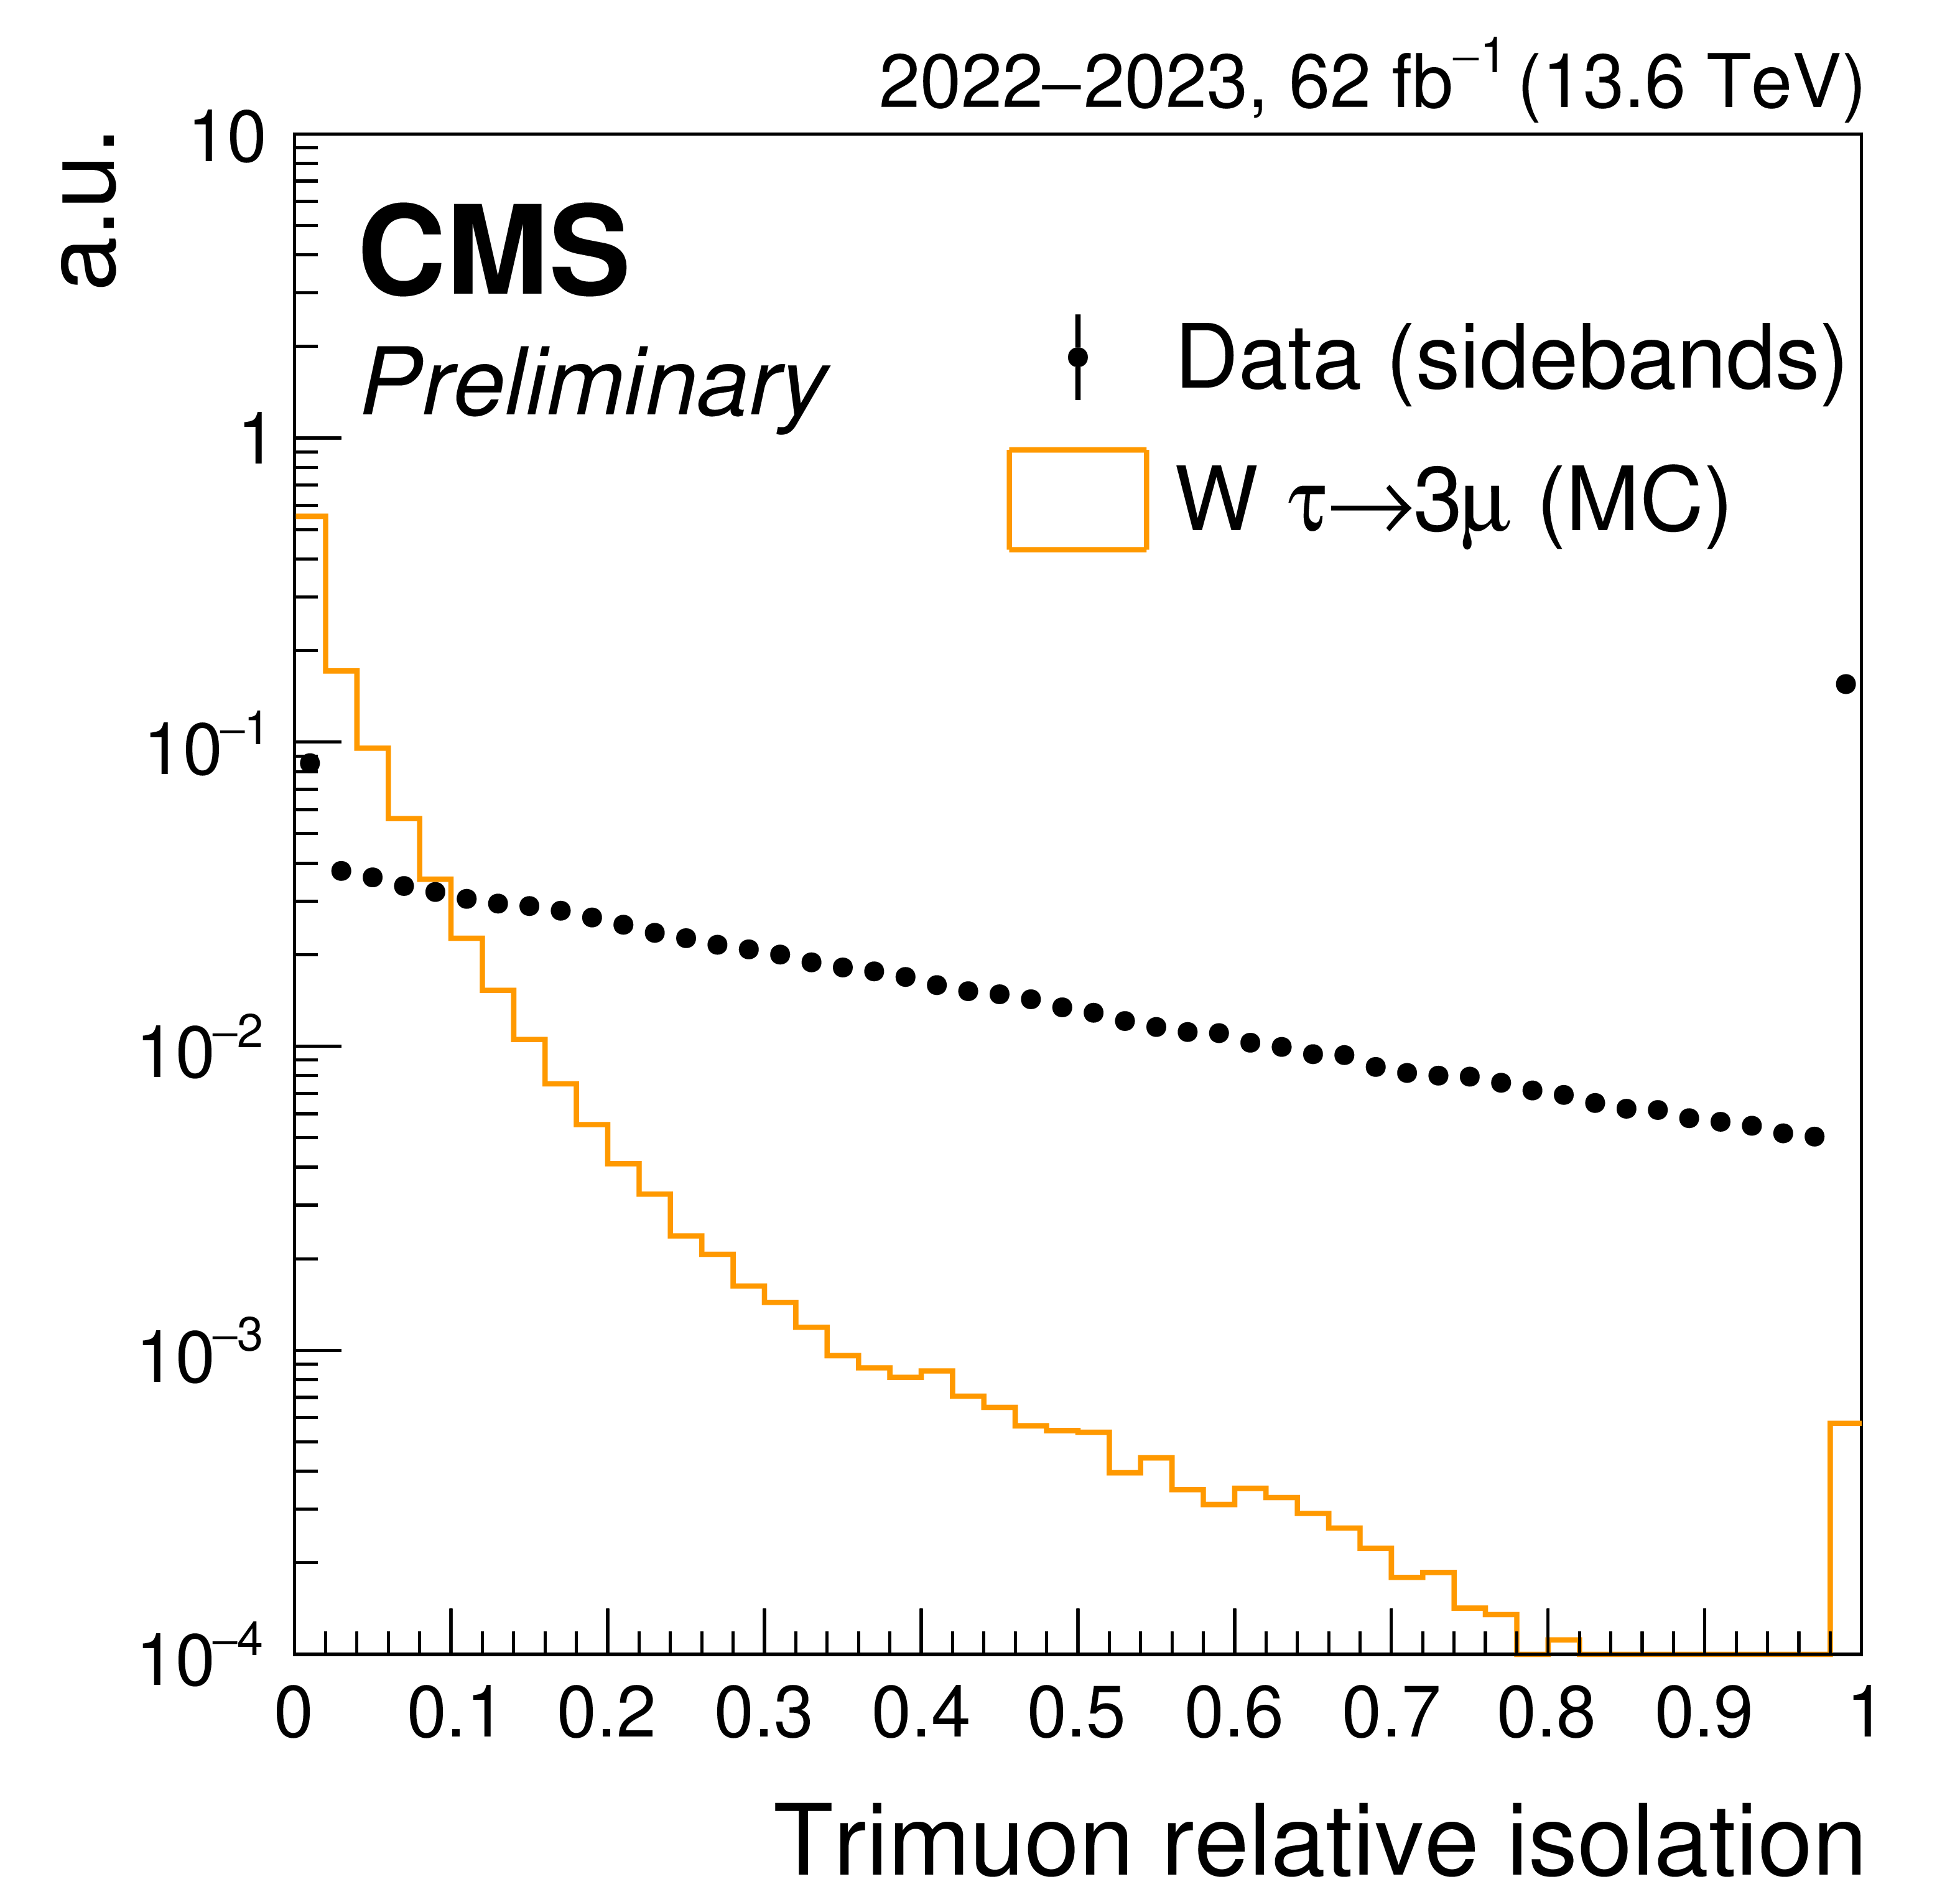
Figure 1-a:
Signal and background distributions for the four observables with the highest impact on the V channel BDT performance: the relative tau isolation (upper left), the $ \cos(\alpha_{\text{2D}}) $ (upper right), the transverse mass $ m_T $ (lower left), and the muon triplet total transverse momentum $ p_{\mathrm{T}}(3\mu) $ (lower right). The signal and background distribution are obtained respectively from simulated events in W boson decay and from data in mass sidebands, and normalized to unity. The first and last bins contain the underflow and overflow events, respectively. |
png pdf |
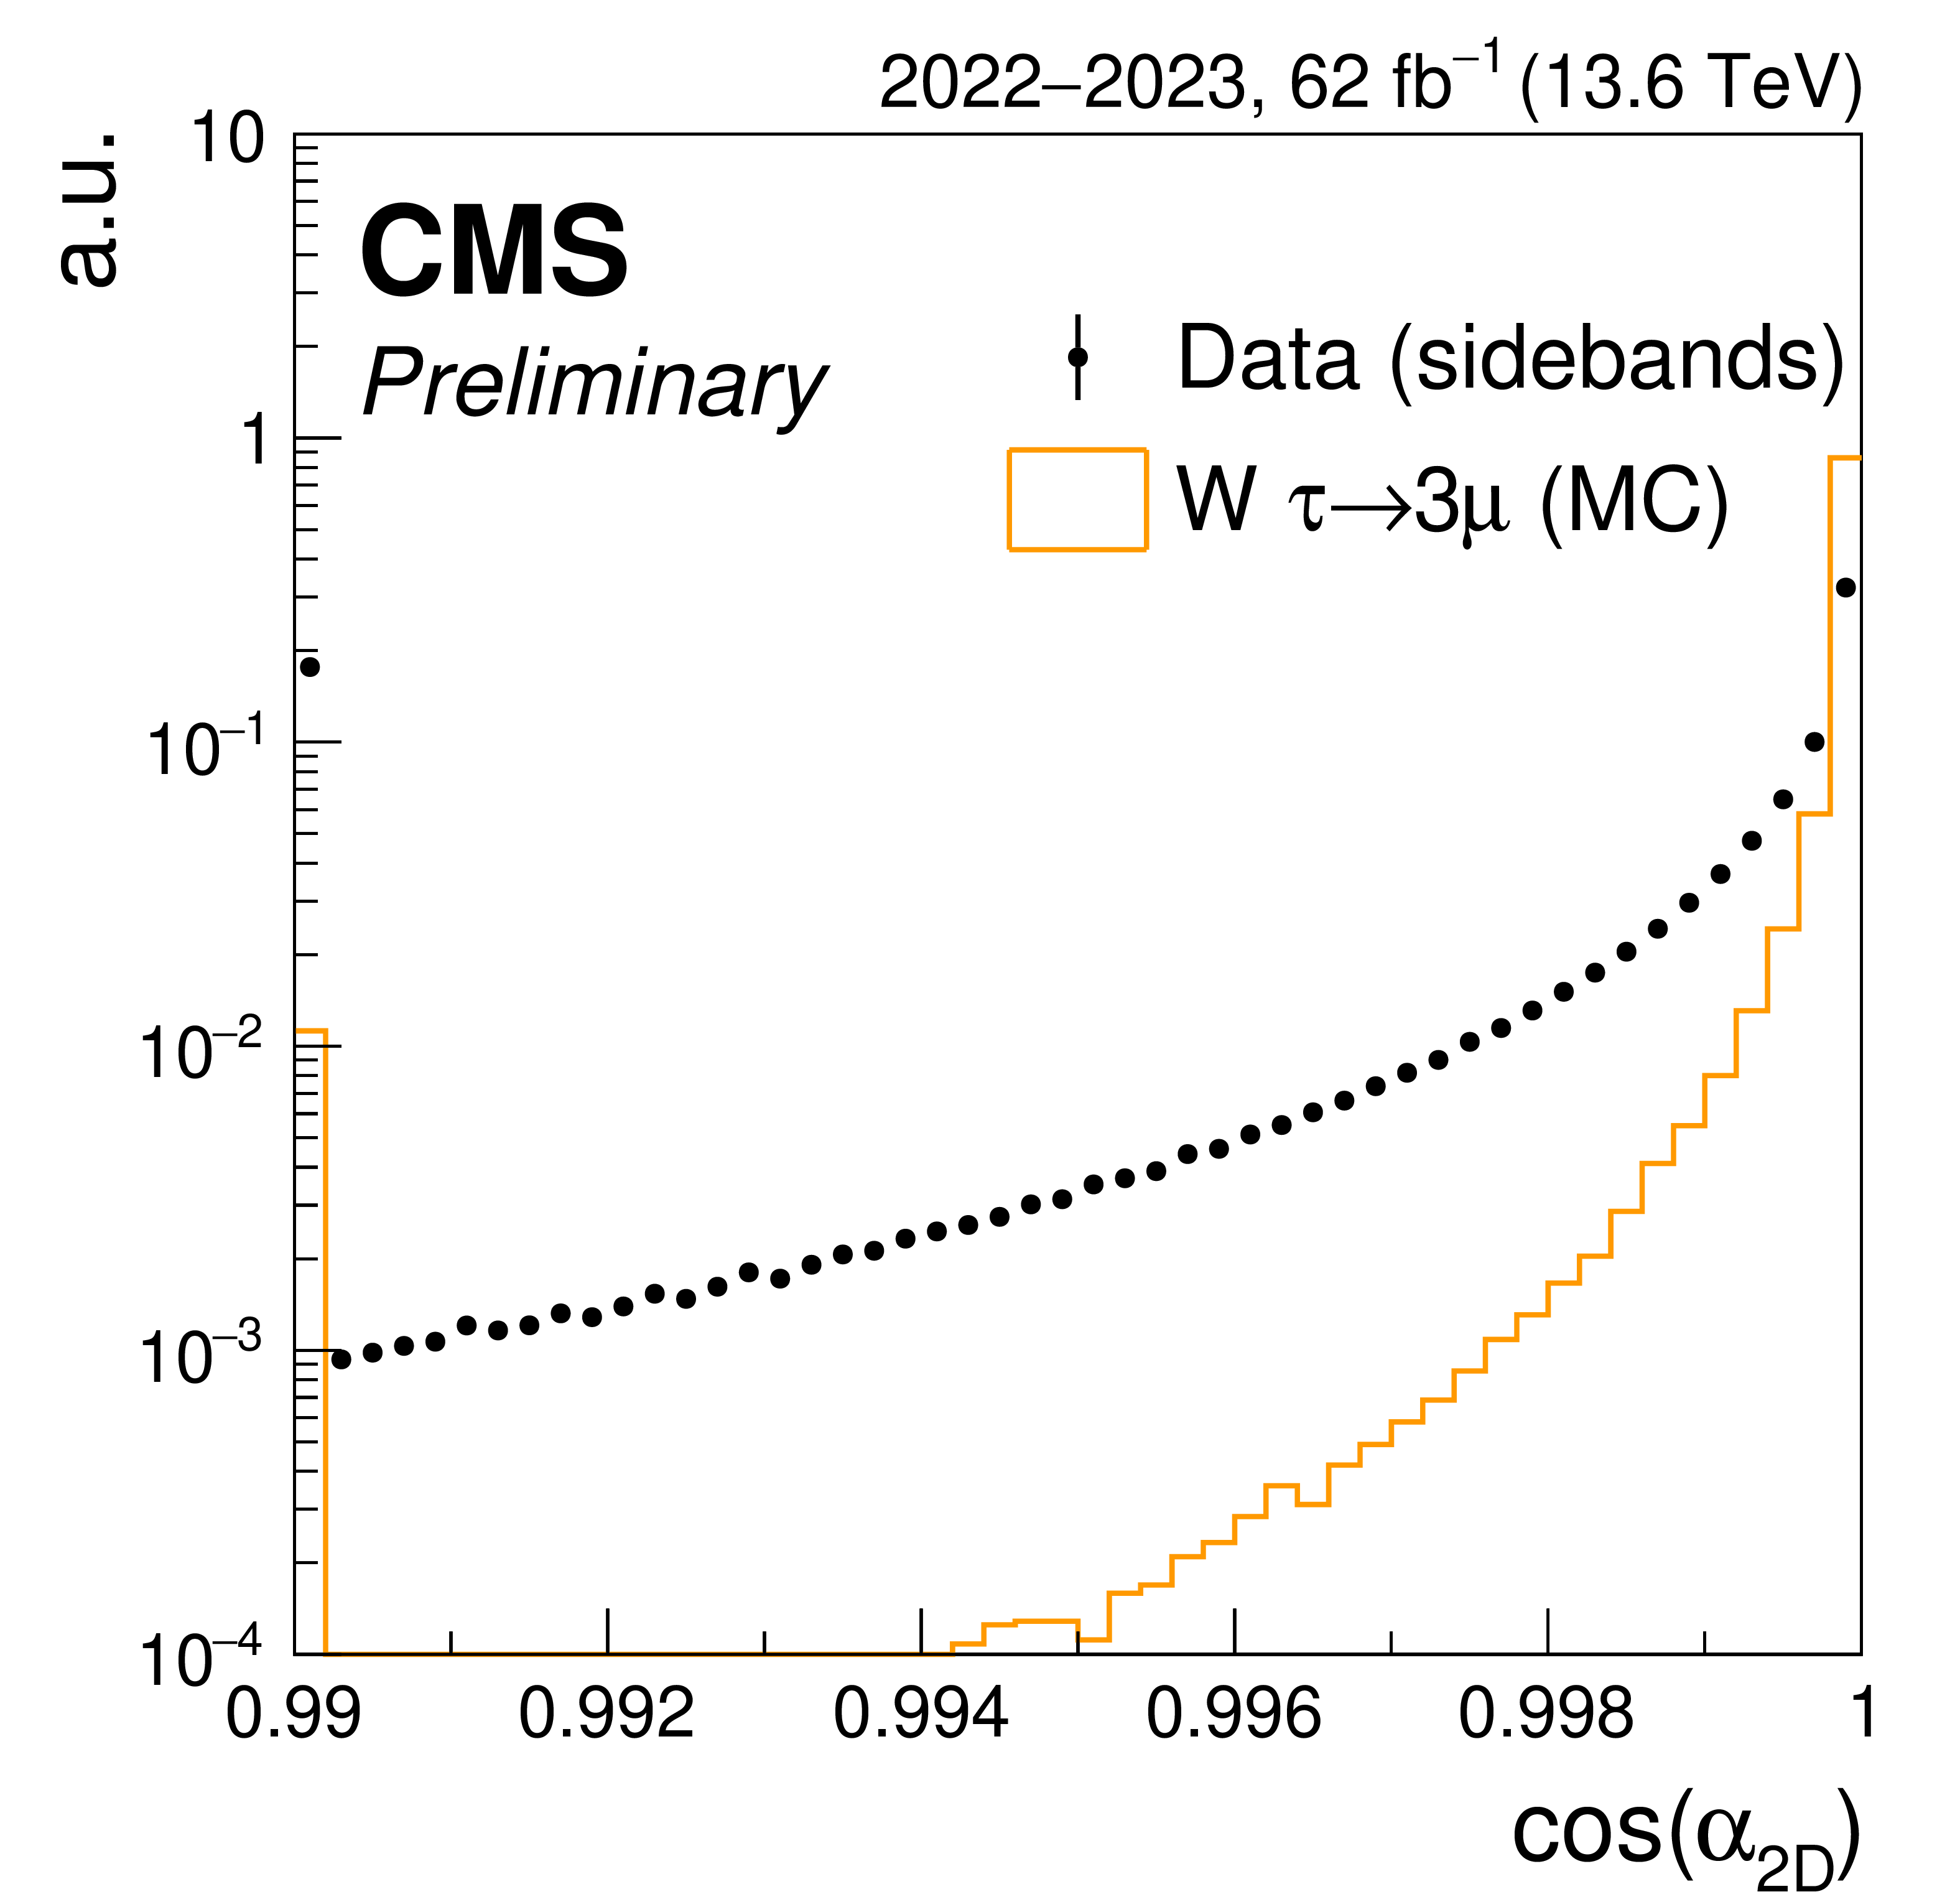
Figure 1-b:
Signal and background distributions for the four observables with the highest impact on the V channel BDT performance: the relative tau isolation (upper left), the $ \cos(\alpha_{\text{2D}}) $ (upper right), the transverse mass $ m_T $ (lower left), and the muon triplet total transverse momentum $ p_{\mathrm{T}}(3\mu) $ (lower right). The signal and background distribution are obtained respectively from simulated events in W boson decay and from data in mass sidebands, and normalized to unity. The first and last bins contain the underflow and overflow events, respectively. |
png pdf |
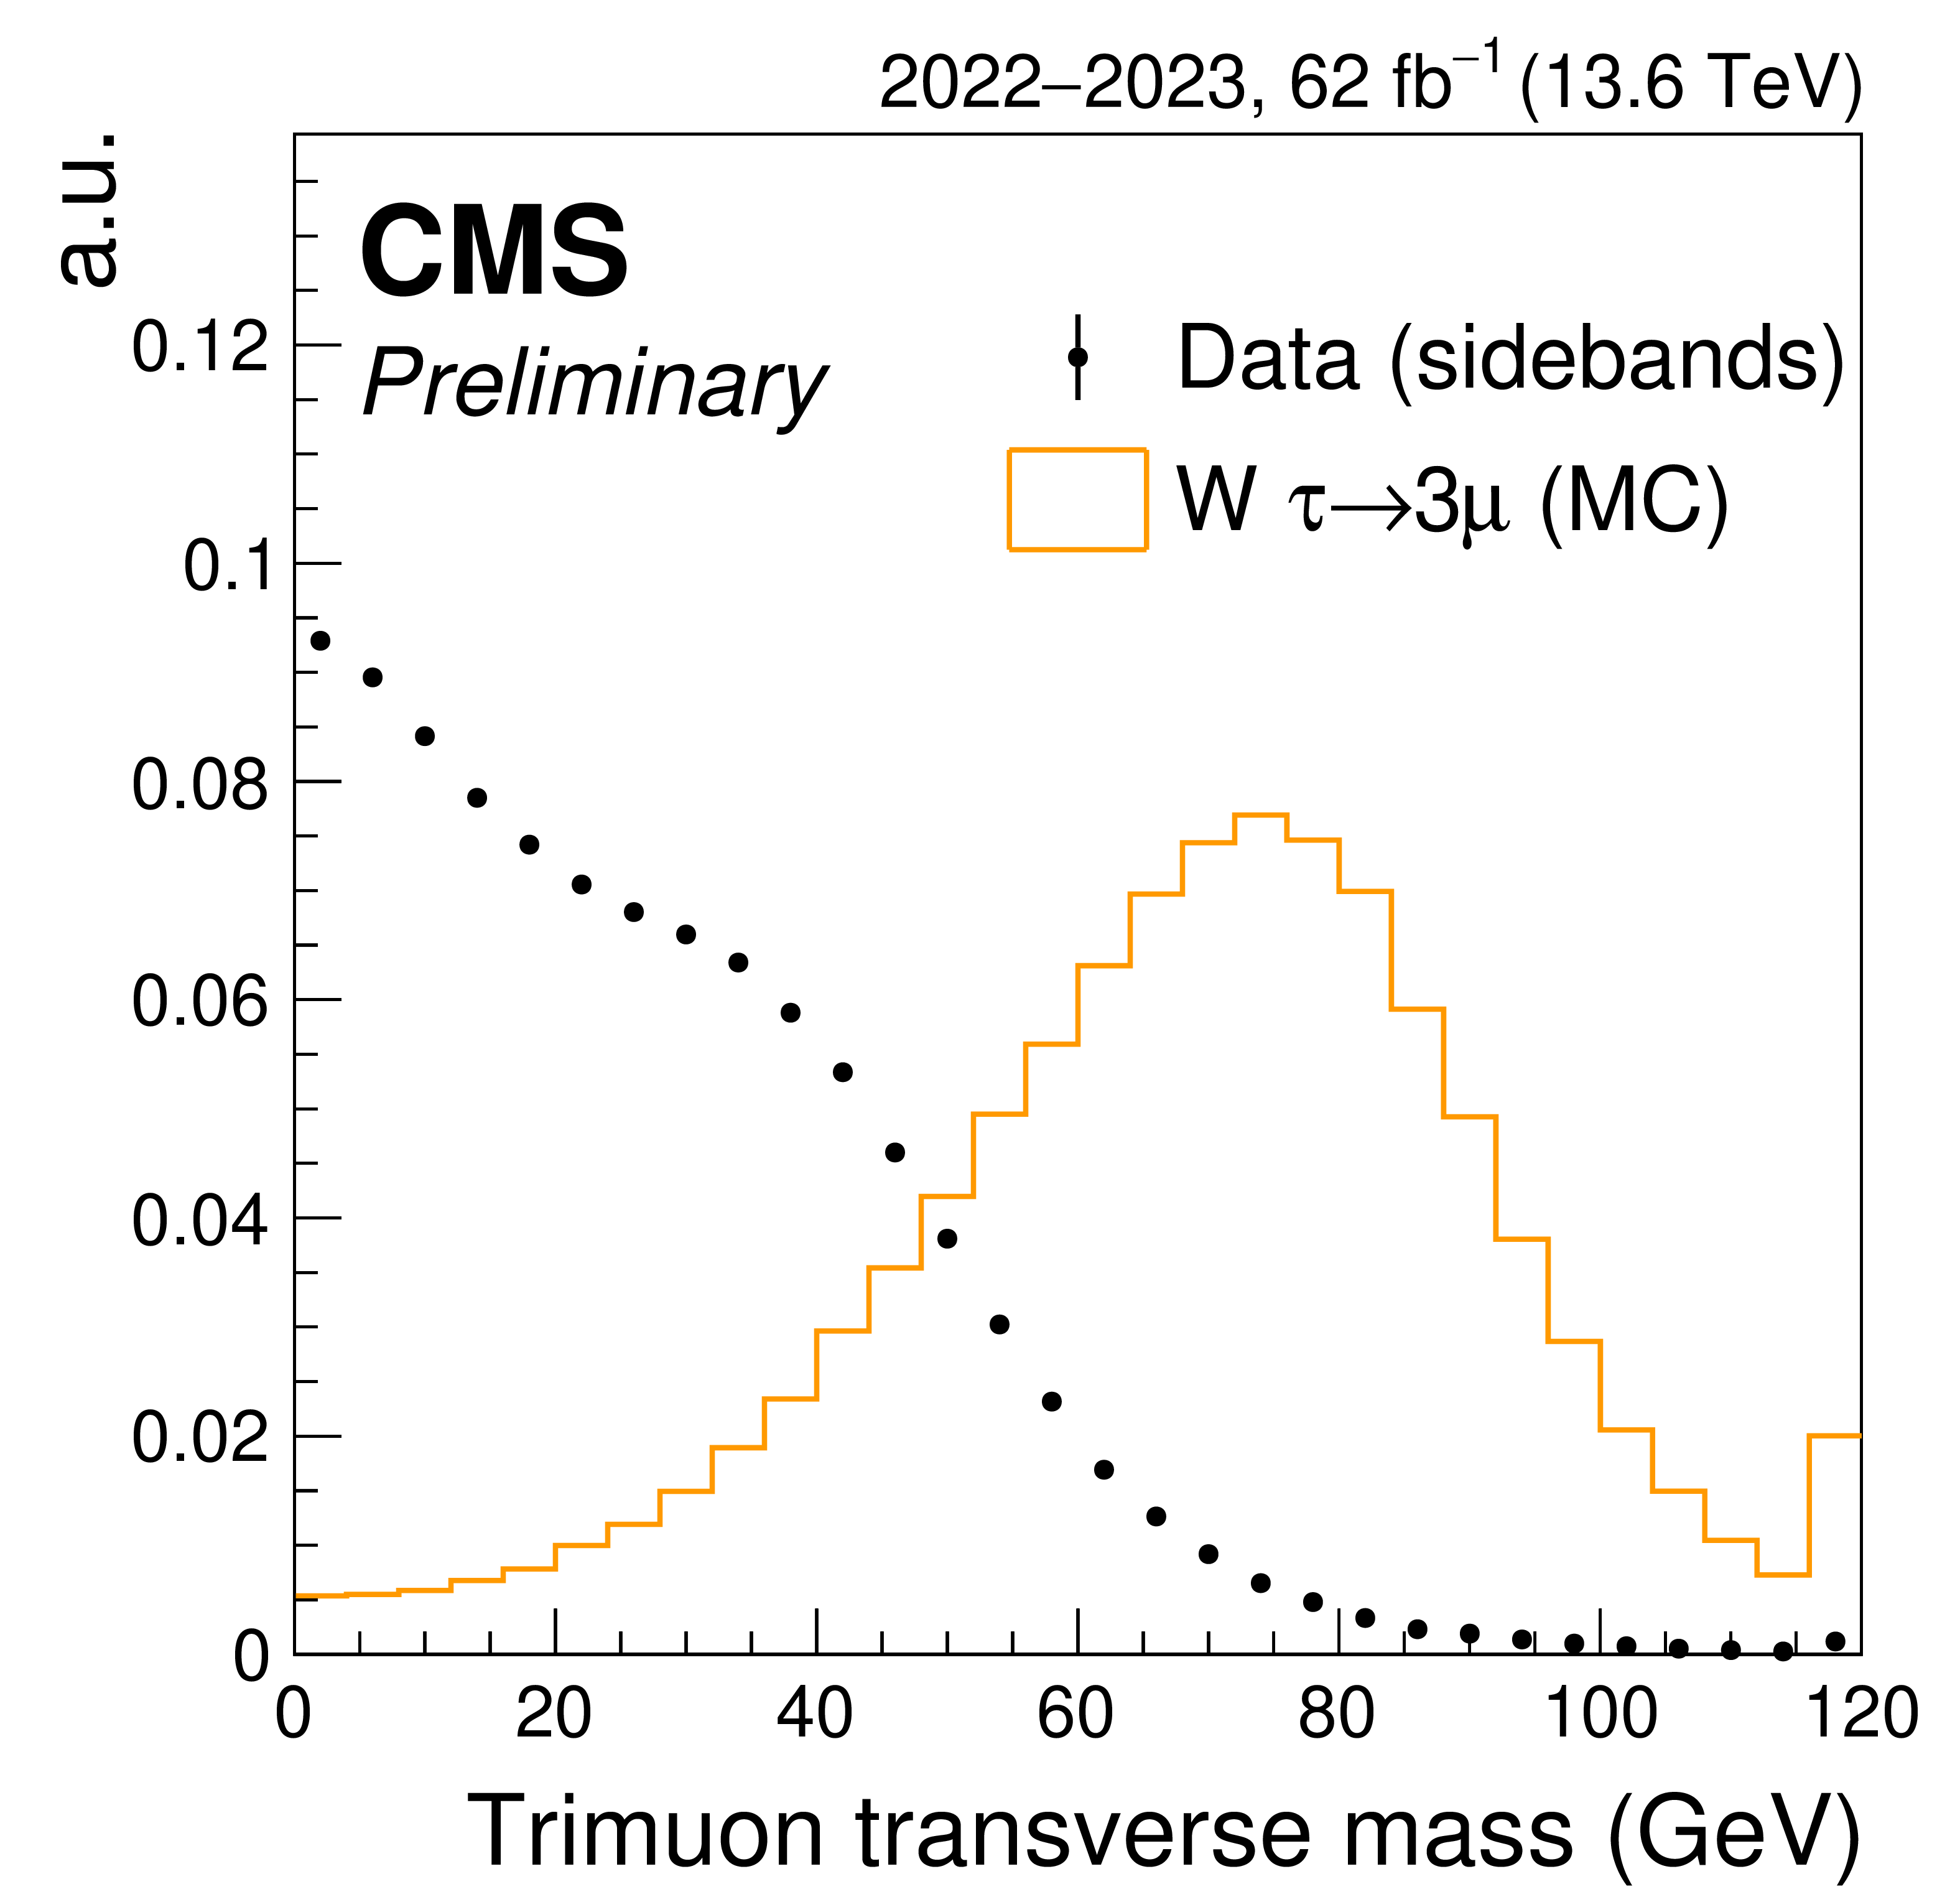
Figure 1-c:
Signal and background distributions for the four observables with the highest impact on the V channel BDT performance: the relative tau isolation (upper left), the $ \cos(\alpha_{\text{2D}}) $ (upper right), the transverse mass $ m_T $ (lower left), and the muon triplet total transverse momentum $ p_{\mathrm{T}}(3\mu) $ (lower right). The signal and background distribution are obtained respectively from simulated events in W boson decay and from data in mass sidebands, and normalized to unity. The first and last bins contain the underflow and overflow events, respectively. |
png pdf |
Figure 1-d:
Signal and background distributions for the four observables with the highest impact on the V channel BDT performance: the relative tau isolation (upper left), the $ \cos(\alpha_{\text{2D}}) $ (upper right), the transverse mass $ m_T $ (lower left), and the muon triplet total transverse momentum $ p_{\mathrm{T}}(3\mu) $ (lower right). The signal and background distribution are obtained respectively from simulated events in W boson decay and from data in mass sidebands, and normalized to unity. The first and last bins contain the underflow and overflow events, respectively. |
png pdf |
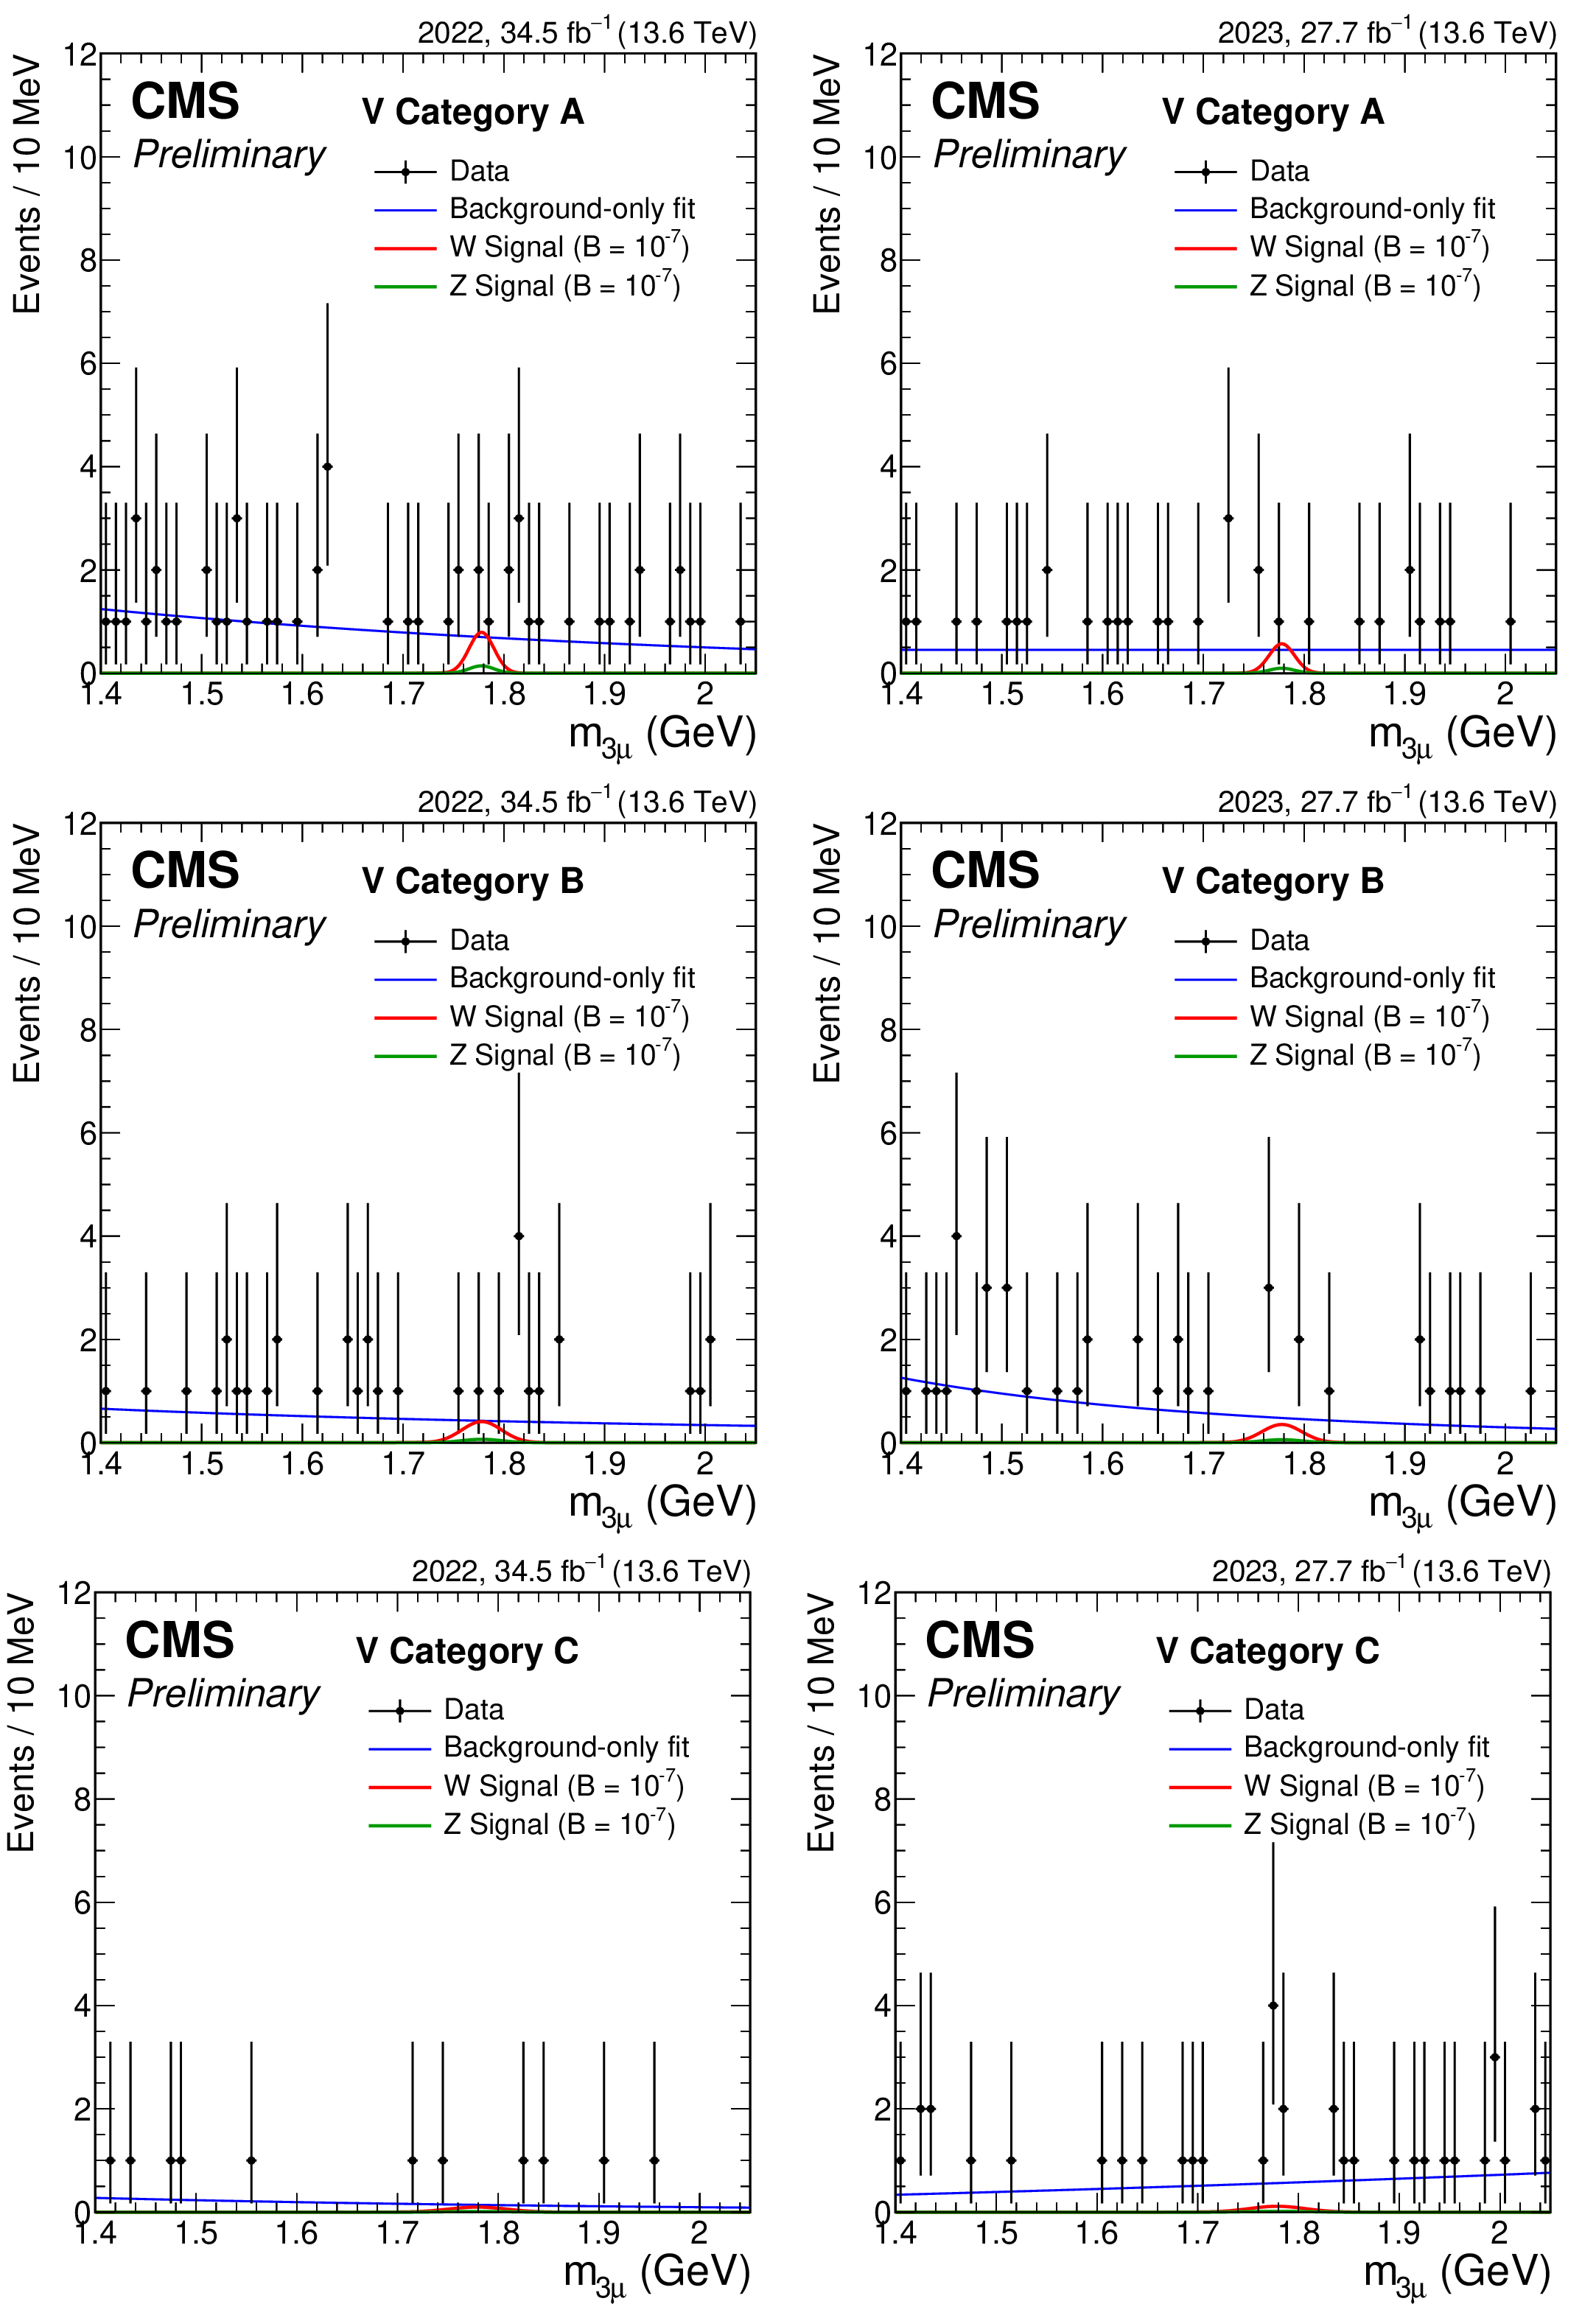
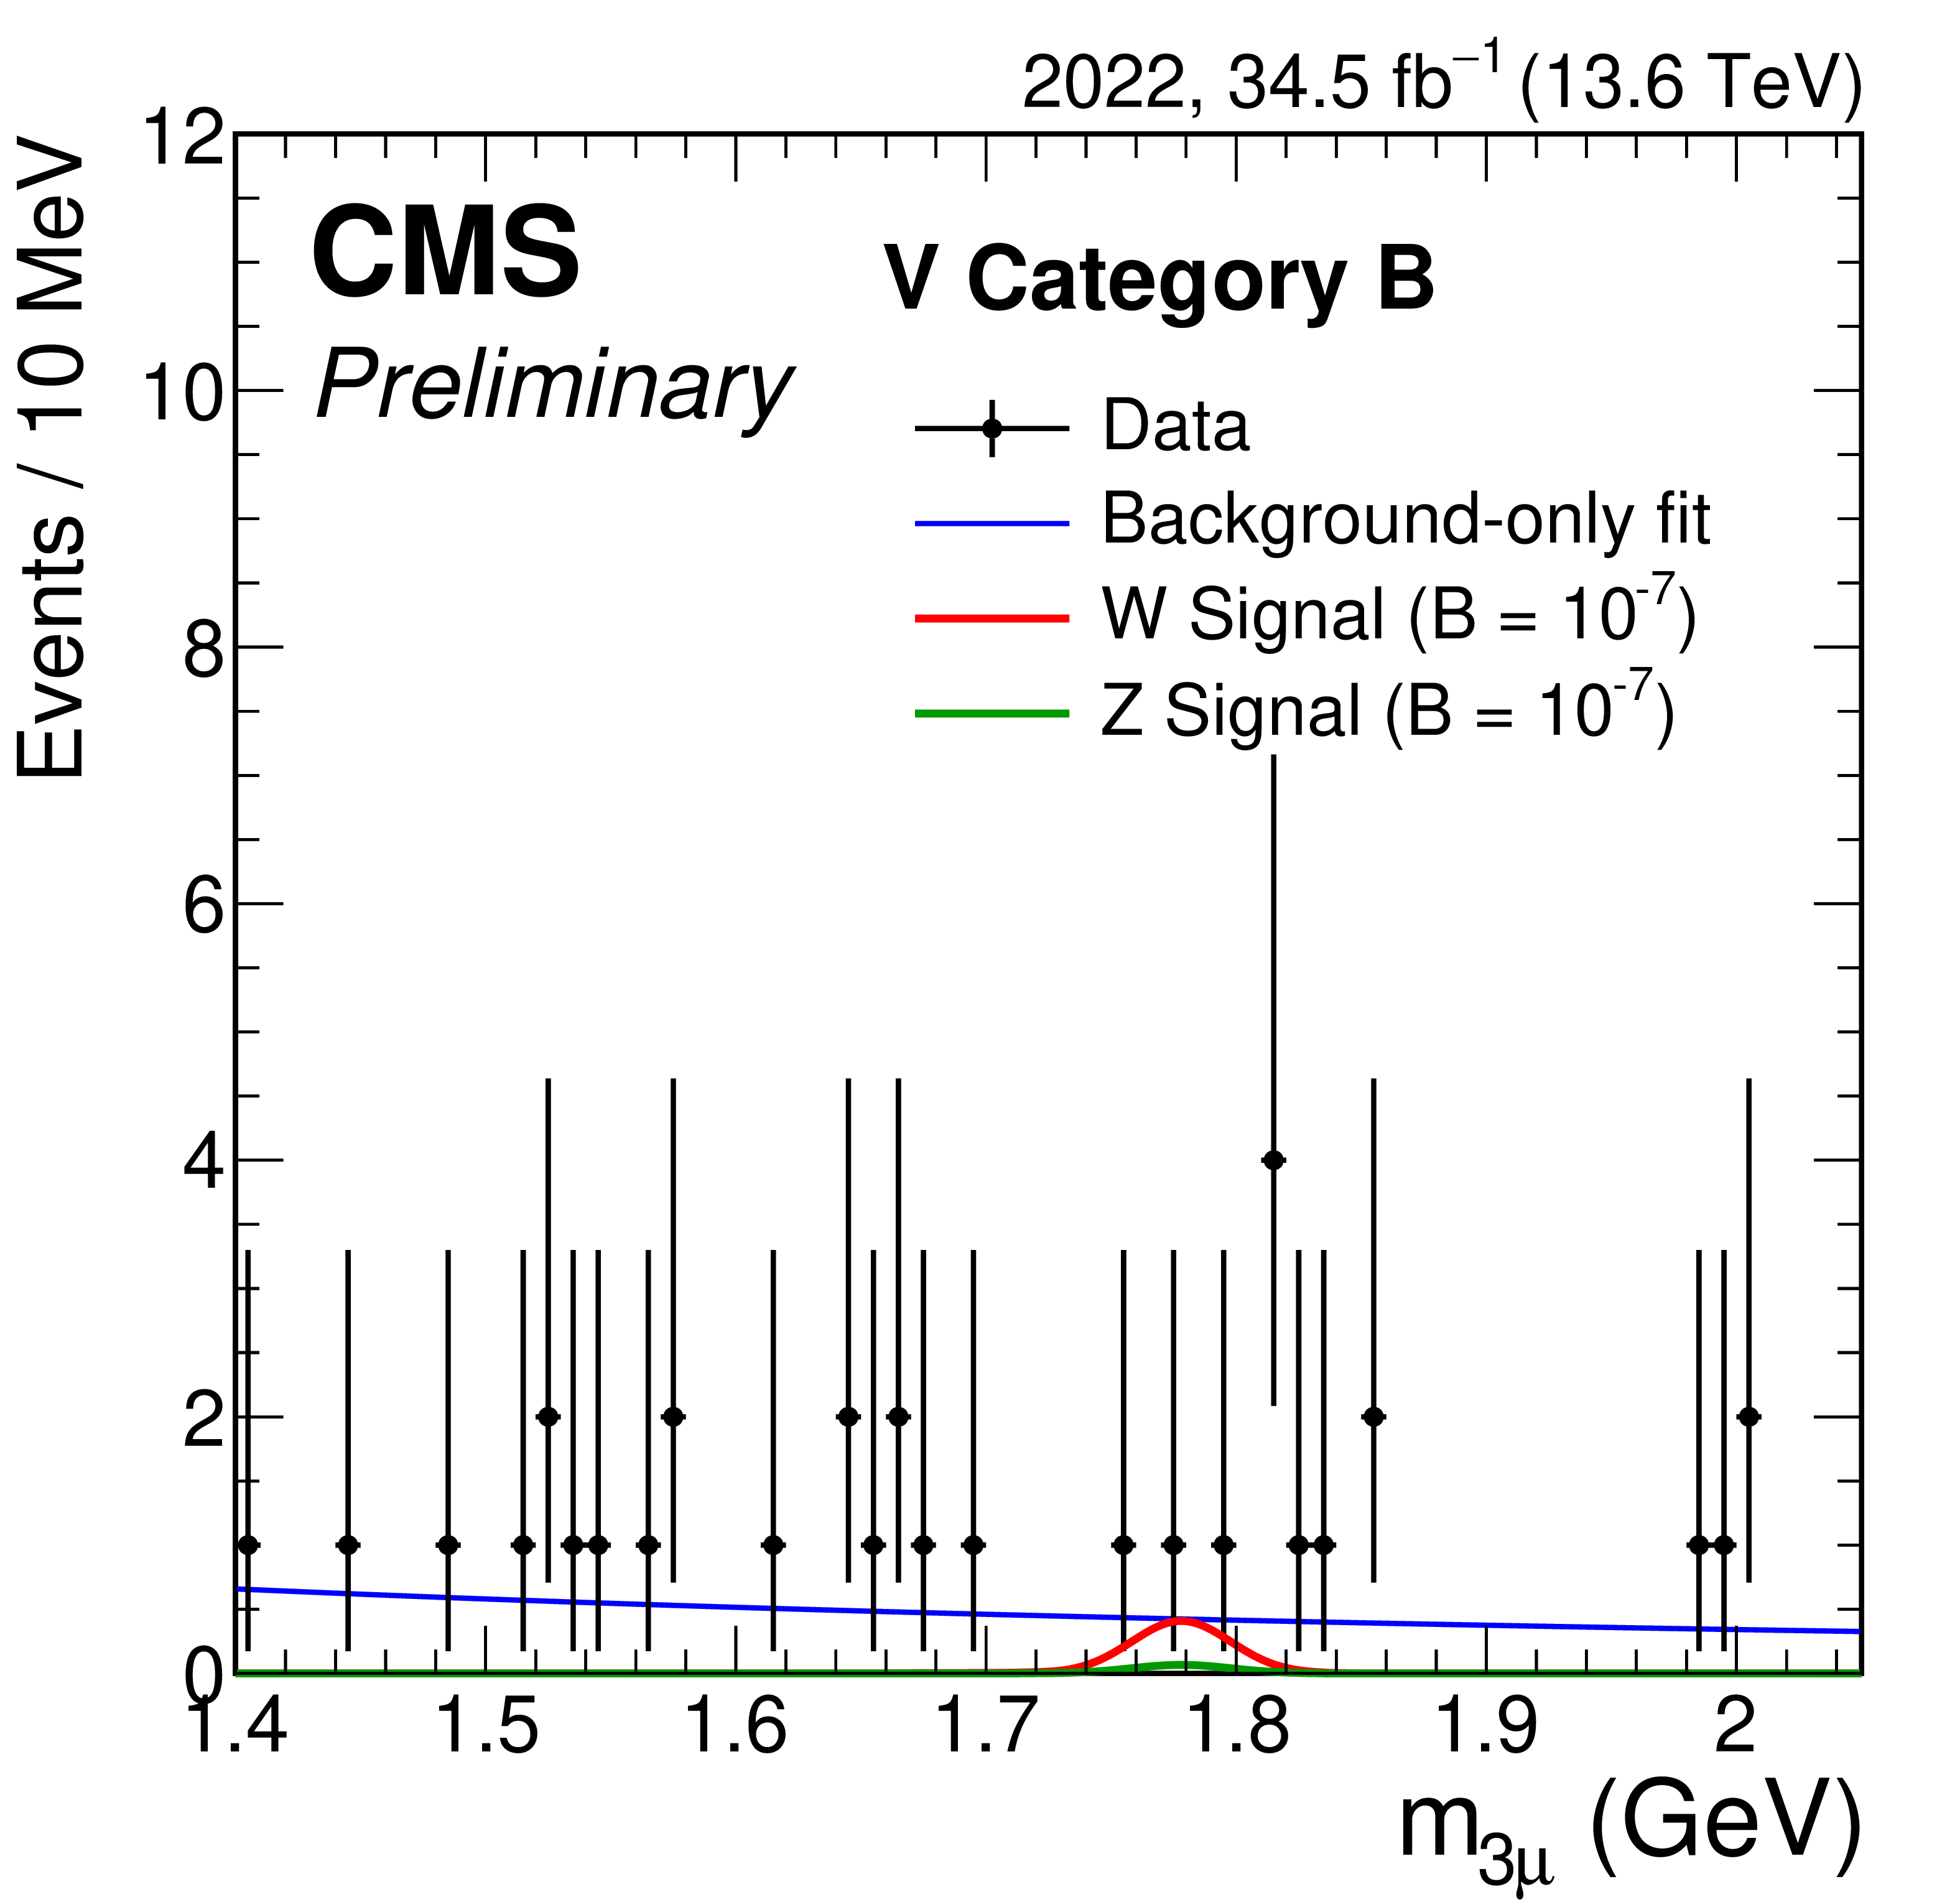
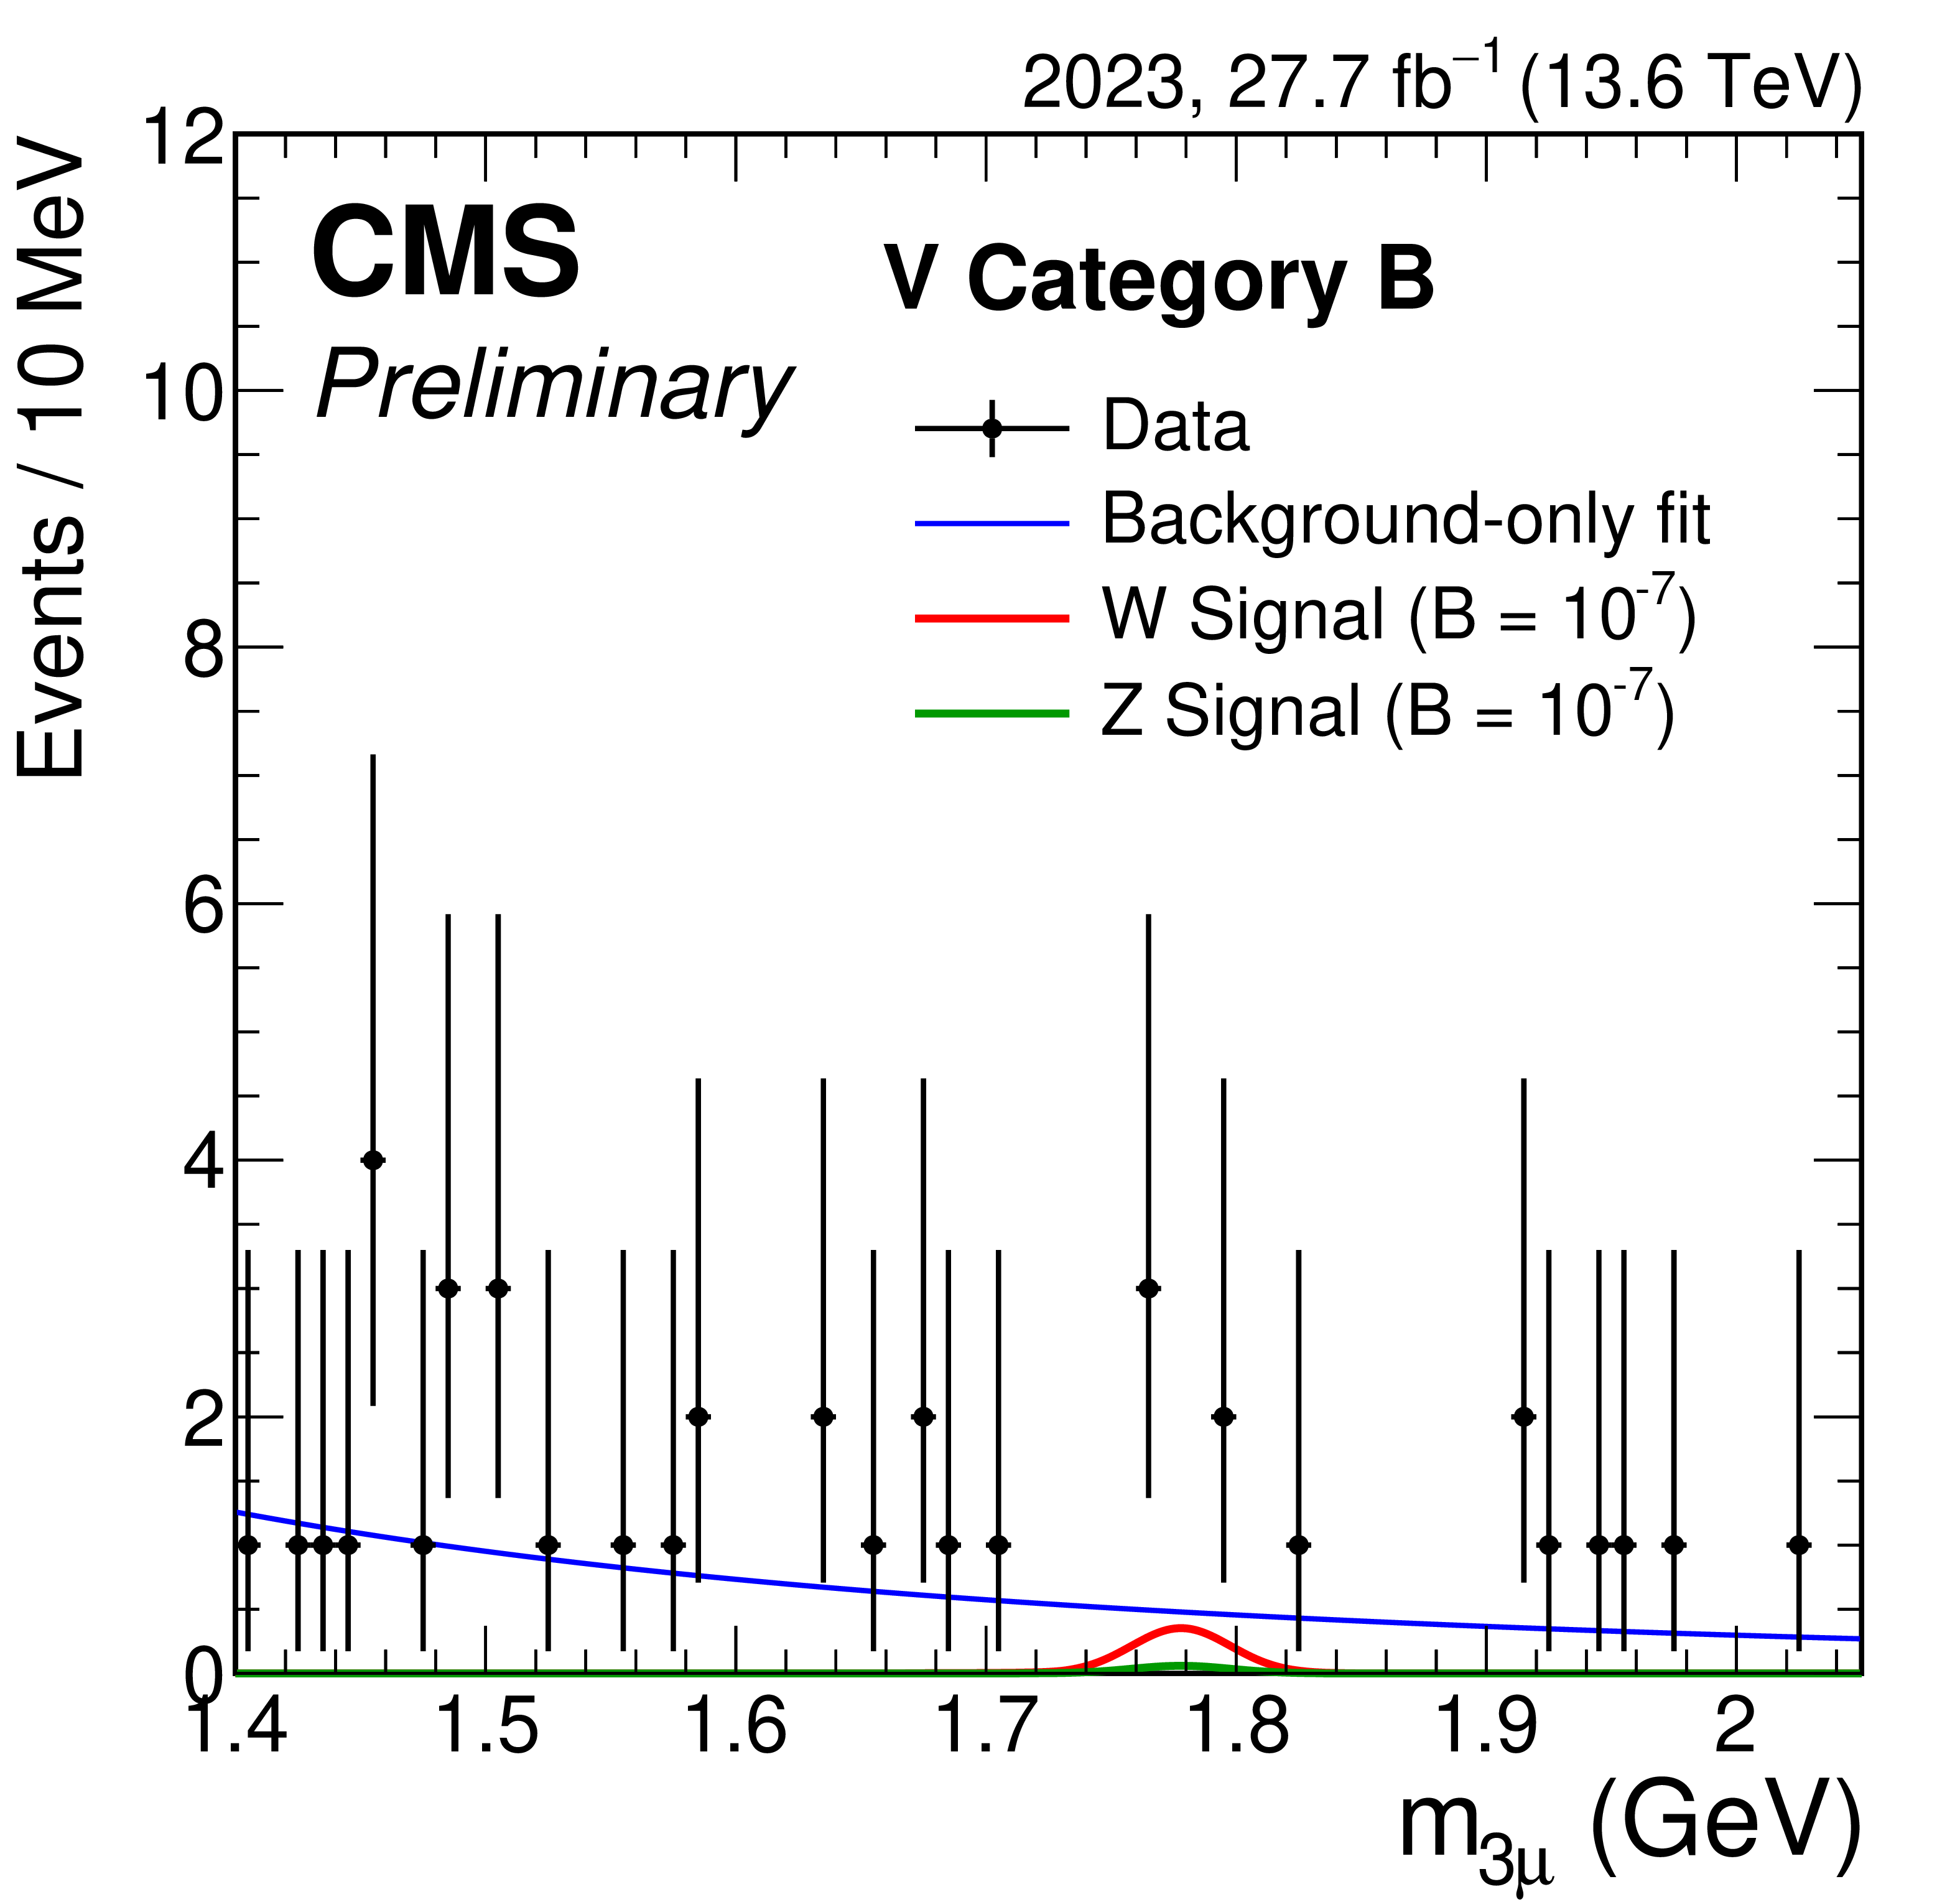
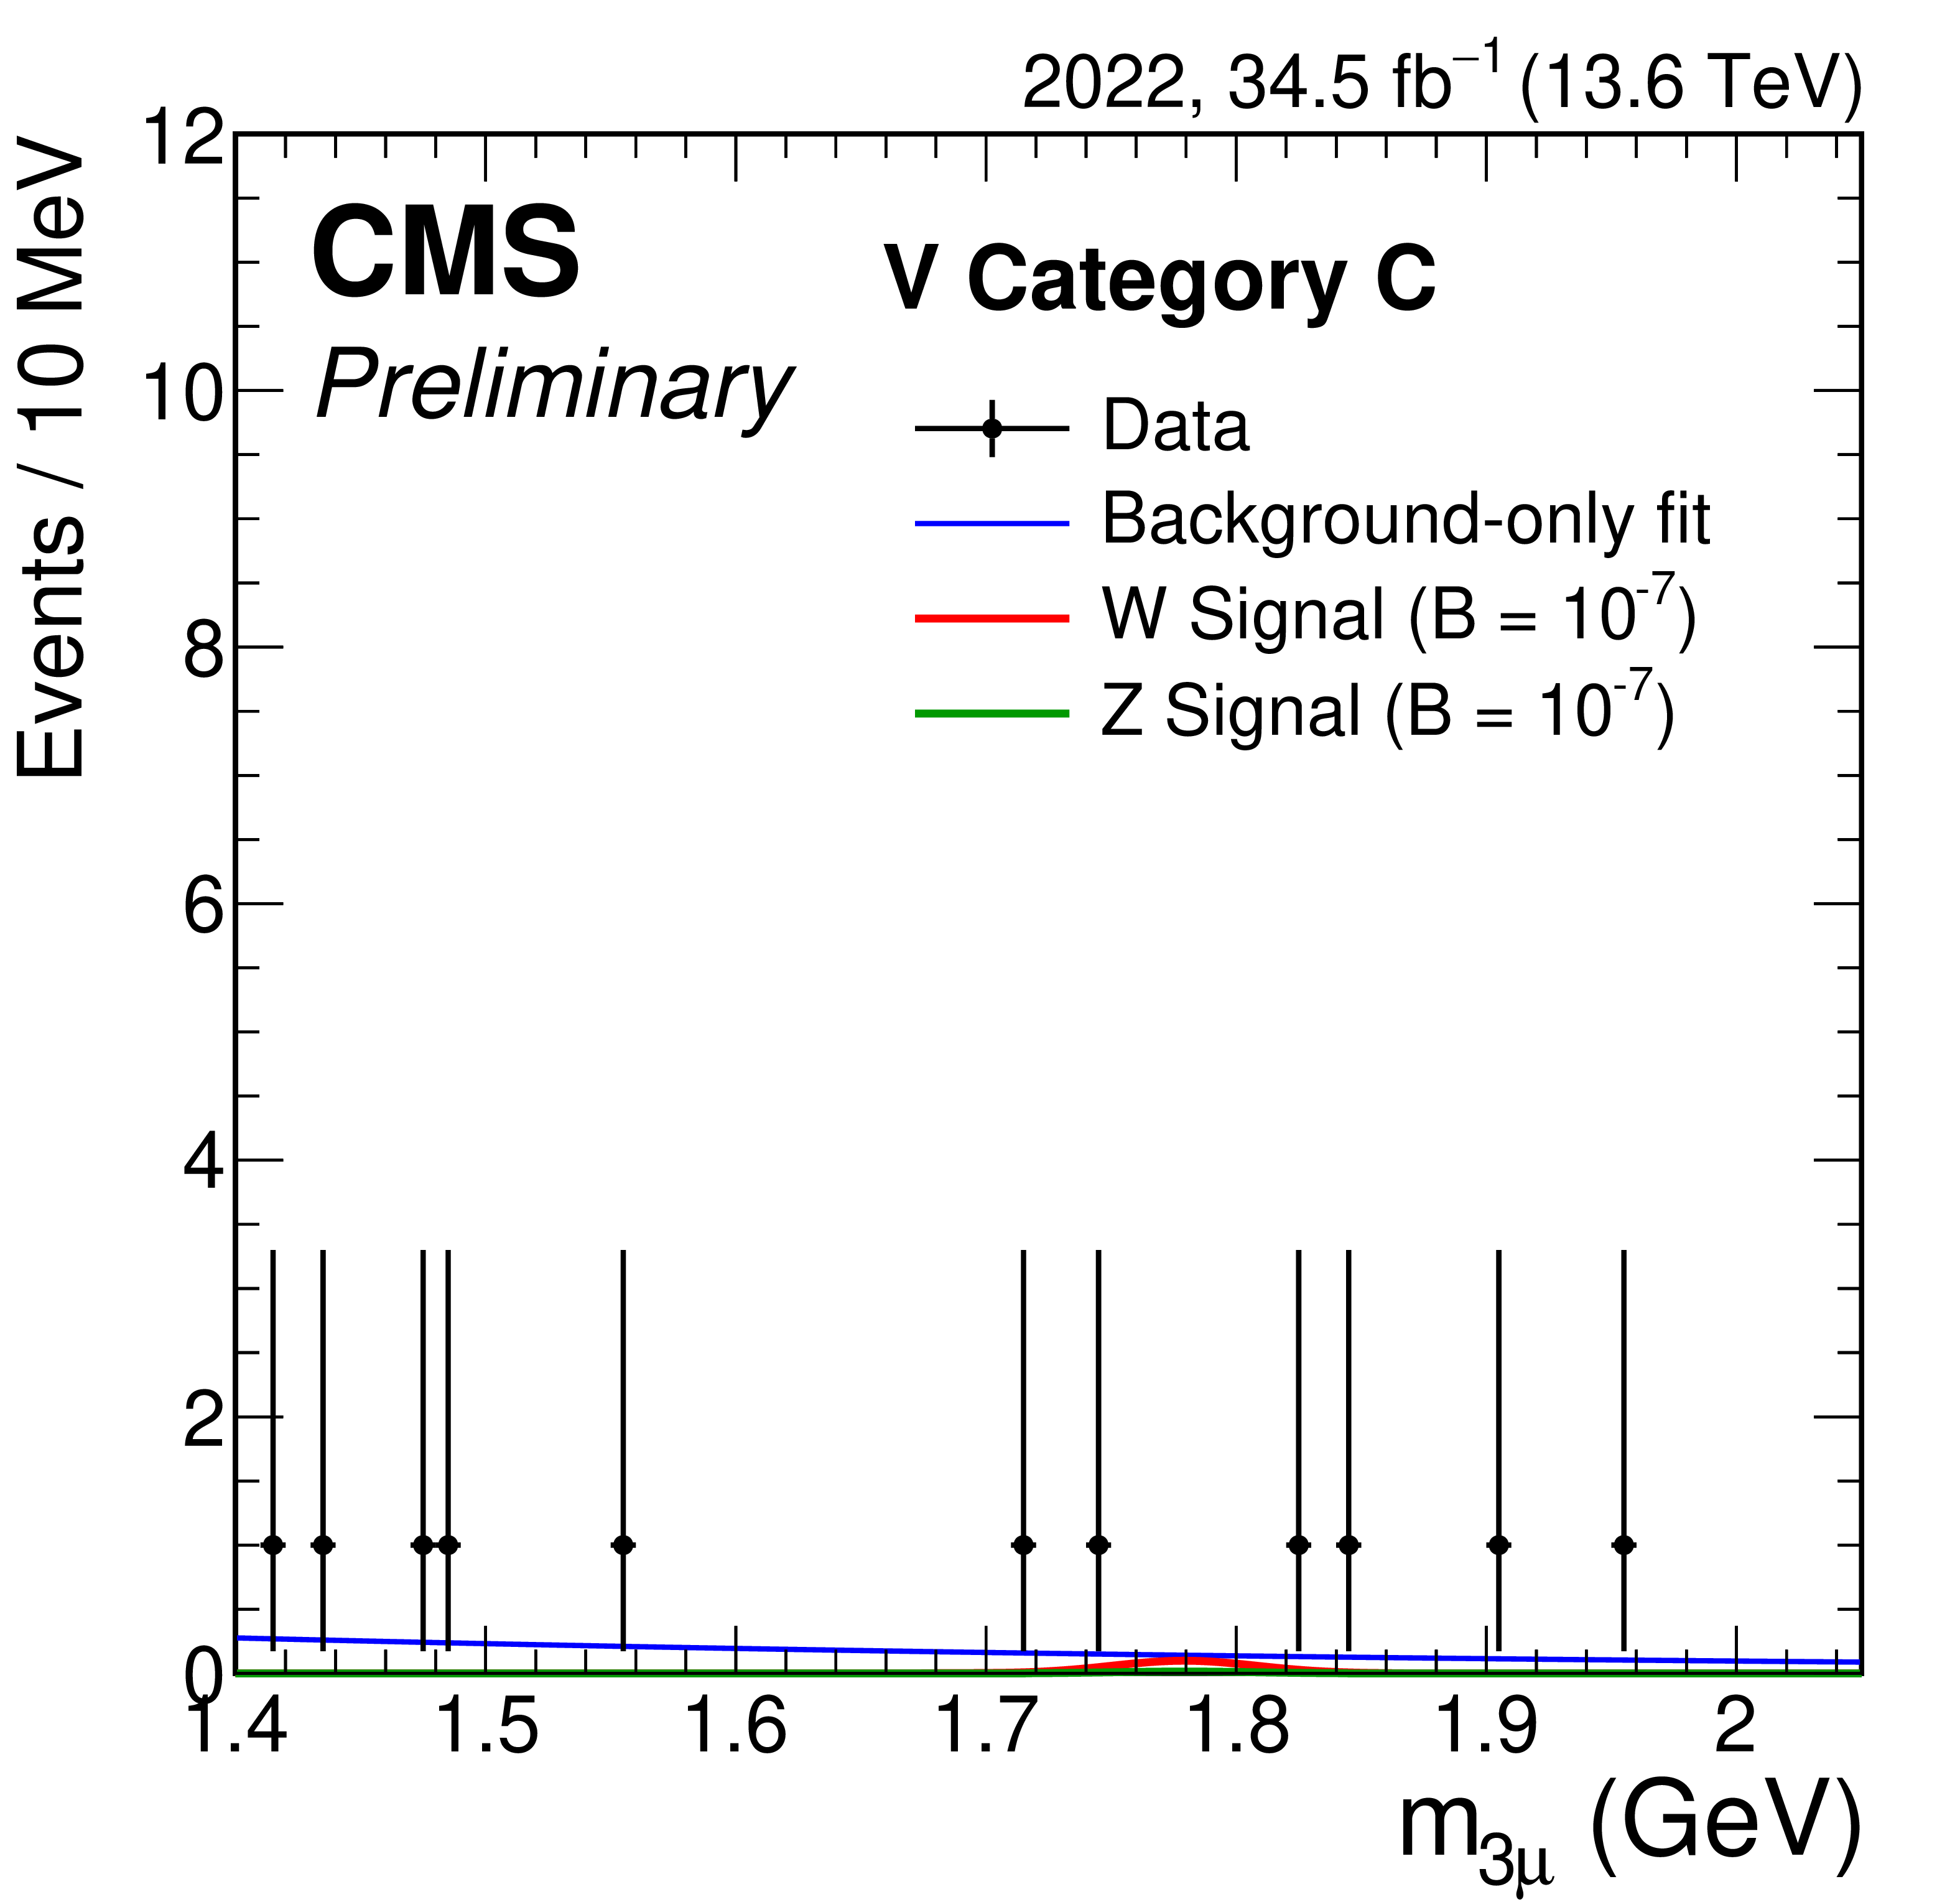
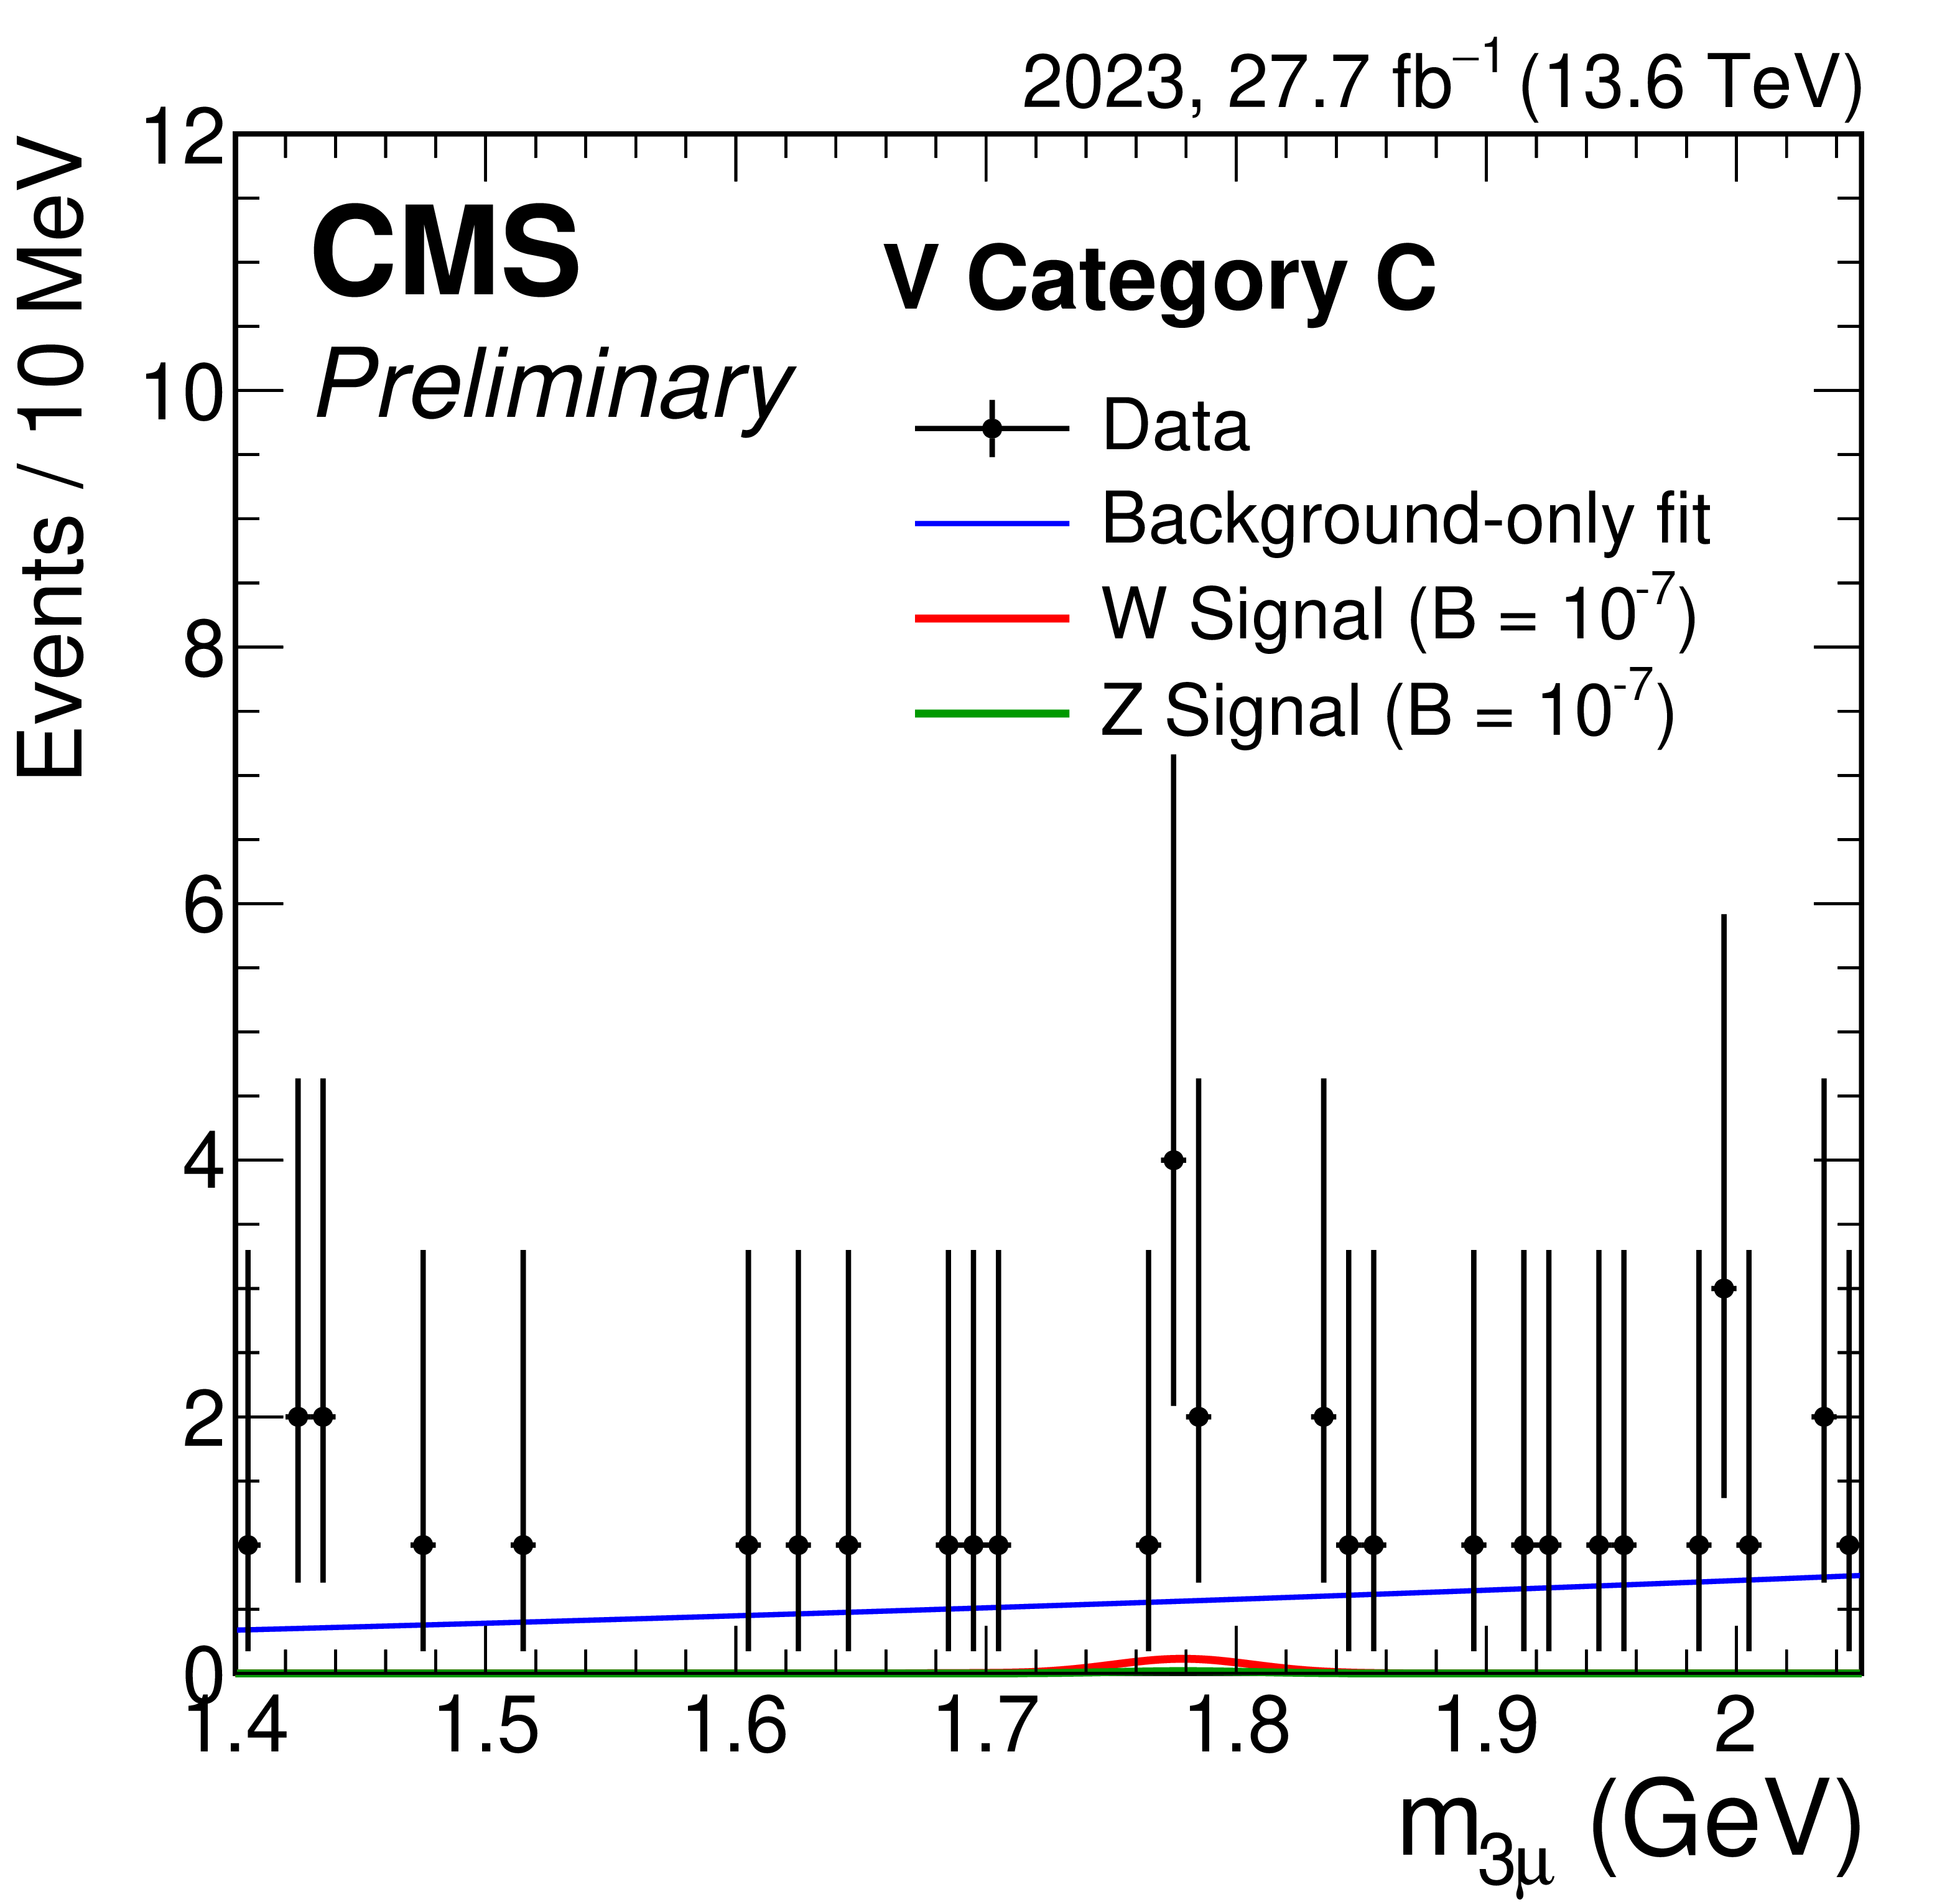
Figure 2:
Trimuon mass distributions of the 2022 (left) and 2023 (right) data events in the three $ |\eta| $ categories A (upper row), B (middle row) and C (lower row) of the V channel analysis. Data are shown with black markers, and the blue line represents the background-only fit to data in the sidebands. Expected signal distribution for $ \mathcal{B}(\tau \!\to\! 3\mu) $ from W (Z) boson decay is shown in red (green). |
png pdf |
Figure 2-a:
Trimuon mass distributions of the 2022 (left) and 2023 (right) data events in the three $ |\eta| $ categories A (upper row), B (middle row) and C (lower row) of the V channel analysis. Data are shown with black markers, and the blue line represents the background-only fit to data in the sidebands. Expected signal distribution for $ \mathcal{B}(\tau \!\to\! 3\mu) $ from W (Z) boson decay is shown in red (green). |
png pdf |
Figure 2-b:
Trimuon mass distributions of the 2022 (left) and 2023 (right) data events in the three $ |\eta| $ categories A (upper row), B (middle row) and C (lower row) of the V channel analysis. Data are shown with black markers, and the blue line represents the background-only fit to data in the sidebands. Expected signal distribution for $ \mathcal{B}(\tau \!\to\! 3\mu) $ from W (Z) boson decay is shown in red (green). |
png pdf |
Figure 2-c:
Trimuon mass distributions of the 2022 (left) and 2023 (right) data events in the three $ |\eta| $ categories A (upper row), B (middle row) and C (lower row) of the V channel analysis. Data are shown with black markers, and the blue line represents the background-only fit to data in the sidebands. Expected signal distribution for $ \mathcal{B}(\tau \!\to\! 3\mu) $ from W (Z) boson decay is shown in red (green). |
png pdf |
Figure 2-d:
Trimuon mass distributions of the 2022 (left) and 2023 (right) data events in the three $ |\eta| $ categories A (upper row), B (middle row) and C (lower row) of the V channel analysis. Data are shown with black markers, and the blue line represents the background-only fit to data in the sidebands. Expected signal distribution for $ \mathcal{B}(\tau \!\to\! 3\mu) $ from W (Z) boson decay is shown in red (green). |
png pdf |
Figure 2-e:
Trimuon mass distributions of the 2022 (left) and 2023 (right) data events in the three $ |\eta| $ categories A (upper row), B (middle row) and C (lower row) of the V channel analysis. Data are shown with black markers, and the blue line represents the background-only fit to data in the sidebands. Expected signal distribution for $ \mathcal{B}(\tau \!\to\! 3\mu) $ from W (Z) boson decay is shown in red (green). |
png pdf |
Figure 2-f:
Trimuon mass distributions of the 2022 (left) and 2023 (right) data events in the three $ |\eta| $ categories A (upper row), B (middle row) and C (lower row) of the V channel analysis. Data are shown with black markers, and the blue line represents the background-only fit to data in the sidebands. Expected signal distribution for $ \mathcal{B}(\tau \!\to\! 3\mu) $ from W (Z) boson decay is shown in red (green). |
png pdf |
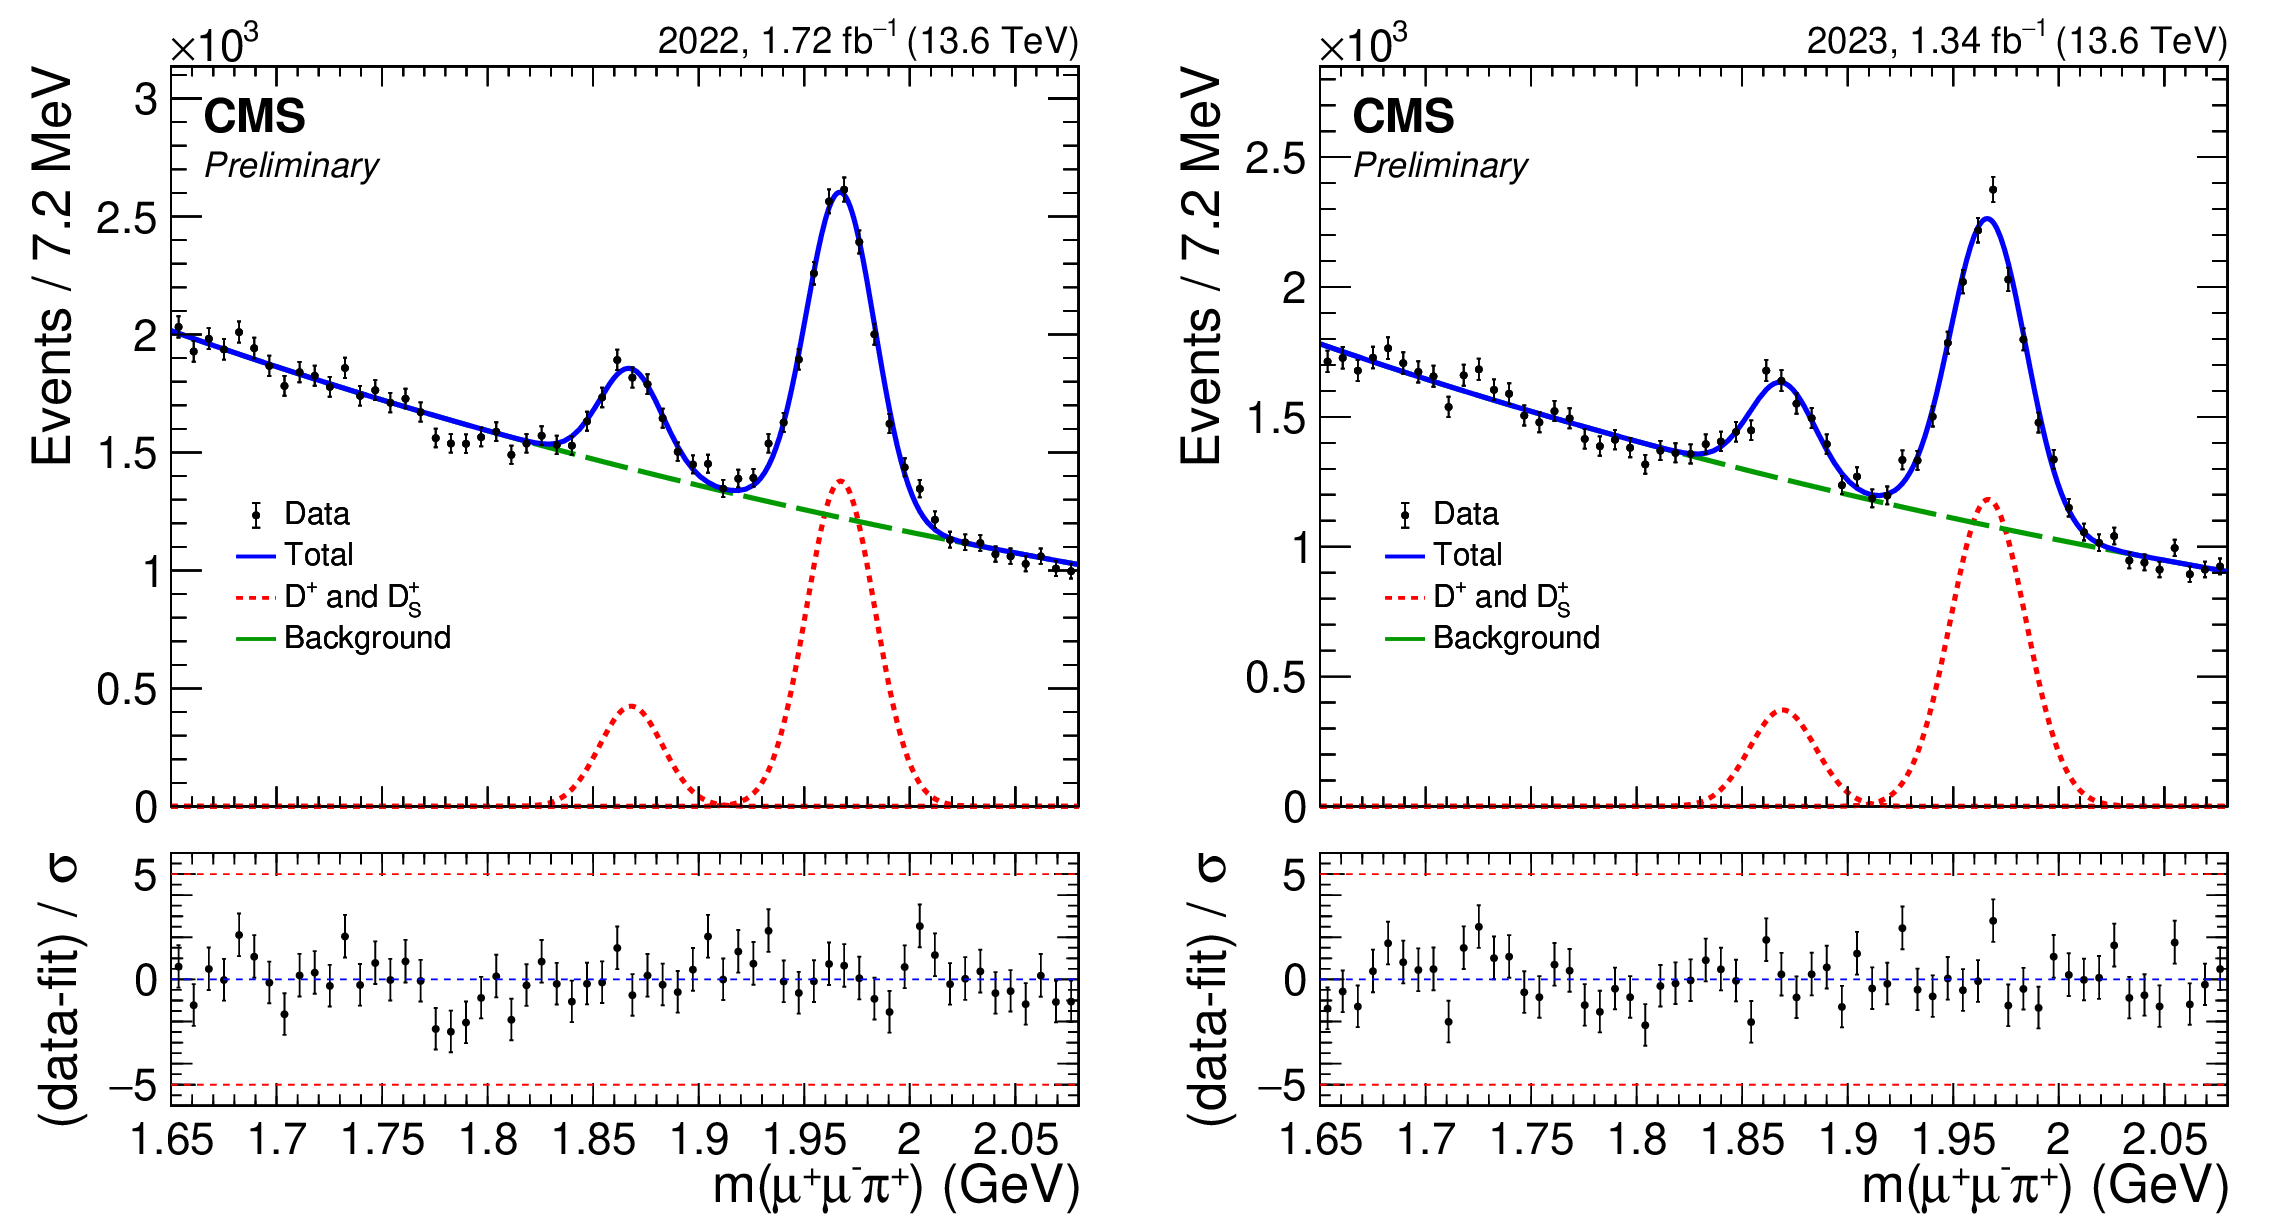
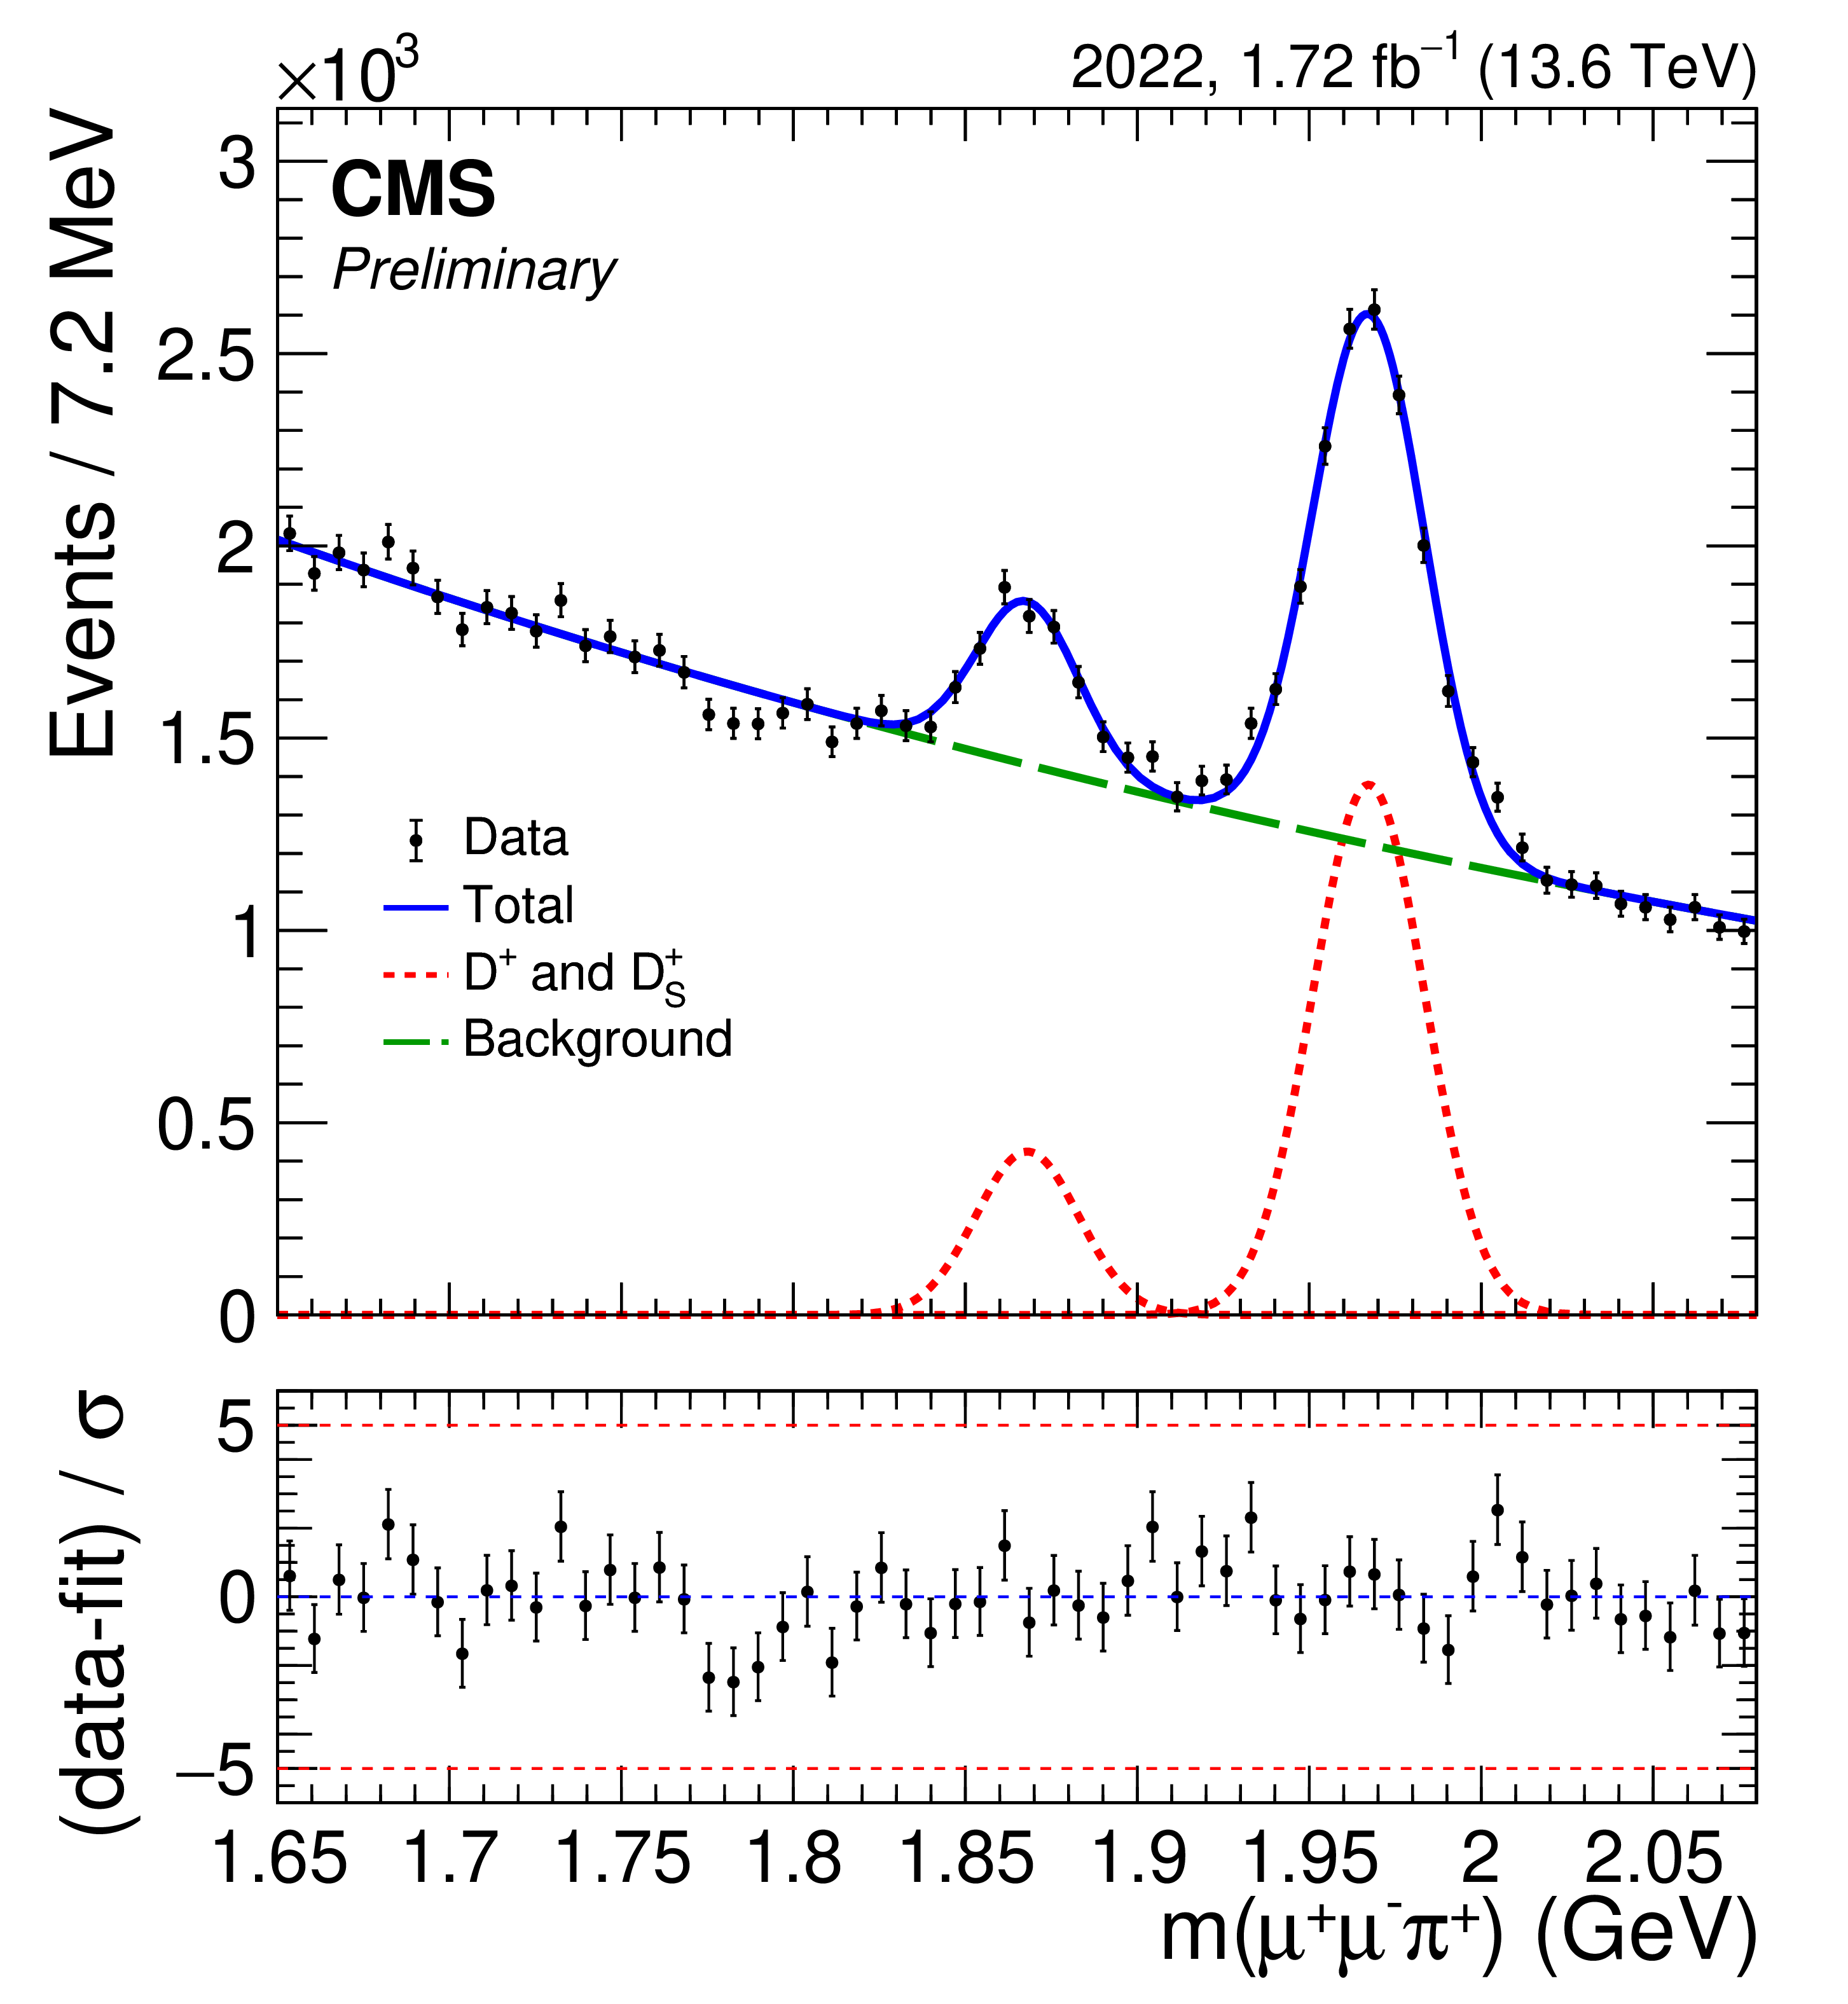
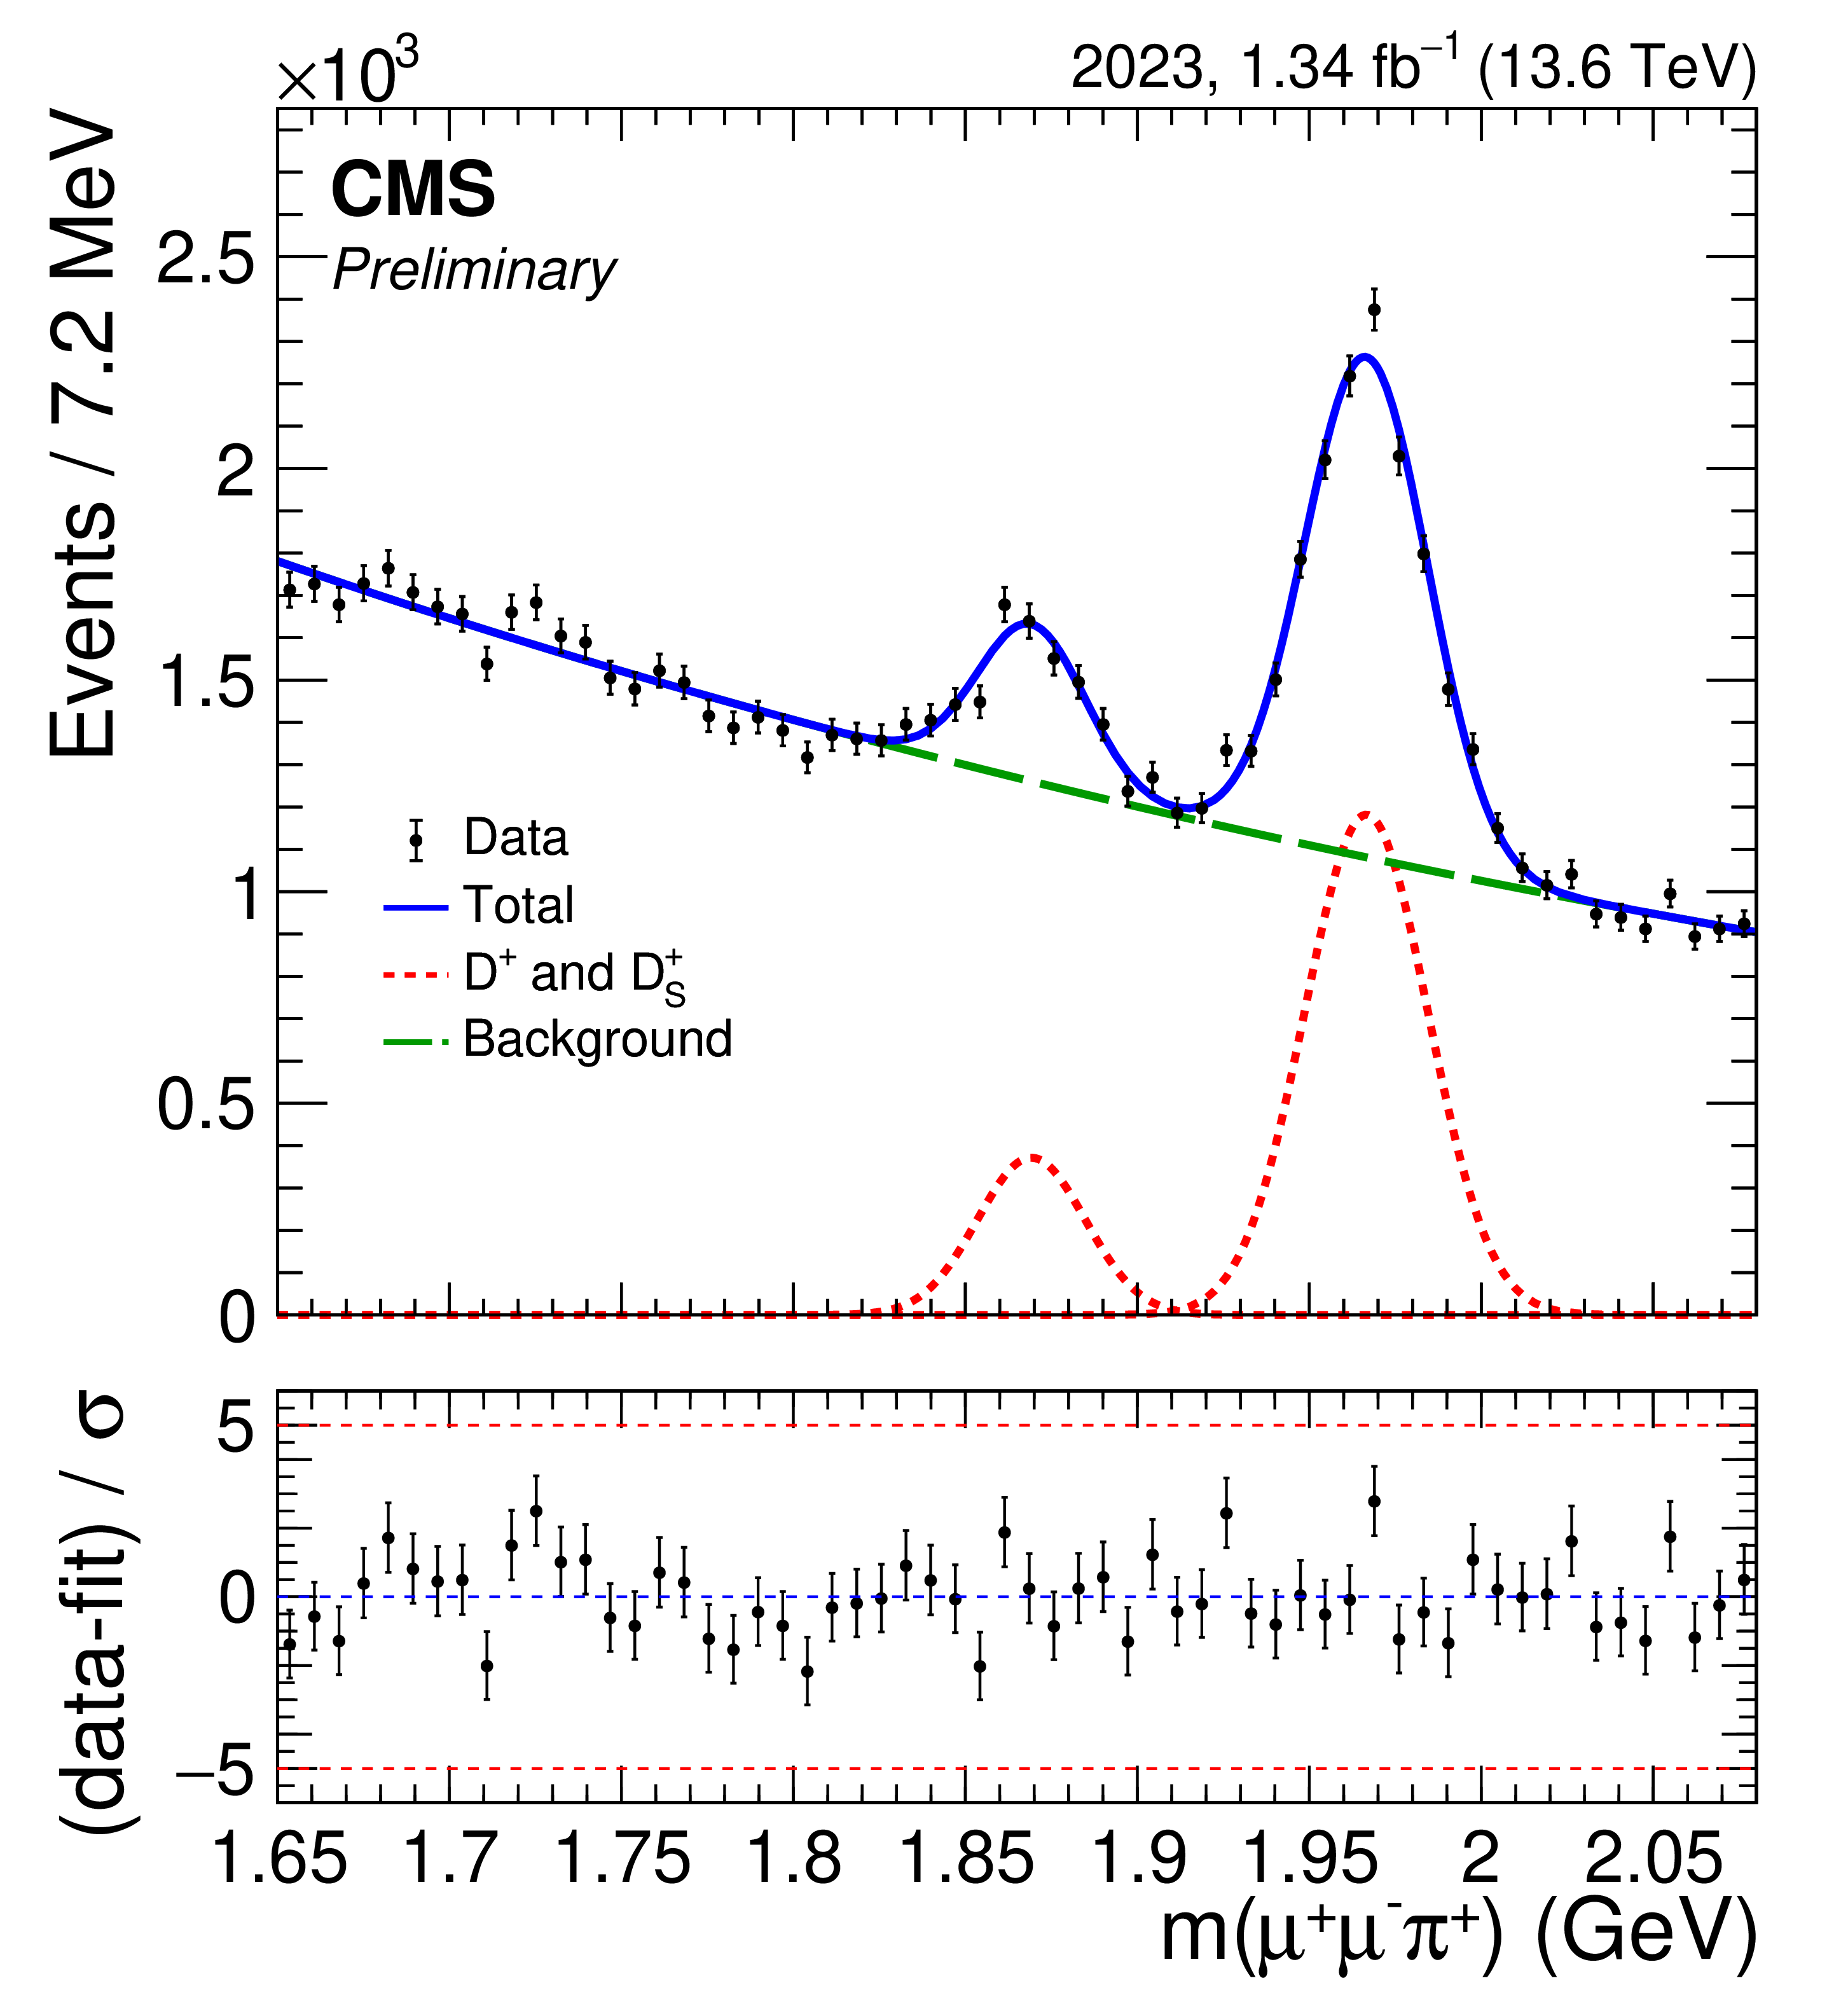
Figure 3:
Fits to the $ \mu^{-}\mu^{+}\pi^{+} $ invariant mass distribution in 2022 (left) and 2023 (right) data. The $ D_{s} $ and $ D^{+} $ peaks are modeled with Crystal Ball functions, while the background is fitted with an exponential function. |
png pdf |
Figure 3-a:
Fits to the $ \mu^{-}\mu^{+}\pi^{+} $ invariant mass distribution in 2022 (left) and 2023 (right) data. The $ D_{s} $ and $ D^{+} $ peaks are modeled with Crystal Ball functions, while the background is fitted with an exponential function. |
png pdf |
Figure 3-b:
Fits to the $ \mu^{-}\mu^{+}\pi^{+} $ invariant mass distribution in 2022 (left) and 2023 (right) data. The $ D_{s} $ and $ D^{+} $ peaks are modeled with Crystal Ball functions, while the background is fitted with an exponential function. |
png pdf |
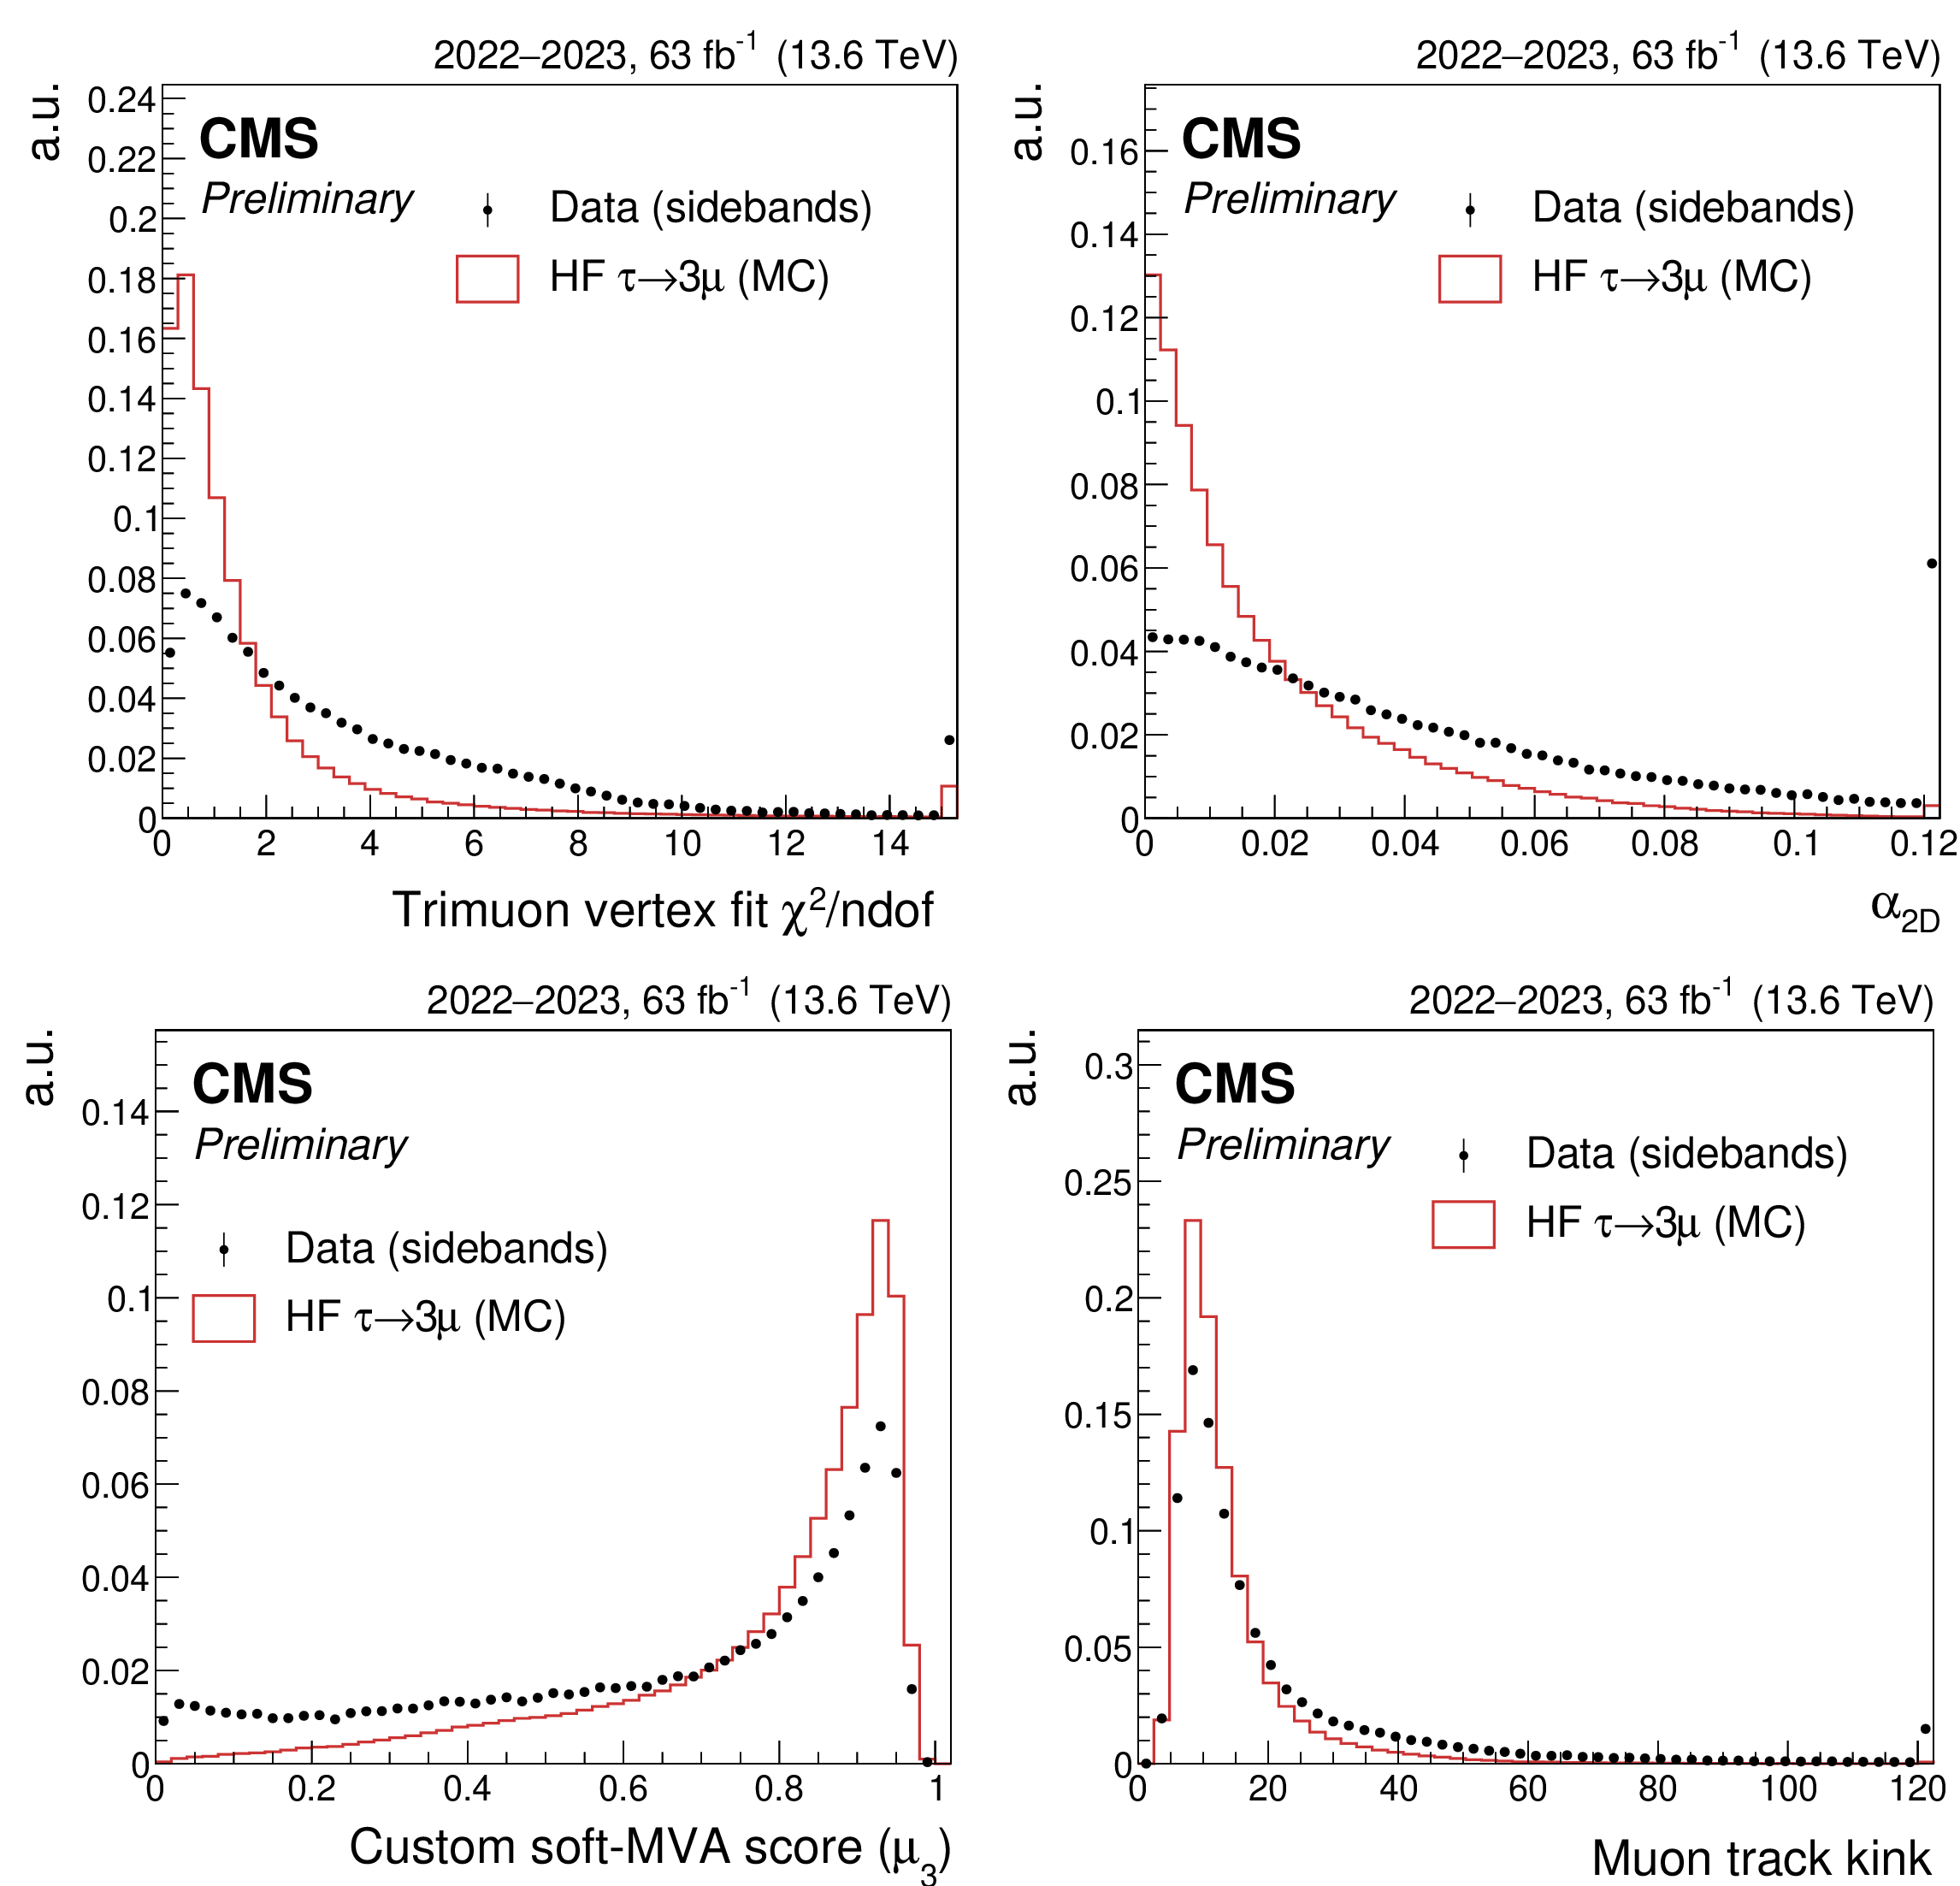
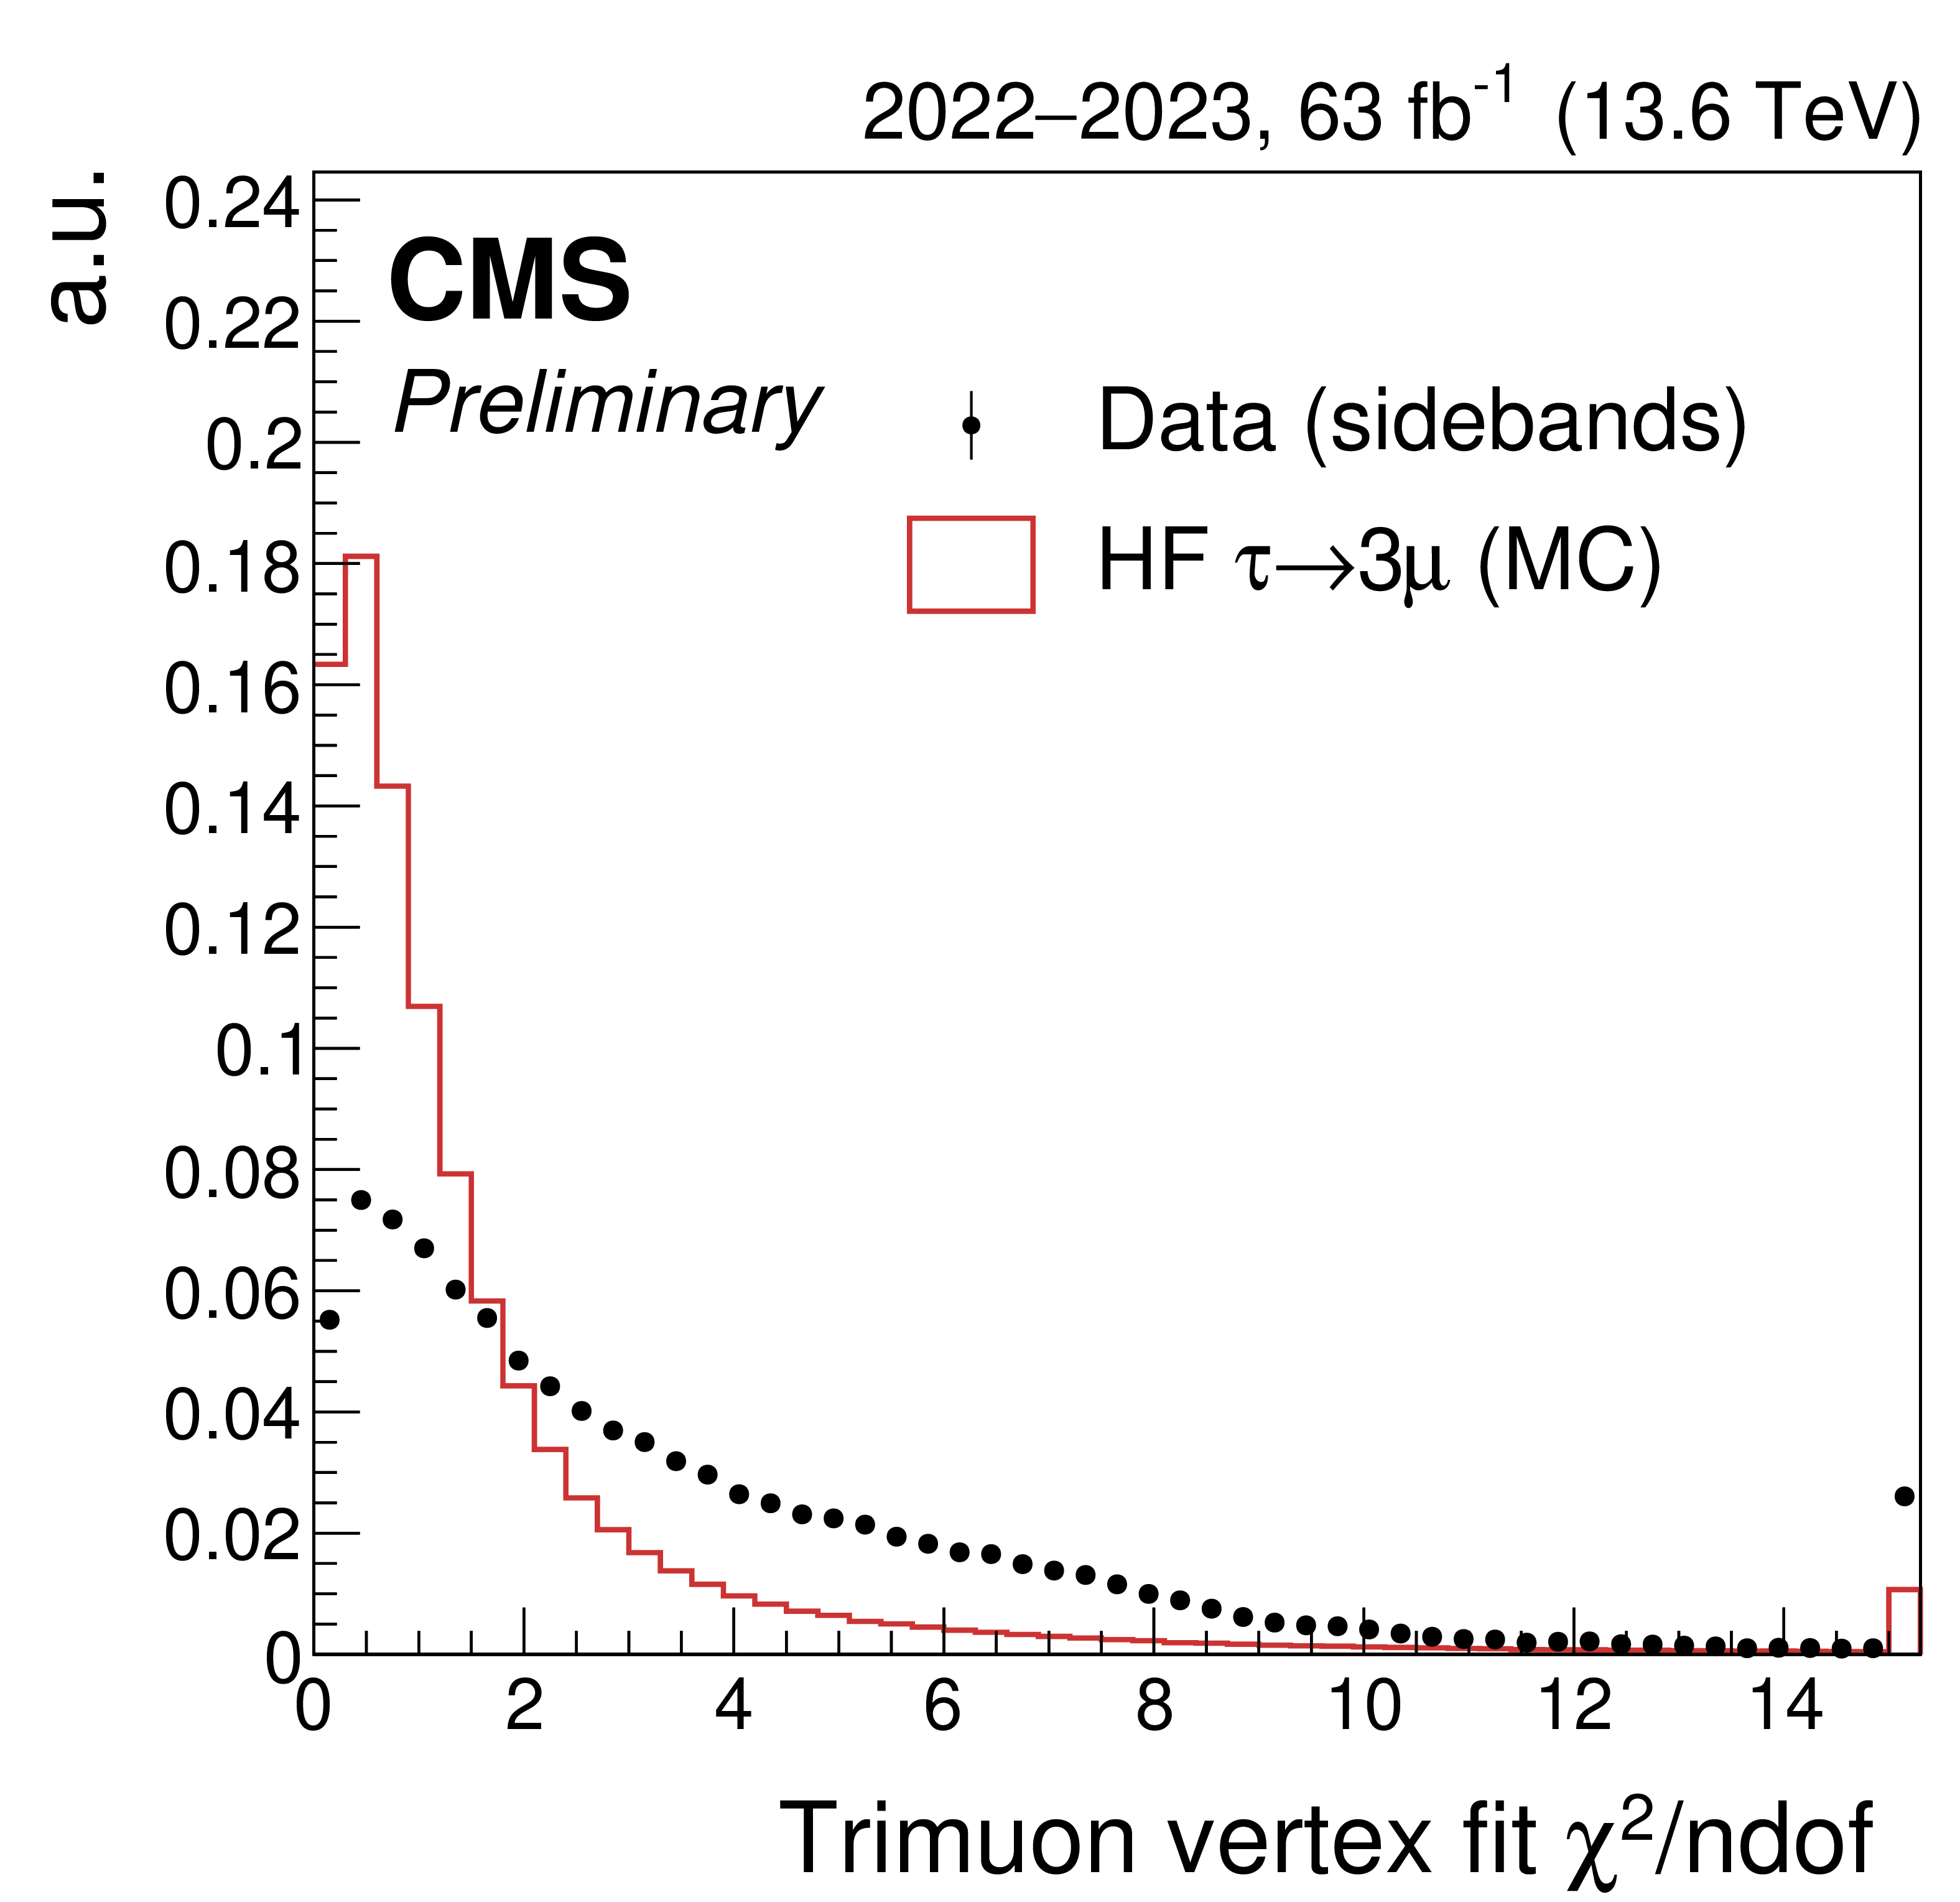
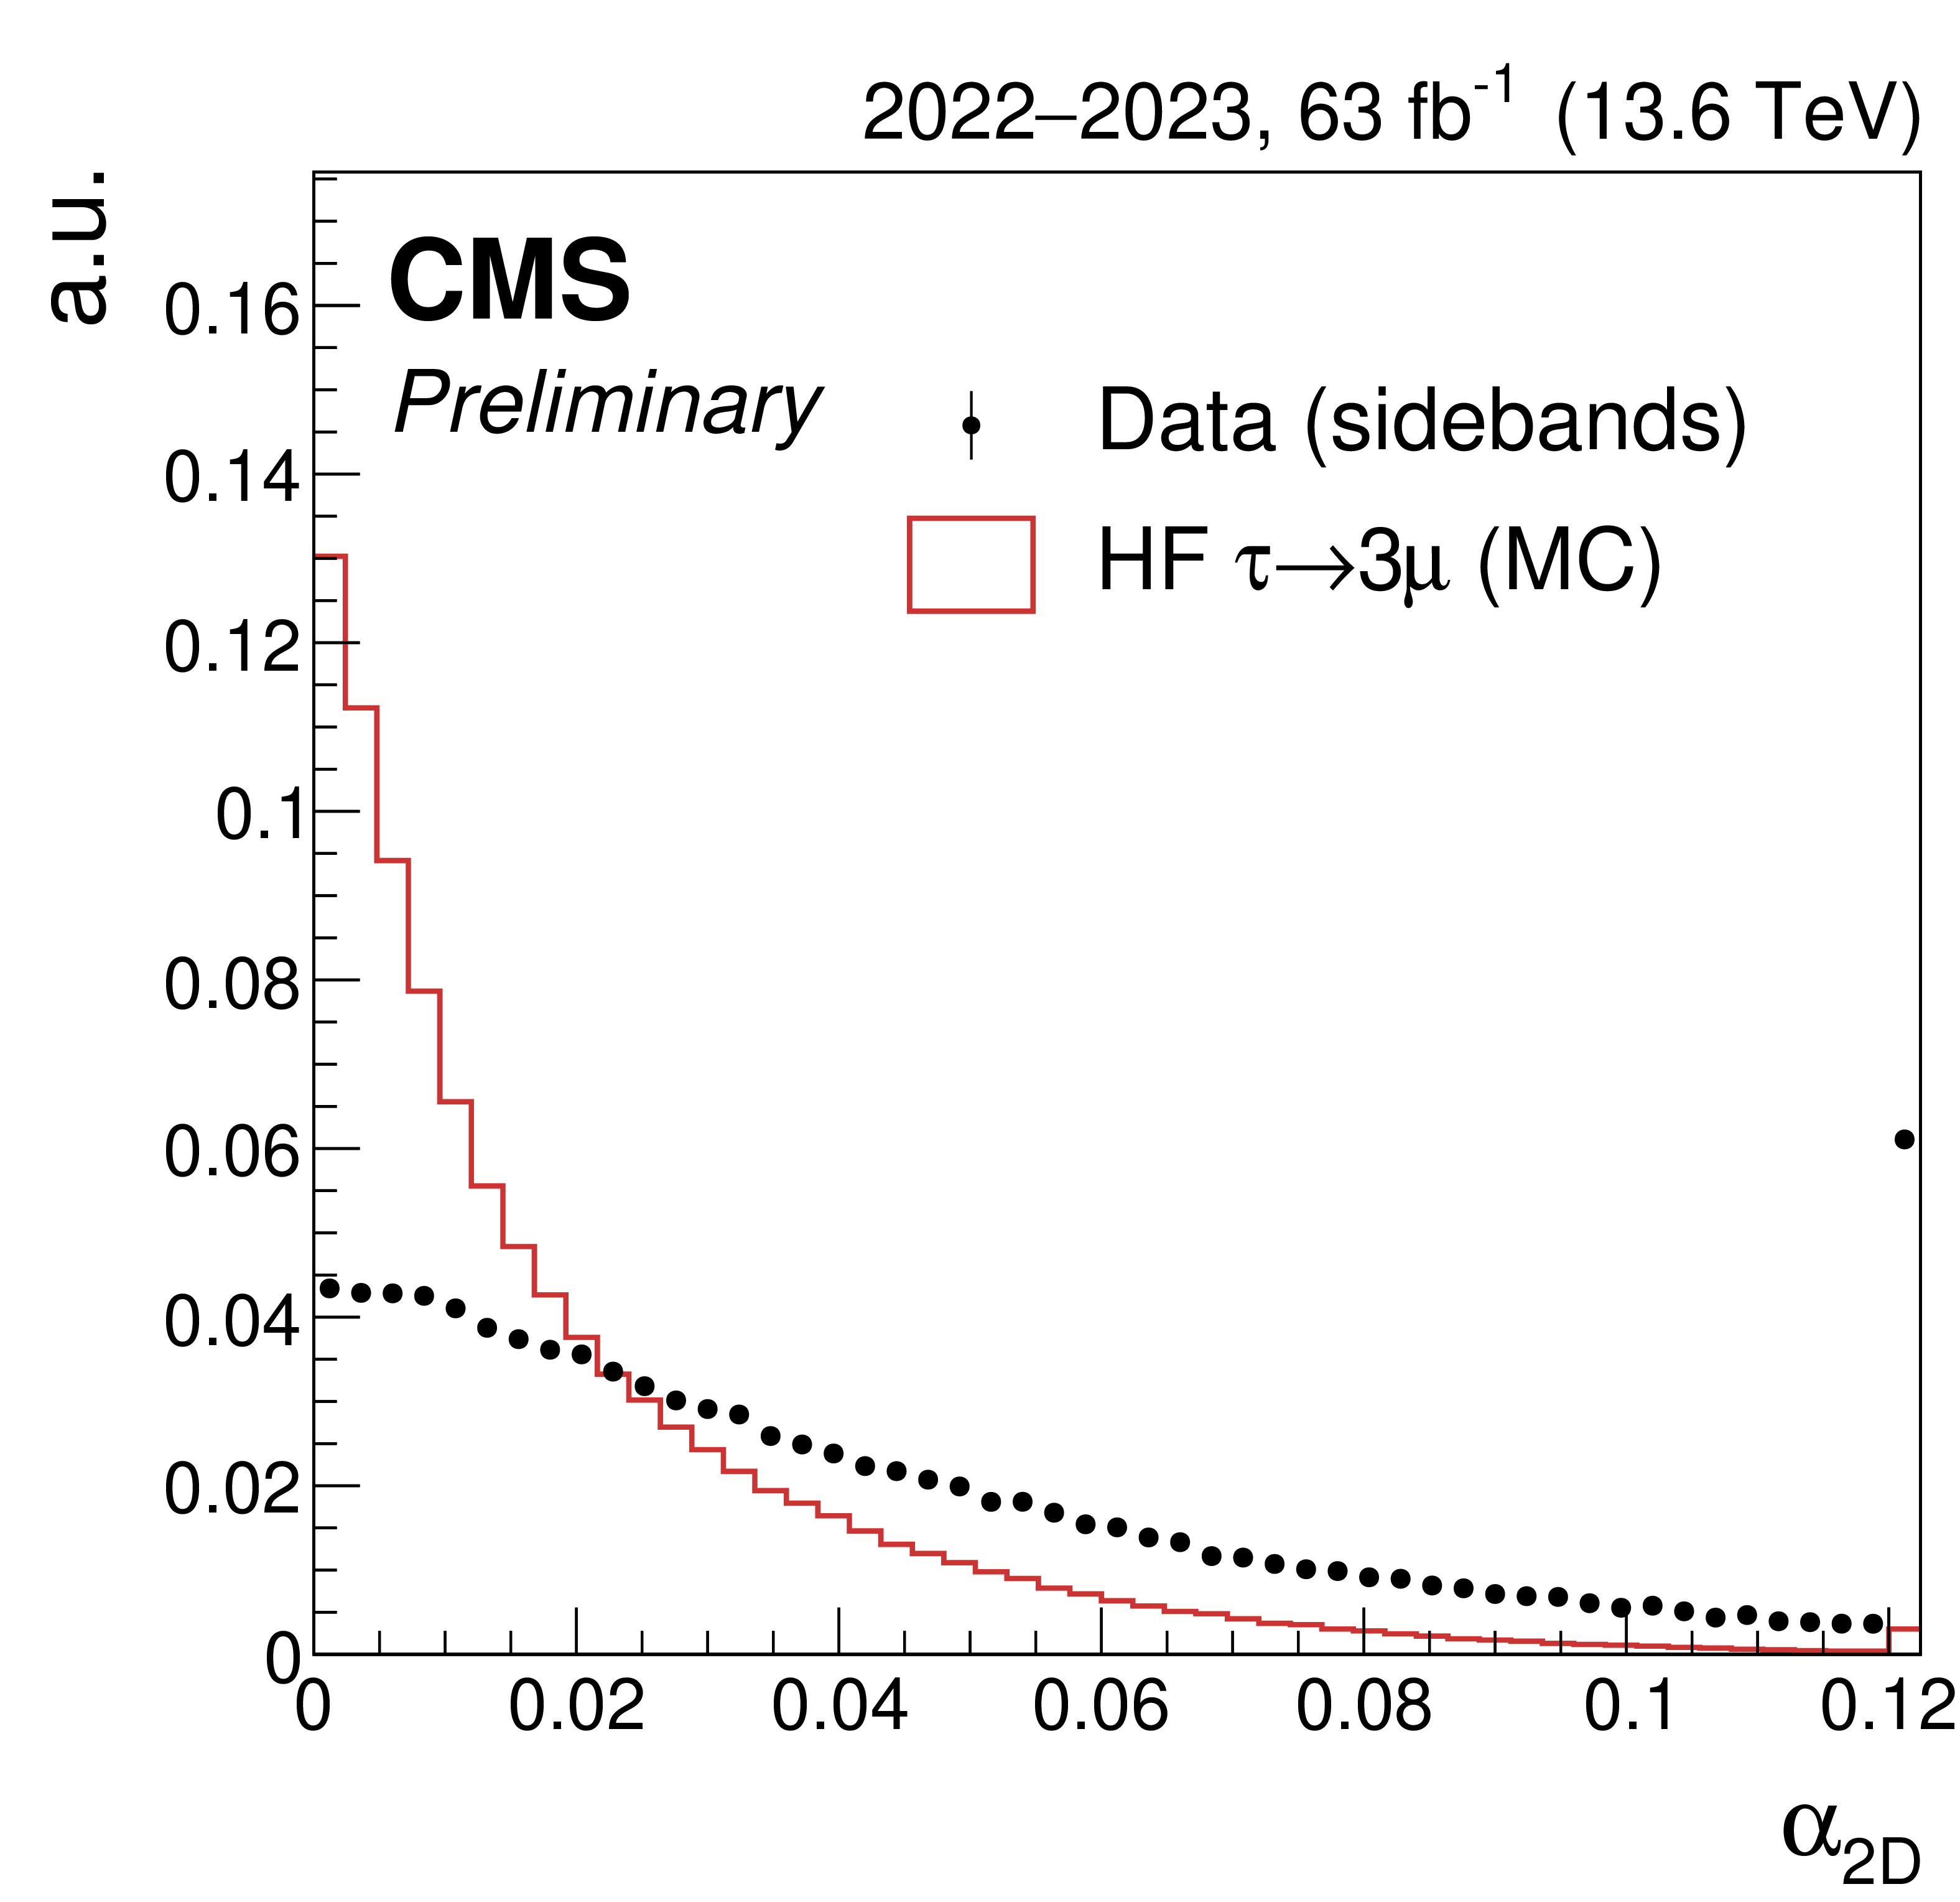
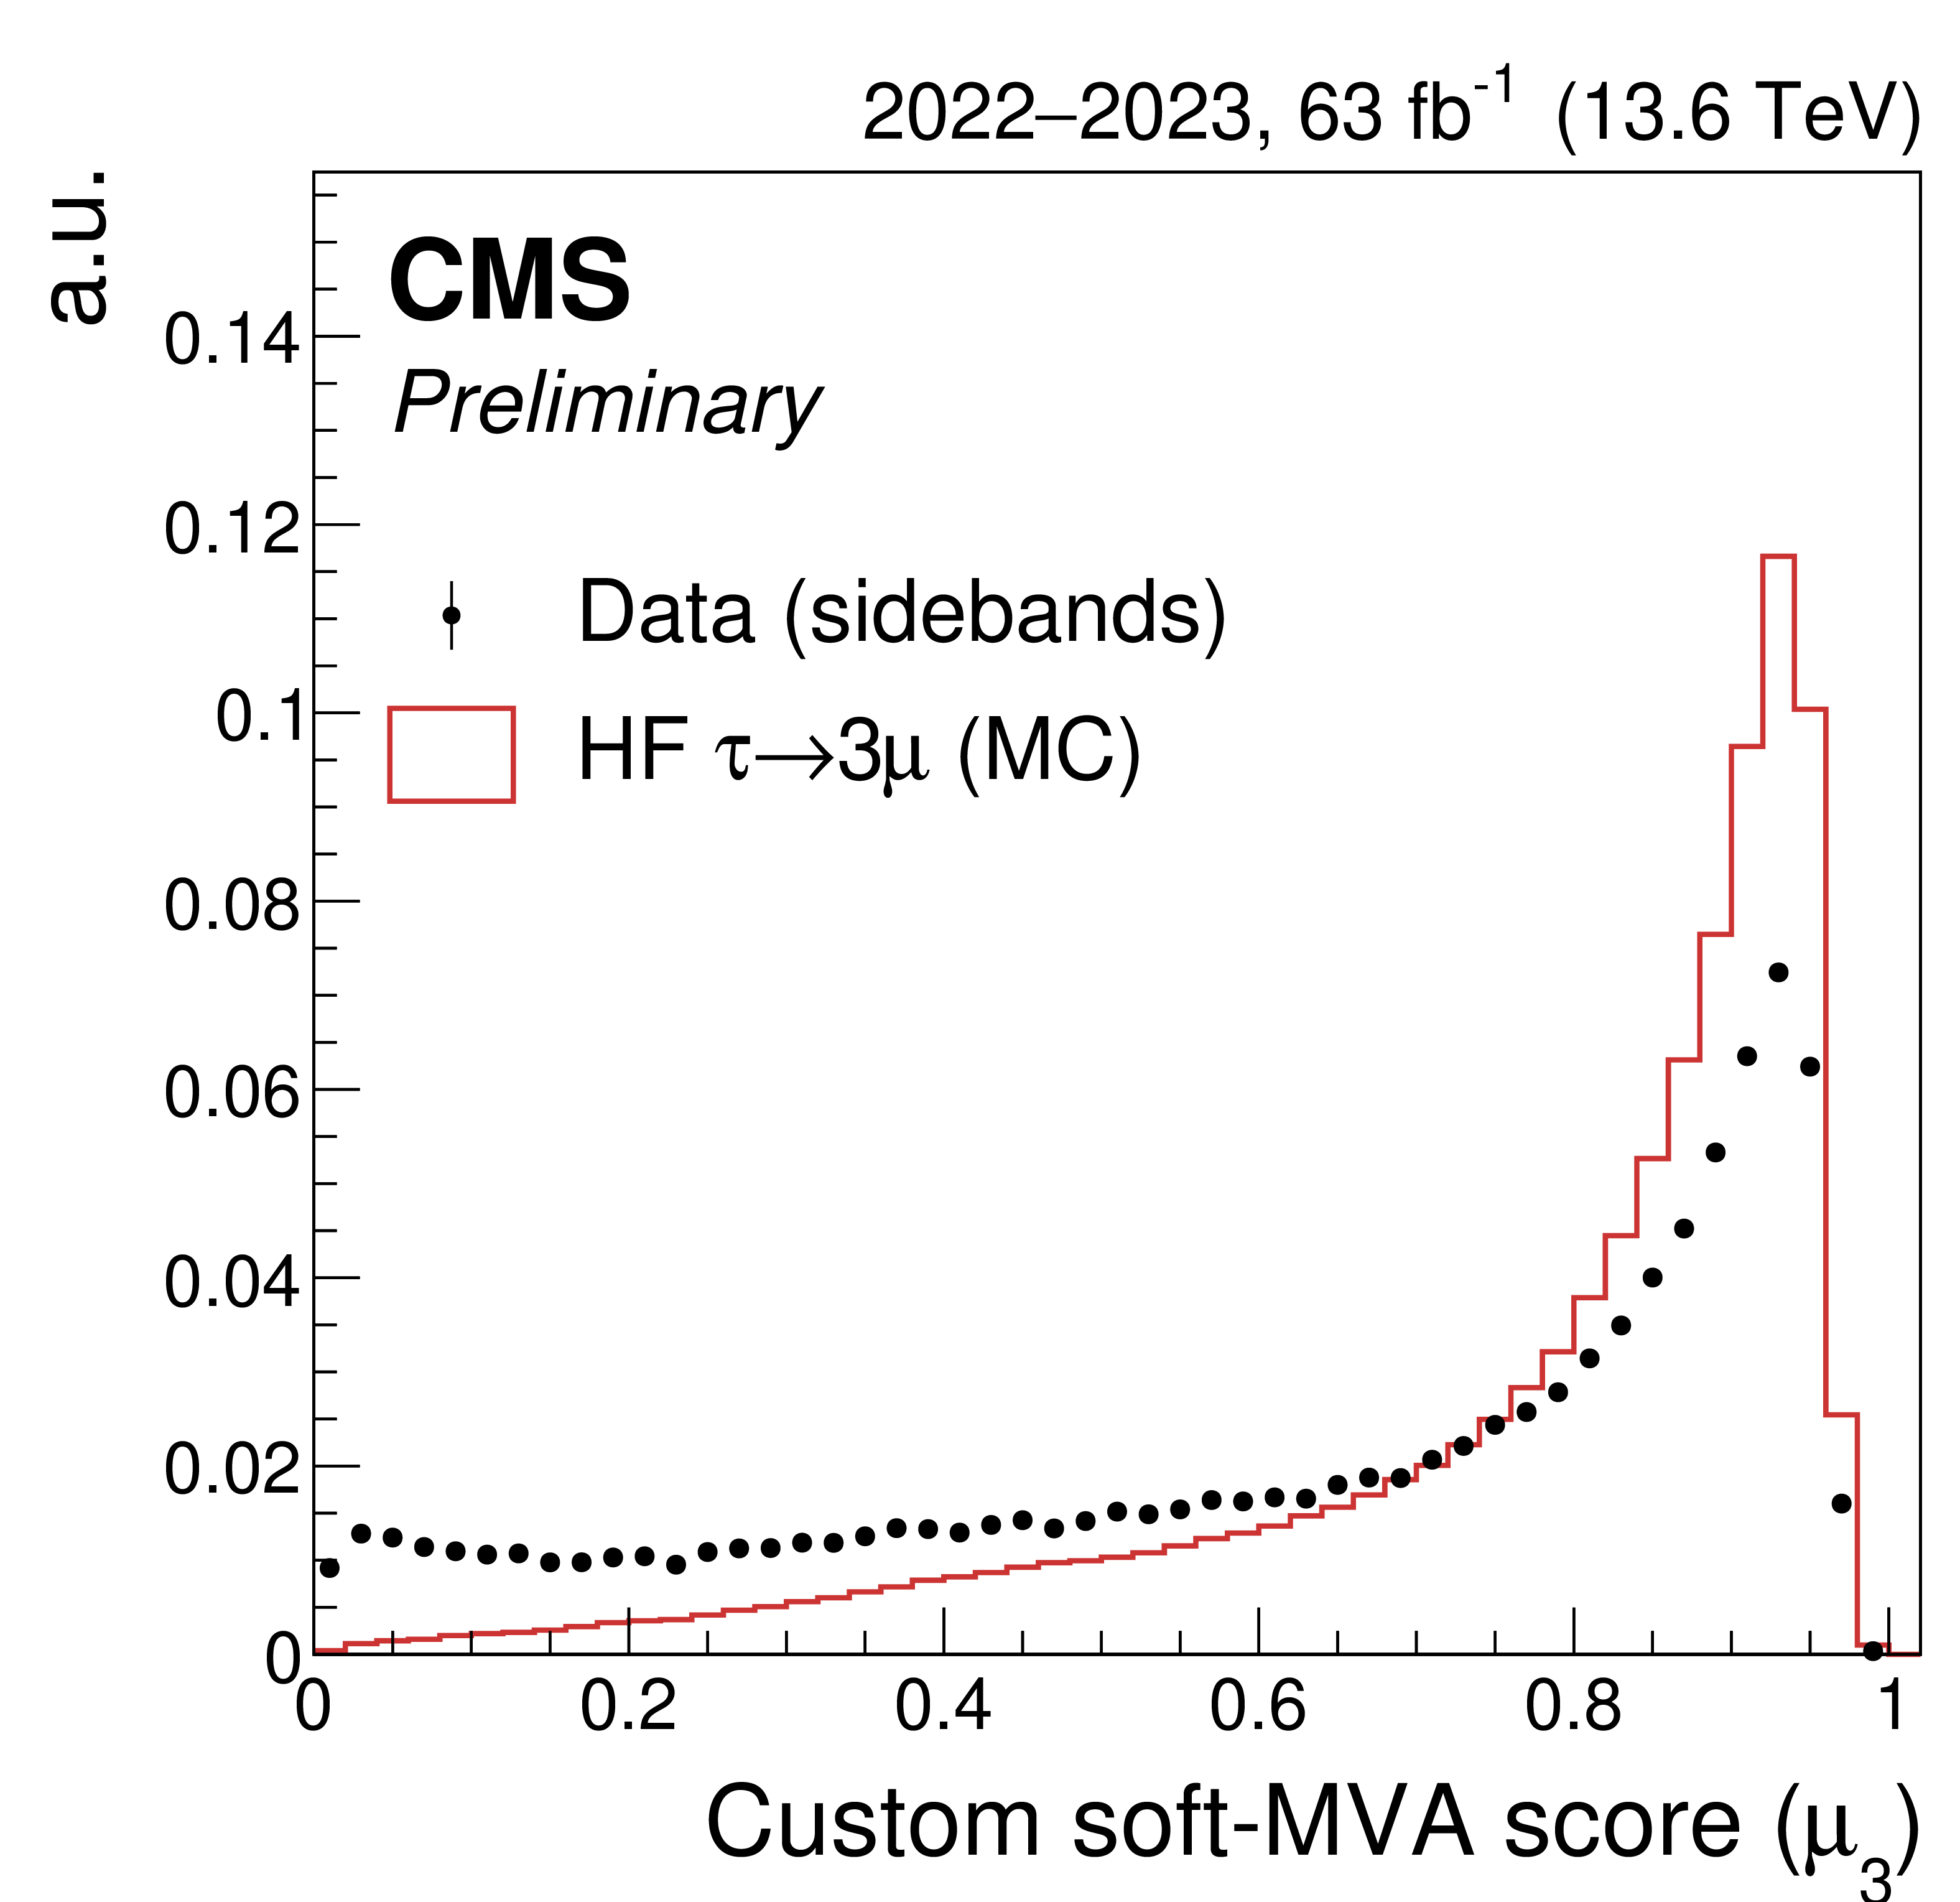
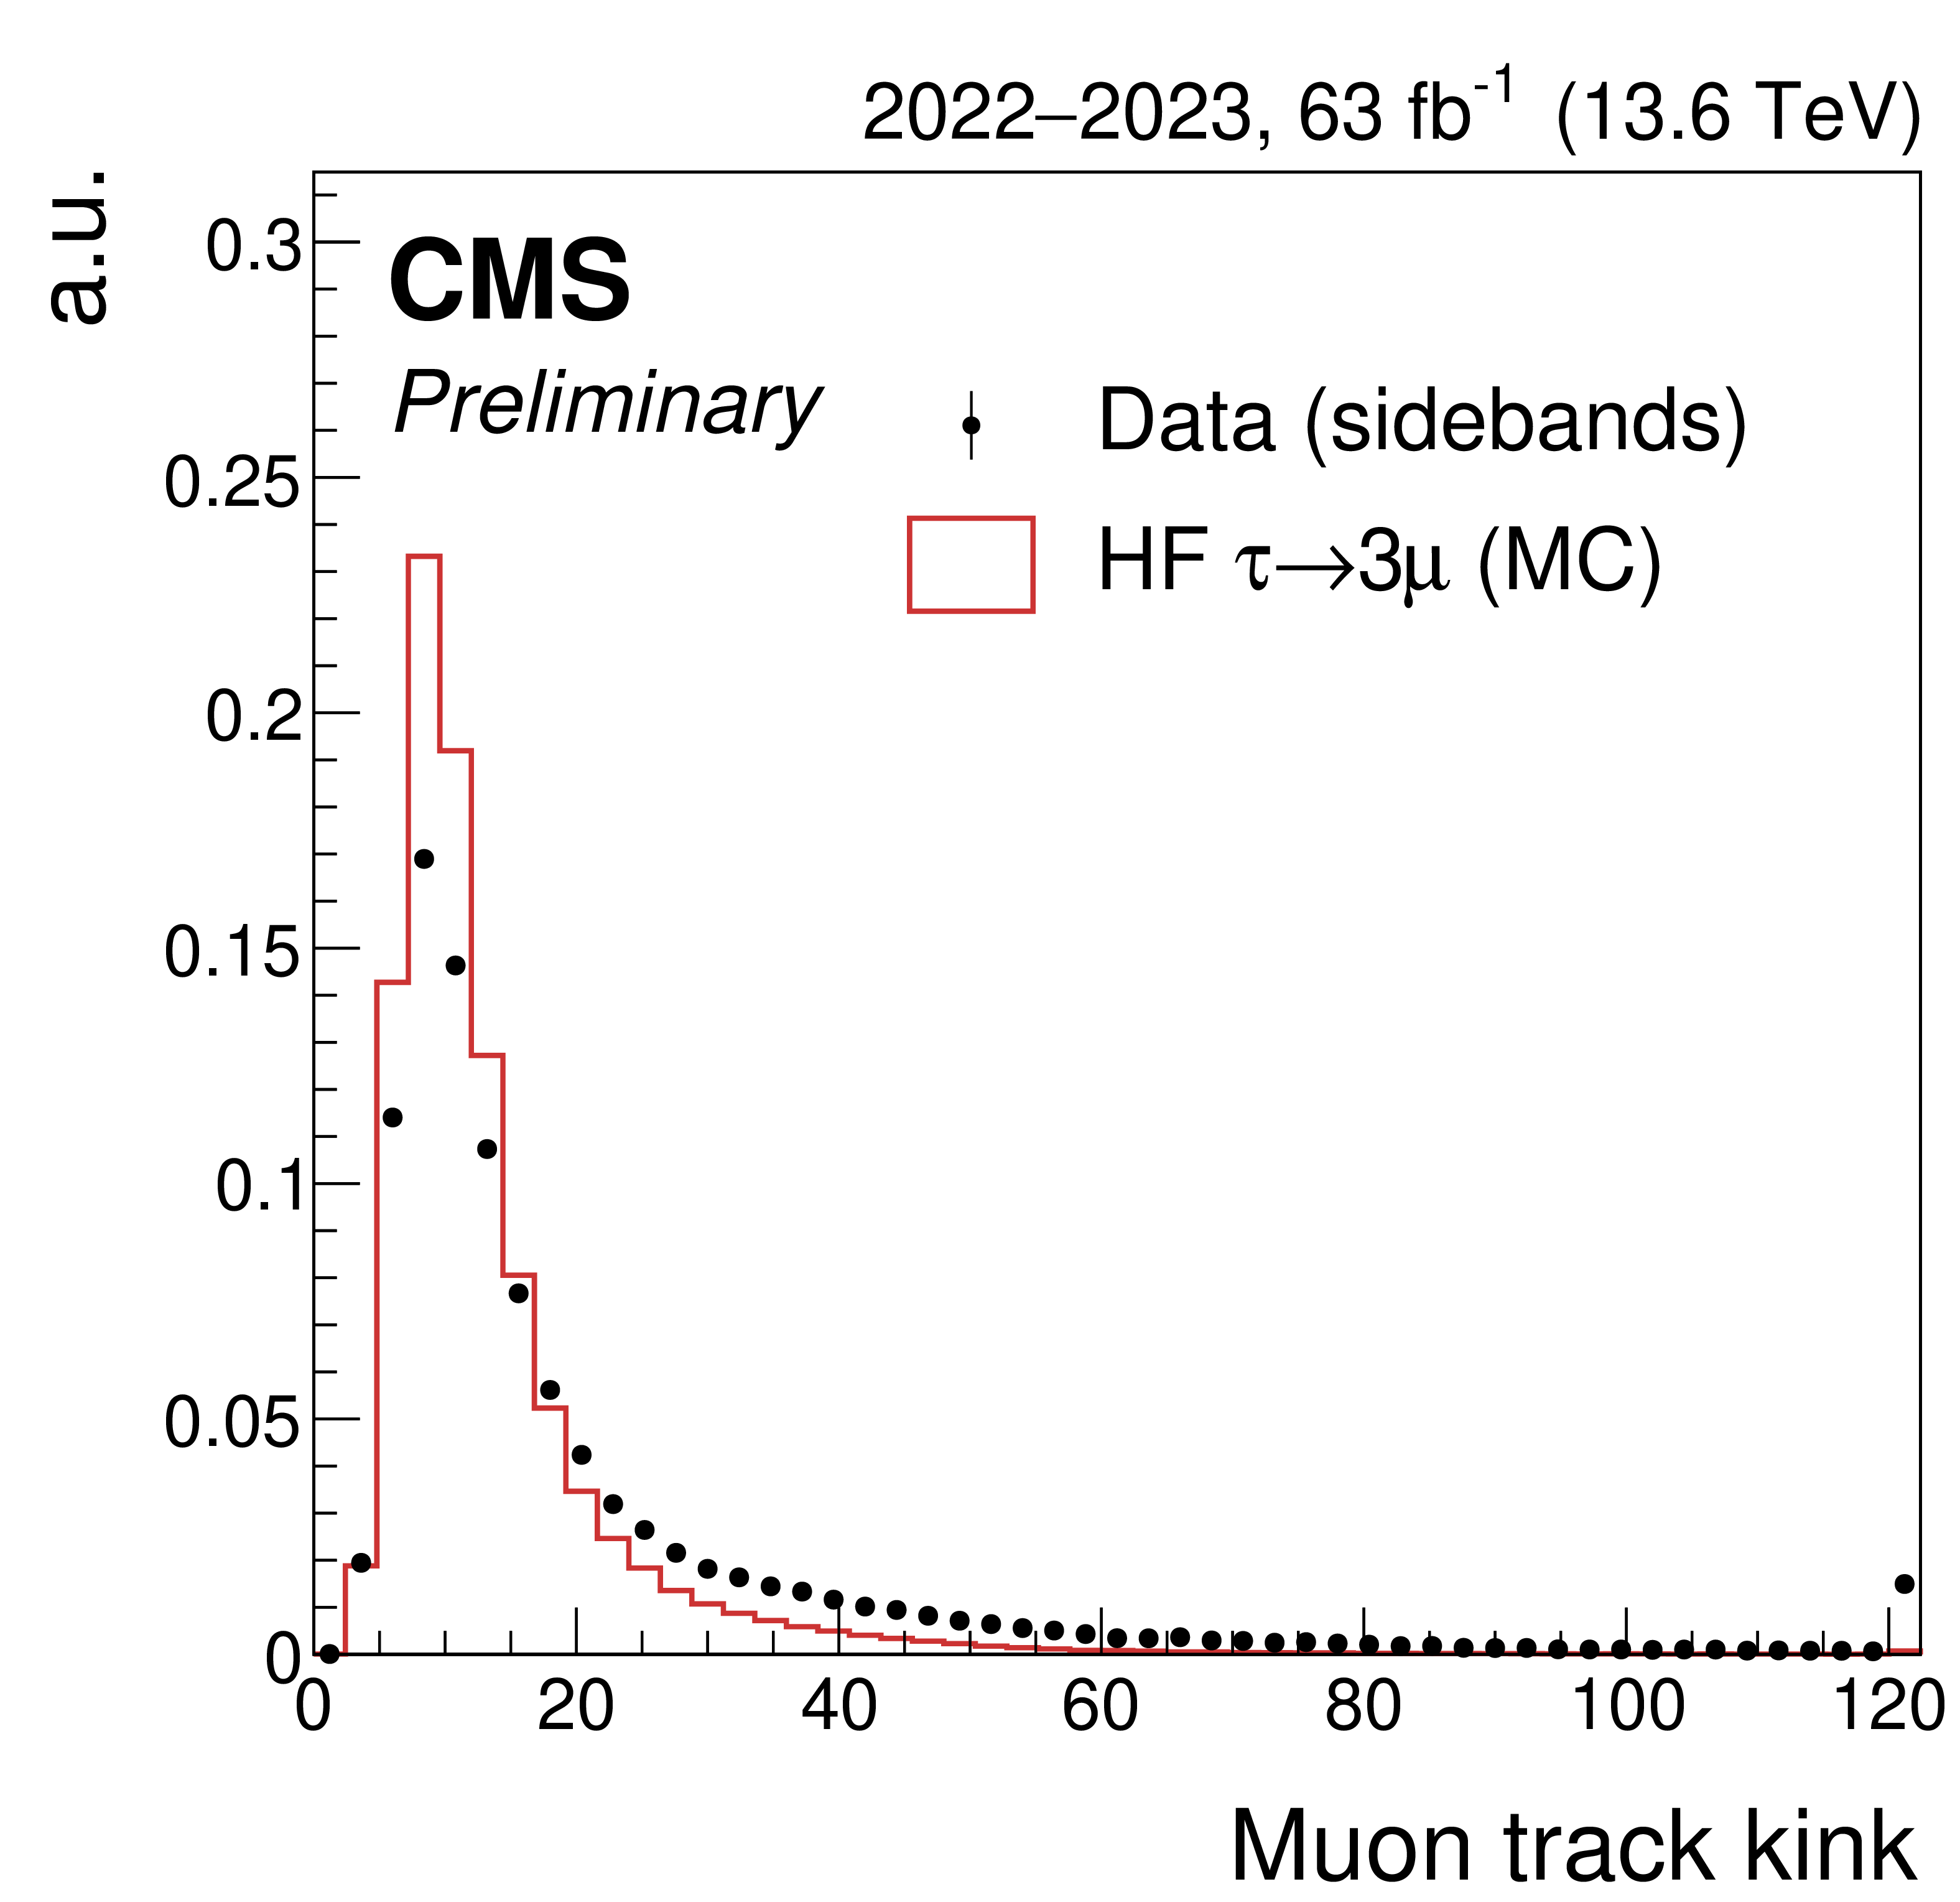
Figure 4:
Normalized signal and background distributions for the four variables with the largest importance in the event-level BDT. Shown are the normalized $ \chi^2 $ of the trimuon vertex fit (upper left), the angle between the $ \tau $ candidate direction and the vector between the trimuon vertex and the beamspot in the transverse plane (upper right), the per-muon BDT score of the lowest $ p_{\mathrm{T}} $ muon (lower left), and a measure of the probability that the muon track is comprised of hits belonging to two independent particle trajectories (lower right). In the latter case, the maximum value out of the three muons is considered. |
png pdf |
Figure 4-a:
Normalized signal and background distributions for the four variables with the largest importance in the event-level BDT. Shown are the normalized $ \chi^2 $ of the trimuon vertex fit (upper left), the angle between the $ \tau $ candidate direction and the vector between the trimuon vertex and the beamspot in the transverse plane (upper right), the per-muon BDT score of the lowest $ p_{\mathrm{T}} $ muon (lower left), and a measure of the probability that the muon track is comprised of hits belonging to two independent particle trajectories (lower right). In the latter case, the maximum value out of the three muons is considered. |
png pdf |
Figure 4-b:
Normalized signal and background distributions for the four variables with the largest importance in the event-level BDT. Shown are the normalized $ \chi^2 $ of the trimuon vertex fit (upper left), the angle between the $ \tau $ candidate direction and the vector between the trimuon vertex and the beamspot in the transverse plane (upper right), the per-muon BDT score of the lowest $ p_{\mathrm{T}} $ muon (lower left), and a measure of the probability that the muon track is comprised of hits belonging to two independent particle trajectories (lower right). In the latter case, the maximum value out of the three muons is considered. |
png pdf |
Figure 4-c:
Normalized signal and background distributions for the four variables with the largest importance in the event-level BDT. Shown are the normalized $ \chi^2 $ of the trimuon vertex fit (upper left), the angle between the $ \tau $ candidate direction and the vector between the trimuon vertex and the beamspot in the transverse plane (upper right), the per-muon BDT score of the lowest $ p_{\mathrm{T}} $ muon (lower left), and a measure of the probability that the muon track is comprised of hits belonging to two independent particle trajectories (lower right). In the latter case, the maximum value out of the three muons is considered. |
png pdf |
Figure 4-d:
Normalized signal and background distributions for the four variables with the largest importance in the event-level BDT. Shown are the normalized $ \chi^2 $ of the trimuon vertex fit (upper left), the angle between the $ \tau $ candidate direction and the vector between the trimuon vertex and the beamspot in the transverse plane (upper right), the per-muon BDT score of the lowest $ p_{\mathrm{T}} $ muon (lower left), and a measure of the probability that the muon track is comprised of hits belonging to two independent particle trajectories (lower right). In the latter case, the maximum value out of the three muons is considered. |
png pdf |
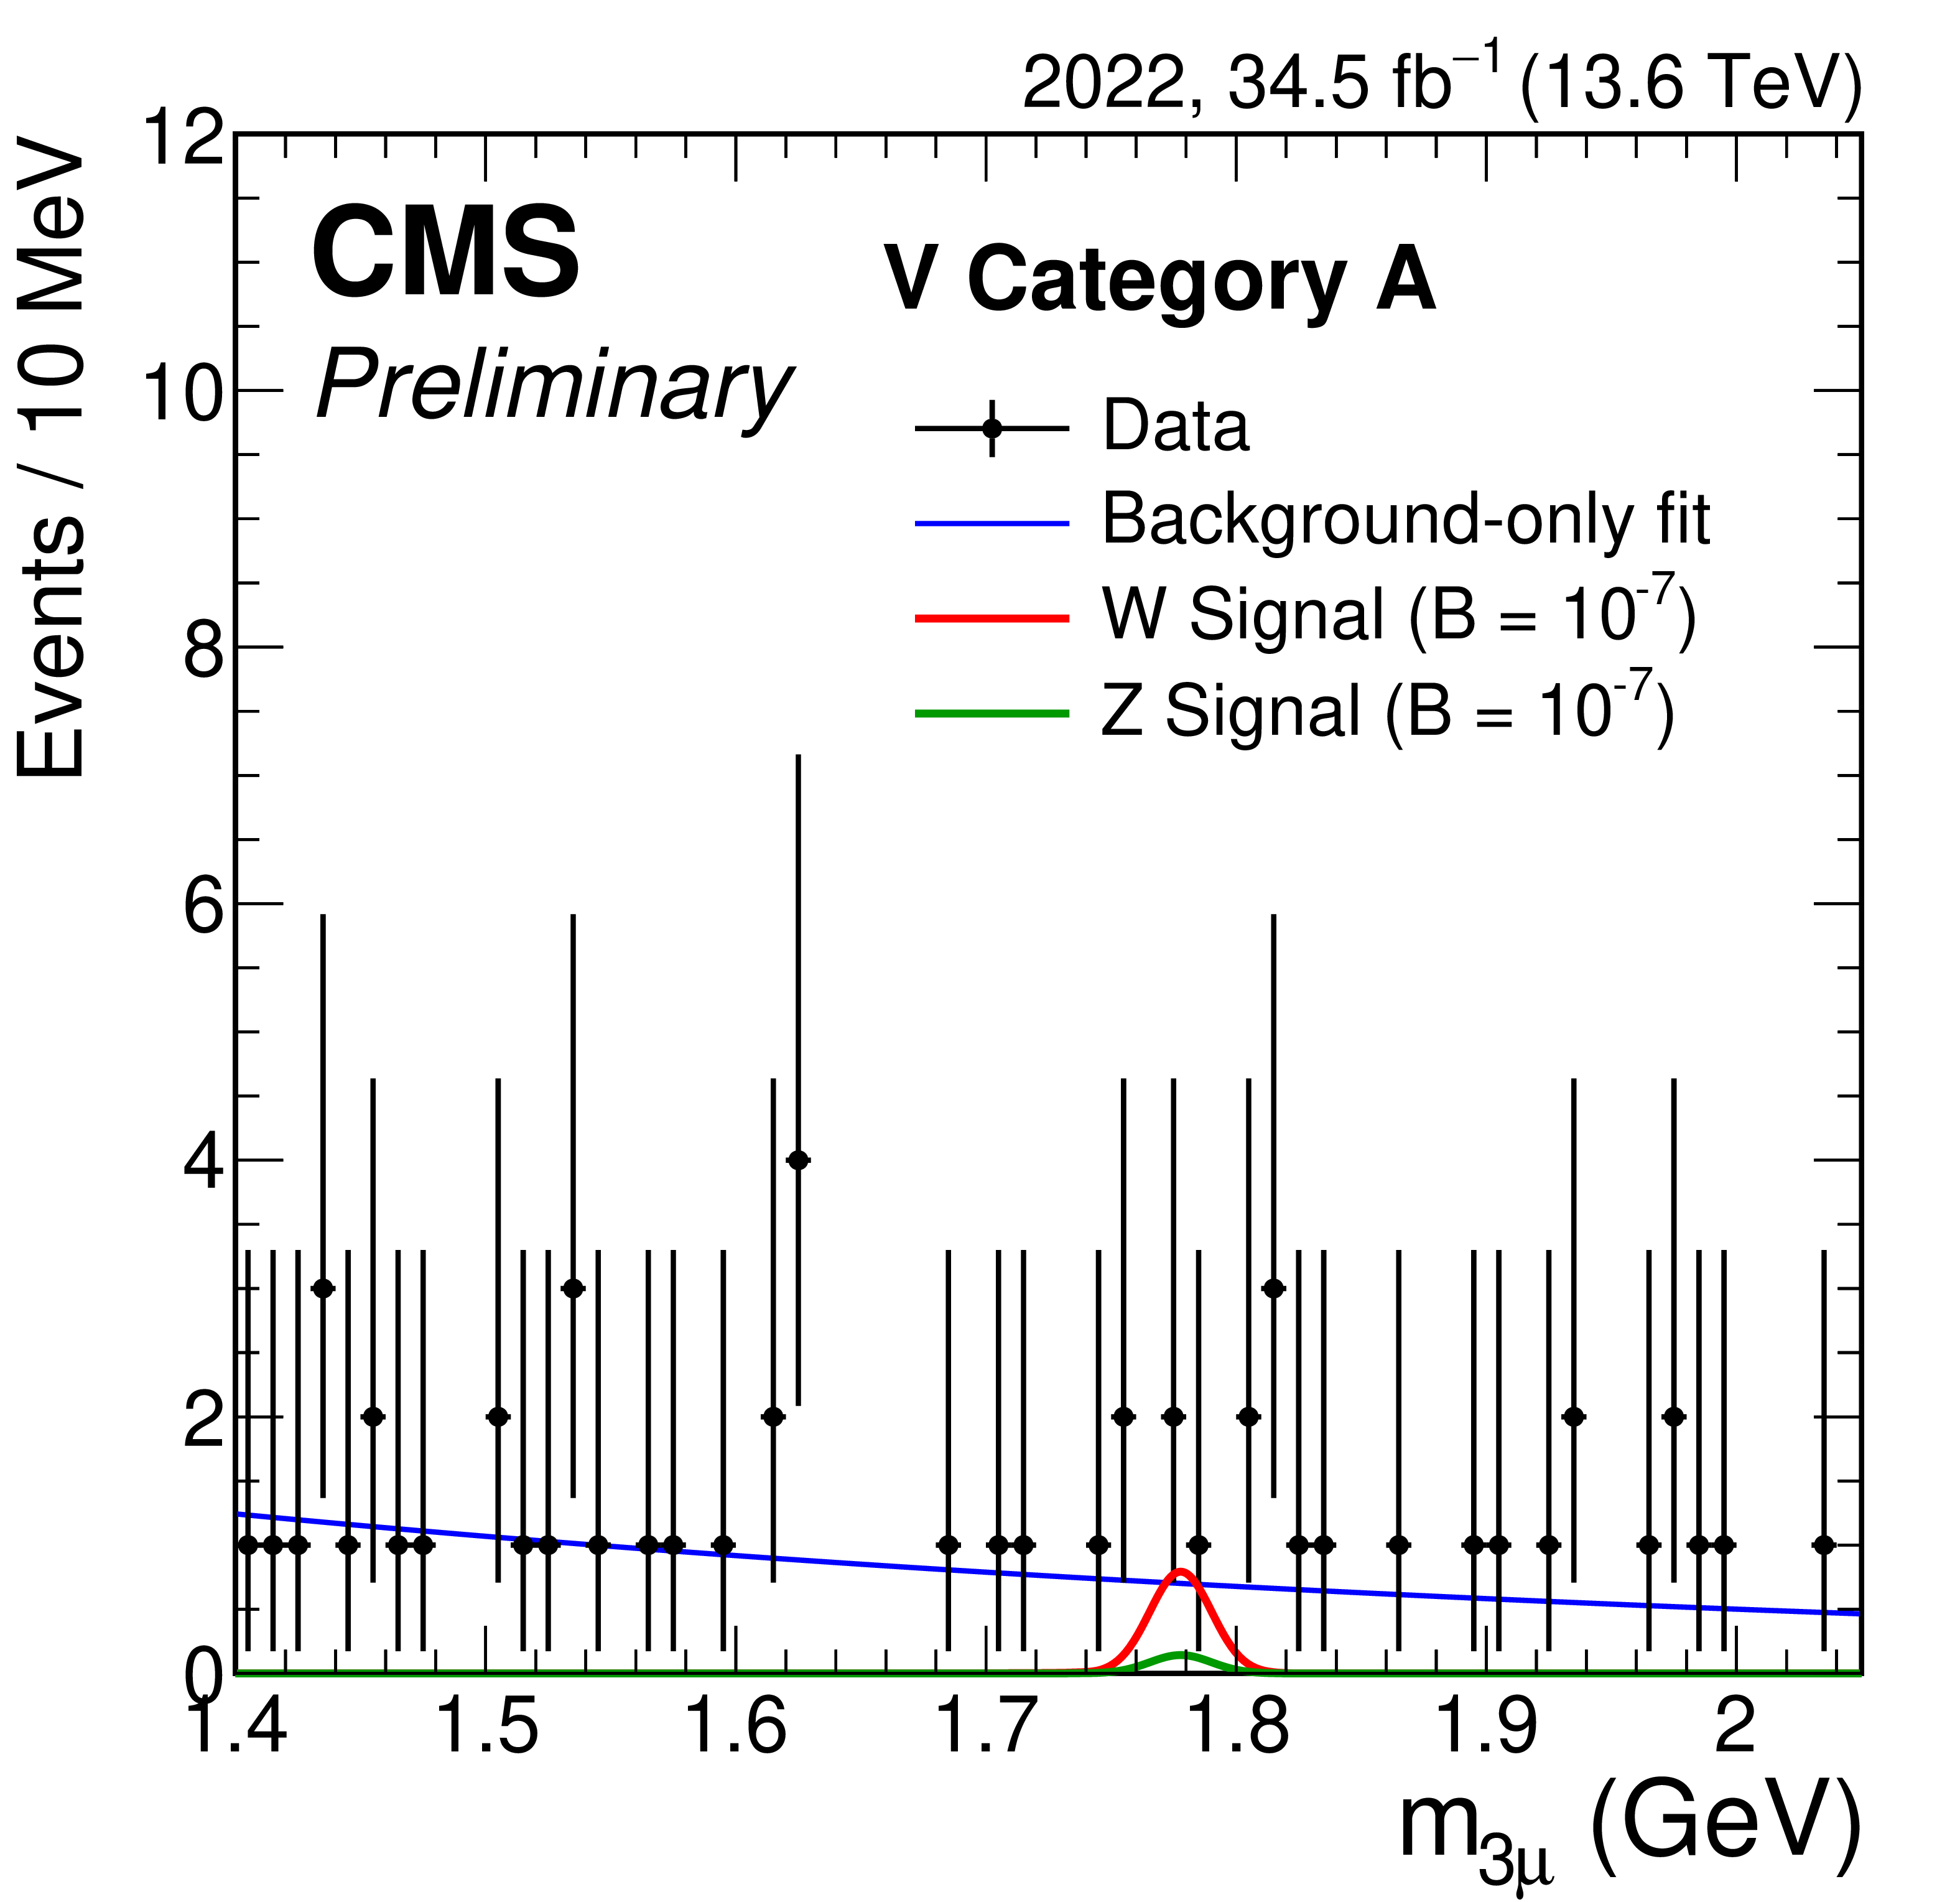
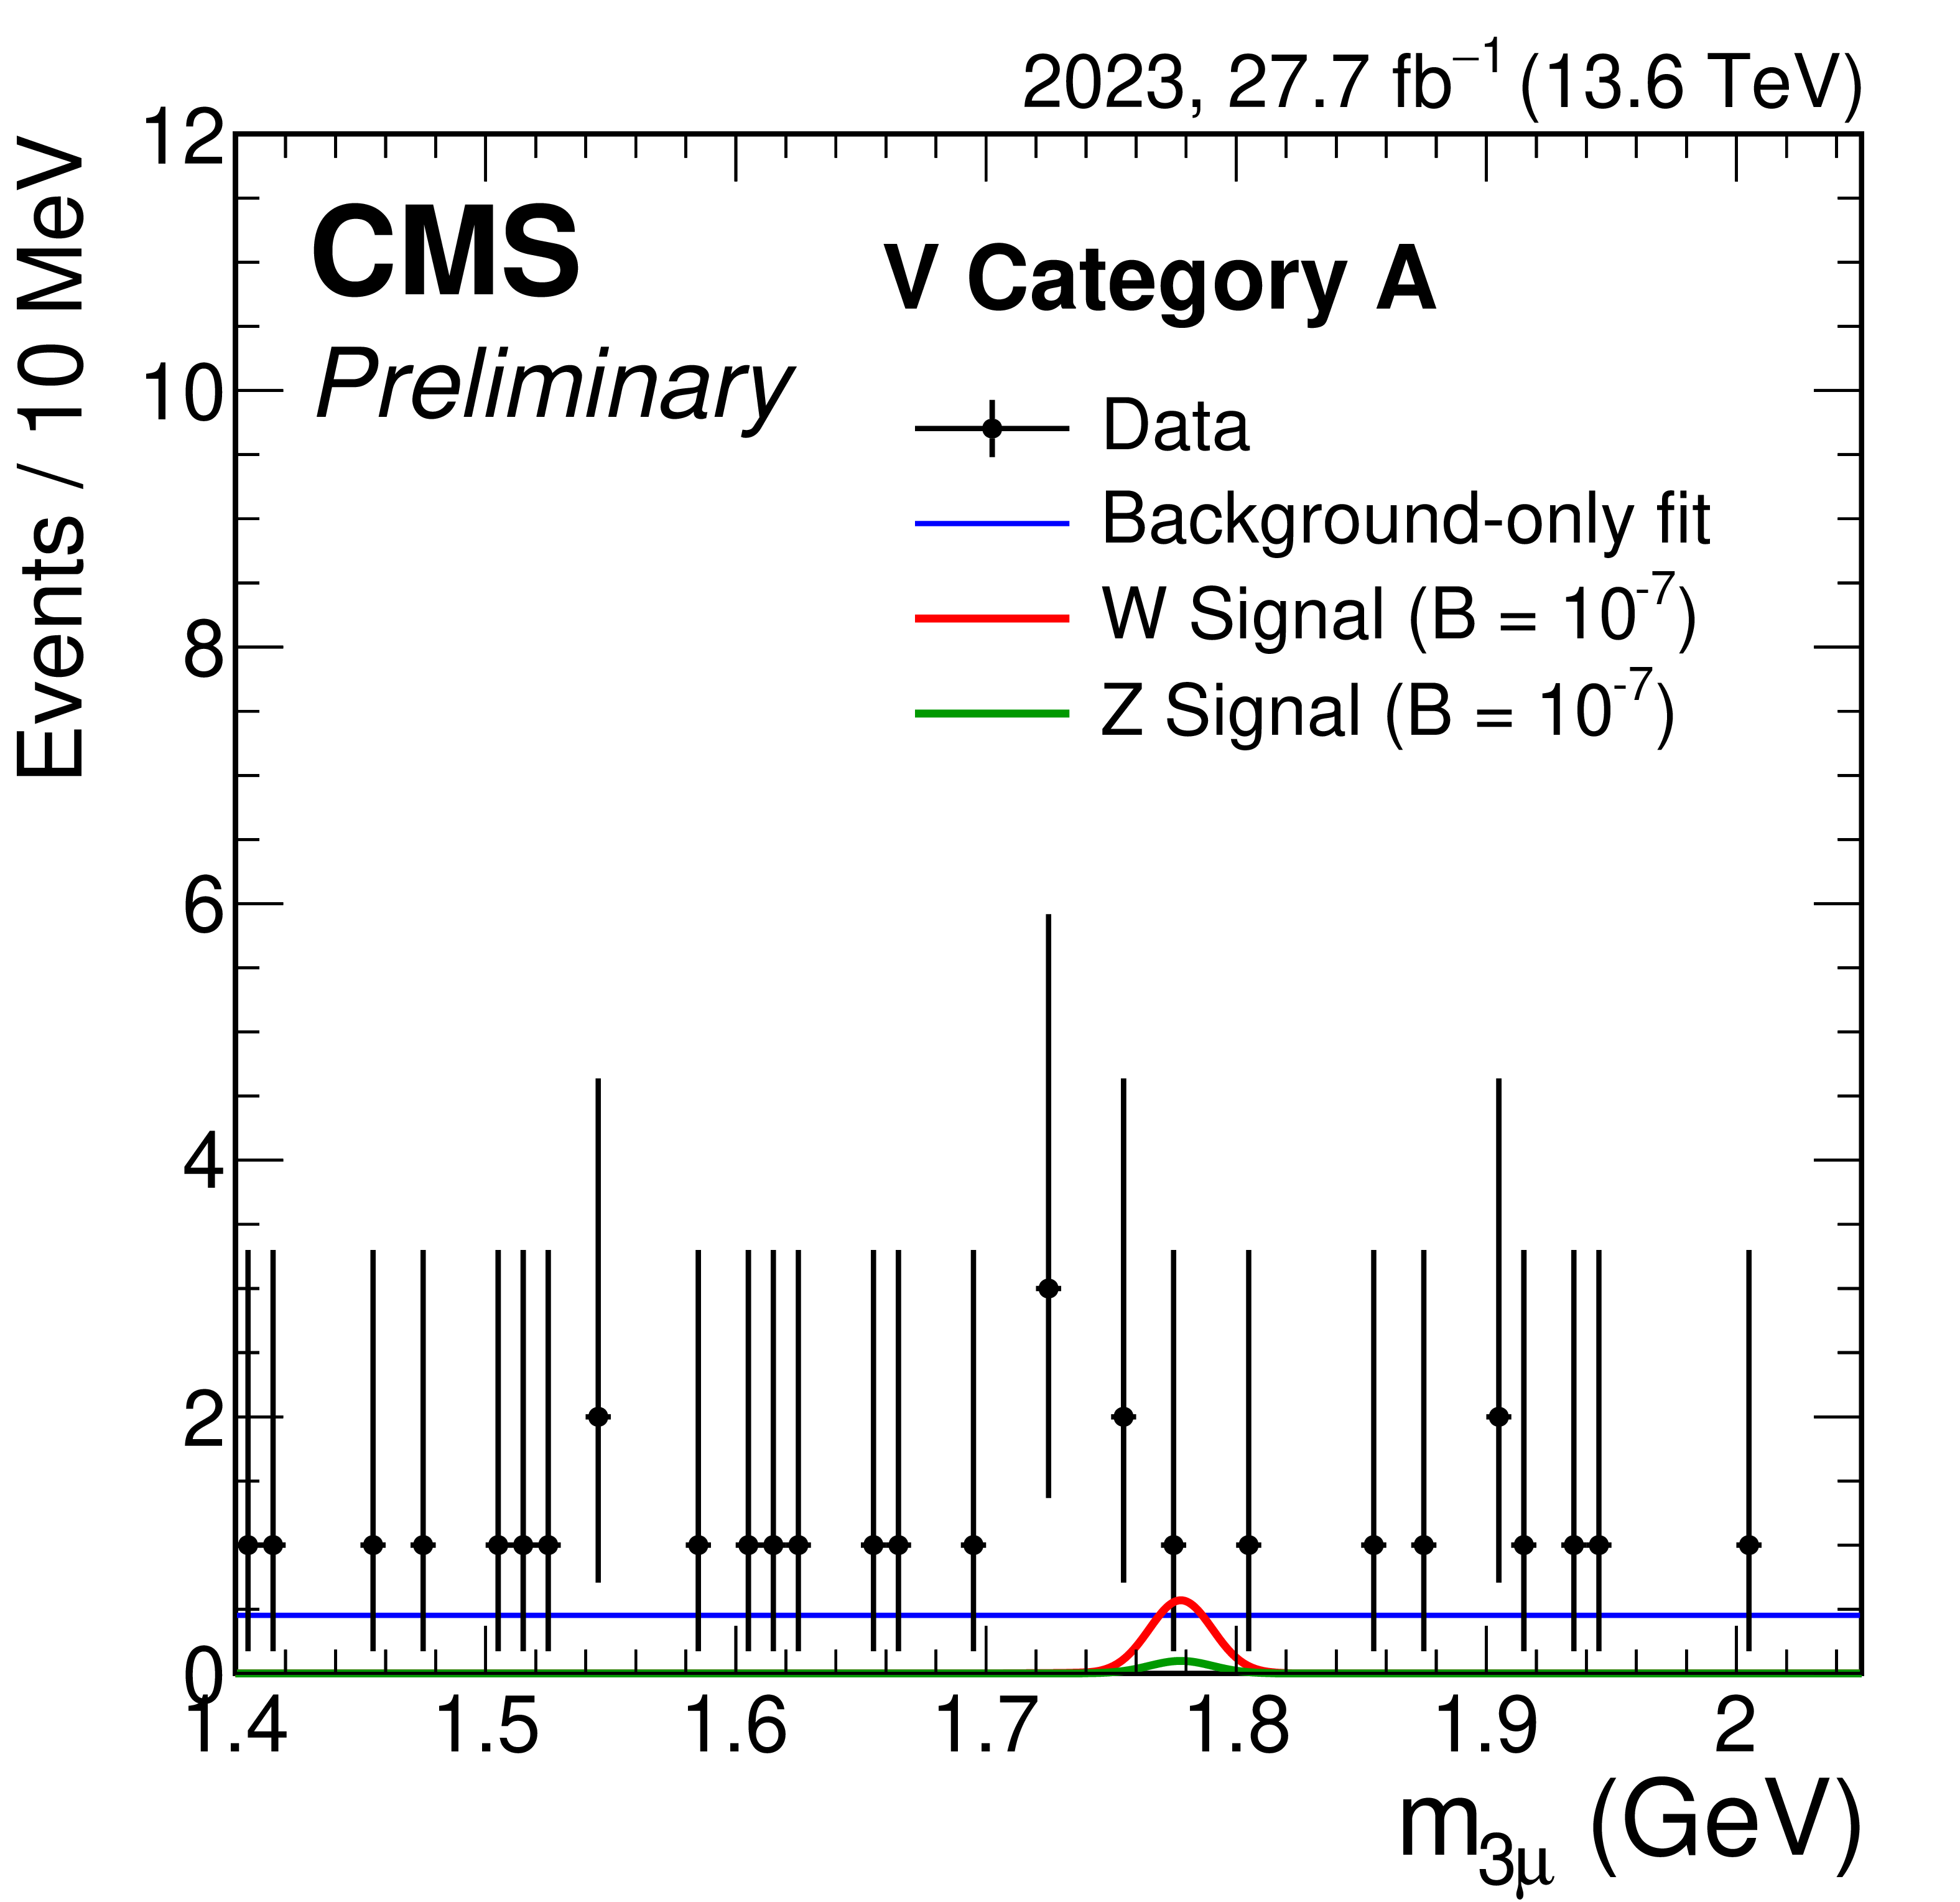
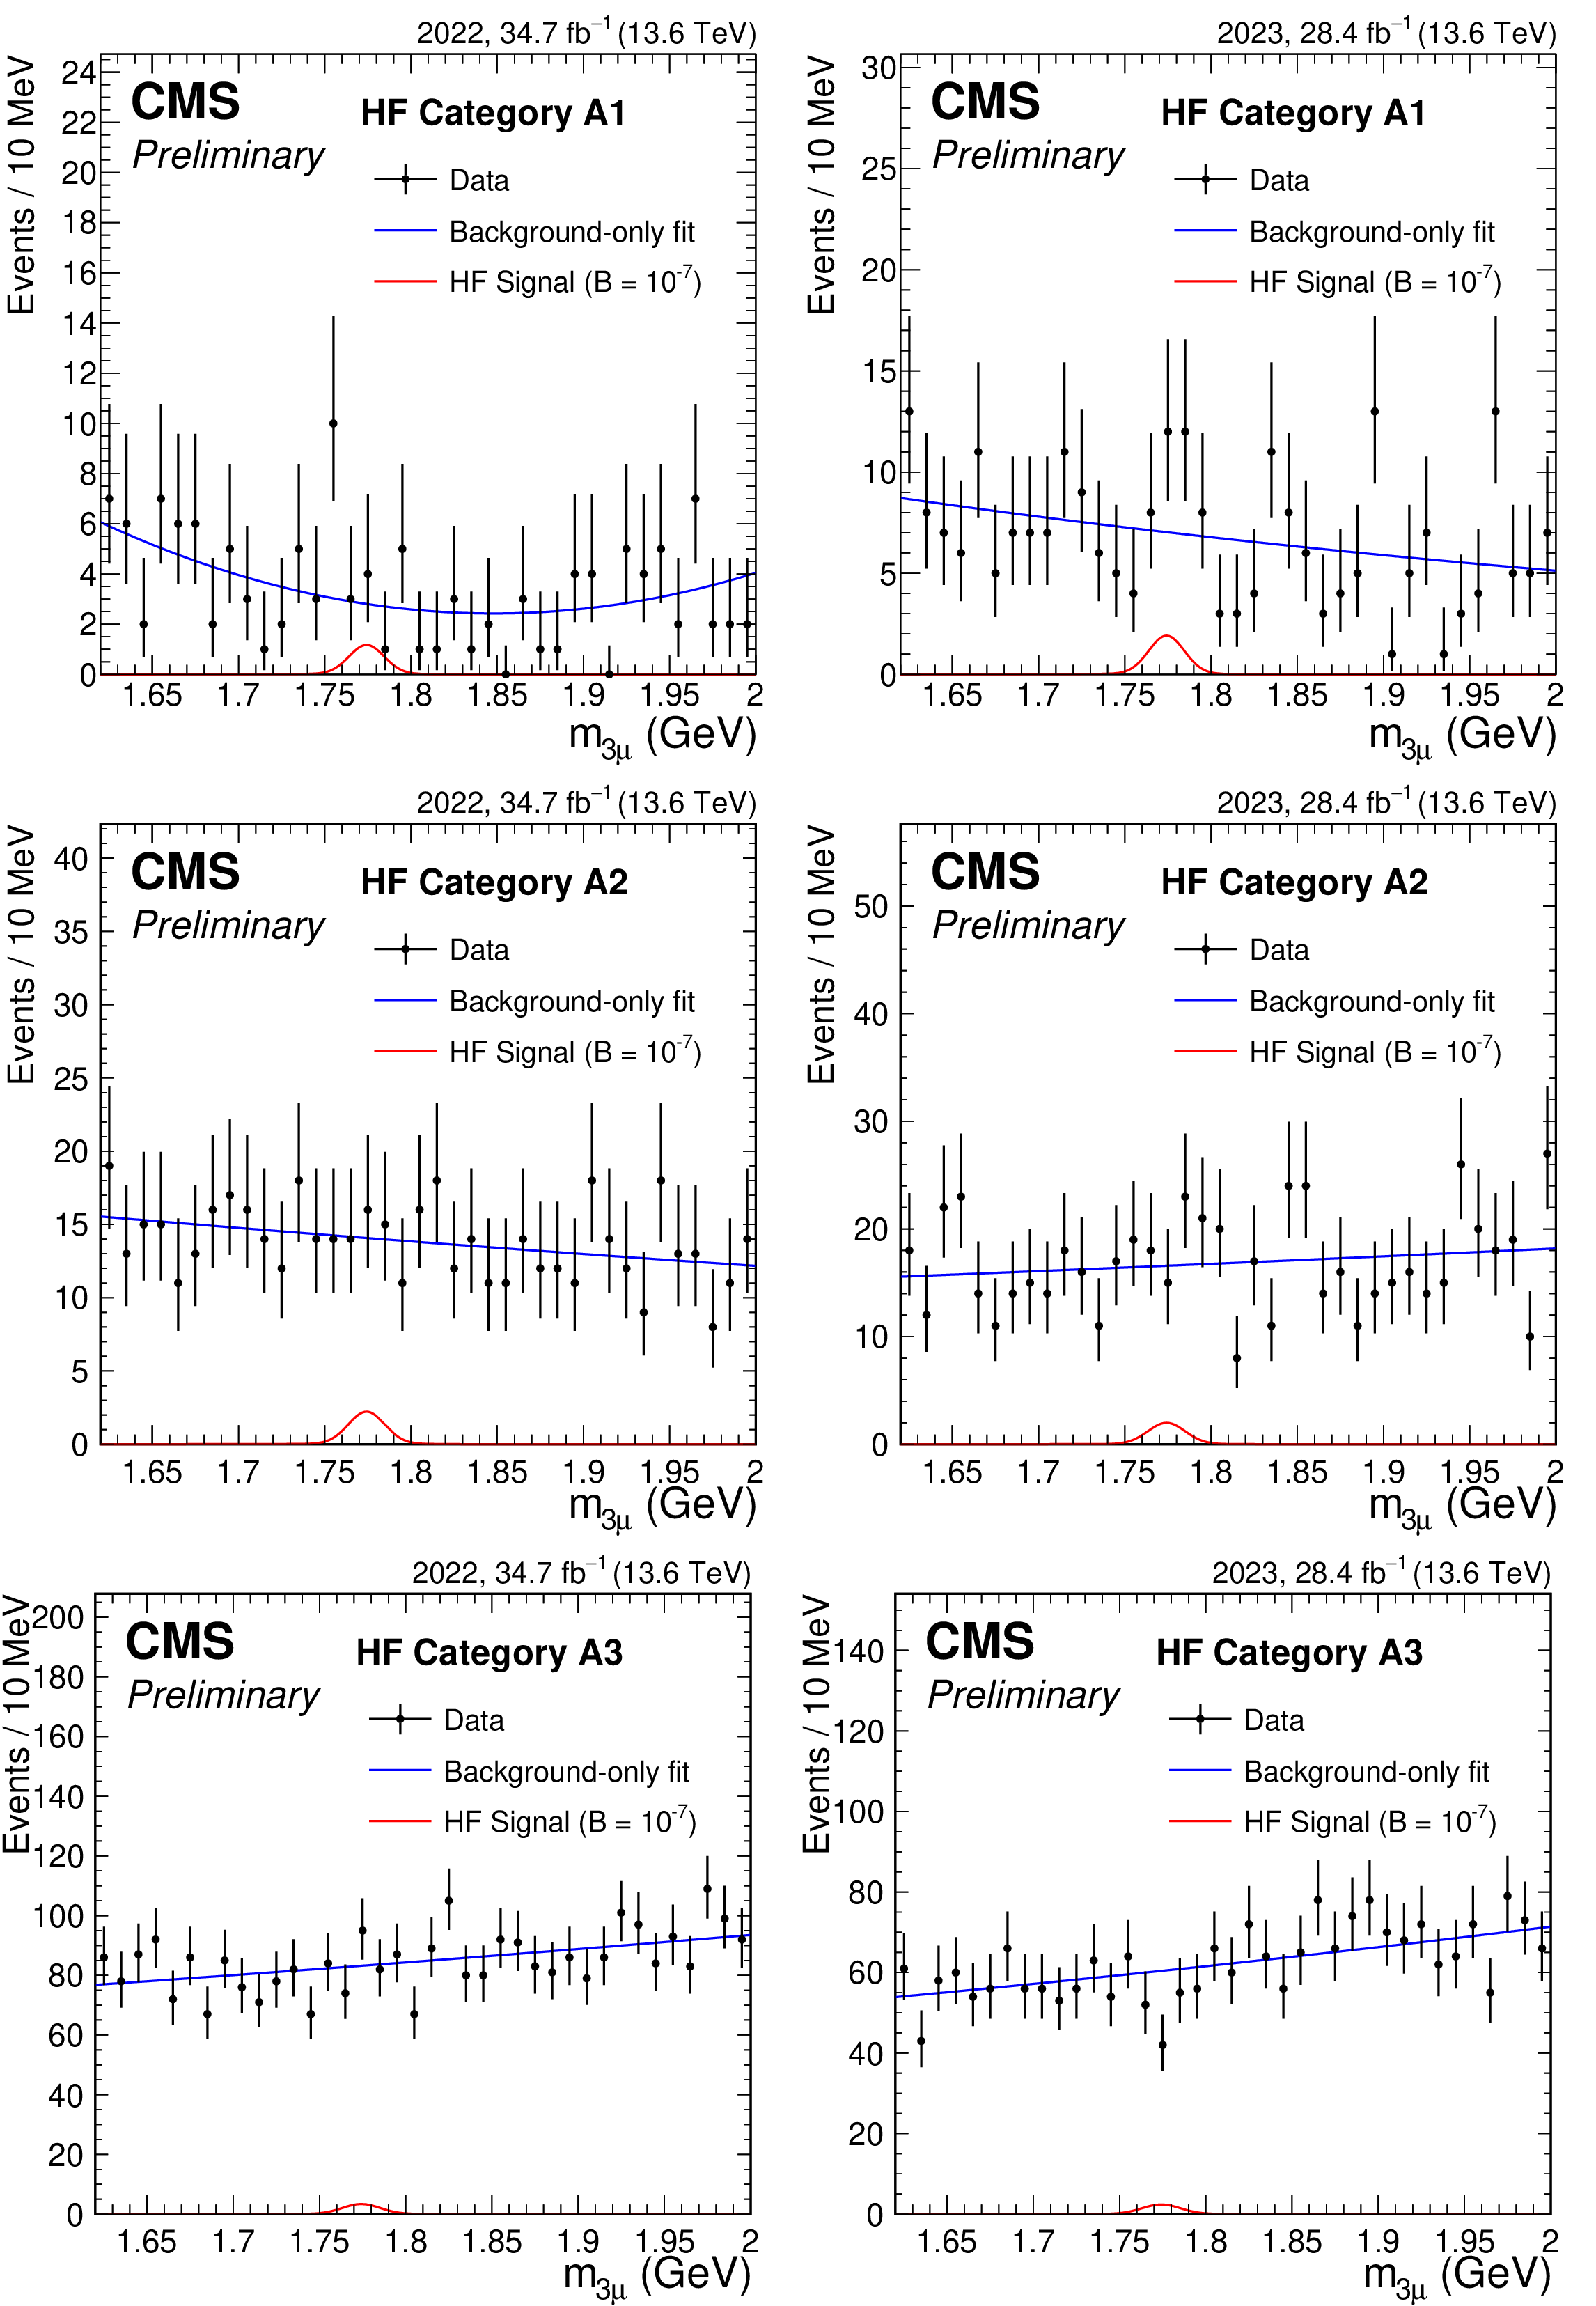
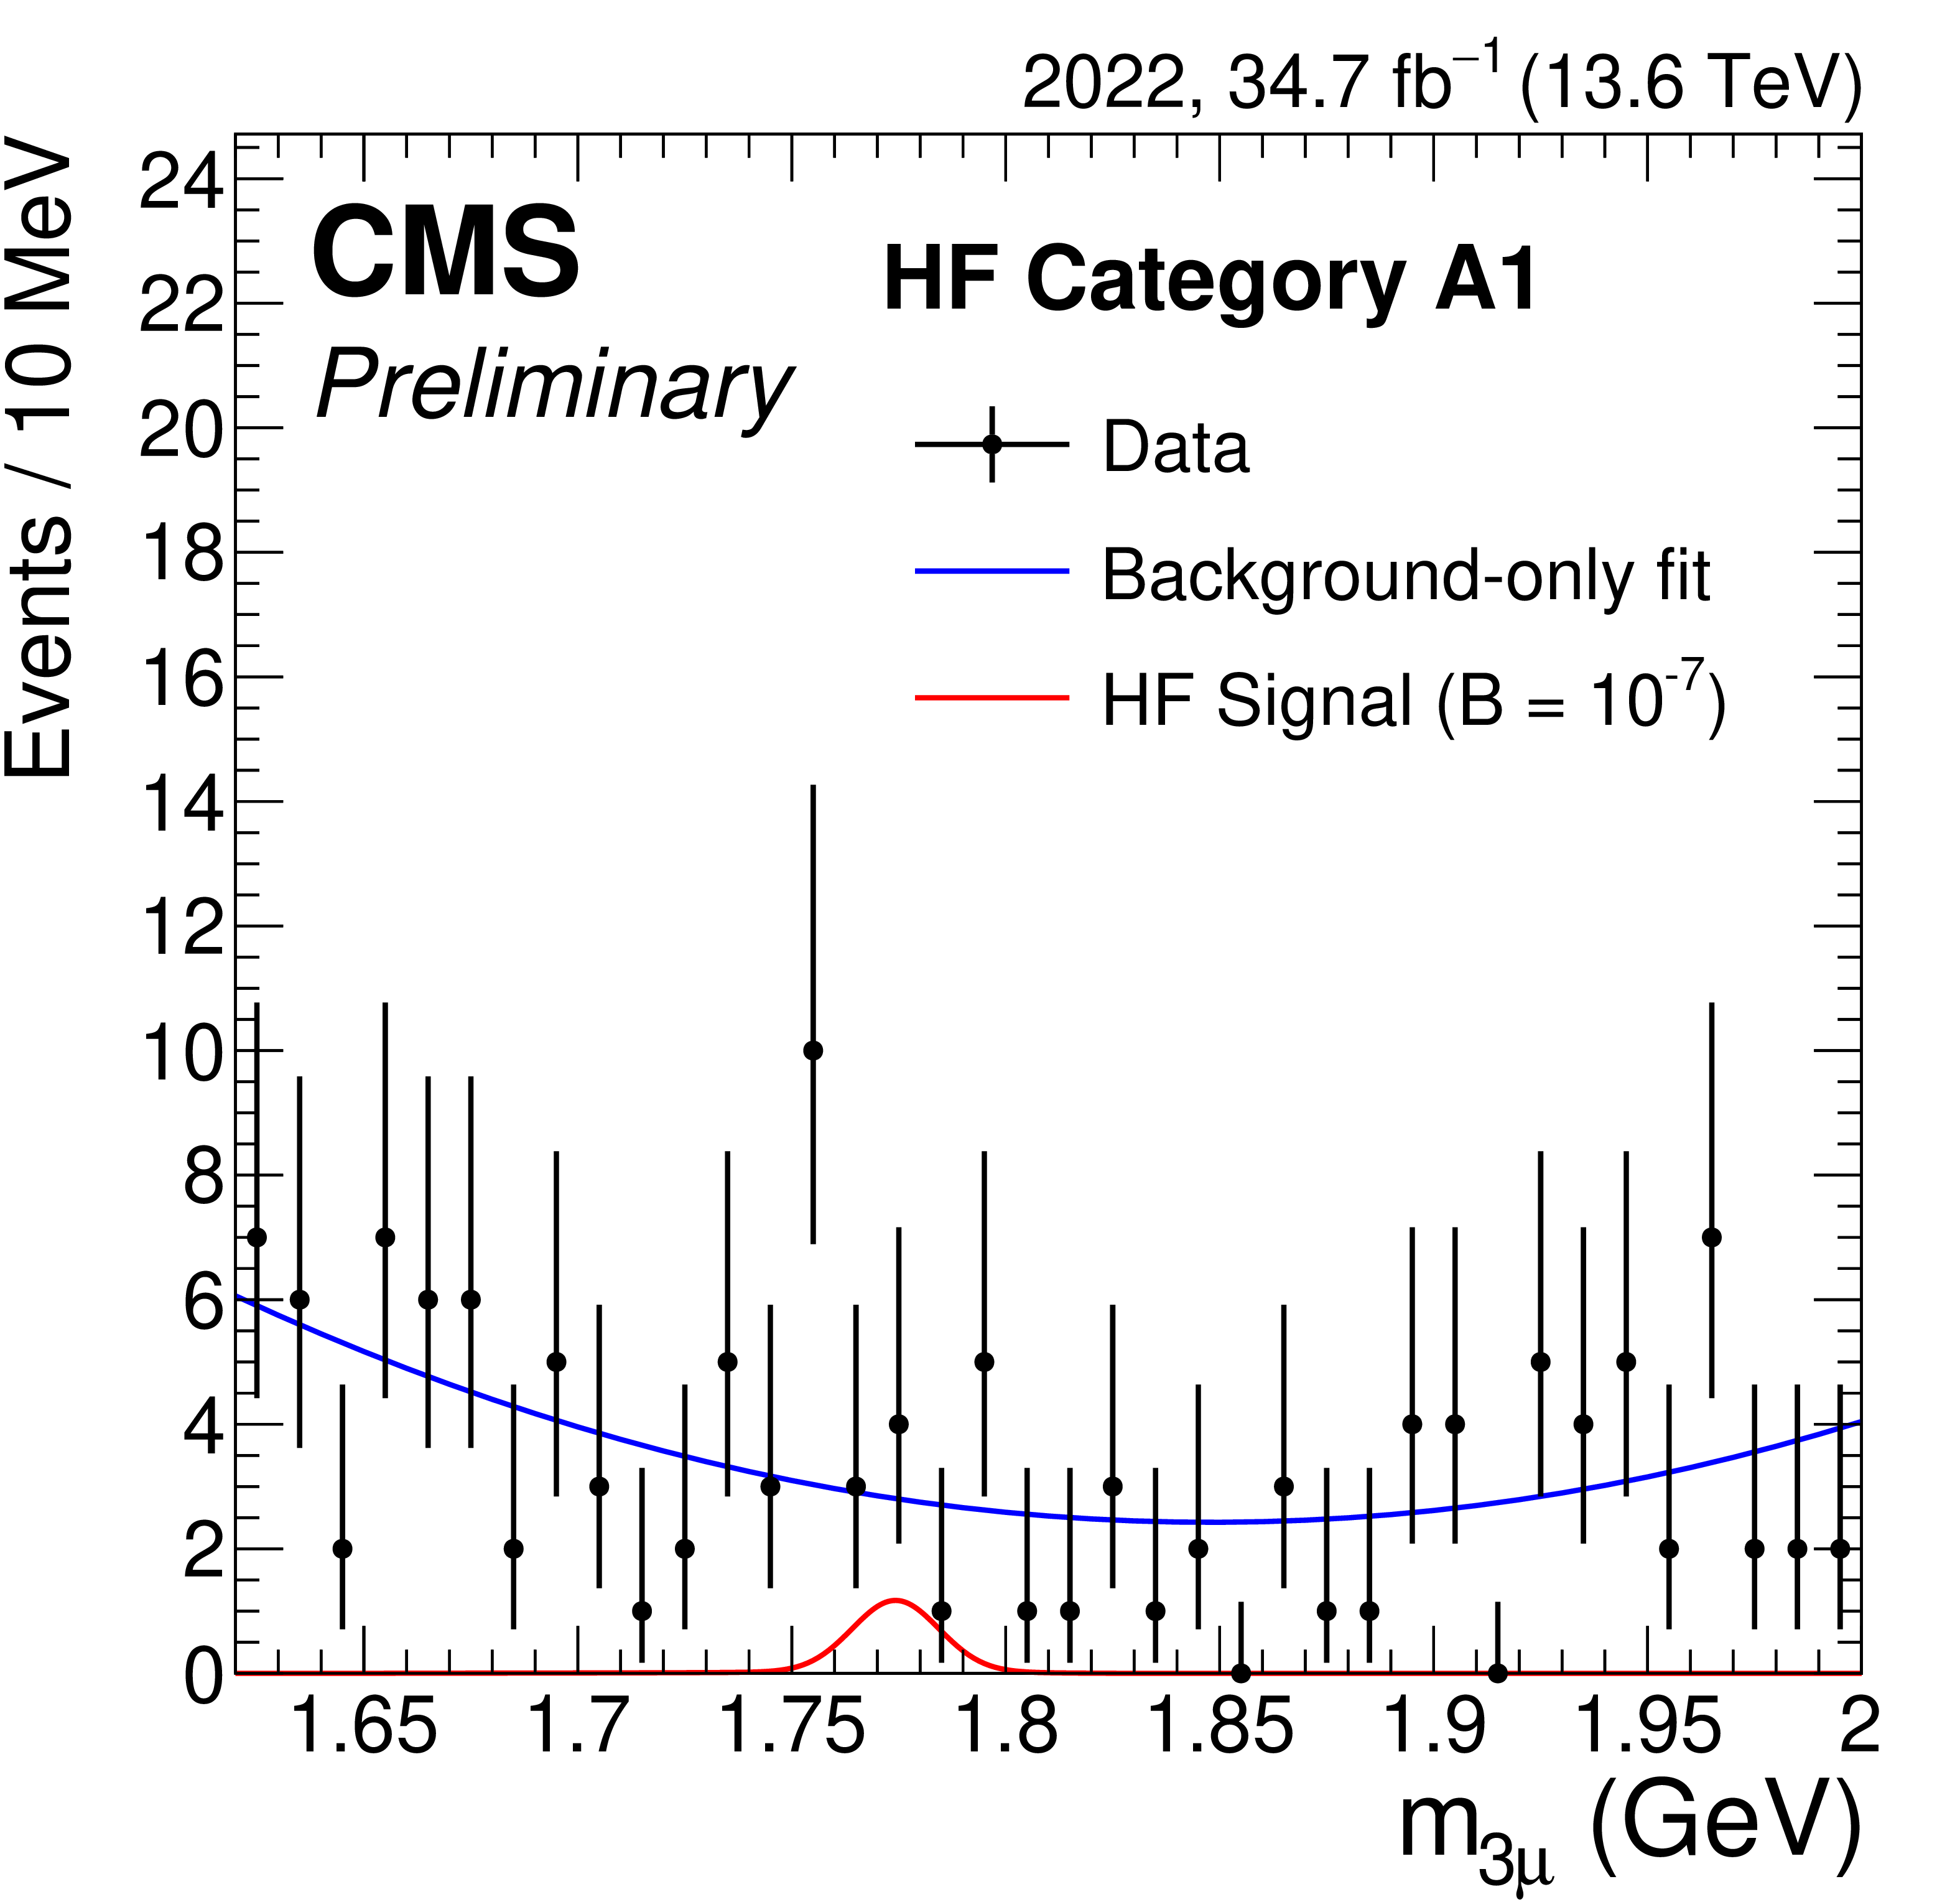
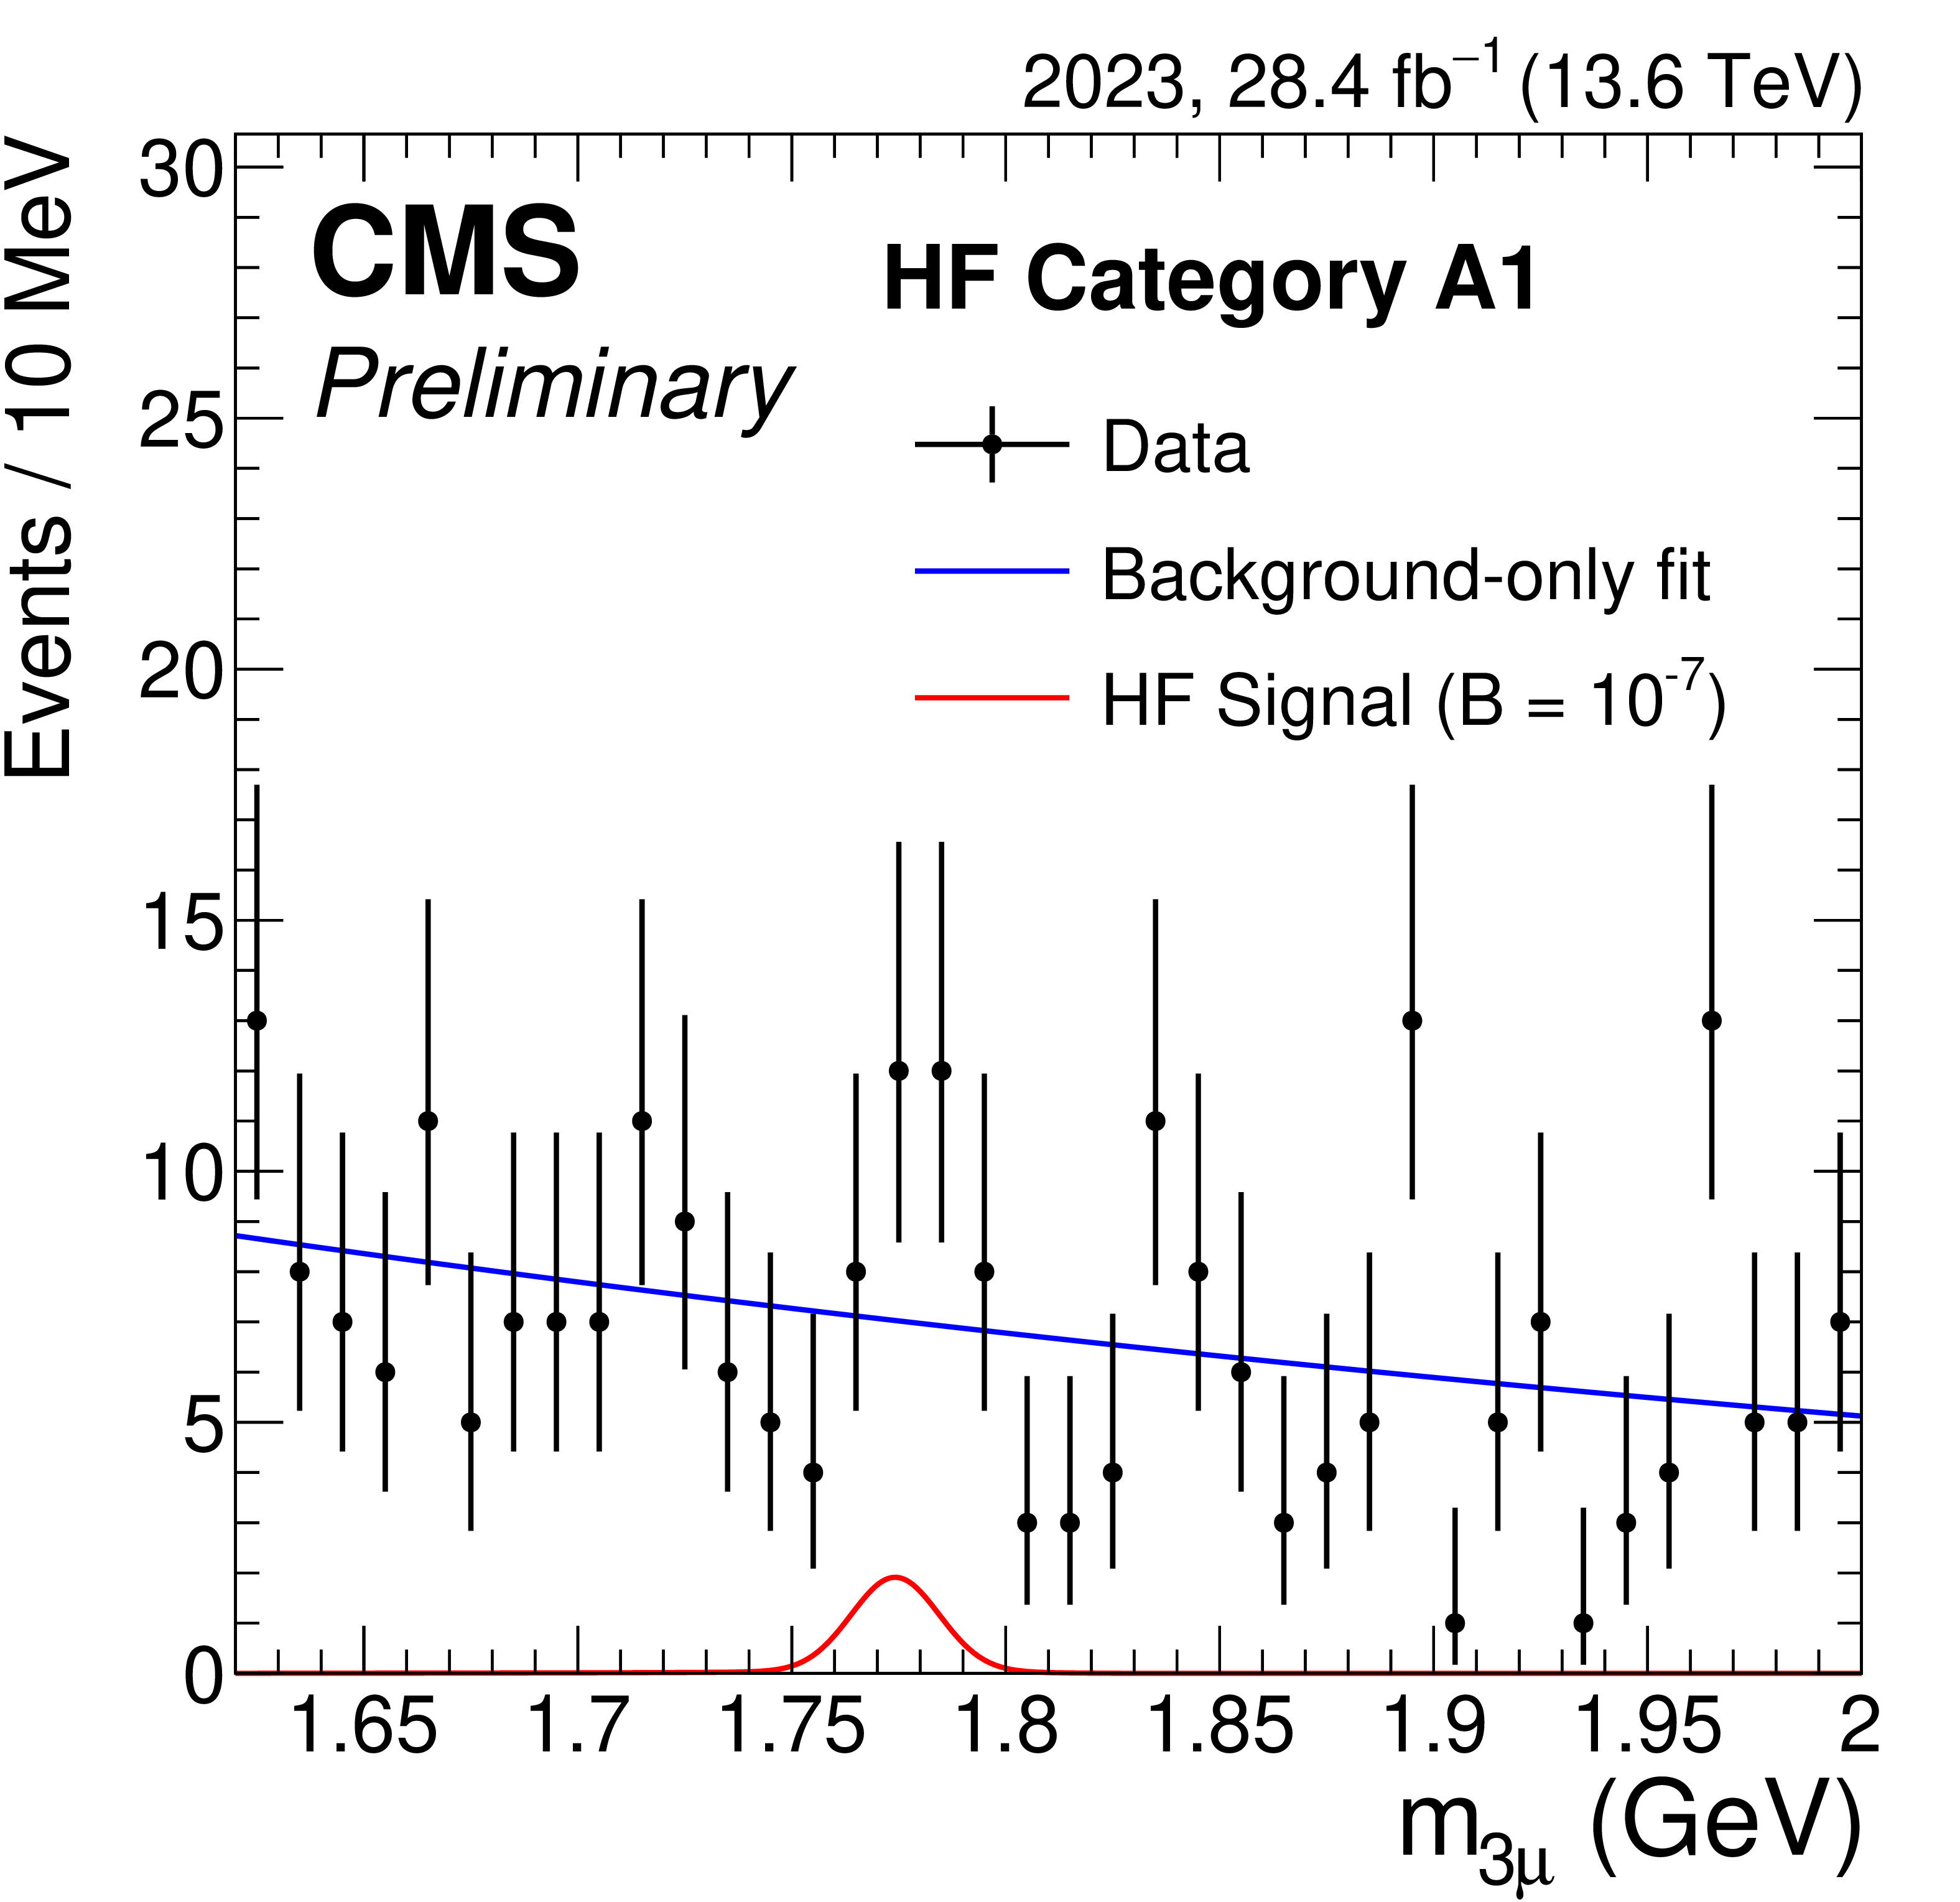
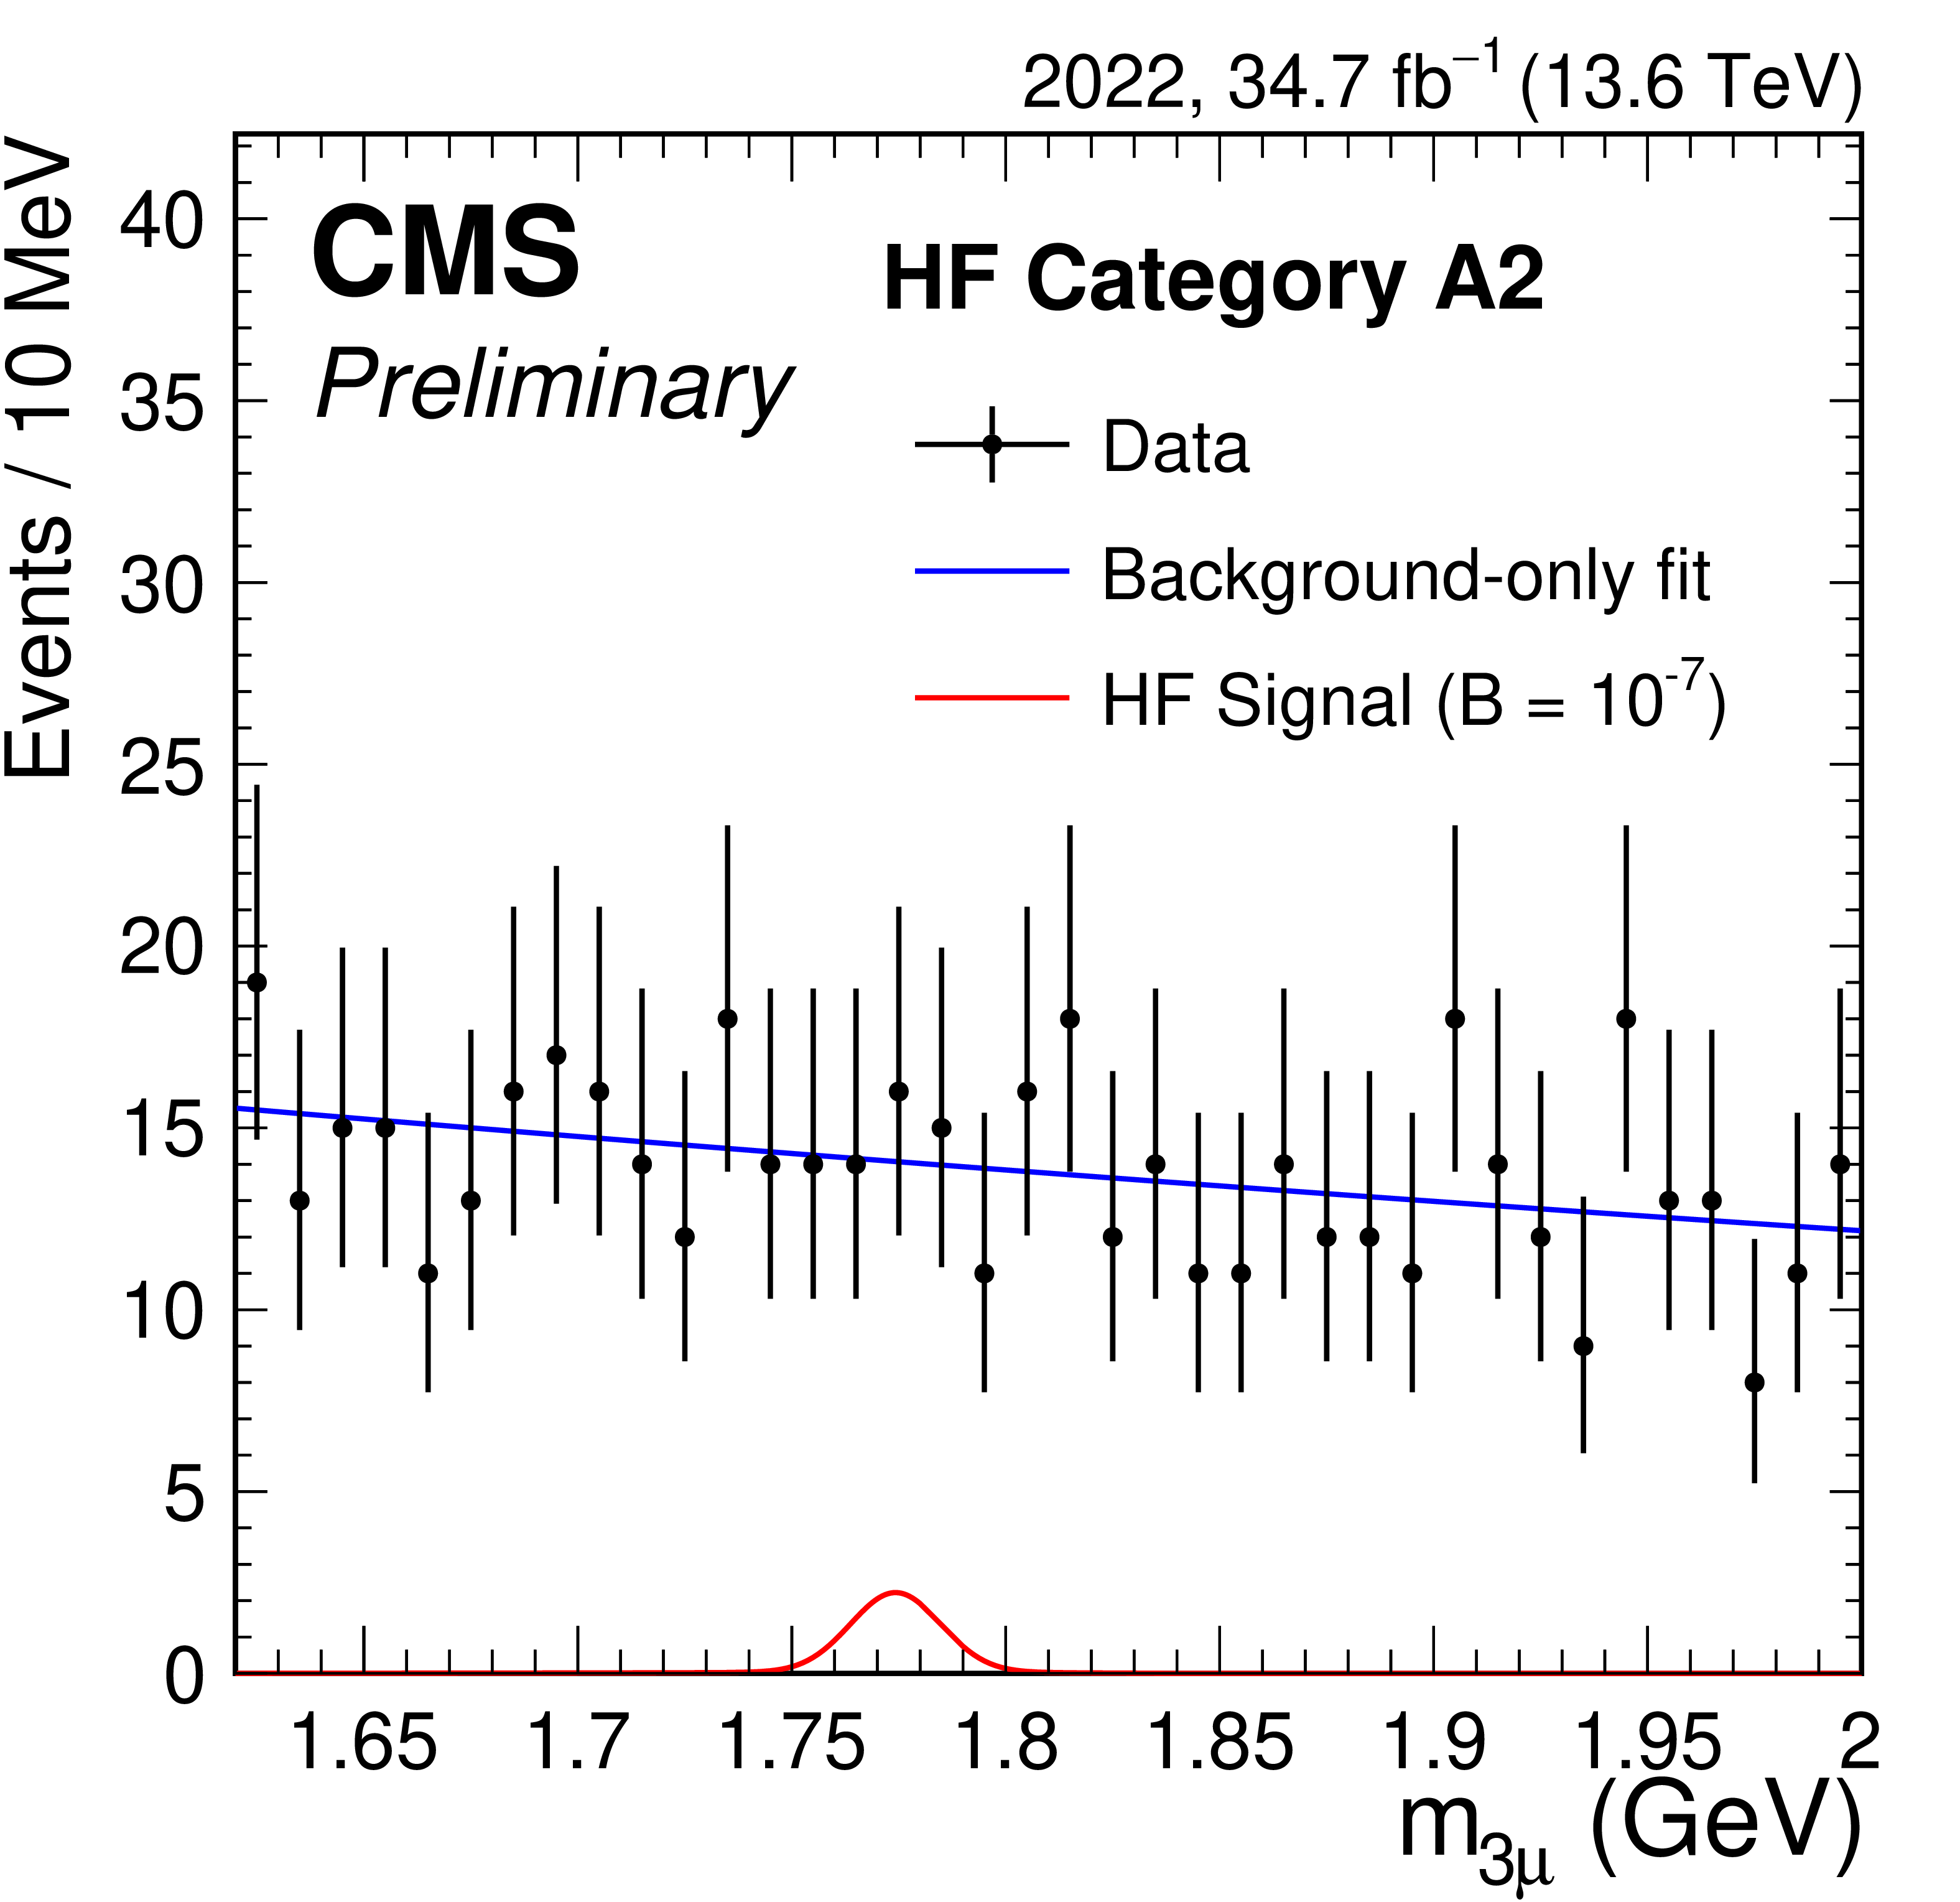
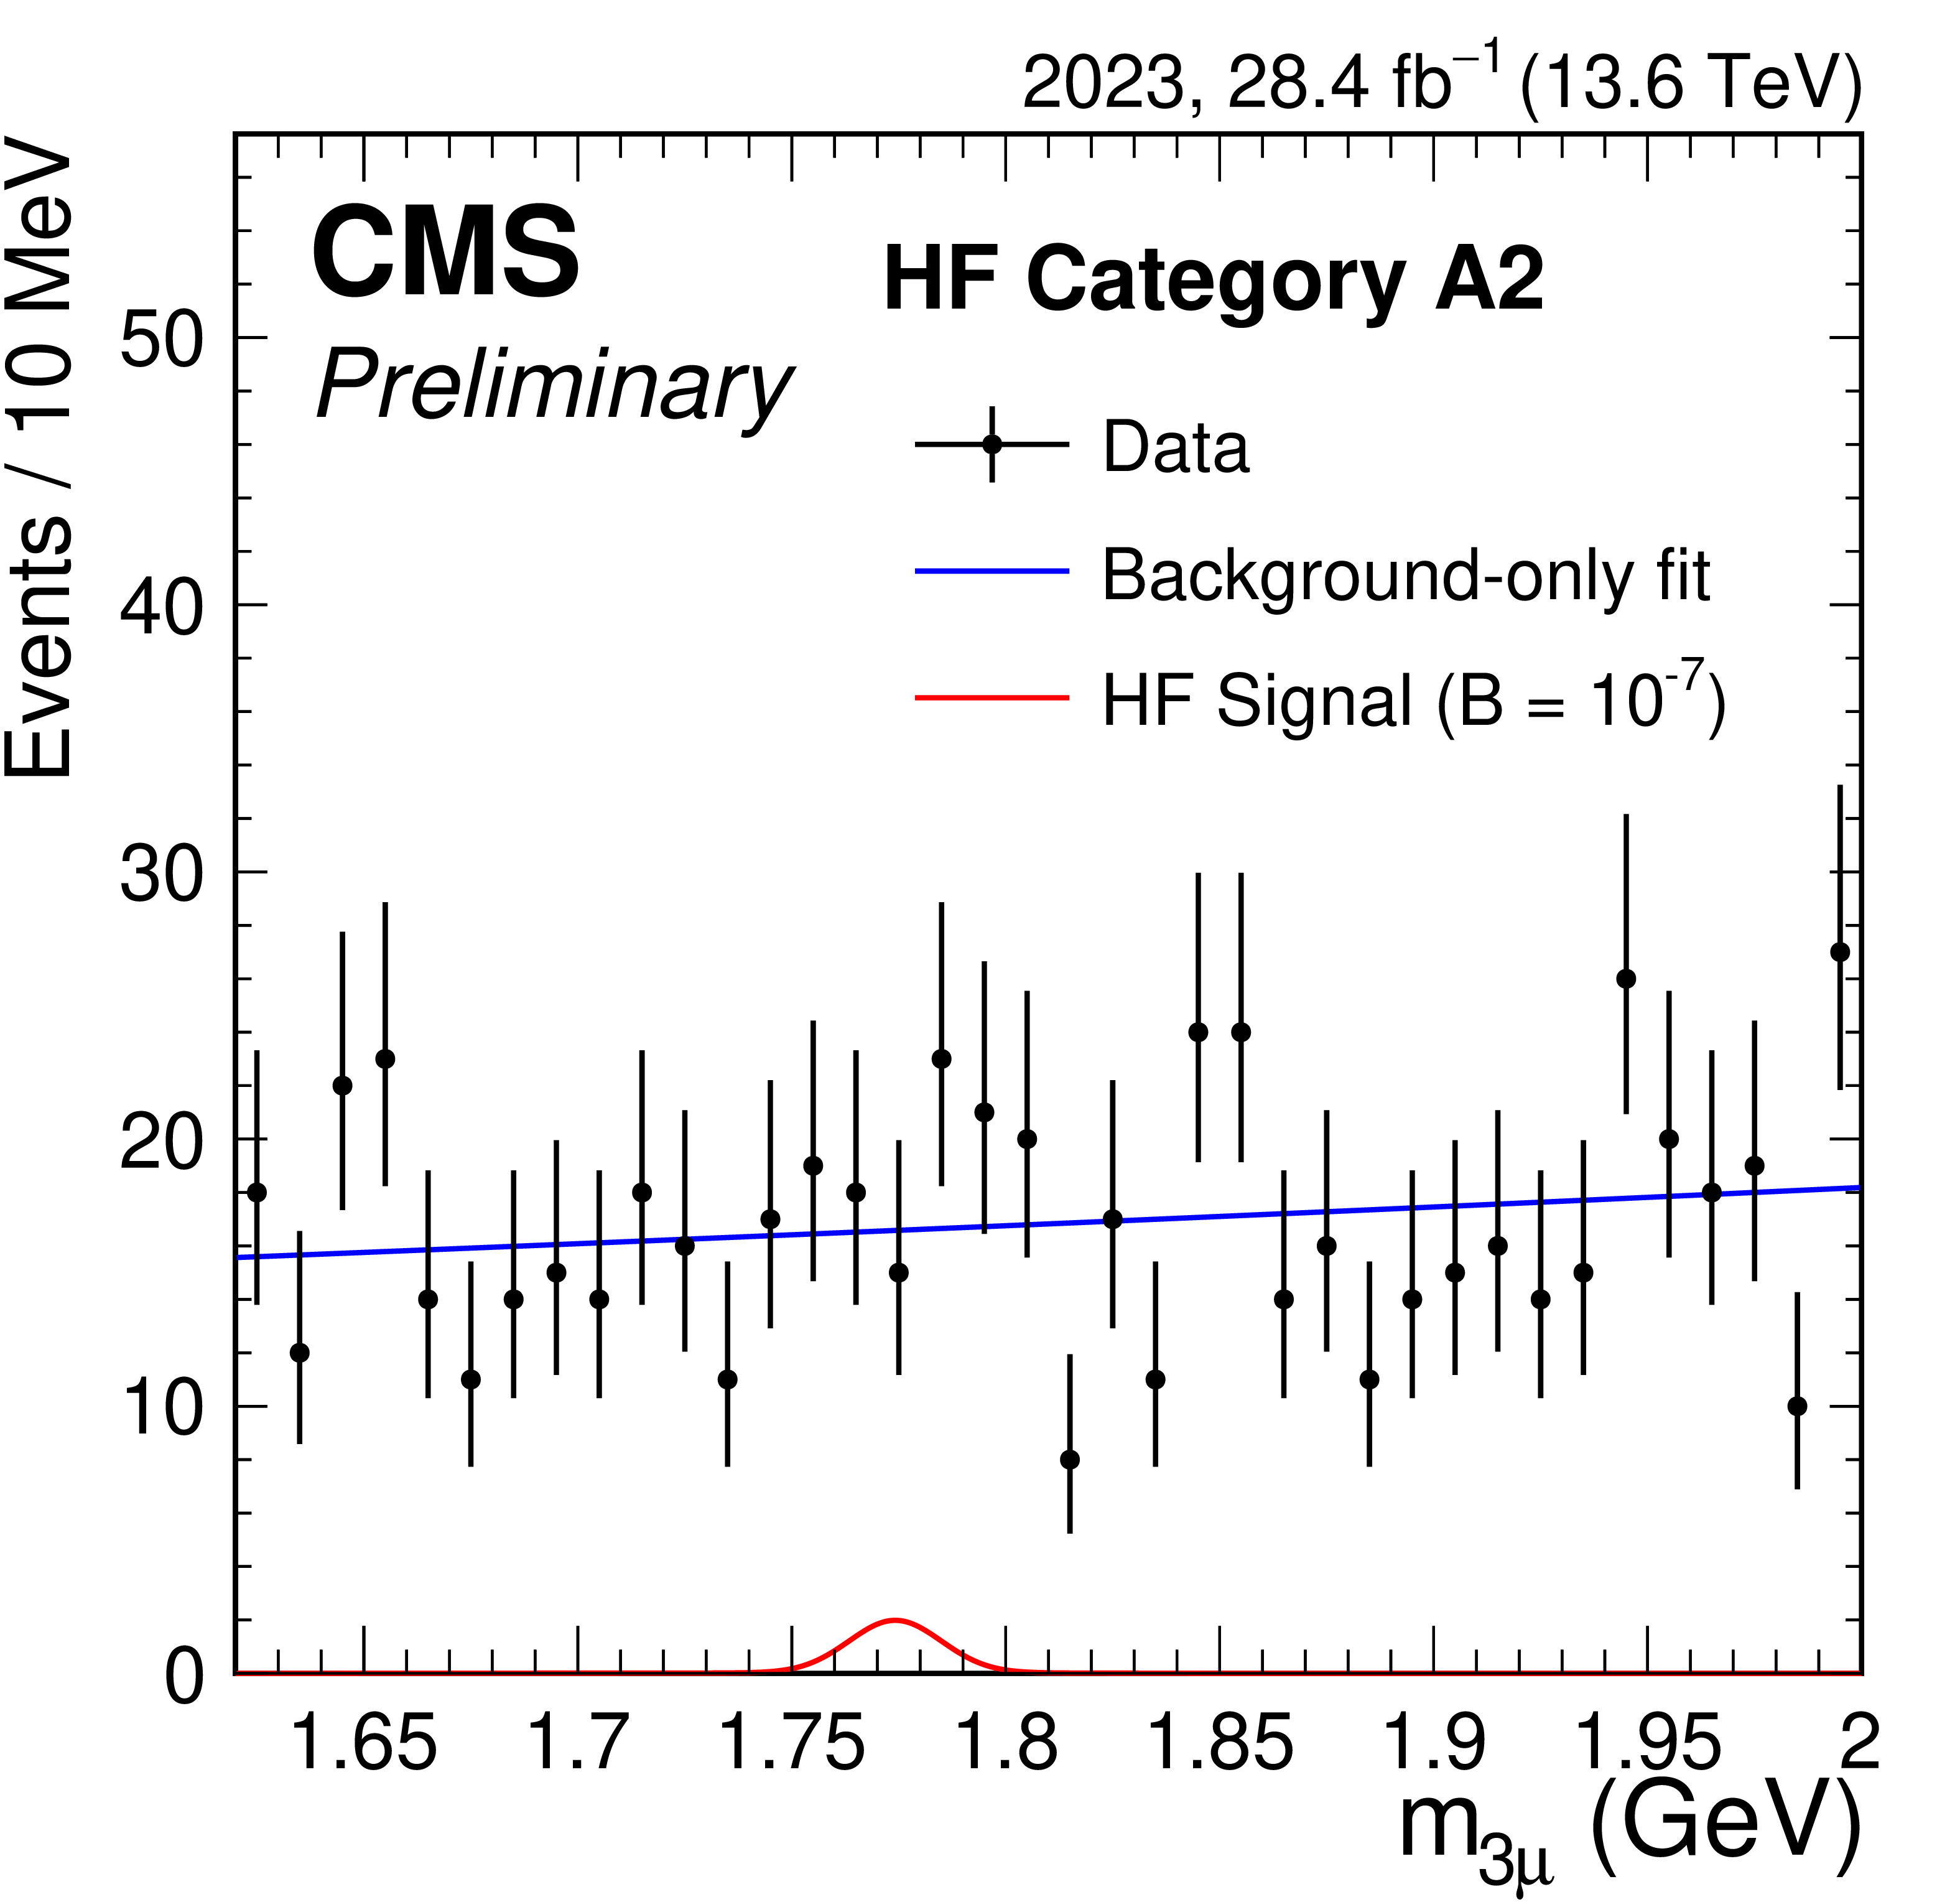
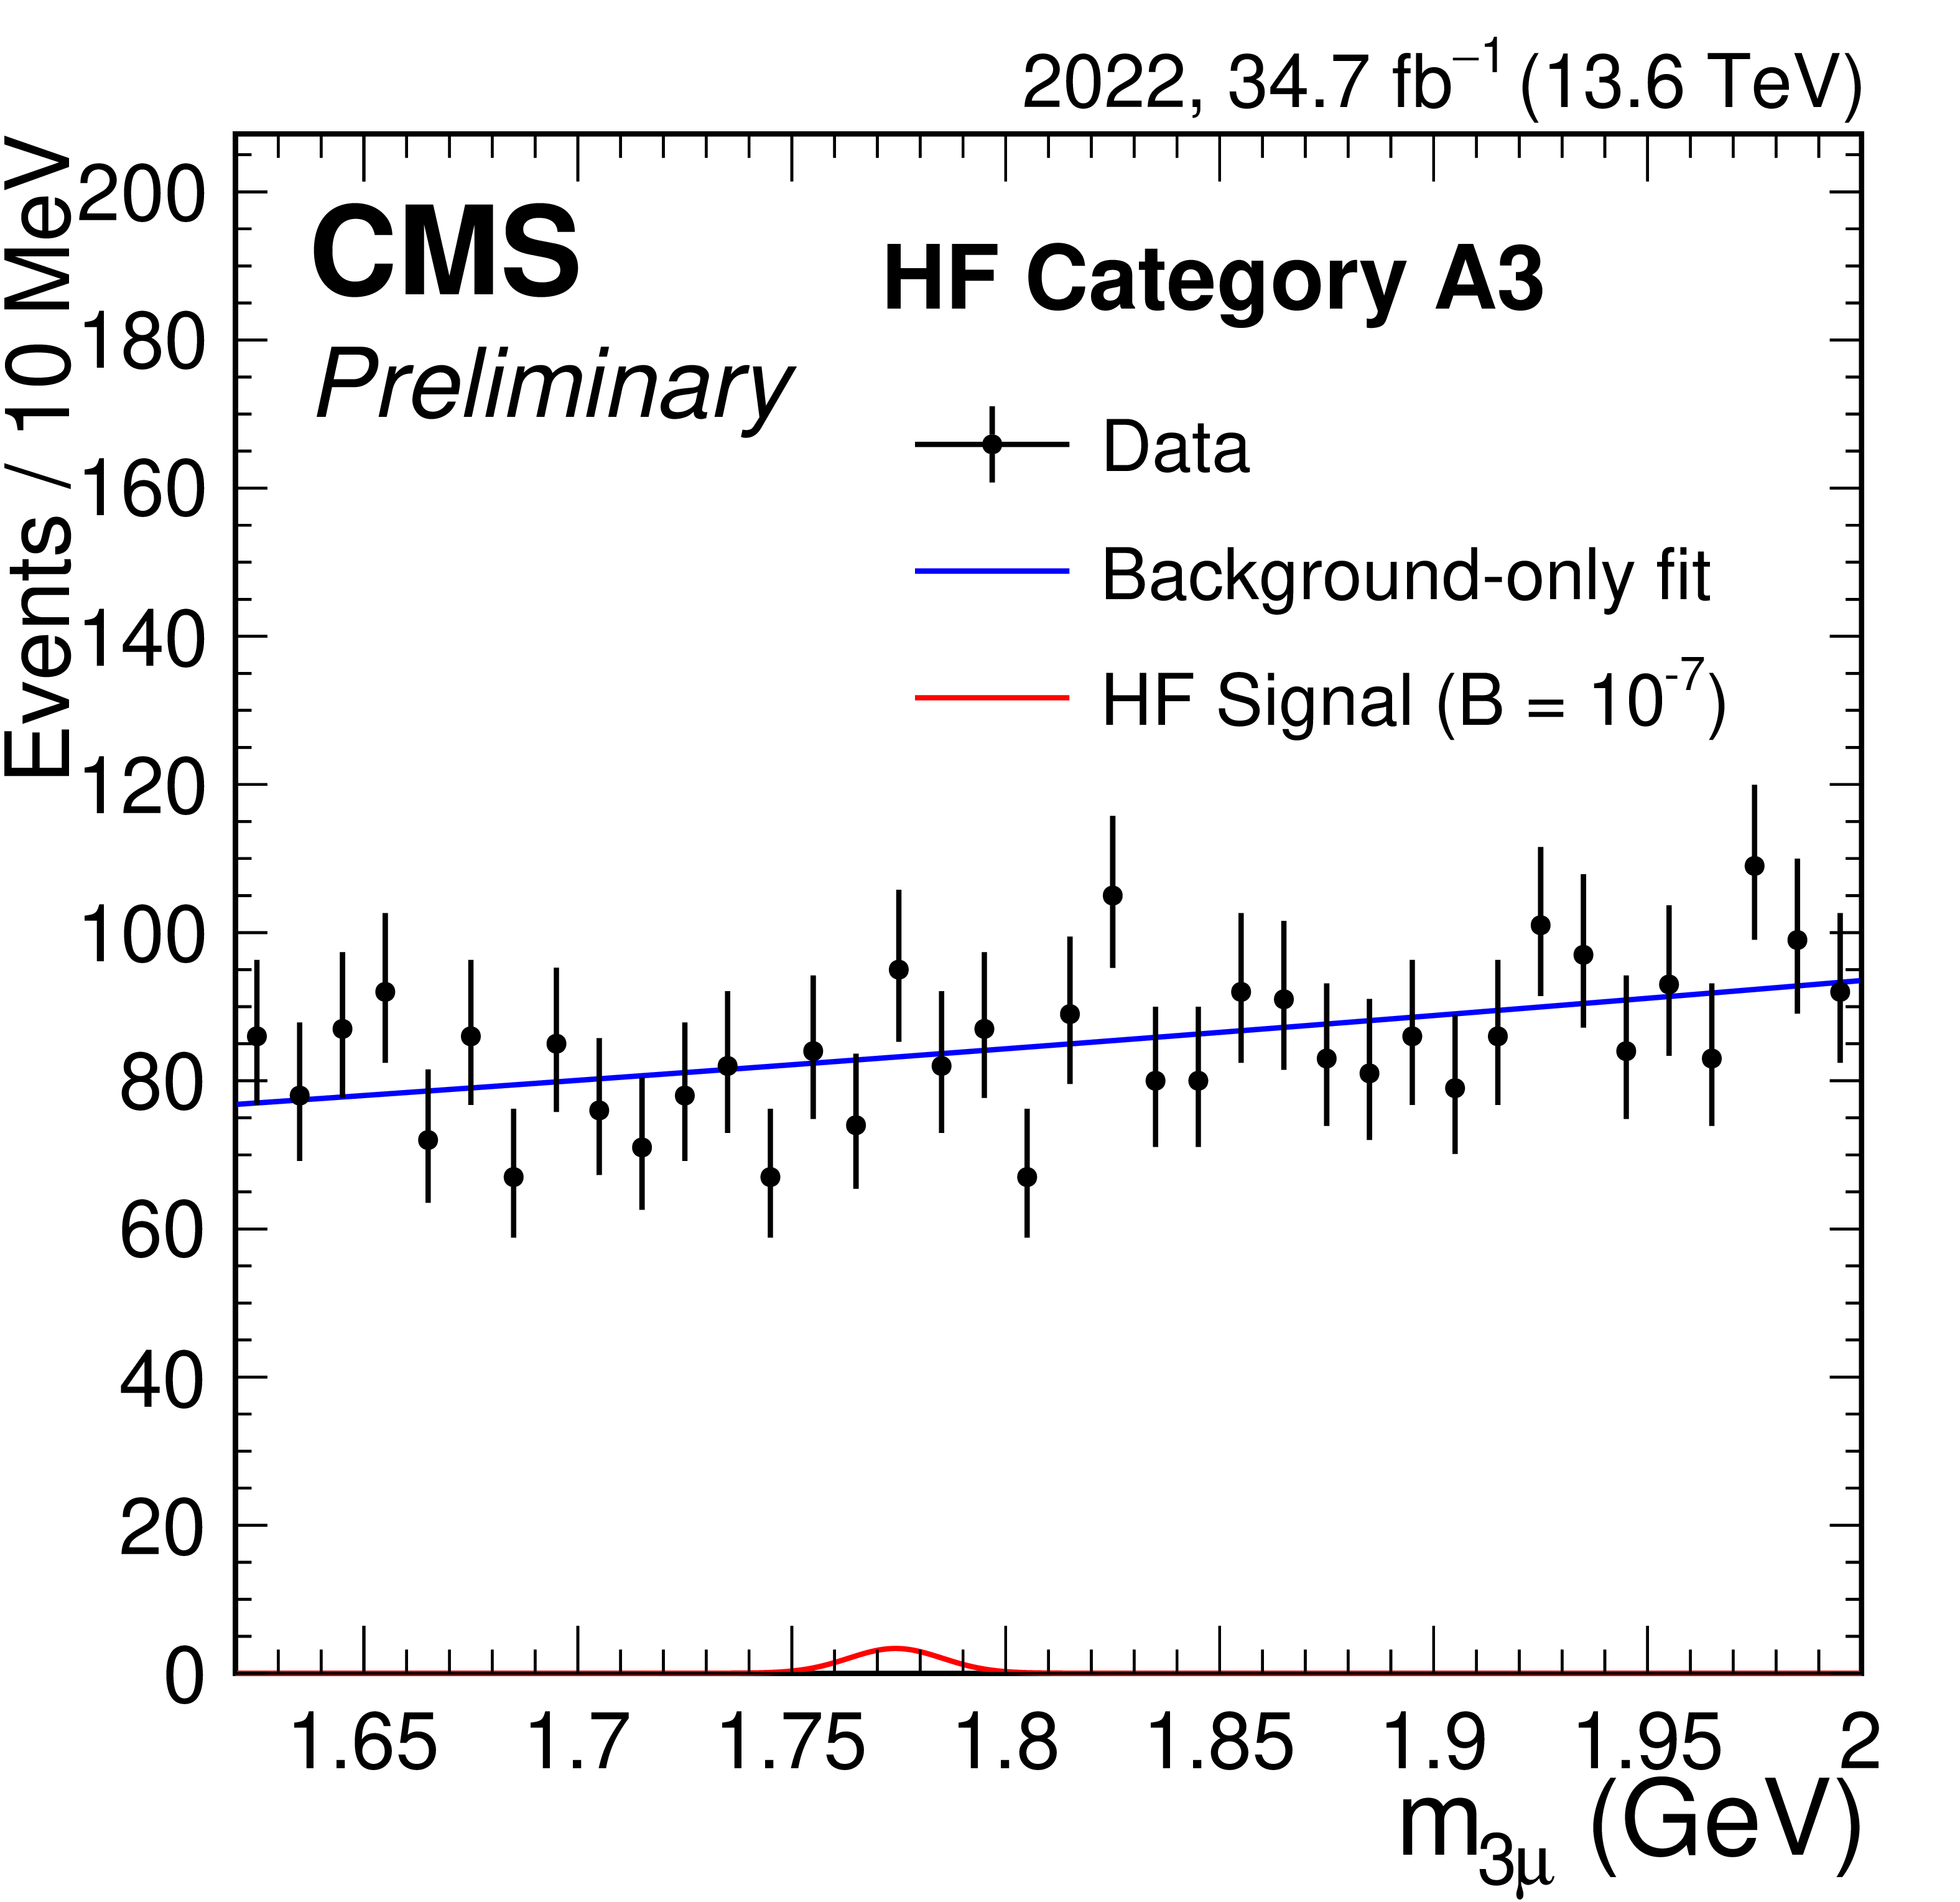
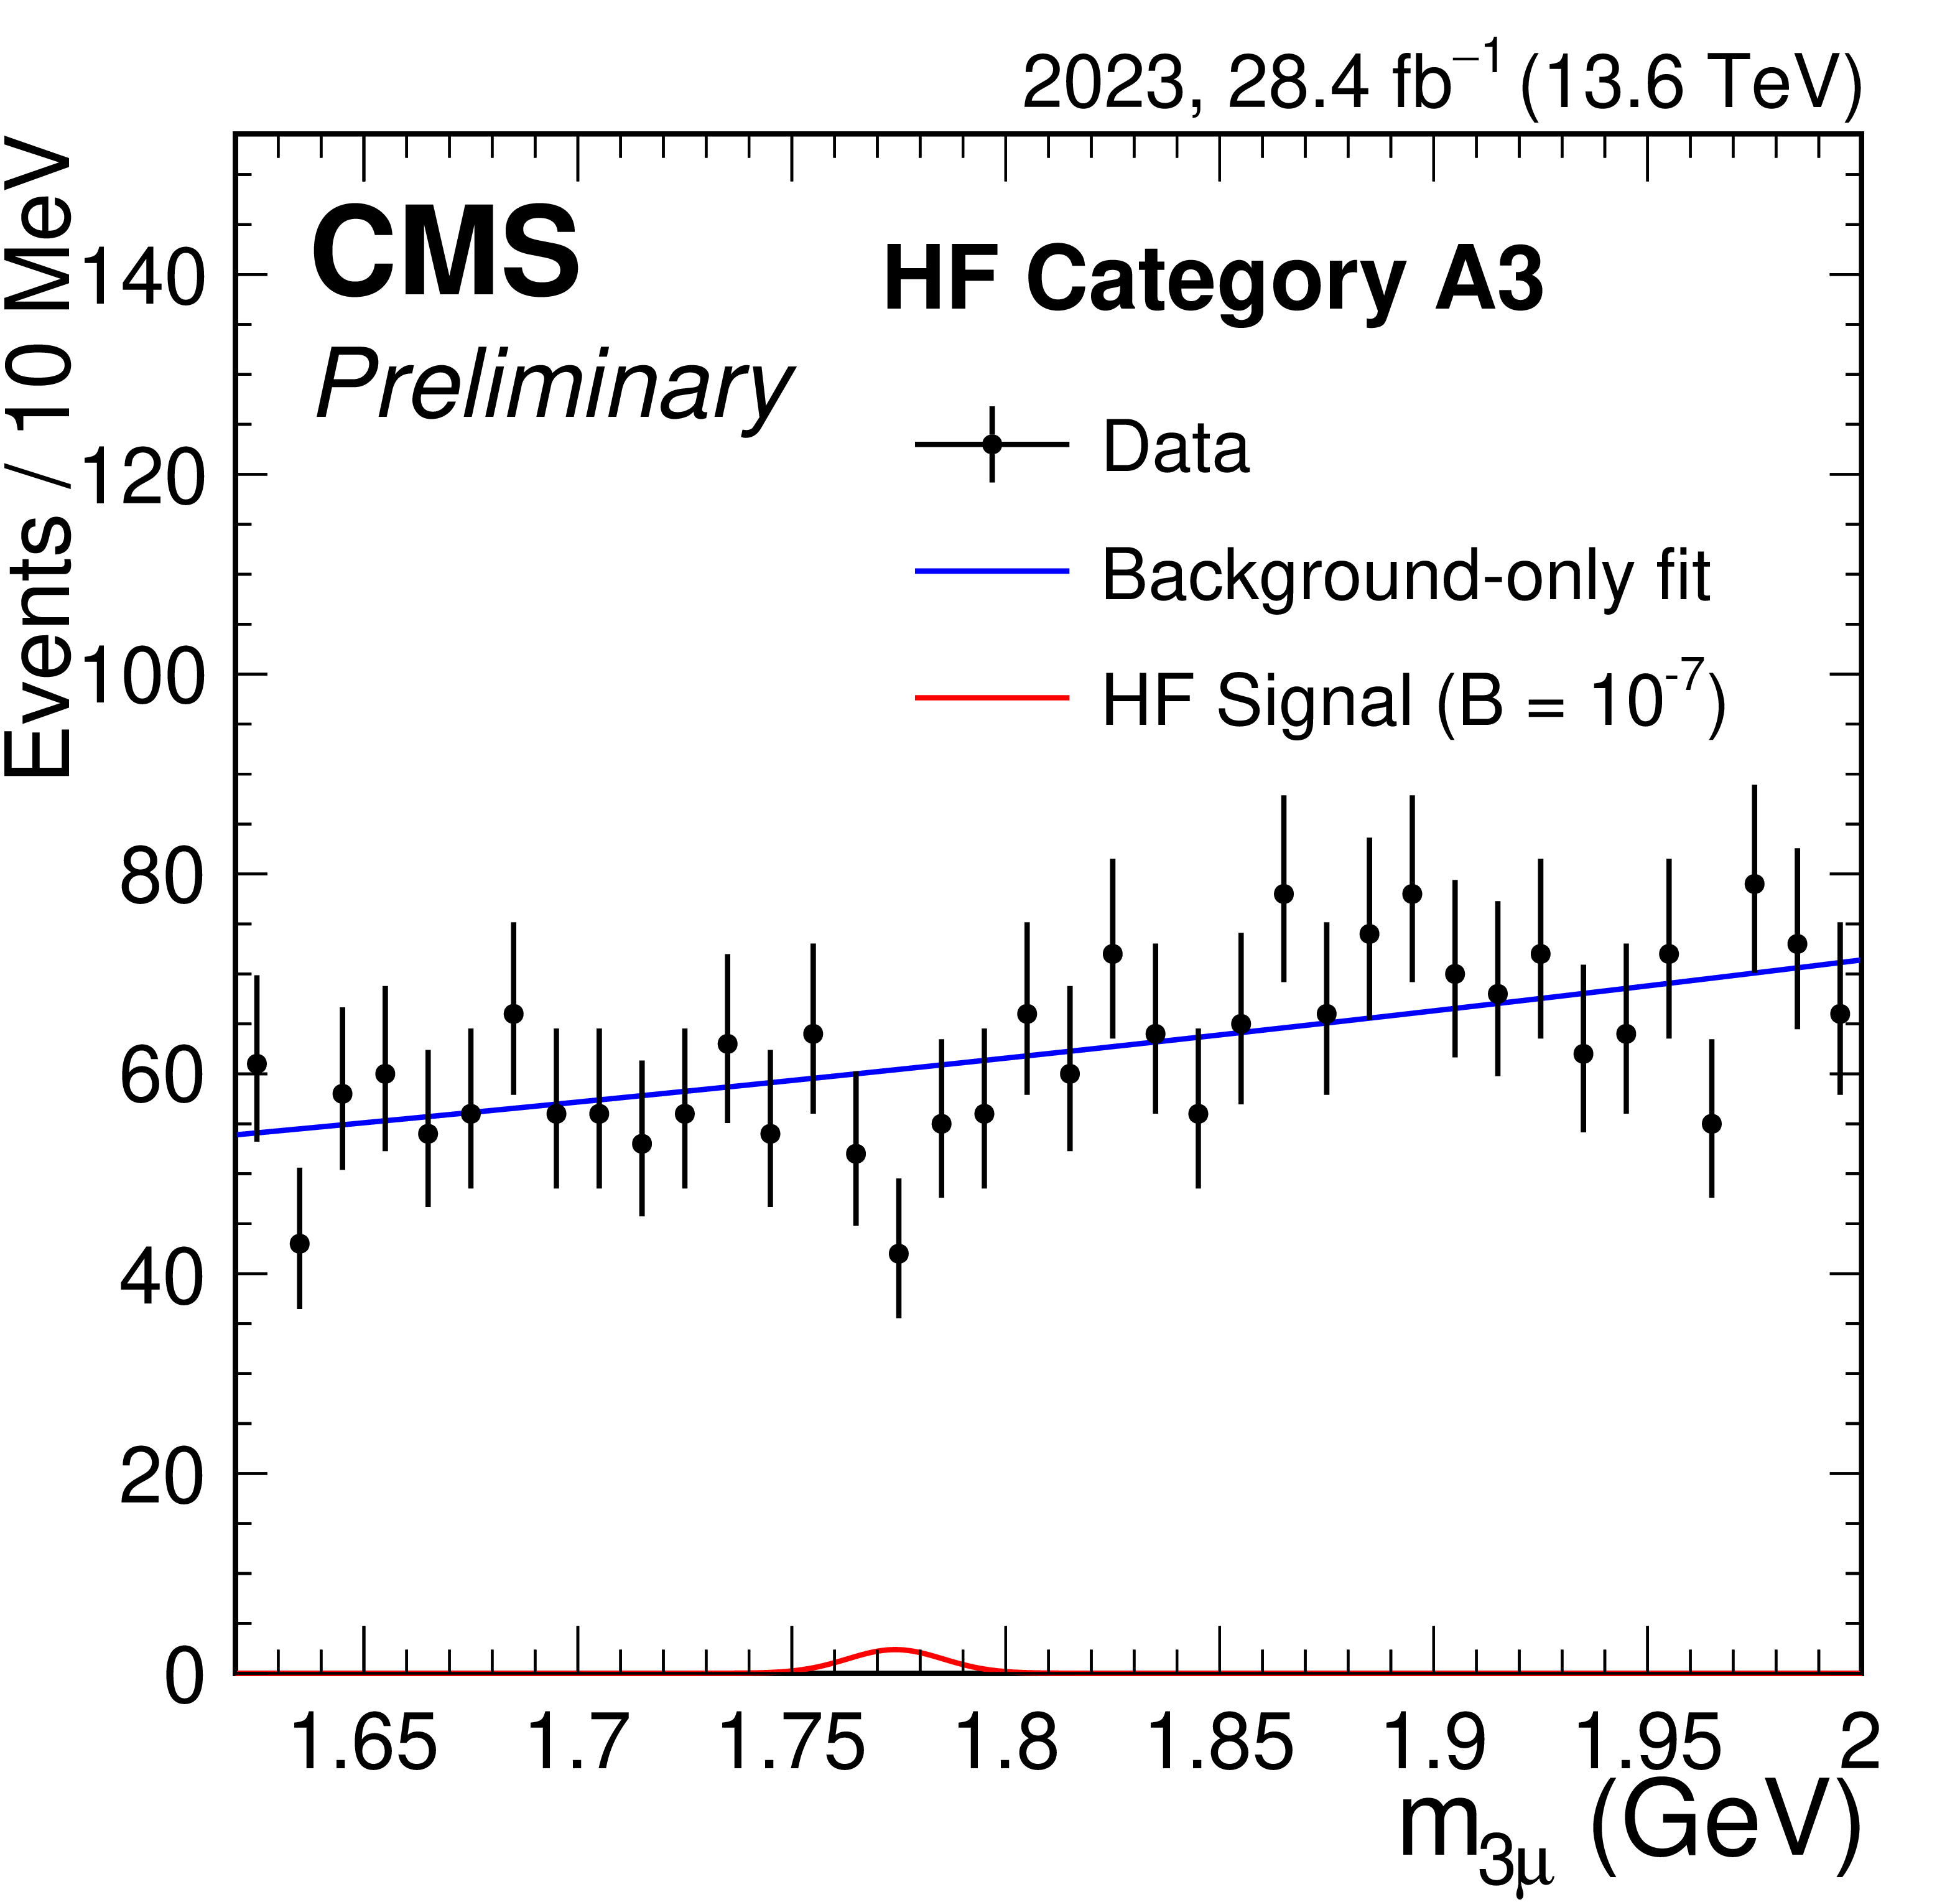
Figure 5:
Trimuon mass distributions for the three subcategories of pseodorapidity category A. Results for 2022 (2023) data are shown on the left (right). Data points in the sidebands are fitted with the lowest $ \chi^2 $ pdf in the envelope (blue line), while the signal for $ \mathcal{B}(\tau\to3\mu)=10^{-7} $ is fitted with a Crystal Ball function plus a Gaussian function (red line). |
png pdf |
Figure 5-a:
Trimuon mass distributions for the three subcategories of pseodorapidity category A. Results for 2022 (2023) data are shown on the left (right). Data points in the sidebands are fitted with the lowest $ \chi^2 $ pdf in the envelope (blue line), while the signal for $ \mathcal{B}(\tau\to3\mu)=10^{-7} $ is fitted with a Crystal Ball function plus a Gaussian function (red line). |
png pdf |
Figure 5-b:
Trimuon mass distributions for the three subcategories of pseodorapidity category A. Results for 2022 (2023) data are shown on the left (right). Data points in the sidebands are fitted with the lowest $ \chi^2 $ pdf in the envelope (blue line), while the signal for $ \mathcal{B}(\tau\to3\mu)=10^{-7} $ is fitted with a Crystal Ball function plus a Gaussian function (red line). |
png pdf |
Figure 5-c:
Trimuon mass distributions for the three subcategories of pseodorapidity category A. Results for 2022 (2023) data are shown on the left (right). Data points in the sidebands are fitted with the lowest $ \chi^2 $ pdf in the envelope (blue line), while the signal for $ \mathcal{B}(\tau\to3\mu)=10^{-7} $ is fitted with a Crystal Ball function plus a Gaussian function (red line). |
png pdf |
Figure 5-d:
Trimuon mass distributions for the three subcategories of pseodorapidity category A. Results for 2022 (2023) data are shown on the left (right). Data points in the sidebands are fitted with the lowest $ \chi^2 $ pdf in the envelope (blue line), while the signal for $ \mathcal{B}(\tau\to3\mu)=10^{-7} $ is fitted with a Crystal Ball function plus a Gaussian function (red line). |
png pdf |
Figure 5-e:
Trimuon mass distributions for the three subcategories of pseodorapidity category A. Results for 2022 (2023) data are shown on the left (right). Data points in the sidebands are fitted with the lowest $ \chi^2 $ pdf in the envelope (blue line), while the signal for $ \mathcal{B}(\tau\to3\mu)=10^{-7} $ is fitted with a Crystal Ball function plus a Gaussian function (red line). |
png pdf |
Figure 5-f:
Trimuon mass distributions for the three subcategories of pseodorapidity category A. Results for 2022 (2023) data are shown on the left (right). Data points in the sidebands are fitted with the lowest $ \chi^2 $ pdf in the envelope (blue line), while the signal for $ \mathcal{B}(\tau\to3\mu)=10^{-7} $ is fitted with a Crystal Ball function plus a Gaussian function (red line). |
png pdf |
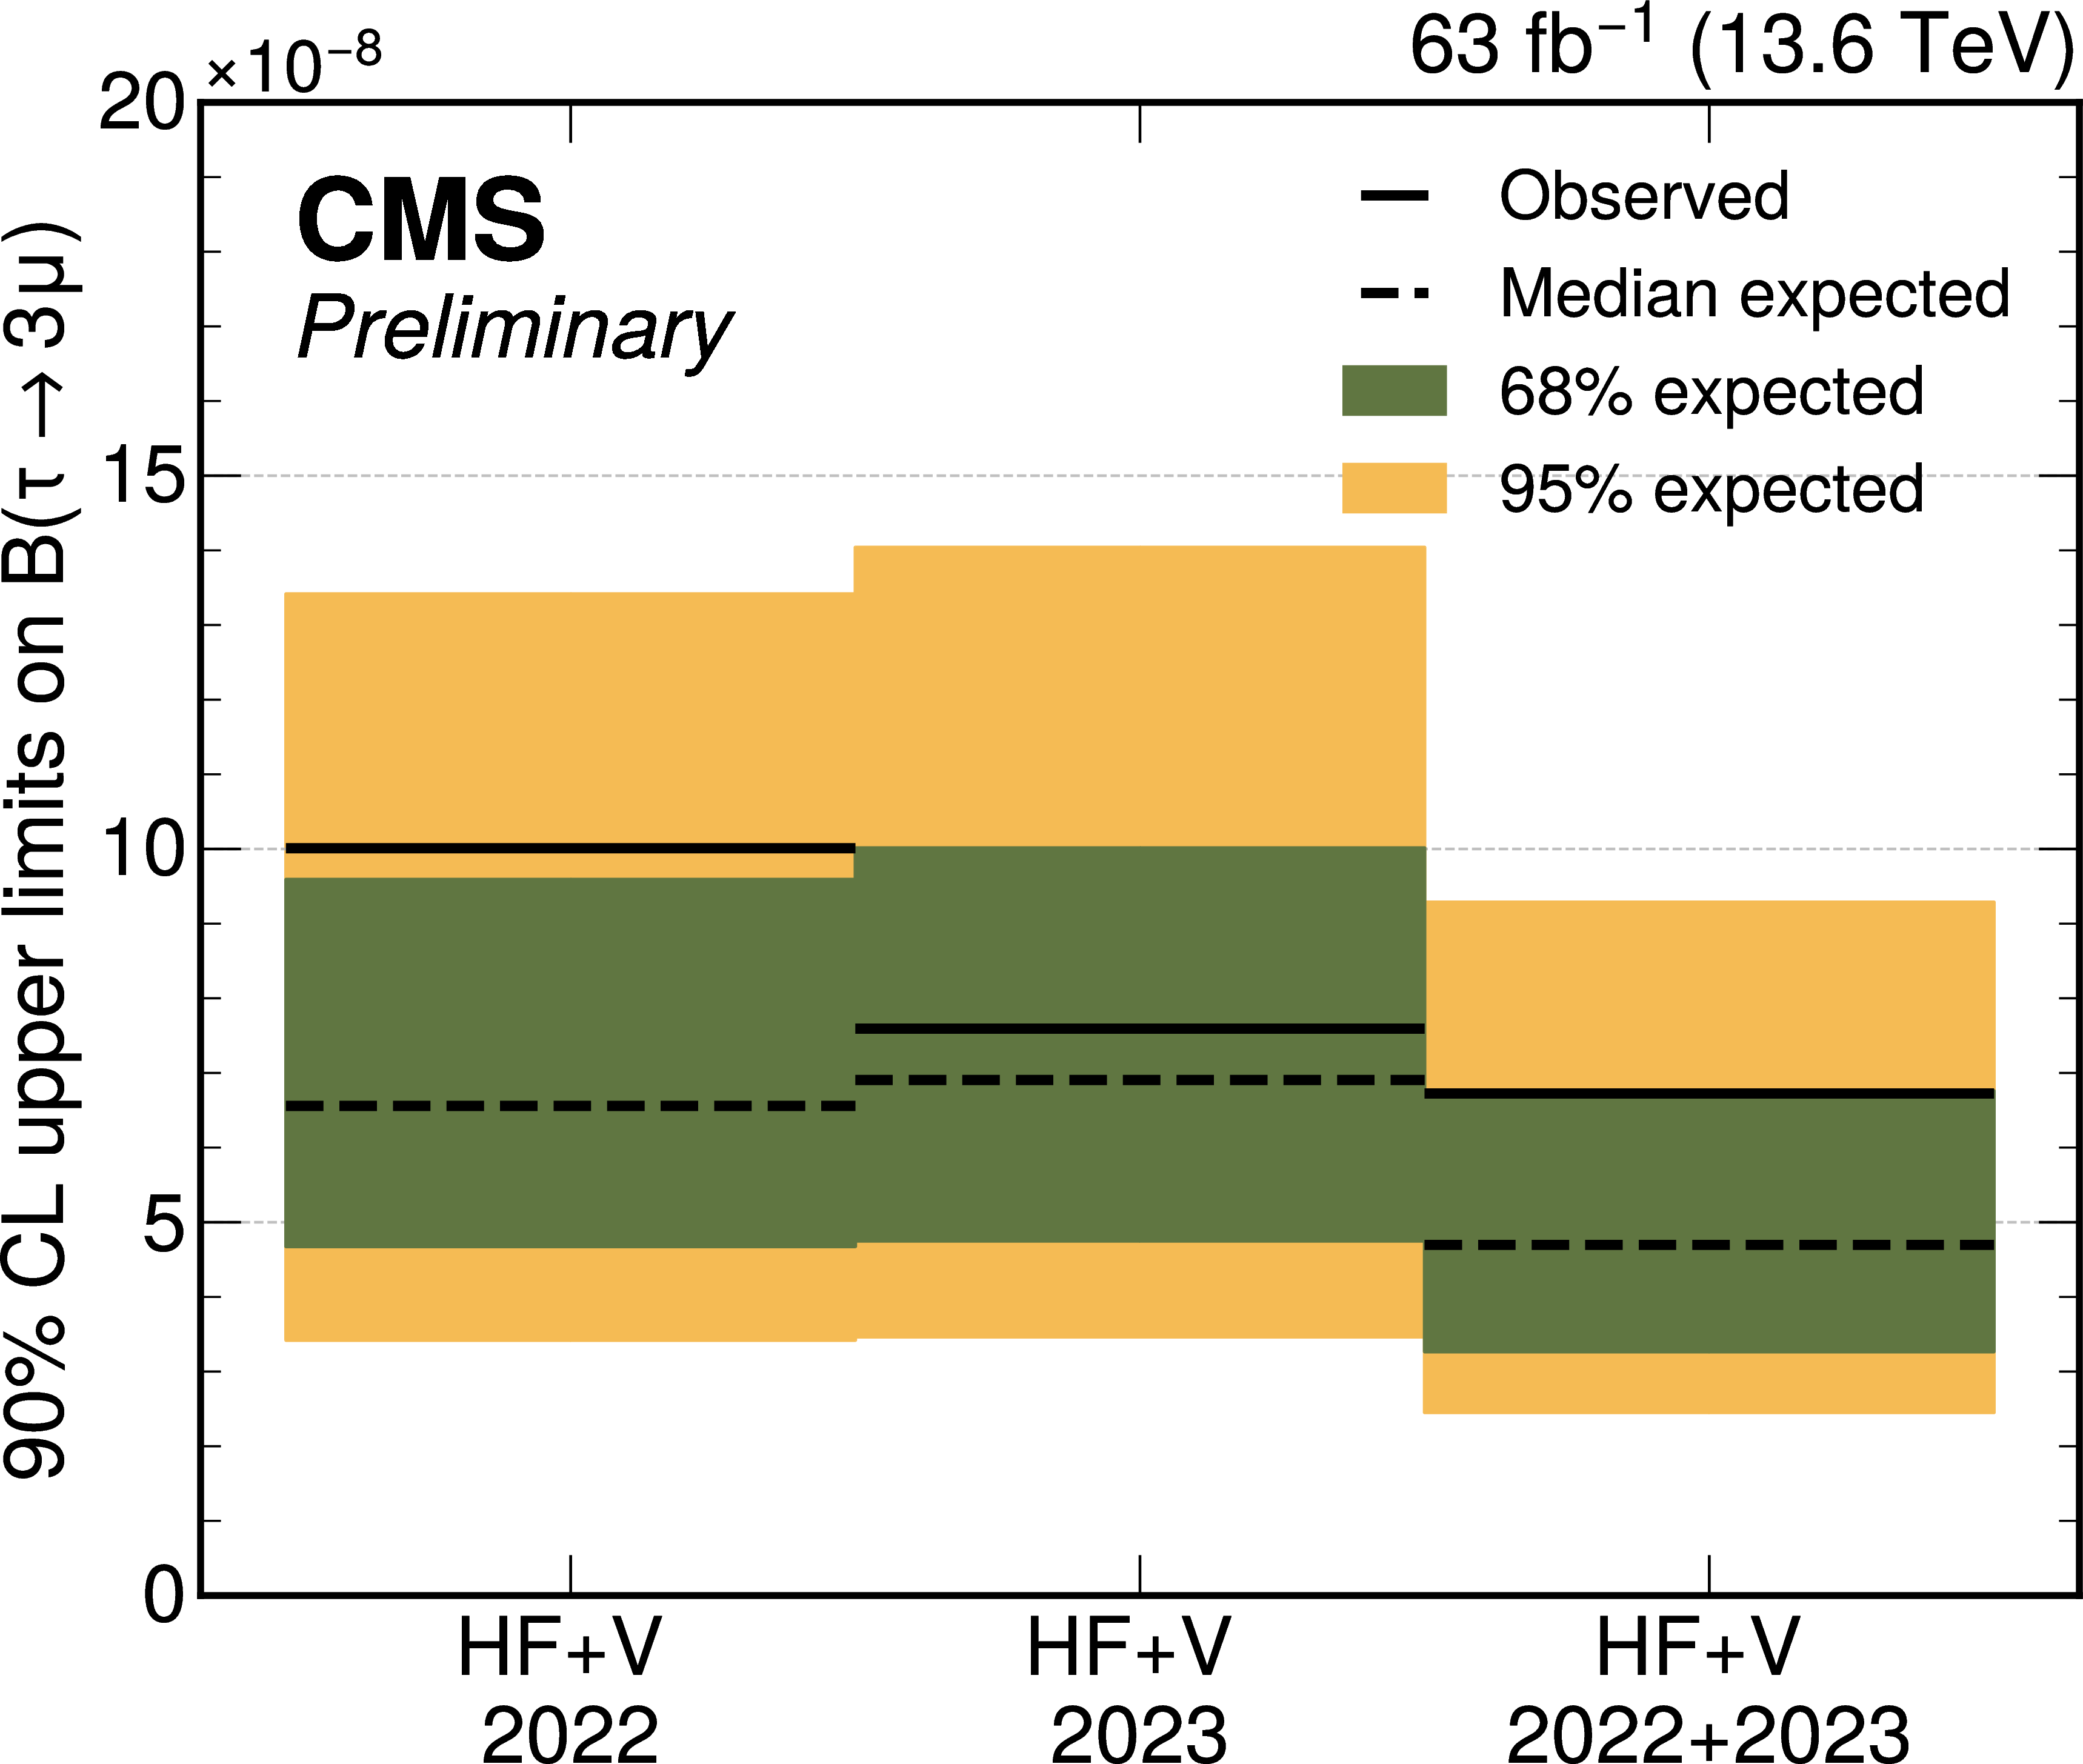
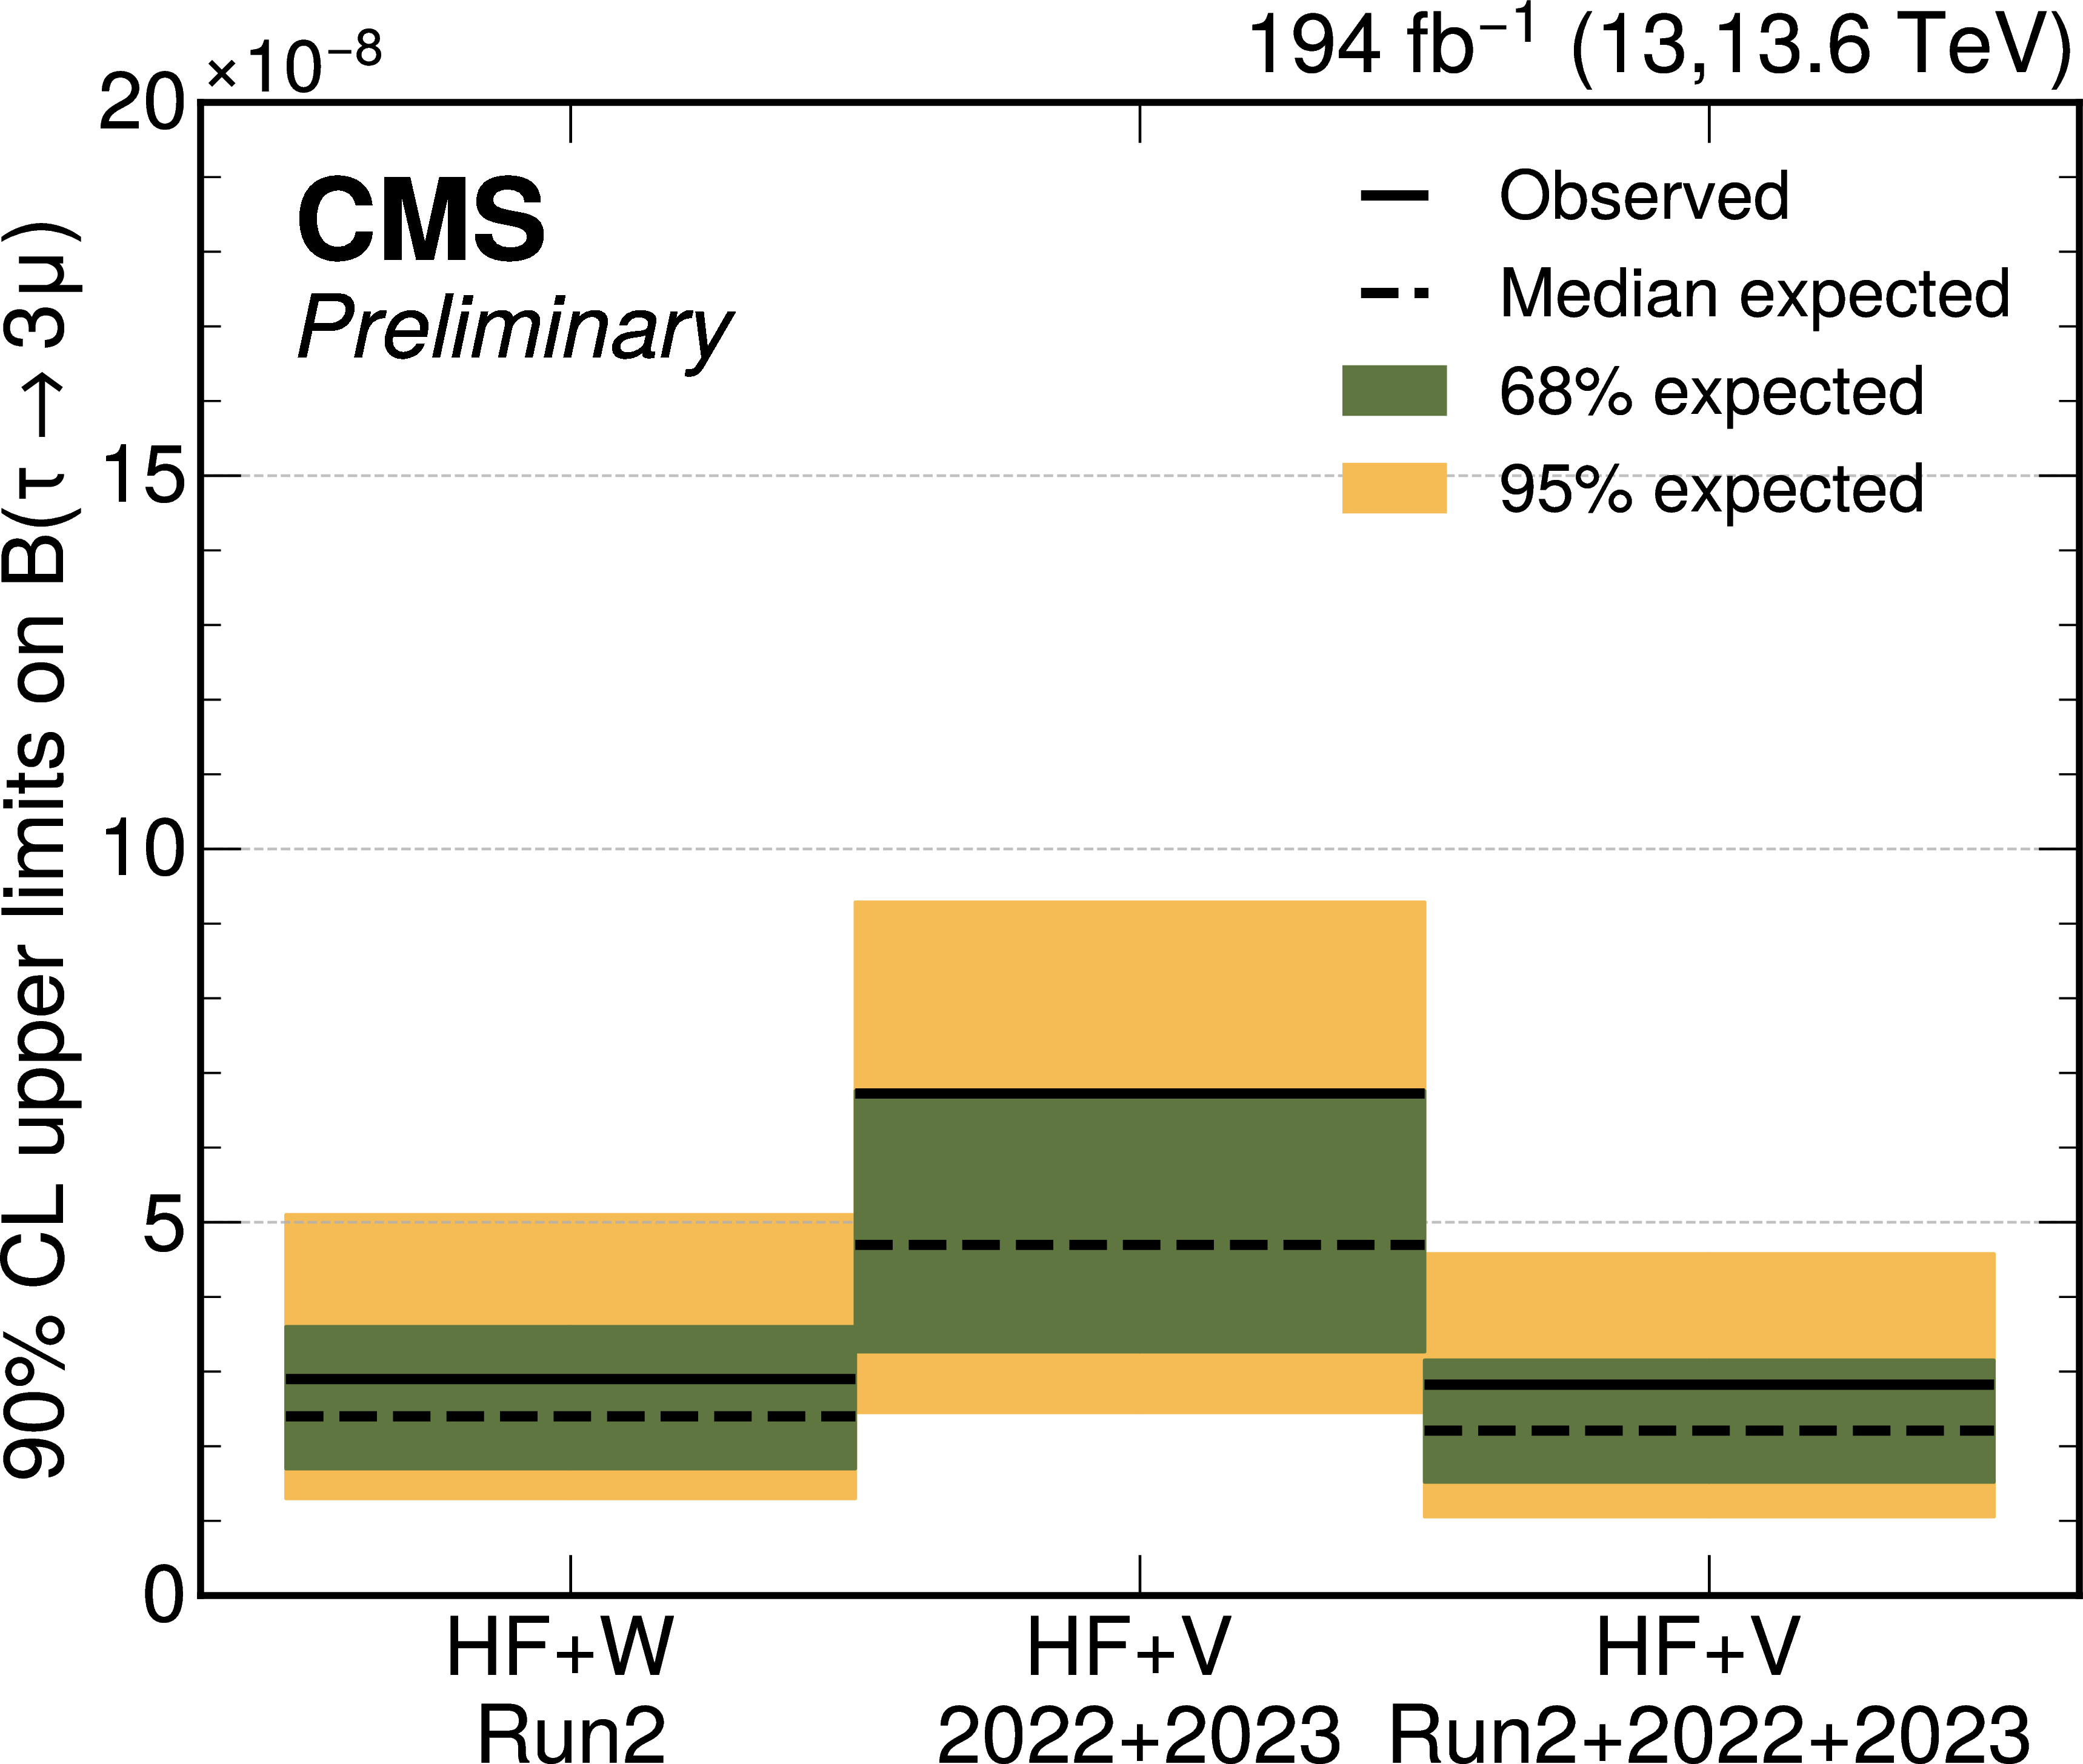
Figure 6:
The expected median (dashed line) with its 68% and 95% confidence intervals (green and yellow bands) and observed upper limit for $ \mathcal{B}(\tau \!\to\! 3\mu) $ at 90% CL, obtained with 2022 and 2023 data separately and combined, using a combination of the heavy-flavor and V channels. |
| Tables | |
png pdf |
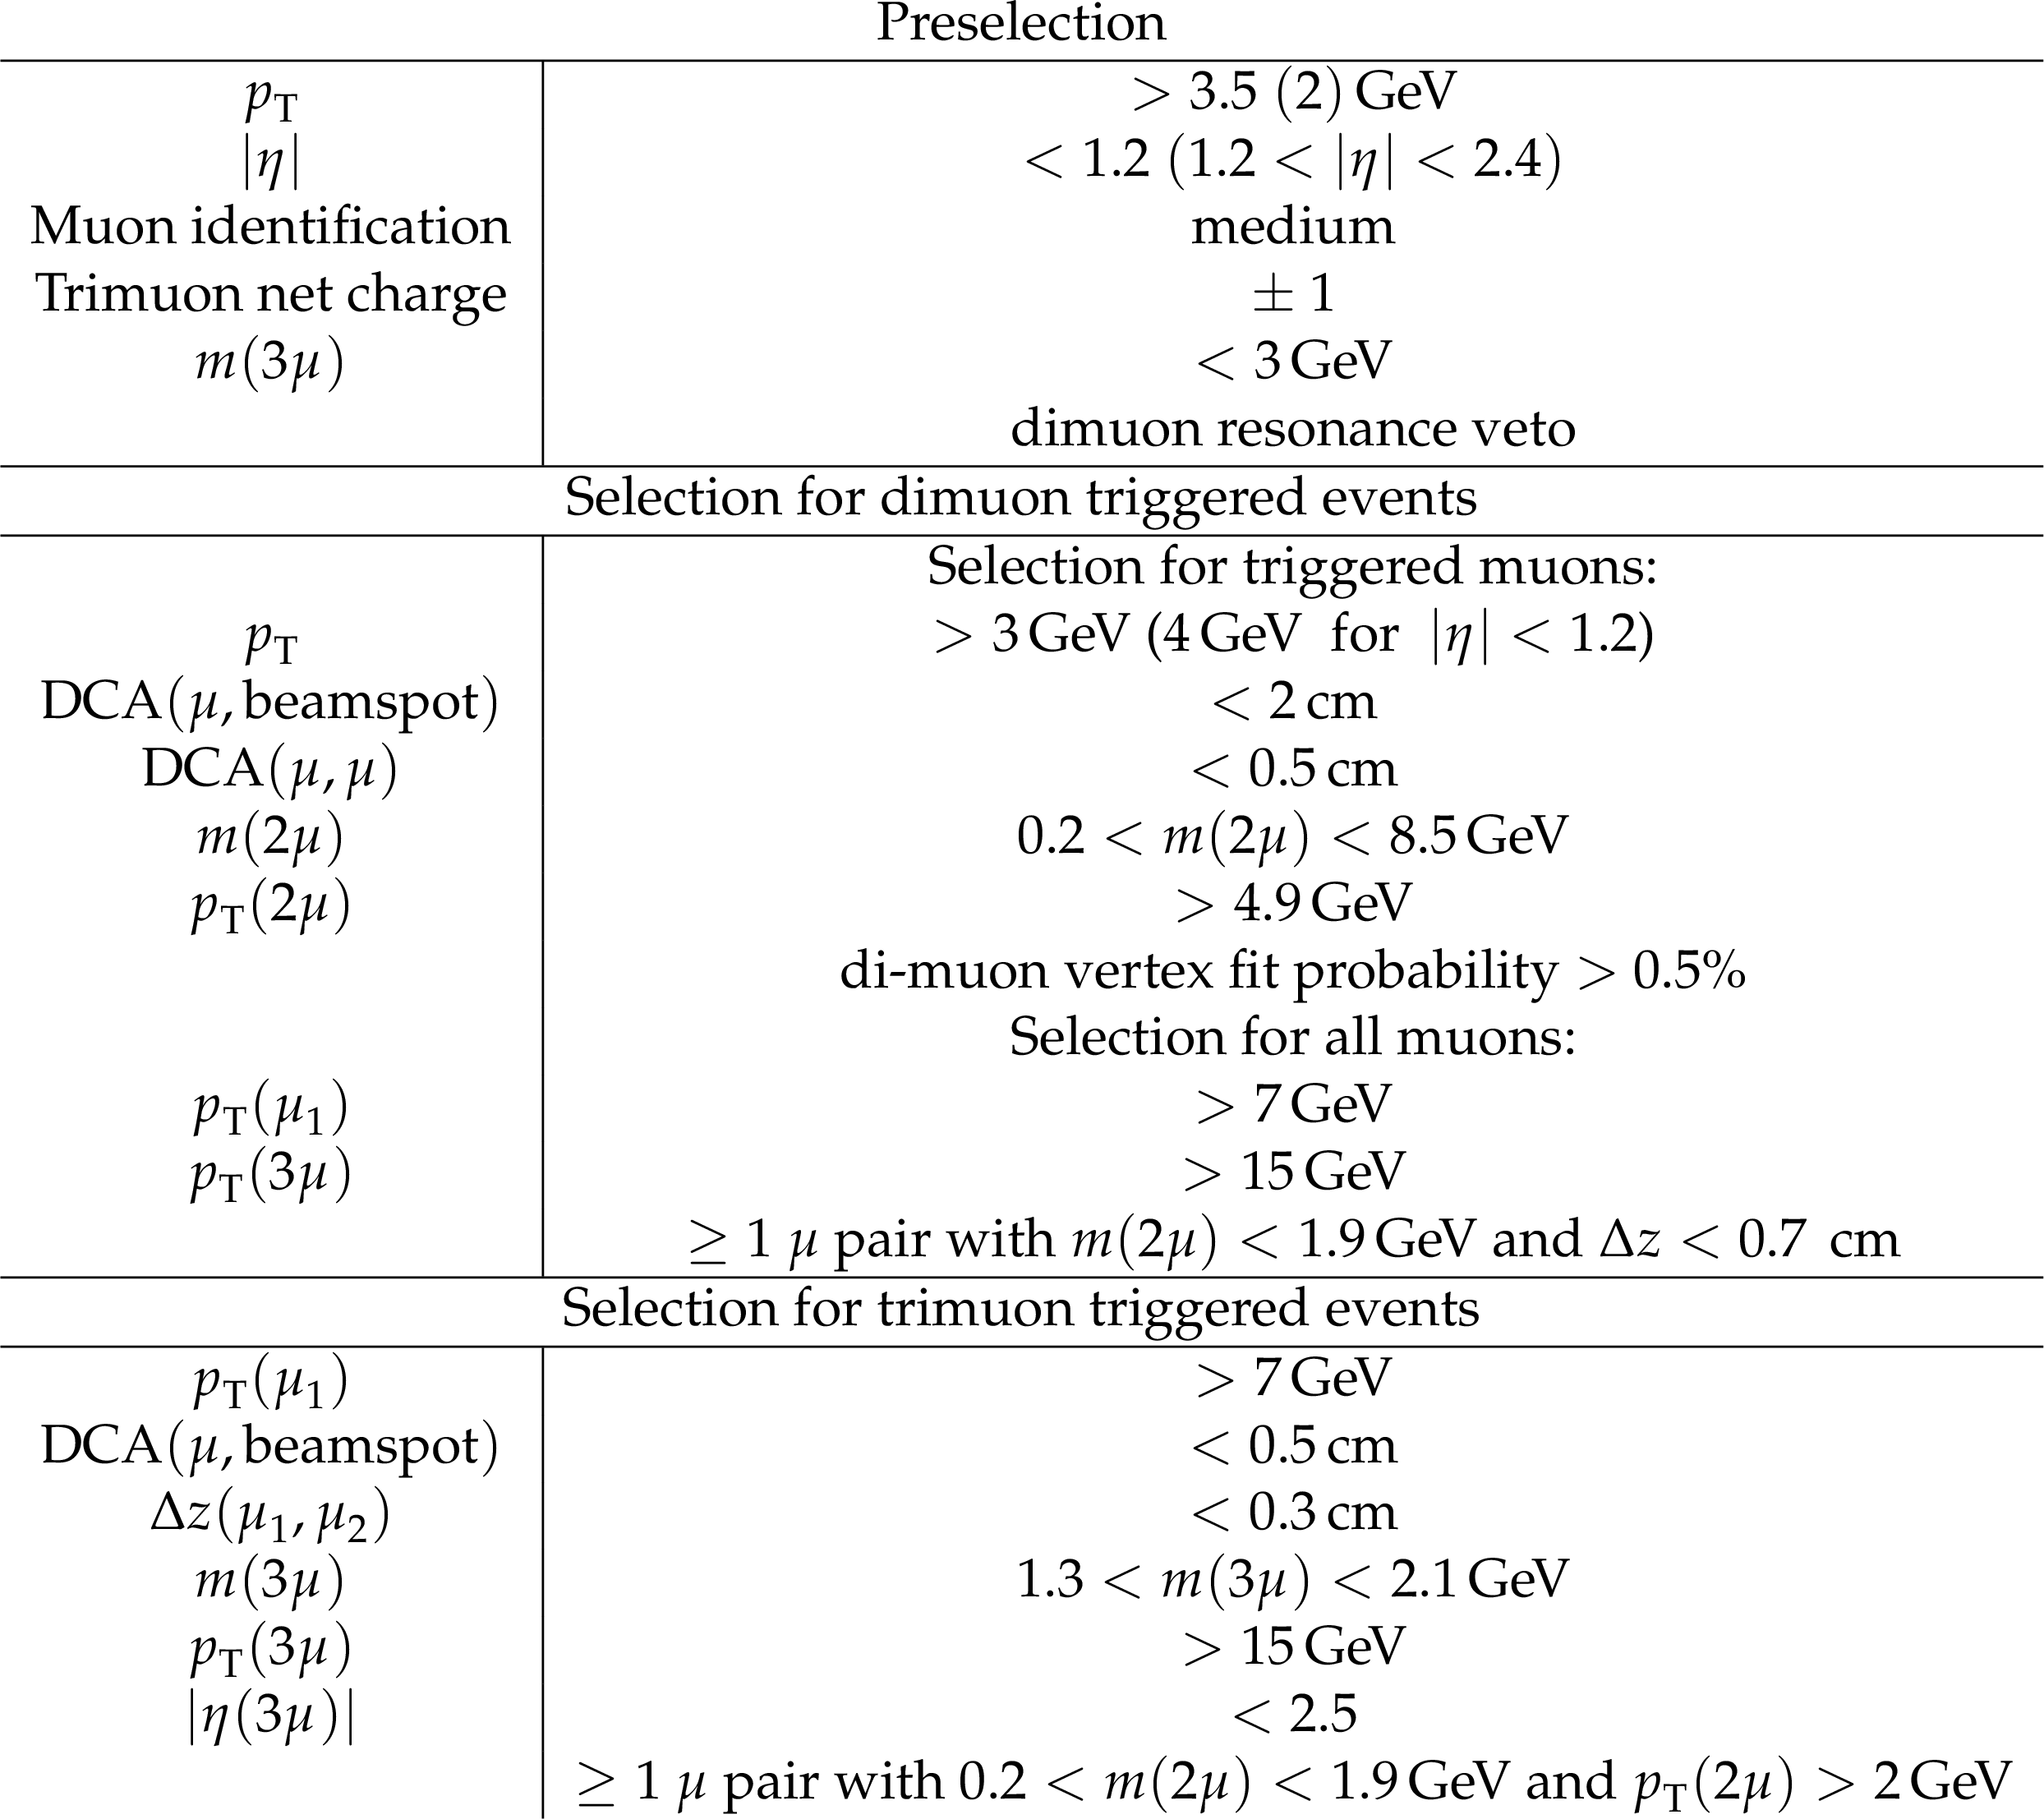
Table 1:
Event selection in the V channel. |
png pdf |
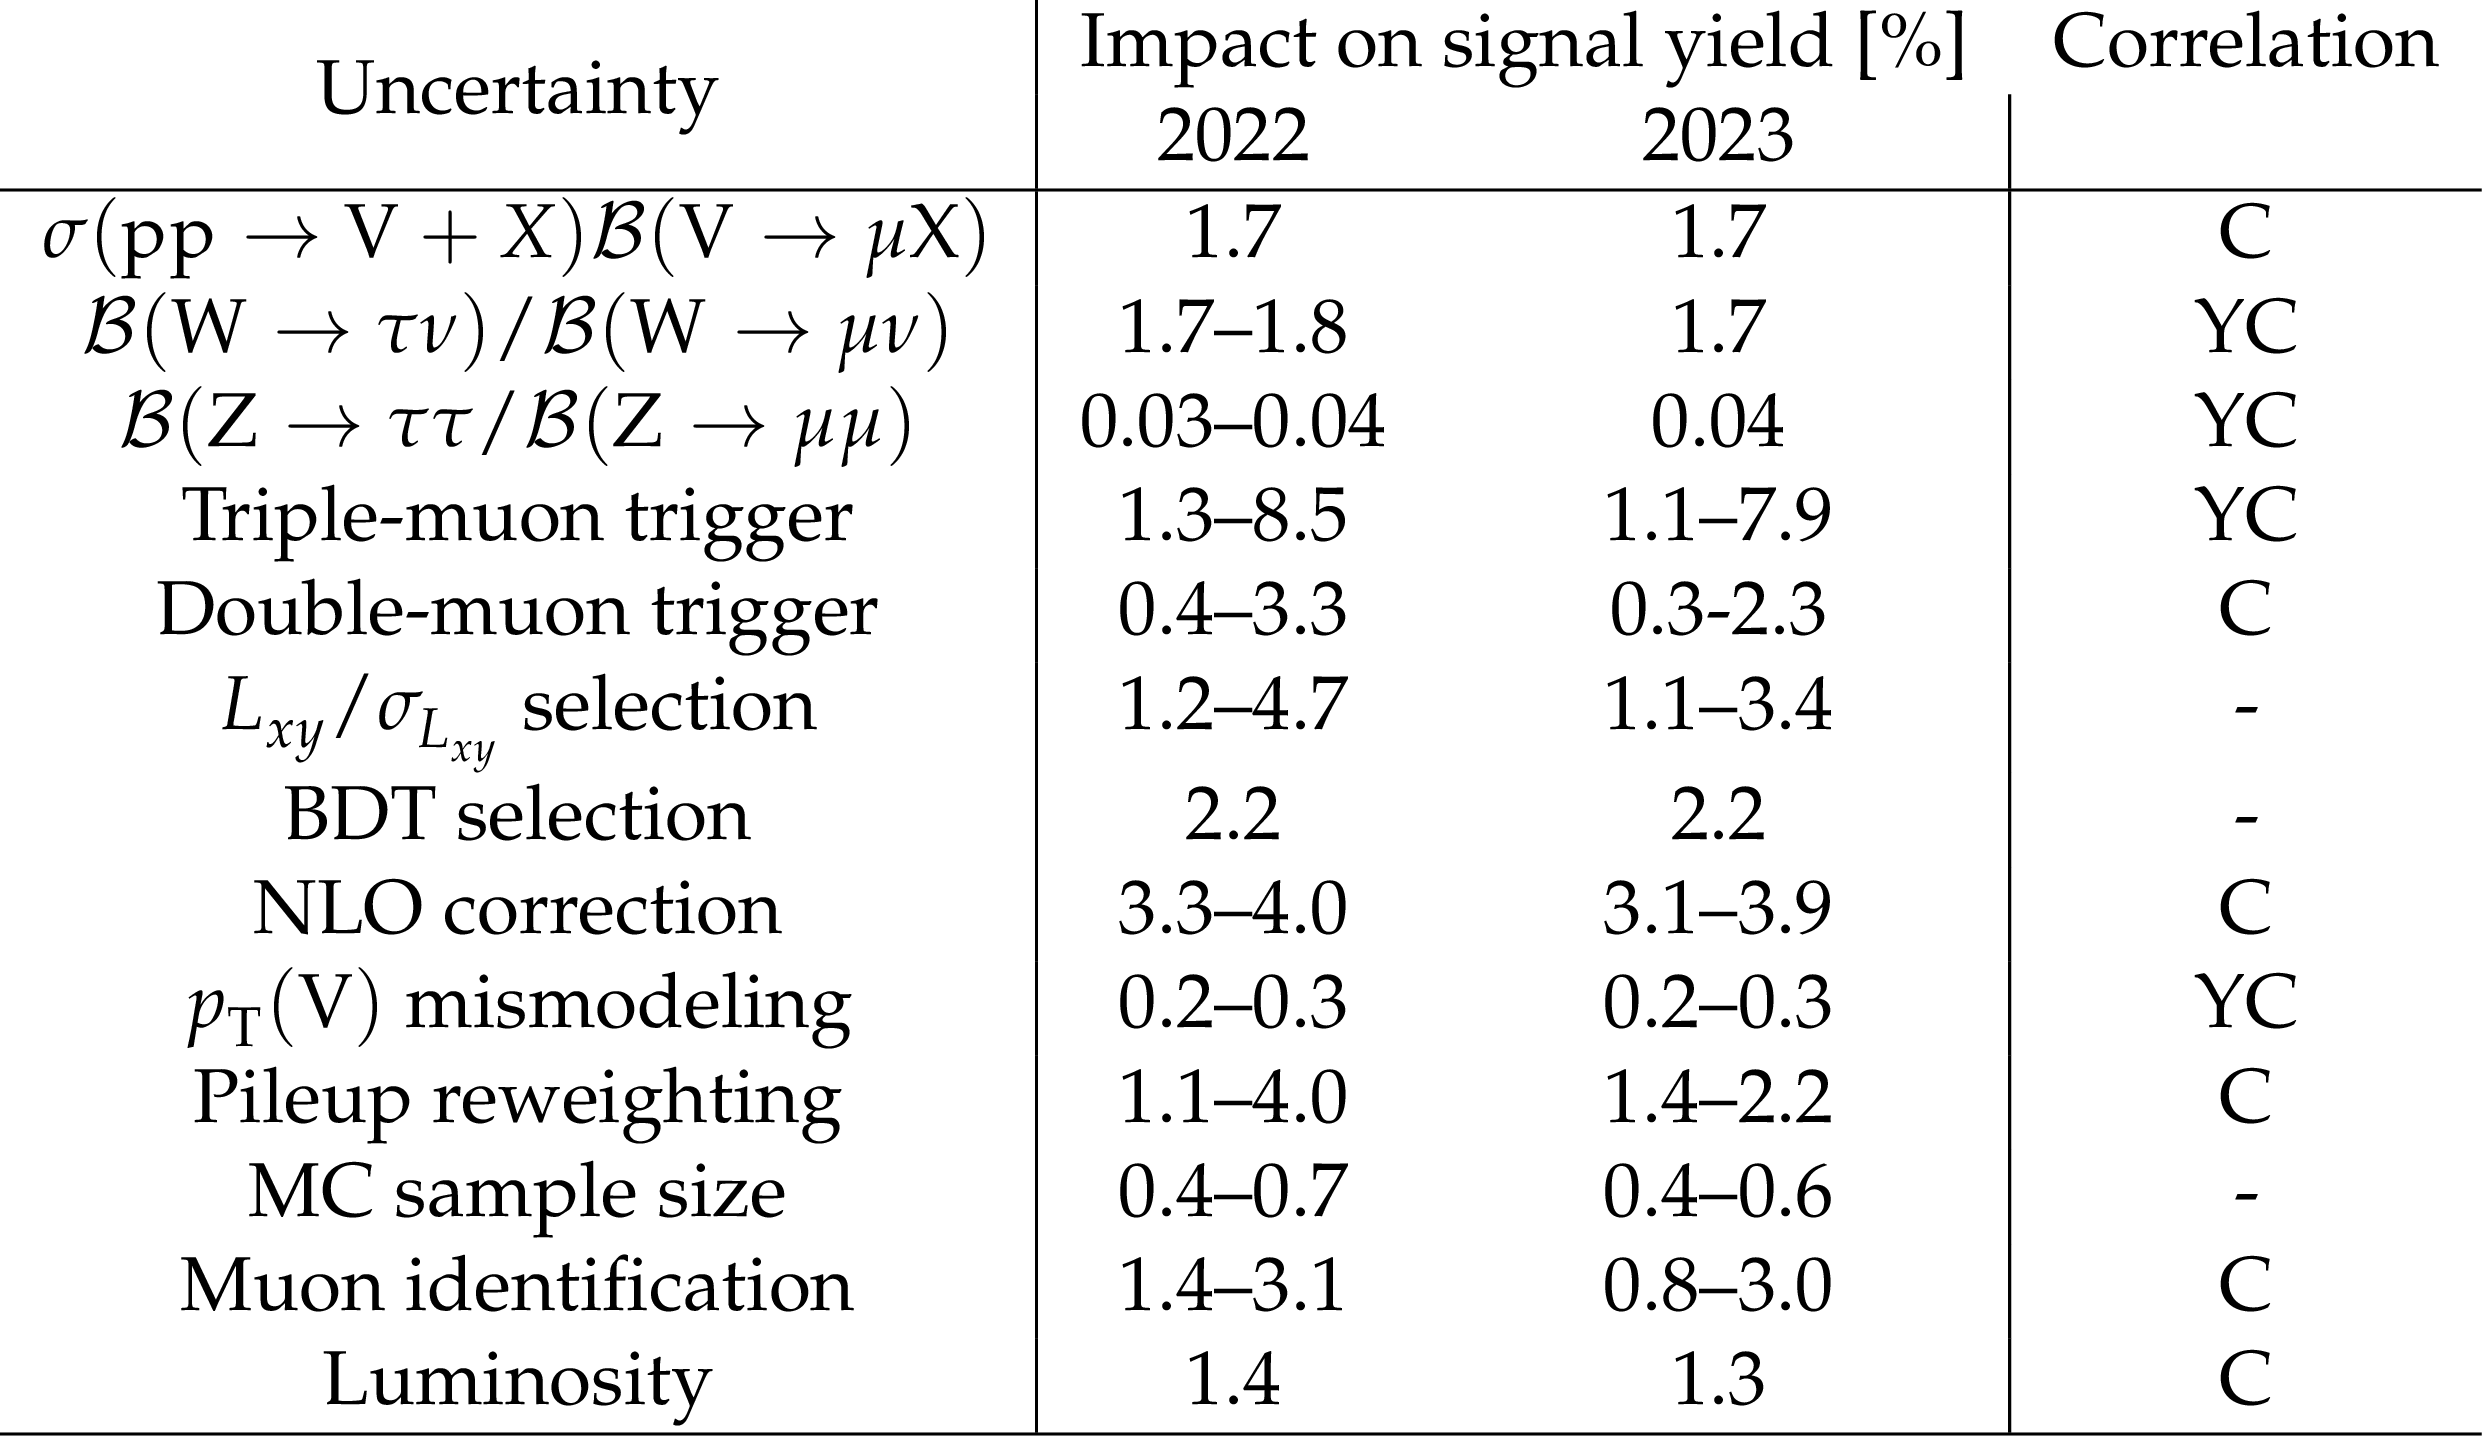
Table 2:
Systematic uncertainties affecting the signal normalization in the V channel and their impacts on the expected signal yield. The last column indicates whether the uncertainties are correlated among the years (Y) or categories (C). |
png pdf |
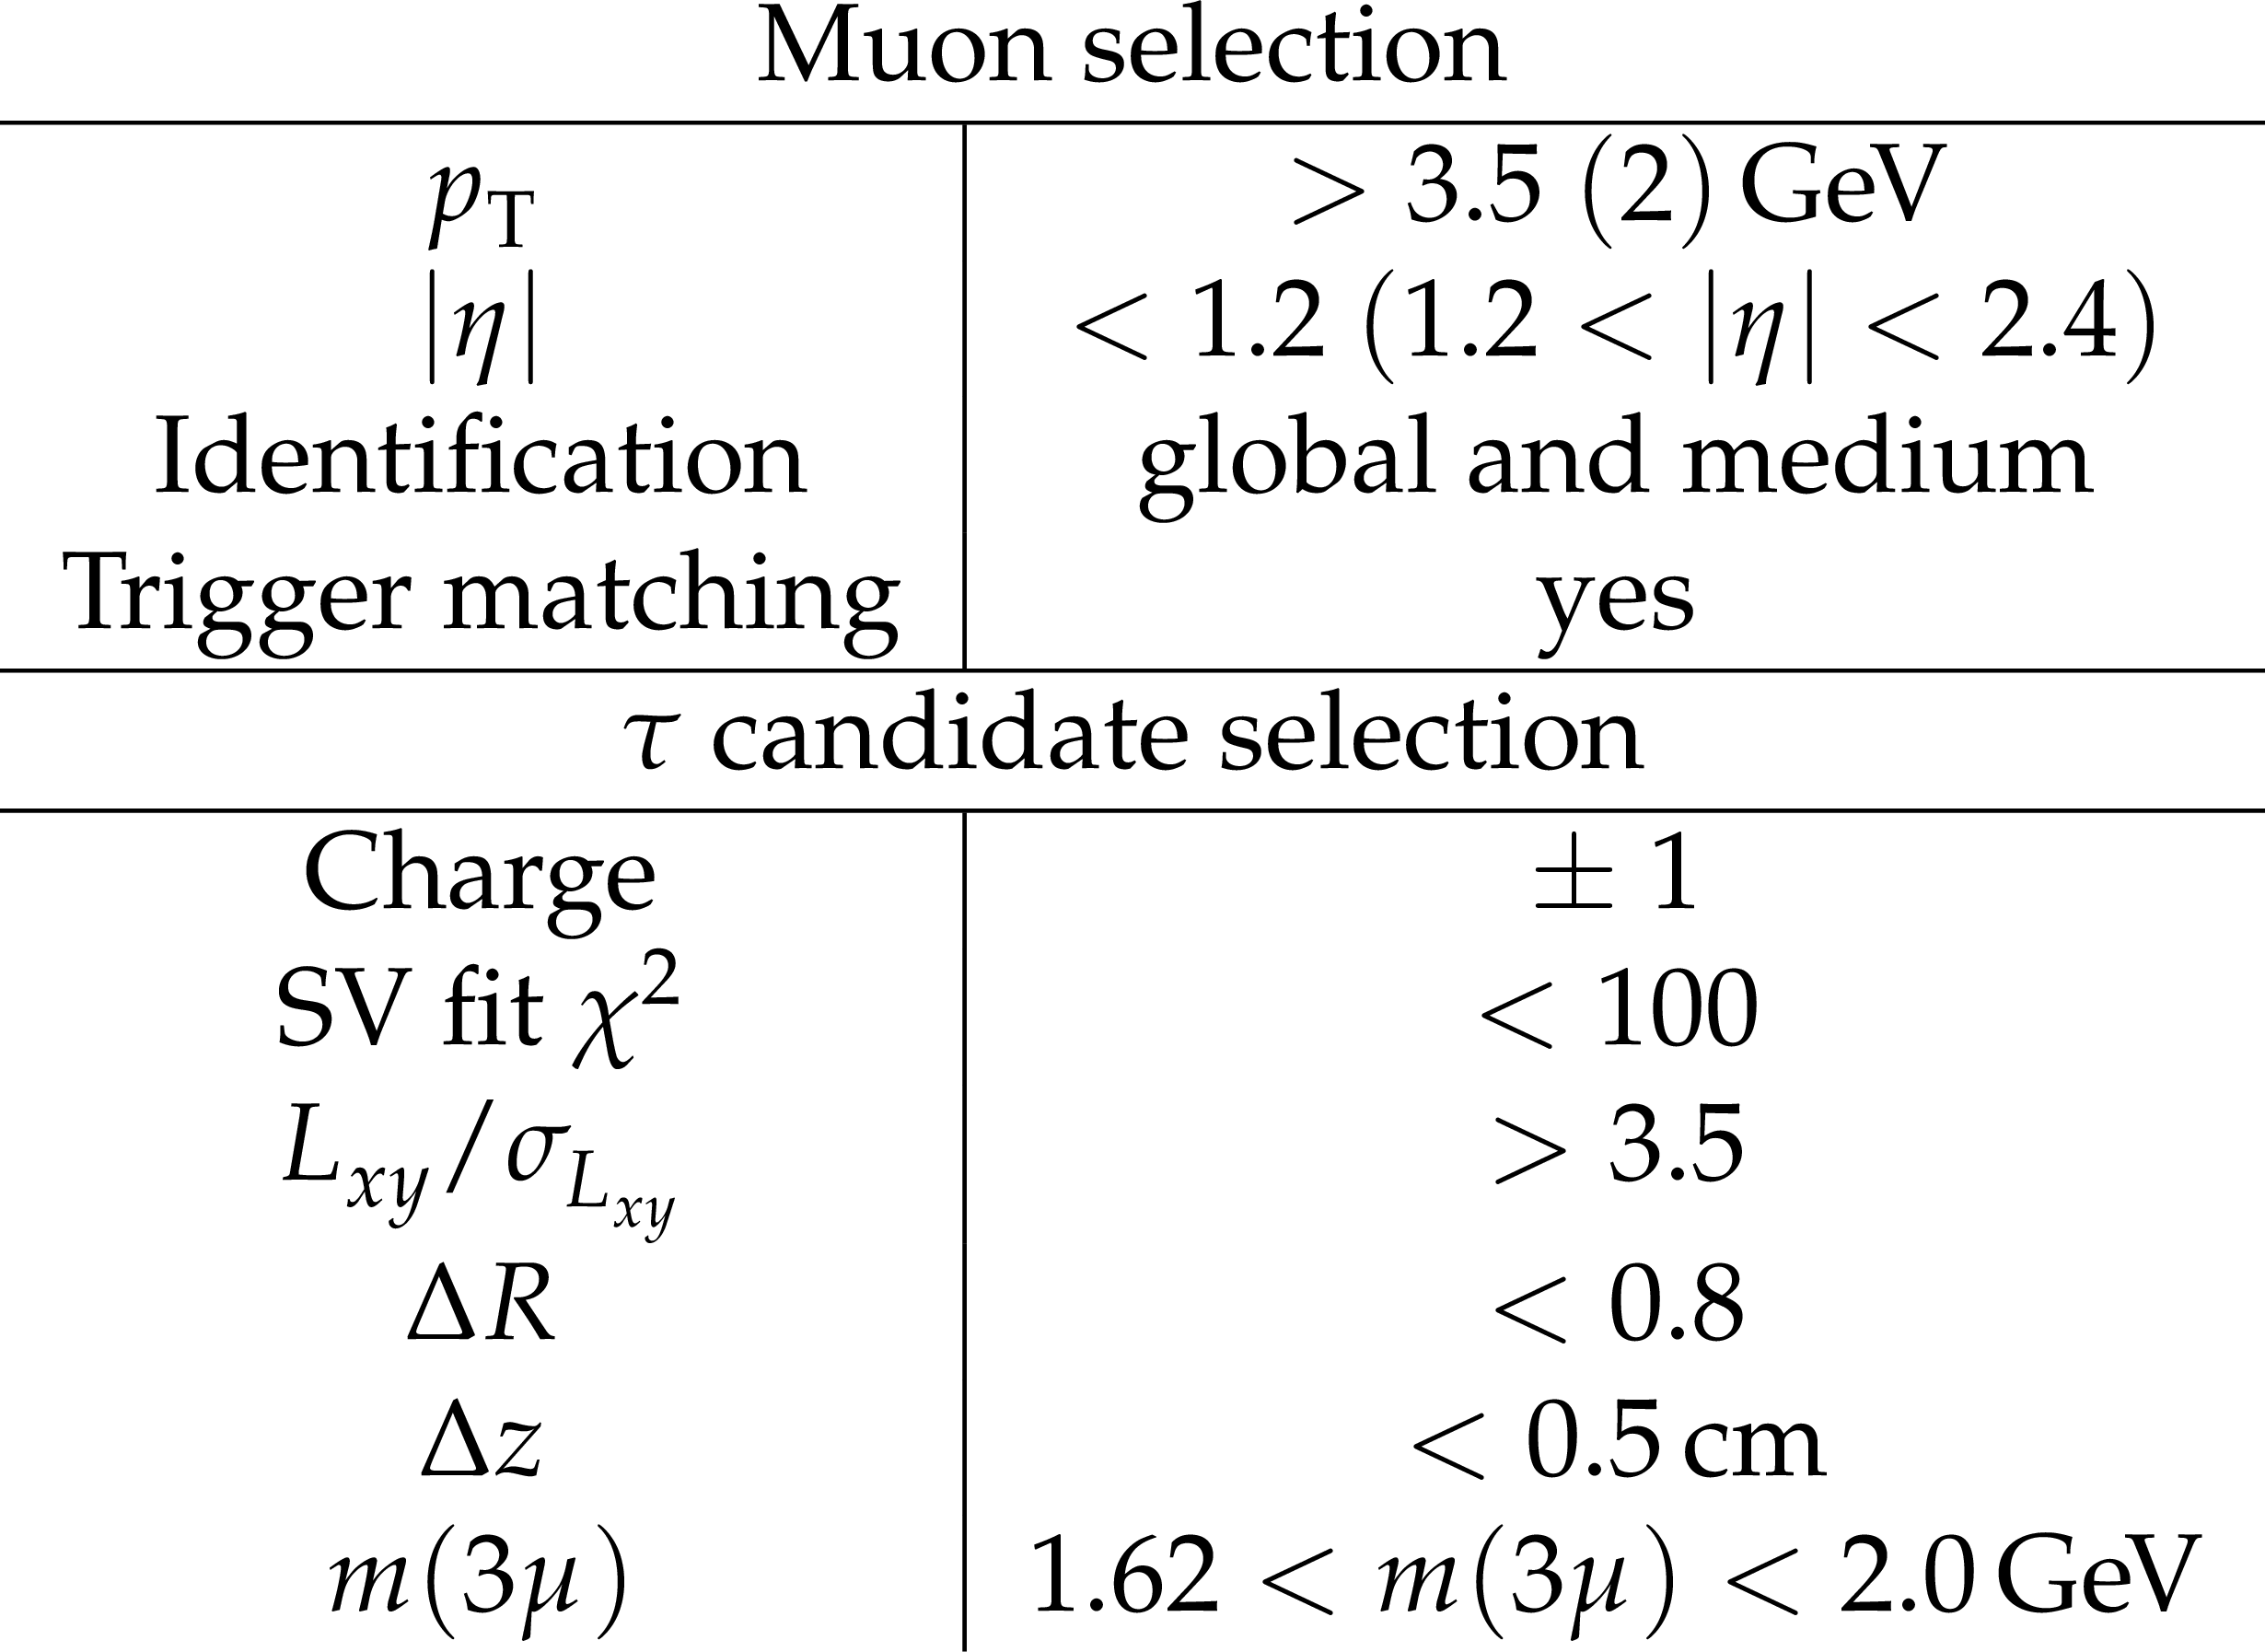
Table 3:
Signal event selection in the heavy-flavor channel. |
png pdf |
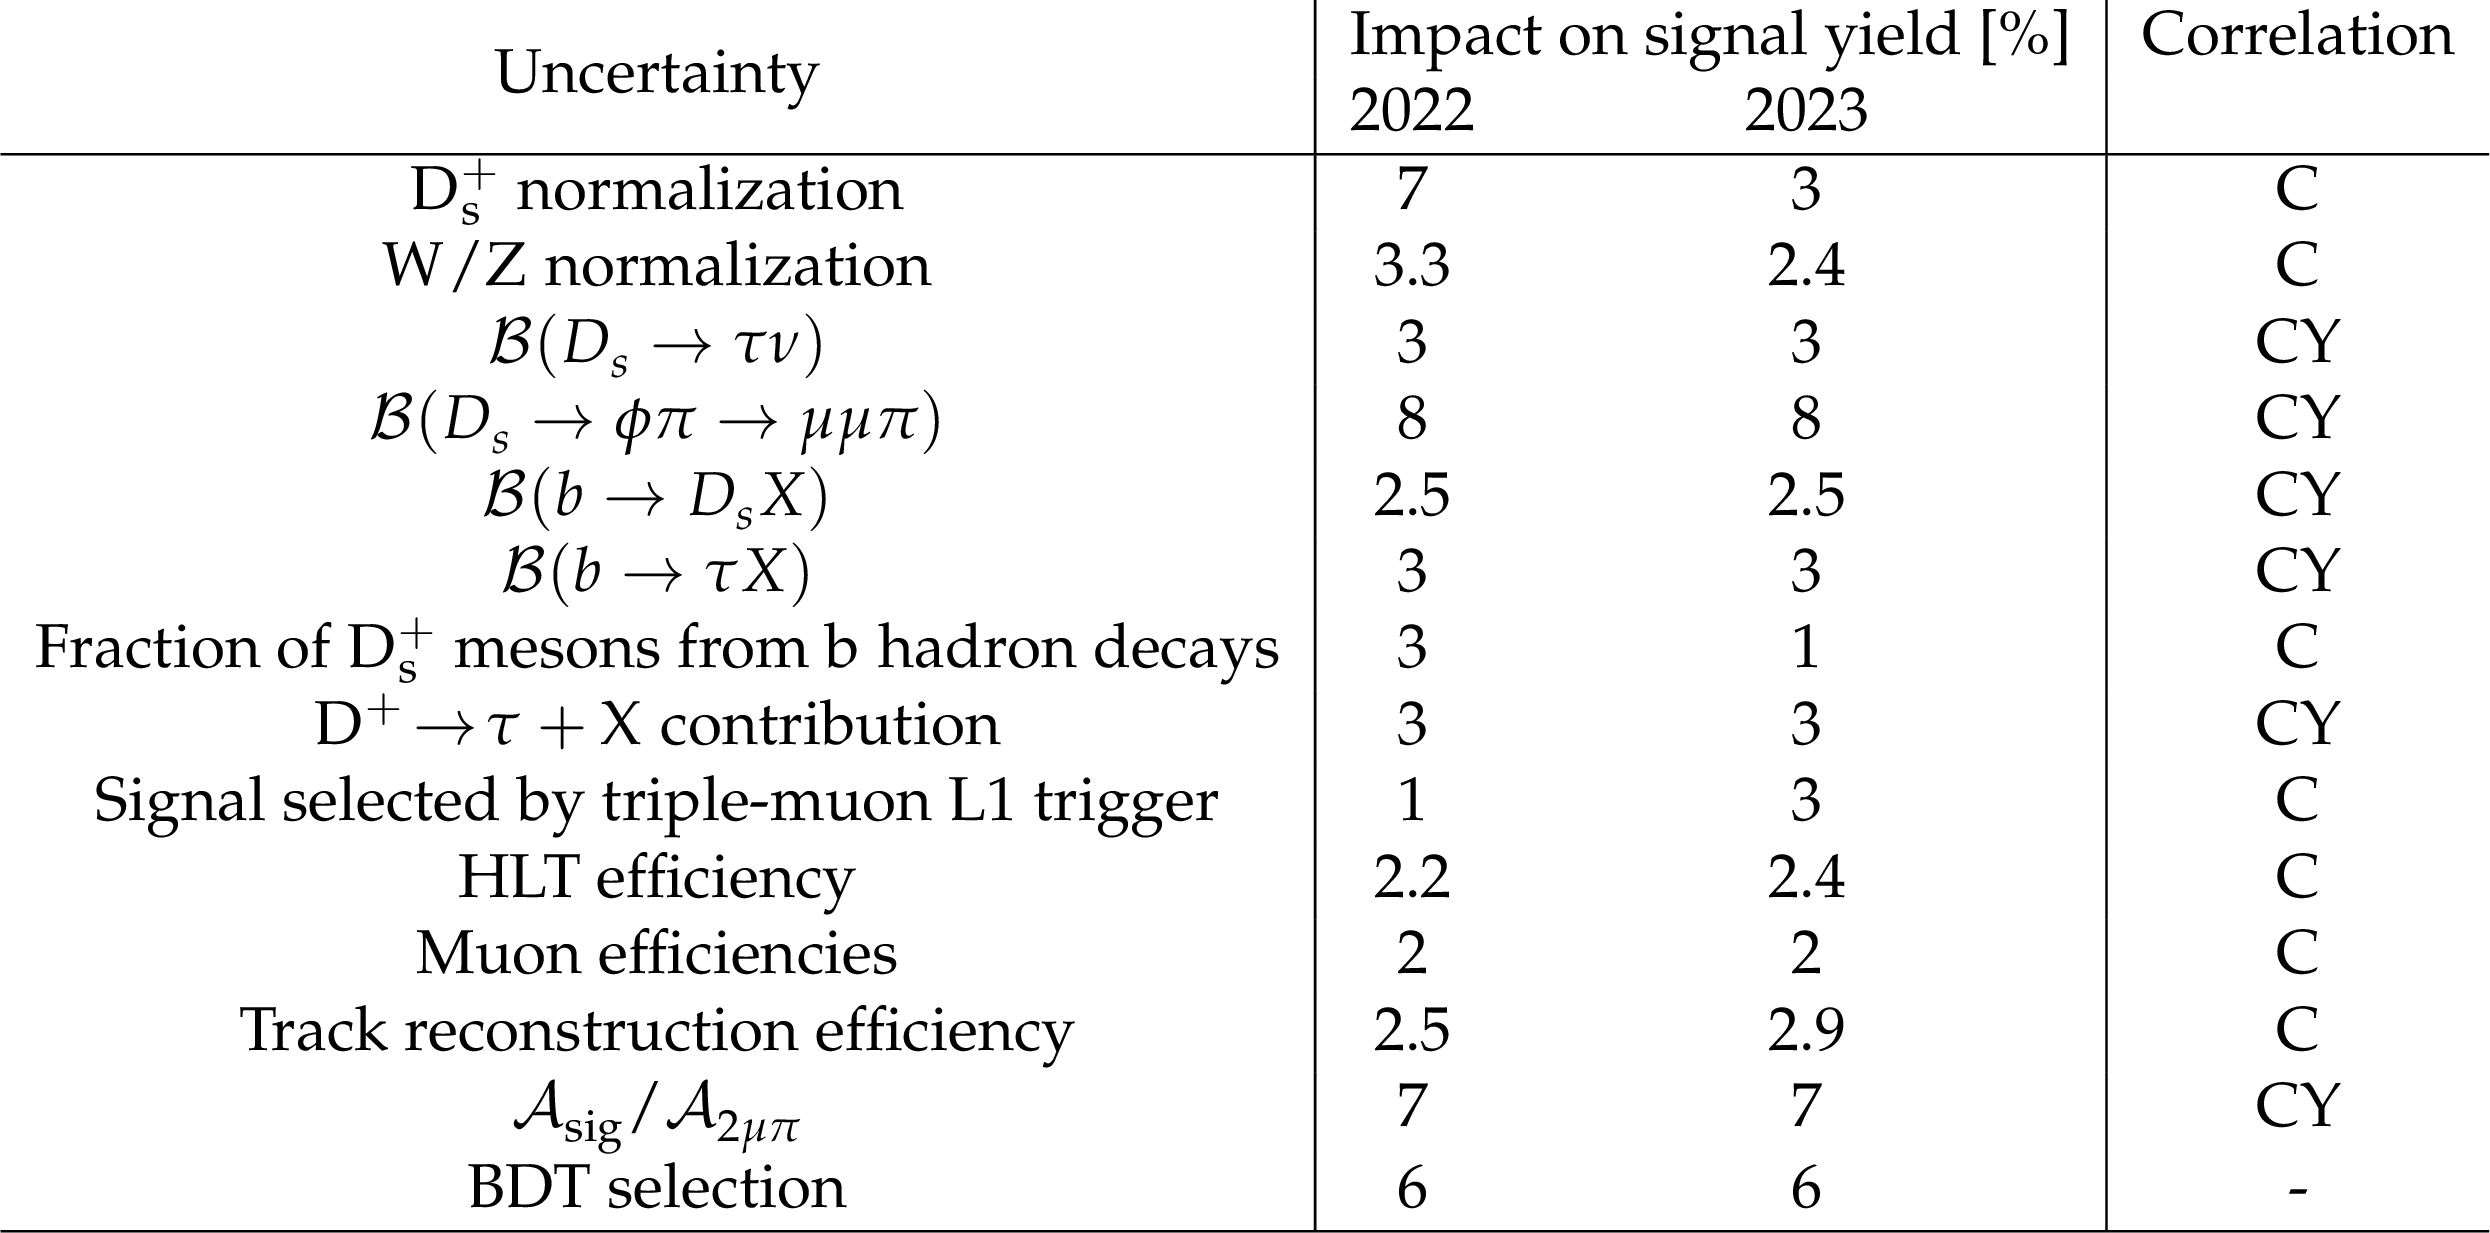
Table 4:
Systematic uncertainties and their impact on the expected signal yield in the heavy-flavor channel. The last column indicates whether the uncertainties are correlated among the years (Y) or categories (C). |
png pdf |
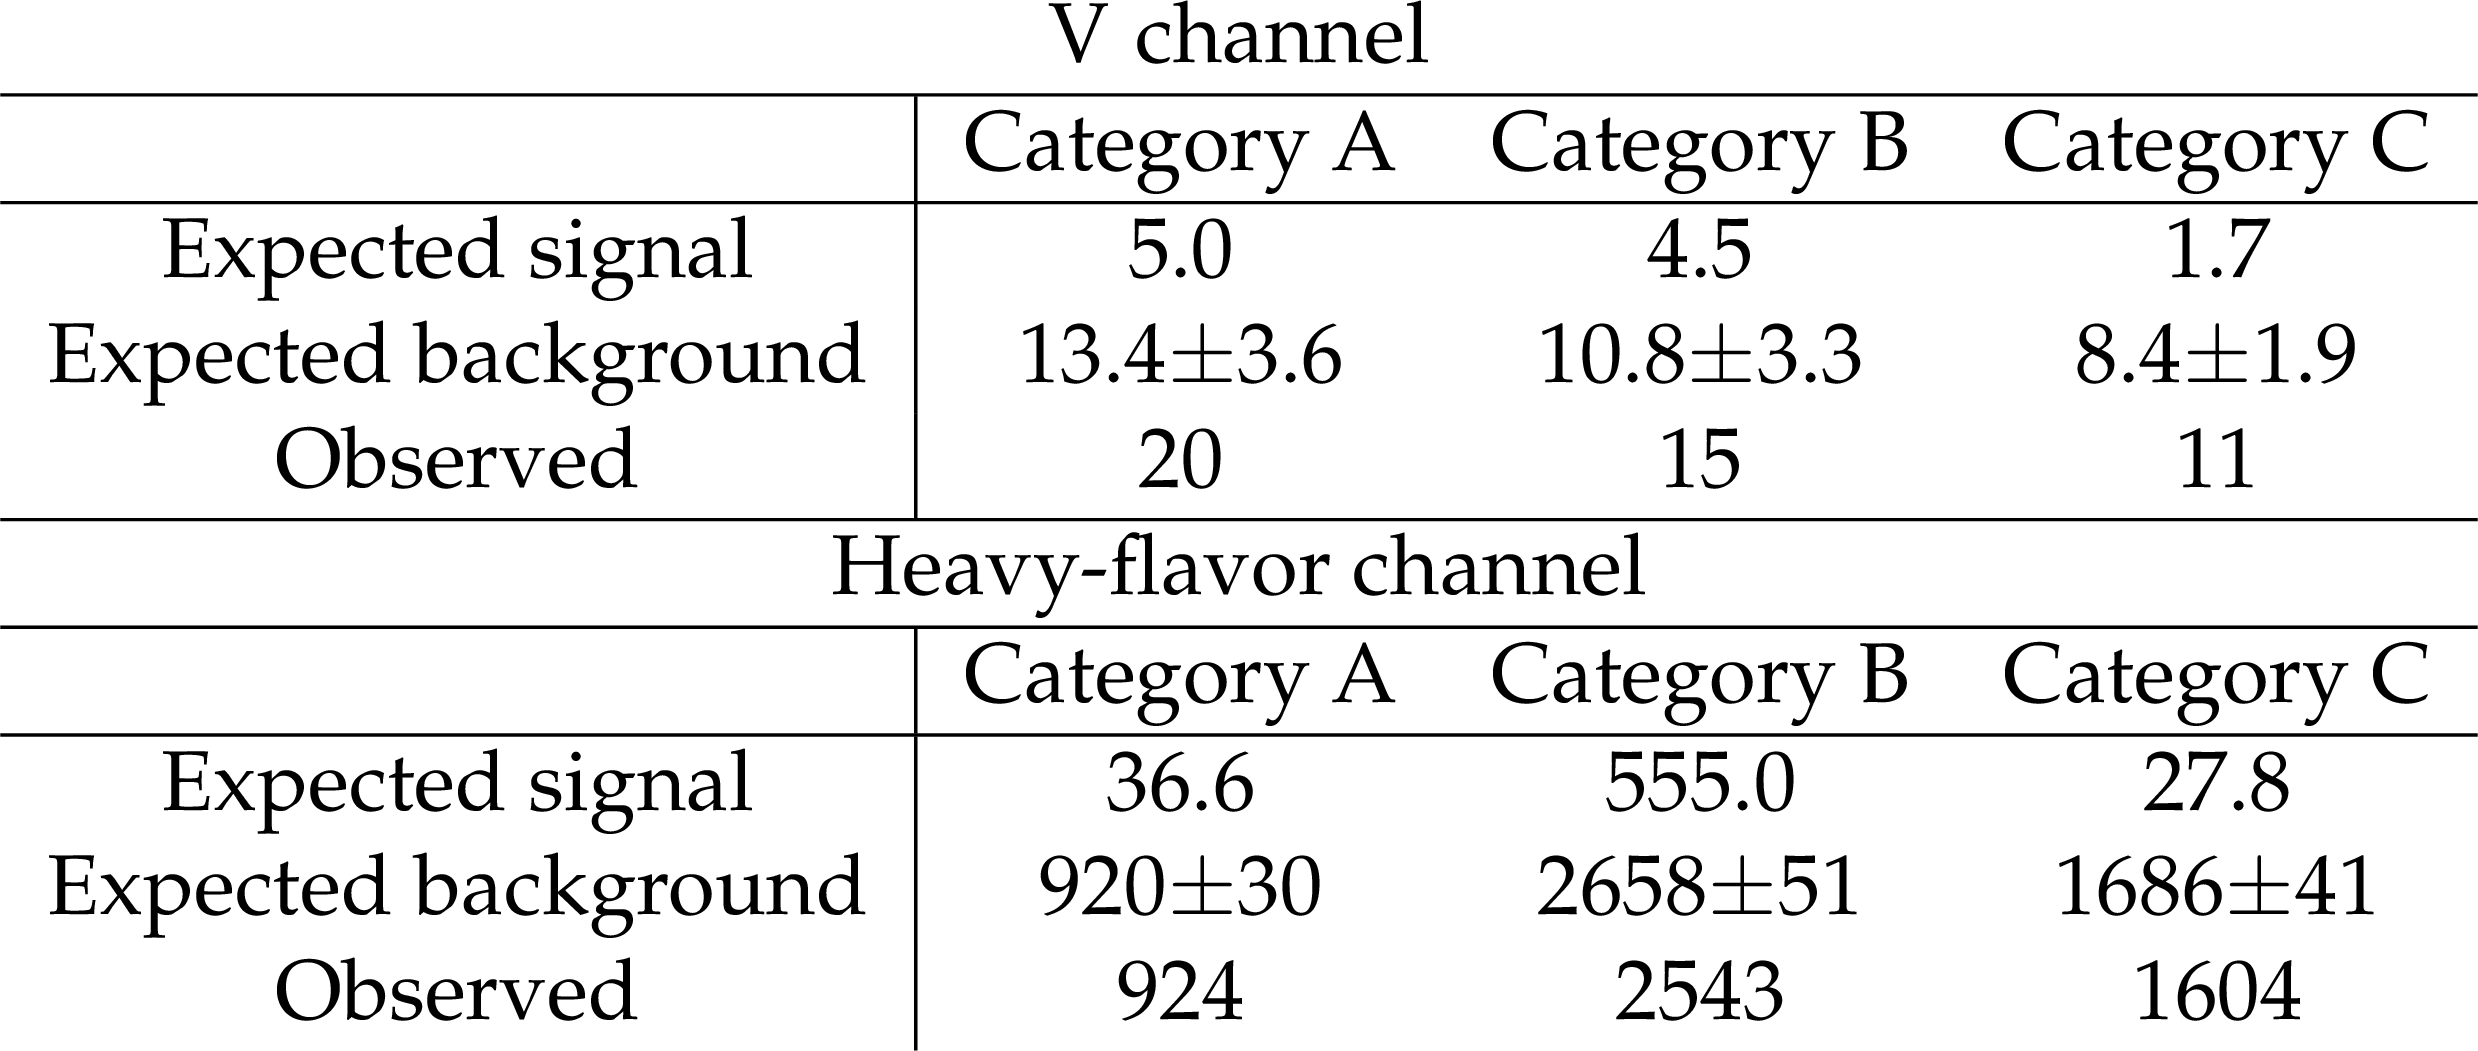
Table 5:
Event yields in the signal region of the muon triplet mass spectrum. Shown are the number of expected signal events for $ \mathcal{B} (\tau \!\to\! 3\mu) = 10^{-7} $, the background expectation from the fit to the $ m(3\mu) $ sidebands, and the number of events observed in data. |
png pdf |
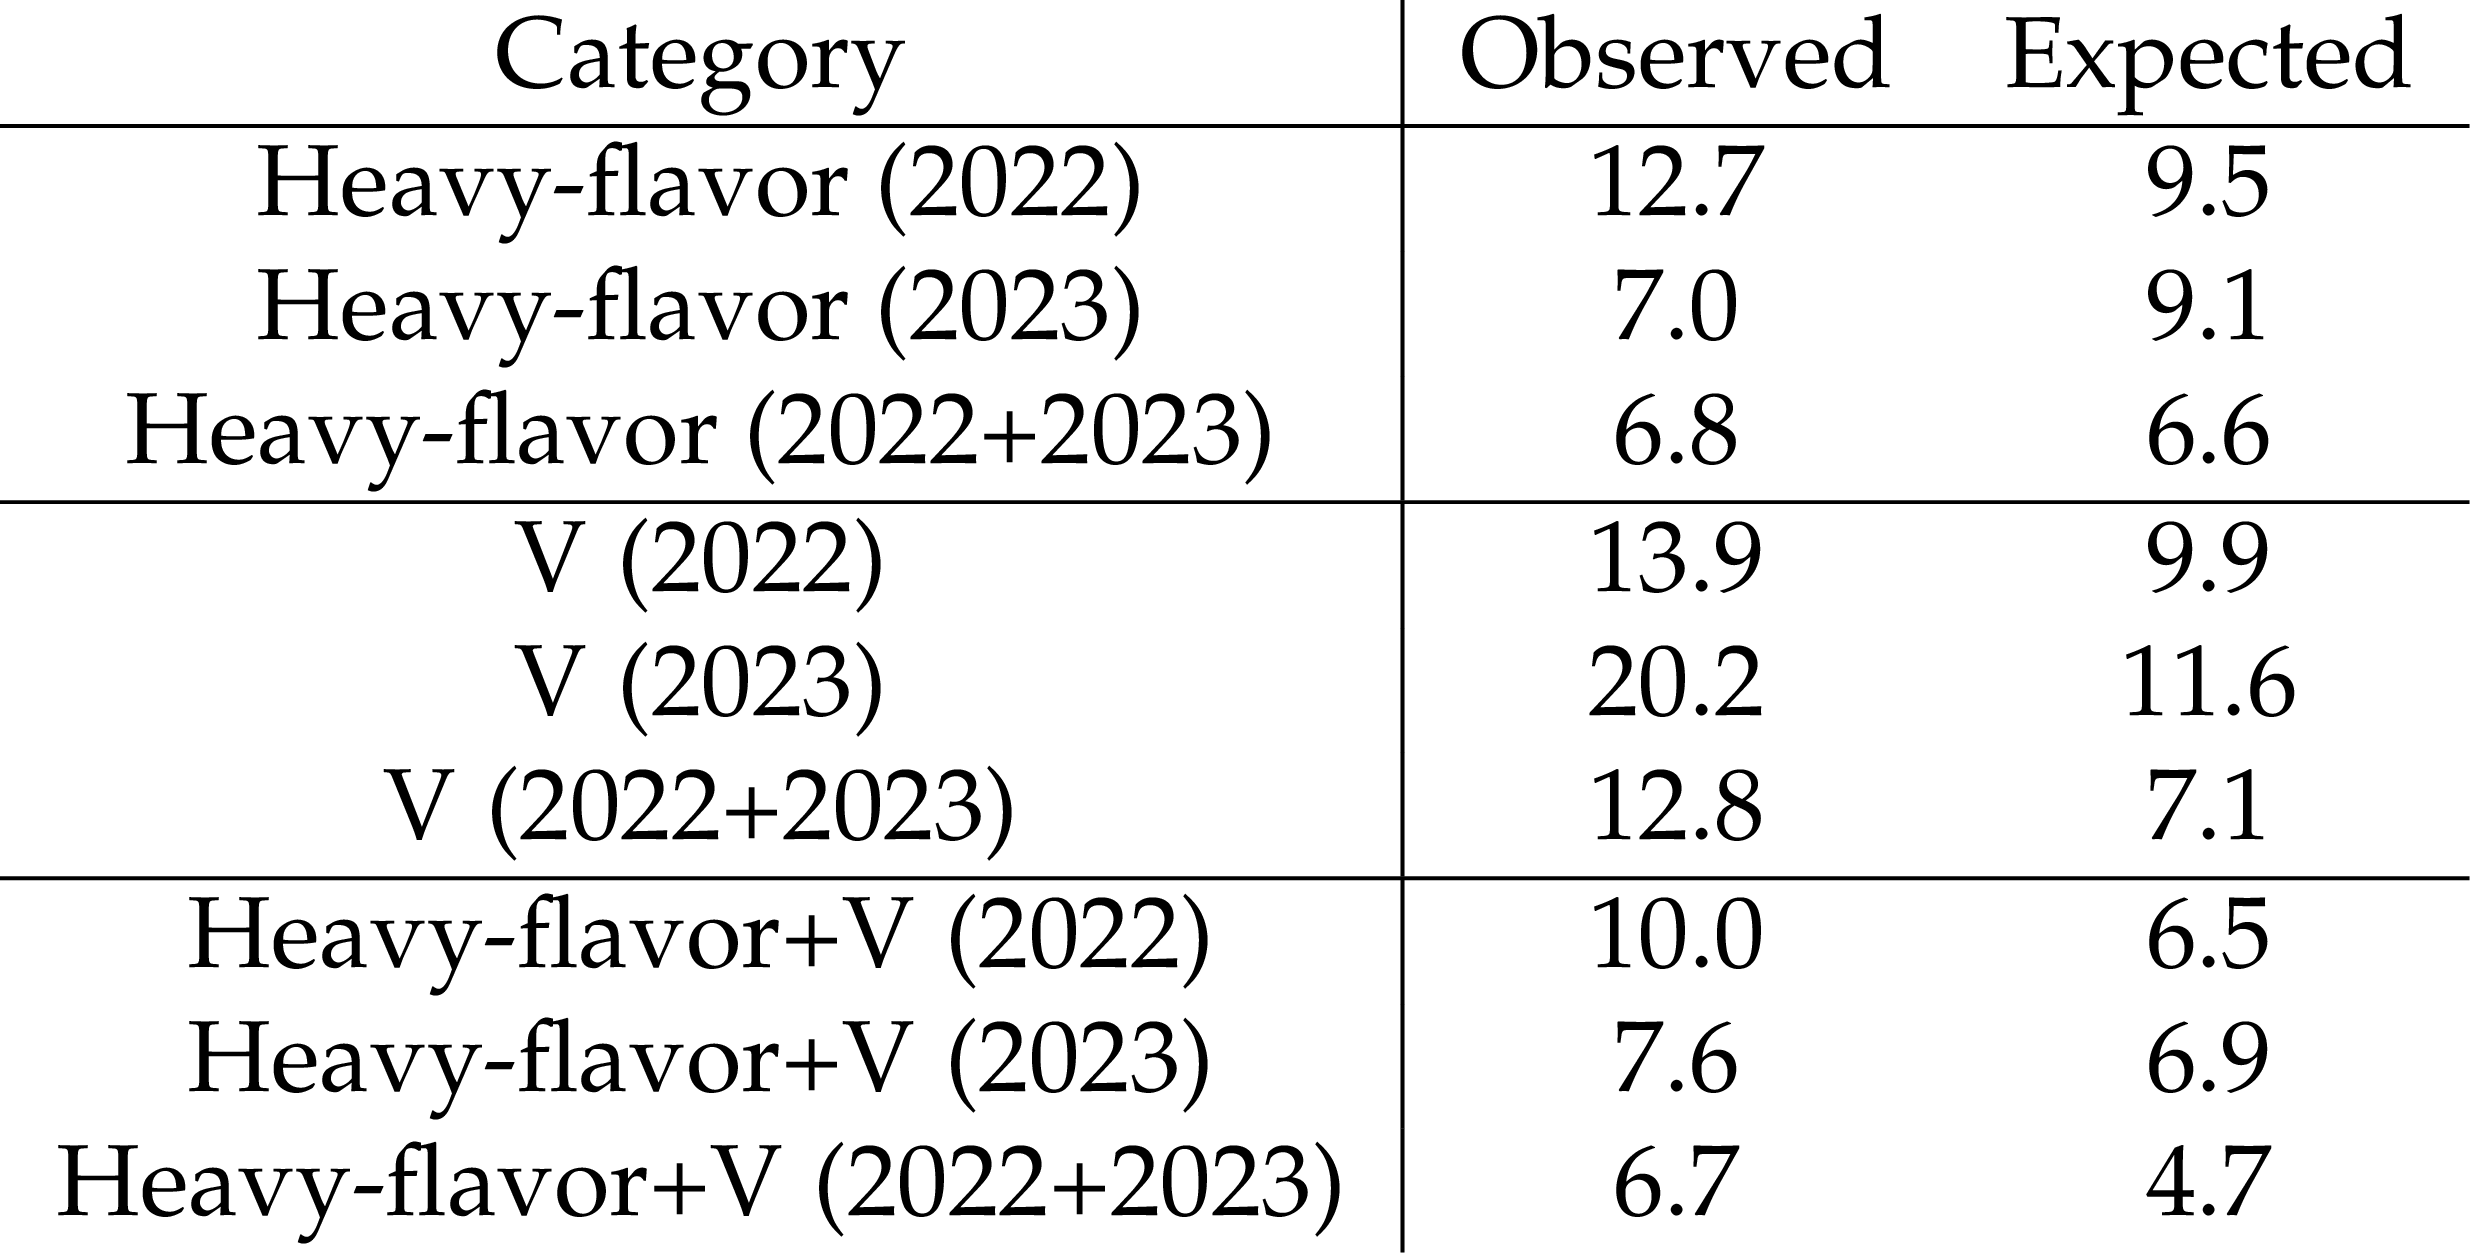
Table 6:
The expected and observed upper limit for different combinations of the analysis categories. The upper limits are computed at 90% of confidence level and reported in units of 10$ ^{-8} $. |
| Summary |
| A search for the lepton flavor violating decay $ \tau \!\to\! 3\mu $ has been performed in proton-proton collisions at a center-of-mass energy of $ \sqrt{s} = $ 13.6 TeV, recorded with the CMS experiment in 2022 and 2023. The decays of tau leptons produced in heavy-flavor, W, and Z boson decays have been utilized. No evidence for the decay has been observed, and upper limits on the branching fraction $ \mathcal{B}(\tau \!\to\! 3\mu) $ are set, yielding an observed (expected) upper limit of 6.7 $ \:(4.7) \times 10^{-8} $ at 90% confidence level. |
| Additional Figures | |
png pdf |
Additional Figure 1:
Expected upper limit (dashed line), with its 68% and 95% confidence intervals (green and yellow bands), and the observed upper limit for $\mathcal{B}(\tau \!\to\ 3\mu)$ at 90% CL, obtained by combining the heavy-flavor and V channel sensitivities. The bounds derived from Run 2 and Run 3 data separately, as well as from their combination, are shown. |
png pdf |
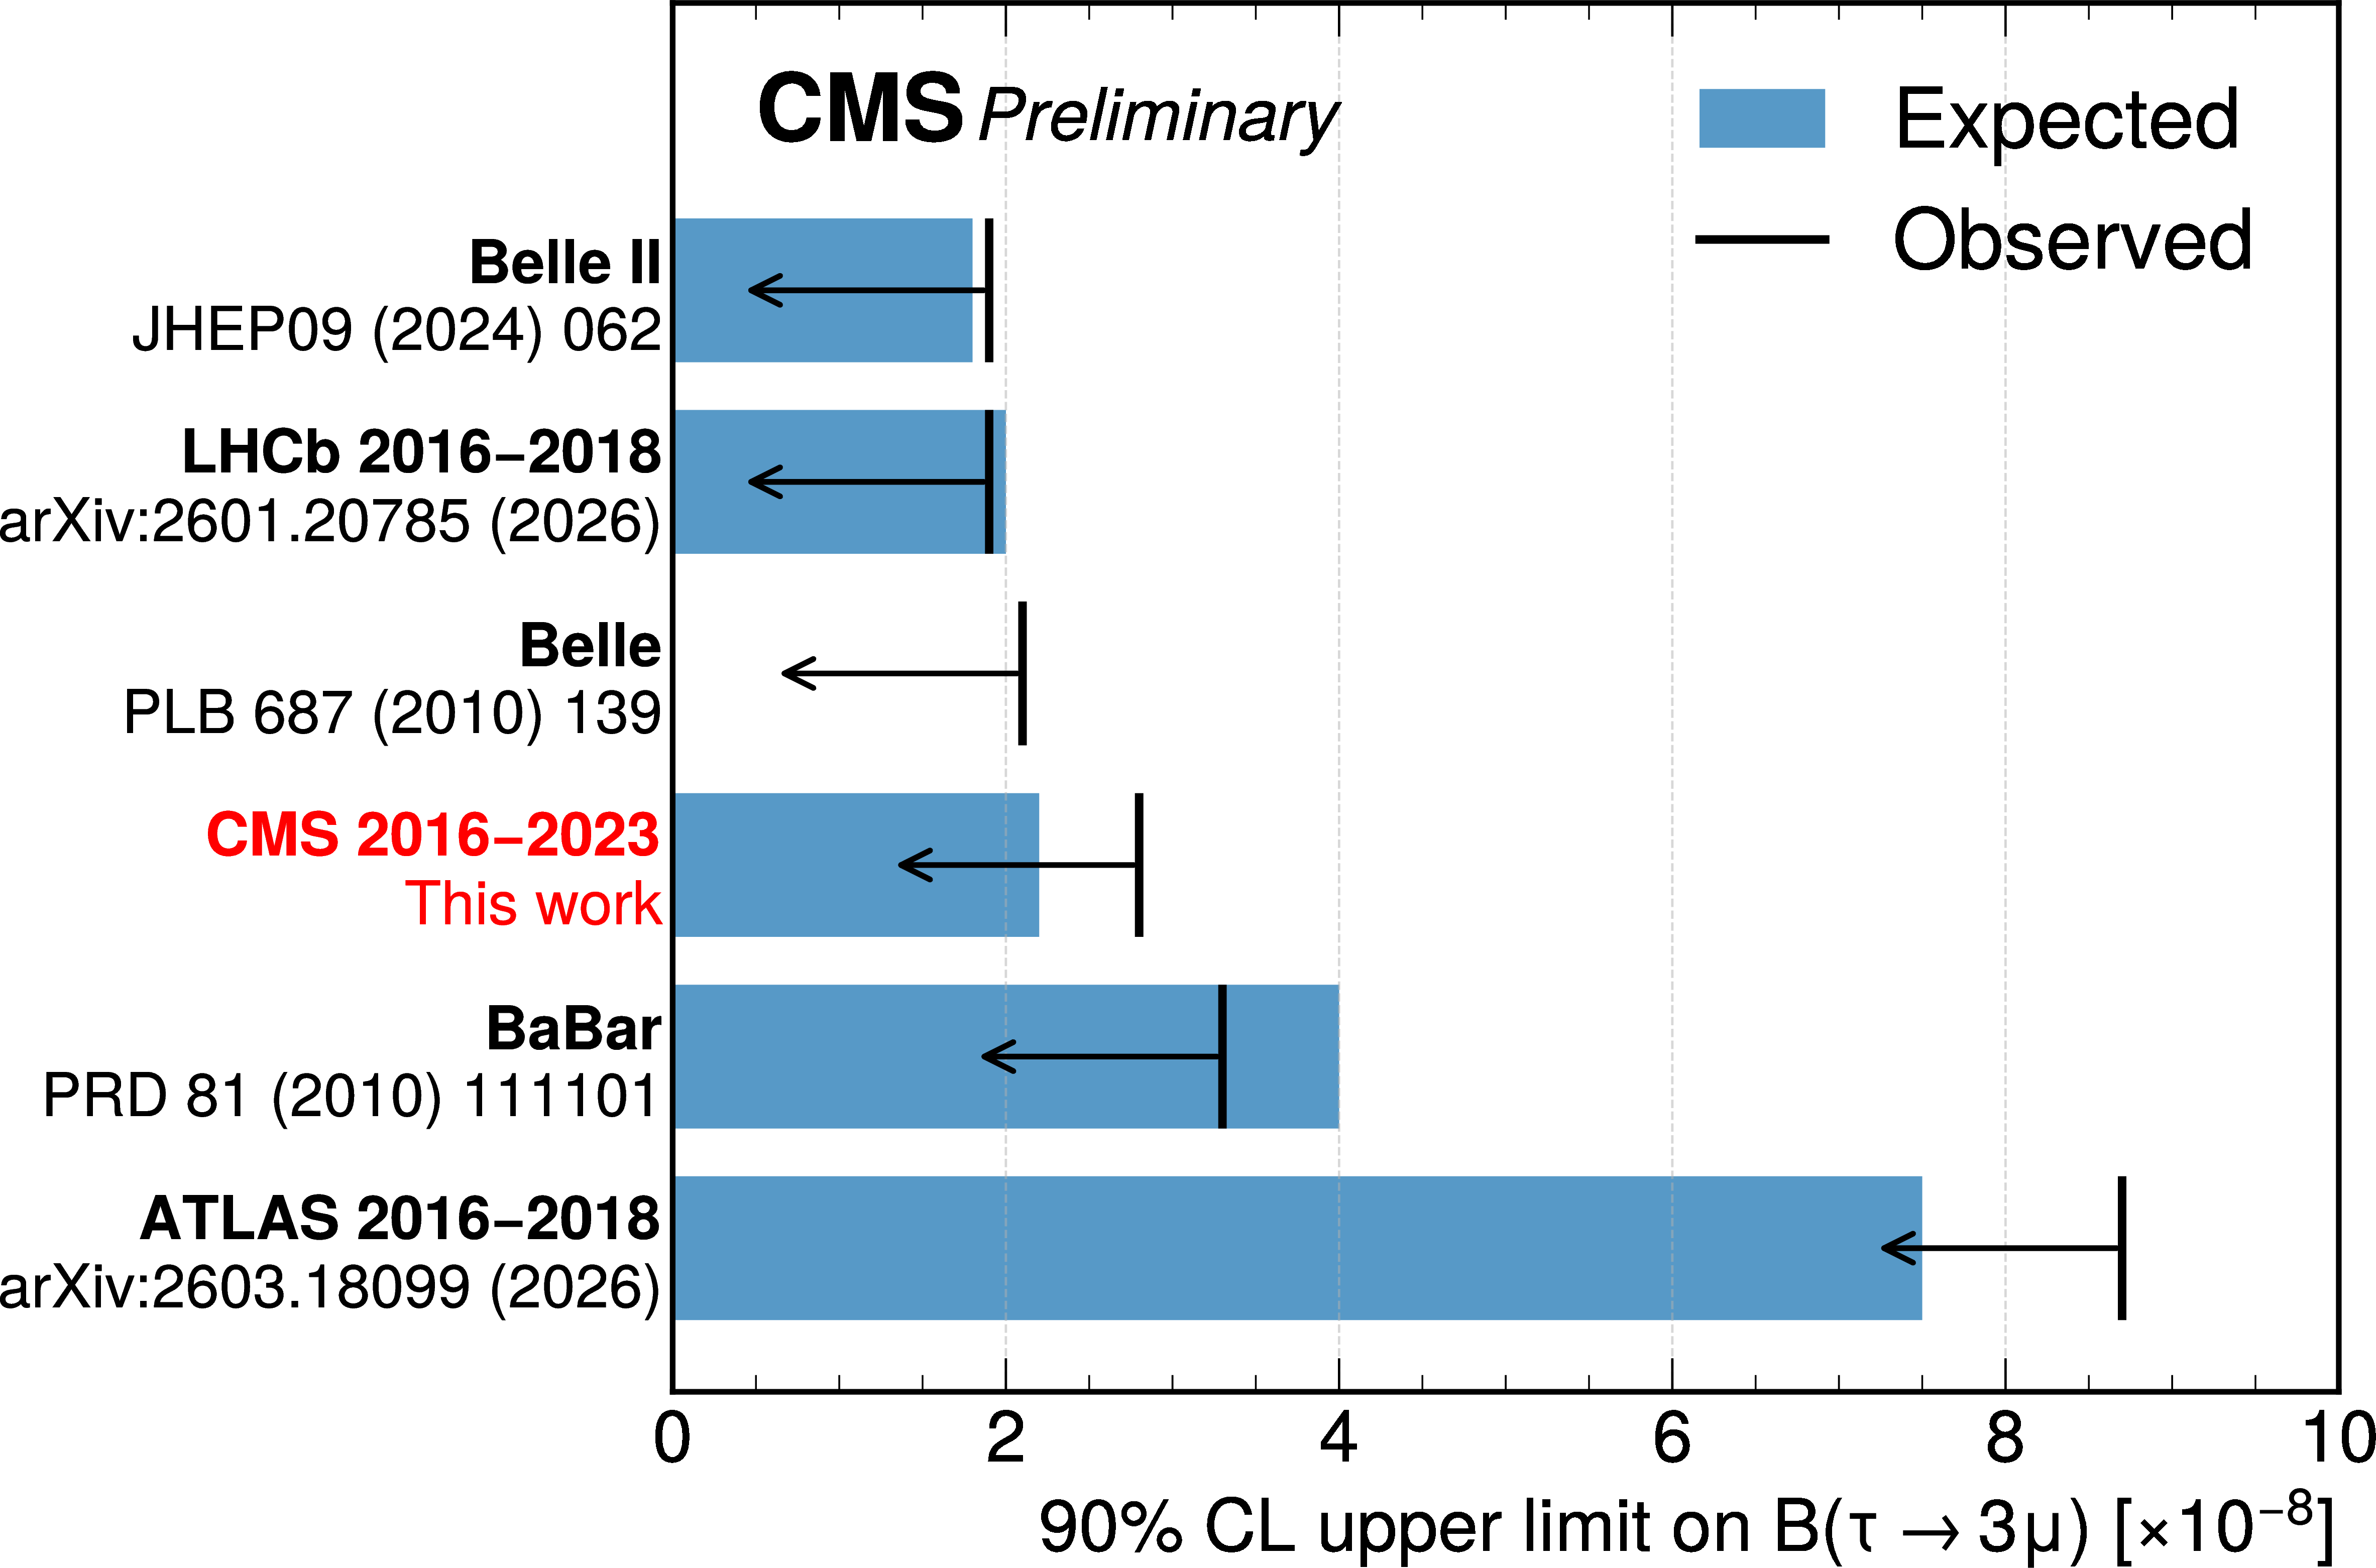
Additional Figure 2:
Latest experimental results on exclusion limits for $\mathcal{B}(\tau \!\to\ 3\mu )$ at 90% CL, as published in this work (highlighted in red) and by other experiments. For each measurement, the interval of $\mathcal{B}(\tau \!\to\ 3\mu )$ values not excluded by the expected upper limits, when available, is represented by the colored bands, while the black arrows indicate the observed exclusion limits. |
| References | ||||
| 1 | X.-Y. Pham | Lepton flavor changing in neutrinoless $ \tau $ decays | EPJC 8 (1999) 513 | hep-ph/9810484 |
| 2 | G. Hernandez-Tom é , G. Lopez Castro, and P. Roig | Flavor violating leptonic decays of $ \tau $ and $ \mu $ leptons in the Standard Model with massive neutrinos | EPJC 79 (2019) 84 | 1807.06050 |
| 3 | P. Blackstone, M. Fael, and E. Passemar | $ \tau \to \mu\mu\mu $ at a rate of one out of $ 10^{14} $ tau decays? | EPJC 80 (2020) 506 | 1912.09862 |
| 4 | W. J. Marciano, T. Mori, and J. M. Roney | Charged lepton flavor violation experiments | Ann. Rev. Nucl. Part. Sci. 58 (2008) 315 | |
| 5 | M. Raidal et al. | Flavour physics of leptons and dipole moments | EPJC 57 (2008) 13 | 0801.1826 |
| 6 | E. Arganda and M. J. Herrero | Testing supersymmetry with lepton flavor violating $ \tau $ and $ \mu $ decays | PRD 73 (2006) 055003 | hep-ph/0510405 |
| 7 | CMS Collaboration | Search for the lepton flavor violating \ensuremath\tau\ensuremath\to 3\ensuremath\mu decay in proton-proton collisions at $ \sqrt{s}= $ 13 TeV | PLB 853 (2024) 138633 | CMS-BPH-21-005 2312.02371 |
| 8 | Belle-II Collaboration | Search for lepton-flavor-violating \ensuremath\tau$ ^{-} $\ensuremath\to \ensuremath\mu$ ^{-} $\ensuremath\mu$ ^{+} $\ensuremath\mu$ ^{-} $ decays at Belle II | JHEP 09 (2024) 062 | 2405.07386 |
| 9 | LHCb Collaboration | Search for $ \tau^-\to \mu^-\mu^+\mu^- $ decays at the LHCb experiment with Run 2 data | 2601.20785 | |
| 10 | BaBar Collaboration | Limits on $ \tau $ lepton-flavor violating decays in three charged leptons | PRD 81 (2010) 111101 | 1002.4550 |
| 11 | ATLAS Collaboration | A search for lepton-flavour violating $ \tau\to 3\mu $ decays with the ATLAS detector | 2603.18099 | |
| 12 | CMS Collaboration | Enriching the physics program of the CMS experiment via data scouting and data parking | Phys. Rept. 1115 (2025) 678 | CMS-EXO-23-007 2403.16134 |
| 13 | CMS Collaboration | The CMS experiment at the CERN LHC | JINST 3 (2008) S08004 | |
| 14 | CMS Collaboration | Development of the CMS detector for the CERN LHC Run 3 | JINST 19 (2024) P05064 | |
| 15 | CMS Collaboration | Performance of the CMS Level-1 trigger in proton-proton collisions at $ \sqrt{s} = $ 13 TeV | JINST 15 (2020) P10017 | CMS-TRG-17-001 2006.10165 |
| 16 | CMS Collaboration | The CMS trigger system | JINST 12 (2017) P01020 | CMS-TRG-12-001 1609.02366 |
| 17 | CMS Collaboration | Performance of the CMS high-level trigger during LHC run 2 | JINST 19 (2024) P11021 | CMS-TRG-19-001 2410.17038 |
| 18 | CMS Collaboration | Electron and photon reconstruction and identification with the CMS experiment at the CERN LHC | JINST 16 (2021) P05014 | CMS-EGM-17-001 2012.06888 |
| 19 | CMS Collaboration | Performance of the CMS muon detector and muon reconstruction with proton-proton collisions at $ \sqrt{s}= $ 13 TeV | JINST 13 (2018) P06015 | CMS-MUO-16-001 1804.04528 |
| 20 | CMS Collaboration | Description and performance of track and primary-vertex reconstruction with the CMS tracker | JINST 9 (2014) P10009 | CMS-TRK-11-001 1405.6569 |
| 21 | CMS Collaboration | Track impact parameter resolution for the full pseudo rapidity coverage in the 2017 dataset with the CMS phase-1 pixel detector | CMS Detector Performance Summary CMS-DP-2020-049, 2020 CDS |
|
| 22 | CMS Collaboration | Particle-flow reconstruction and global event description with the CMS detector | JINST 12 (2017) P10003 | CMS-PRF-14-001 1706.04965 |
| 23 | CMS Collaboration | Performance of missing transverse momentum reconstruction in proton-proton collisions at $ \sqrt{s} = $ 13 TeV using the CMS detector | JINST 14 (2019) P07004 | CMS-JME-17-001 1903.06078 |
| 24 | D. Bertolini, P. Harris, M. Low, and N. Tran | Pileup per particle identification | JHEP 10 (2014) 059 | 1407.6013 |
| 25 | T. Sjöstrand et al. | An introduction to PYTHIA 8.2 | Comput. Phys. Commun. 191 (2015) 159 | 1410.3012 |
| 26 | D. J. Lange | The EvtGen particle decay simulation package | NIM A 462 (2001) 152 | |
| 27 | J. Alwall et al. | The automated computation of tree-level and next-to-leading order differential cross sections, and their matching to parton shower simulations | JHEP 07 (2014) 079 | 1405.0301 |
| 28 | R. Frederix and S. Frixione | Merging meets matching in MC@NLO | JHEP 12 (2012) 061 | 1209.6215 |
| 29 | NNPDF Collaboration | Parton distributions from high-precision collider data | EPJC 77 (2017) 663 | 1706.00428 |
| 30 | CMS Collaboration | Extraction and validation of a new set of CMS PYTHIA8 tunes from underlying-event measurements | EPJC 80 (2020) 4 | CMS-GEN-17-001 1903.12179 |
| 31 | GEANT4 Collaboration | GEANT 4---a simulation toolkit | NIM A 506 (2003) 250 | |
| 32 | K. Prokofiev and T. Speer | A kinematic and a decay chain reconstruction library | in 14th Int. Conf. on Computing in High-Energy and Nuclear Physics, 2005 | |
| 33 | T. Chen and C. Guestrin | XGBoost: A scalable tree boosting system | in nd ACM SIGKDD Int. Conf. on Knowledge Discovery and Data Mining, KDD '16, 2016 Proc. 2 (2016) 785 |
|
| 34 | T. Akiba et al. | Optuna: A next-generation hyperparameter optimization framework | in th ACM SIGKDD International Conference on Knowledge Discovery and Data Mining, 2019 Proceedings of the 2 (2019) 5 |
|
| 35 | CMS Collaboration | Precision luminosity measurement in proton-proton collisions at $ \sqrt{s} = $ 13 TeV in 2015 and 2016 at CMS | EPJC 81 (2021) 800 | CMS-LUM-17-003 2104.01927 |
| 36 | CMS Collaboration | Luminosity measurement in proton-proton collisions at 13.6 TeV in 2022 at CMS | technical report, CERN, Geneva, 2024 CDS |
|
| 37 | CMS Collaboration | Measurement of the offline integrated luminosity for the CMS proton-proton collision dataset recorded in 2023 | CDS | |
| 38 | CMS Collaboration | Measurements of the inclusive W and Z boson production cross sections and their ratios in proton-proton collisions at $ \sqrt{s}= $ 13.6 TeV | JHEP 01 (2026) 047 | CMS-SMP-22-017 2503.09742 |
| 39 | Particle Data Group Collaboration | Review of particle physics | PRD 110 (2024) 030001 | |
| 40 | CMS Collaboration | Performance of the CMS muon trigger system in proton-proton collisions at $ \sqrt{s} = $ 13 TeV | JINST 16 (2021) P07001 | CMS-MUO-19-001 2102.04790 |
| 41 | M. Pivk and F. Le Diberder | Plots: A statistical tool to unfold data distributions | Nuclear Instruments and Methods in Physics Research Section A: Accelerators, Spectrometers, 2005 Detectors and Associated Equipment 555 (2005) 356 |
|
| 42 | CMS Collaboration | Identification of low-momentum muons in the CMS detector using multivariate techniques in proton-proton collisions at sqrt(s) = 13.6 TeV | JINST 20 (2025) P04021 | CMS-MUO-24-001 2412.17590 |
| 43 | J. H. Friedman | Greedy function approximation: A gradient boosting machine | Ann. Stat. 29 (2001) 1189 | |
| 44 | F. Pedregosa et al. | Scikit-learn: Machine learning in Python | JMLR 12 (2011) 2825 | 1201.0490 |
| 45 | C.~Adam-Bourdarios et al. | The Higgs boson machine learning challenge | Bourdarios in Proceedings of the NIPS 2014 (2015) 19 | |
| 46 | A. L. Read | Presentation of search results: The CL$ _{\text{s}} $ technique | JPG 28 (2002) 2693 | |
| 47 | T. Junk | Confidence level computation for combining searches with small statistics | NIM A 434 (1999) 435 | hep-ex/9902006 |
| 48 | S. S. Wilks | The large-sample distribution of the likelihood ratio for testing composite hypotheses | The Annals of Mathematical Statistics 9 (1938) 60 | |
| 49 | CMS Collaboration | The CMS statistical analysis and combination tool: COMBINE | Comput. Softw. Big Sci. 8 (2024) 19 | CMS-CAT-23-001 2404.06614 |
| 50 | W. Verkerke and D. P. Kirkby | The RooFit toolkit for data modeling | eConf C0303241 MOLT007, 2003 | physics/0306116 |
| 51 | L. Moneta et al. | The RooStats Project | PoS ACAT 057, 2010 link |
1009.1003 |
| 52 | P. D. Dauncey, M. Kenzie, N. Wardle, and G. J. Davies | Handling uncertainties in background shapes: the discrete profiling method | JINST 10 (2015) P04015 | 1408.6865 |
| 53 | T. Skwarnicki | A study of the radiative cascade transitions between the Upsilon-prime and Upsilon resonances | PhD thesis, Institute of Nuclear Physics, Krakow, 1986 link |
|
|
|
Compact Muon Solenoid LHC, CERN |
|

|

|

|

|

|