

Compact Muon Solenoid
LHC, CERN
| CMS-PAS-BPH-20-003 | ||
| Combination of the ATLAS, CMS and LHCb results on the $\mathrm{B^0_{(s)}} \to \mu^+\mu^-$ decays | ||
| CMS Collaboration | ||
| August 2020 | ||
| Abstract: A combination of results on the rare $\mathrm{B^0_s} \to \mu^+\mu^-$ and $\mathrm{B^0} \to \mu^+\mu^-$ decays from the ATLAS, CMS, and LHCb experiments using data collected at the Large Hadron Collider between 2011 and 2016, is presented. The $\mathrm{B^0_s} \to \mu^+\mu^-$ branching fraction is obtained to be (2.69 $^{+\, 0.37}_{-\, 0.35}$) $\times $ 10$^{-9}$ and the effective lifetime of the $\mathrm{B^0_s} \to \mu^+\mu^-$ decay is measured to be $\tau_{\mathrm{B^0_s} \to \mu^+\mu^-} = $ 1.91$^{+0.37}_{-0.35}$ ps. An upper limit on the $\mathrm{B^0} \to \mu^+\mu^-$ branching fraction is evaluated to be $\mathcal{B}(\mathrm{B^0} \to \mu^+\mu^-) < $ 1.6 (1.9) $\times$ 10$^{-10}$ at 90% (95%) confidence level. An upper limit on the ratio of the $\mathrm{B^0} \to \mu^+\mu^-$ and $\mathrm{B^0_s} \to \mu^+\mu^-$ branching fractions is obtained to be 0.052 (0.060) at 90% (95%) confidence level. | ||
| Links: CDS record (PDF) ; inSPIRE record ; CADI line (restricted) ; | ||
| Figures | |
png pdf |
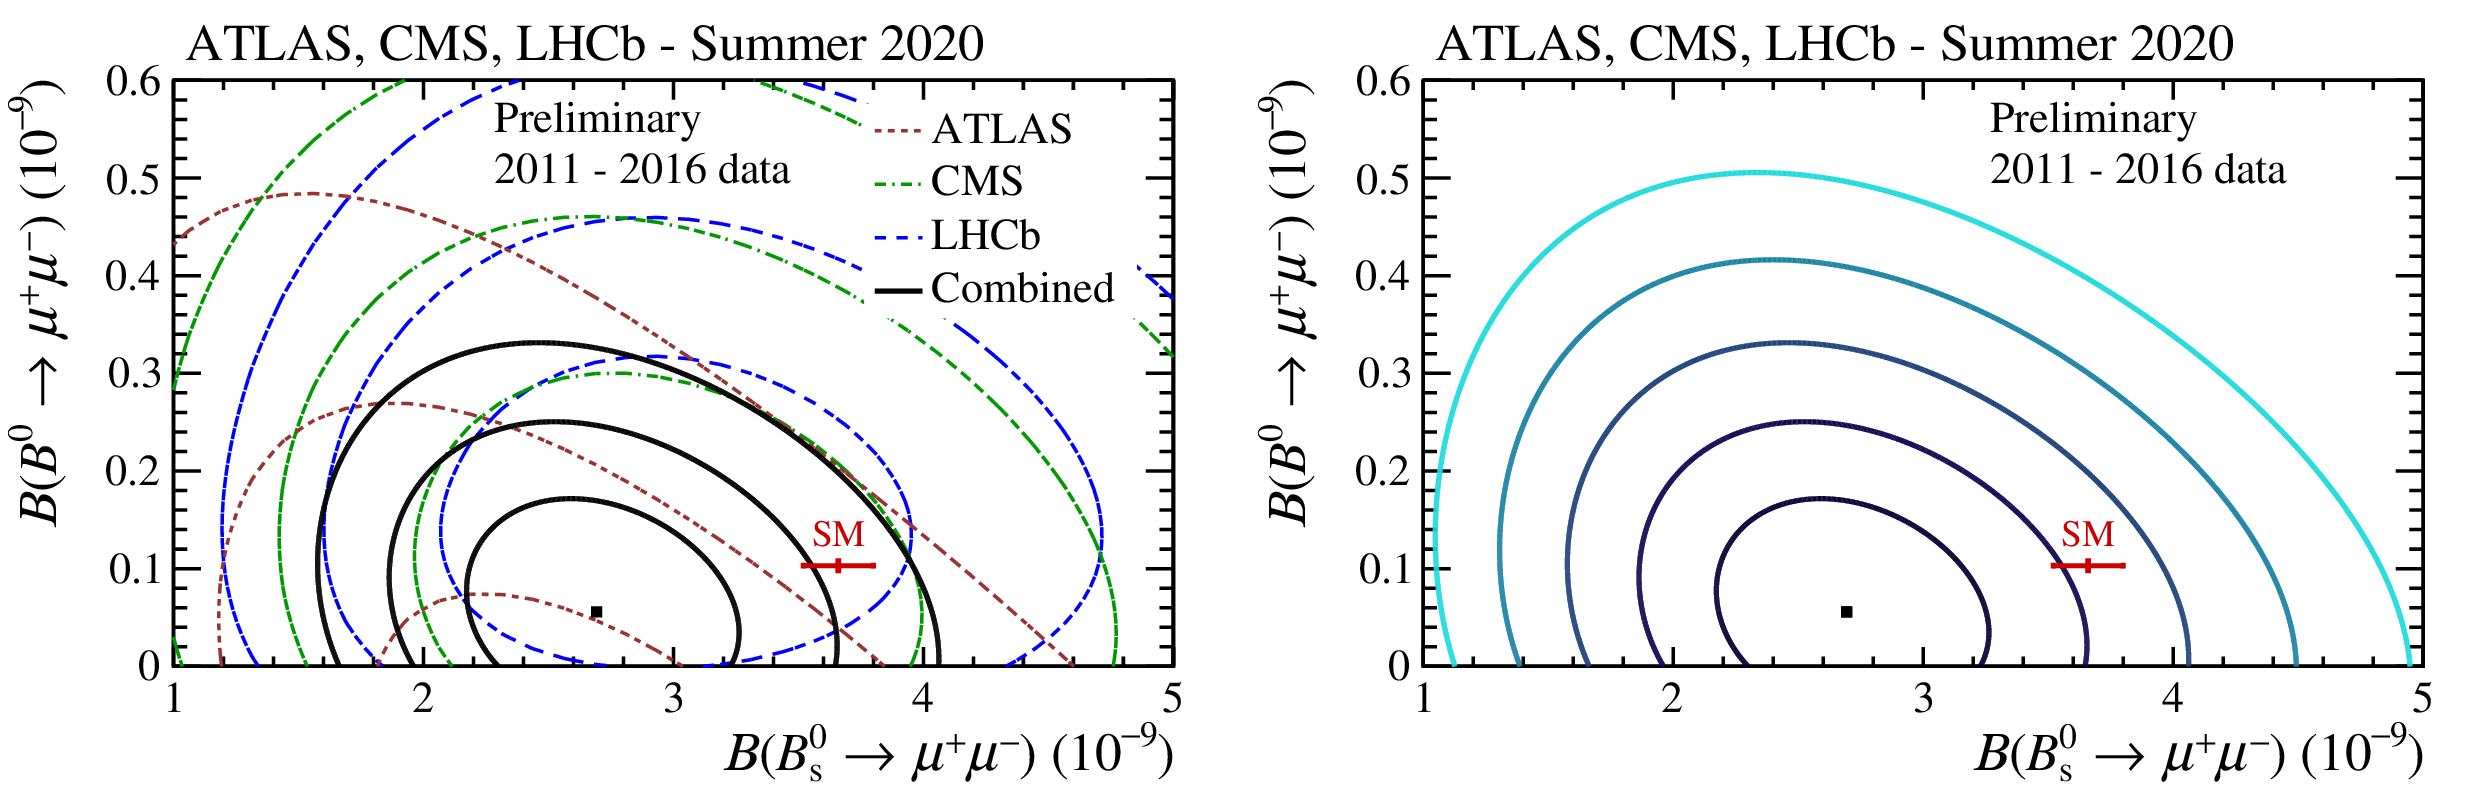
Figure 1:
In the left-hand plot, the two-dimensional likelihood contours of the results for the ${\mathrm{B ^0_ {s}} {\rightarrow} \mu ^+\mu ^-}$ and ${\mathrm{B ^0} {\rightarrow} \mu ^+\mu ^-}$ decays for the three experiments are shown together with their combination. The dataset used was collected from 2011 to 2016. The red dashed line represents the ATLAS experiment, the green dot-dashed line the CMS experiment, the blue long-dashed line the LHCb experiment and the continuous line their combination. For each experiment and for the combination, likelihood contours correspond to the values of $-2 \Delta \ln \mathcal {L} = $ 2.3, 6.2, and 11.8, respectively. In the right-hand plot, the combination of the three experiments is shown with contours of different shades. Likelihood contours correspond to the values of $-2\Delta \ln \mathcal {L} = $ 2.3, 6.2, 11.8, 19.3, and 30.2, represented in order by darkest to less dark colour. In both plots, the red point shows the SM predictions with their uncertainties. The published results from the three experiments are detailed in Ref. [1,2,3]. |
png pdf |
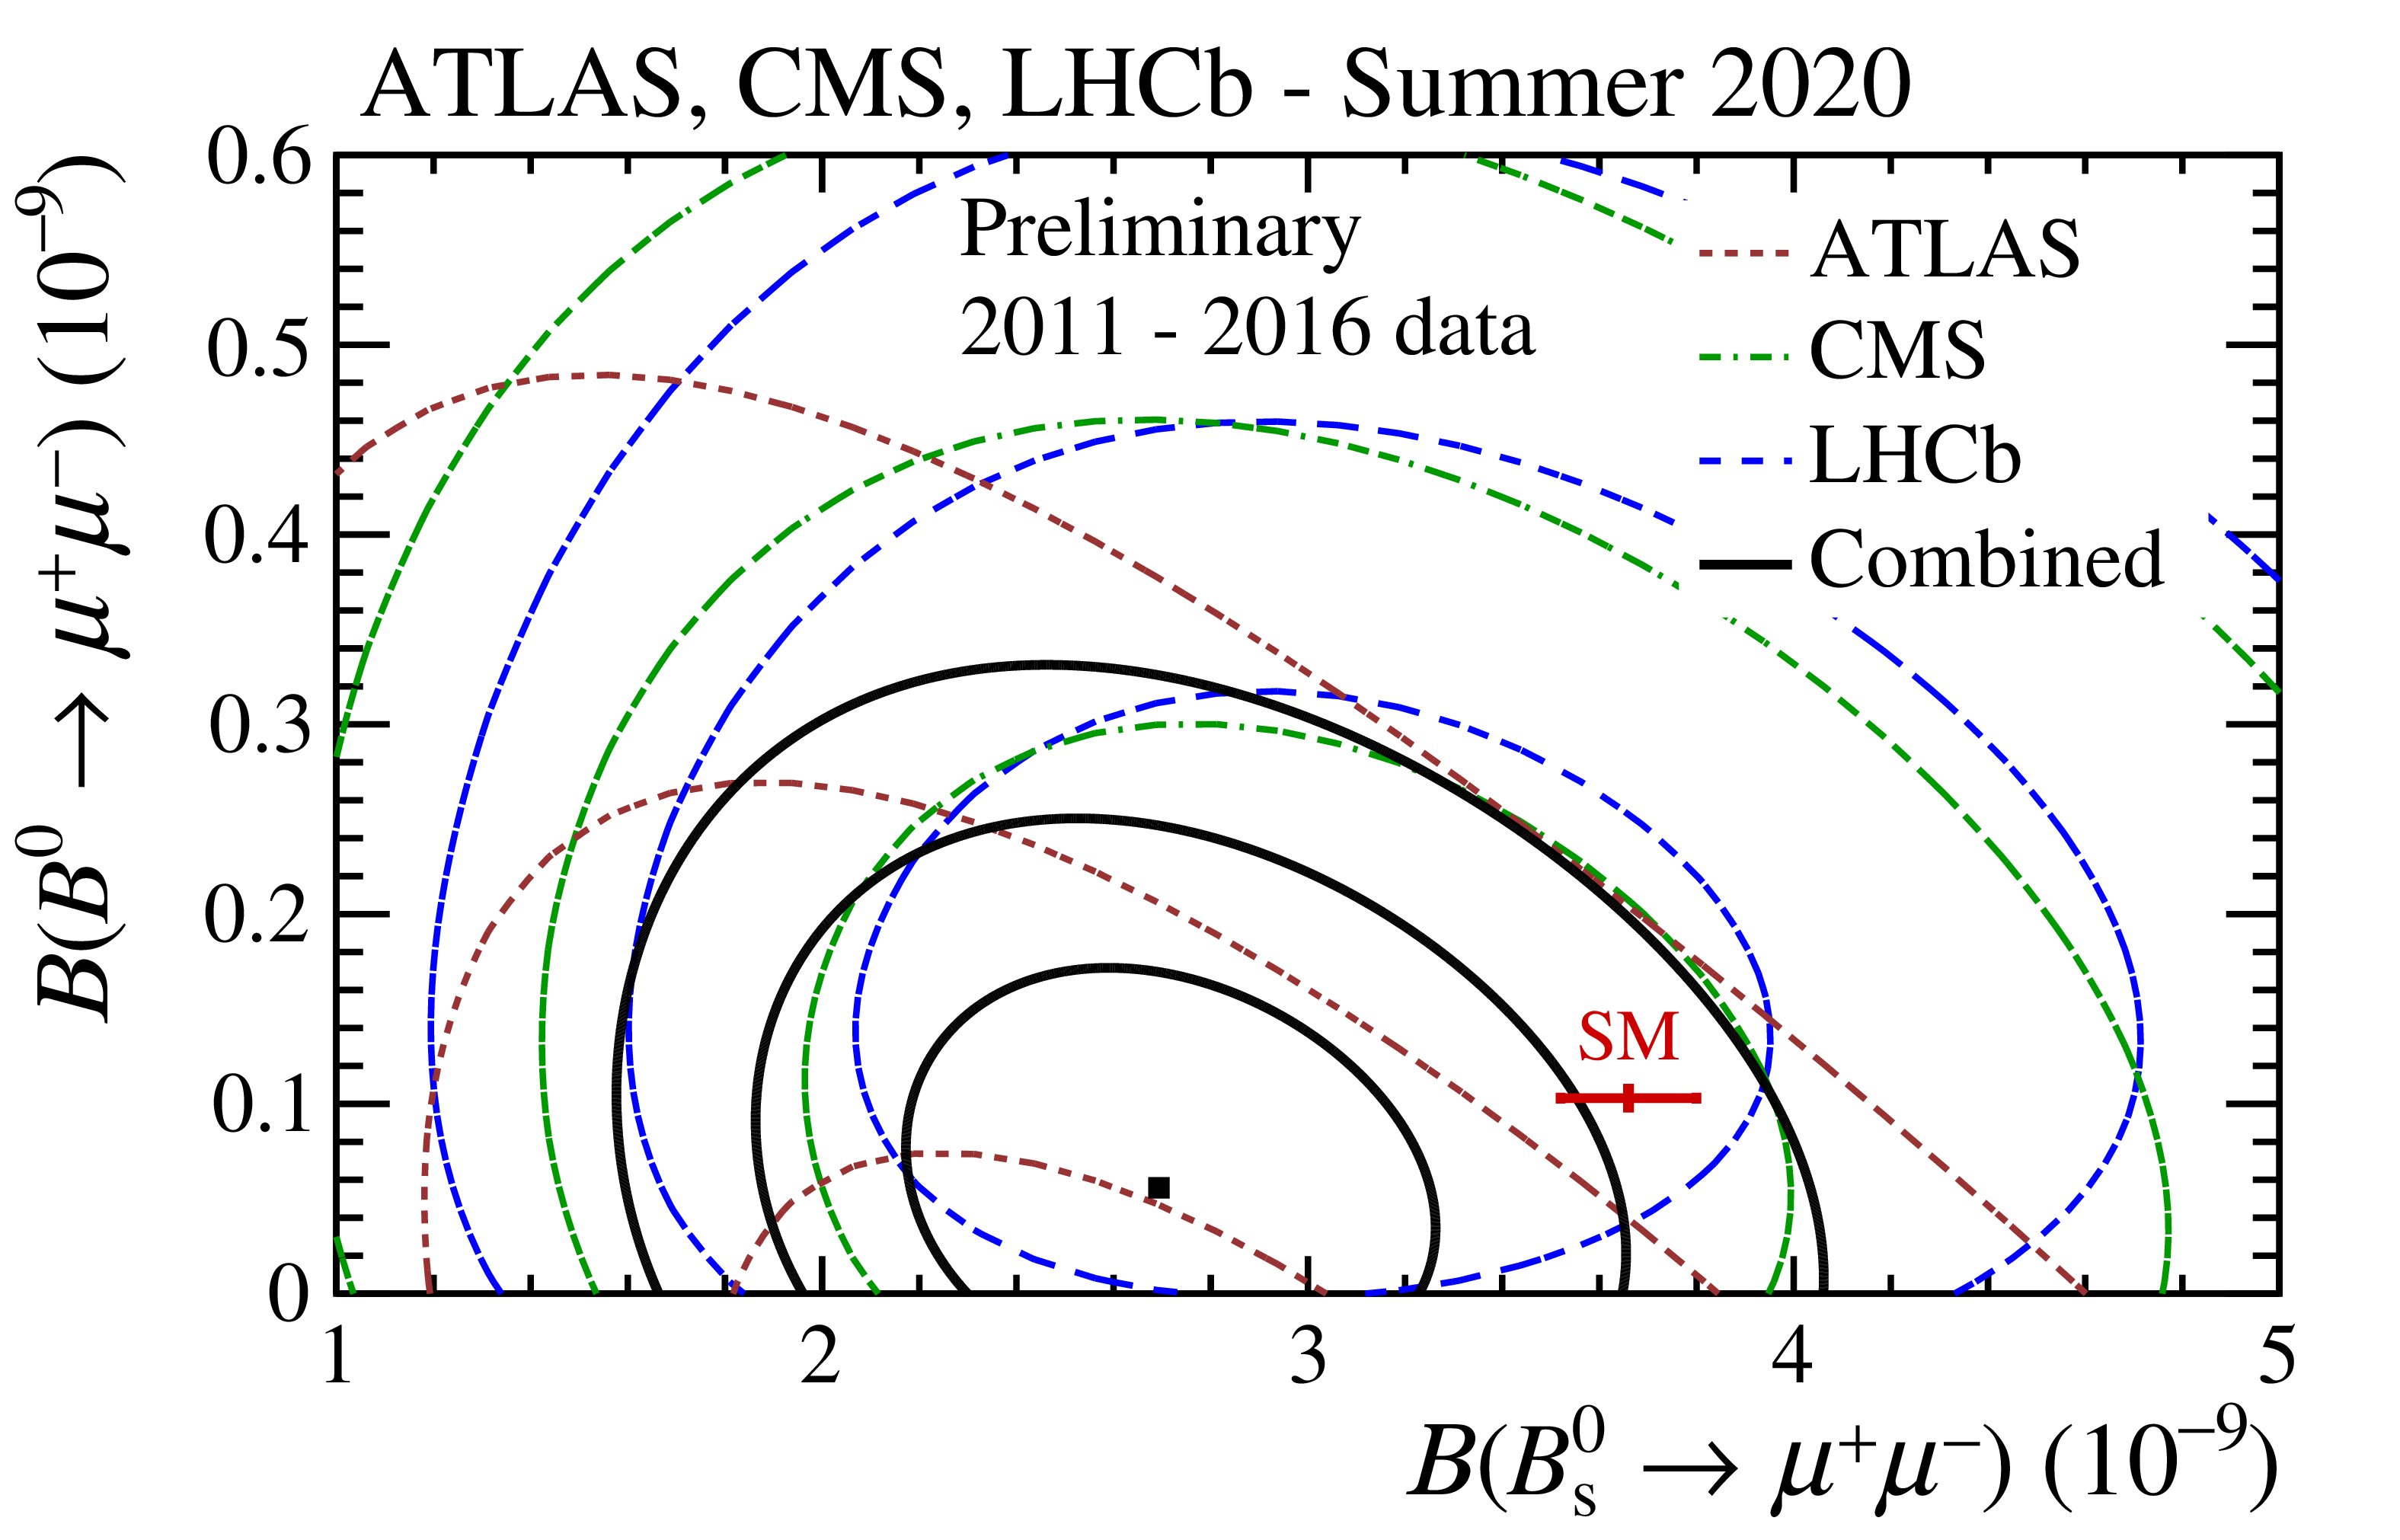
Figure 1-a:
The two-dimensional likelihood contours of the results for the ${\mathrm{B ^0_ {s}} {\rightarrow} \mu ^+\mu ^-}$ and ${\mathrm{B ^0} {\rightarrow} \mu ^+\mu ^-}$ decays for the three experiments are shown together with their combination. The dataset used was collected from 2011 to 2016. The red dashed line represents the ATLAS experiment, the green dot-dashed line the CMS experiment, the blue long-dashed line the LHCb experiment and the continuous line their combination. For each experiment and for the combination, likelihood contours correspond to the values of $-2 \Delta \ln \mathcal {L} = $ 2.3, 6.2, and 11.8, respectively. The red point shows the SM predictions with their uncertainties. The published results from the three experiments are detailed in Ref. [1,2,3]. |
png pdf |
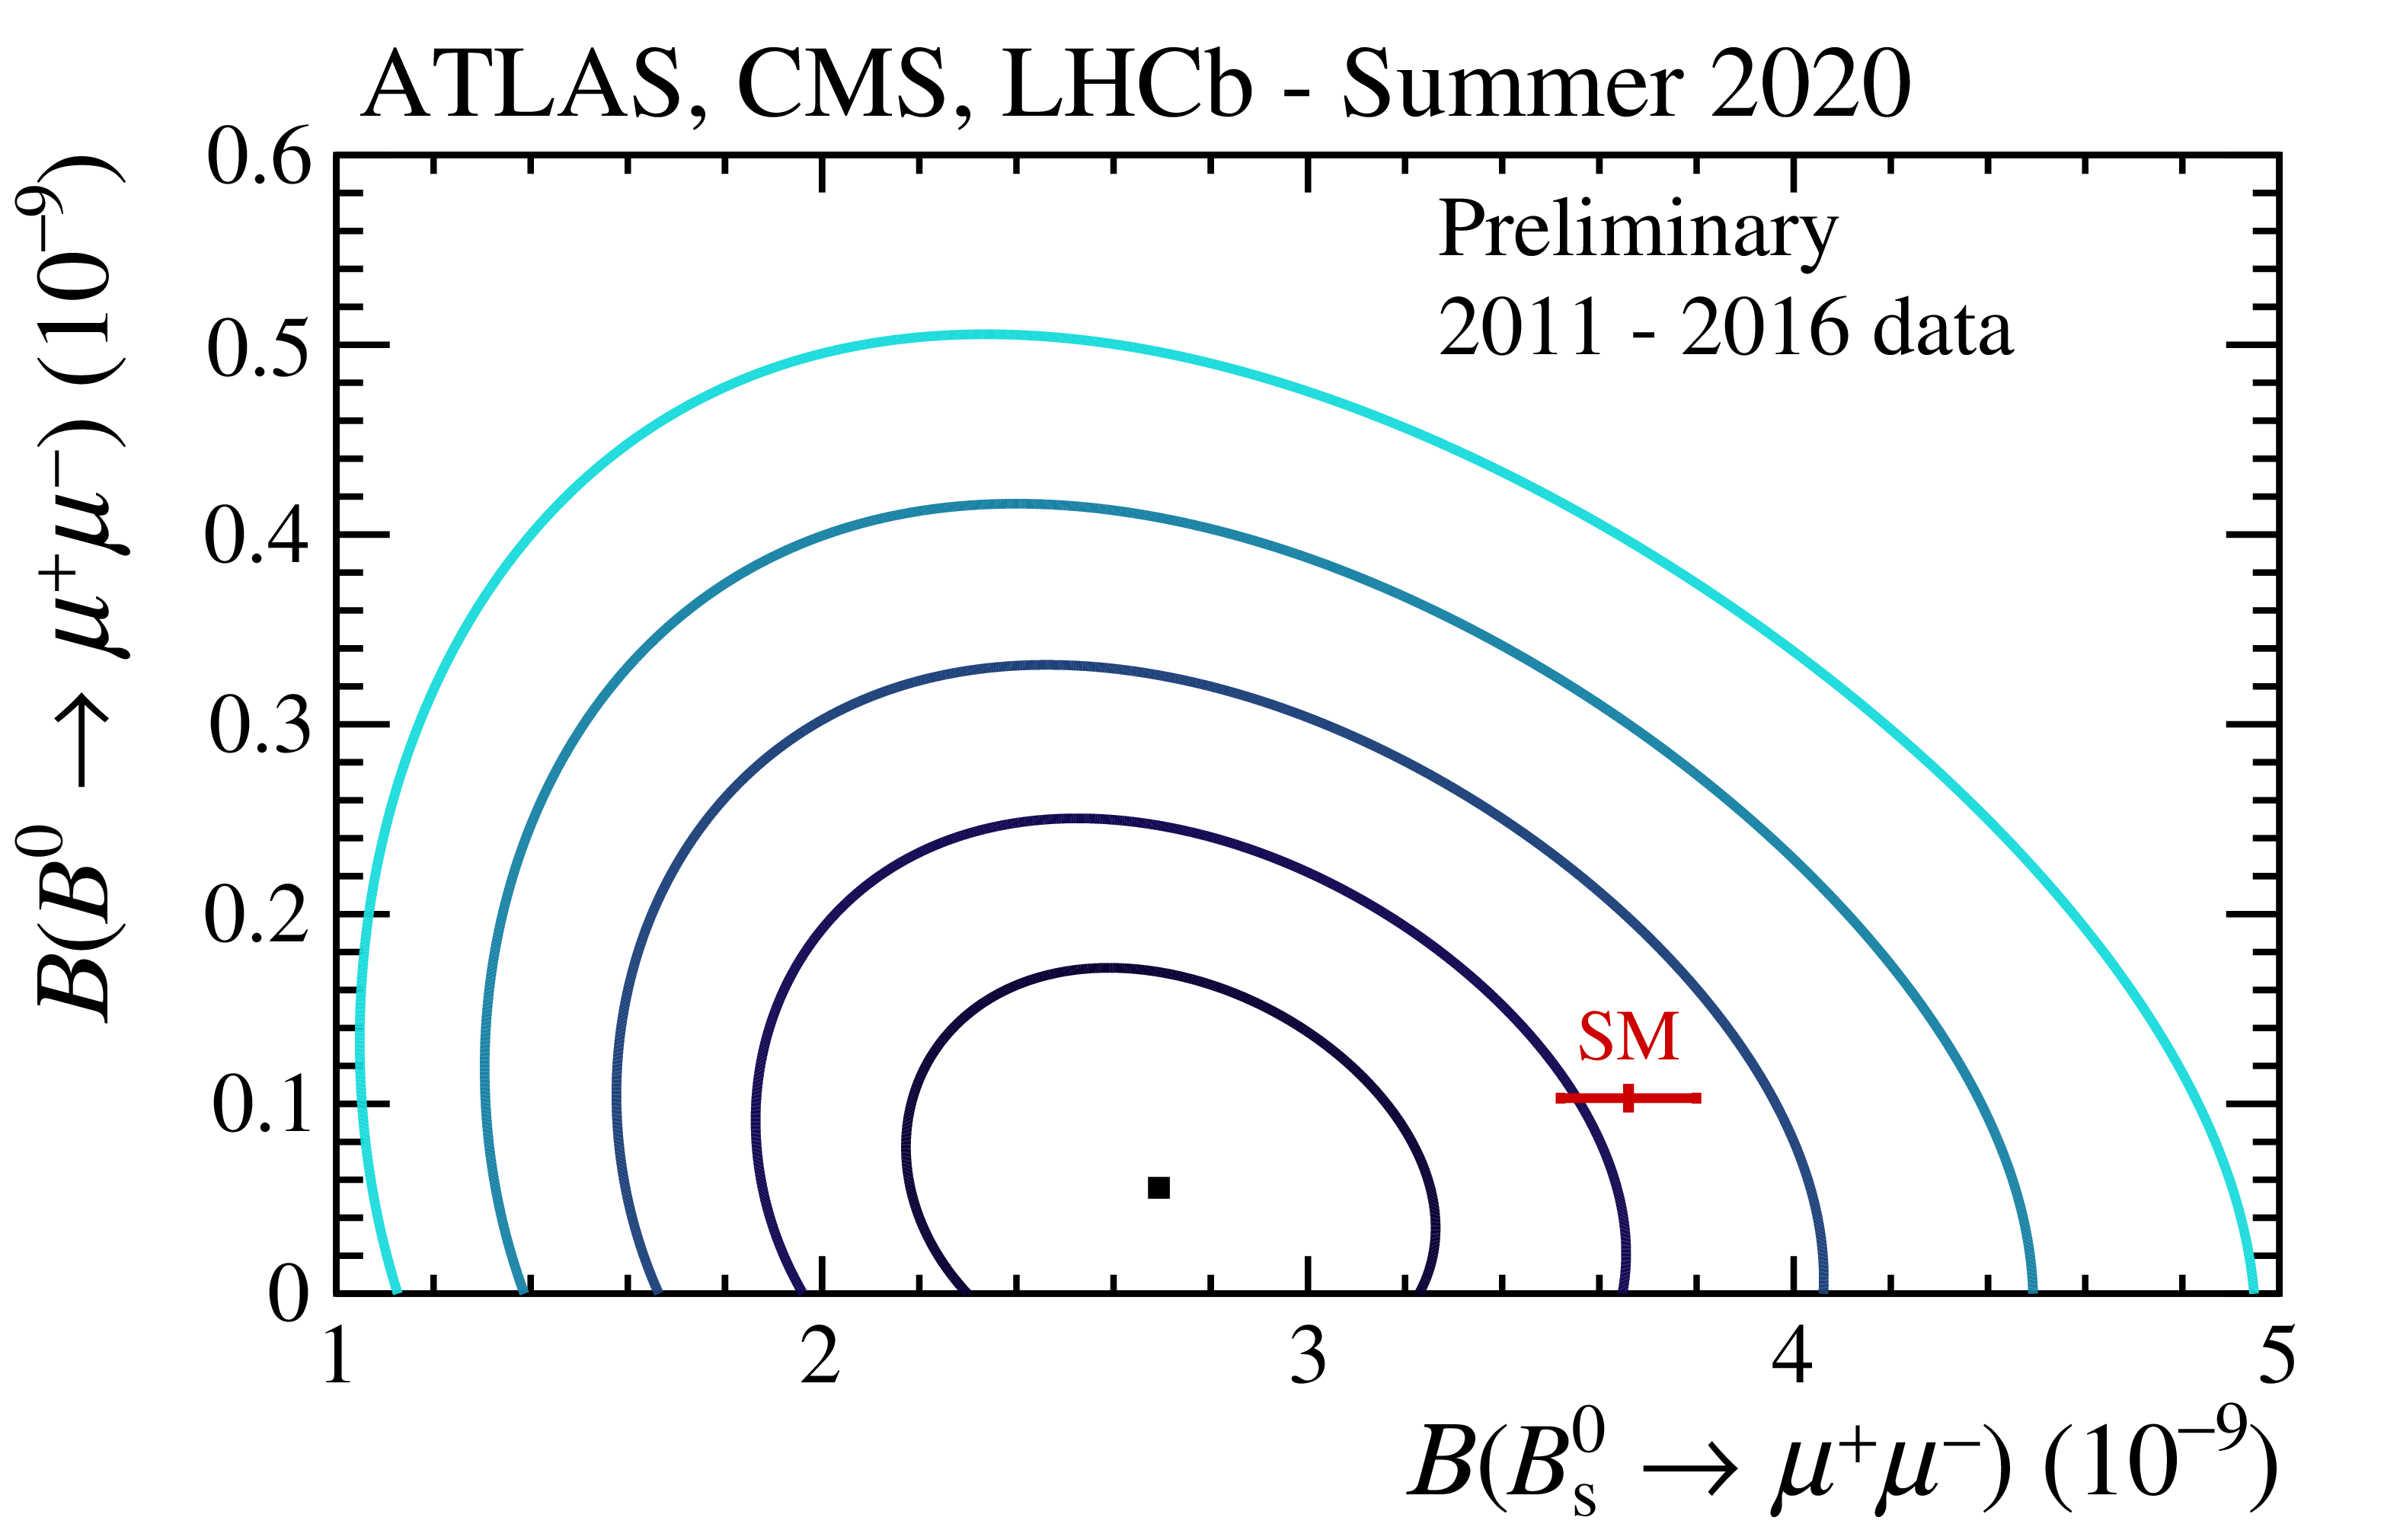
Figure 1-b:
The combination of the three experiments is shown with contours of different shades. Likelihood contours correspond to the values of $-2\Delta \ln \mathcal {L} = $ 2.3, 6.2, 11.8, 19.3, and 30.2, represented in order by darkest to less dark colour. The red point shows the SM predictions with their uncertainties. The published results from the three experiments are detailed in Ref. [1,2,3]. |
png pdf |
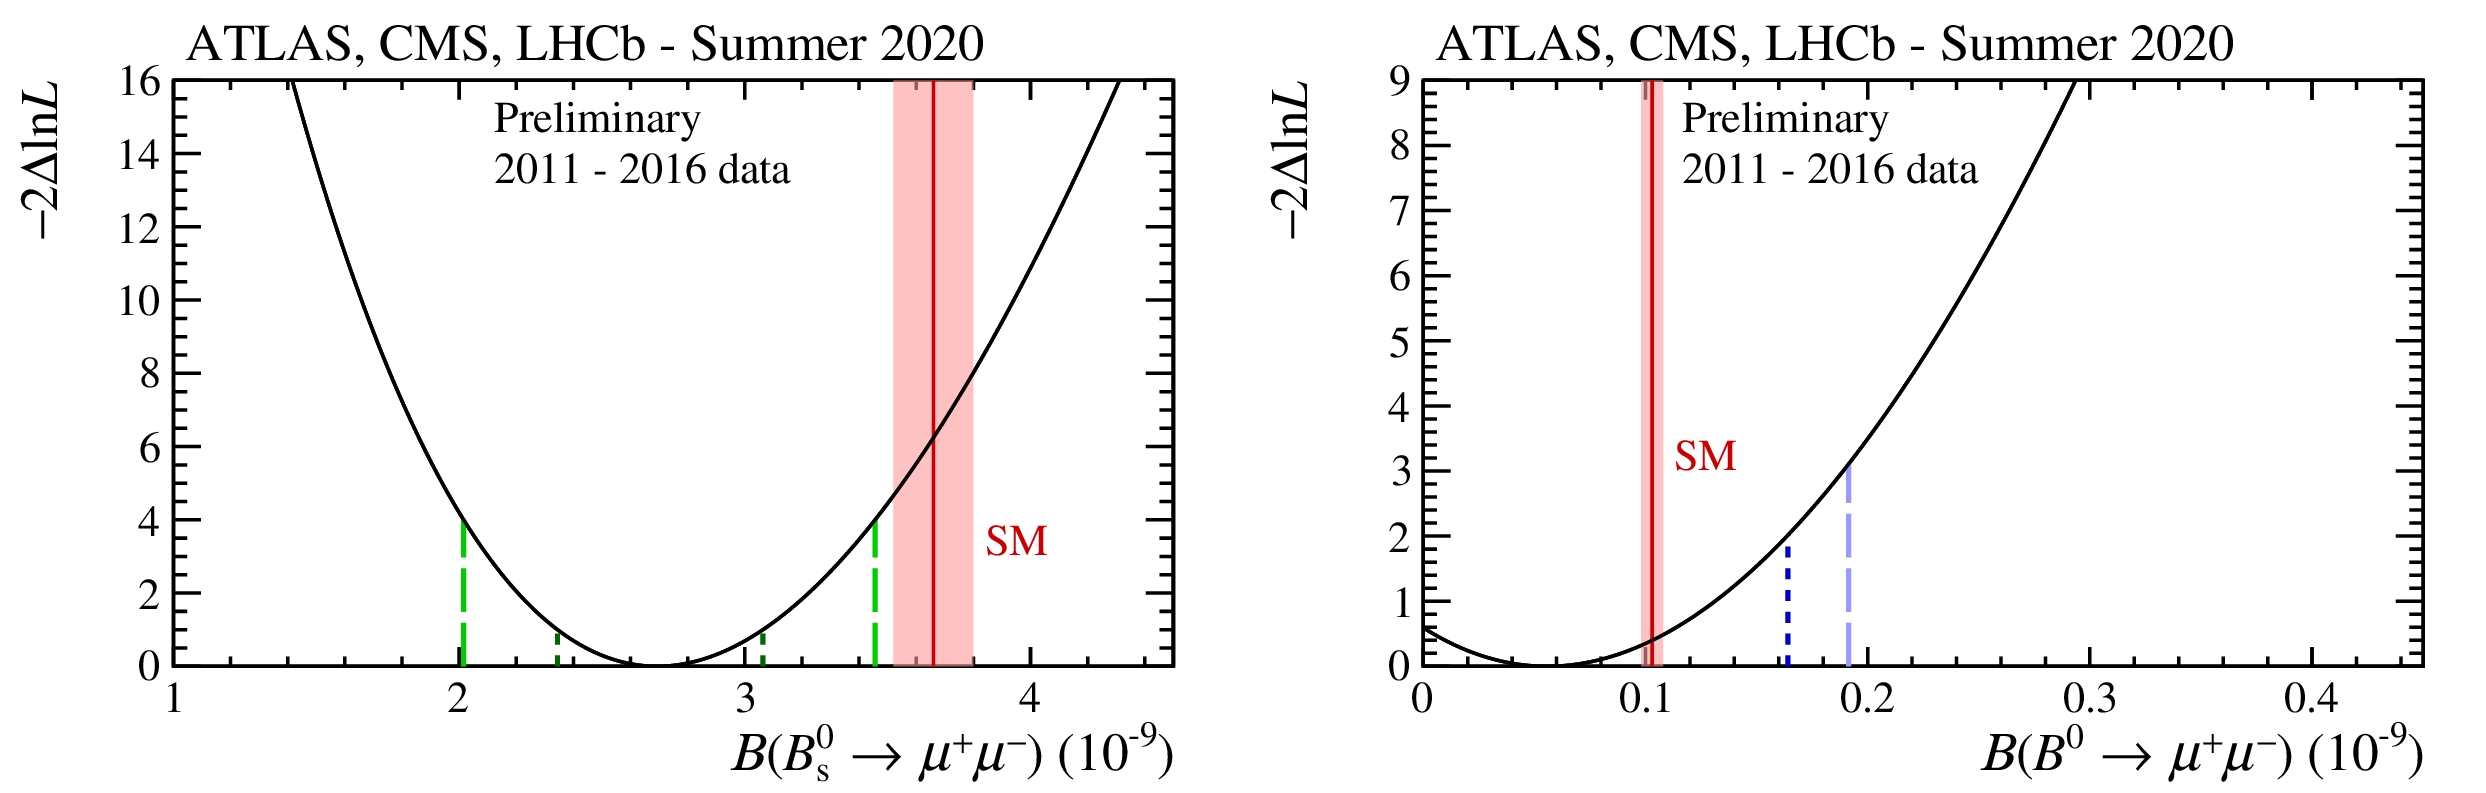
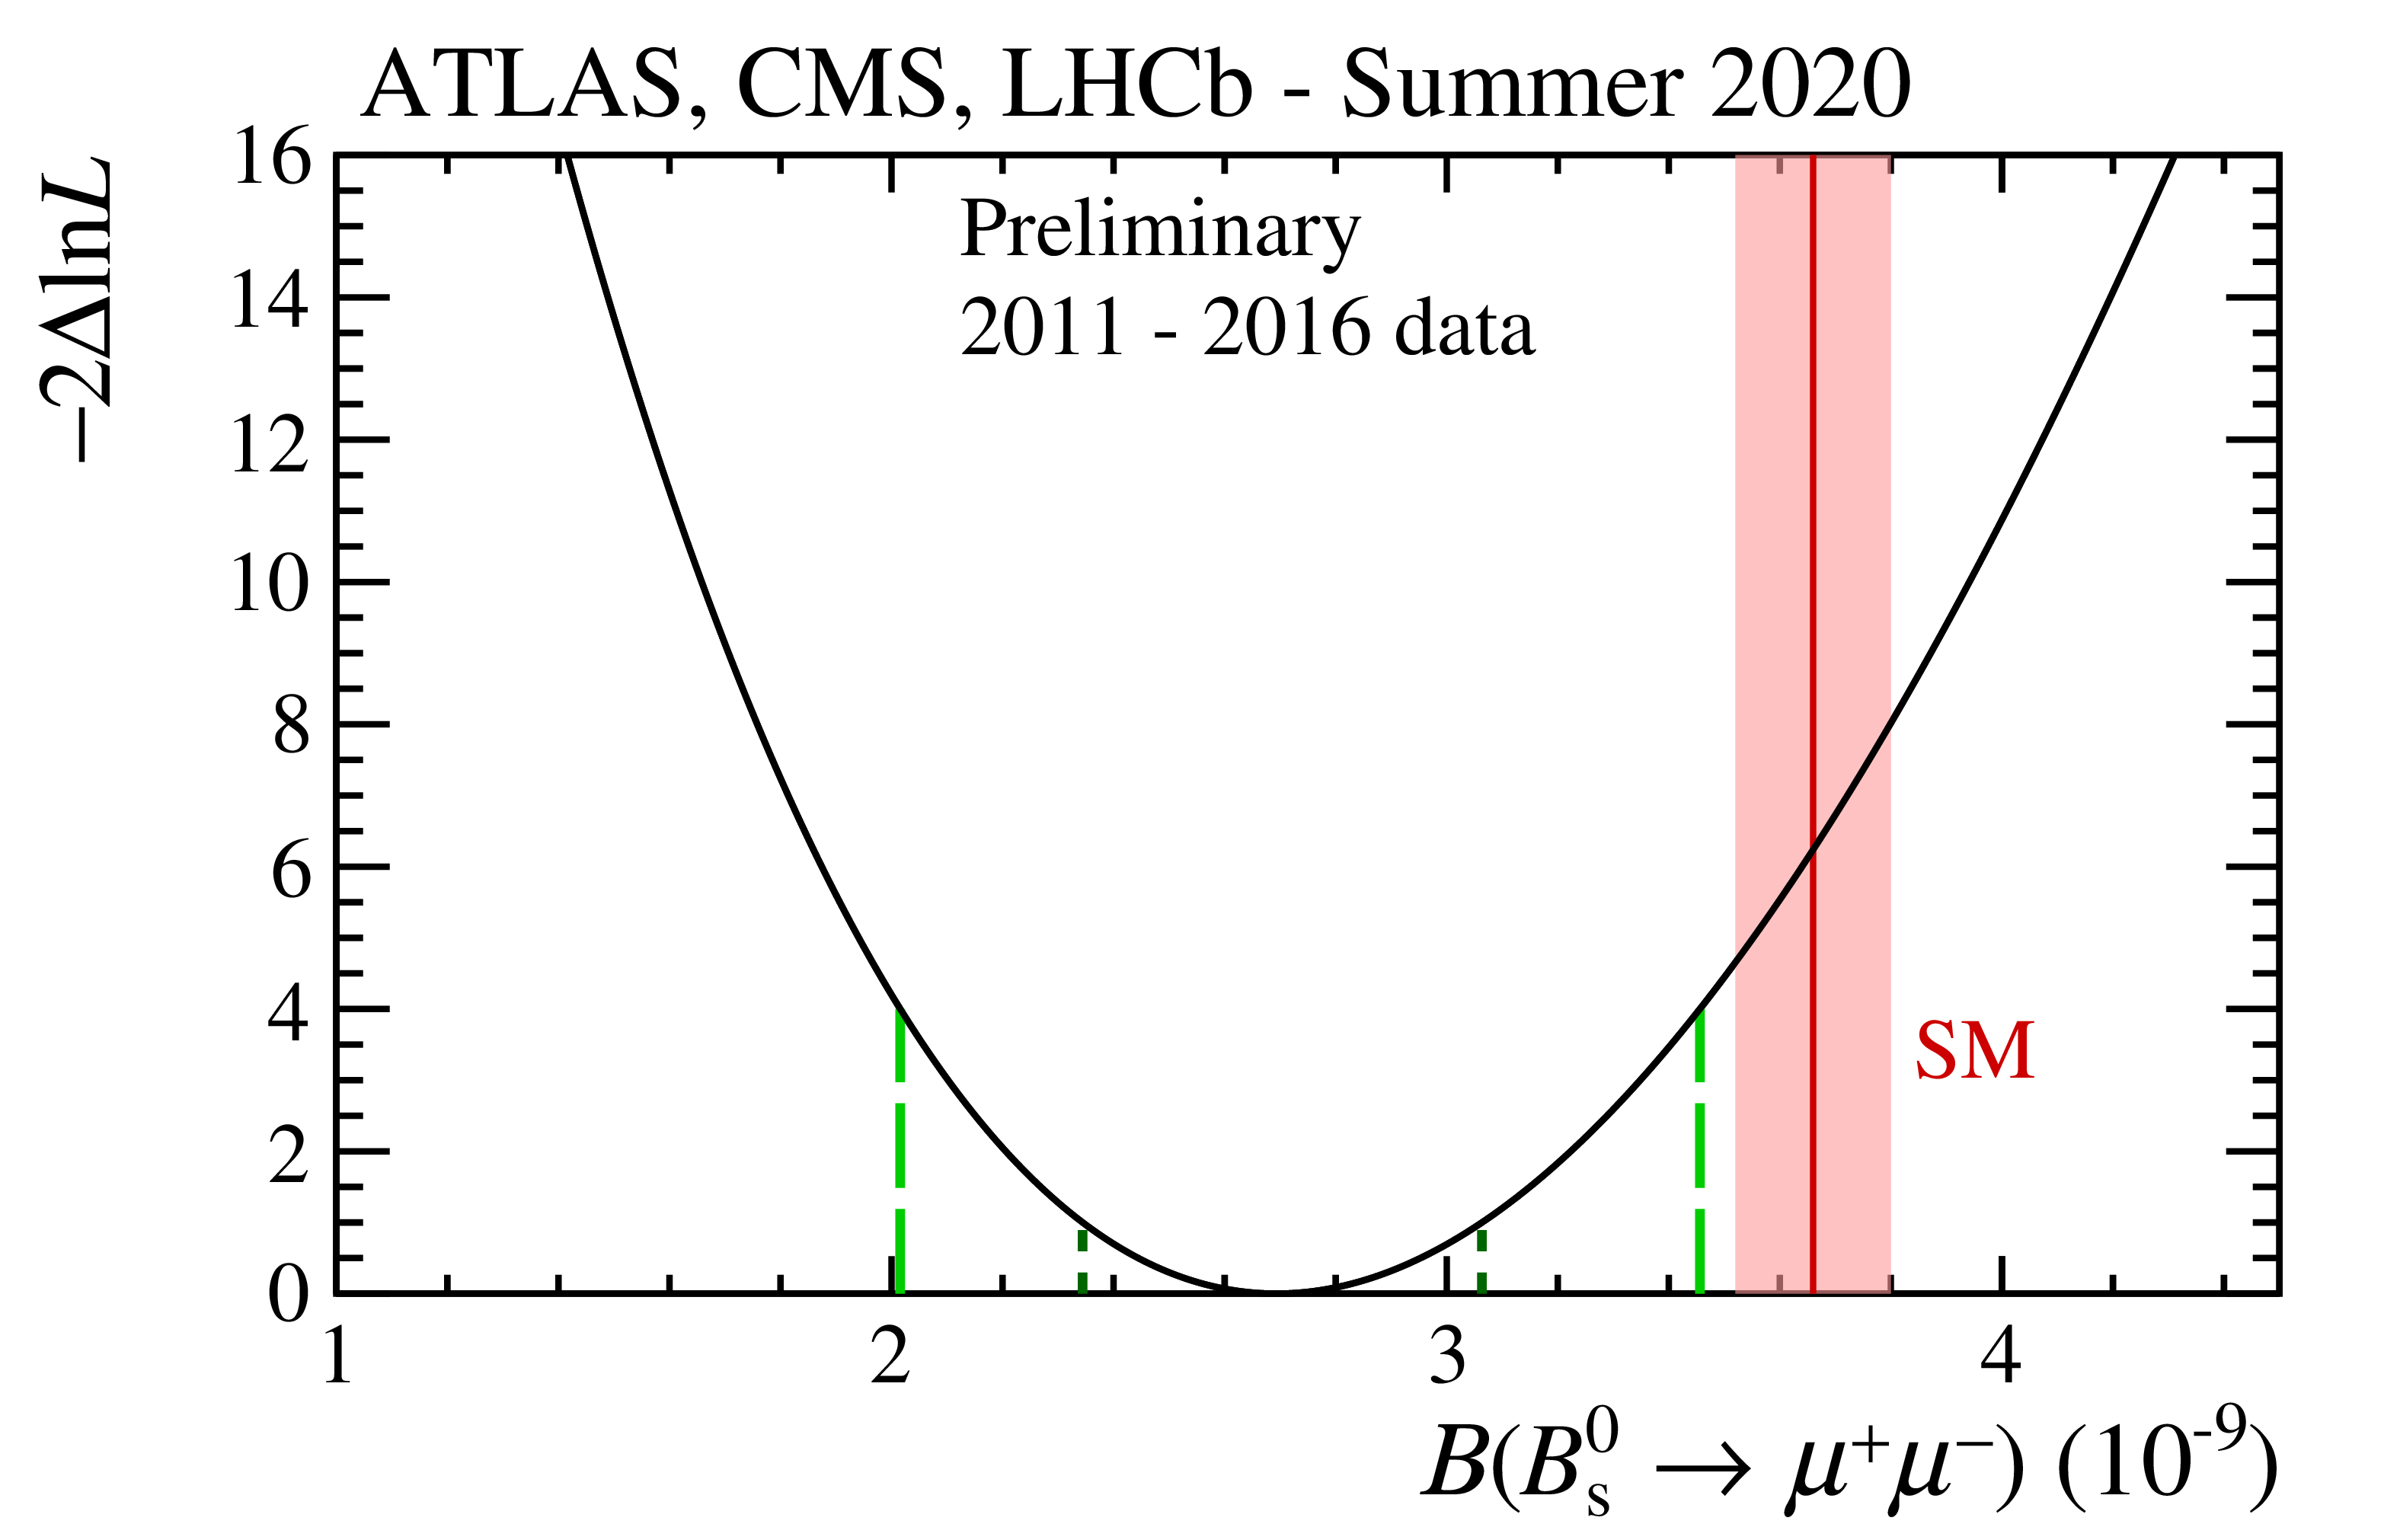
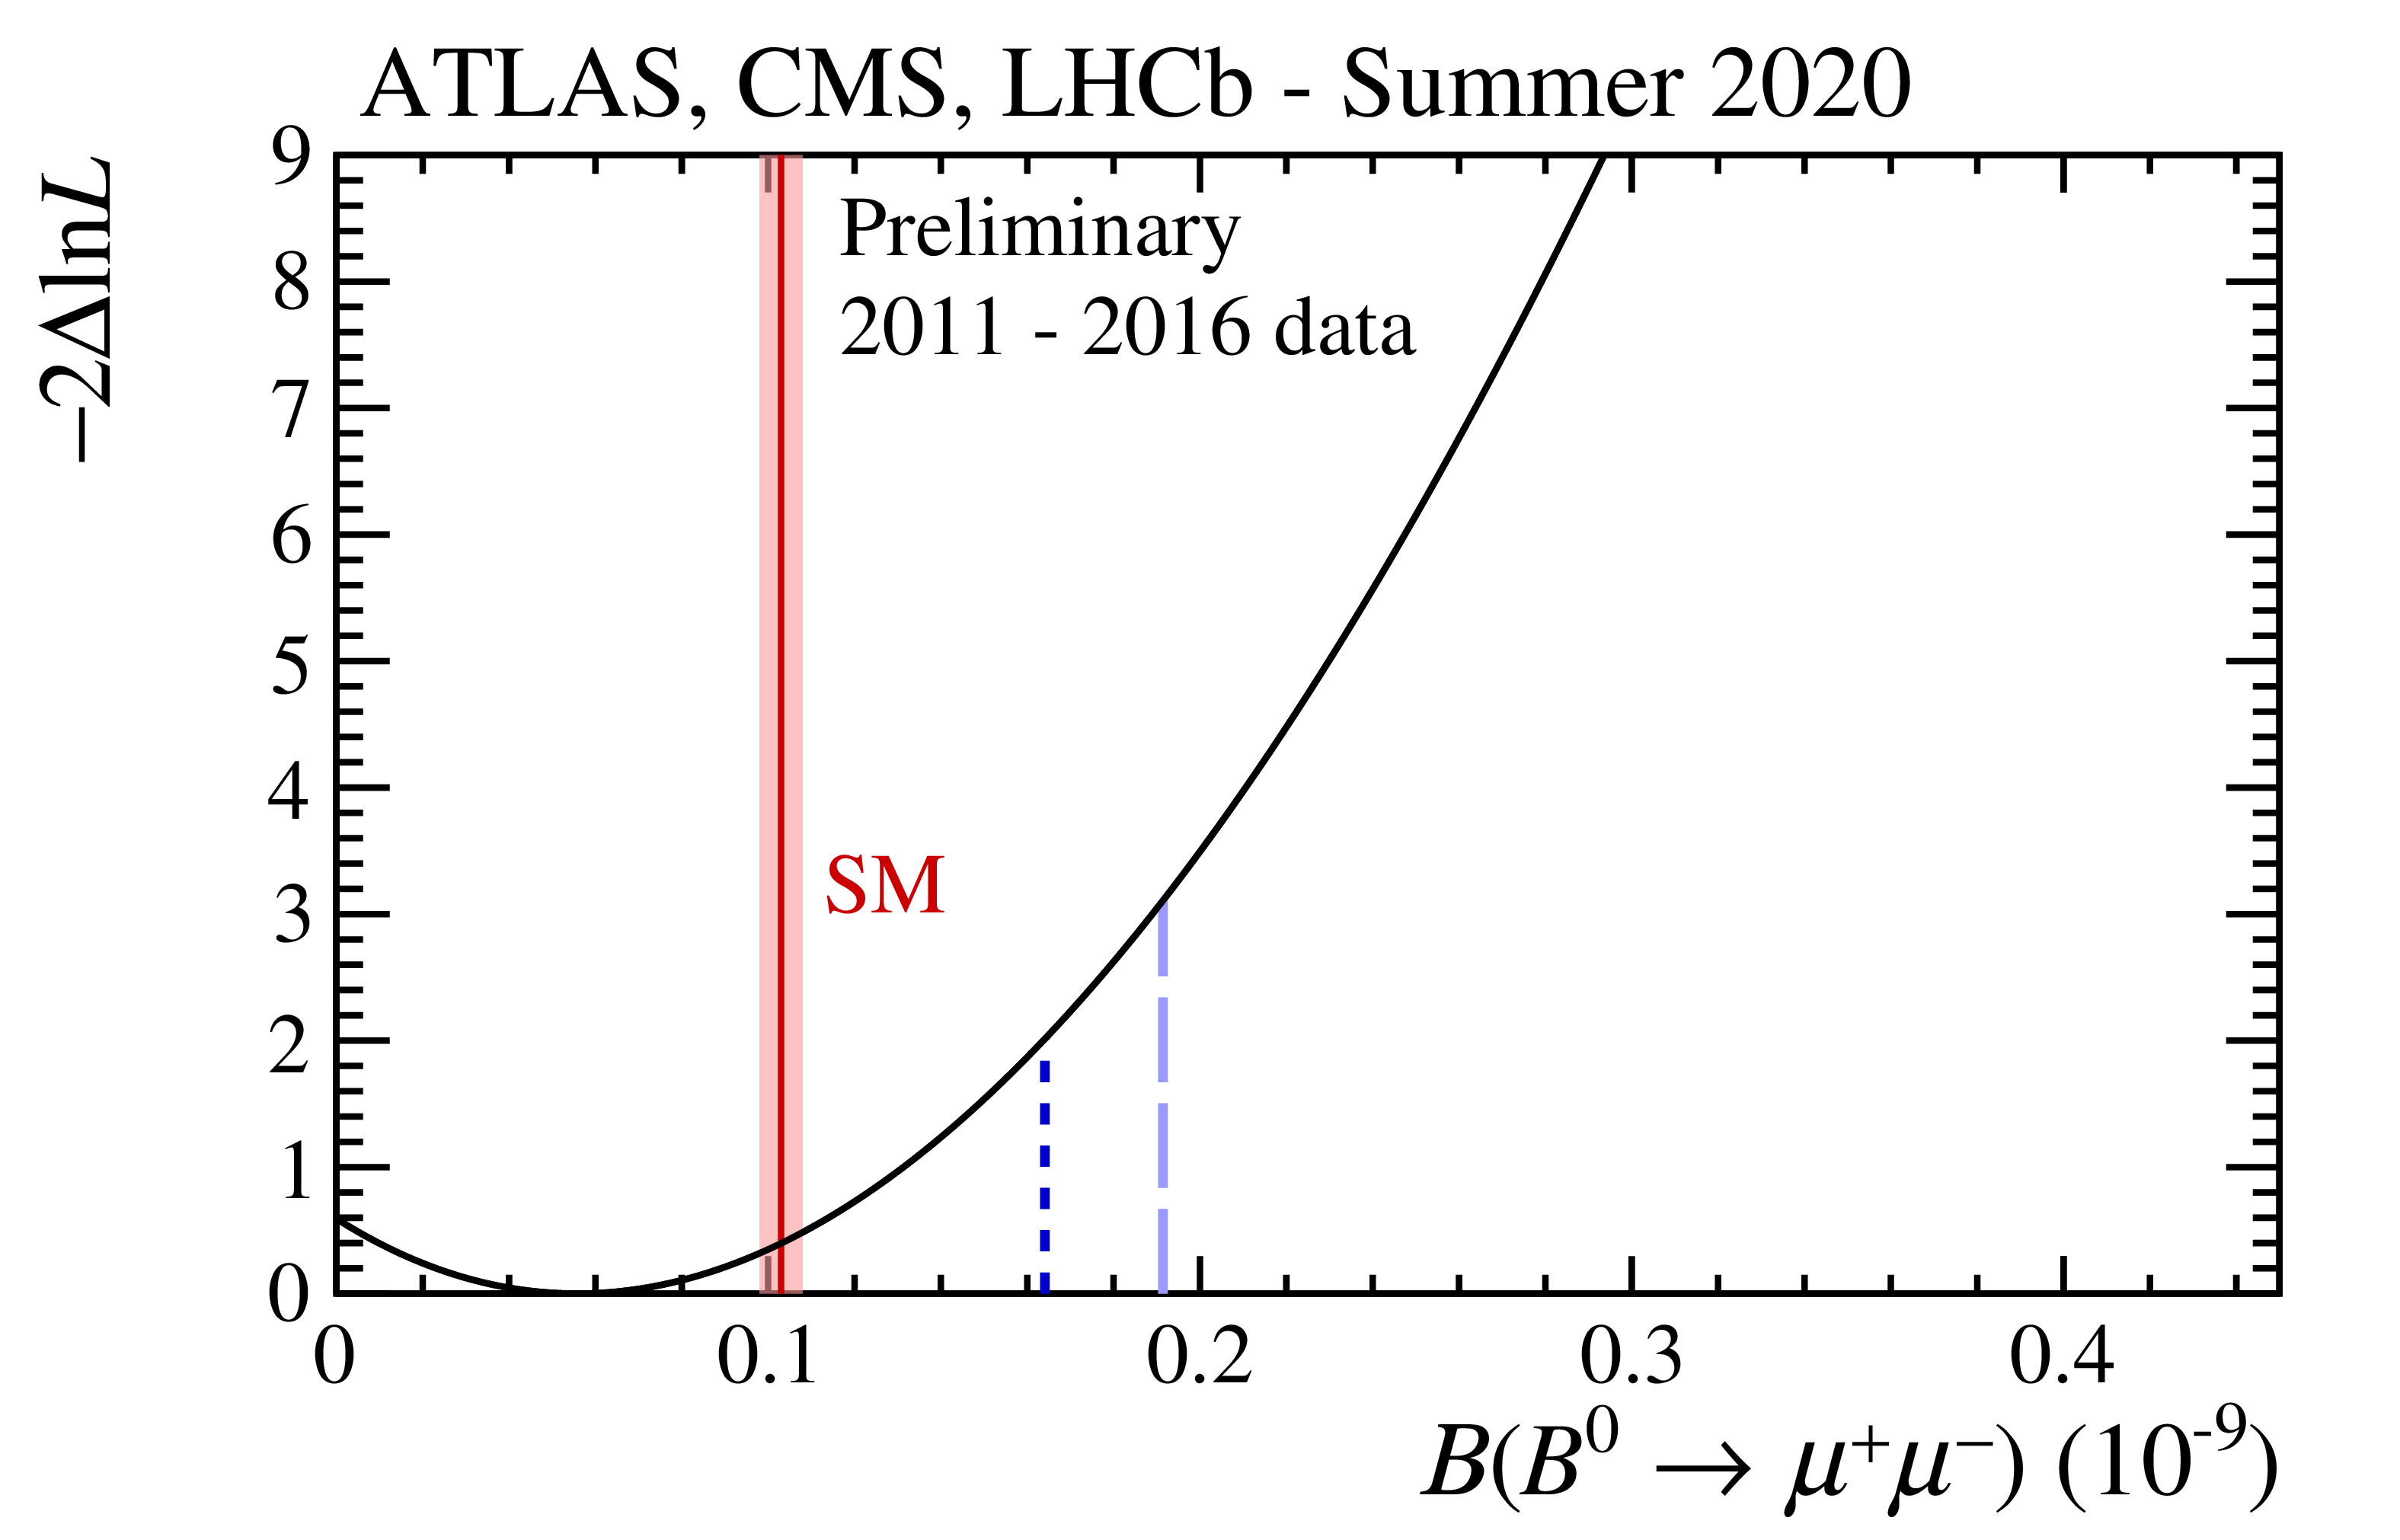
Figure 2:
Value of $-2 \Delta \ln \mathcal {L}$ for ${{\cal B}({\mathrm{B ^0_ {s}} {\rightarrow} \mu ^+\mu ^-})}$ (left) and ${{\cal B}({\mathrm{B ^0} {\rightarrow} \mu ^+\mu ^-})}$ (right), shown in both as solid black line. In the left-hand plot, the dark (light) green dashed lines represent the 1$\sigma $ (2$\sigma $) interval. In the right-hand plot, the dark (light) blue dashed lines represent the 90% (95%) CL. In both plots, the red solid band shows the SM prediction with its uncertainty. The published results from the three experiments are detailed in Ref. [1,2,3]. |
png pdf |
Figure 2-a:
Value of $-2 \Delta \ln \mathcal {L}$ for ${{\cal B}({\mathrm{B ^0_ {s}} {\rightarrow} \mu ^+\mu ^-})}$, shown as solid black line. The dark (light) blue dashed lines represent the 90% (95%) CL. The red solid band shows the SM prediction with its uncertainty. The published results from the three experiments are detailed in Ref. [1,2,3]. |
png pdf |
Figure 2-b:
Value of $-2 \Delta \ln \mathcal {L}$ for ${{\cal B}({\mathrm{B ^0} {\rightarrow} \mu ^+\mu ^-})}$, shown as solid black line. The dark (light) blue dashed lines represent the 90% (95%) CL. The red solid band shows the SM prediction with its uncertainty. The published results from the three experiments are detailed in Ref. [1,2,3]. |
png pdf |
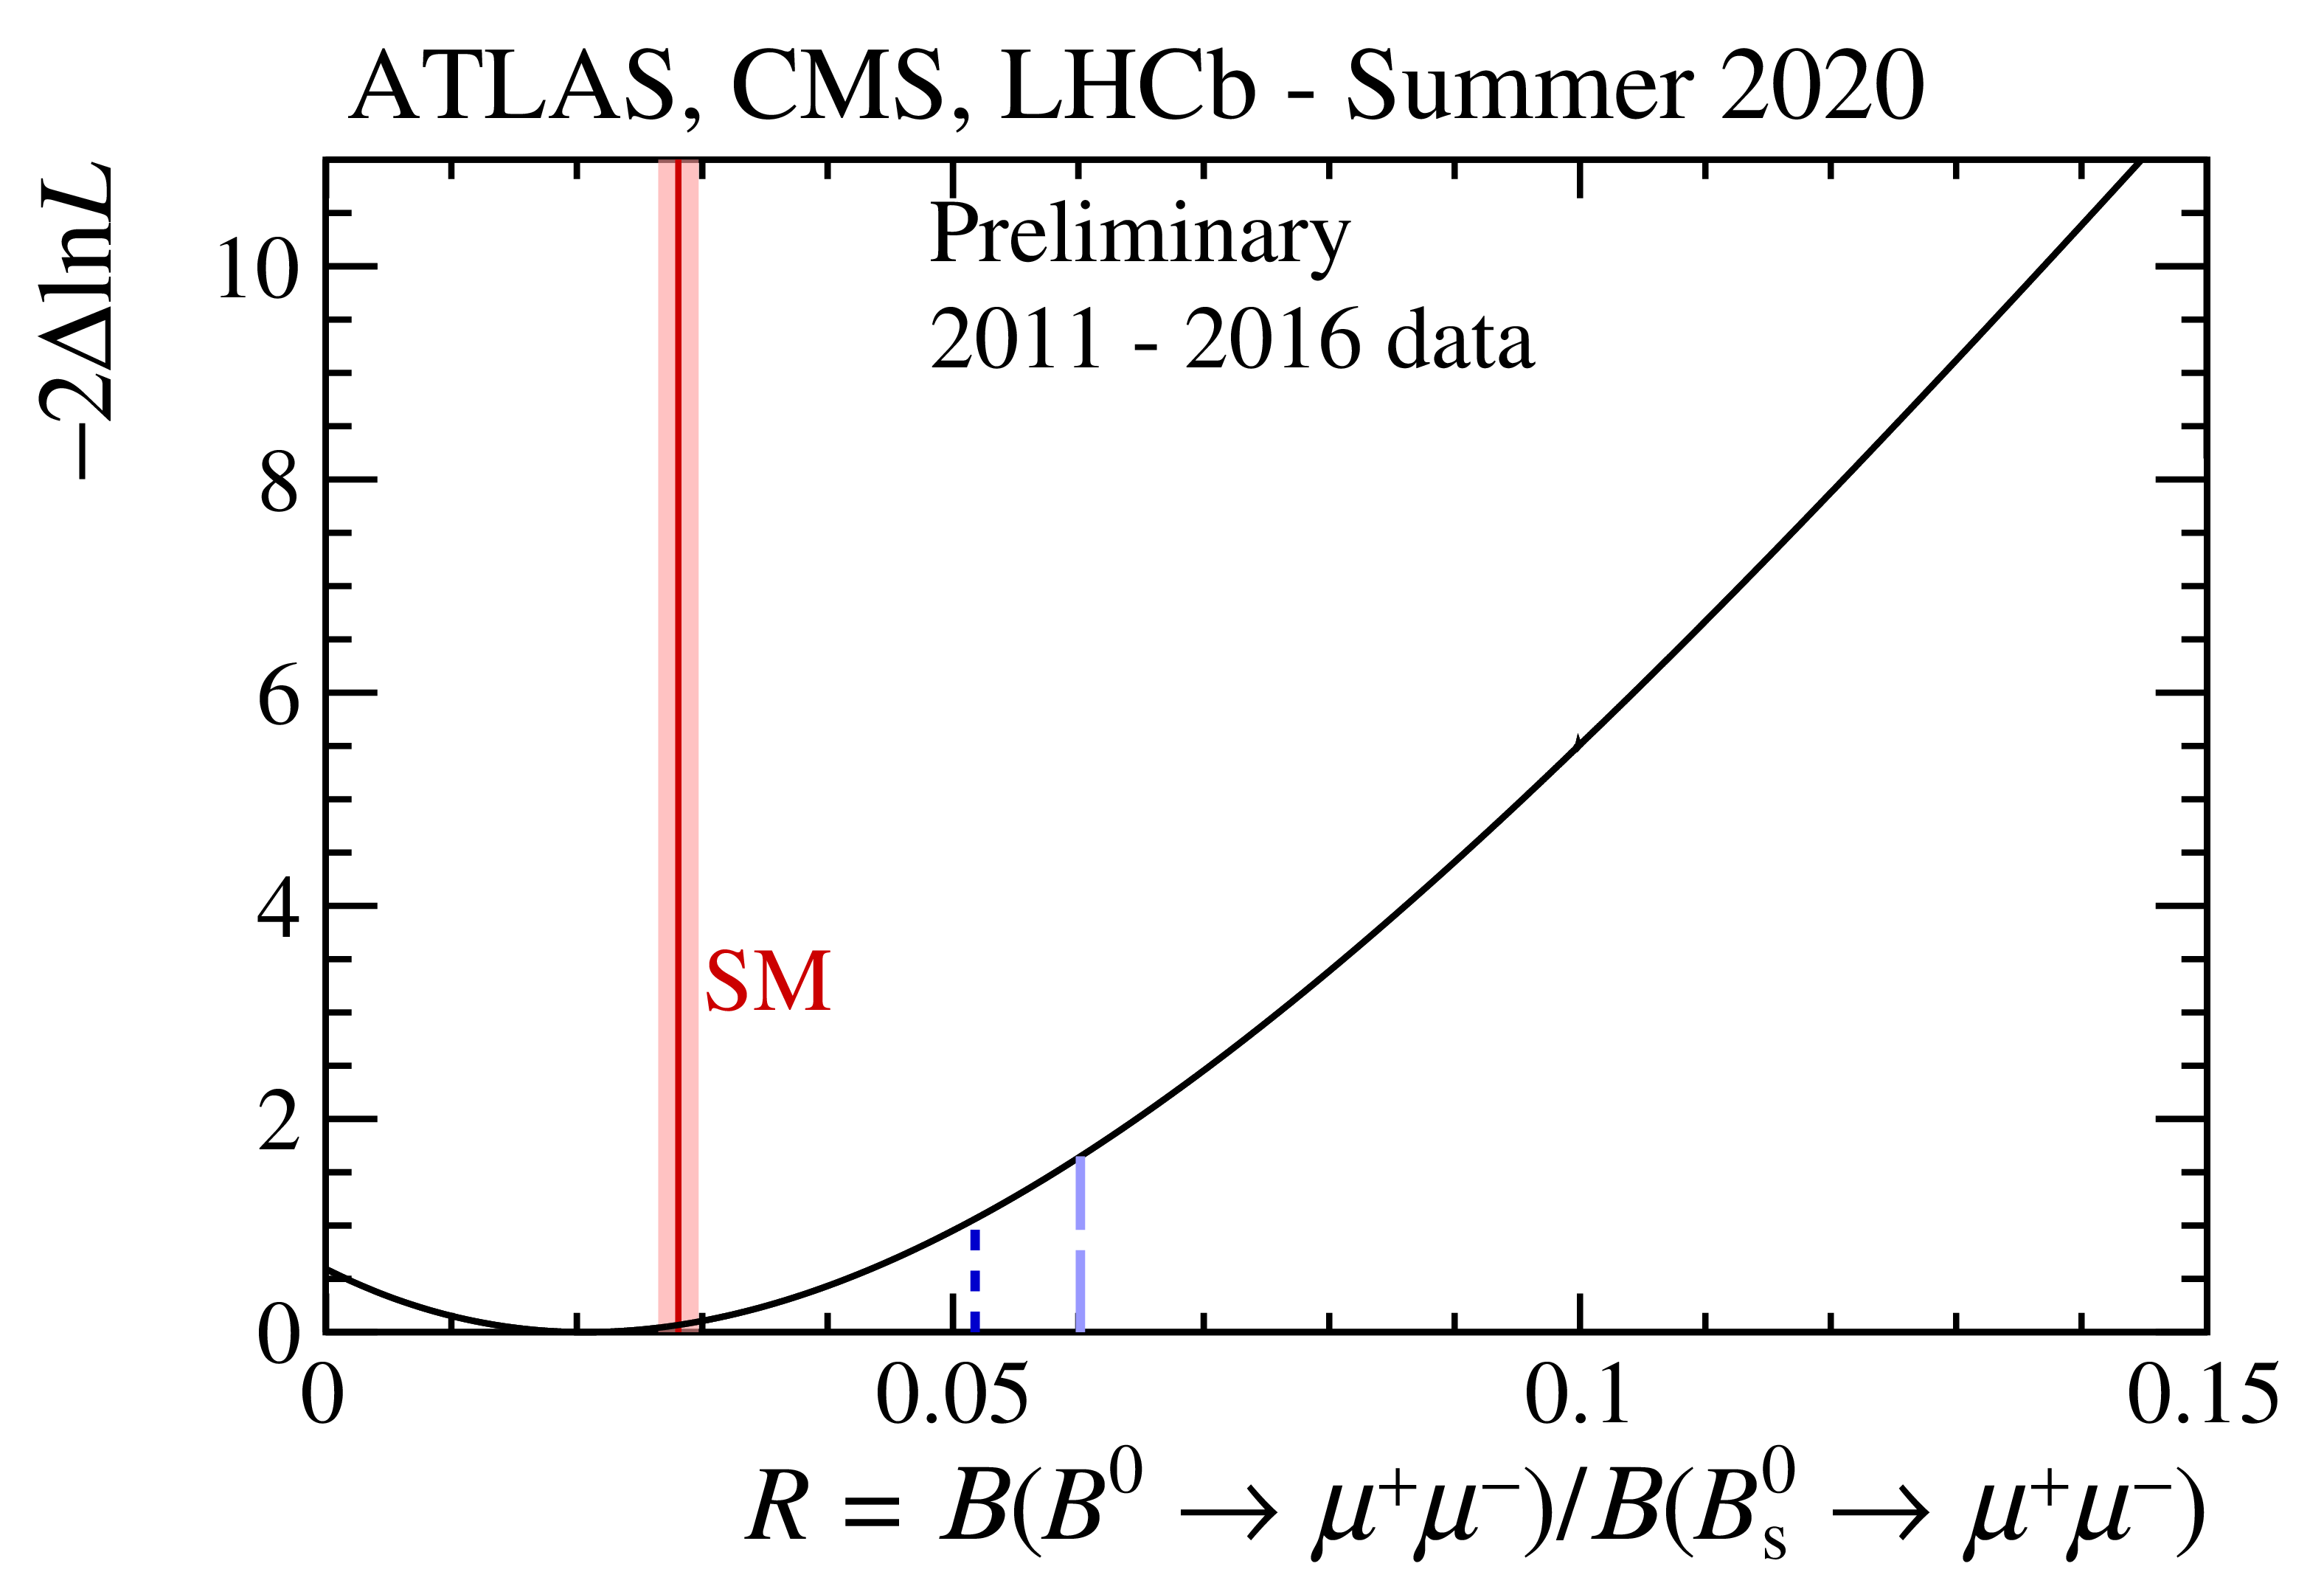
Figure 3:
Value of $-2 \Delta \ln \mathcal {L}$ for the ratio of the ${\mathrm{B ^0} {\rightarrow} \mu ^+\mu ^-}$ and ${\mathrm{B ^0_ {s}} {\rightarrow} \mu ^+\mu ^-}$ branching fractions, $\mathcal {R}$, shown as solid black line. The light (dark) blue dashed line represents the 90% (95%) CL and the red solid band shows the SM prediction with its uncertainty. The published results from the three experiments are detailed in Ref. [1,2,3]. |
png pdf |
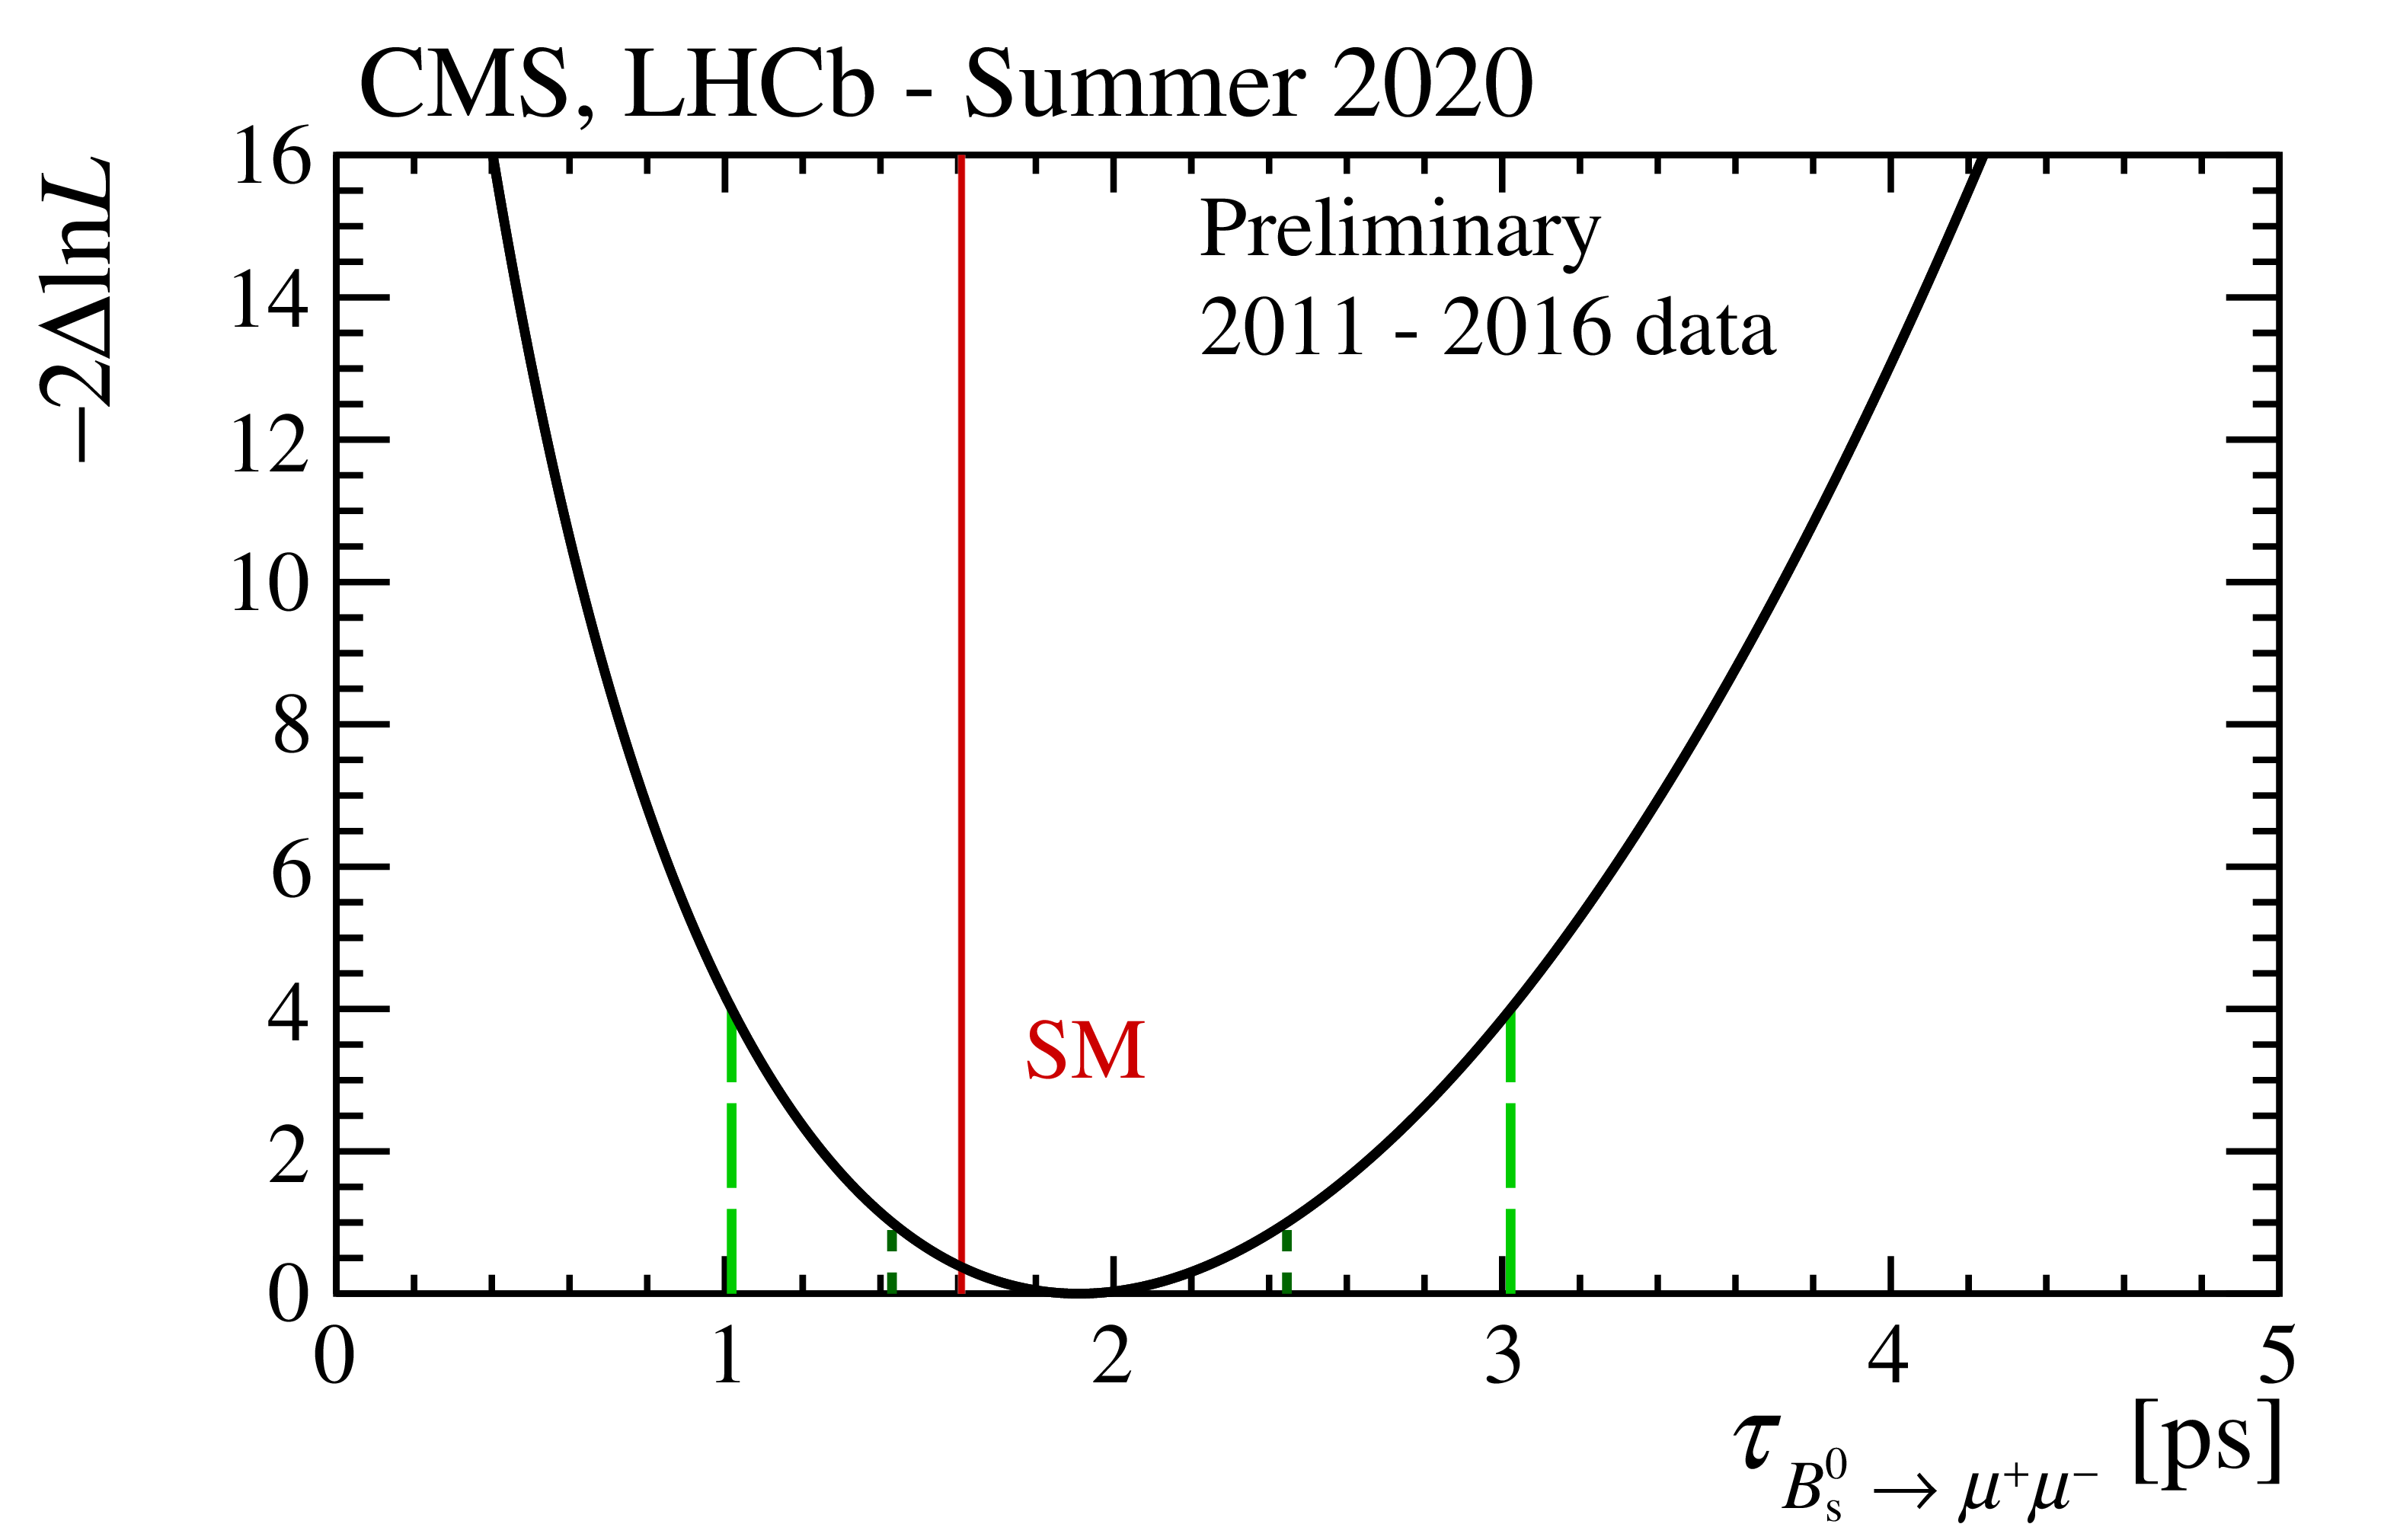
Figure 4:
Value of $-2 \Delta \ln \mathcal {L}$ for the combination of CMS and LHCb measurements [2,3] of the ${\mathrm{B ^0_ {s}} {\rightarrow} \mu ^+\mu ^-}$ effective lifetime, shown as solid black line. The dark and light green dashed lines represent the intervals corresponding to $-2 \Delta \ln \mathcal {L} = $1 and 4, respectively, and the red solid band shows the SM prediction with its uncertainty. |
| Summary |
| In summary, the results of the ATLAS, CMS, and LHCb experiments on the $\mathrm{B^0_{s,d}} \to \mu^+\mu^-$ decays obtained from the data collected between 2011 and 2016 have been combined. |
| References | ||||
| 1 | ATLAS Collaboration | Study of the rare decays of $ B^0_s $ and $ B^0 $ mesons into muon pairs using data collected during 2015 and 2016 with the ATLAS detector | JHEP 04 (2019) 098 | 1812.03017 |
| 2 | CMS Collaboration | Measurement of properties of $\mathrm{B ^0_\mathrm{s}}\to\mu^+\mu^- $ decays and search for $\mathrm{B ^0}\to\mu^+\mu^- $ with the CMS experiment | JHEP 04 (2020) 188 | CMS-BPH-16-004 1910.12127 |
| 3 | LHCb Collaboration | Measurement of the $ \mathrm{B ^0_\mathrm{s}}\to \mu^{+}\mu^{-} $ branching fraction and effective lifetime and search for $ \mathrm{B ^0}\to \mu^{+}\mu^{-} $ decays | PRL 118 (2017) 191801 LHCb-PAPER-2017-001, CERN-EP-2017-041 | 1703.05747 |
| 4 | C. Bobeth et al. | $ \mathrm{B_{s,d}} \to \ell^+ \ell^- $ in the Standard Model with reduced theoretical uncertainty | Phys.Rev.Lett. 112 (2014) 101801 | 1311.0903 |
| 5 | C. Bobeth, M. Gorbahn, and E. Stamou | Electroweak Corrections to $ \mathrm{B_{s,d}} \to \ell^+ \ell^- $ | PRD 89 (2014) 034023 | 1311.1348 |
| 6 | T. Hermann, M. Misiak, and M. Steinhauser | Three-loop QCD corrections to $ \mathrm{B_s} \to \mu^+ \mu^- $ | JHEP 12 (2013) 097 | 1311.1347 |
| 7 | M. Beneke, C. Bobeth, and R. Szafron | Enhanced electromagnetic correction to the rare B-meson decay $ \mathrm{B_{s,d}} \to \mu^+ \mu^- $ | PRL 120 (2018) 011801 | 1708.09152 |
| 8 | M. Beneke, C. Bobeth, and R. Szafron | Power-enhanced leading-logarithmic QED corrections to $ \mathrm{B_q} \to \mu^+\mu^- $ | JHEP 10 (2019) 232 | 1908.07011 |
| 9 | Flavour Lattice Averaging Group Collaboration | FLAG Review 2019: Flavour Lattice Averaging Group (FLAG) | EPJC 80 (2020) 113 | 1902.08191 |
| 10 | Fermilab Lattice and MILC Collaboration | B- and D-meson leptonic decay constants from four-flavor lattice QCD | PRD 98 (2018) 074512 | 1712.09262 |
| 11 | ETM Collaboration | Mass of the b quark and B meson decay constants from $N _f = $ 2+1+1 twisted-mass lattice QCD | PRD 93 (2016) 114505 | 1603.04306 |
| 12 | HPQCD Collaboration | B-meson decay constants from improved lattice nonrelativistic QCD with physical u, d, s, and c quarks | PRL 110 (2013) 222003 | 1302.2644 |
| 13 | C. Hughes, C. T. H. Davies, and C. J. Monahan | New methods for B meson decay constants and form factors from lattice NRQCD | PRD 97 (2018) 054509 | 1711.09981 |
| 14 | K. De Bruyn et al. | Probing new physics via the $ B^0_s\to $\mu$mu $ effective lifetime | Phys.Rev.Lett. 109 (2012) 041801 | 1204.1737 |
| 15 | K. De Bruyn et al. | Branching Ratio Measurements of $ \mathrm{B ^0_\mathrm{s}} $ Decays | Phys.Rev.D 86 (2012) 014027 | 1204.1735 |
| 16 | A. J. Buras | Relations between $ \Delta M( \mathrm{s , d}) $ and $\mathrm{B_{s,d}} \to \mu \bar{\mu} $ in models with minimal flavor violation | PLB 566 (2003) 115--119 | hep-ph/0303060 |
| 17 | D. King, A. Lenz, and T. Rauh | $\mathrm{B_{s}}$ mixing observables and $ |V_{td}/V_{ts}| $ from sum rules | JHEP 05 (2019) 034 | 1904.00940 |
| 18 | G. D'Ambrosio, G. Giudice, G. Isidori, and A. Strumia | Minimal flavor violation: An effective field theory approach | NPB 645 (2002) 155--187 | hep-ph/0207036 |
| 19 | A. J. Buras | Minimal flavor violation | Acta Phys. Polon. B 34 (2003) 5615--5668 | hep-ph/0310208 |
| 20 | Heavy Flavour Averaging Group Collaboration | Averages of $ b $-hadron, $ c $-hadron, and $ \tau $-lepton properties as of summer 2016 | EPJC 77 (2017) 895 | 1612.07233 |
| 21 | LHCb Collaboration | Measurement of the fragmentation fraction ratio $ f_s/f_d $ and its dependence on $ B $ meson kinematics | JHEP 04 (2013) 001 | 1301.5286 |
| 22 | Particle Data Group Collaboration | Review of Particle Physics | PRD 98 (2018) 030001 | |
| 23 | J. Neyman | Outline of a Theory of Statistical Estimation Based on the Classical Theory of Probability | Phil. Trans. R. Soc. London A, 236 (1937) 333-380 | |
| 24 | J. Conrad, O. Botner, A. Hallgren, and C. Perez de los Heros | Including systematic uncertainties in confidence interval construction for Poisson statistics | PRD 67 (2003) 012002 | hep-ex/0202013 |
| 25 | G. Cowan, K. Cranmer, E. Gross, and O. Vitells | Asymptotic formulae for likelihood-based tests of new physics | EPJC 71 (2011) 1554 | 1007.1727 |
| 26 | A. L. Read | Presentation of search results: The CL(s) technique | J.Phys.G 28 (2002) 2693--2704 | |
| 27 | R. Barlow | Asymmetric statistical errors | in Statistical Problems in Particle Physics, Astrophysics and Cosmology | physics/0406120 |
| 28 | L. Lyons, D. Gibaut, and P. Clifford | How to Combine Correlated Estimates of a Single Physical Quantity | NIMA 270 (1988) 110 | |
| 29 | S. Wilks | The Large-Sample Distribution of the Likelihood Ratio for Testing Composite Hypotheses | Annals Math. Statist. 9 (1938) 60--62 | |
|
|
Compact Muon Solenoid LHC, CERN |
|

|

|

|

|

|