

Compact Muon Solenoid
LHC, CERN
| CMS-PAS-TOP-20-005 | ||
| Search for CP violation in top quark pair events in the lepton+jets channel at $\sqrt{s}= $ 13 TeV | ||
| CMS Collaboration | ||
| July 2021 | ||
| Abstract: The results of a search for CP violation in the production and decay of top quark-antiquark pairs using the semileptonic decay channel are presented. The search uses data from proton-proton collisions at $\sqrt{s}= $ 13 TeV, collected with the CMS detector, corresponding to an integrated luminosity of 137 fb$^{-1}$. Asymmetries that probe CP violating interactions are measured in observables constructed from linearly independent four-momentum vectors associated with the final-state particles. The CP violating effect is evaluated using the measured asymmetries in each observable. The measured effective asymmetries achieved a precision of 10$^{-3}$ and exhibit no evidence for CP violating effects, consistent with the expectation from the standard model. | ||
|
Links:
CDS record (PDF) ;
CADI line (restricted) ;
These preliminary results are superseded in this paper, Submitted to JHEP. |
||
| Figures | |
png pdf |
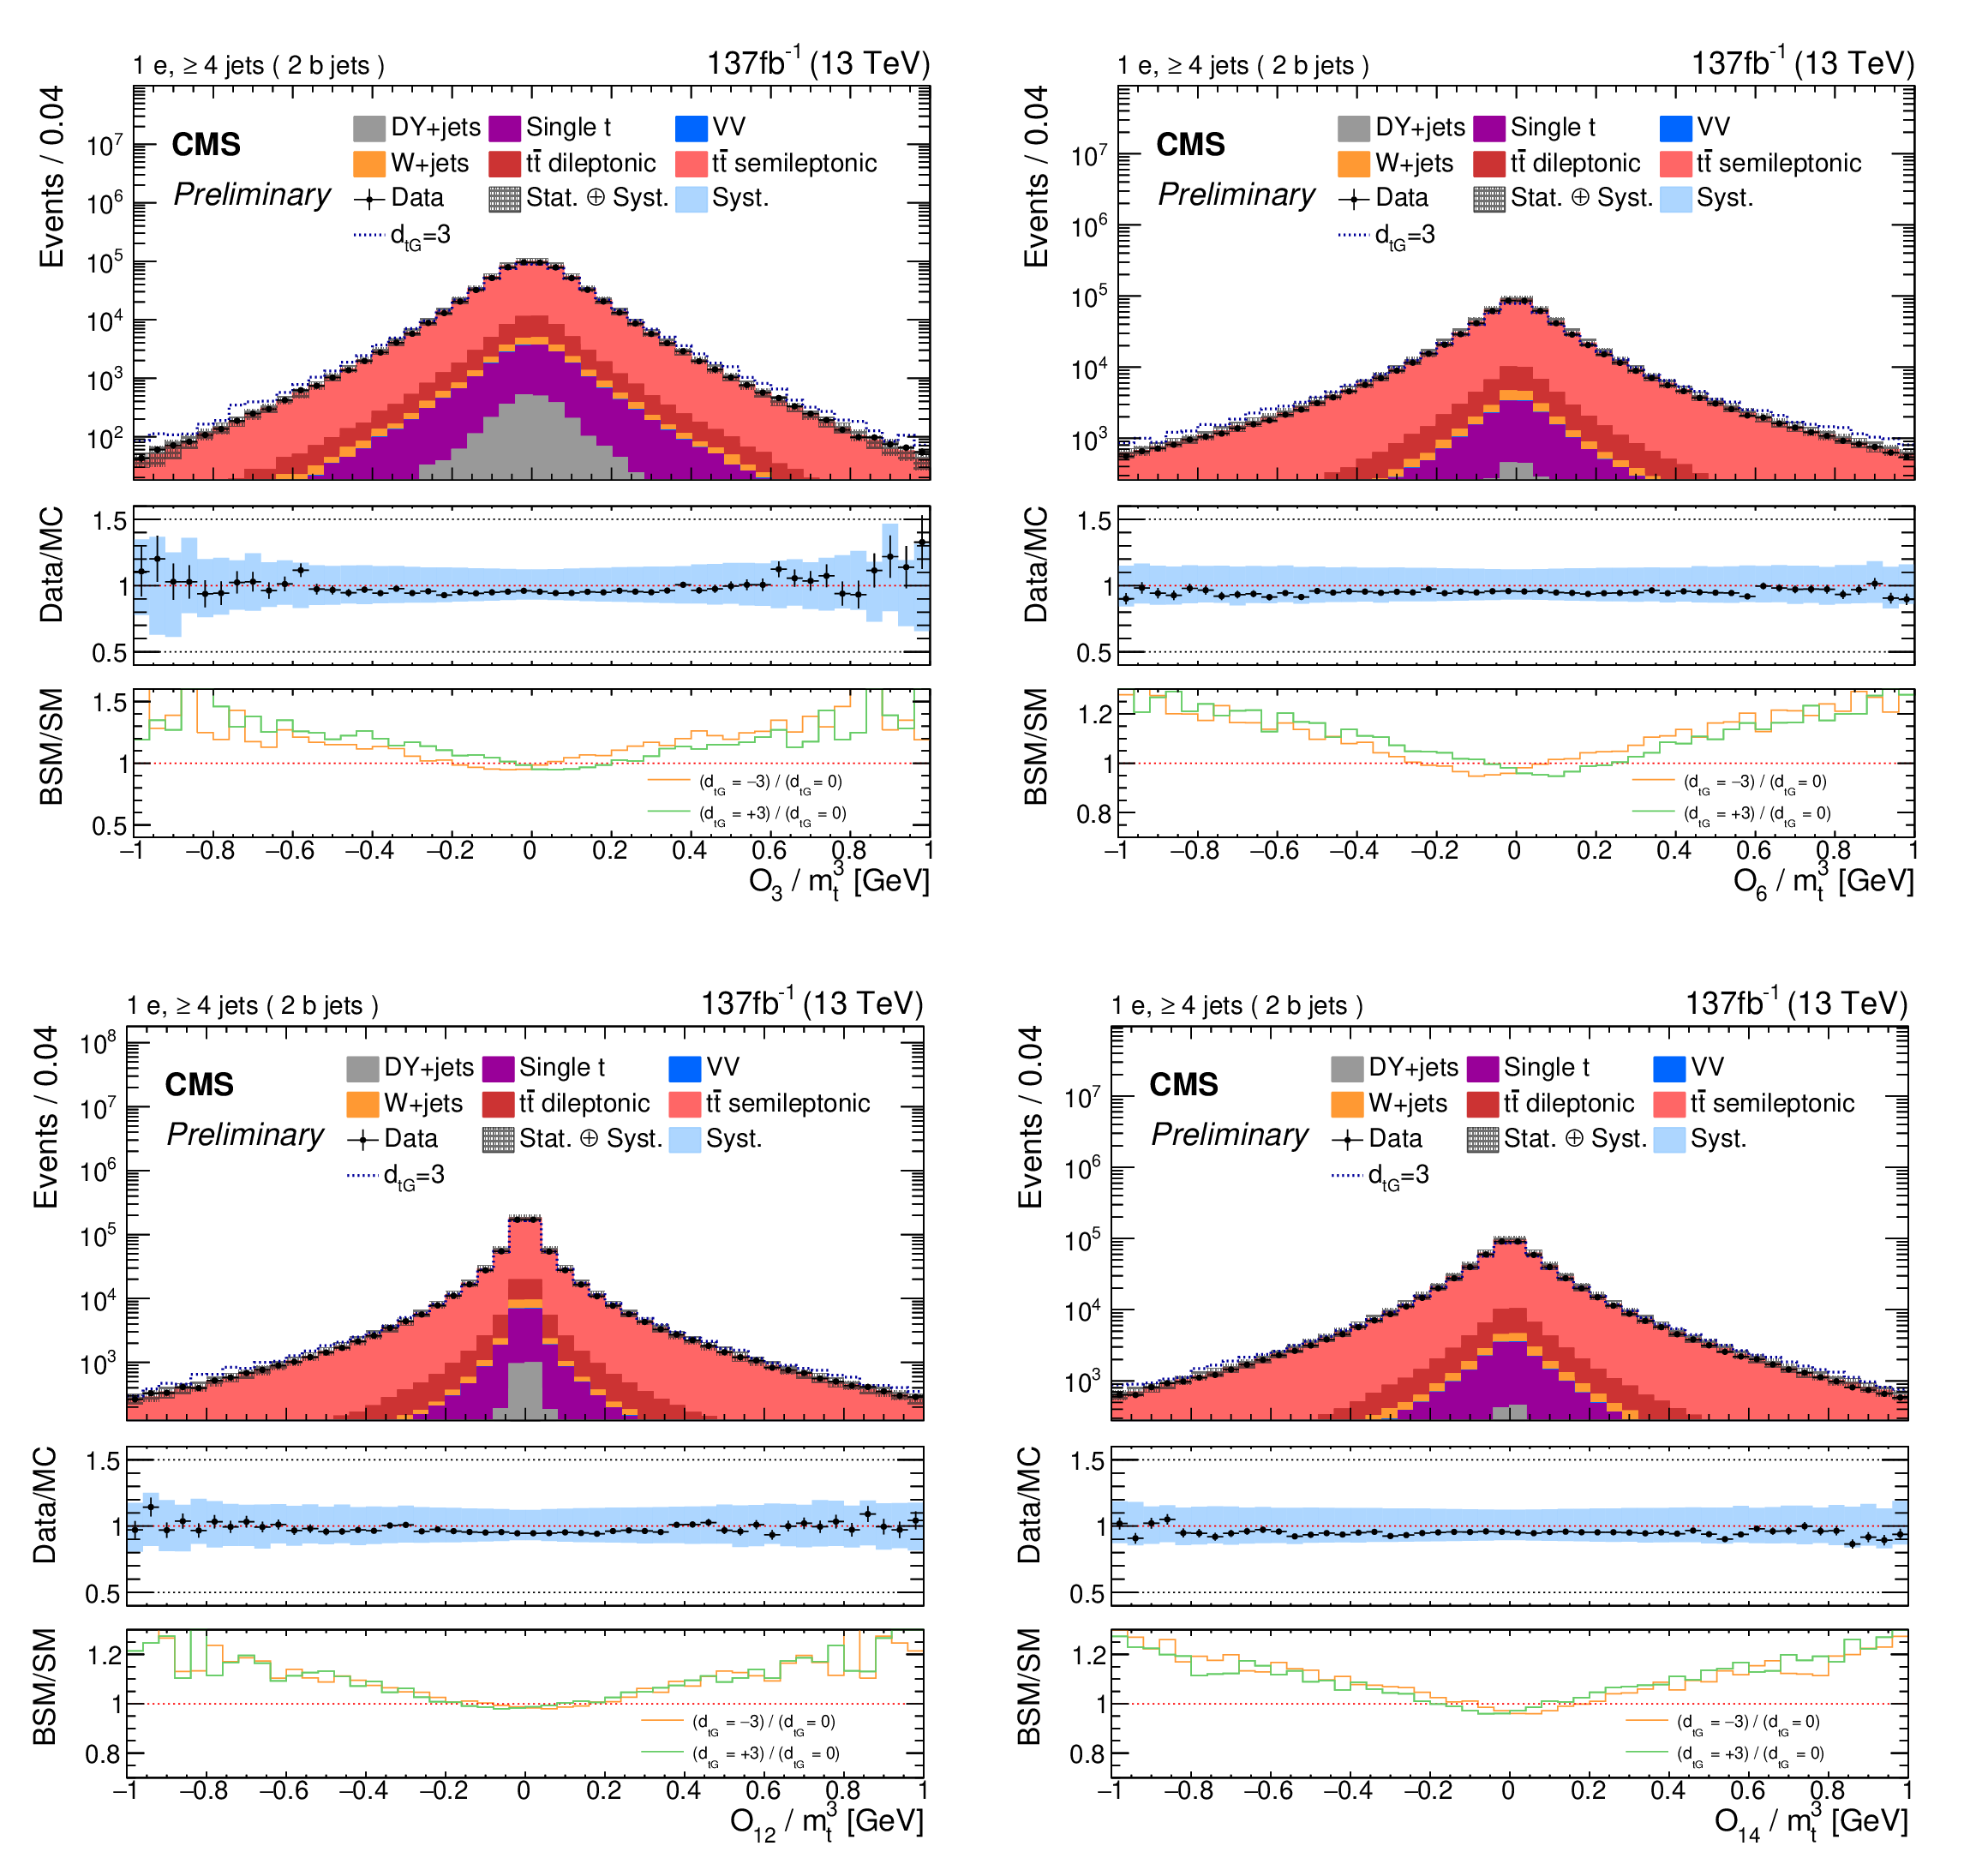
Figure 1:
Comparison of data and simulation in the signal region for the four observables in the electron channel. The dashed line shows the CEDM simulated signal with CP-odd CEDM parameter set to 3 and normalized to data. The vertical bars on the data points indicate the statistical uncertainties in the data and the hatched bands indicate the statistical uncertainties combined with the systematic uncertainties in the simulation. The blue bands represent the overall uncertainty in the expected yield, including all systematic uncertainties described in Section 5, except that due to changing background template. The orange line shows the ratio $(d_{tG} = -3) / (d_{tG} = 0)$ of CEDM samples at the generator level. The green line shows the ratio $(d_{tG} = 3) / (d_{tG} = 0)$ of CEDM samples at the generator level. |

png pdf |
Figure 1-a:
Comparison of data and simulation in the signal region for the four observables in the electron channel. The dashed line shows the CEDM simulated signal with CP-odd CEDM parameter set to 3 and normalized to data. The vertical bars on the data points indicate the statistical uncertainties in the data and the hatched bands indicate the statistical uncertainties combined with the systematic uncertainties in the simulation. The blue bands represent the overall uncertainty in the expected yield, including all systematic uncertainties described in Section 5, except that due to changing background template. The orange line shows the ratio $(d_{tG} = -3) / (d_{tG} = 0)$ of CEDM samples at the generator level. The green line shows the ratio $(d_{tG} = 3) / (d_{tG} = 0)$ of CEDM samples at the generator level. |
png pdf |
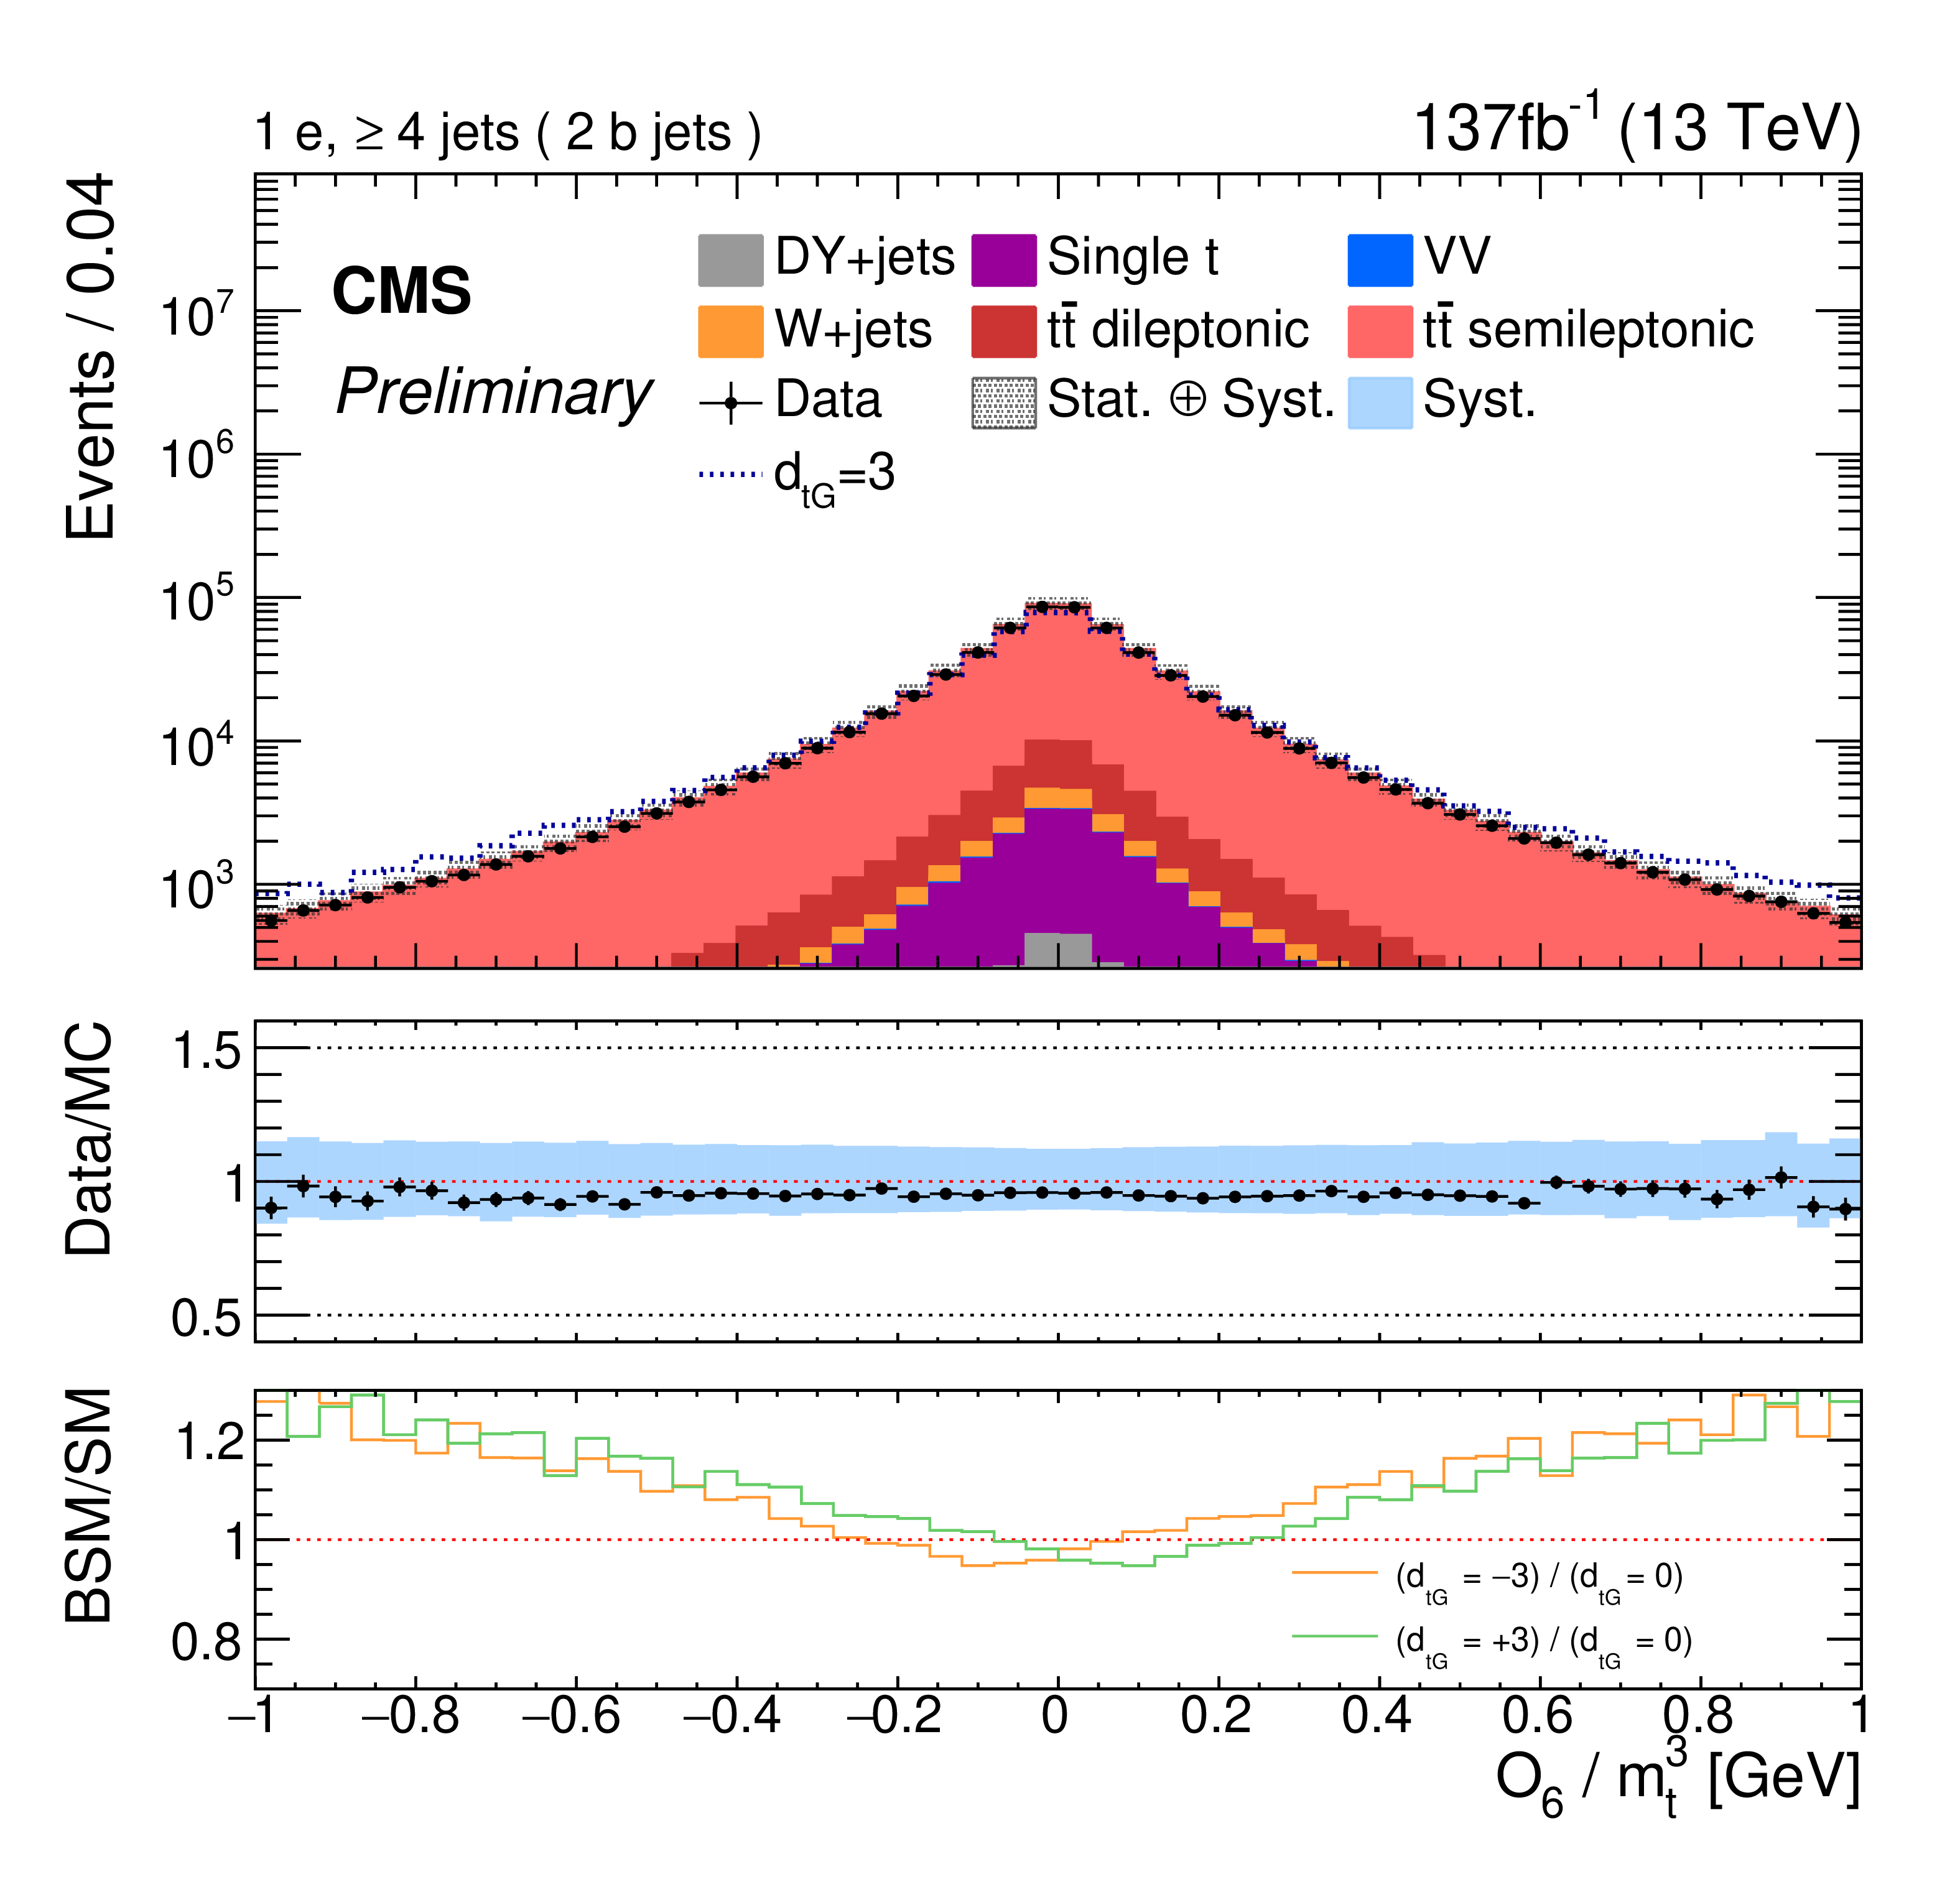
Figure 1-b:
Comparison of data and simulation in the signal region for the four observables in the electron channel. The dashed line shows the CEDM simulated signal with CP-odd CEDM parameter set to 3 and normalized to data. The vertical bars on the data points indicate the statistical uncertainties in the data and the hatched bands indicate the statistical uncertainties combined with the systematic uncertainties in the simulation. The blue bands represent the overall uncertainty in the expected yield, including all systematic uncertainties described in Section 5, except that due to changing background template. The orange line shows the ratio $(d_{tG} = -3) / (d_{tG} = 0)$ of CEDM samples at the generator level. The green line shows the ratio $(d_{tG} = 3) / (d_{tG} = 0)$ of CEDM samples at the generator level. |
png pdf |
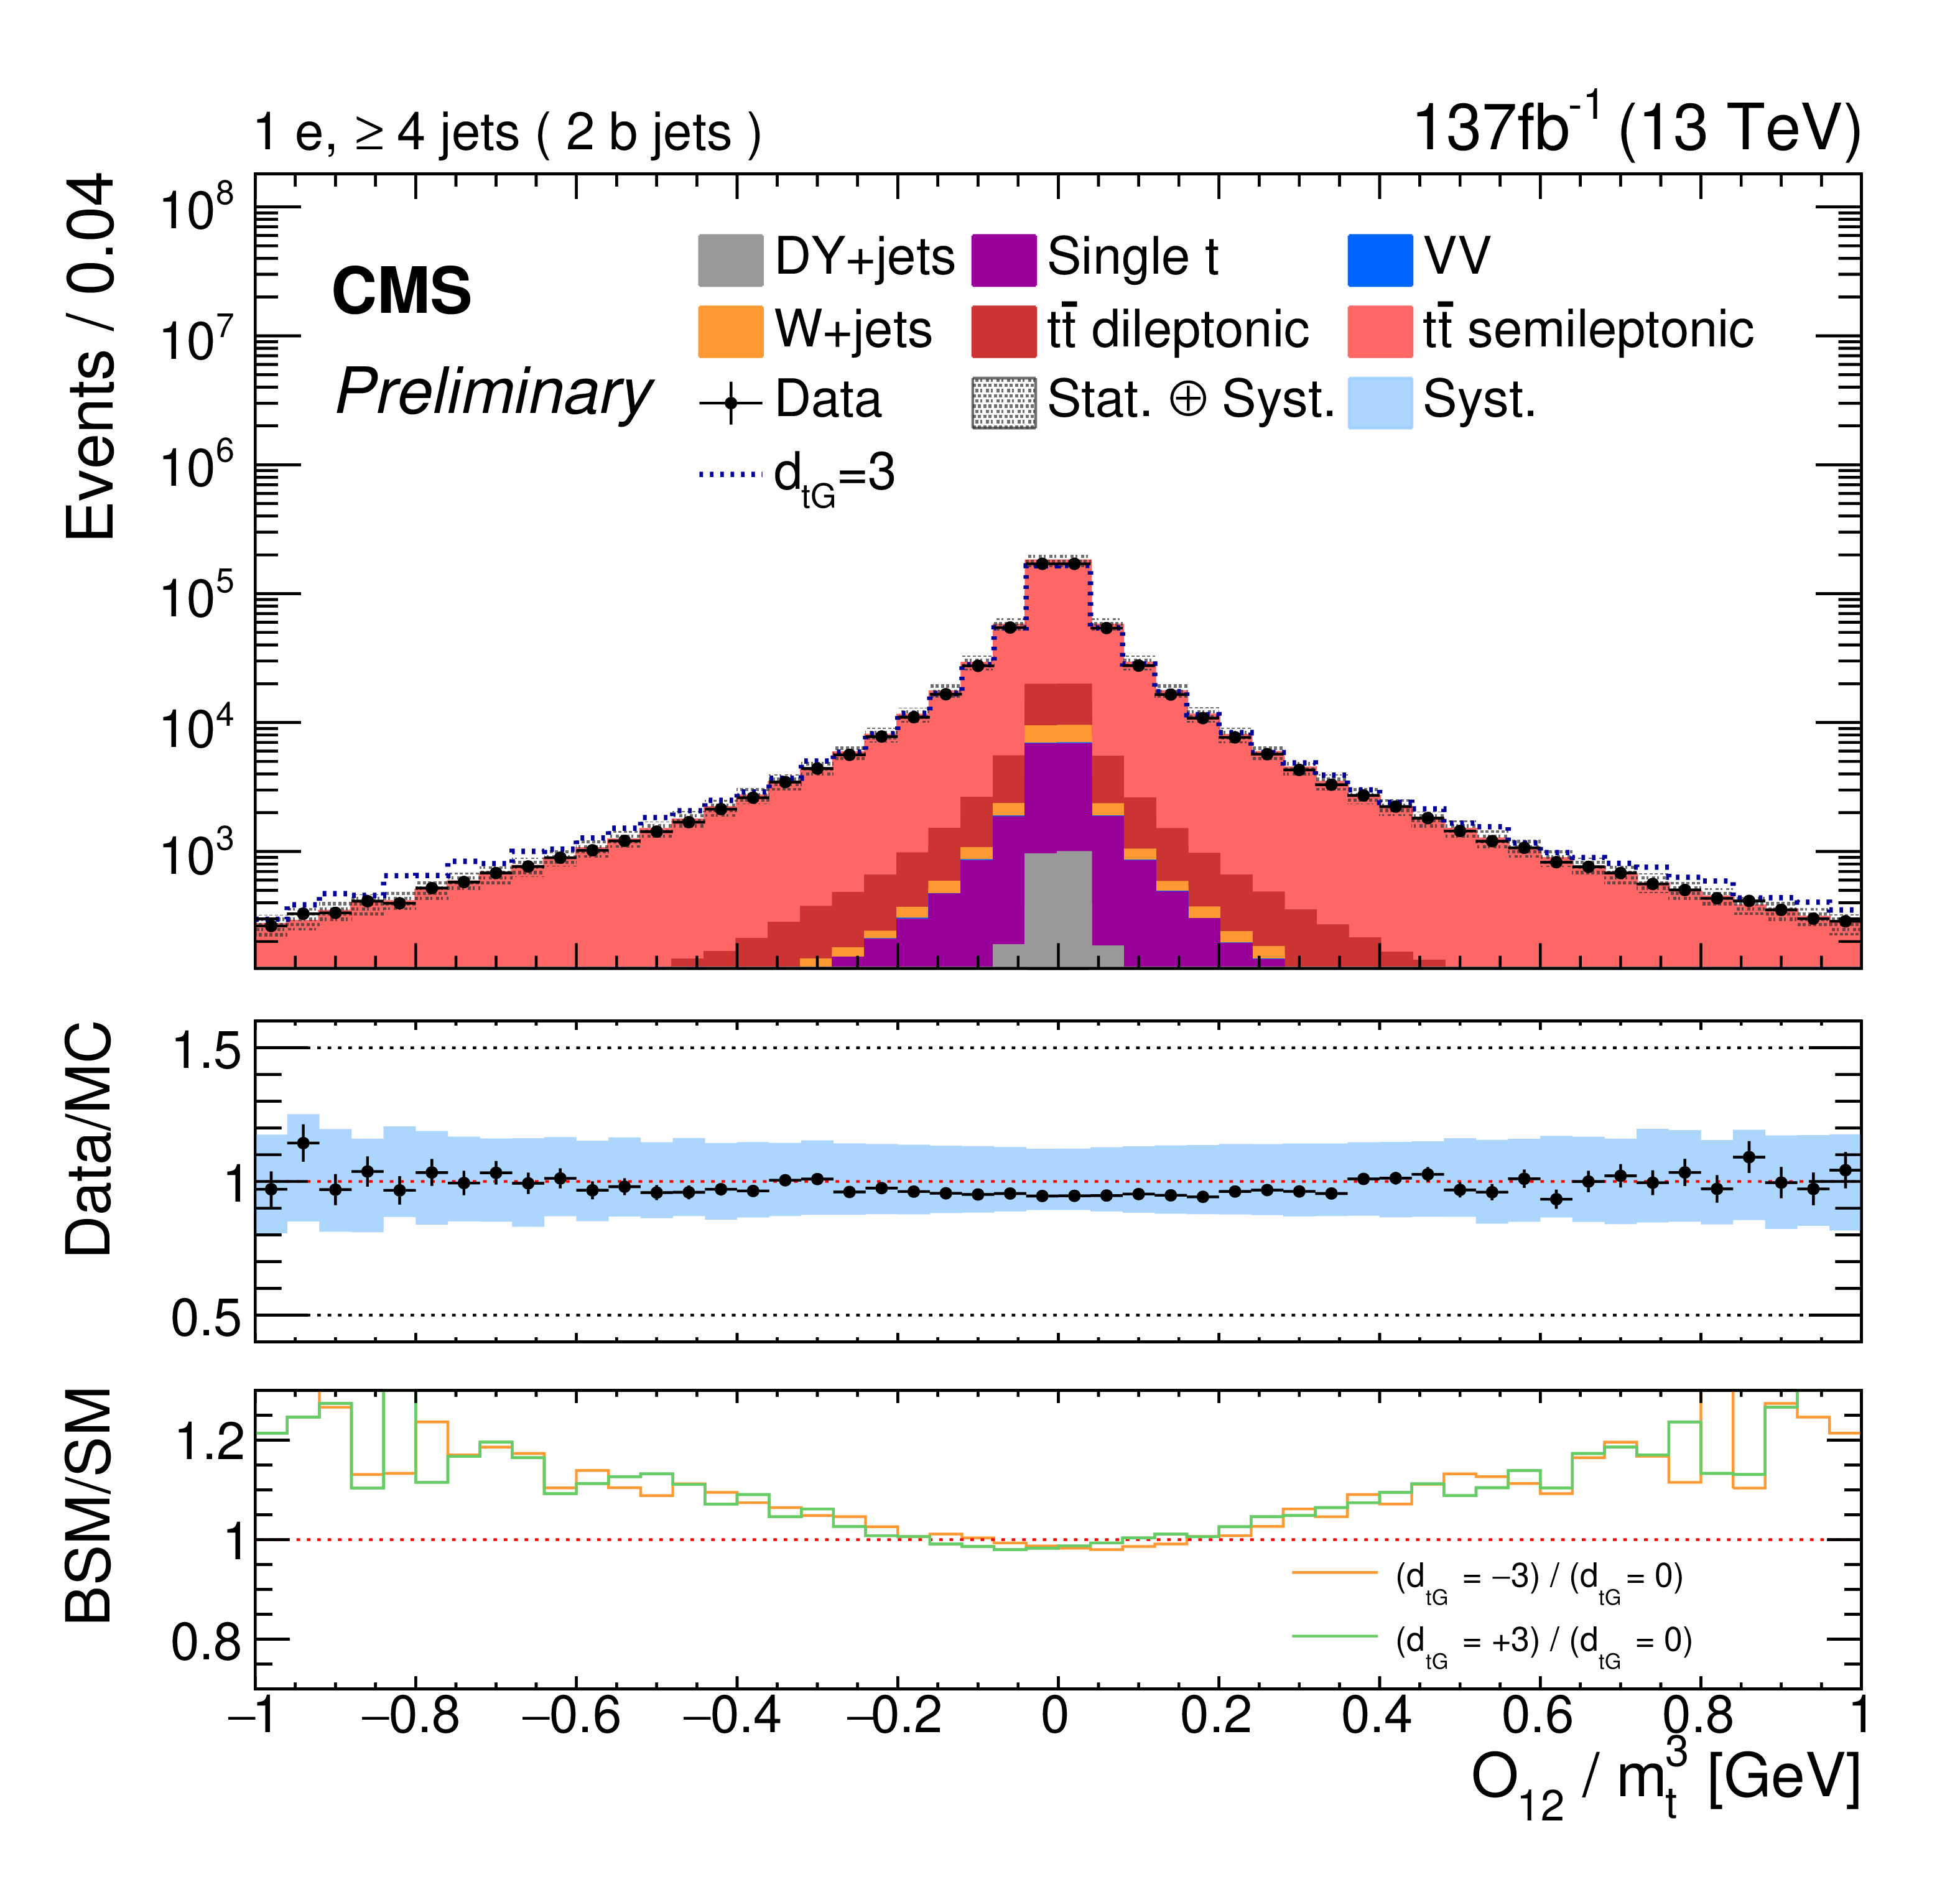
Figure 1-c:
Comparison of data and simulation in the signal region for the four observables in the electron channel. The dashed line shows the CEDM simulated signal with CP-odd CEDM parameter set to 3 and normalized to data. The vertical bars on the data points indicate the statistical uncertainties in the data and the hatched bands indicate the statistical uncertainties combined with the systematic uncertainties in the simulation. The blue bands represent the overall uncertainty in the expected yield, including all systematic uncertainties described in Section 5, except that due to changing background template. The orange line shows the ratio $(d_{tG} = -3) / (d_{tG} = 0)$ of CEDM samples at the generator level. The green line shows the ratio $(d_{tG} = 3) / (d_{tG} = 0)$ of CEDM samples at the generator level. |

png pdf |
Figure 1-d:
Comparison of data and simulation in the signal region for the four observables in the electron channel. The dashed line shows the CEDM simulated signal with CP-odd CEDM parameter set to 3 and normalized to data. The vertical bars on the data points indicate the statistical uncertainties in the data and the hatched bands indicate the statistical uncertainties combined with the systematic uncertainties in the simulation. The blue bands represent the overall uncertainty in the expected yield, including all systematic uncertainties described in Section 5, except that due to changing background template. The orange line shows the ratio $(d_{tG} = -3) / (d_{tG} = 0)$ of CEDM samples at the generator level. The green line shows the ratio $(d_{tG} = 3) / (d_{tG} = 0)$ of CEDM samples at the generator level. |
png pdf |
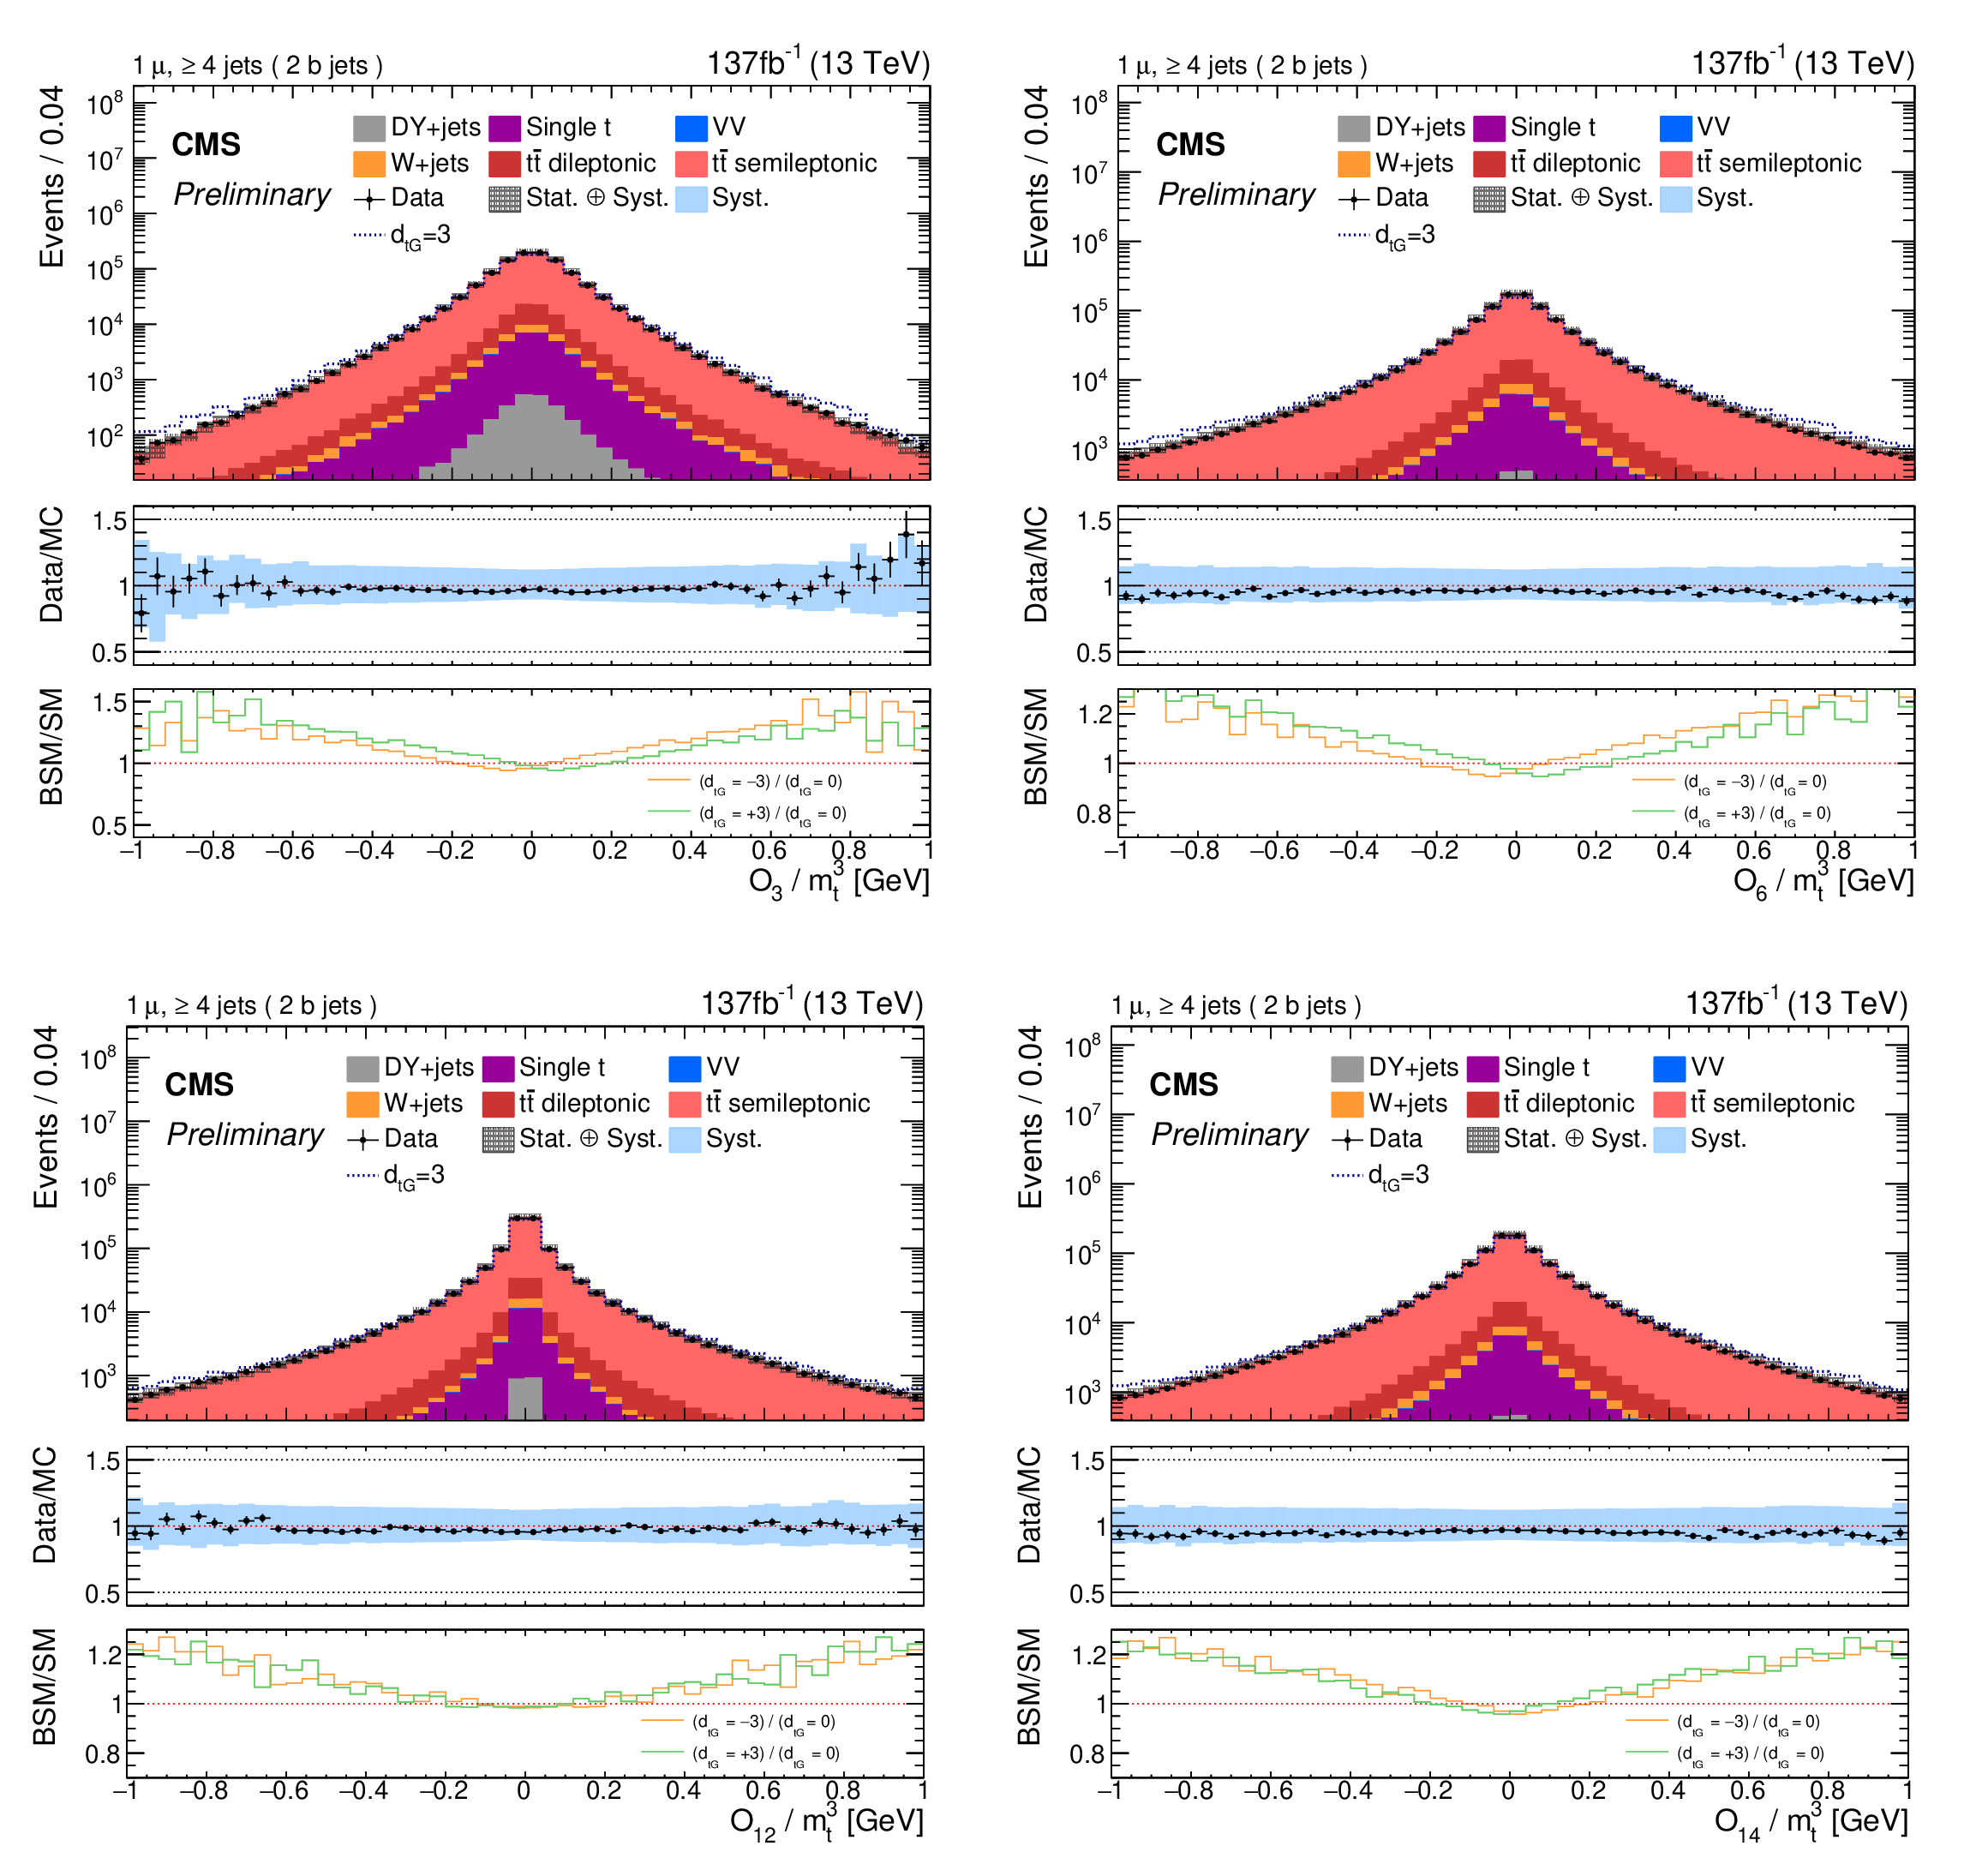
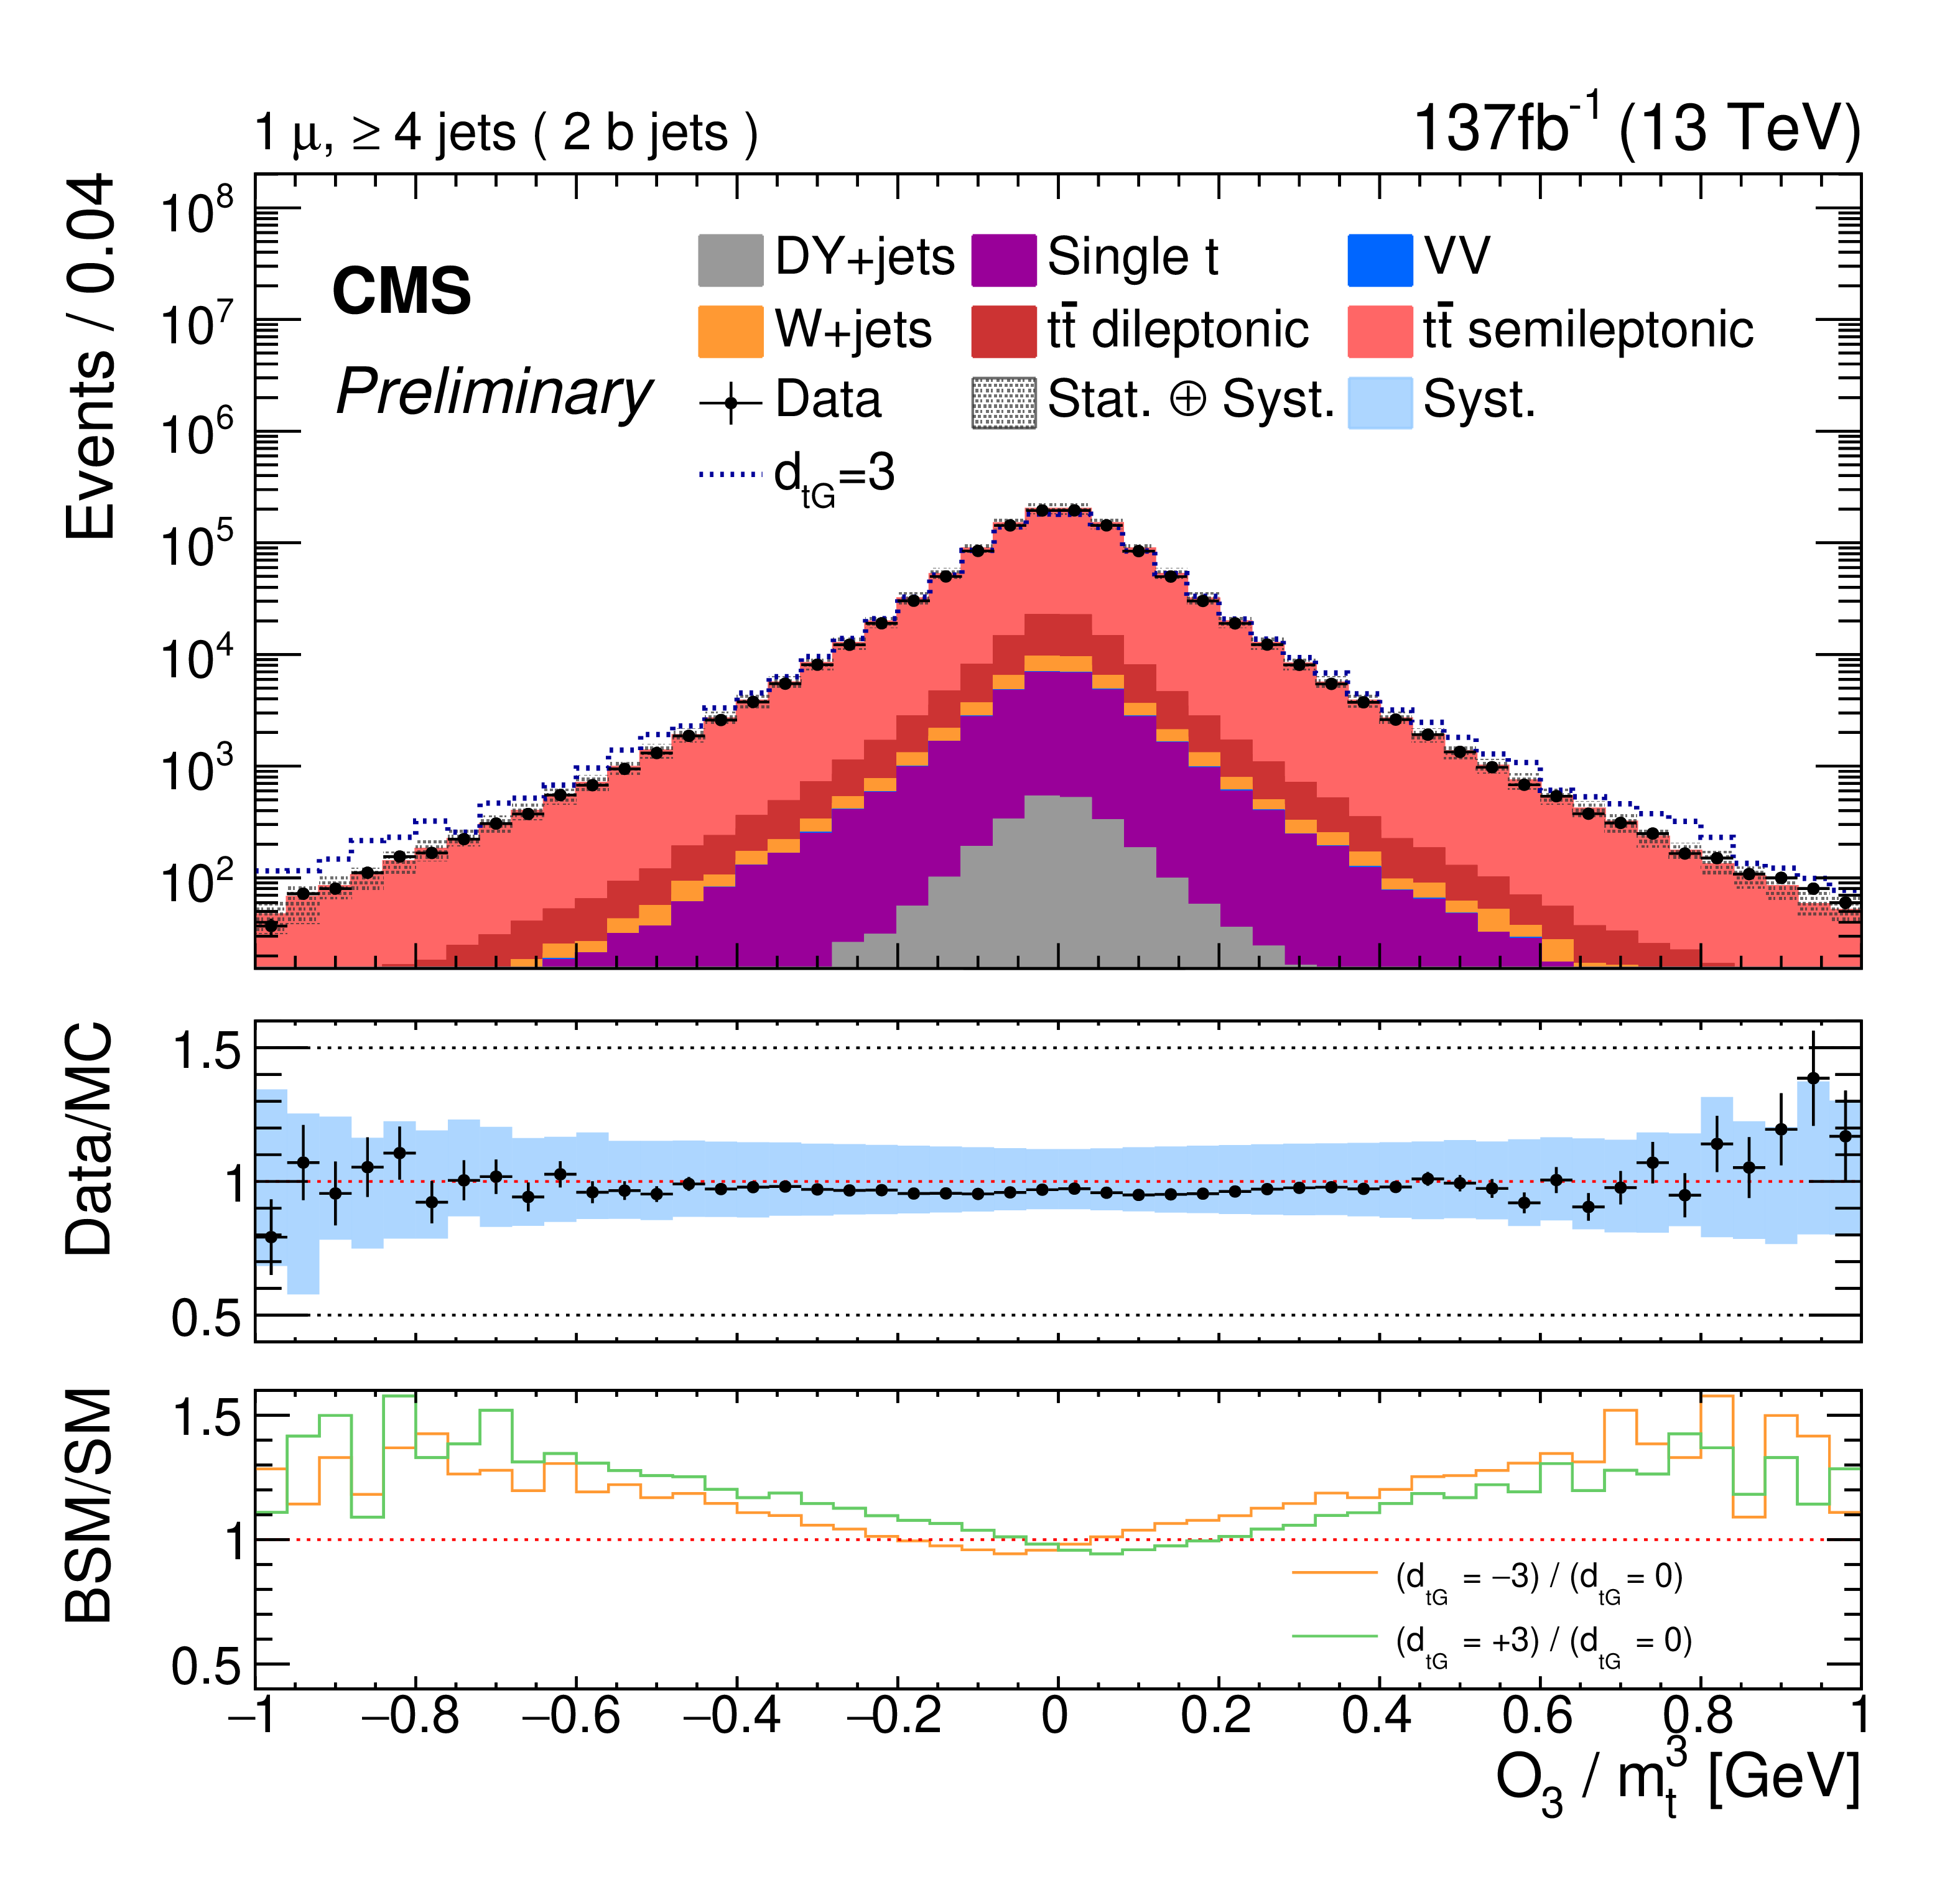
Figure 2:
Comparison of data and simulation in the signal region for the four observables in the muon channel. The dashed line shows the CEDM simulated signal with CP-odd CEDM parameter set to 3 and normalized to data. The vertical bars on the data points indicate the statistical uncertainties in the data and the hatched bands indicate the statistical uncertainties combined with the systematic uncertainties in the simulation. The blue bands represent the overall uncertainty in the expected yield, including all systematic uncertainties described in Section 5, except that due to changing background template. The orange line shows the ratio $(d_{tG} = -3) / (d_{tG} = 0)$ of CEDM samples at the generator level. The green line shows the ratio $(d_{tG} = 3) / (d_{tG} = 0)$ of CEDM samples at the generator level. |
png pdf |
Figure 2-a:
Comparison of data and simulation in the signal region for the four observables in the muon channel. The dashed line shows the CEDM simulated signal with CP-odd CEDM parameter set to 3 and normalized to data. The vertical bars on the data points indicate the statistical uncertainties in the data and the hatched bands indicate the statistical uncertainties combined with the systematic uncertainties in the simulation. The blue bands represent the overall uncertainty in the expected yield, including all systematic uncertainties described in Section 5, except that due to changing background template. The orange line shows the ratio $(d_{tG} = -3) / (d_{tG} = 0)$ of CEDM samples at the generator level. The green line shows the ratio $(d_{tG} = 3) / (d_{tG} = 0)$ of CEDM samples at the generator level. |

png pdf |
Figure 2-b:
Comparison of data and simulation in the signal region for the four observables in the muon channel. The dashed line shows the CEDM simulated signal with CP-odd CEDM parameter set to 3 and normalized to data. The vertical bars on the data points indicate the statistical uncertainties in the data and the hatched bands indicate the statistical uncertainties combined with the systematic uncertainties in the simulation. The blue bands represent the overall uncertainty in the expected yield, including all systematic uncertainties described in Section 5, except that due to changing background template. The orange line shows the ratio $(d_{tG} = -3) / (d_{tG} = 0)$ of CEDM samples at the generator level. The green line shows the ratio $(d_{tG} = 3) / (d_{tG} = 0)$ of CEDM samples at the generator level. |

png pdf |
Figure 2-c:
Comparison of data and simulation in the signal region for the four observables in the muon channel. The dashed line shows the CEDM simulated signal with CP-odd CEDM parameter set to 3 and normalized to data. The vertical bars on the data points indicate the statistical uncertainties in the data and the hatched bands indicate the statistical uncertainties combined with the systematic uncertainties in the simulation. The blue bands represent the overall uncertainty in the expected yield, including all systematic uncertainties described in Section 5, except that due to changing background template. The orange line shows the ratio $(d_{tG} = -3) / (d_{tG} = 0)$ of CEDM samples at the generator level. The green line shows the ratio $(d_{tG} = 3) / (d_{tG} = 0)$ of CEDM samples at the generator level. |

png pdf |
Figure 2-d:
Comparison of data and simulation in the signal region for the four observables in the muon channel. The dashed line shows the CEDM simulated signal with CP-odd CEDM parameter set to 3 and normalized to data. The vertical bars on the data points indicate the statistical uncertainties in the data and the hatched bands indicate the statistical uncertainties combined with the systematic uncertainties in the simulation. The blue bands represent the overall uncertainty in the expected yield, including all systematic uncertainties described in Section 5, except that due to changing background template. The orange line shows the ratio $(d_{tG} = -3) / (d_{tG} = 0)$ of CEDM samples at the generator level. The green line shows the ratio $(d_{tG} = 3) / (d_{tG} = 0)$ of CEDM samples at the generator level. |
png pdf |
Figure 3:
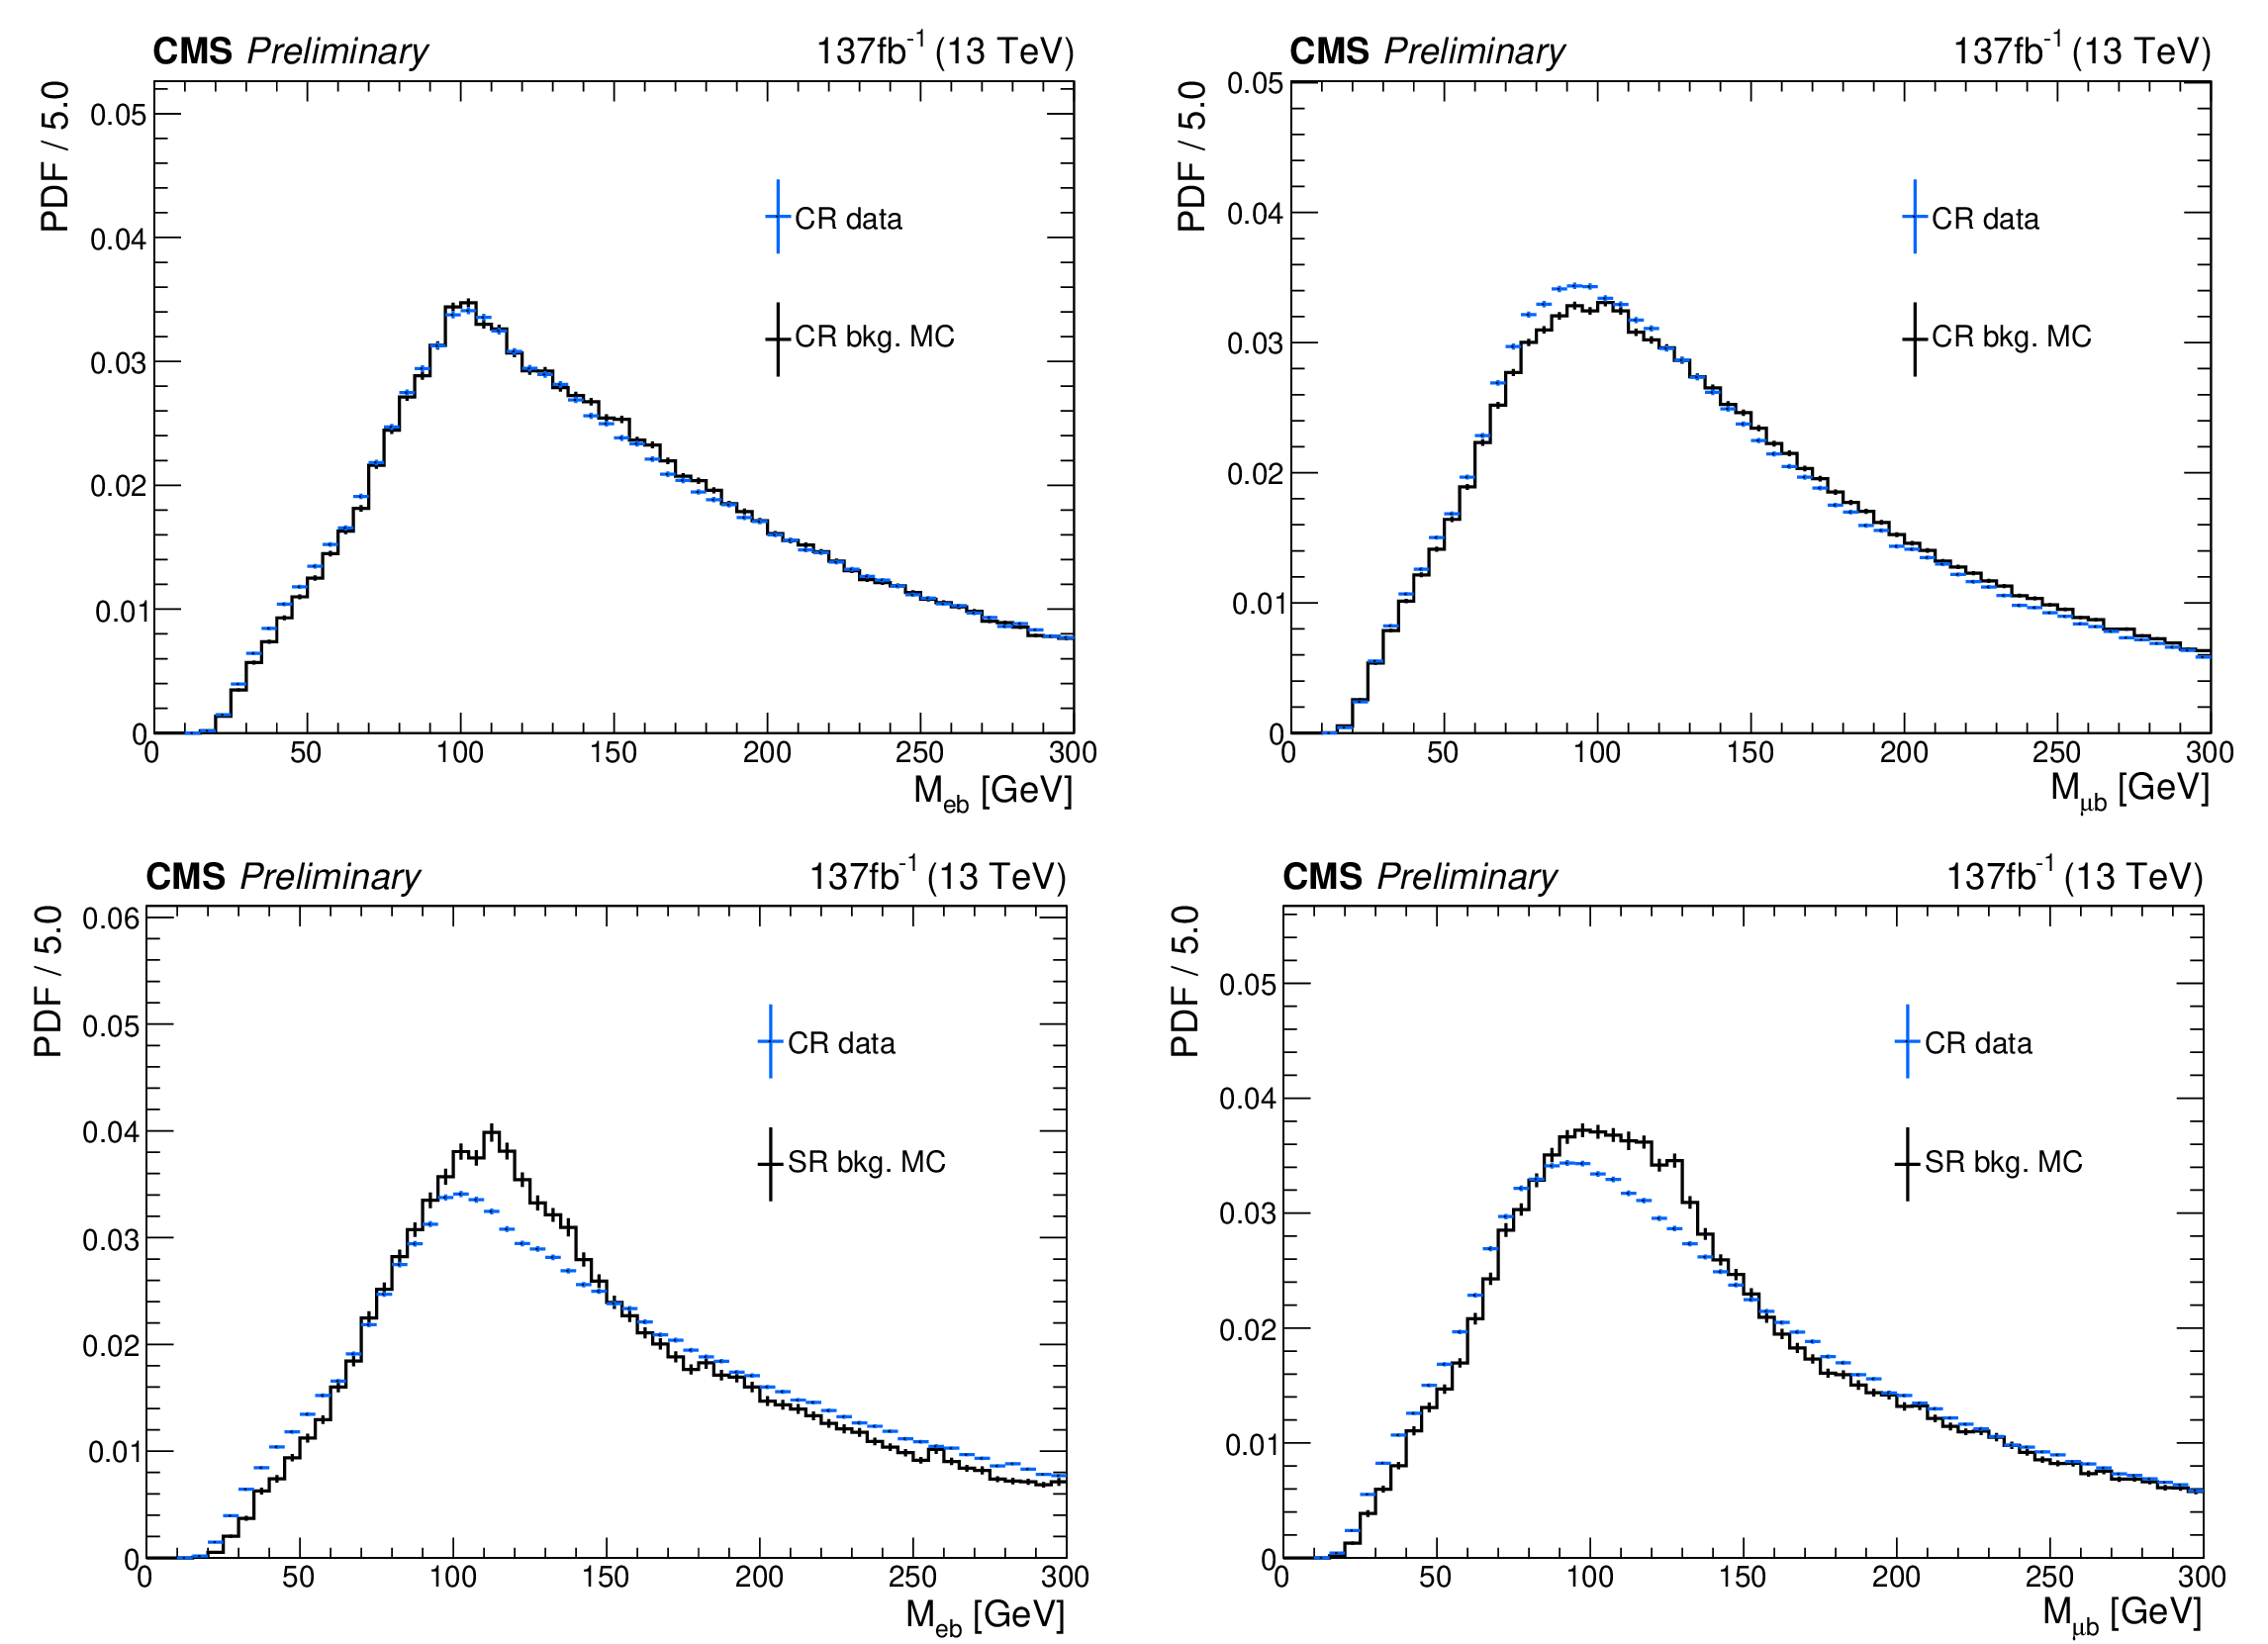
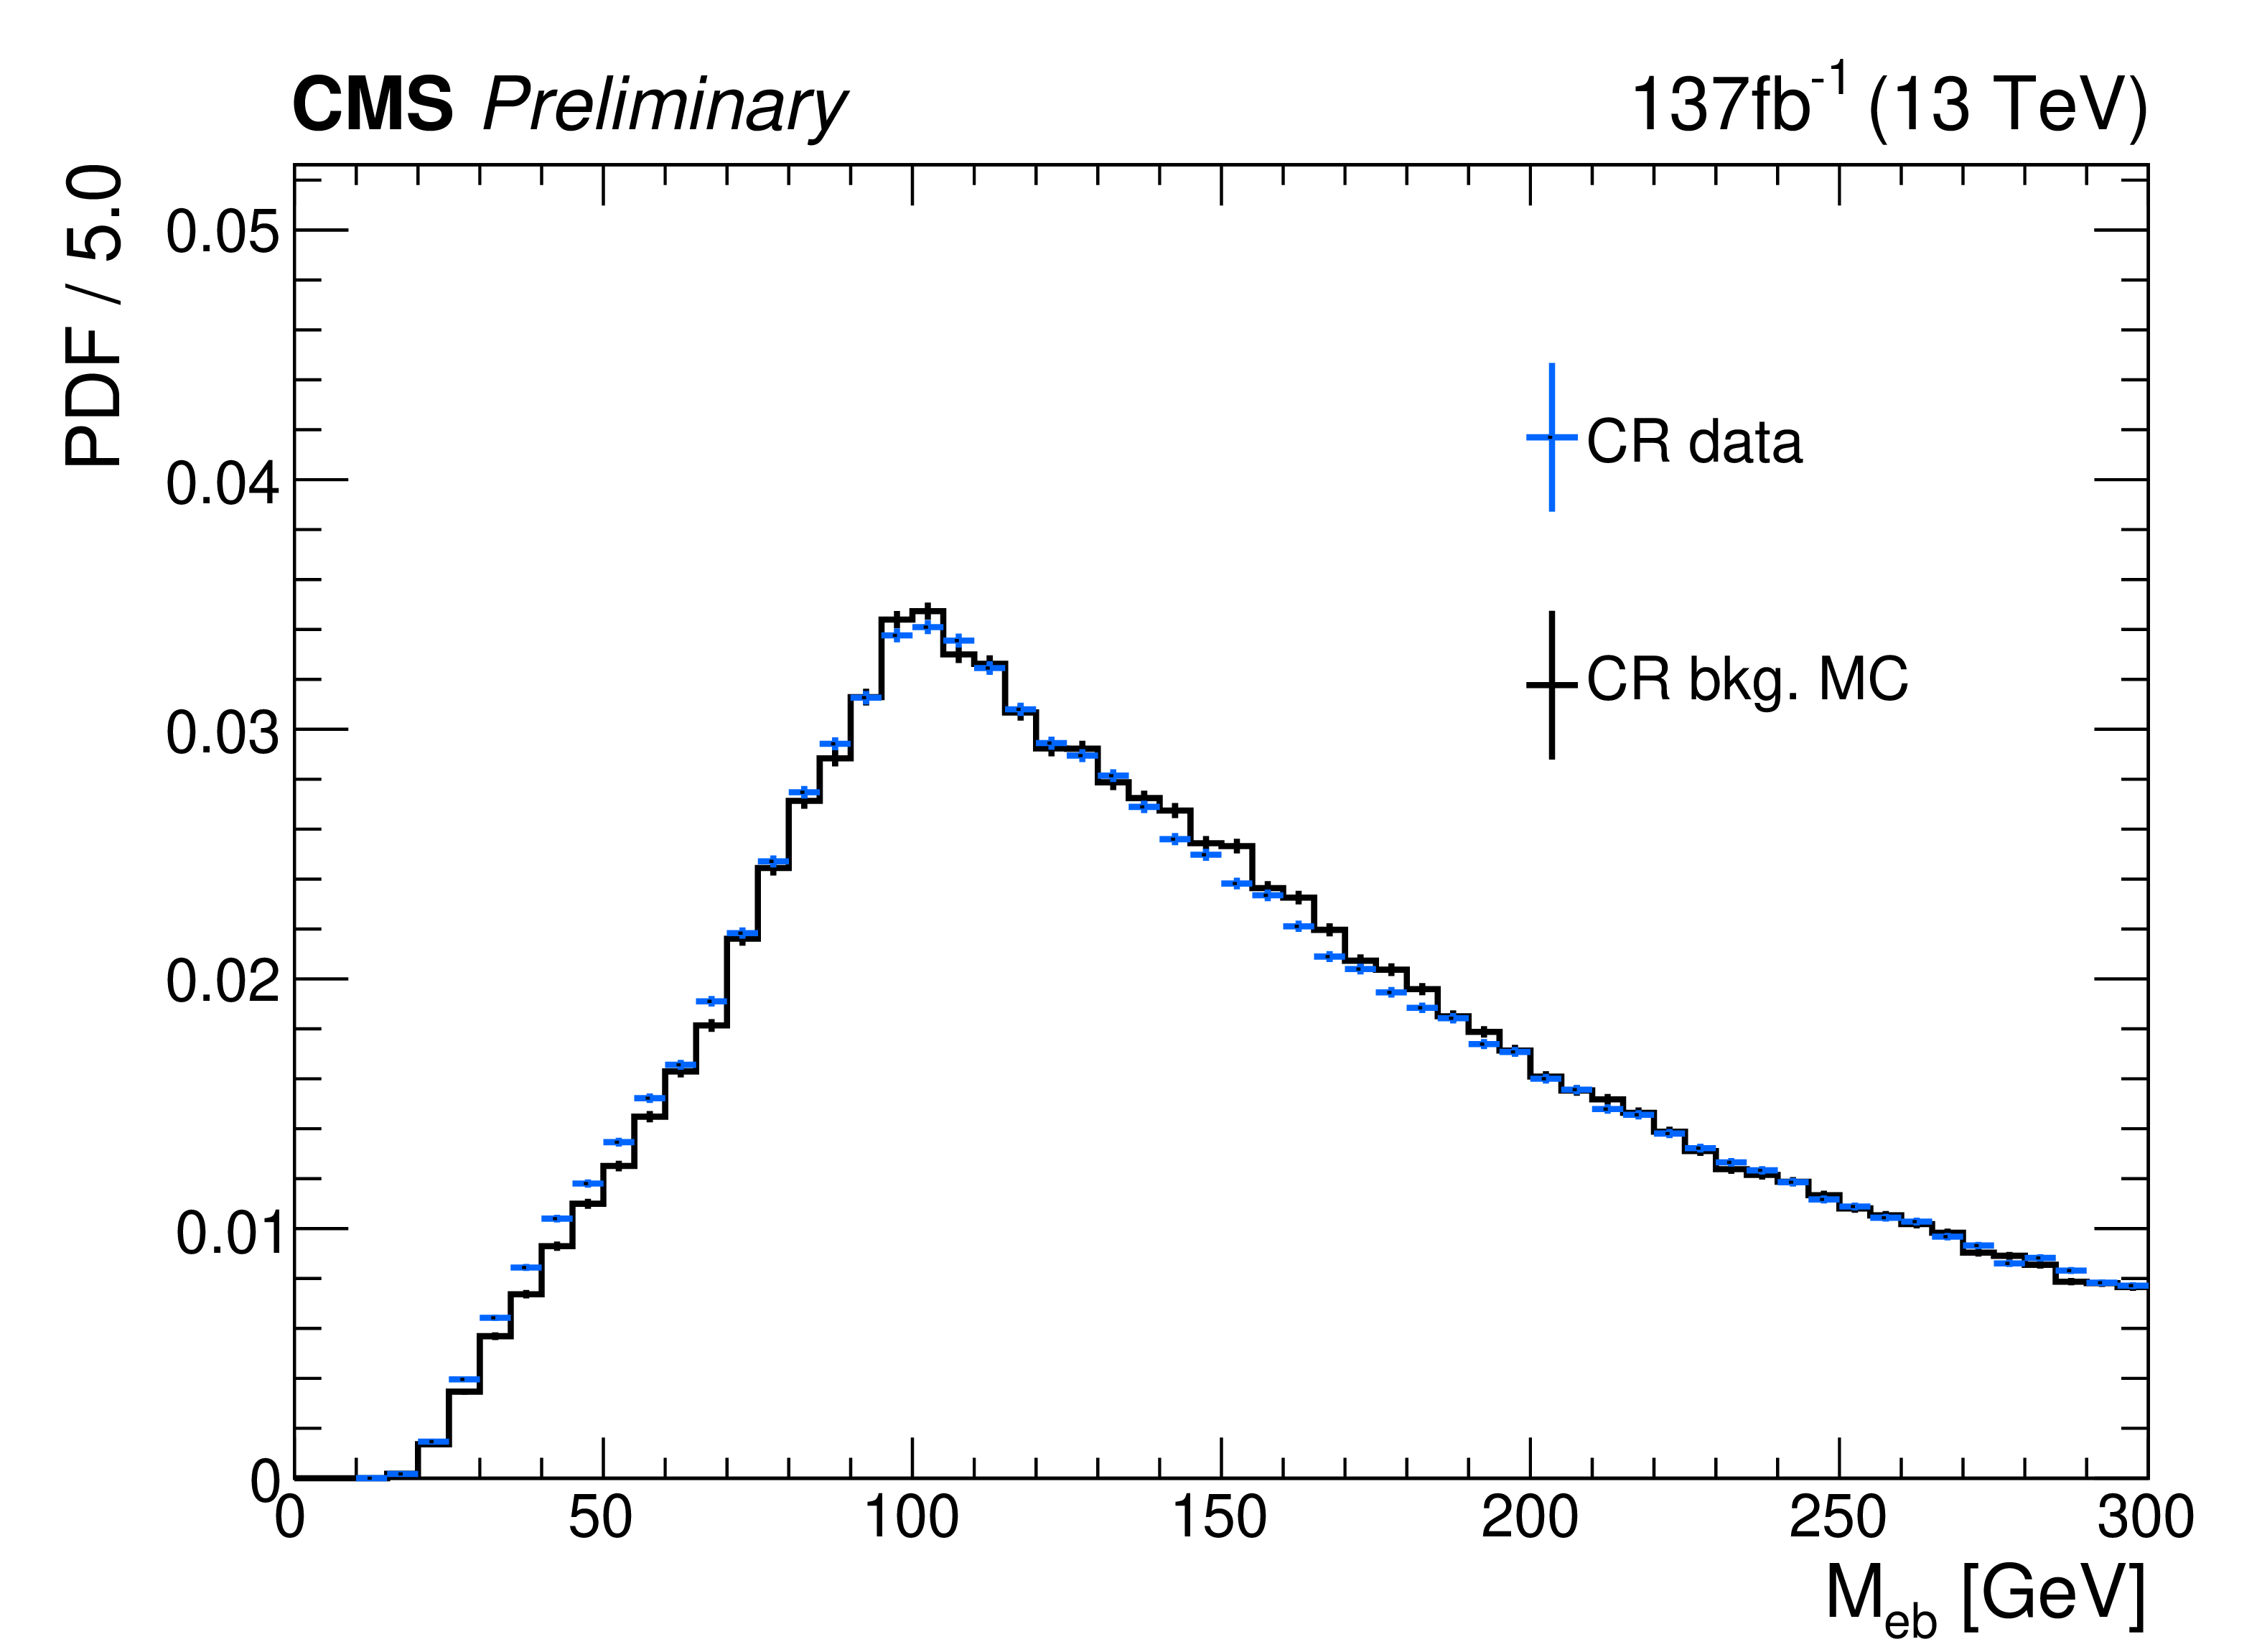
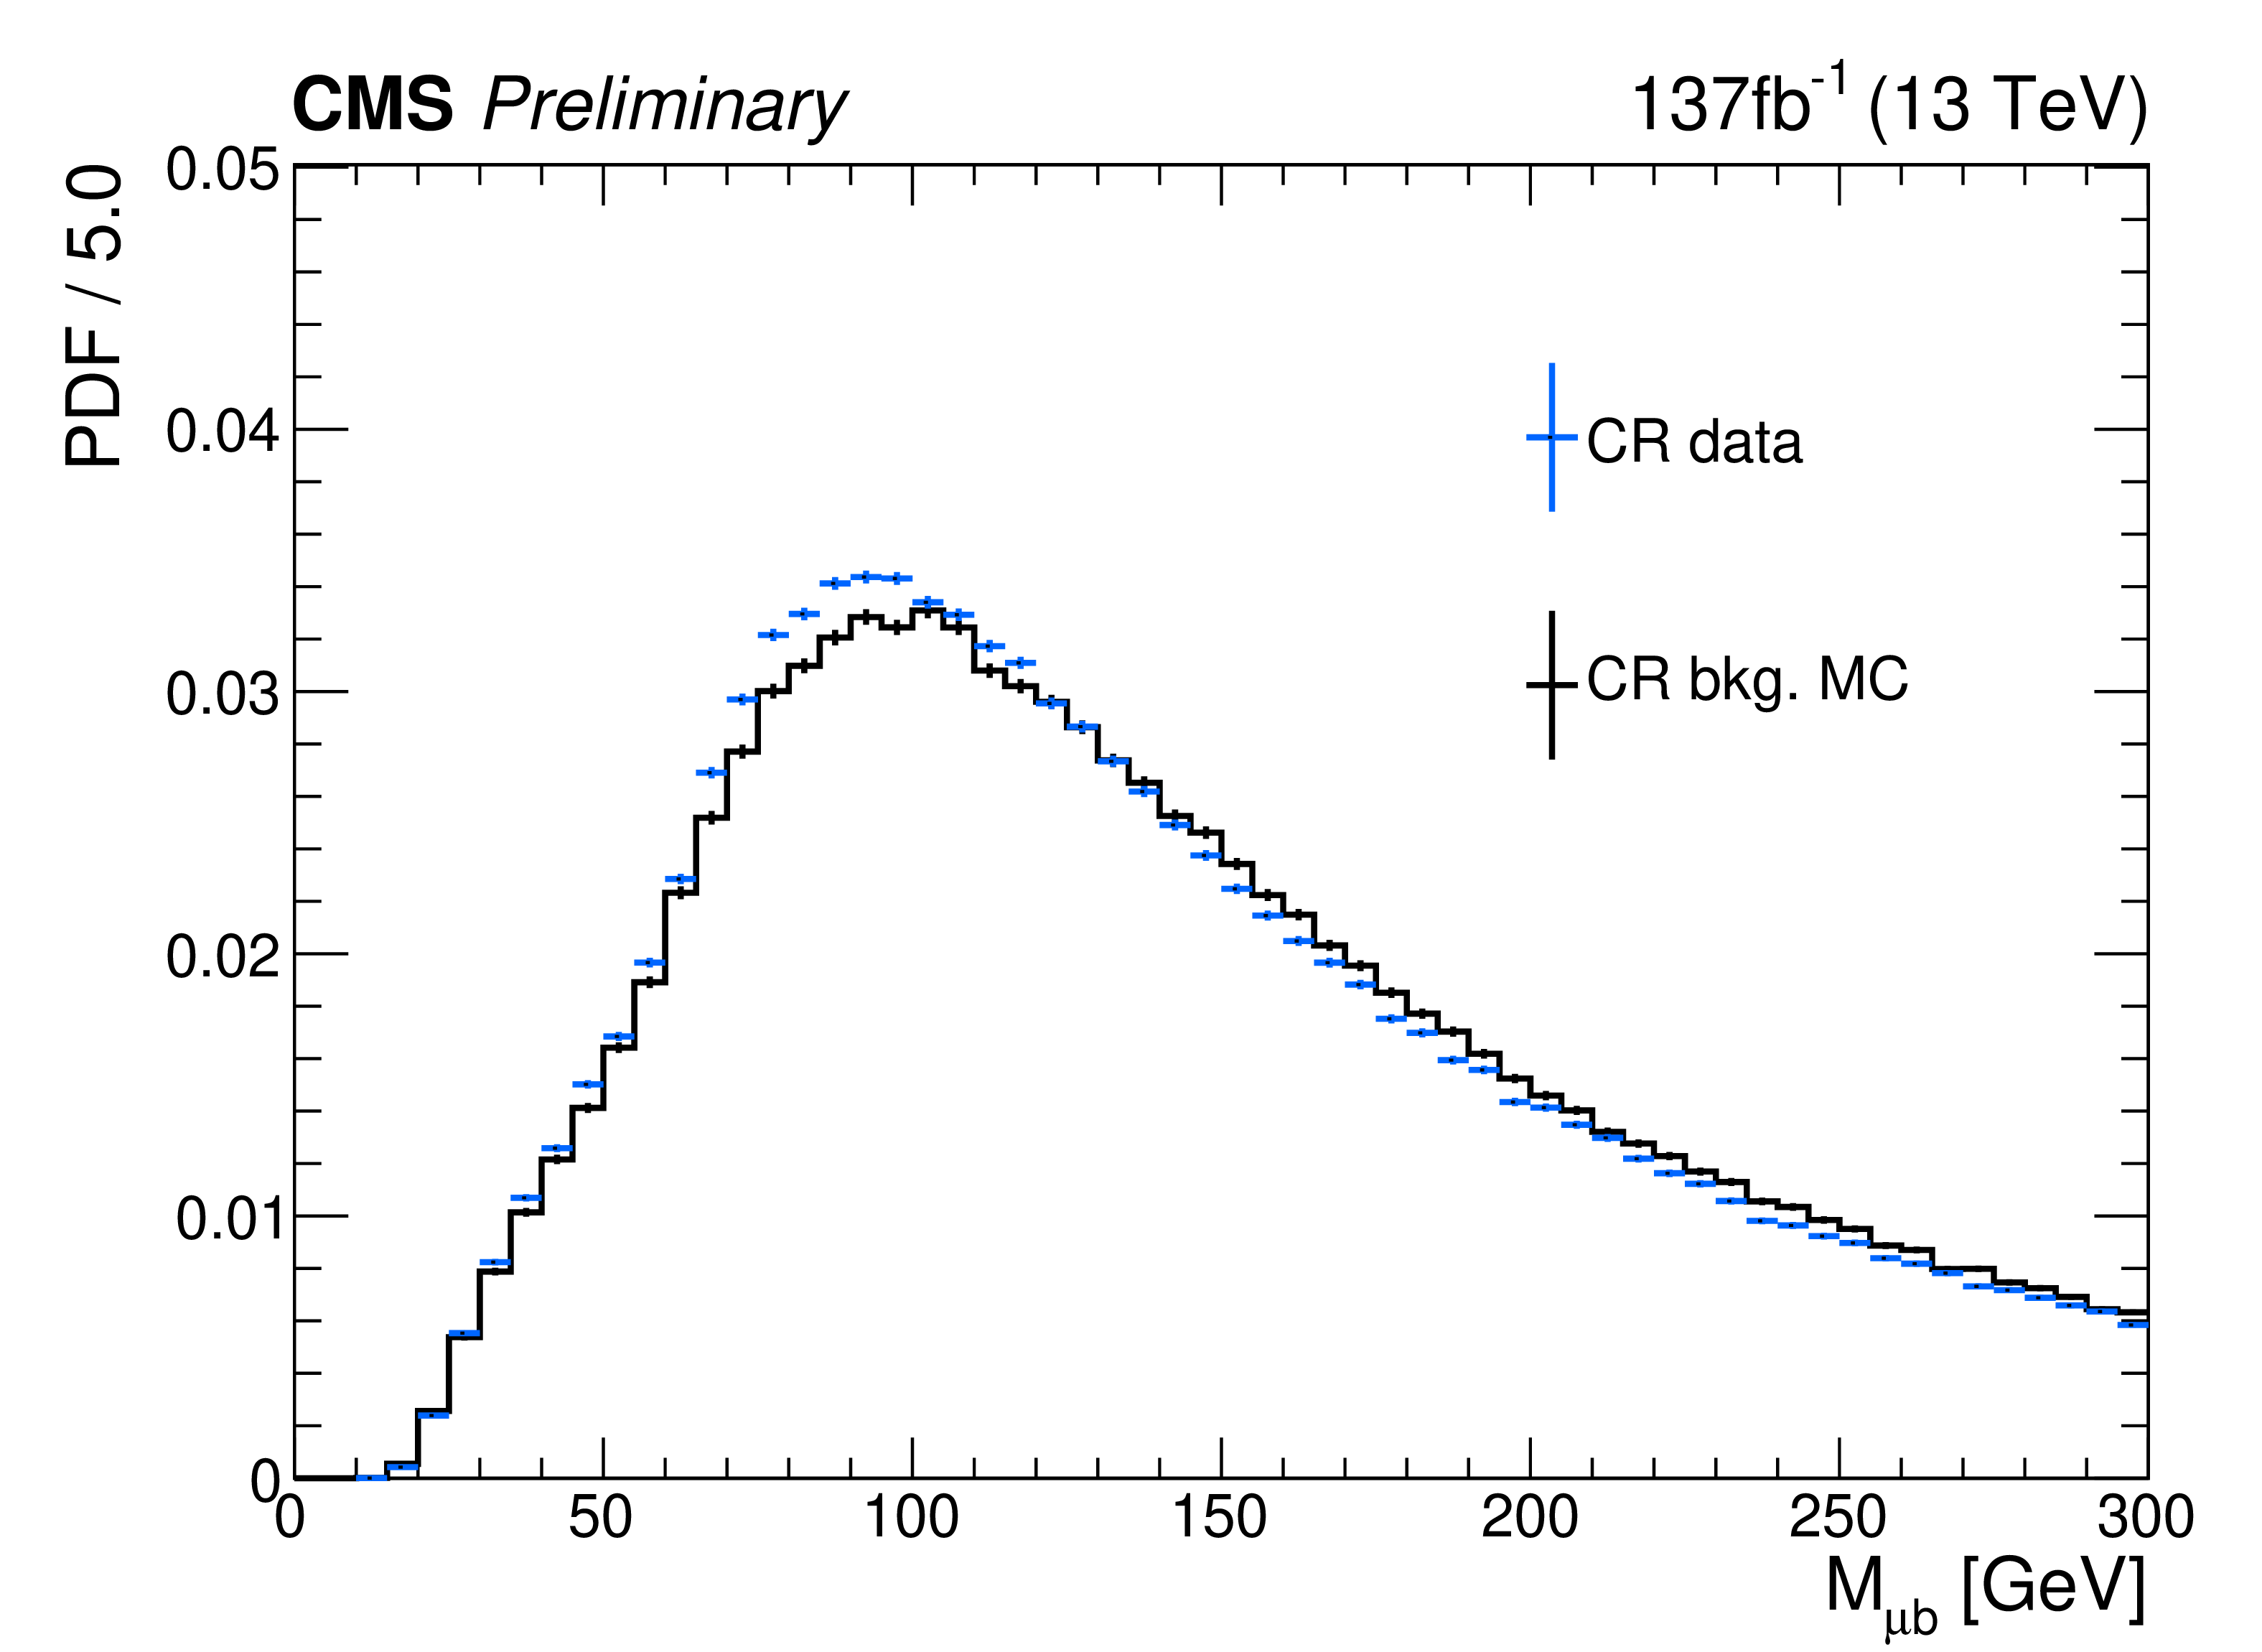
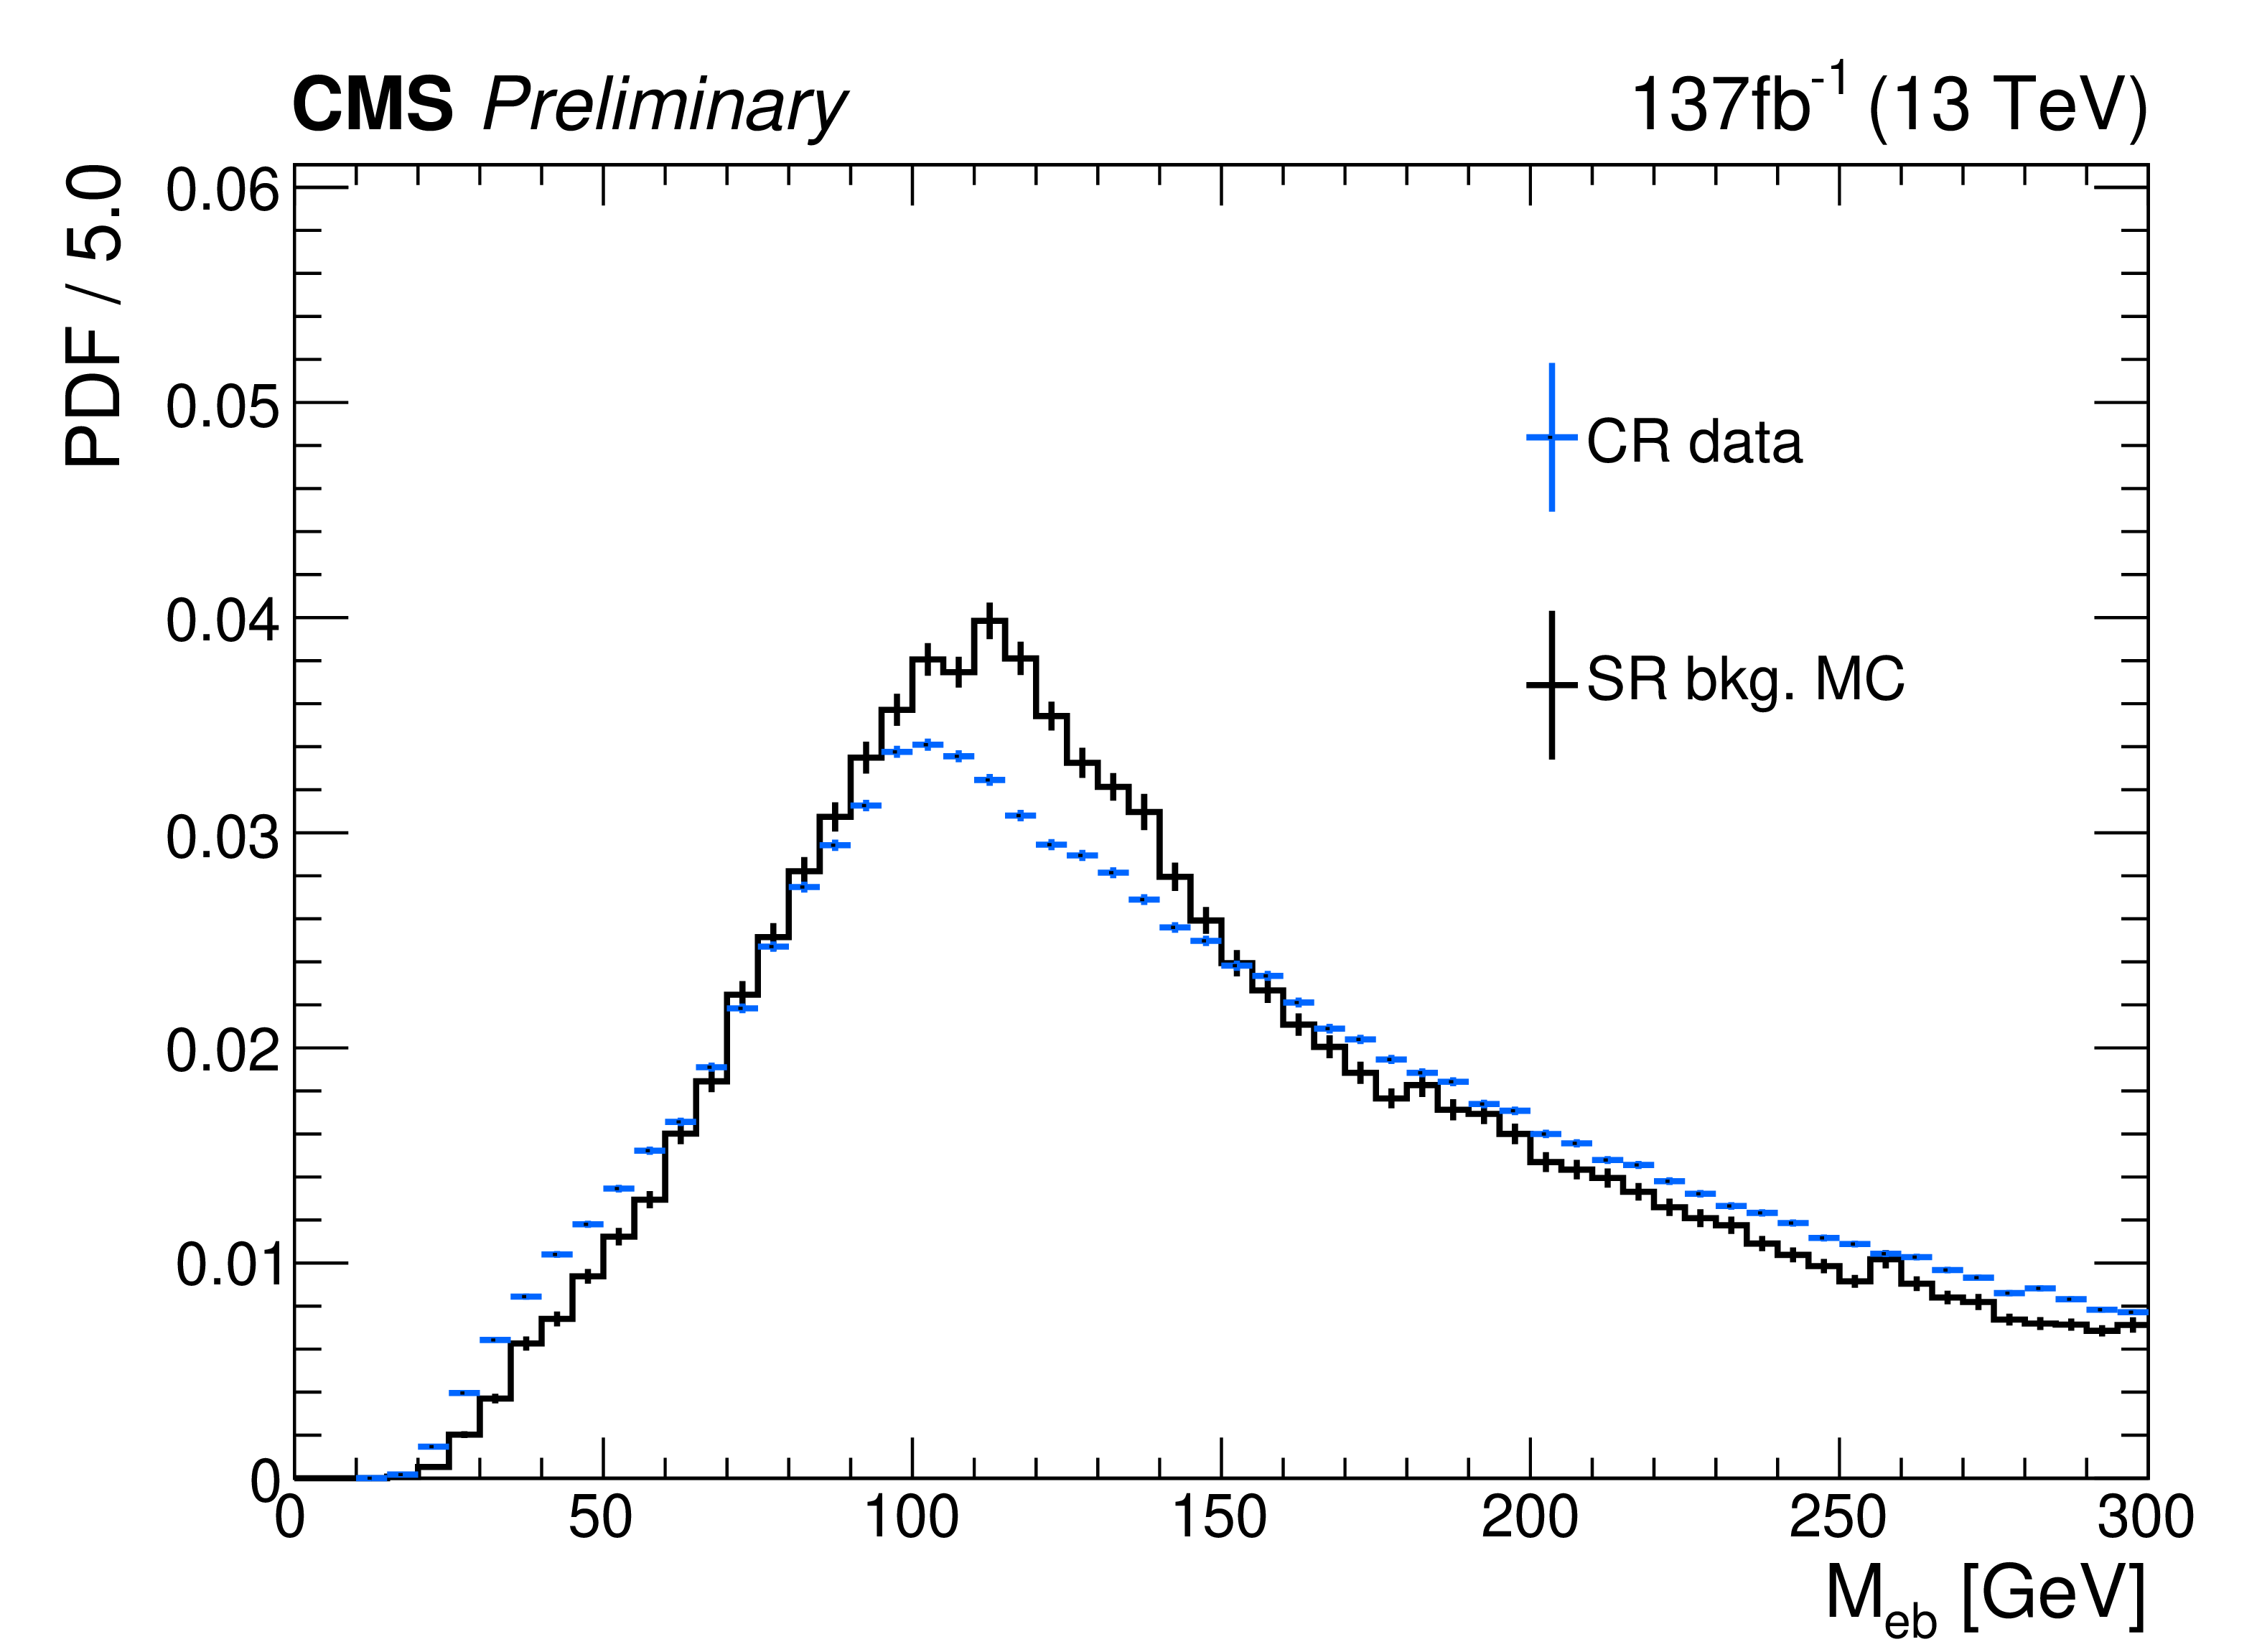
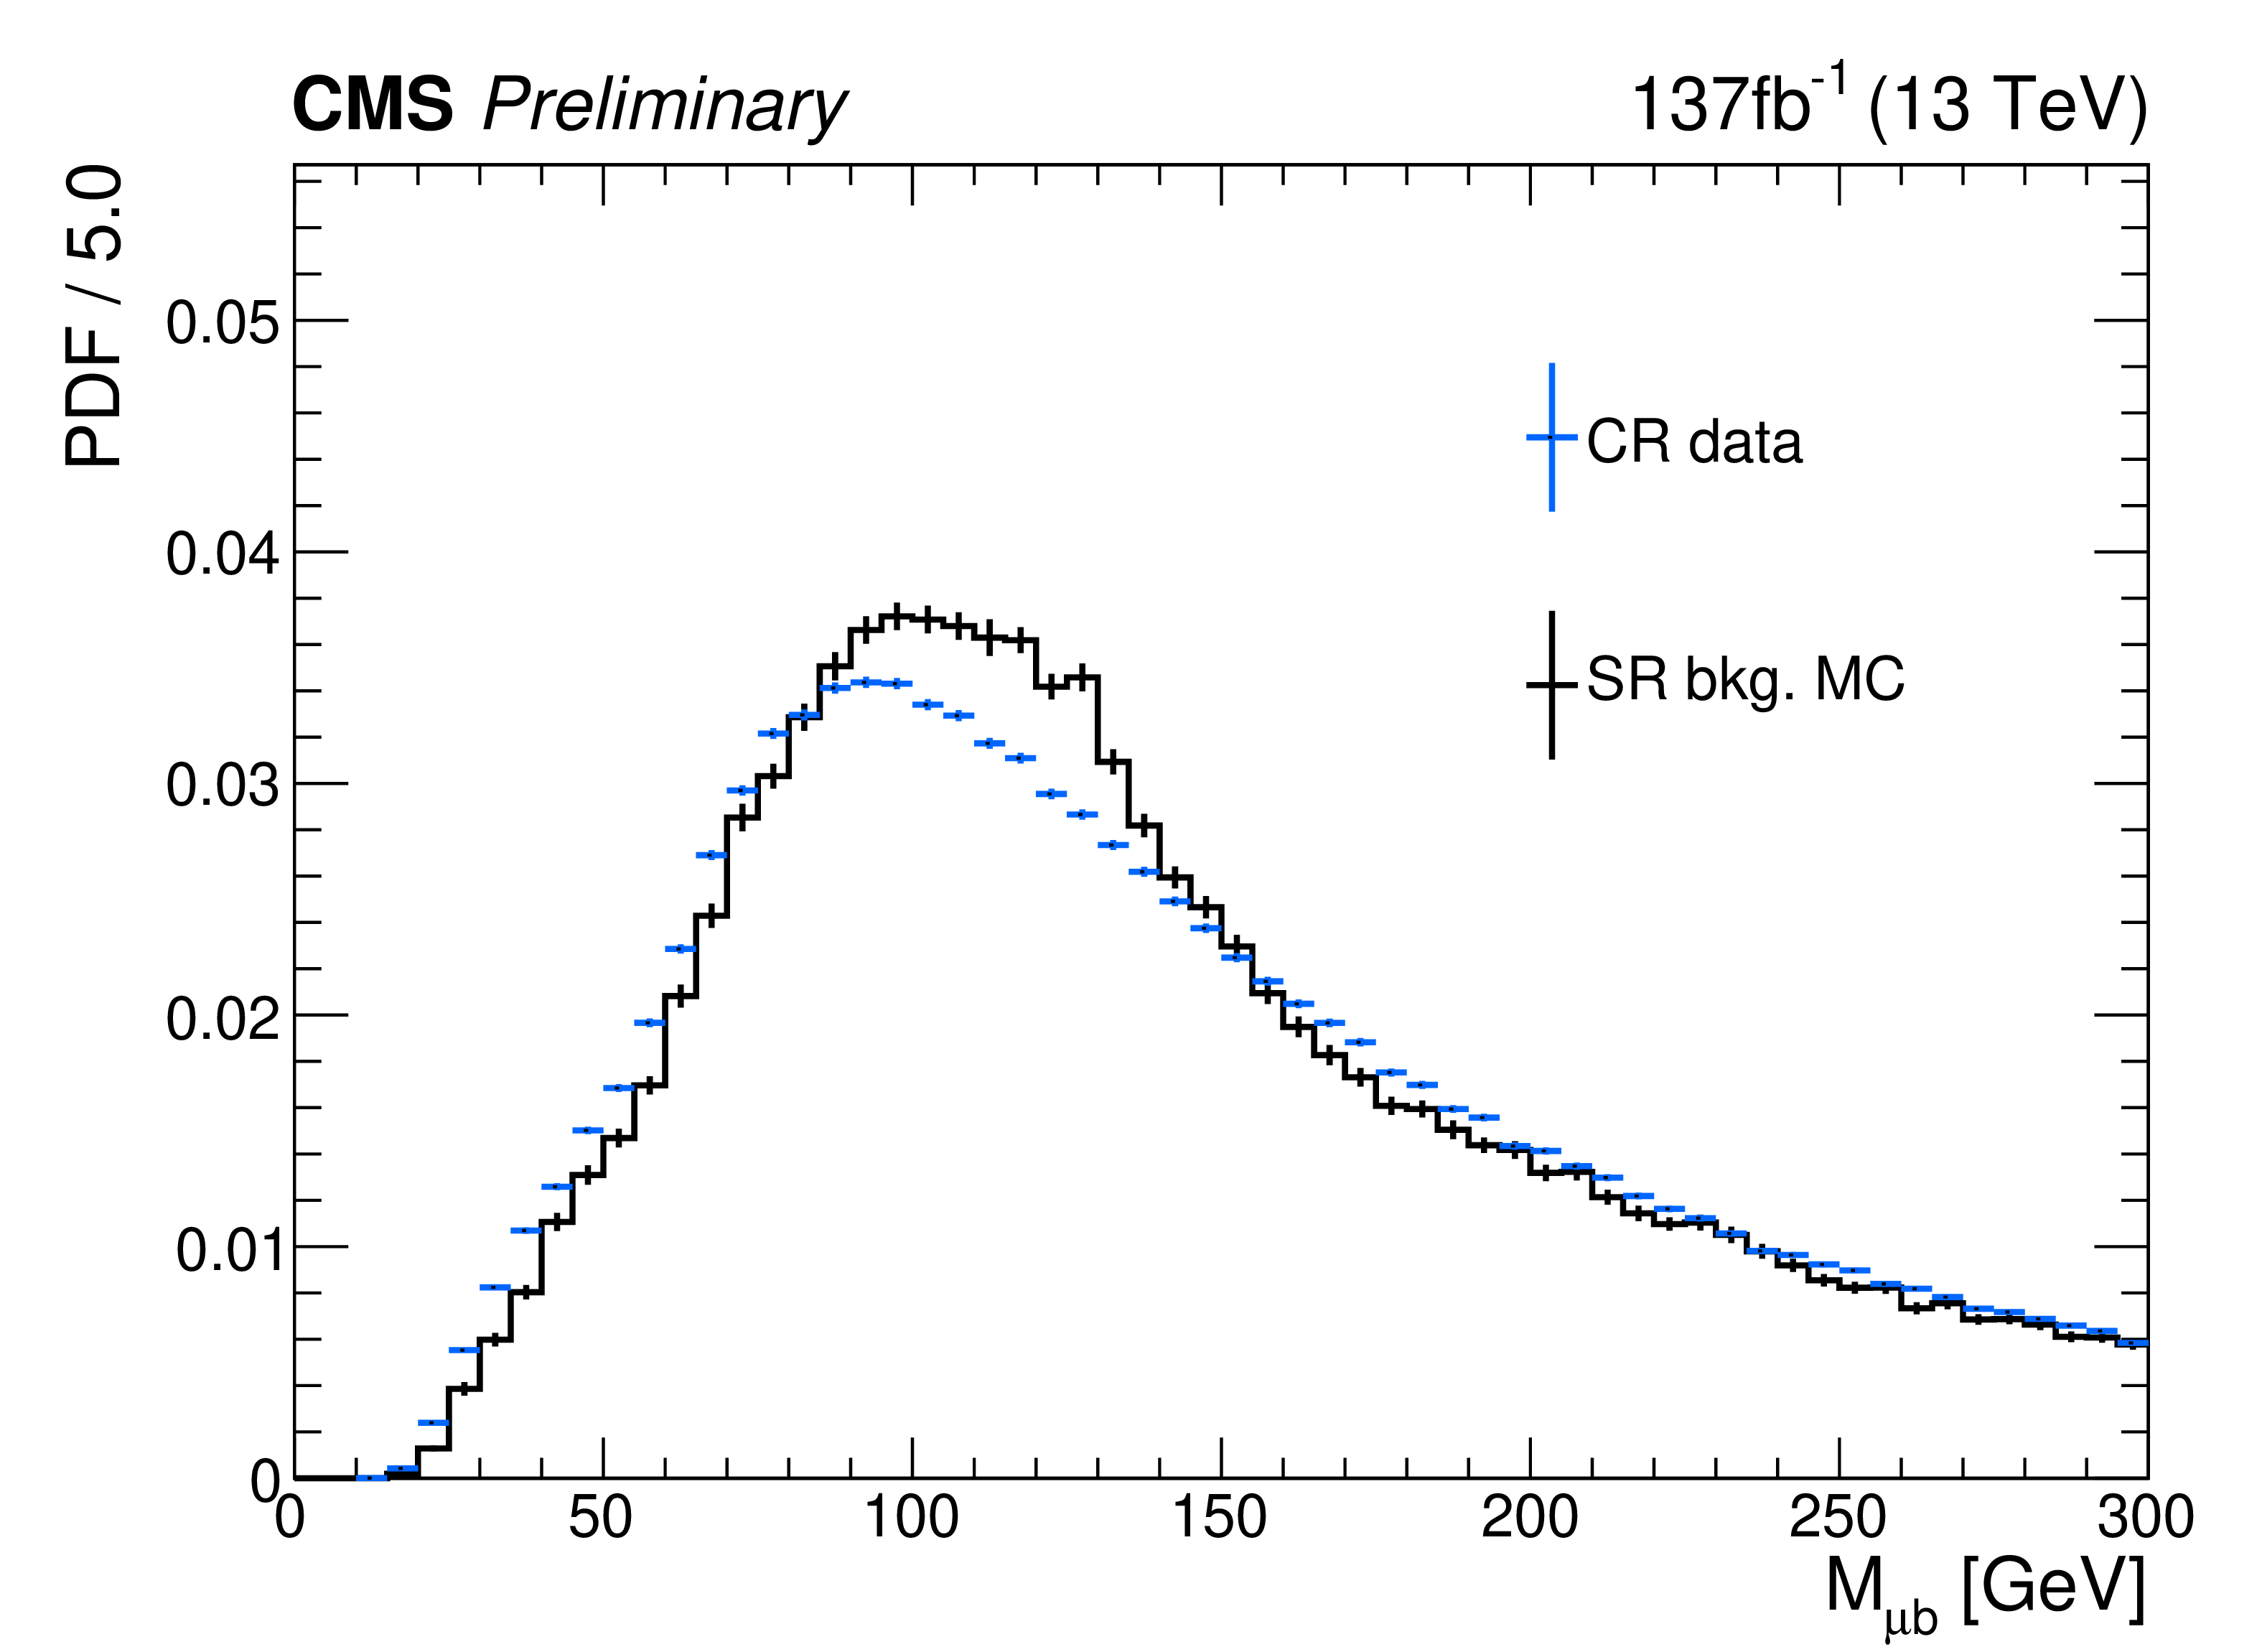
Distribution of the invariant mass $M_{lb}$ in the electron (left) and muon (right) channel. CR in the label means W+jets control region and SR in the label means the signal region. PDF in the y-axis title means probability density function. The upper two figures show that the W+jets enriched control region is background-like. The lower two figures show little difference between the simulated background in the signal region and the W+jets-enriched control region, which are considered as one of our systematic uncertainties. For signal-region simulated background samples, we consider the Drell-Yan, single top, diboson, and W+jets processes. |
png pdf |
Figure 3-a:
Distribution of the invariant mass $M_{lb}$ in the electron (left) and muon (right) channel. CR in the label means W+jets control region and SR in the label means the signal region. PDF in the y-axis title means probability density function. The upper two figures show that the W+jets enriched control region is background-like. The lower two figures show little difference between the simulated background in the signal region and the W+jets-enriched control region, which are considered as one of our systematic uncertainties. For signal-region simulated background samples, we consider the Drell-Yan, single top, diboson, and W+jets processes. |
png pdf |
Figure 3-b:
Distribution of the invariant mass $M_{lb}$ in the electron (left) and muon (right) channel. CR in the label means W+jets control region and SR in the label means the signal region. PDF in the y-axis title means probability density function. The upper two figures show that the W+jets enriched control region is background-like. The lower two figures show little difference between the simulated background in the signal region and the W+jets-enriched control region, which are considered as one of our systematic uncertainties. For signal-region simulated background samples, we consider the Drell-Yan, single top, diboson, and W+jets processes. |
png pdf |
Figure 3-c:
Distribution of the invariant mass $M_{lb}$ in the electron (left) and muon (right) channel. CR in the label means W+jets control region and SR in the label means the signal region. PDF in the y-axis title means probability density function. The upper two figures show that the W+jets enriched control region is background-like. The lower two figures show little difference between the simulated background in the signal region and the W+jets-enriched control region, which are considered as one of our systematic uncertainties. For signal-region simulated background samples, we consider the Drell-Yan, single top, diboson, and W+jets processes. |
png pdf |
Figure 3-d:
Distribution of the invariant mass $M_{lb}$ in the electron (left) and muon (right) channel. CR in the label means W+jets control region and SR in the label means the signal region. PDF in the y-axis title means probability density function. The upper two figures show that the W+jets enriched control region is background-like. The lower two figures show little difference between the simulated background in the signal region and the W+jets-enriched control region, which are considered as one of our systematic uncertainties. For signal-region simulated background samples, we consider the Drell-Yan, single top, diboson, and W+jets processes. |
png pdf |
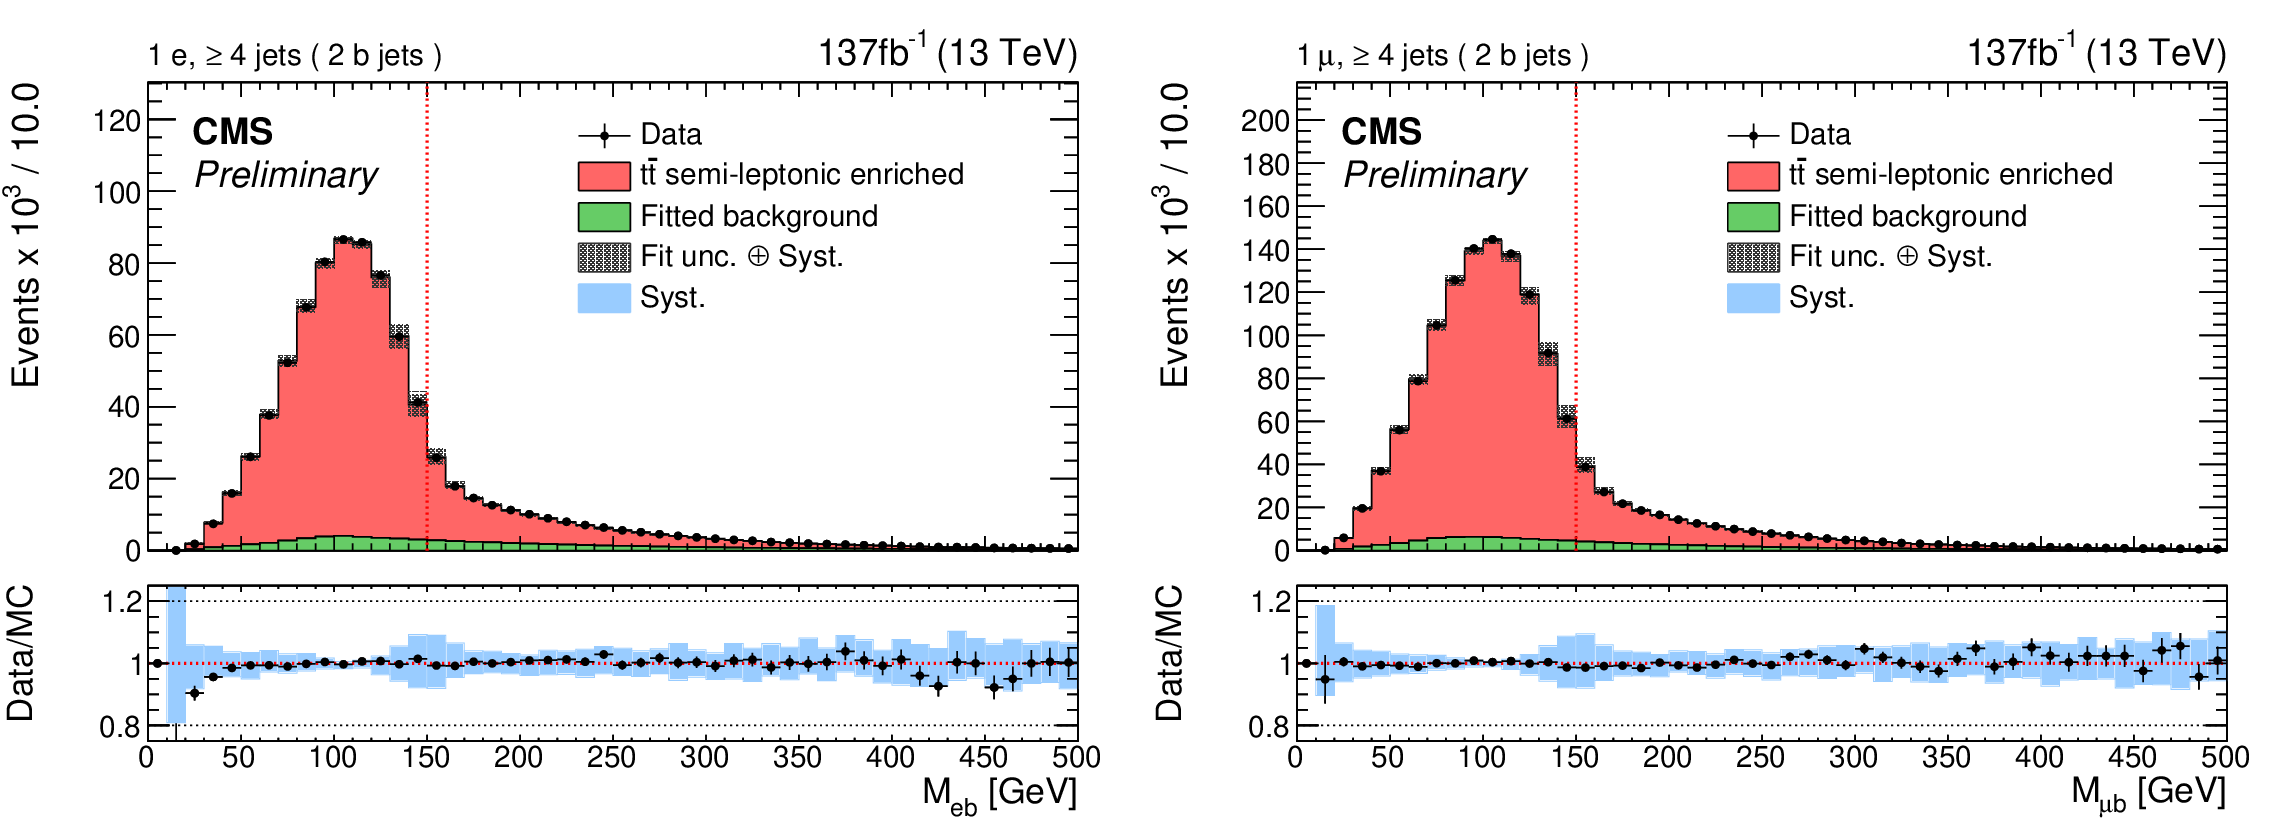
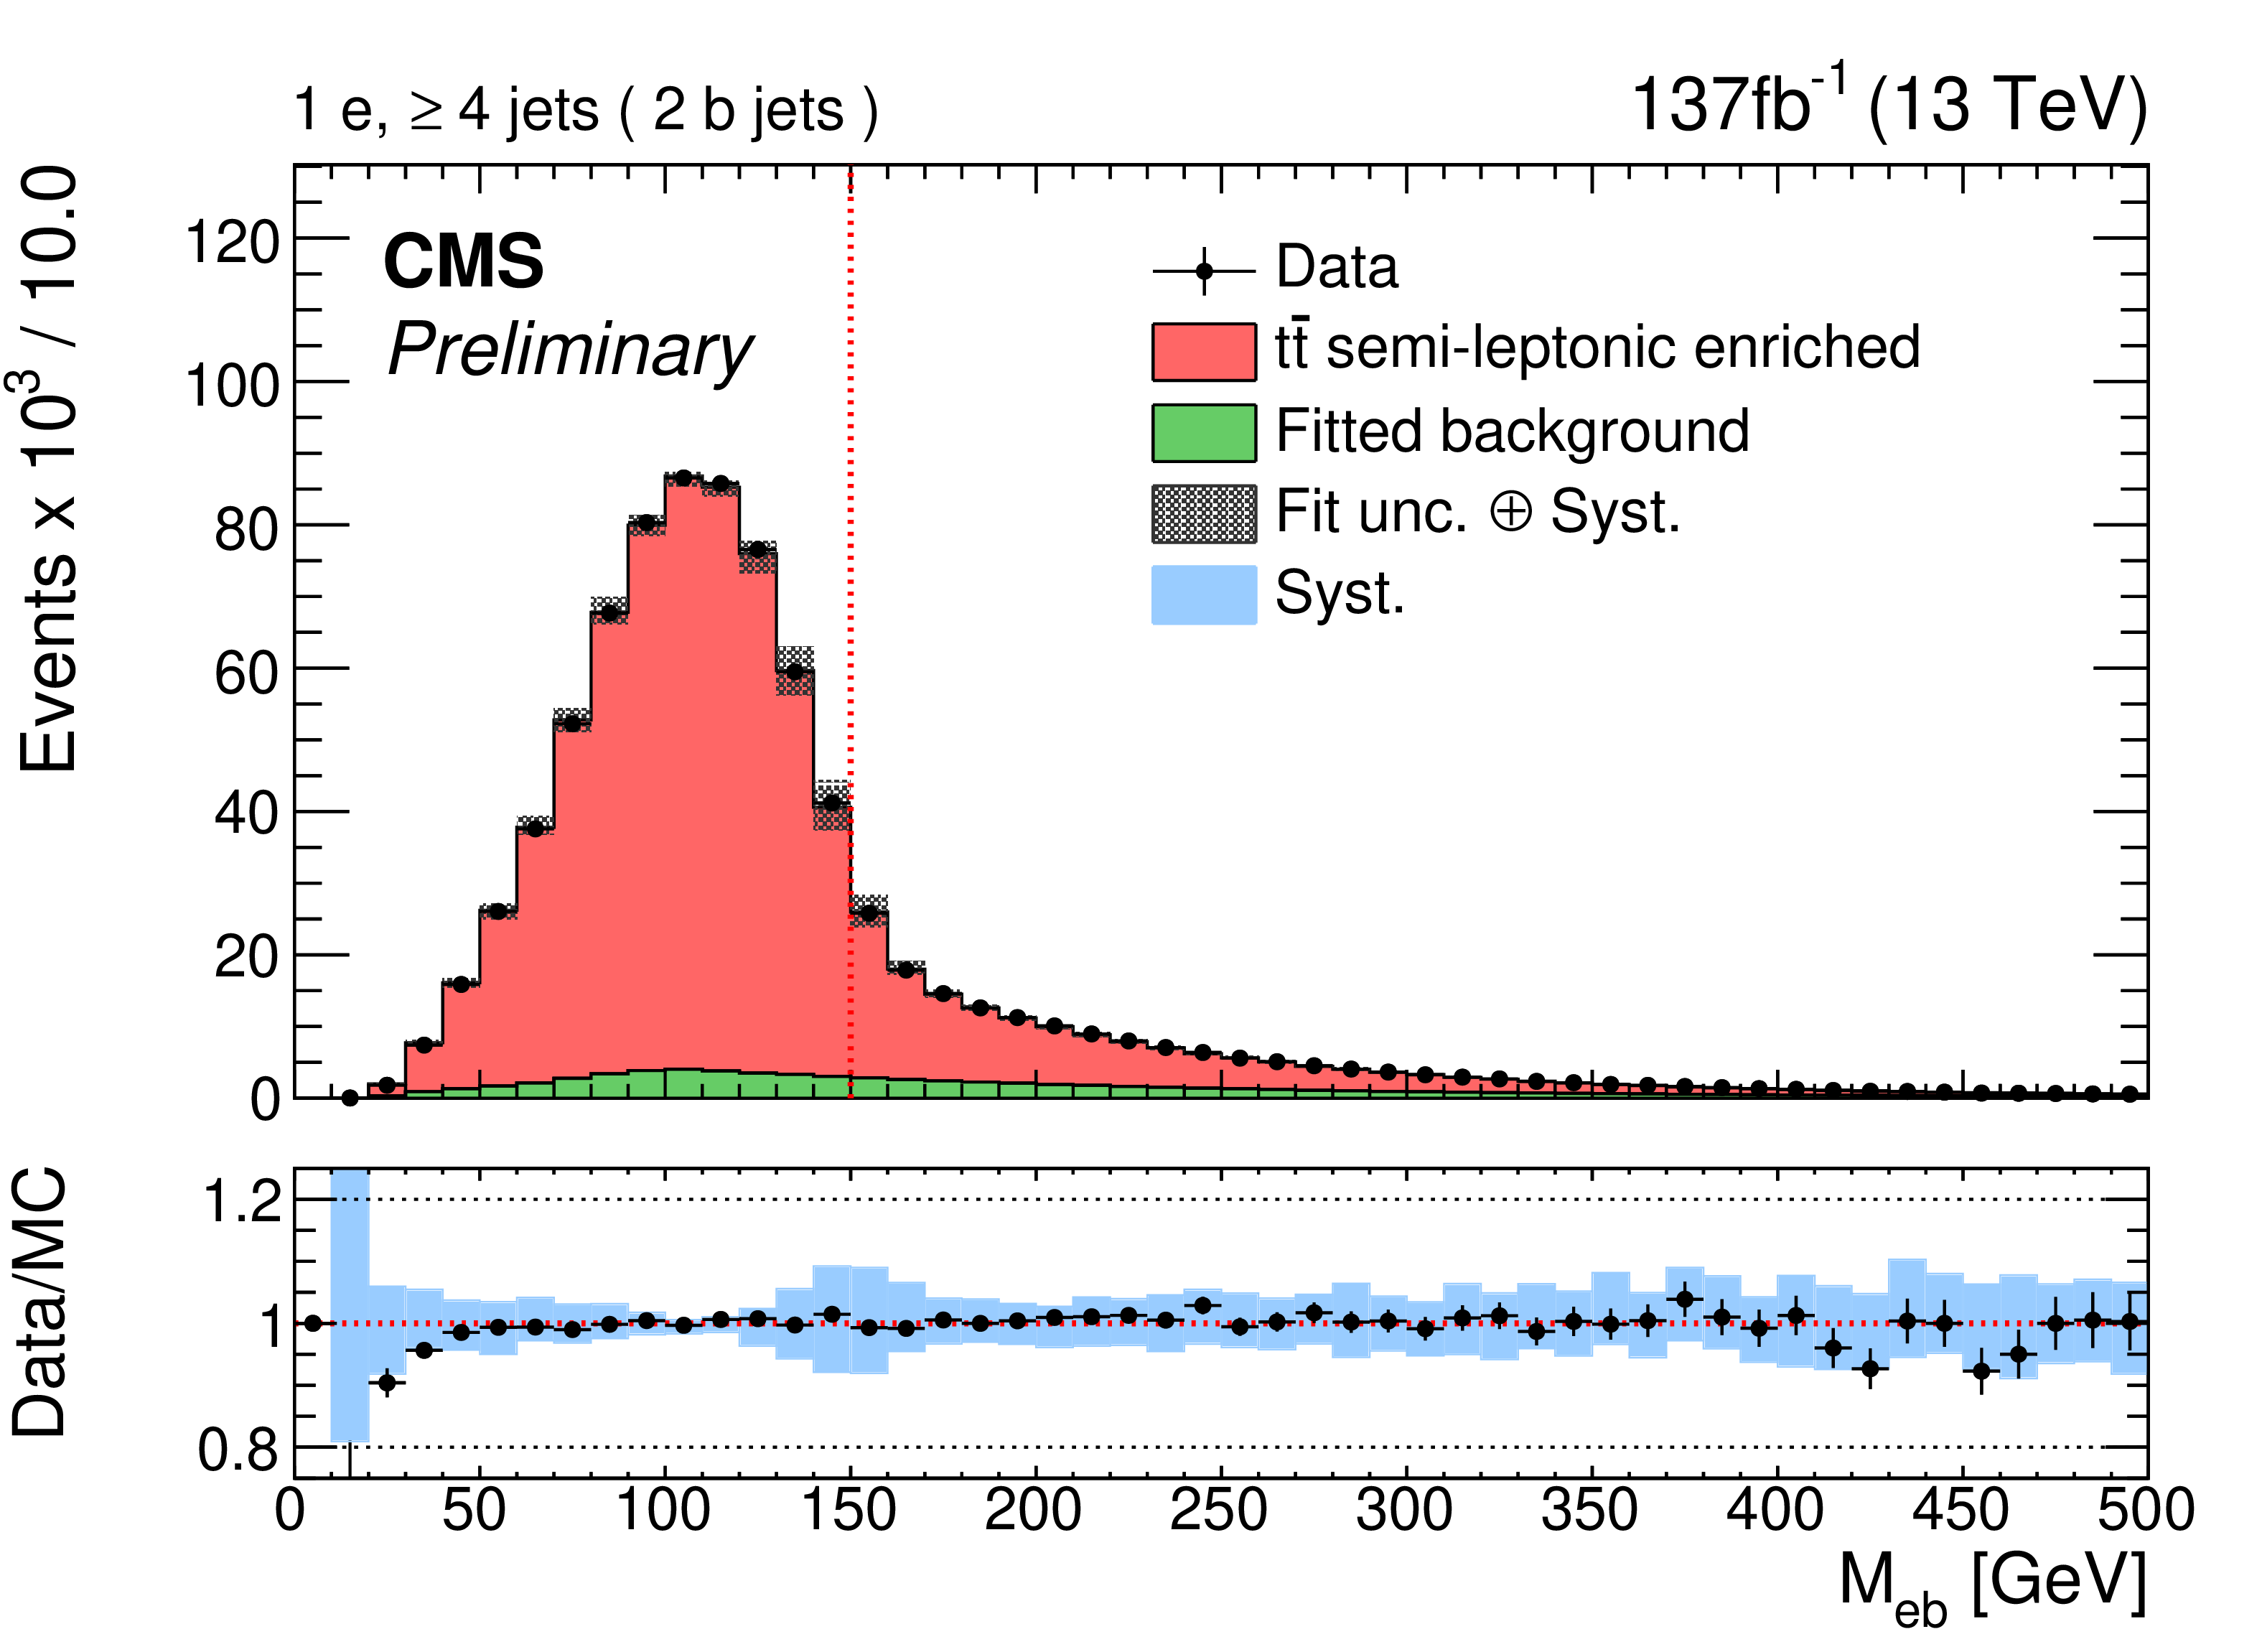
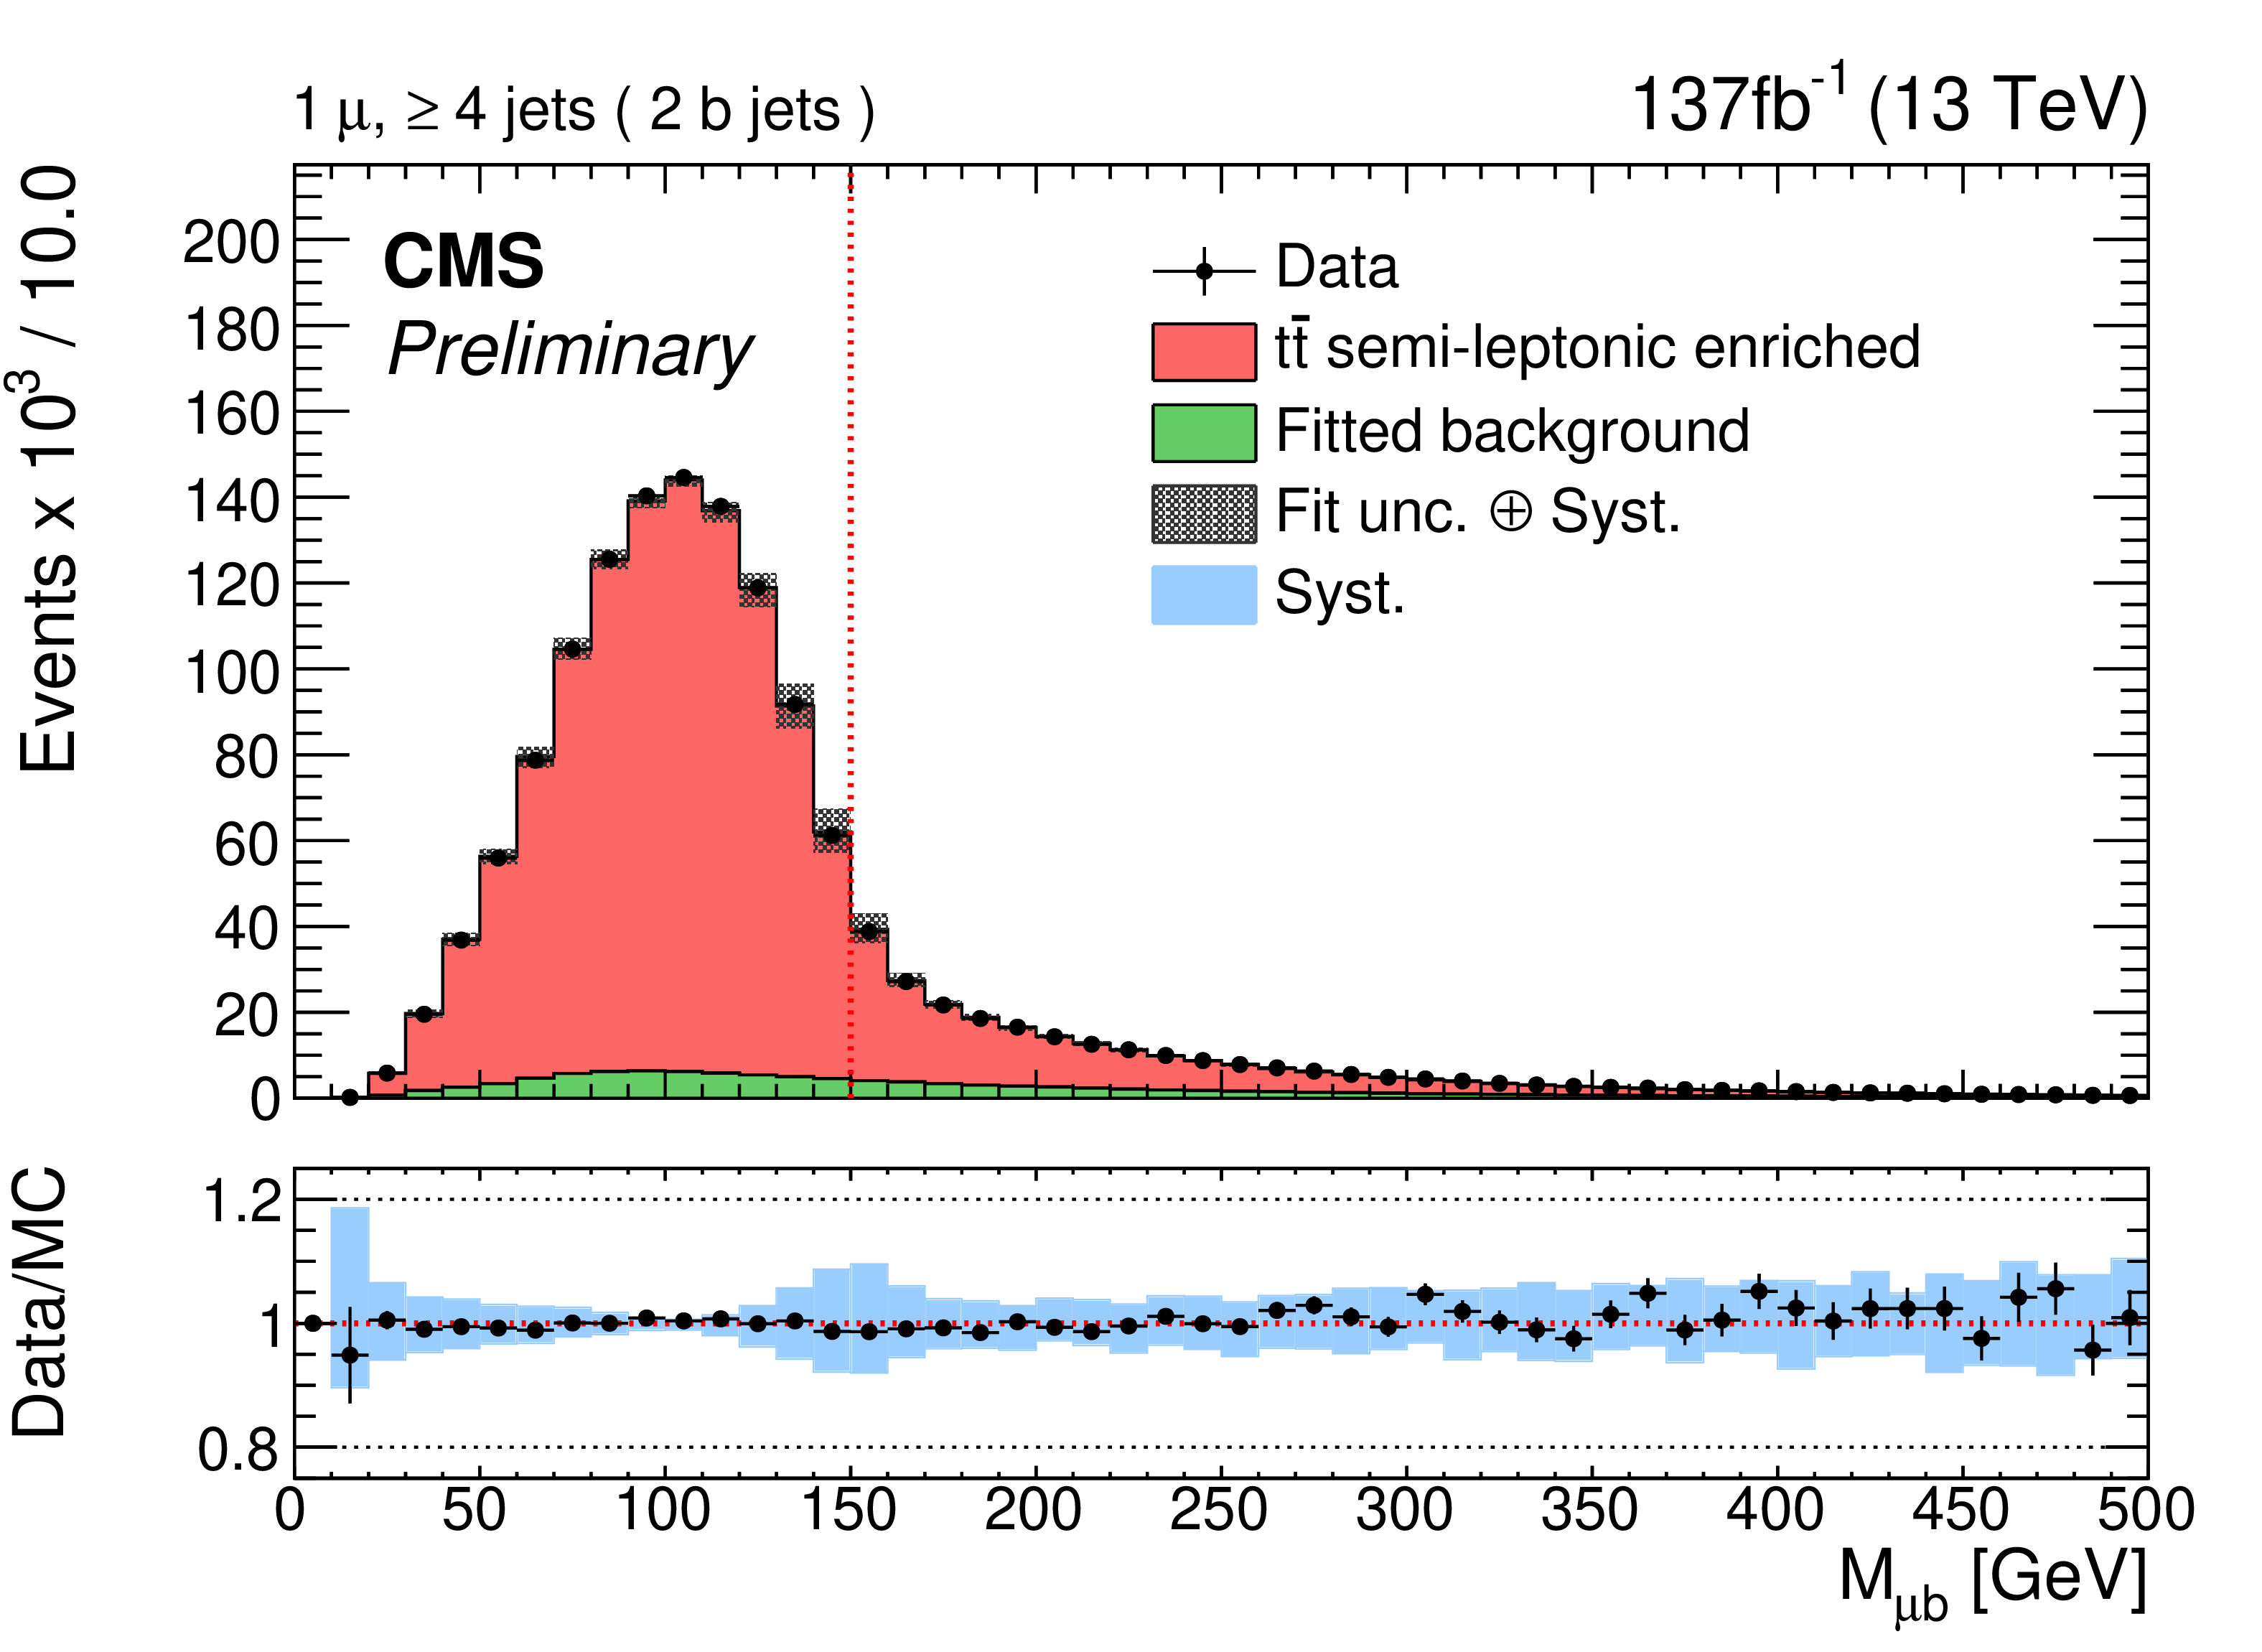
Figure 4:
The distribution of the invariant mass $M_{lb}$ of the leptonically decaying top quark candidates in the electron (left) and muon (right) channels. The vertical bars on the data points in the lower panels indicate the statistical uncertainties in the data and the hatched bands indicate the statistical uncertainties combined with the systematic uncertainties in the simulation. The blue bands represent the systematic uncertainties in the expected yield in the simulation, including all sources of systematic uncertainty (Section 5), except for the uncertainty due to changing the background template. |
png pdf |
Figure 4-a:
The distribution of the invariant mass $M_{lb}$ of the leptonically decaying top quark candidates in the electron (left) and muon (right) channels. The vertical bars on the data points in the lower panels indicate the statistical uncertainties in the data and the hatched bands indicate the statistical uncertainties combined with the systematic uncertainties in the simulation. The blue bands represent the systematic uncertainties in the expected yield in the simulation, including all sources of systematic uncertainty (Section 5), except for the uncertainty due to changing the background template. |
png pdf |
Figure 4-b:
The distribution of the invariant mass $M_{lb}$ of the leptonically decaying top quark candidates in the electron (left) and muon (right) channels. The vertical bars on the data points in the lower panels indicate the statistical uncertainties in the data and the hatched bands indicate the statistical uncertainties combined with the systematic uncertainties in the simulation. The blue bands represent the systematic uncertainties in the expected yield in the simulation, including all sources of systematic uncertainty (Section 5), except for the uncertainty due to changing the background template. |
png pdf |
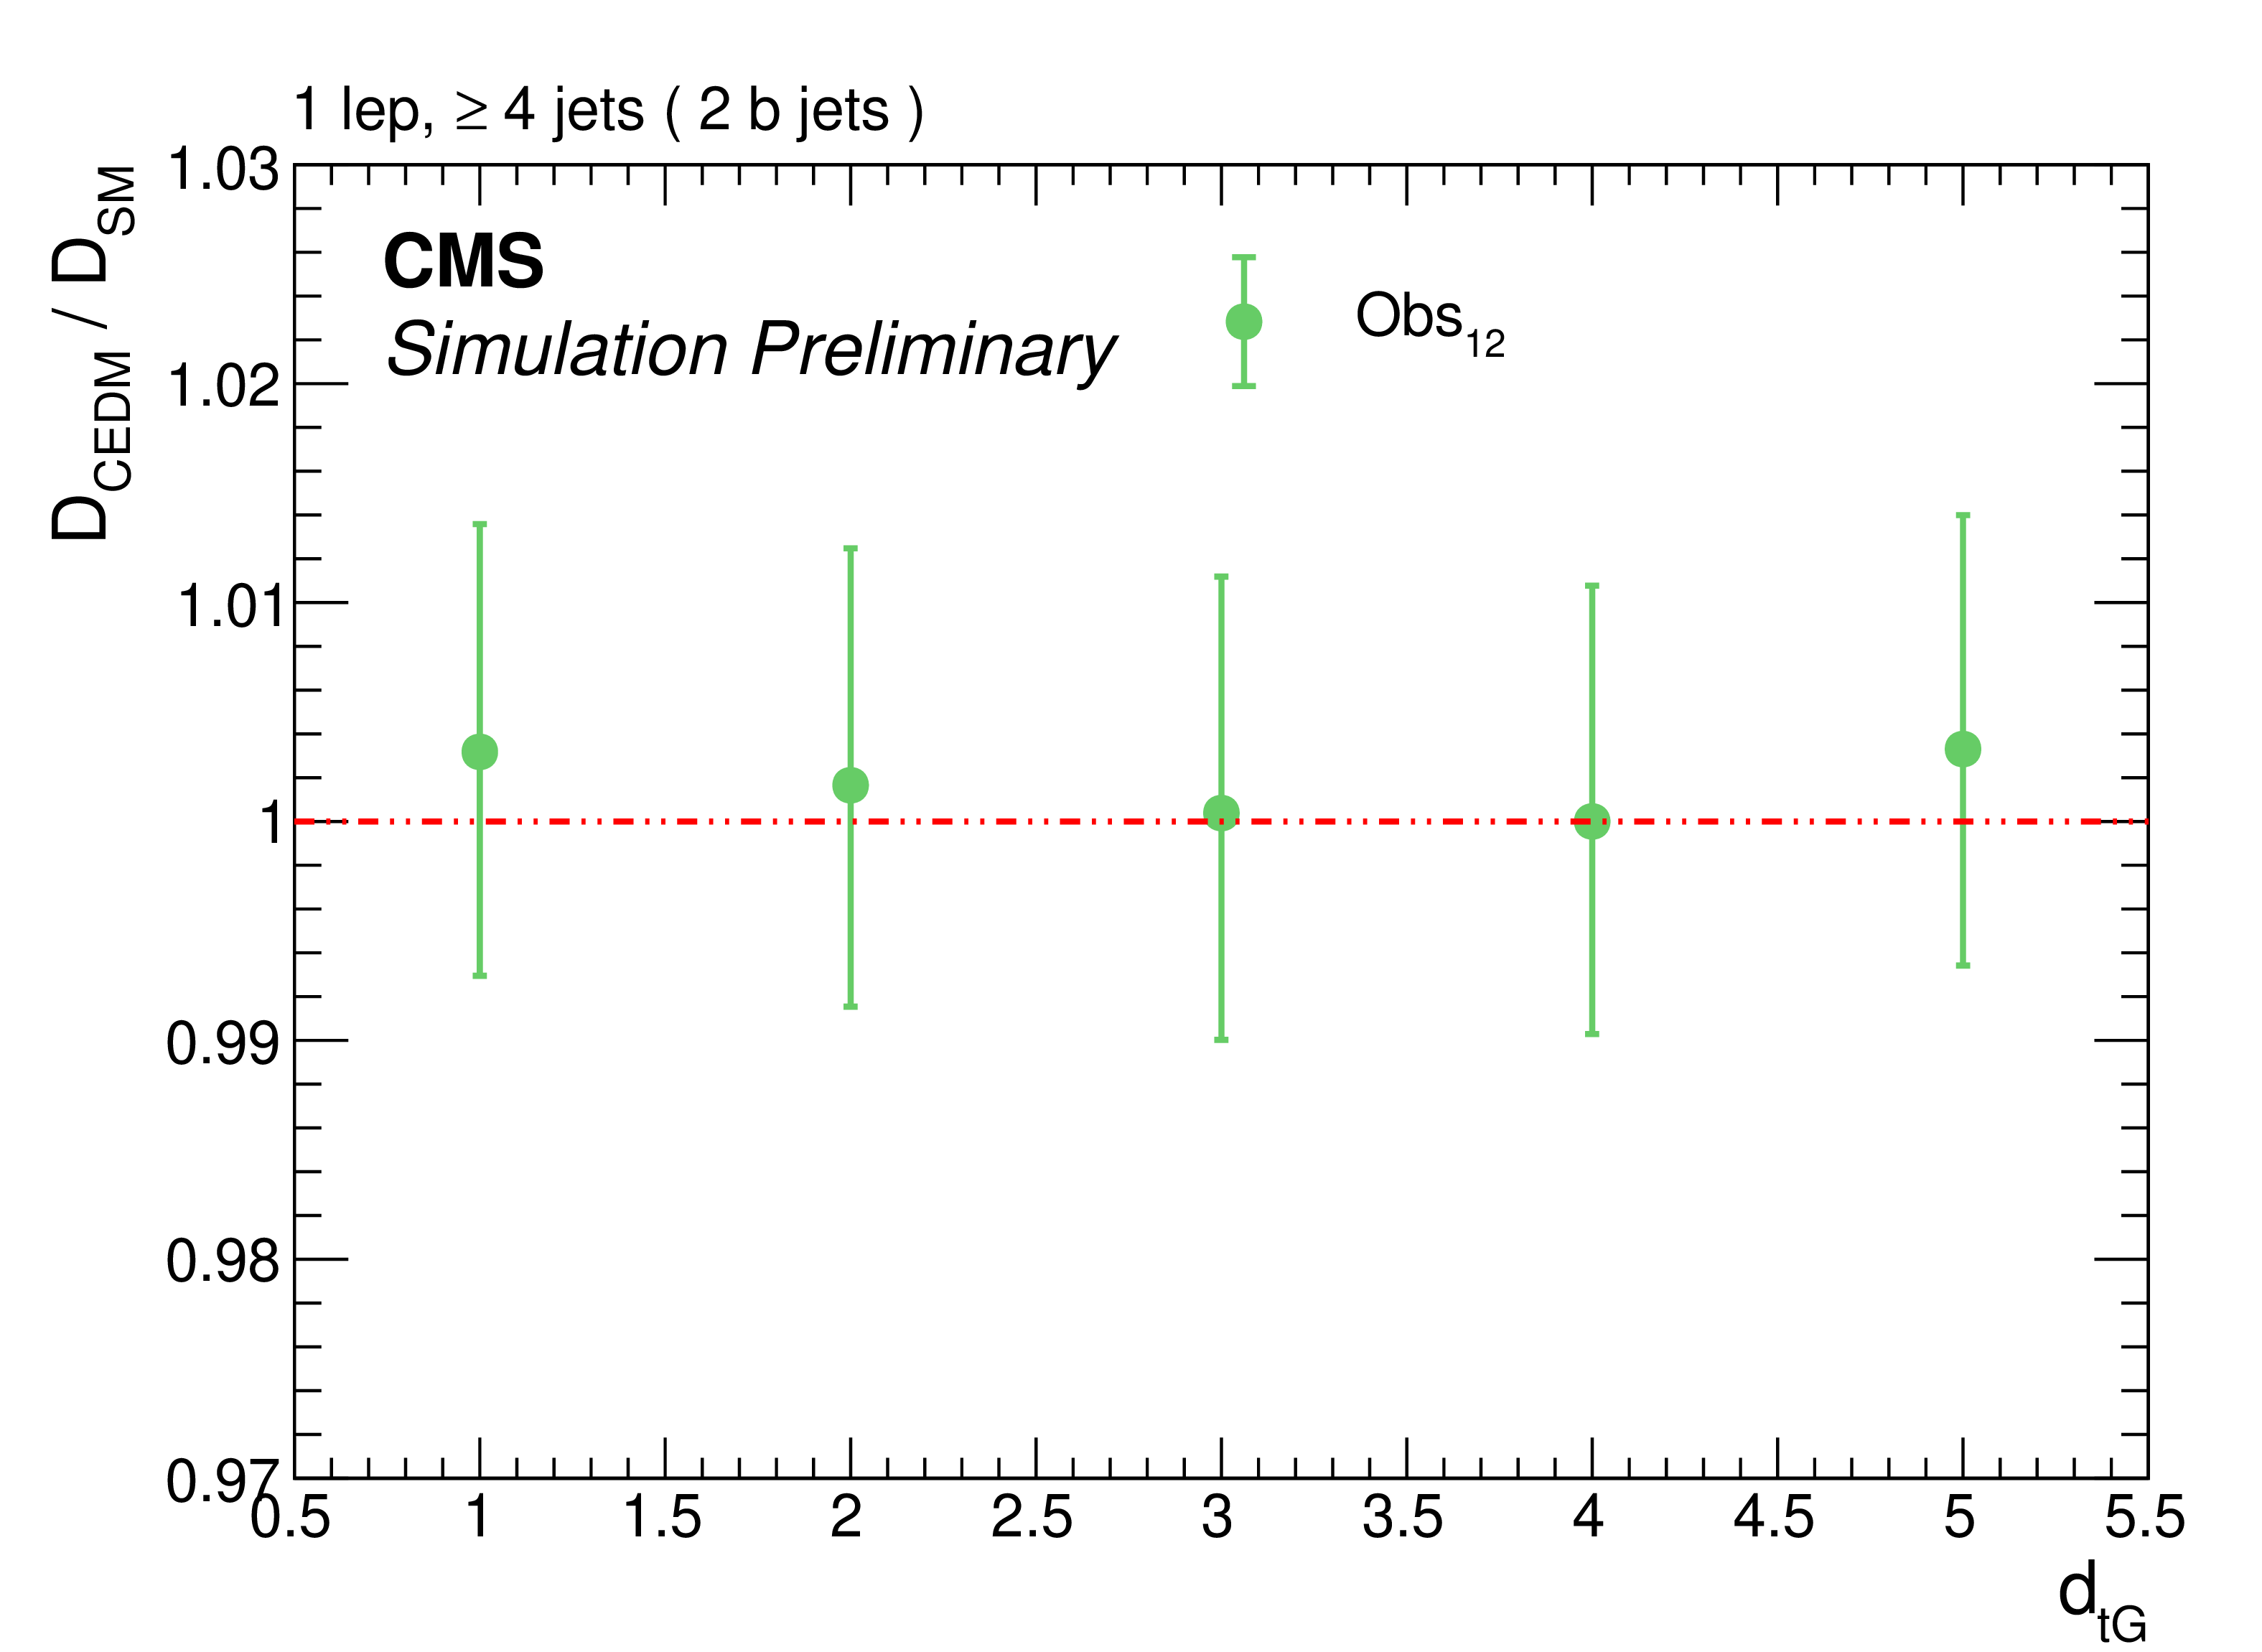
Figure 5:
Model dependency for the dilution factor $D_{12}$. The points show the ratio between the value obtained by re-weigthing events according to different CEDM models with the baseline results obtained in the SM simulation. It should be noted that, although all the points are correlated, the deviations from unity are much smaller than the statistical uncertainty represented by the error bars. |
png pdf |
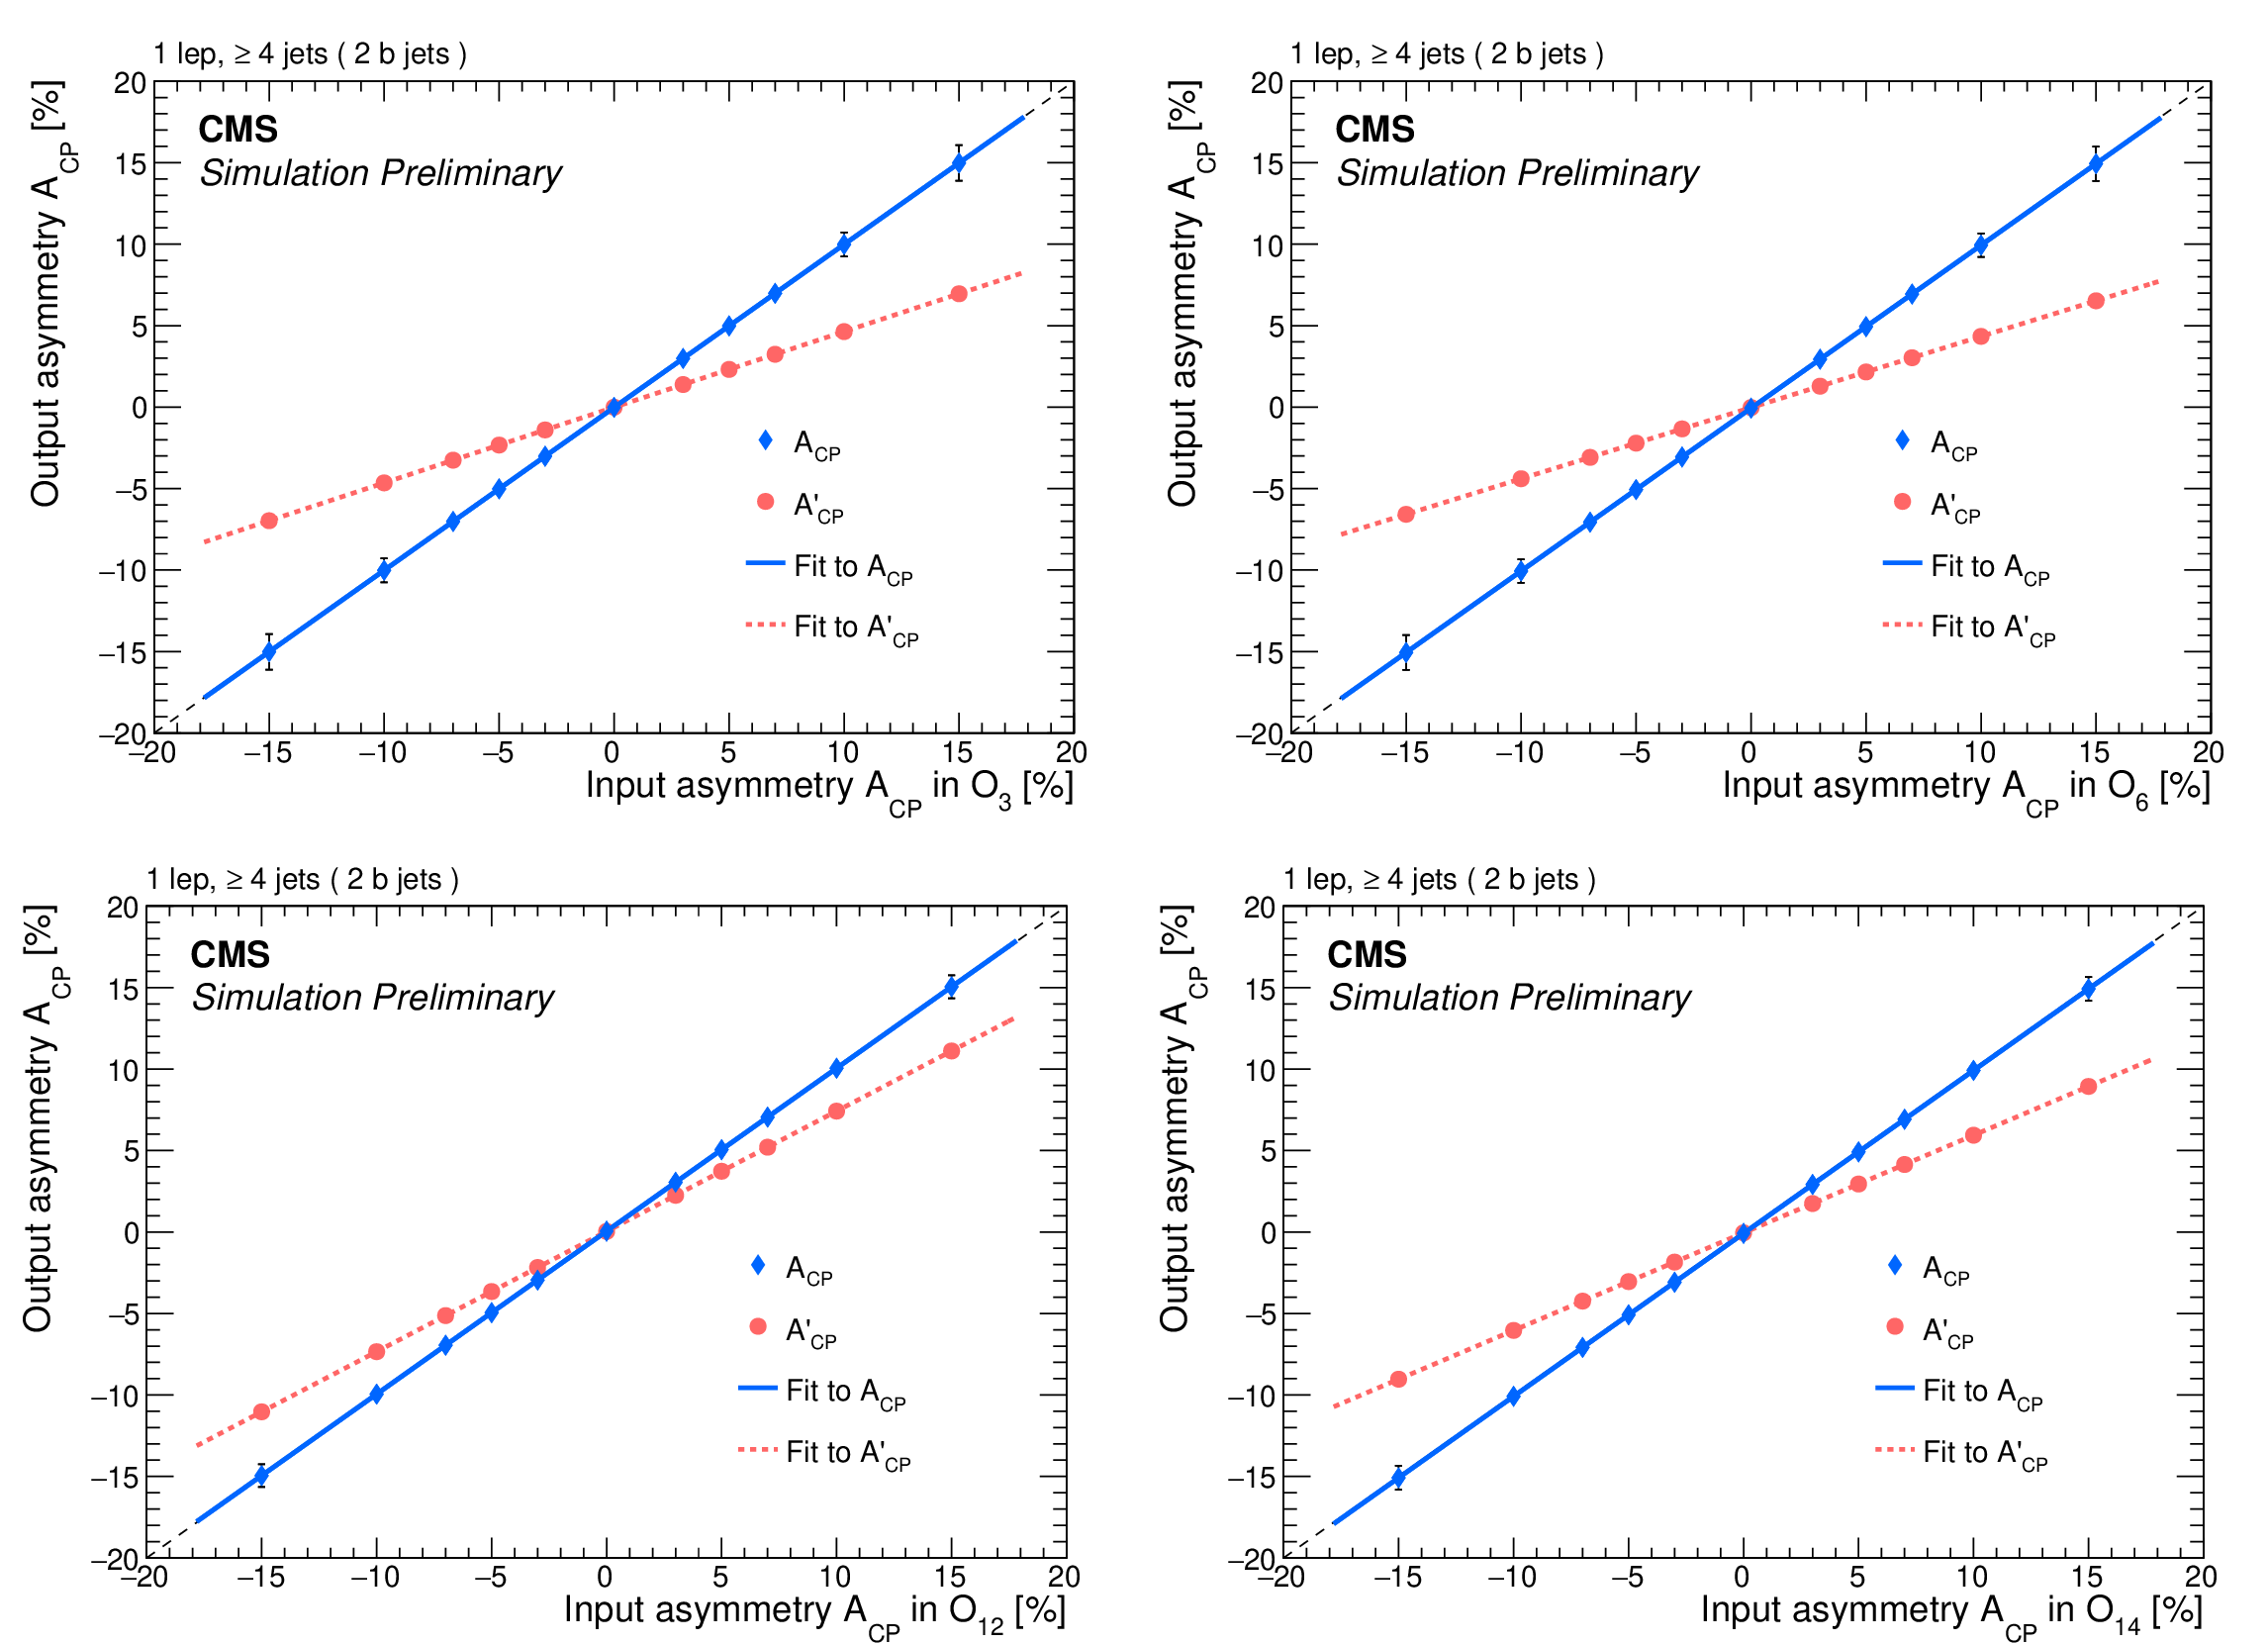
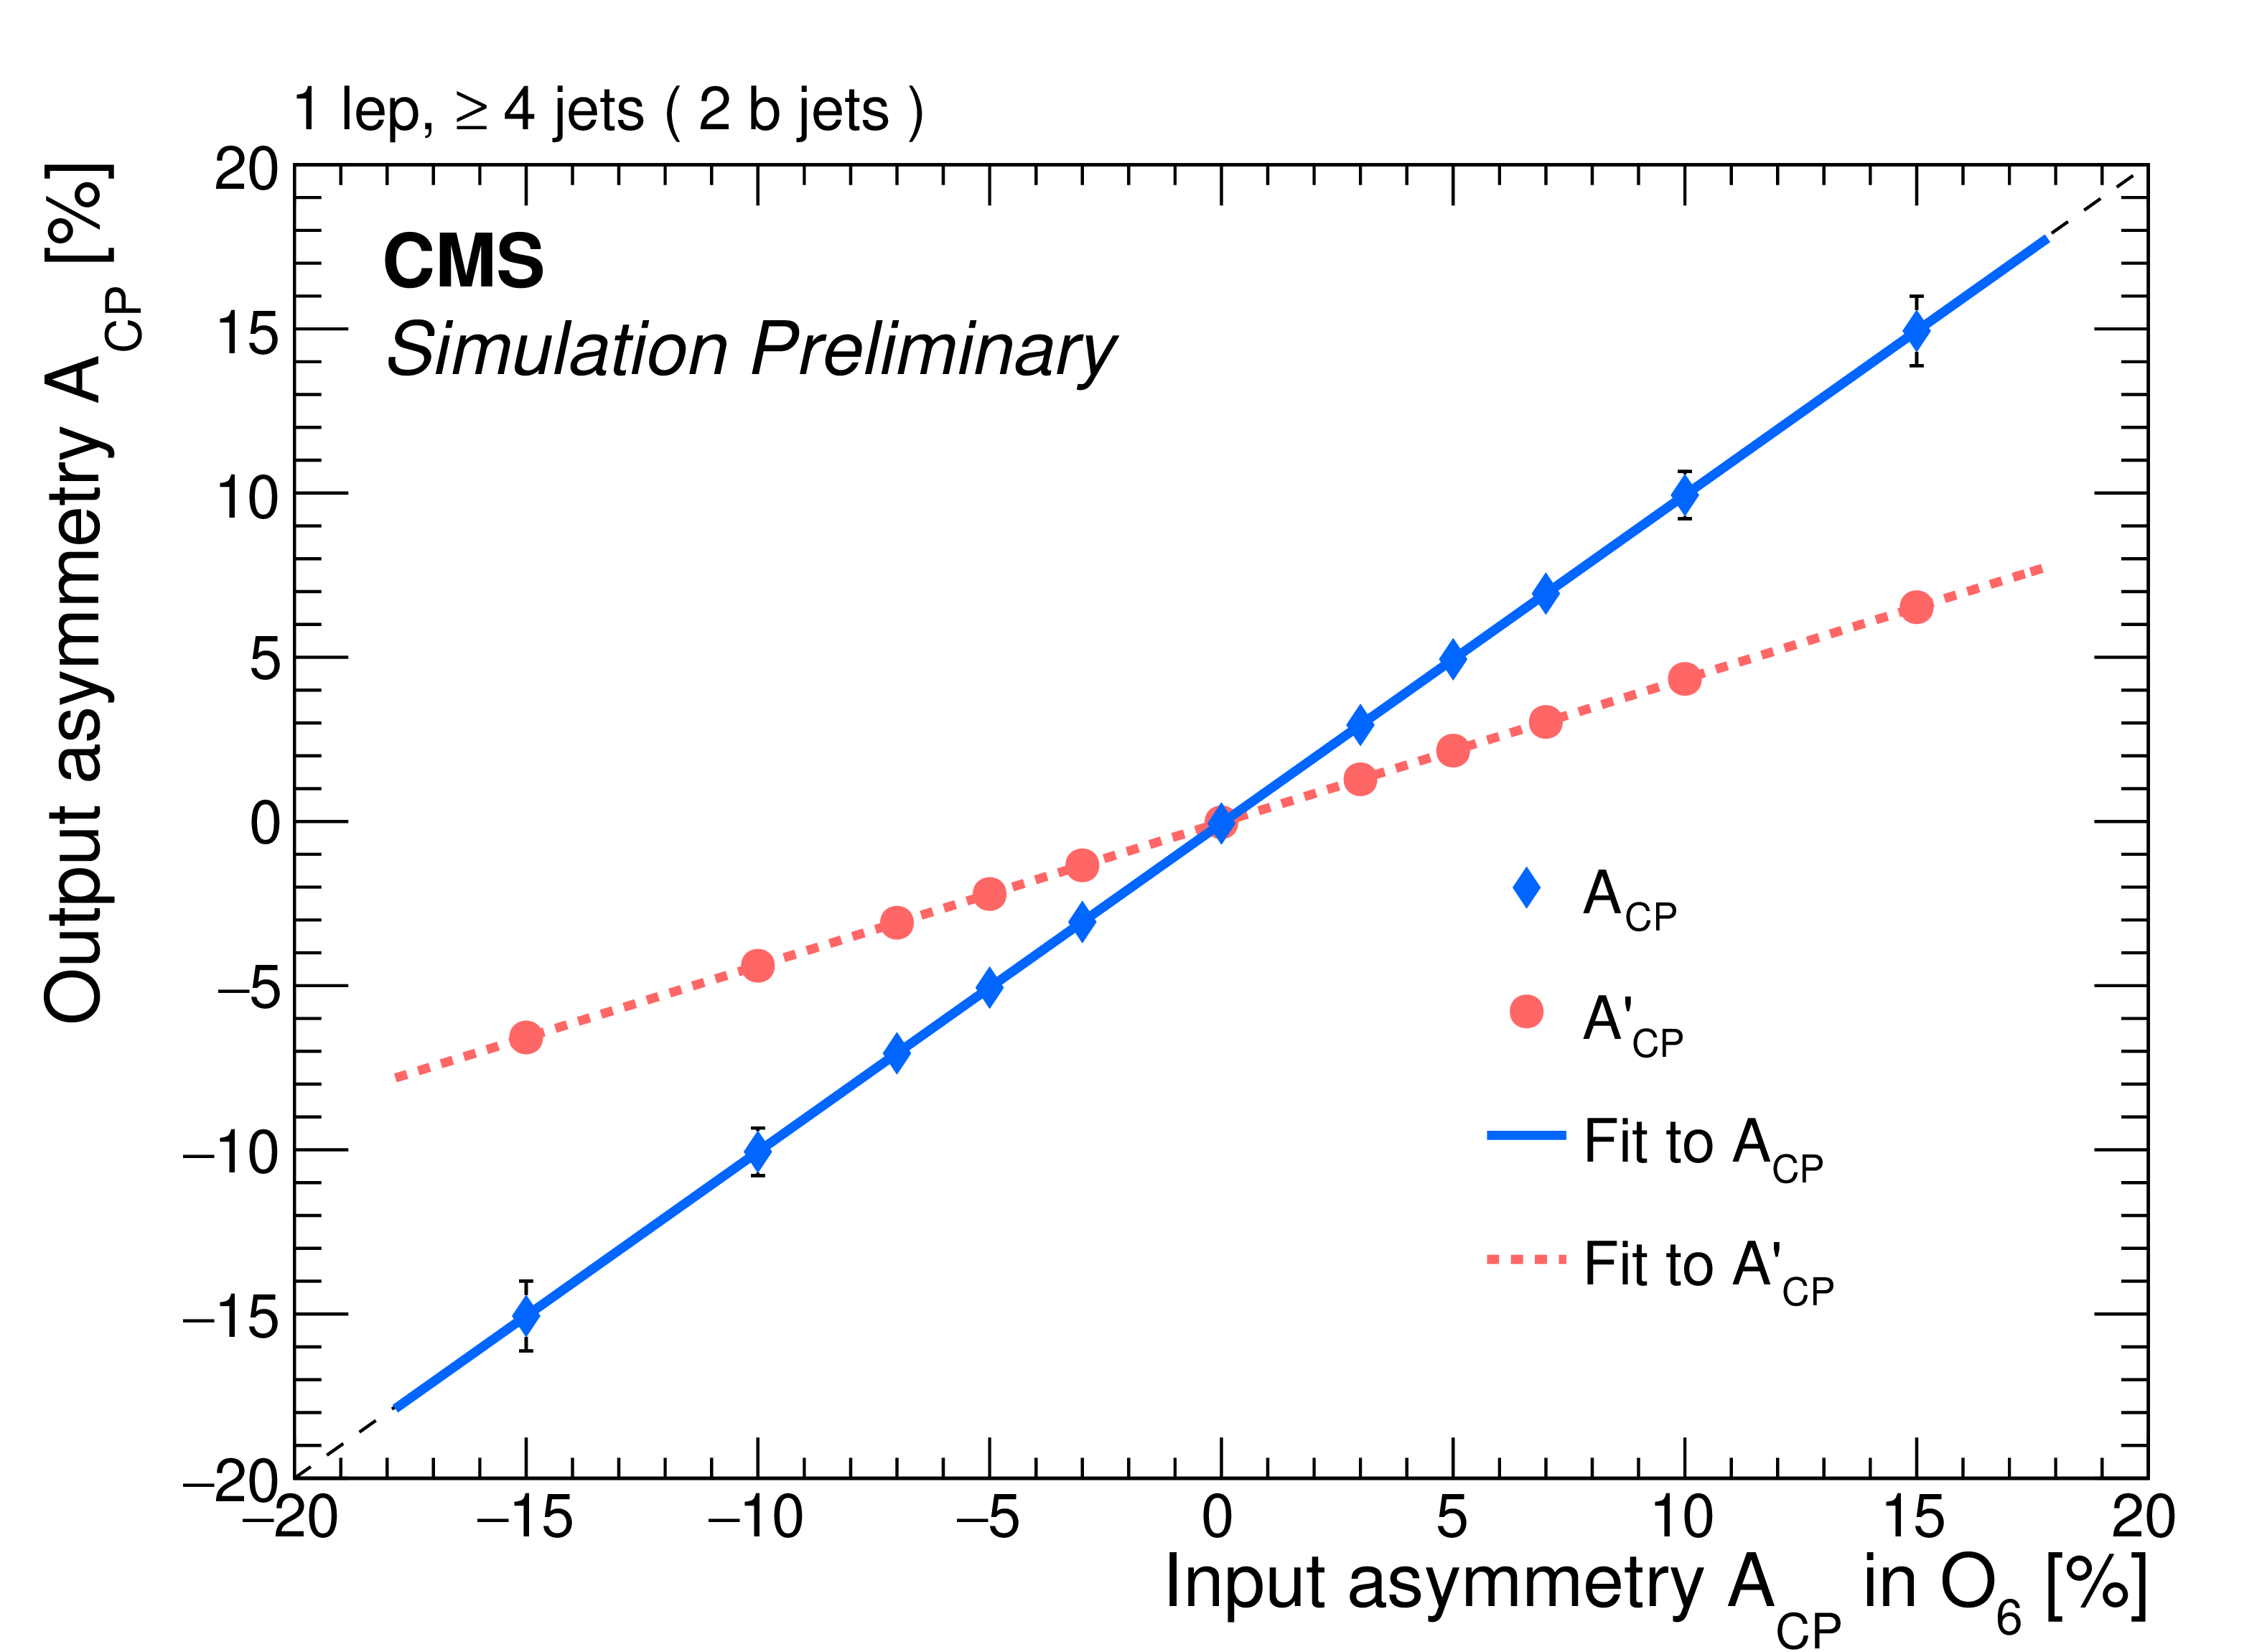
Figure 6:
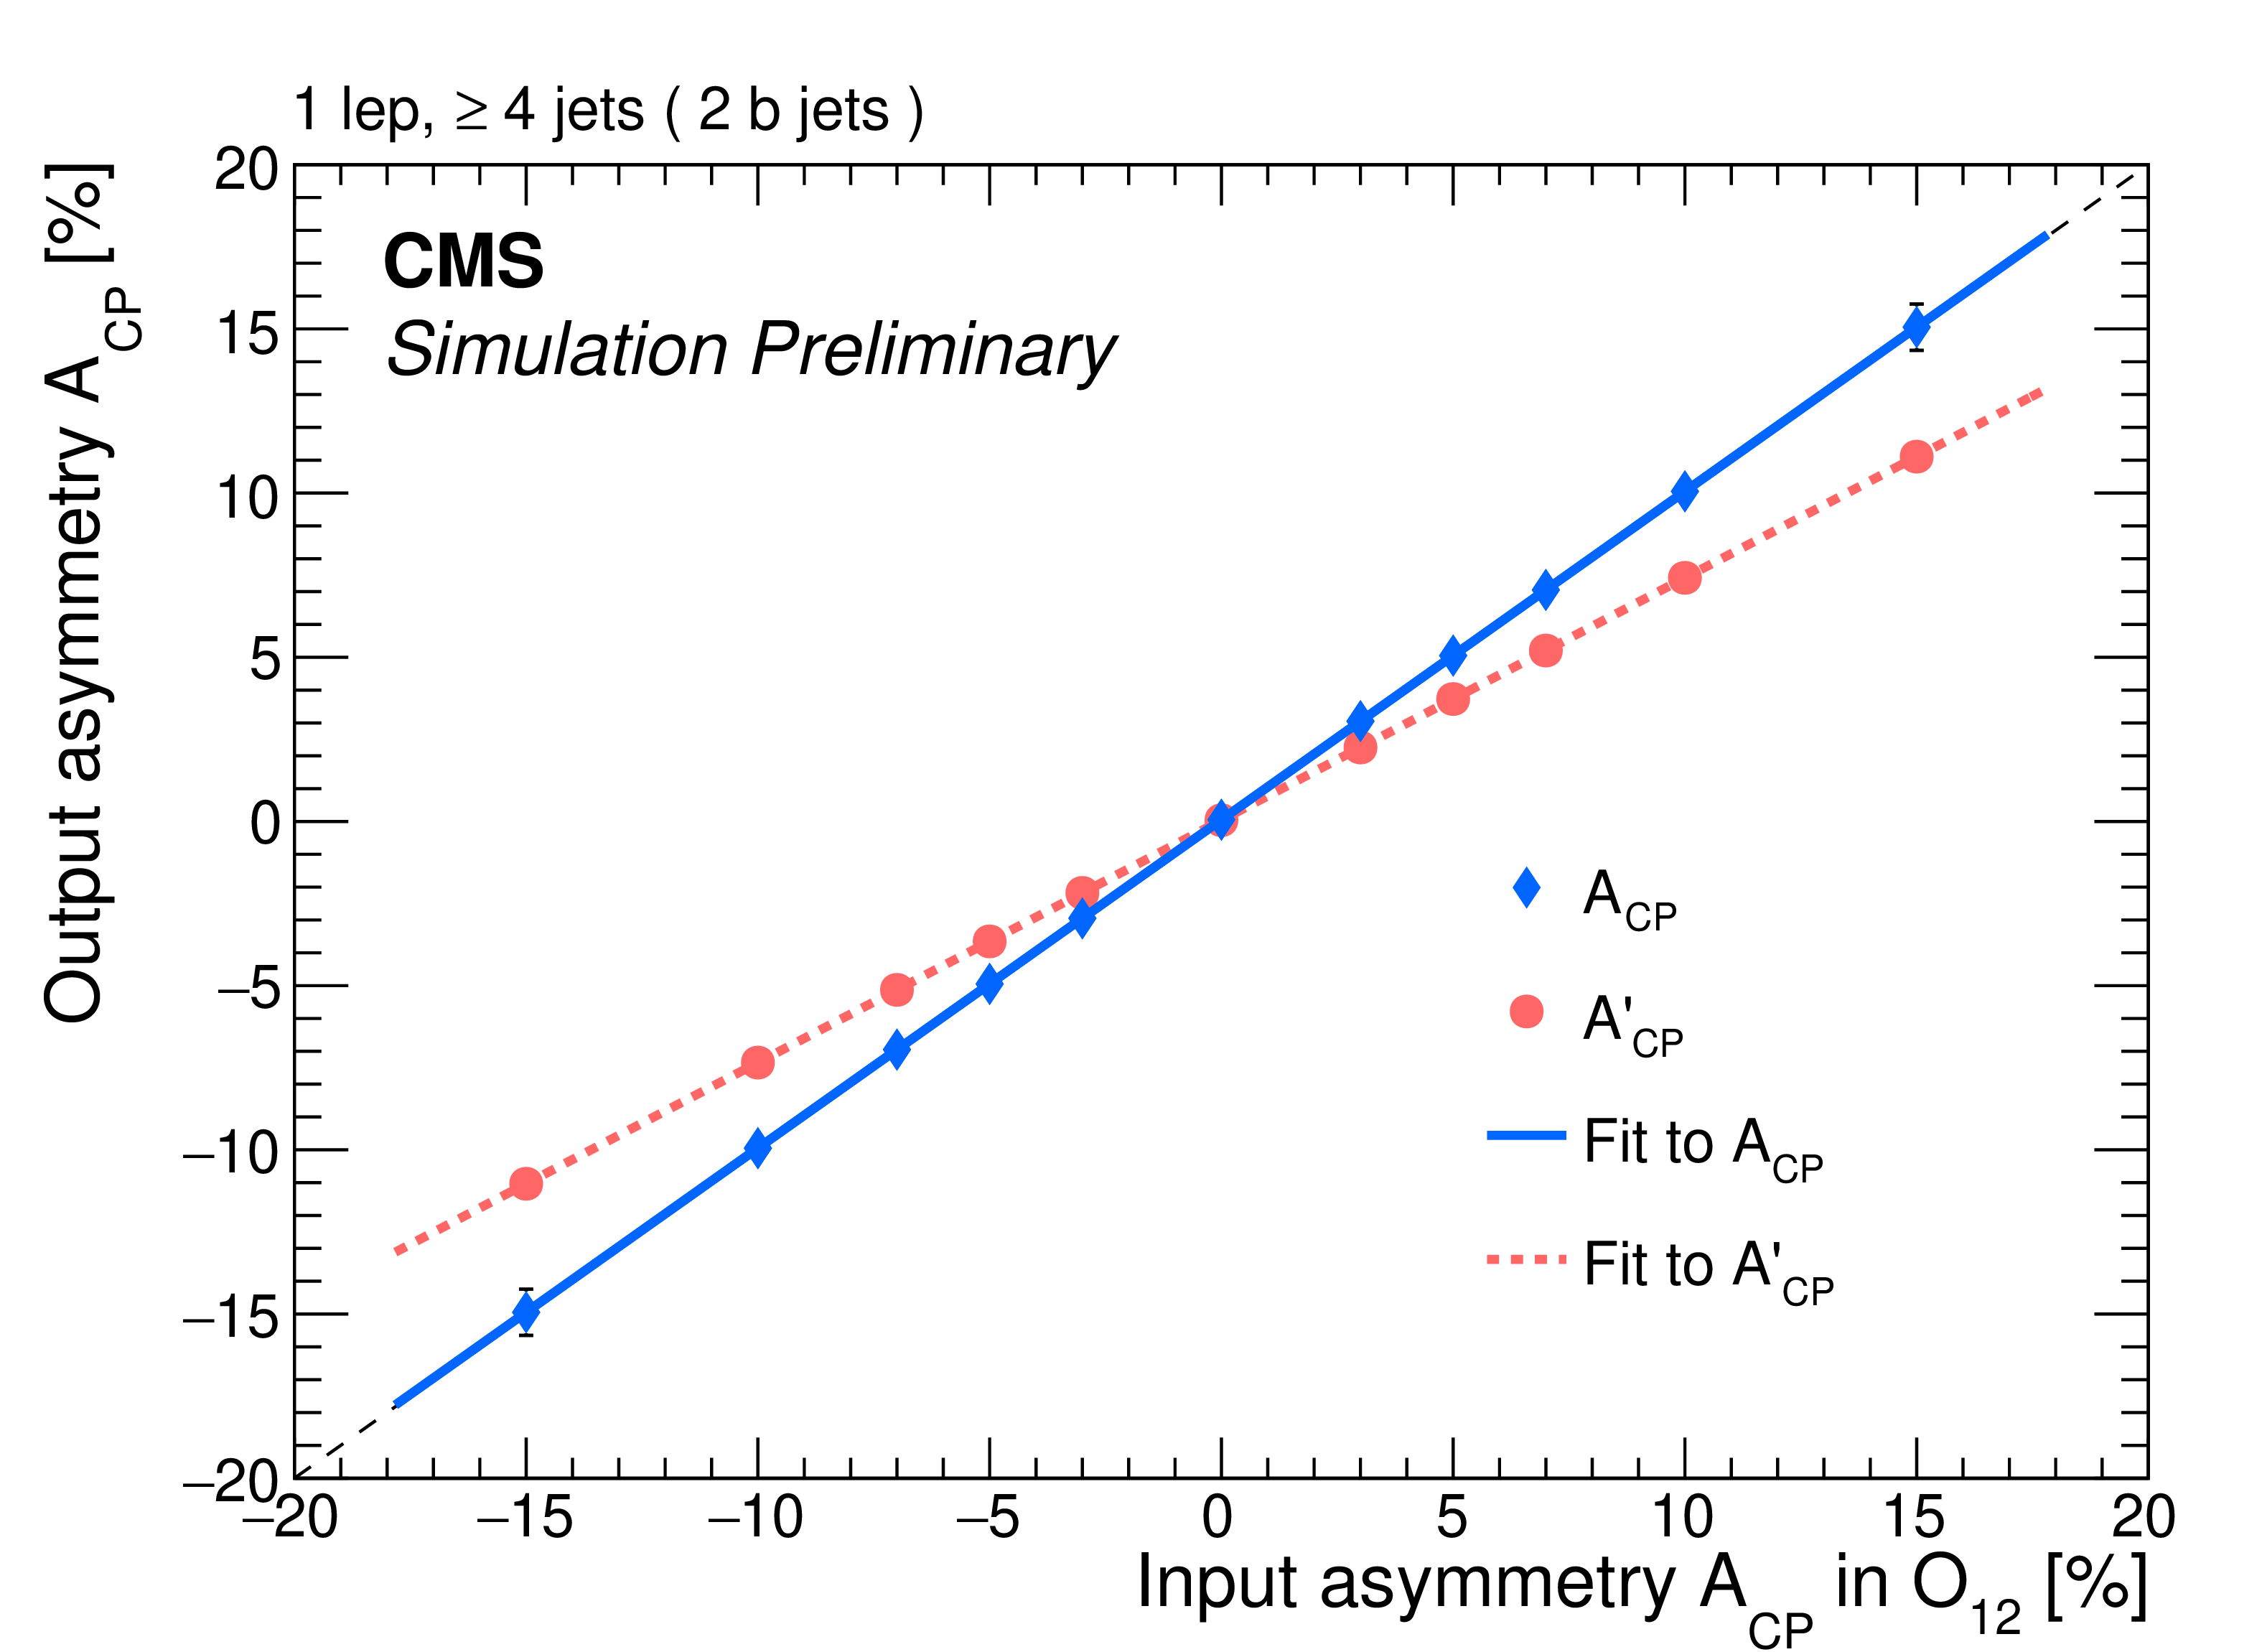
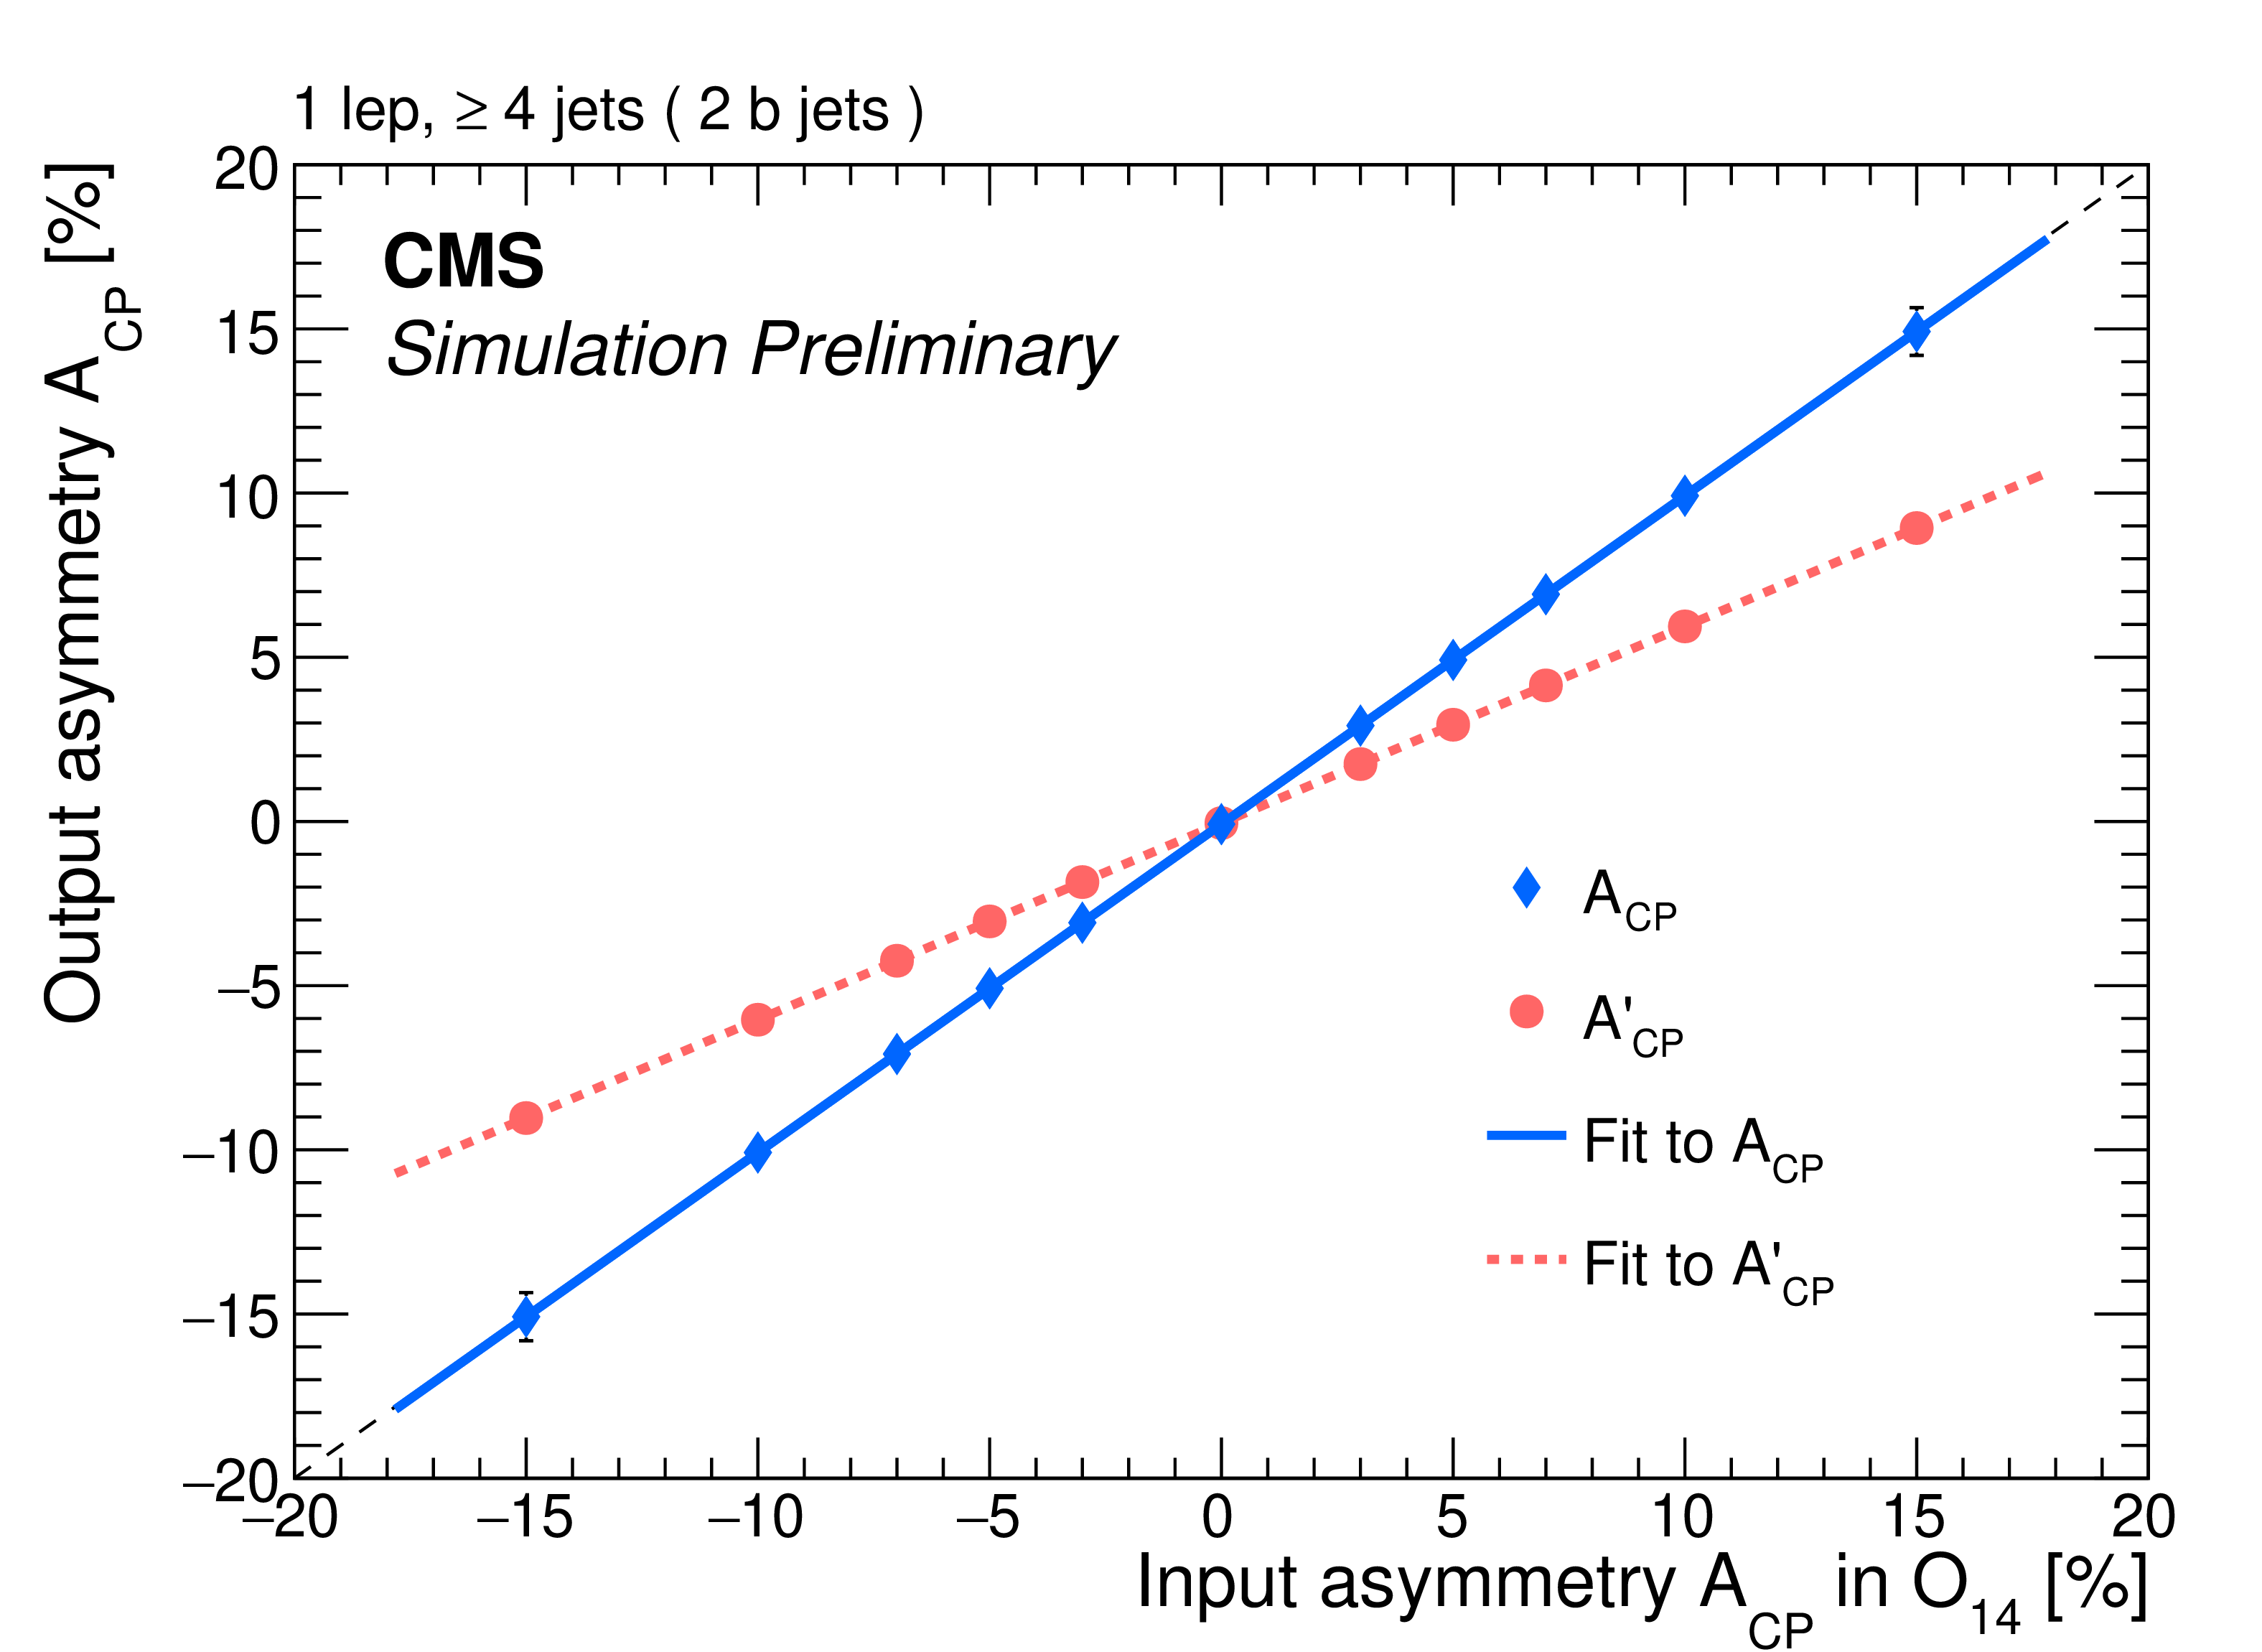
Asymmetries as a function of a varying input true asymmetry for each observable. The circular markers representing the $A'_{CP}$ are fitted to the dashed red lines, and the diamond markers representing the $A_{CP}$ are fitted to the solid blue lines. The value of each $A_{CP}$ value is obtained after applying the dilution factor to the corresponding $A'_{CP}$ value. The slopes of the solid blue lines are larger than the dashed red lines, demonstrating the magnitude of the dilution effect. The statistical uncertainties in the values of the asymmetries are smaller than the markers. |

png pdf |
Figure 6-a:
Asymmetries as a function of a varying input true asymmetry for each observable. The circular markers representing the $A'_{CP}$ are fitted to the dashed red lines, and the diamond markers representing the $A_{CP}$ are fitted to the solid blue lines. The value of each $A_{CP}$ value is obtained after applying the dilution factor to the corresponding $A'_{CP}$ value. The slopes of the solid blue lines are larger than the dashed red lines, demonstrating the magnitude of the dilution effect. The statistical uncertainties in the values of the asymmetries are smaller than the markers. |
png pdf |
Figure 6-b:
Asymmetries as a function of a varying input true asymmetry for each observable. The circular markers representing the $A'_{CP}$ are fitted to the dashed red lines, and the diamond markers representing the $A_{CP}$ are fitted to the solid blue lines. The value of each $A_{CP}$ value is obtained after applying the dilution factor to the corresponding $A'_{CP}$ value. The slopes of the solid blue lines are larger than the dashed red lines, demonstrating the magnitude of the dilution effect. The statistical uncertainties in the values of the asymmetries are smaller than the markers. |
png pdf |
Figure 6-c:
Asymmetries as a function of a varying input true asymmetry for each observable. The circular markers representing the $A'_{CP}$ are fitted to the dashed red lines, and the diamond markers representing the $A_{CP}$ are fitted to the solid blue lines. The value of each $A_{CP}$ value is obtained after applying the dilution factor to the corresponding $A'_{CP}$ value. The slopes of the solid blue lines are larger than the dashed red lines, demonstrating the magnitude of the dilution effect. The statistical uncertainties in the values of the asymmetries are smaller than the markers. |
png pdf |
Figure 6-d:
Asymmetries as a function of a varying input true asymmetry for each observable. The circular markers representing the $A'_{CP}$ are fitted to the dashed red lines, and the diamond markers representing the $A_{CP}$ are fitted to the solid blue lines. The value of each $A_{CP}$ value is obtained after applying the dilution factor to the corresponding $A'_{CP}$ value. The slopes of the solid blue lines are larger than the dashed red lines, demonstrating the magnitude of the dilution effect. The statistical uncertainties in the values of the asymmetries are smaller than the markers. |
png pdf |
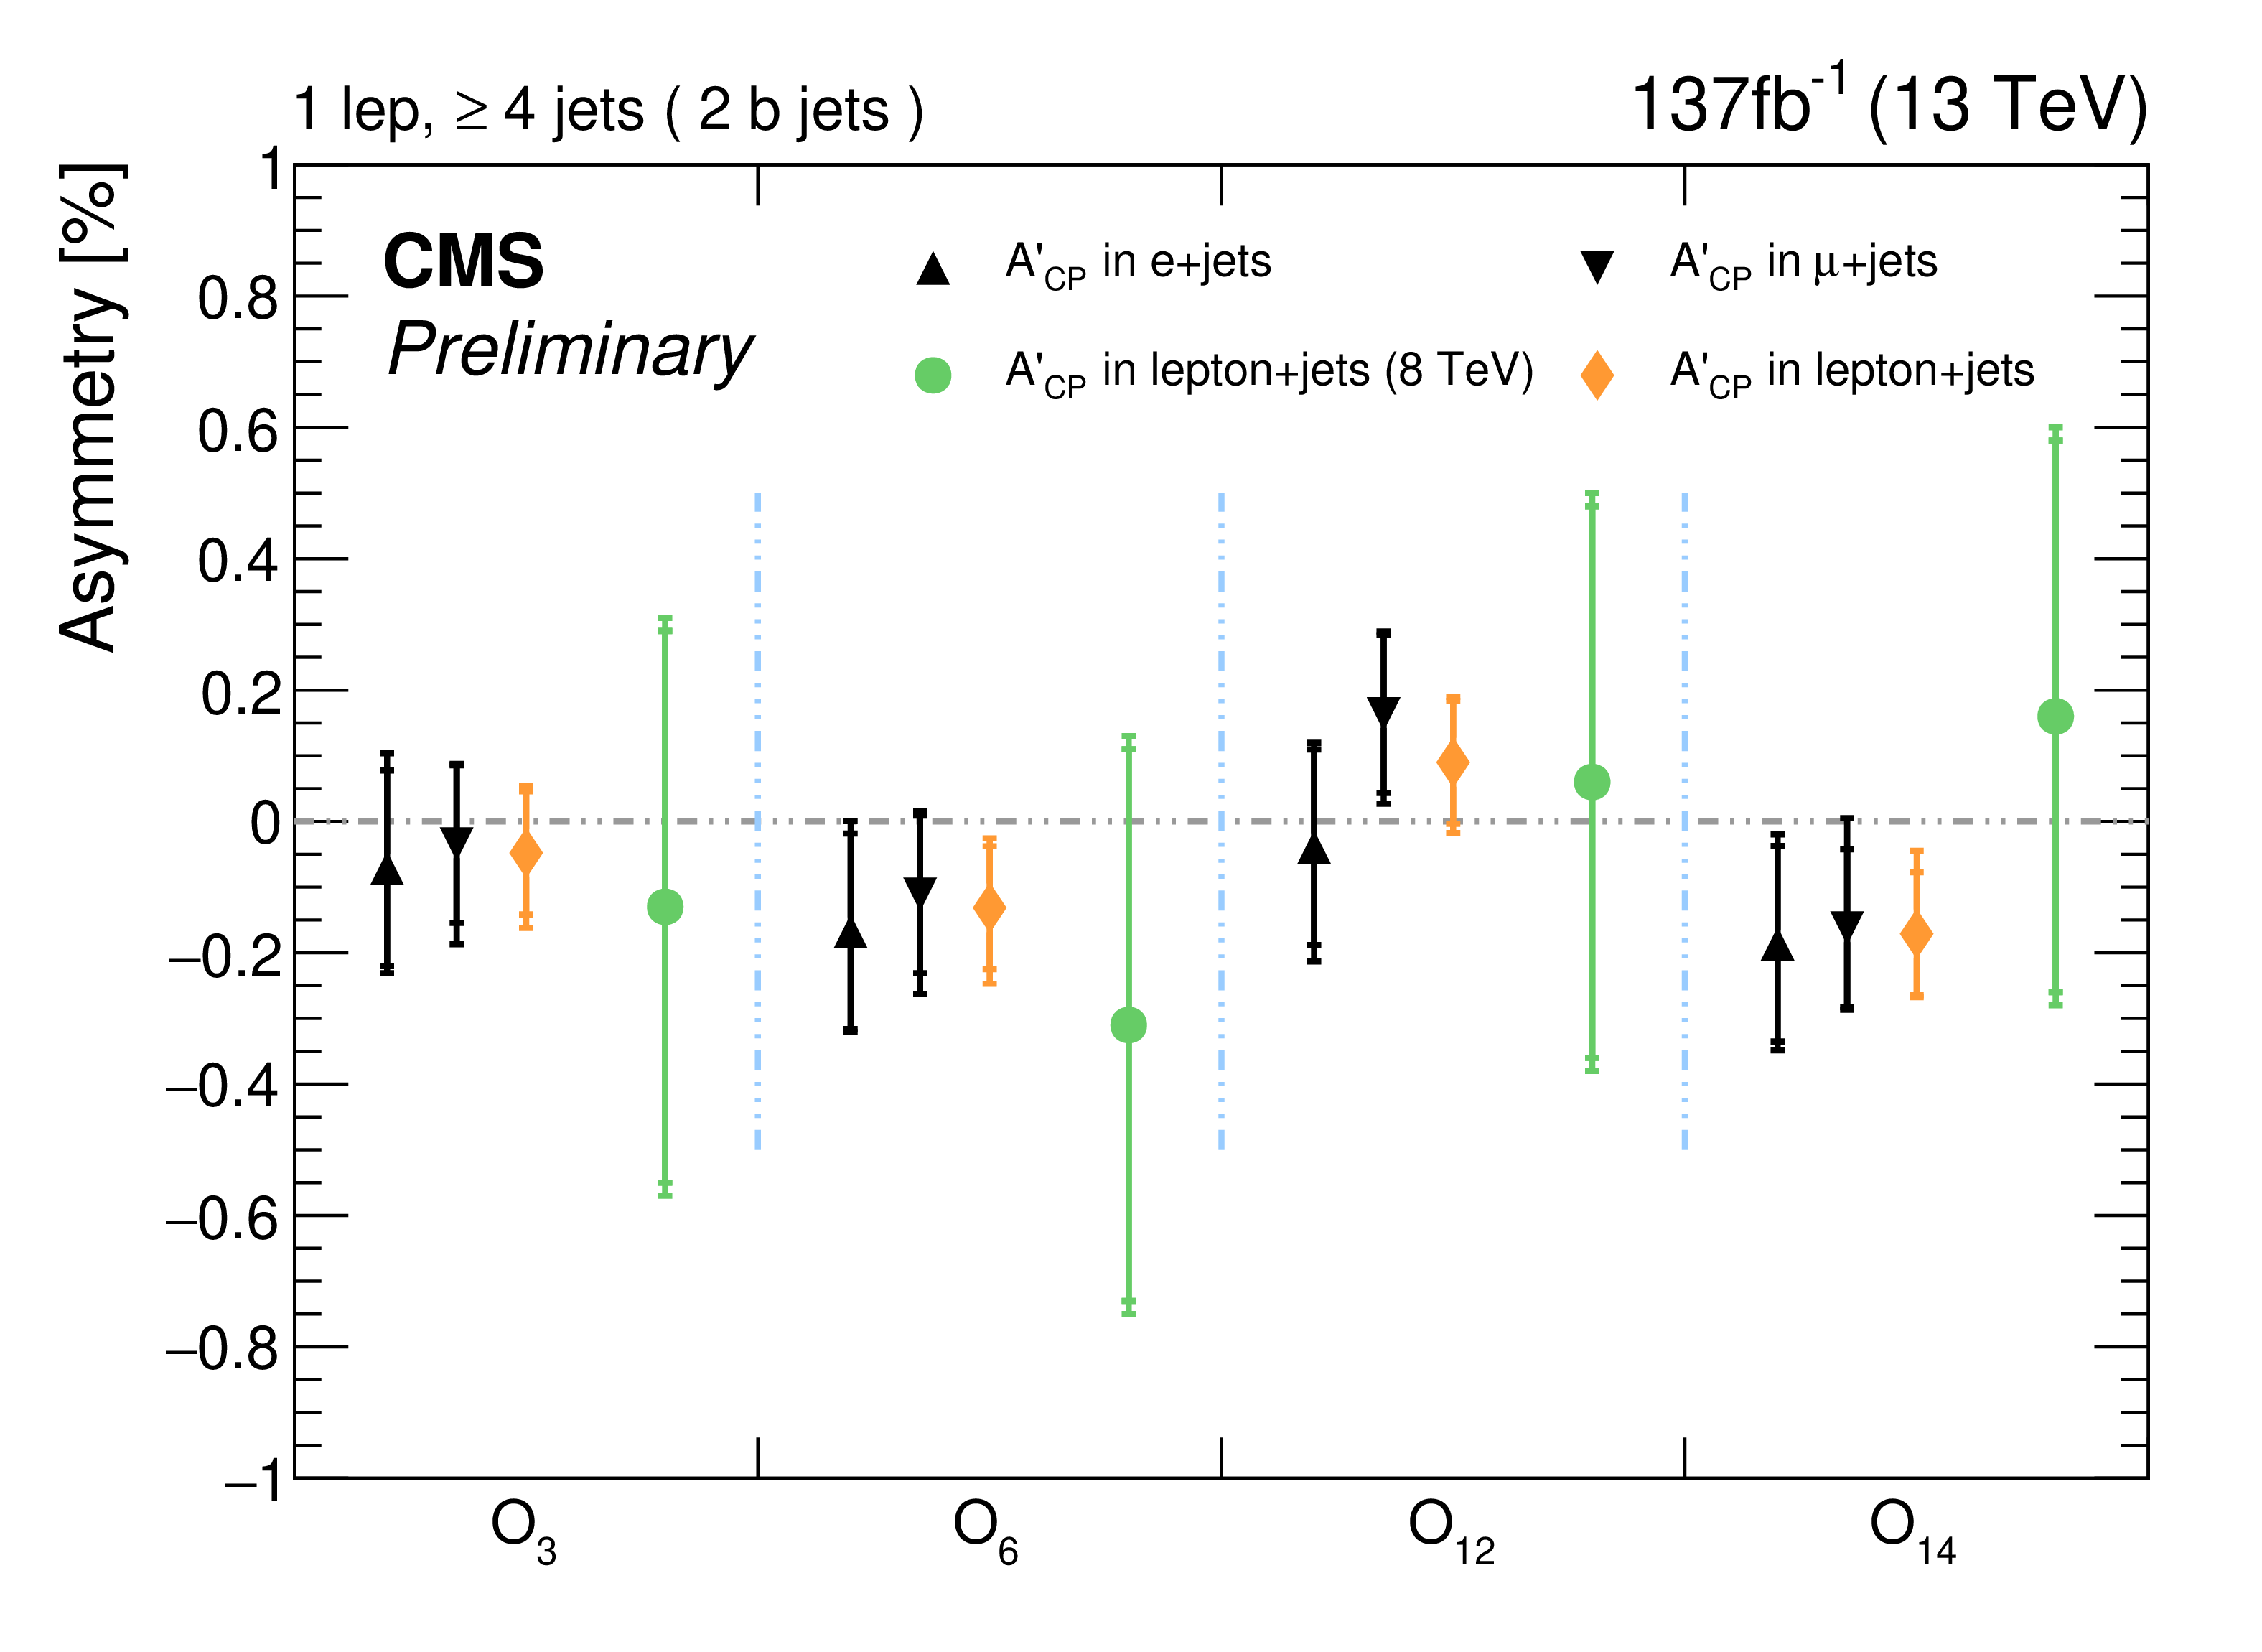
Figure 7:
The results of the effective asymmetries $A'_{CP}$ for each observable are shown for the separate electron and muon channels, as well as for the combined lepton+jets channel. The inner bars represent the statistical uncertainties, and the outer bars represent the combined statistical and systematic uncertainties added in quadrature. The 13 TeV results reduce the uncertainties by a factor of 3 compared with the 8 TeV results. |
| Tables | |
png pdf |
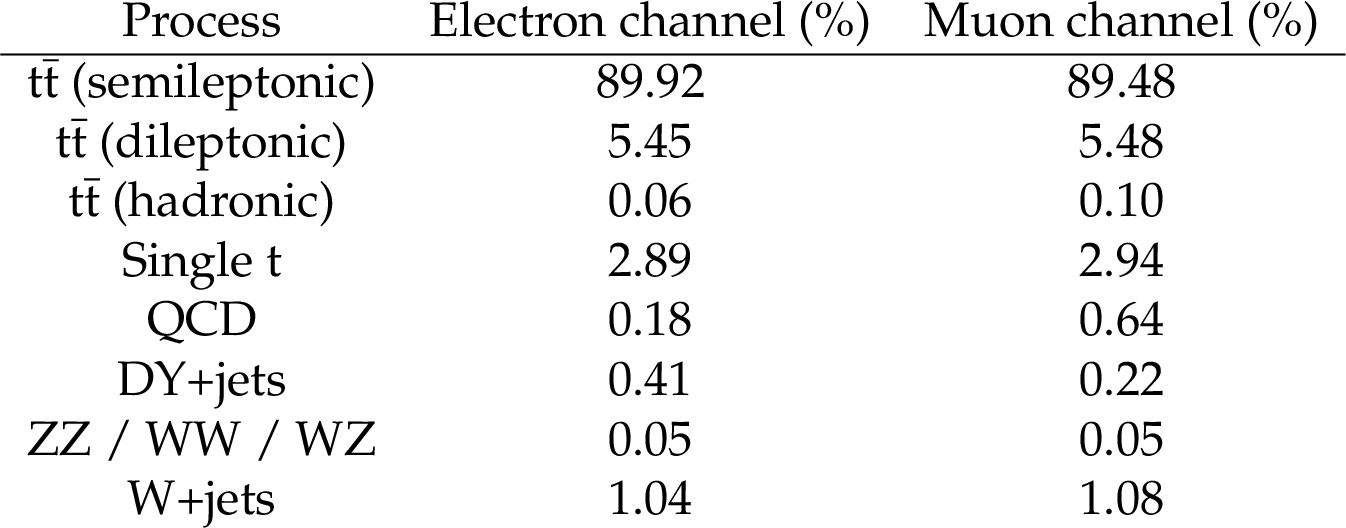
Table 1:
The expected composition of signal (semileptonic and dileptonic ${\mathrm{t} {}\mathrm{\bar{t}}}$) and different background processes in the signal region, estimated using simulation. |
png pdf |
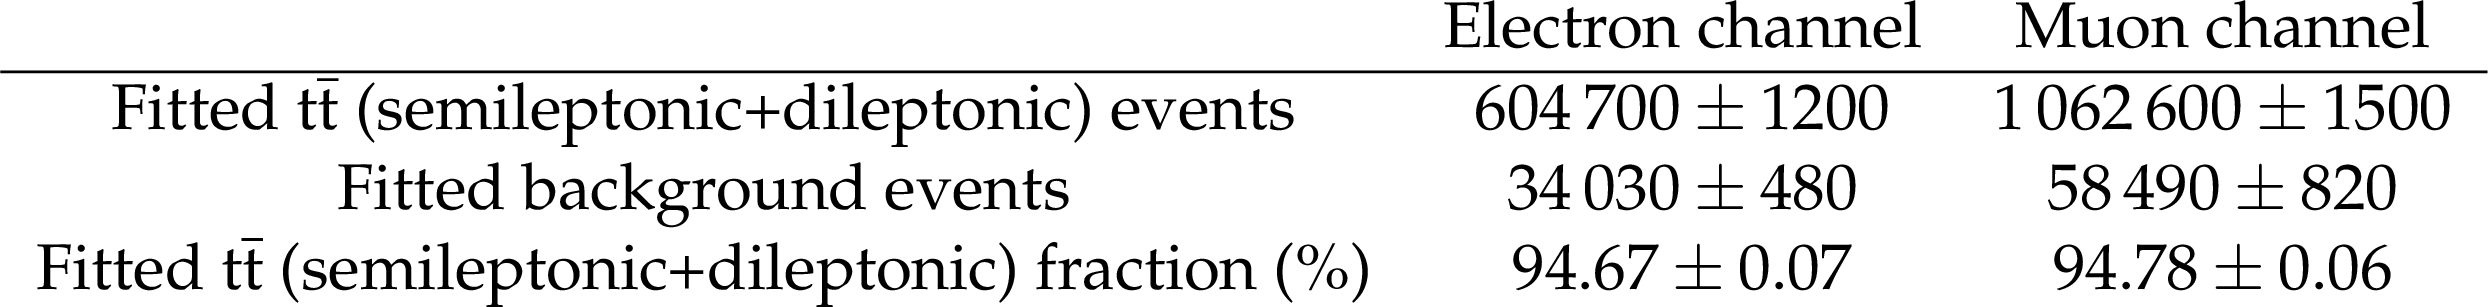
Table 2:
Fitted number of events in the electron and muon channels, along with the ${\mathrm{t} {}\mathrm{\bar{t}}}$ (semileptonic+dileptonic) fraction in percent. Although the fit is implemented over the full mass range, the fitted results are shown for $M_{lb} < $ 150 GeV. |
png pdf |
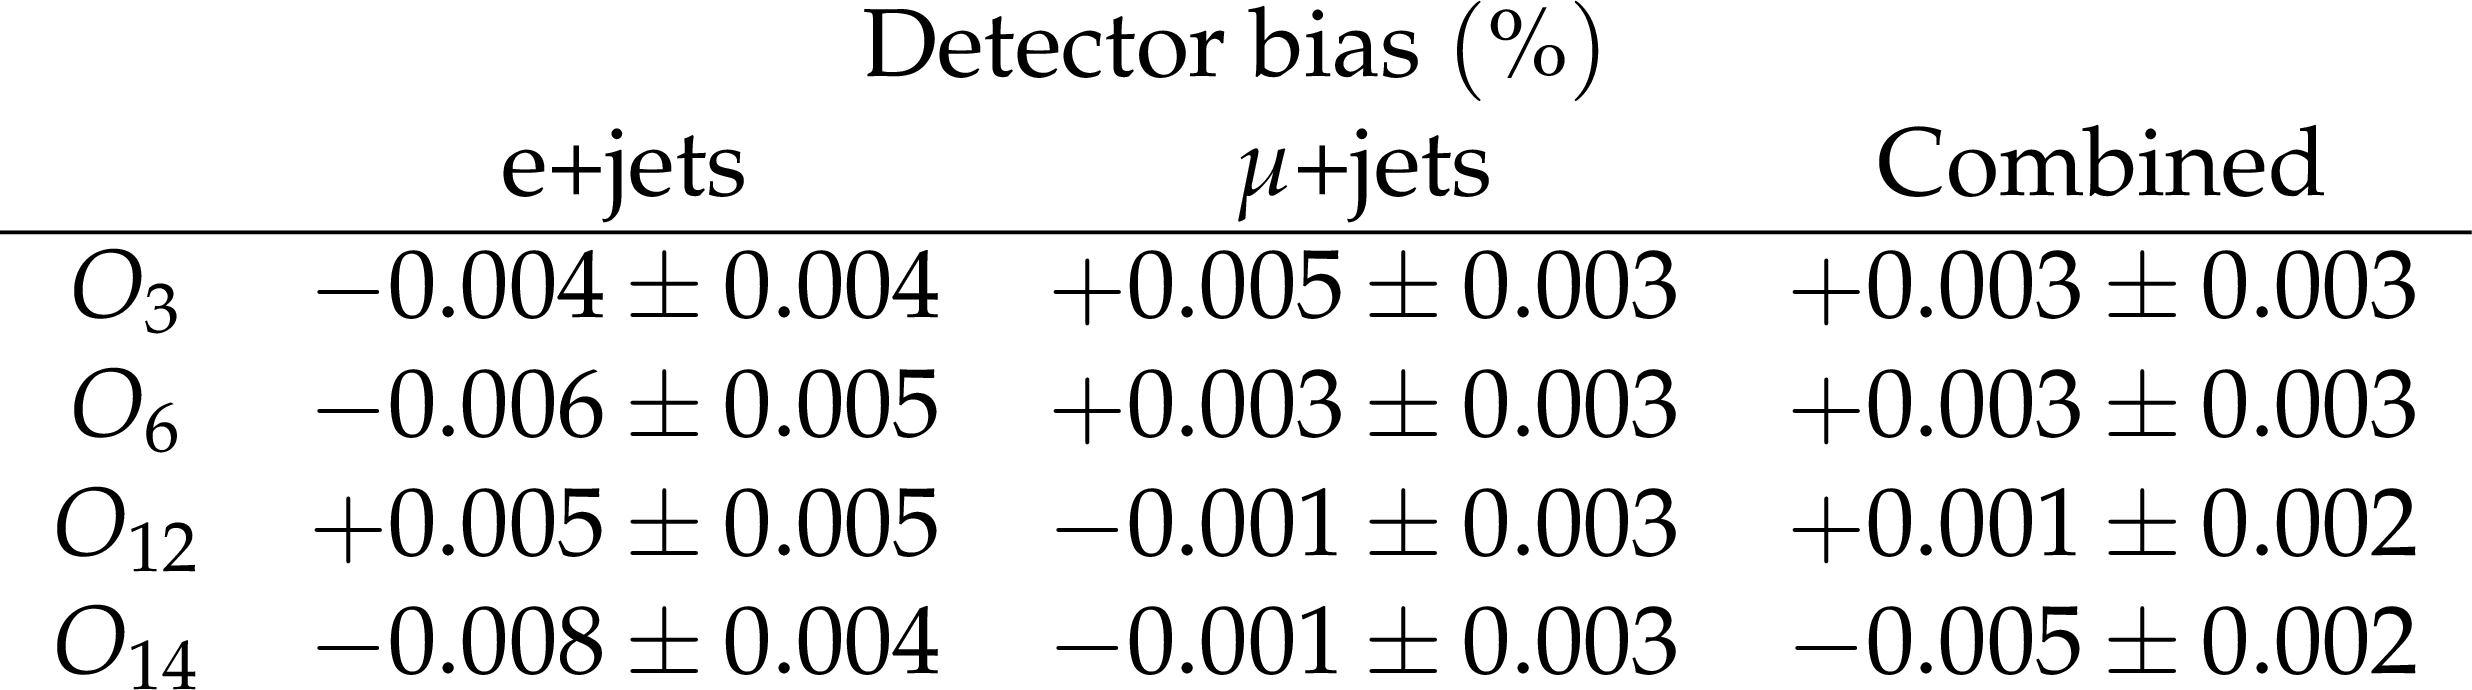
Table 3:
The mean value of asymmetries of mixed data samples and the standard deviation on the mean value. The shift from the mean value in the bias measurement or the standard deviation on the shift is taken as the systematic uncertainty from possible detector bias. The results show no significant intrinsic detector bias within about one standard deviation of the statistical uncertainty in both the electron and muon channels and their combined value. |
png pdf |
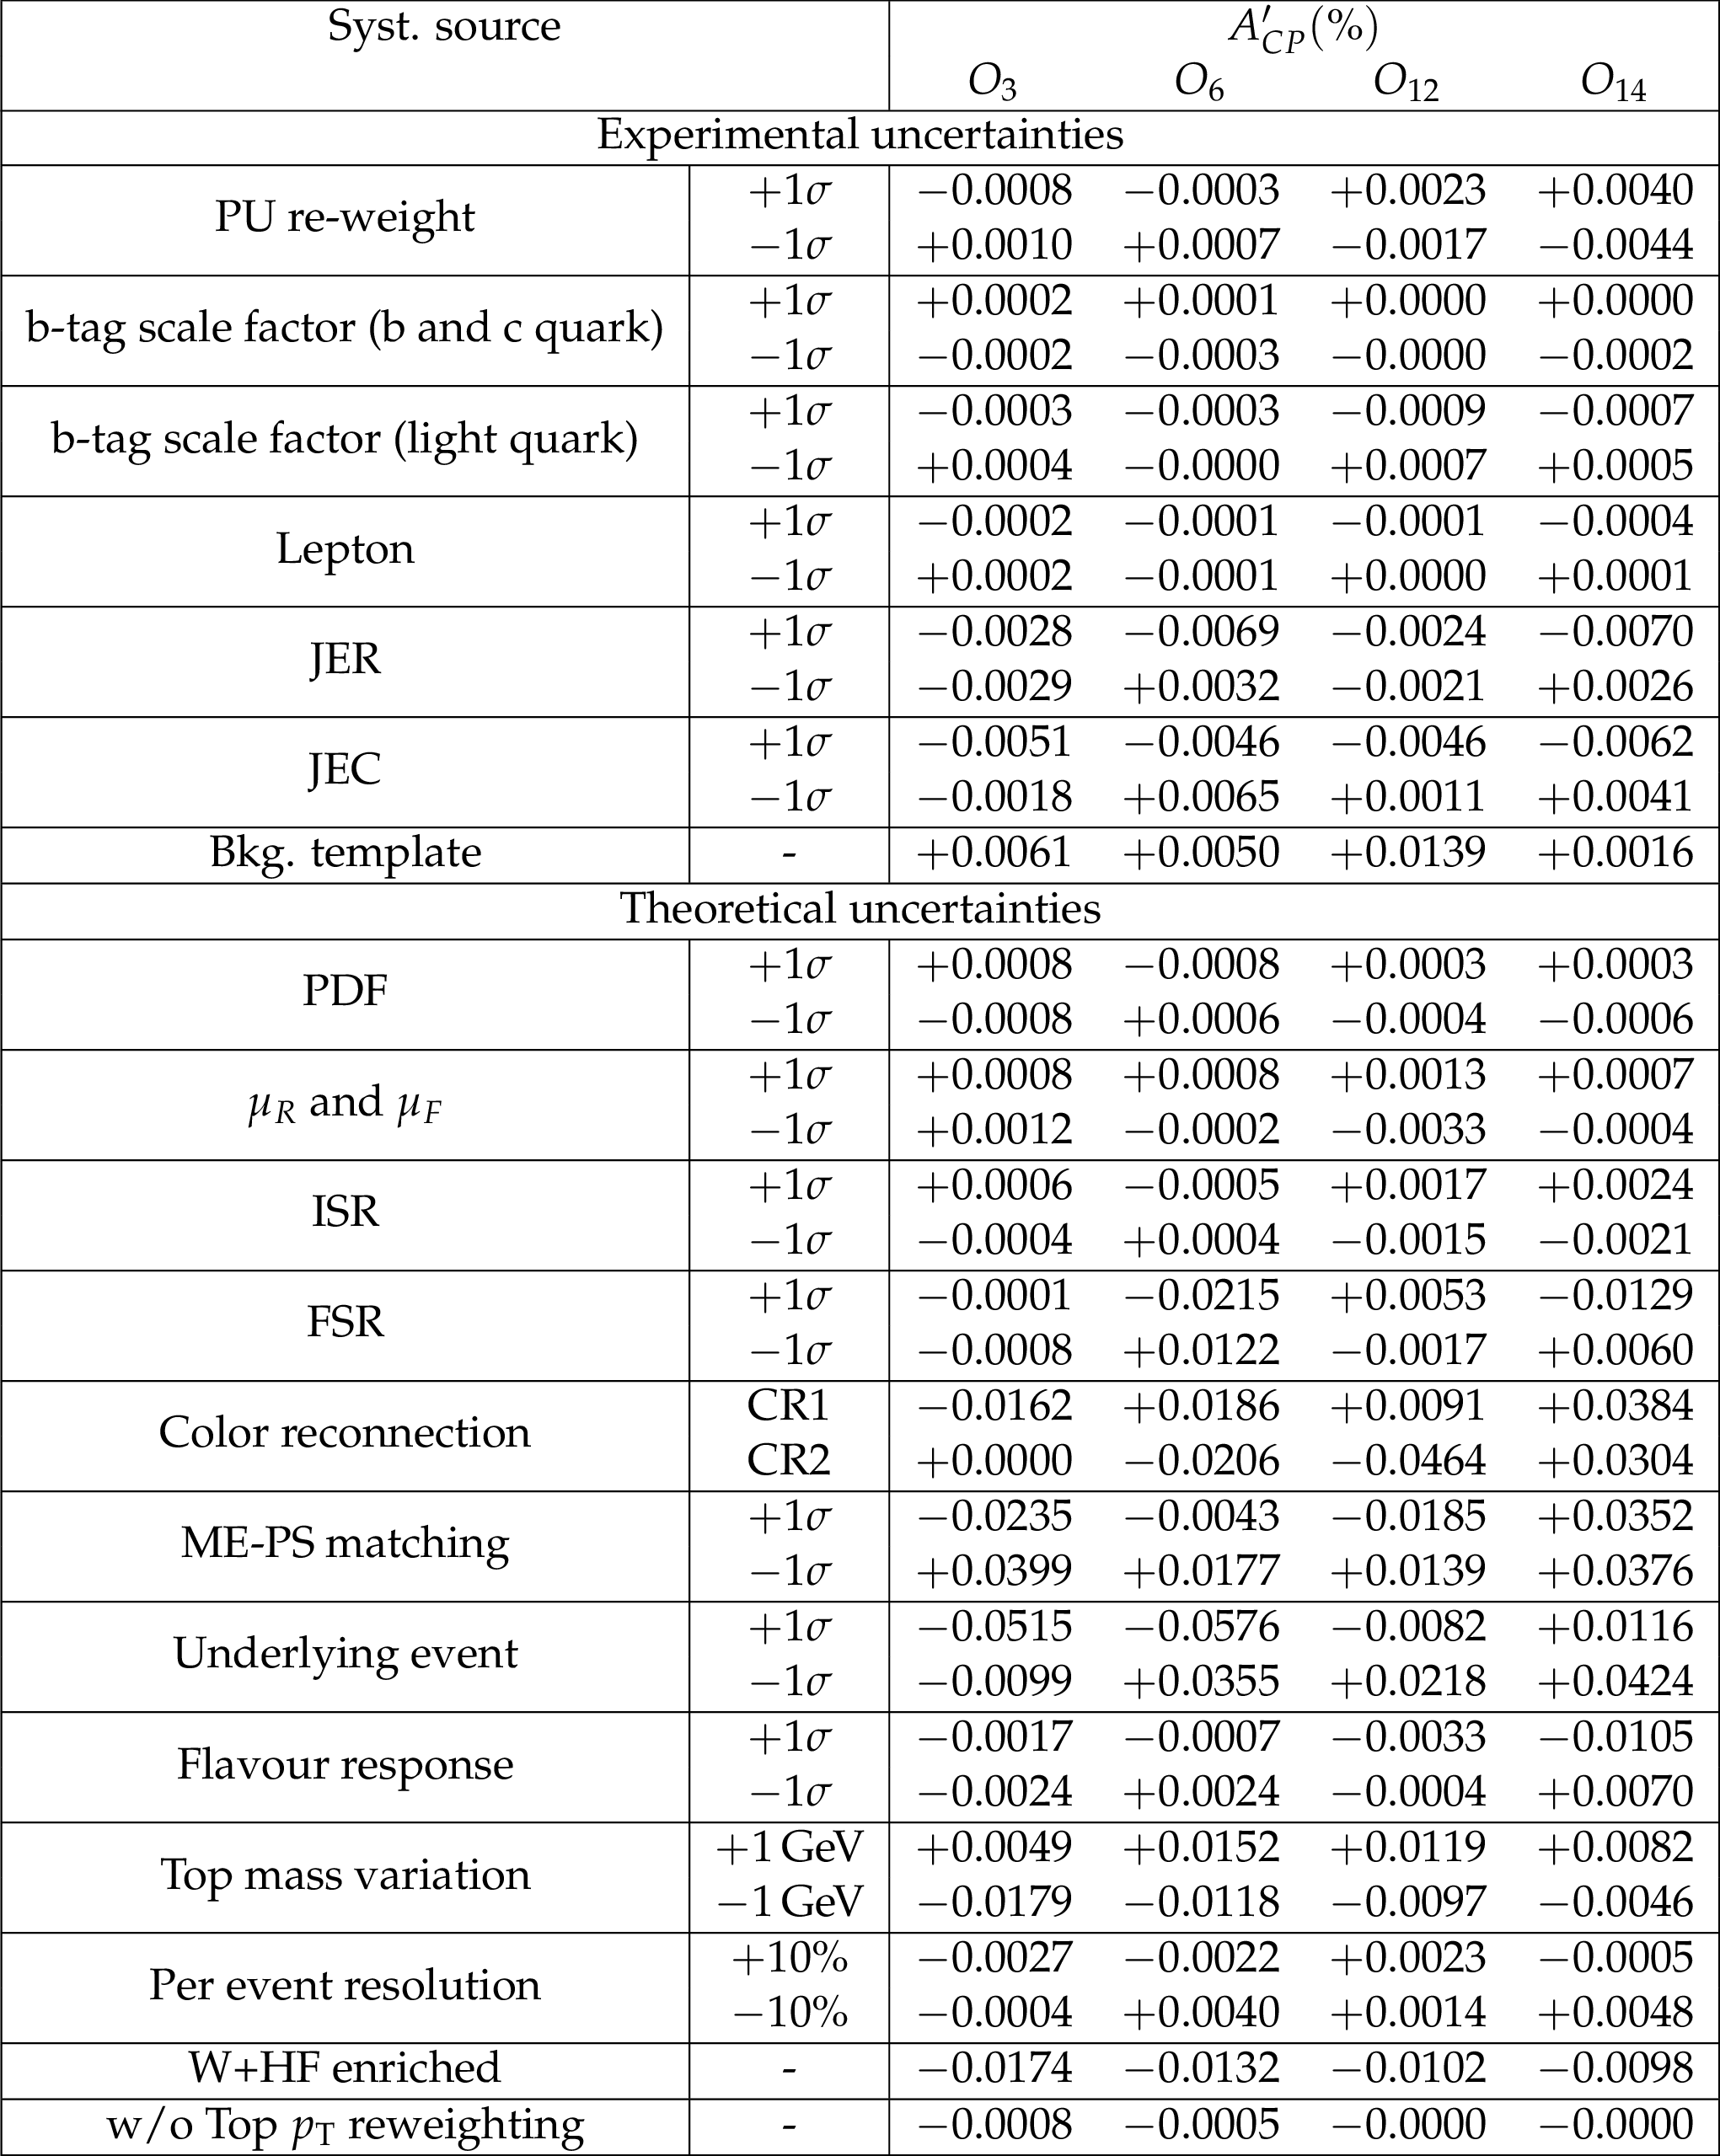
Table 4:
Systematic uncertainties in the $A'_{CP}$ measurement in both channels. The uncertainties due to experimental sources are in the upper part of the list, and theoretical sources are in the lower part. The $A'_{CP}$ values are obtained after a template fit with full signal region selection. |
png pdf |
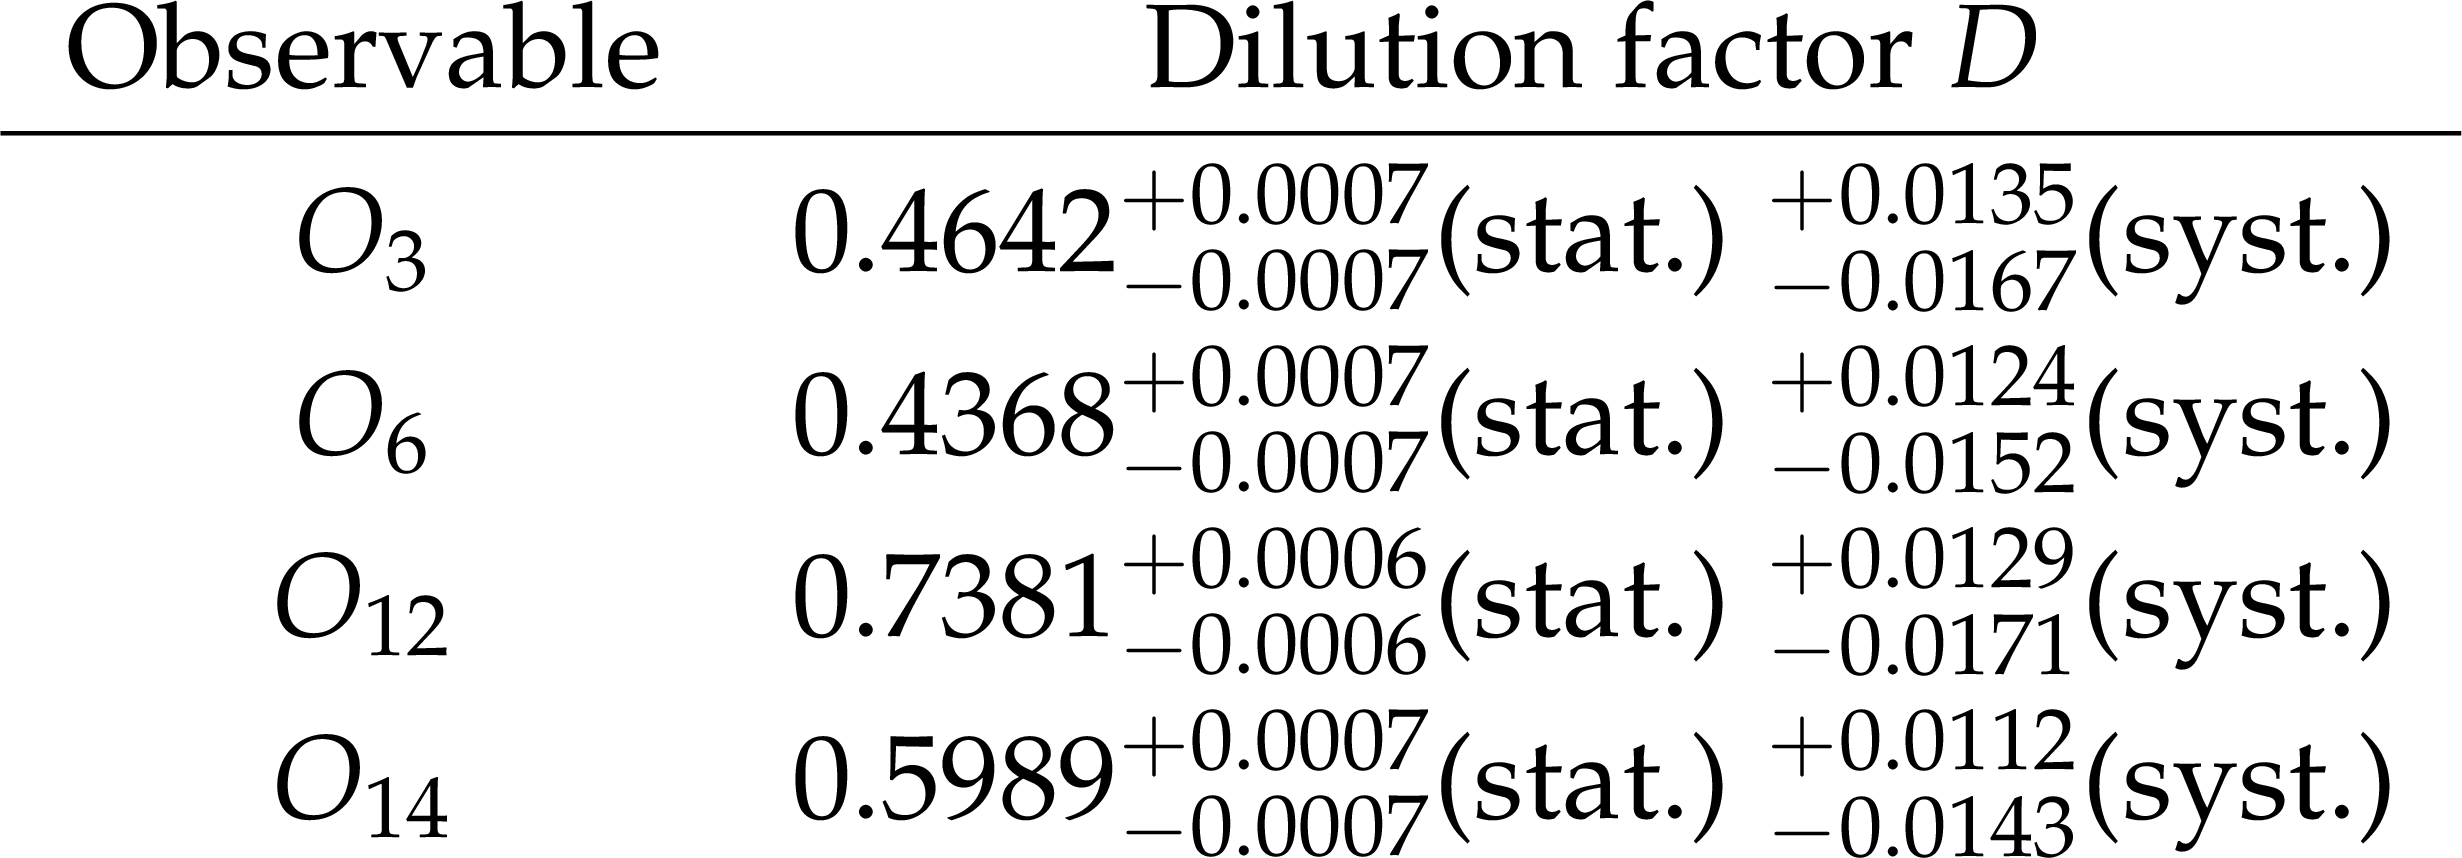
Table 5:
The measured dilution factor $D$ with their uncertainties for each observable. The first uncertainties are statistical and the second are systematic. The systematic uncertainties listed in Table are taken into consideration, except for the uncertainties from changing the background template. |
png pdf |
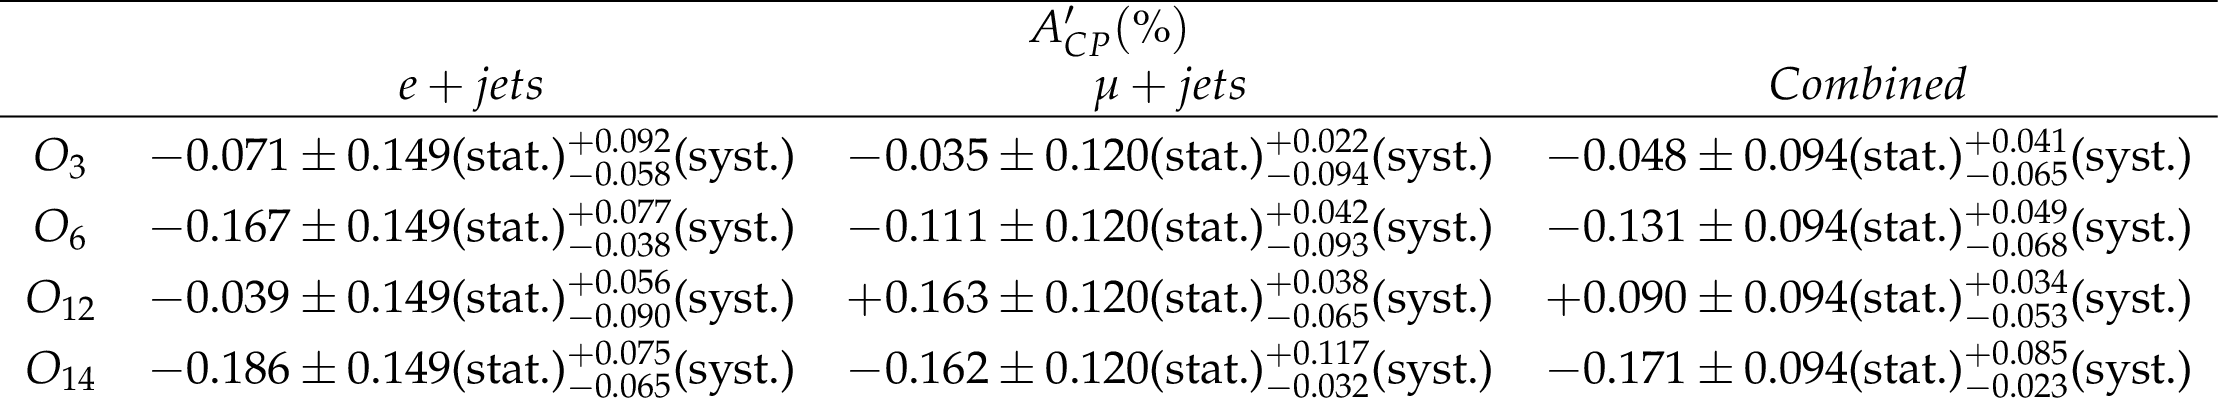
Table 6:
The results of the effective asymmetries $A'_{CP}$ for each observable are presented in both electron and muon channels, as well as for the combined lepton+jets channel. The first uncertainties are statistical, which comes from data and is the same for all observables. The second uncertainties are systematic uncertainties, which are dominated by W+HF modeling and the ME-PS matching. The systematic uncertainties combine detector bias and all the sources are listed in Table 4. |
| Summary |
| A search for CP violating effects in top quark-antiquark events has been presented. The search has been performed in the electron + jets and muon + jets final states, with one top quark assumed to decay hadronically and the other leptonically. This study uses the data from $\sqrt{s}=$ 13 TeV pp collisions collected with the CMS detector during Run 2. The CP violating asymmetries are measured with the triple-product T-odd observables, constructed using linearly independent four-momentum vectors associated with the final state particles, where T is the time-reversal operator. A data control sample is used to model the shape of the background in the asymmetry observables. The background contribution in the signal region is estimated from a fit to the mass distribution $M_{lb}$ associated with the leptonically decaying top quarks. The effective asymmetries are computed using the fitted signal events. The measured effective asymmetries exhibit no evidence for CPV effects, consistent with the expectation from the standard model. |
| References | ||||
| 1 | A. Hocker and Z. Ligeti | CP violation and the CKM matrix | Ann. Rev. Nucl. Part. Sci. 56 (2006) 501 | hep-ph/0605217 |
| 2 | BaBar, Belle Collaboration | The Physics of the B Factories | EPJC 74 (2014) 3026 | 1406.6311 |
| 3 | LHCb Collaboration | $ CP $ violation in charm at LHCb | Nuovo Cim. C 42 (2020) 250 | |
| 4 | Particle Data Group Collaboration | Review of Particle Physics | CPC 38 (2014) 090001 | |
| 5 | D. Atwood, S. Bar-Shalom, G. Eilam, and A. Soni | CP violation in top physics | PR 347 (2001) 1 | hep-ph/0006032 |
| 6 | S. K. Gupta, A. S. Mete, and G. Valencia | CP-violating anomalous top-quark couplings at the LHC | PRD 80 (2009) 034013 | 0905.1074 |
| 7 | A. Hayreter and G. Valencia | T-odd correlations from top-quark CEDM in lepton plus jets top-pair events | PRD 93 (2016) 014020 | 1511.01464 |
| 8 | S. K. Gupta and G. Valencia | CP-odd correlations using jet momenta from tt$ \_bar $ events at the Tevatron | PRD 81 (2010) 034013 | 0912.0707 |
| 9 | G. Valencia | Cp violation in top-quark physics | 2010 | |
| 10 | CMS Collaboration | Search for CP violation in $ t\overline{t} $ production and decay in proton-proton collisions at $ \sqrt{s}= $ 8 TeV | JHEP 03 (2017) 101 | CMS-TOP-16-001 1611.08931 |
| 11 | CMS Collaboration | Search for CP violating anomalous top quark coupling in pp collisions with the CMS detector at $ \sqrt{s}= $ 13 TeV | CMS-PAS-TOP-18-007 | CMS-PAS-TOP-18-007 |
| 12 | CMS Collaboration | Measurement of the top quark polarization and $ \mathrm{t\bar{t}} $ spin correlations using dilepton final states in proton-proton collisions at $ \sqrt{s} = $ 13 TeV | PRD 100 (2019) 072002 | CMS-TOP-18-006 1907.03729 |
| 13 | W. Bernreuther, D. Heisler, and Z.-G. Si | A set of top quark spin correlation and polarization observables for the LHC: Standard model predictions and new physics contributions | JHEP 12 (2015) 026 | 1508.05271 |
| 14 | CMS Collaboration | The CMS trigger system | JINST 12 (2017) P01020 | CMS-TRG-12-001 1609.02366 |
| 15 | P. Nason | A new method for combining NLO QCD with shower Monte Carlo algorithms | JHEP 11 (2004) 040 | hep-ph/0409146 |
| 16 | S. Frixione, P. Nason, and C. Oleari | Matching NLO QCD computations with parton shower simulations: the POWHEG method | JHEP 11 (2007) 070 | 0709.2092 |
| 17 | S. Alioli, P. Nason, C. Oleari, and E. Re | A general framework for implementing NLO calculations in shower Monte Carlo programs: the POWHEG BOX | JHEP 06 (2010) 043 | 1002.2581 |
| 18 | J. M. Campbell, R. K. Ellis, P. Nason, and E. Re | Top-pair production and decay at NLO matched with parton showers | JHEP 04 (2015) 114 | 1412.1828 |
| 19 | T. Sjostrand, S. Mrenna, and P. Skands | PYTHIA 6.4 physics and manual | JHEP 05 (2006) 026 | hep-ph/0603175 |
| 20 | T. Sjostrand et al. | An introduction to PYTHIA 8.2 | CPC 191 (2015) 159 | 1410.3012 |
| 21 | CMS Collaboration | Extraction and validation of a new set of CMS PYTHIA8 tunes from underlying-event measurements | EPJC 80 (2020) 4 | CMS-GEN-17-001 1903.12179 |
| 22 | NNPDF Collaboration | Parton distributions from high-precision collider data | EPJC 77 (2017) 663 | 1706.00428 |
| 23 | J. Alwall et al. | The automated computation of tree-level and next-to-leading order differential cross sections, and their matching to parton shower simulations | JHEP 07 (2014) 079 | 1405.0301 |
| 24 | CMS Collaboration | Event generator tunes obtained from underlying event and multiparton scattering measurements | EPJC 76 (2016) 155 | CMS-GEN-14-001 1512.00815 |
| 25 | J. Alwall et al. | Comparative study of various algorithms for the merging of parton showers and matrix elements in hadronic collisions | EPJC 53 (2008) 473--500 | 0706.2569 |
| 26 | GEANT4 Collaboration | GEANT4--a simulation toolkit | NIMA 506 (2003) 250--303 | |
| 27 | CMS Collaboration | Measurement of the inelastic proton-proton cross section at $ \sqrt{s}= $ 13 TeV | JHEP 07 (2018) 161 | CMS-FSQ-15-005 1802.02613 |
| 28 | CMS Collaboration | Particle-flow reconstruction and global event description with the CMS detector | JINST 12 (2017) P10003 | CMS-PRF-14-001 1706.04965 |
| 29 | CMS Collaboration | Performance of Electron Reconstruction and Selection with the CMS Detector in Proton-Proton Collisions at $ \sqrt{s} = $ 8 TeV | JINST 10 (2015) P06005 | CMS-EGM-13-001 1502.02701 |
| 30 | CMS Collaboration | Performance of the CMS muon detector and muon reconstruction with proton-proton collisions at $ \sqrt{s}= $ 13 TeV | JINST 13 (2018) P06015 | CMS-MUO-16-001 1804.04528 |
| 31 | M. Cacciari, G. P. Salam, and G. Soyez | FastJet user manual | EPJC 72 (2012) 1896 | 1111.6097 |
| 32 | M. Cacciari, G. P. Salam, and G. Soyez | The anti-$ k_t $ jet clustering algorithm | JHEP 04 (2008) 063 | 0802.1189 |
| 33 | CMS Collaboration | Identification of heavy-flavour jets with the CMS detector in pp collisions at 13 TeV | JINST 13 (2018) P05011 | CMS-BTV-16-002 1712.07158 |
| 34 | CMS Collaboration | Measurements of the $ \mathrm{t}\overline{\mathrm{t}} $ production cross section in lepton+jets final states in pp collisions at 8 TeV and ratio of 8 to 7 TeV cross sections | EPJC 77 (2017) 15 | CMS-TOP-12-006 1602.09024 |
| 35 | A. Buckley et al. | LHAPDF6: parton density access in the LHC precision era | EPJC 75 (2015) 132 | 1412.7420 |
|
|
Compact Muon Solenoid LHC, CERN |
|

|

|

|

|

|