

Compact Muon Solenoid
LHC, CERN
| CMS-PAS-SUS-15-003 | ||
| Search for new physics in the all-hadronic final state with the $M_{\mathrm{T2}}$ variable | ||
| CMS Collaboration | ||
| December 2015 | ||
| Abstract: A search for new physics is performed using events with jets and the $M_{\mathrm{T2}}$ variable, which is a measure of the transverse momentum imbalance in an event. Results are based on a sample of proton-proton collisions collected at a center-of-mass energy of 13 TeV with the CMS detector and corresponding to an integrated luminosity of 2.2 fb$^{-1}$. No excess above the standard model background is observed. The results are interpreted as limits on the masses of potential new colored particles in a variety of simplified models of supersymmetry. | ||
|
Links:
CDS record (PDF) ;
CADI line (restricted) ;
These preliminary results are superseded in this paper, JHEP 10 (2016) 006. |
||
| Figures | |

png pdf |
Figure 1-a:
Shape comparison between simulation and data for the $ M_{\mathrm{T2}} $ observable. The left and right panels correspond to W+jets and $ \mathrm{ t \overline {t} }$+jets enriched control samples, respectively. |
png pdf |
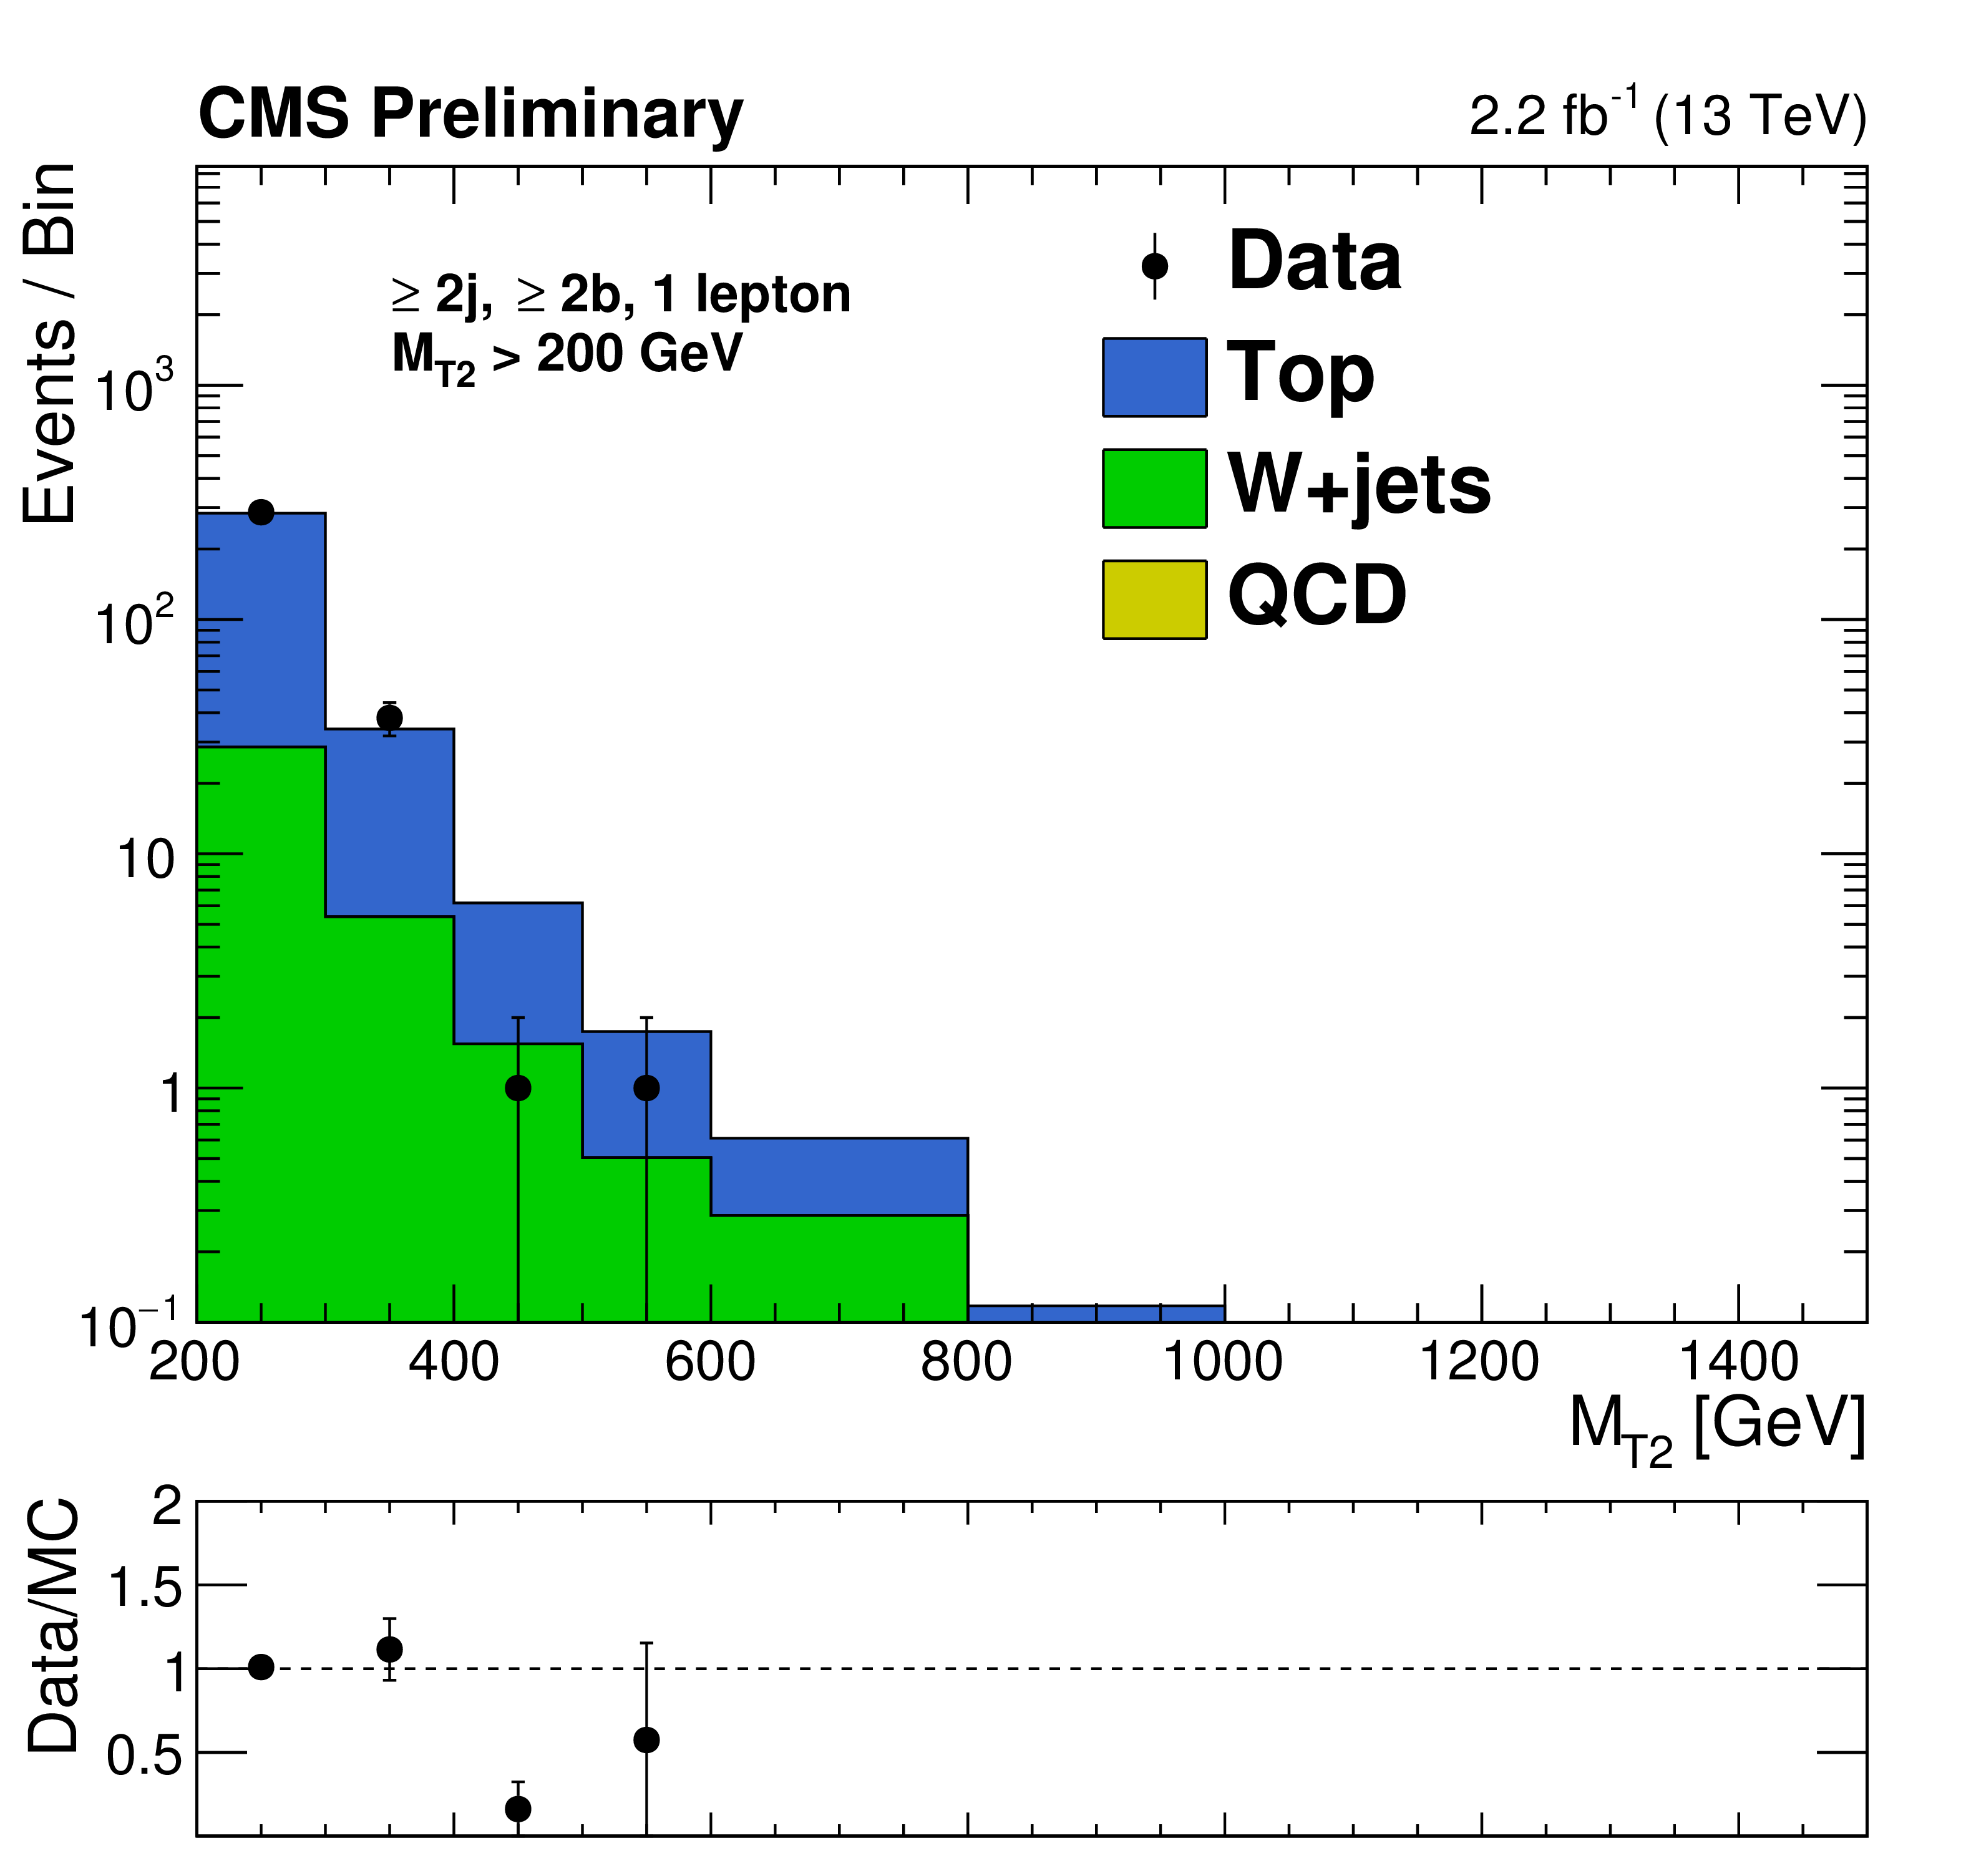
Figure 1-b:
Shape comparison between simulation and data for the $ M_{\mathrm{T2}} $ observable. The left and right panels correspond to W+jets and $ \mathrm{ t \overline {t} }$+jets enriched control samples, respectively. |
png pdf |
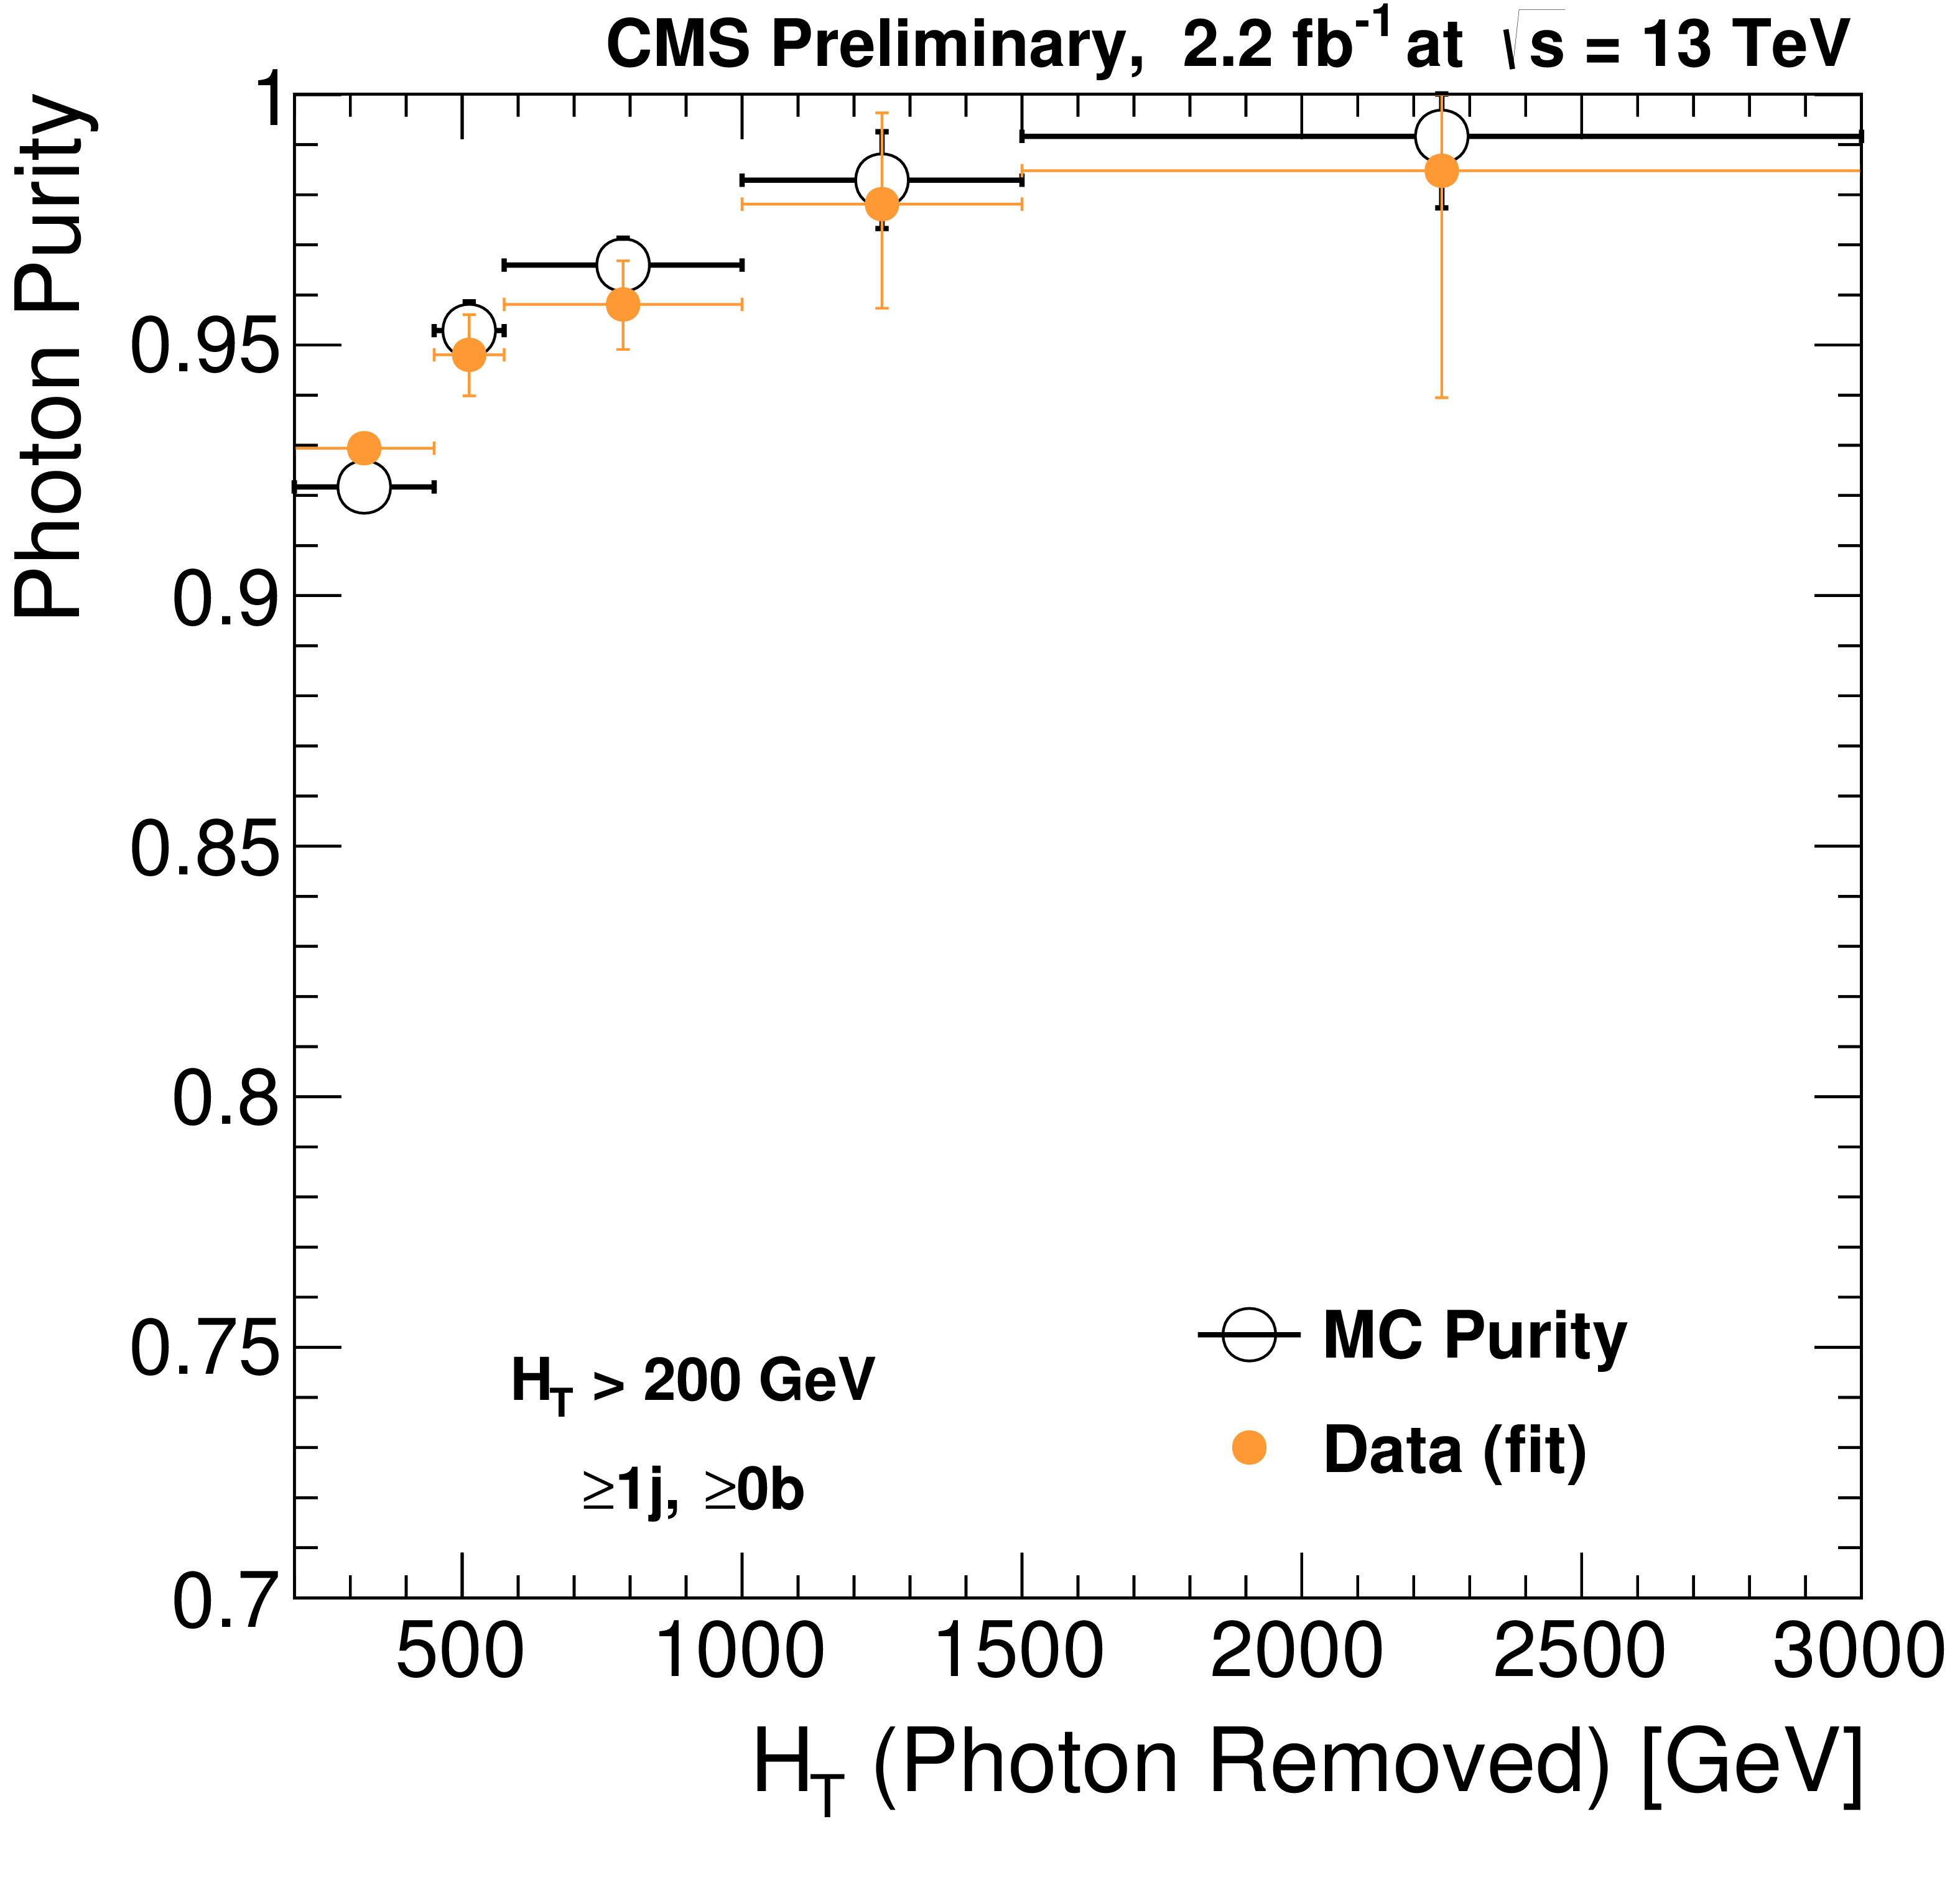
Figure 2-a:
The (a) plot shows the photon purity measured in data for the single photon control sample compared with the values extracted from simulation. The (b) plot shows $R(Z/\gamma )$ the $Z/\gamma $ ratio in simulation and data as a function of $ {H_{\mathrm {T}}} $, and the corresponding double ratio (bottom panel). |

png pdf |
Figure 2-b:
The (a) plot shows the photon purity measured in data for the single photon control sample compared with the values extracted from simulation. The (b) plot shows $R(Z/\gamma )$ the $Z/\gamma $ ratio in simulation and data as a function of $ {H_{\mathrm {T}}} $, and the corresponding double ratio (bottom panel). |
png pdf |
Figure 3-a:
The shape of the $ M_{\mathrm{T2}} $ distribution from $ \mathrm{Z} \rightarrow \nu \overline {\nu } $ simulation compared to shapes extracted from $\gamma $ and $W$ data control samples in the medium $ {H_{\mathrm {T}}} $ and high $ {H_{\mathrm {T}}} $ regions. |

png pdf |
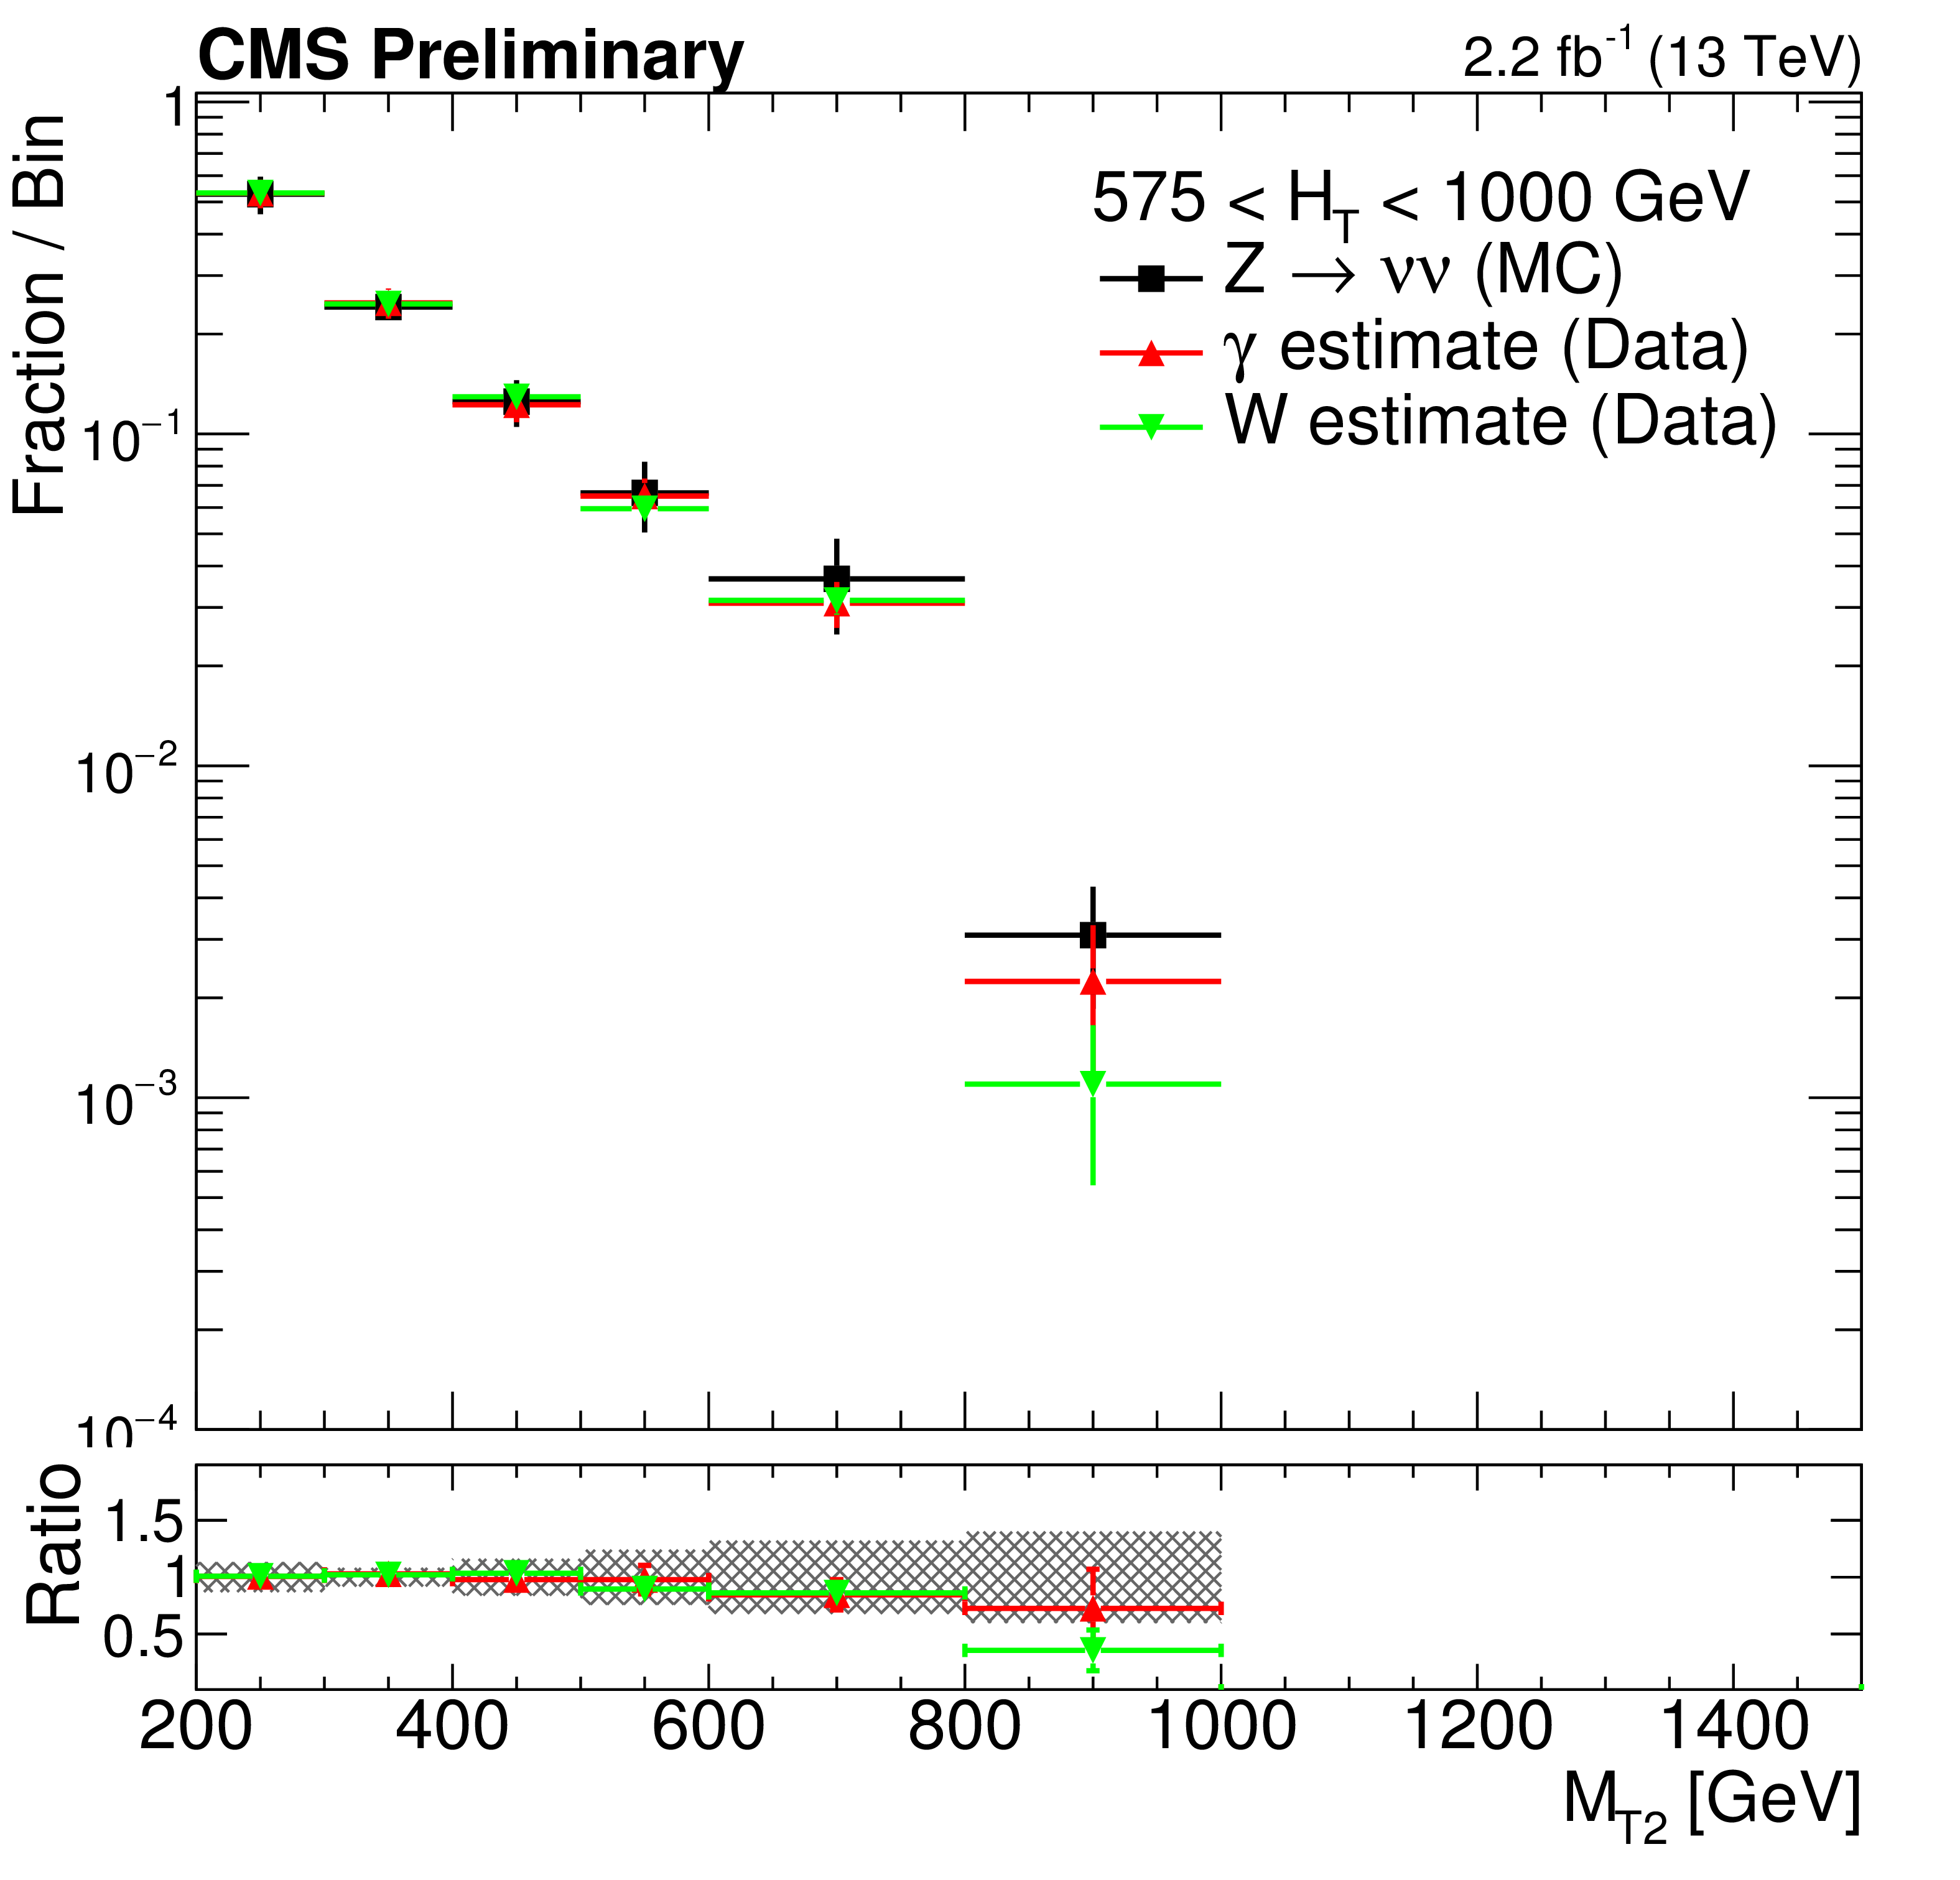
Figure 3-b:
The shape of the $ M_{\mathrm{T2}} $ distribution from $ \mathrm{Z} \rightarrow \nu \overline {\nu } $ simulation compared to shapes extracted from $\gamma $ and $W$ data control samples in the medium $ {H_{\mathrm {T}}} $ and high $ {H_{\mathrm {T}}} $ regions. |
png pdf |
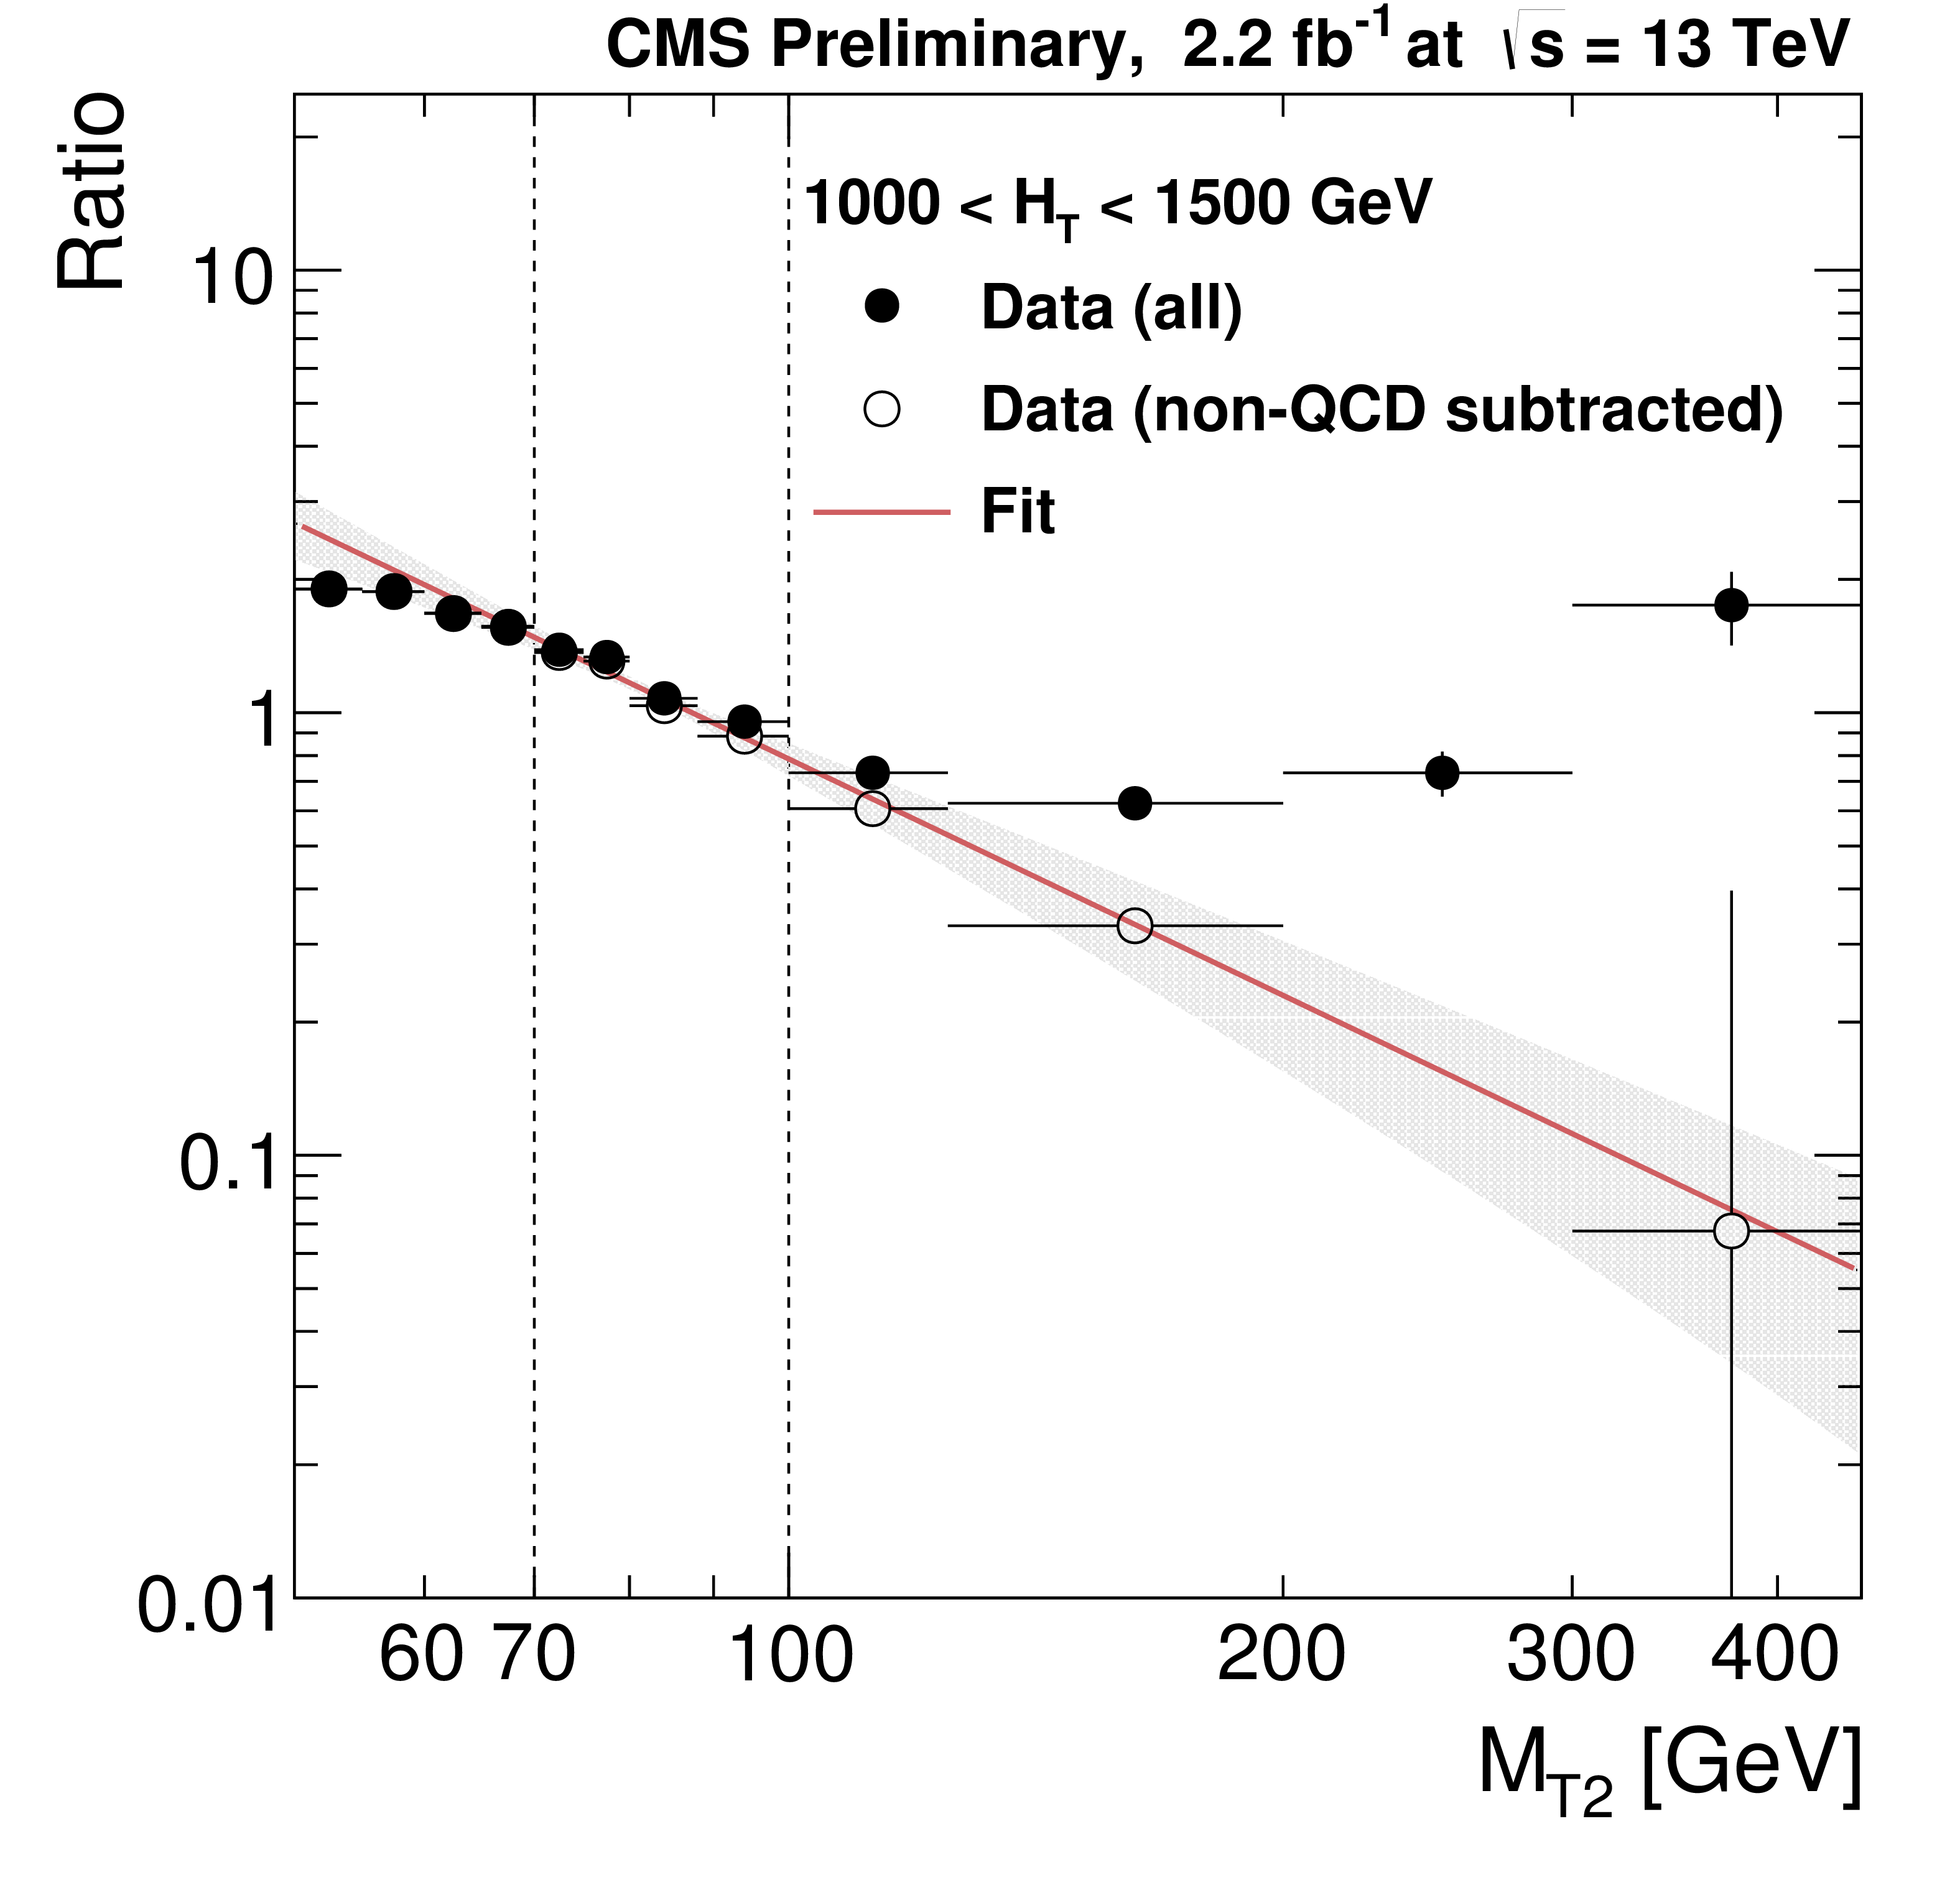
Figure 4:
Distribution of the ratio $r_{\phi }$ as a function of $ M_{\mathrm{T2}} $ for the high $ H_{\mathrm{T}} $ region. The fit is performed to the hollow, background-subtracted data points. The full points represent the data before subtracting non-QCD backgrounds using simulation. Data point uncertainties are statistical only. The red line and the band around it show the fit to a power-law function perfomed in the window 70 $< M_{\mathrm{T2}} <$ 100 GeV and the associated fit uncertainty. |
png pdf |
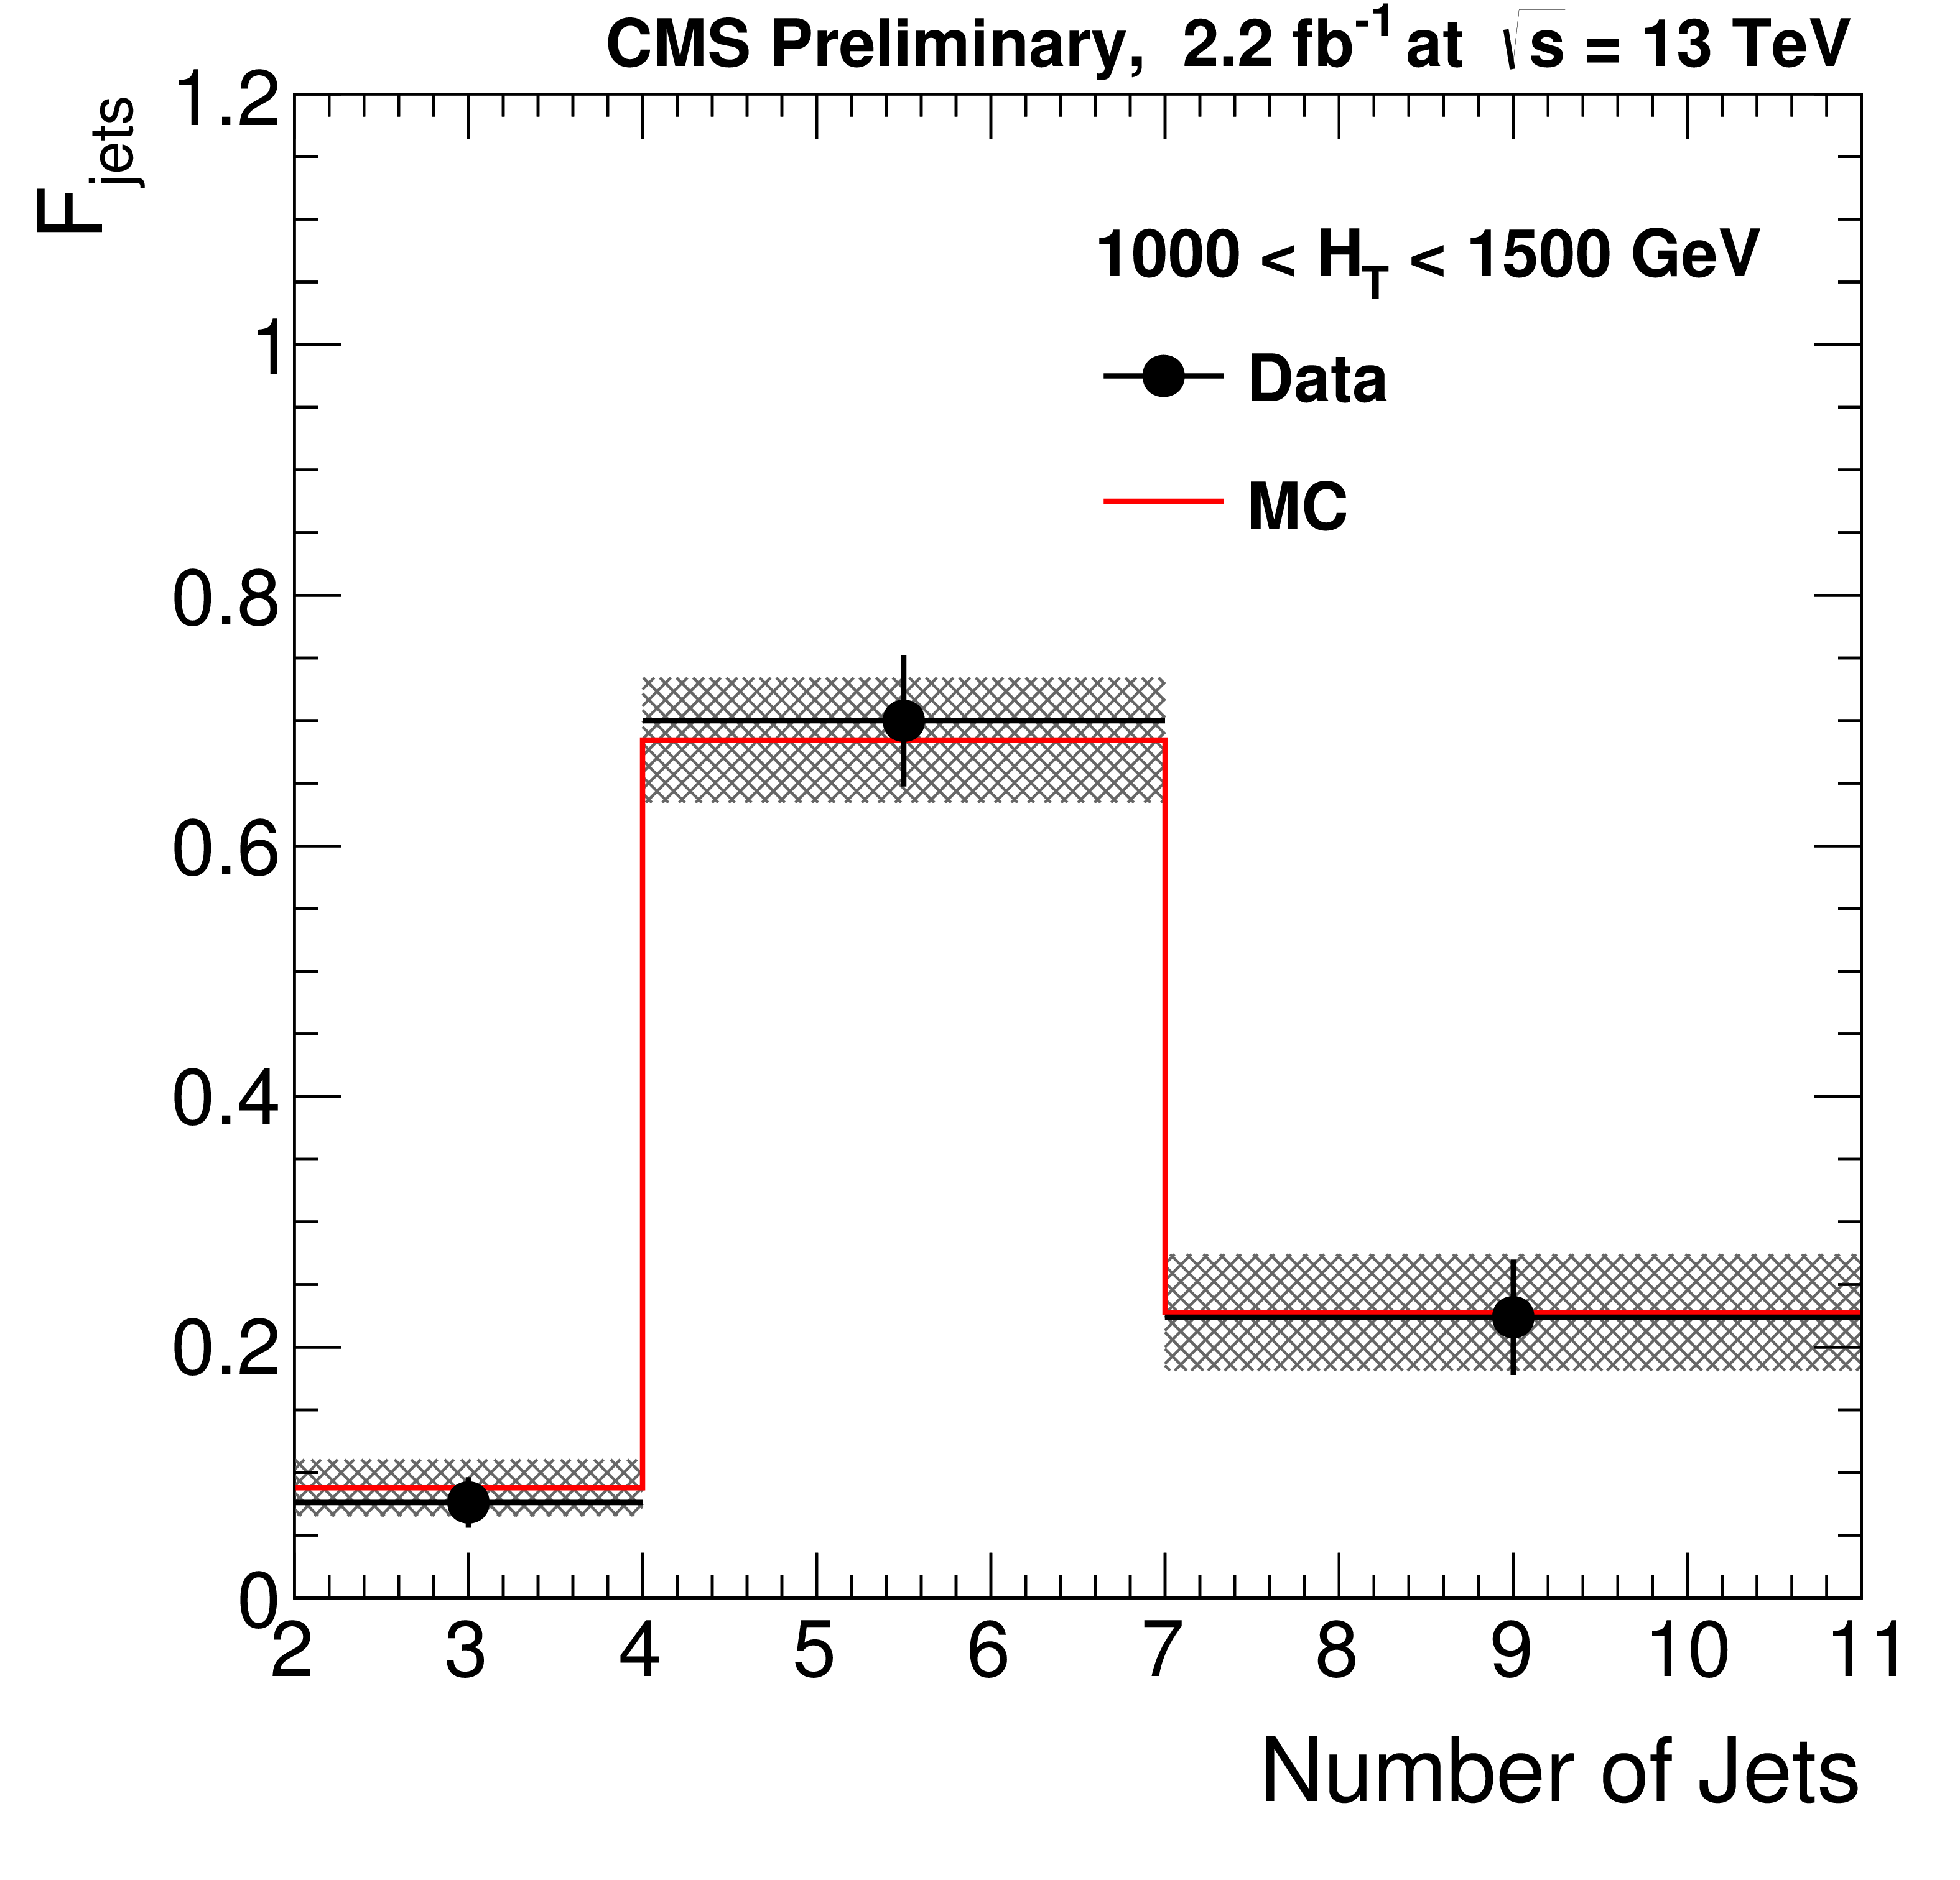
Figure 5-a:
Values of $f_j$ (a) and $r_b$ (b) measured in data after requiring $ {\Delta \phi _{\mathrm {min}}} <$ 0.3 radians and 100 $< M_{\mathrm{T2}} <$ 200 GeV. The bands represent both statistical and systematic uncertainties. |
png pdf |
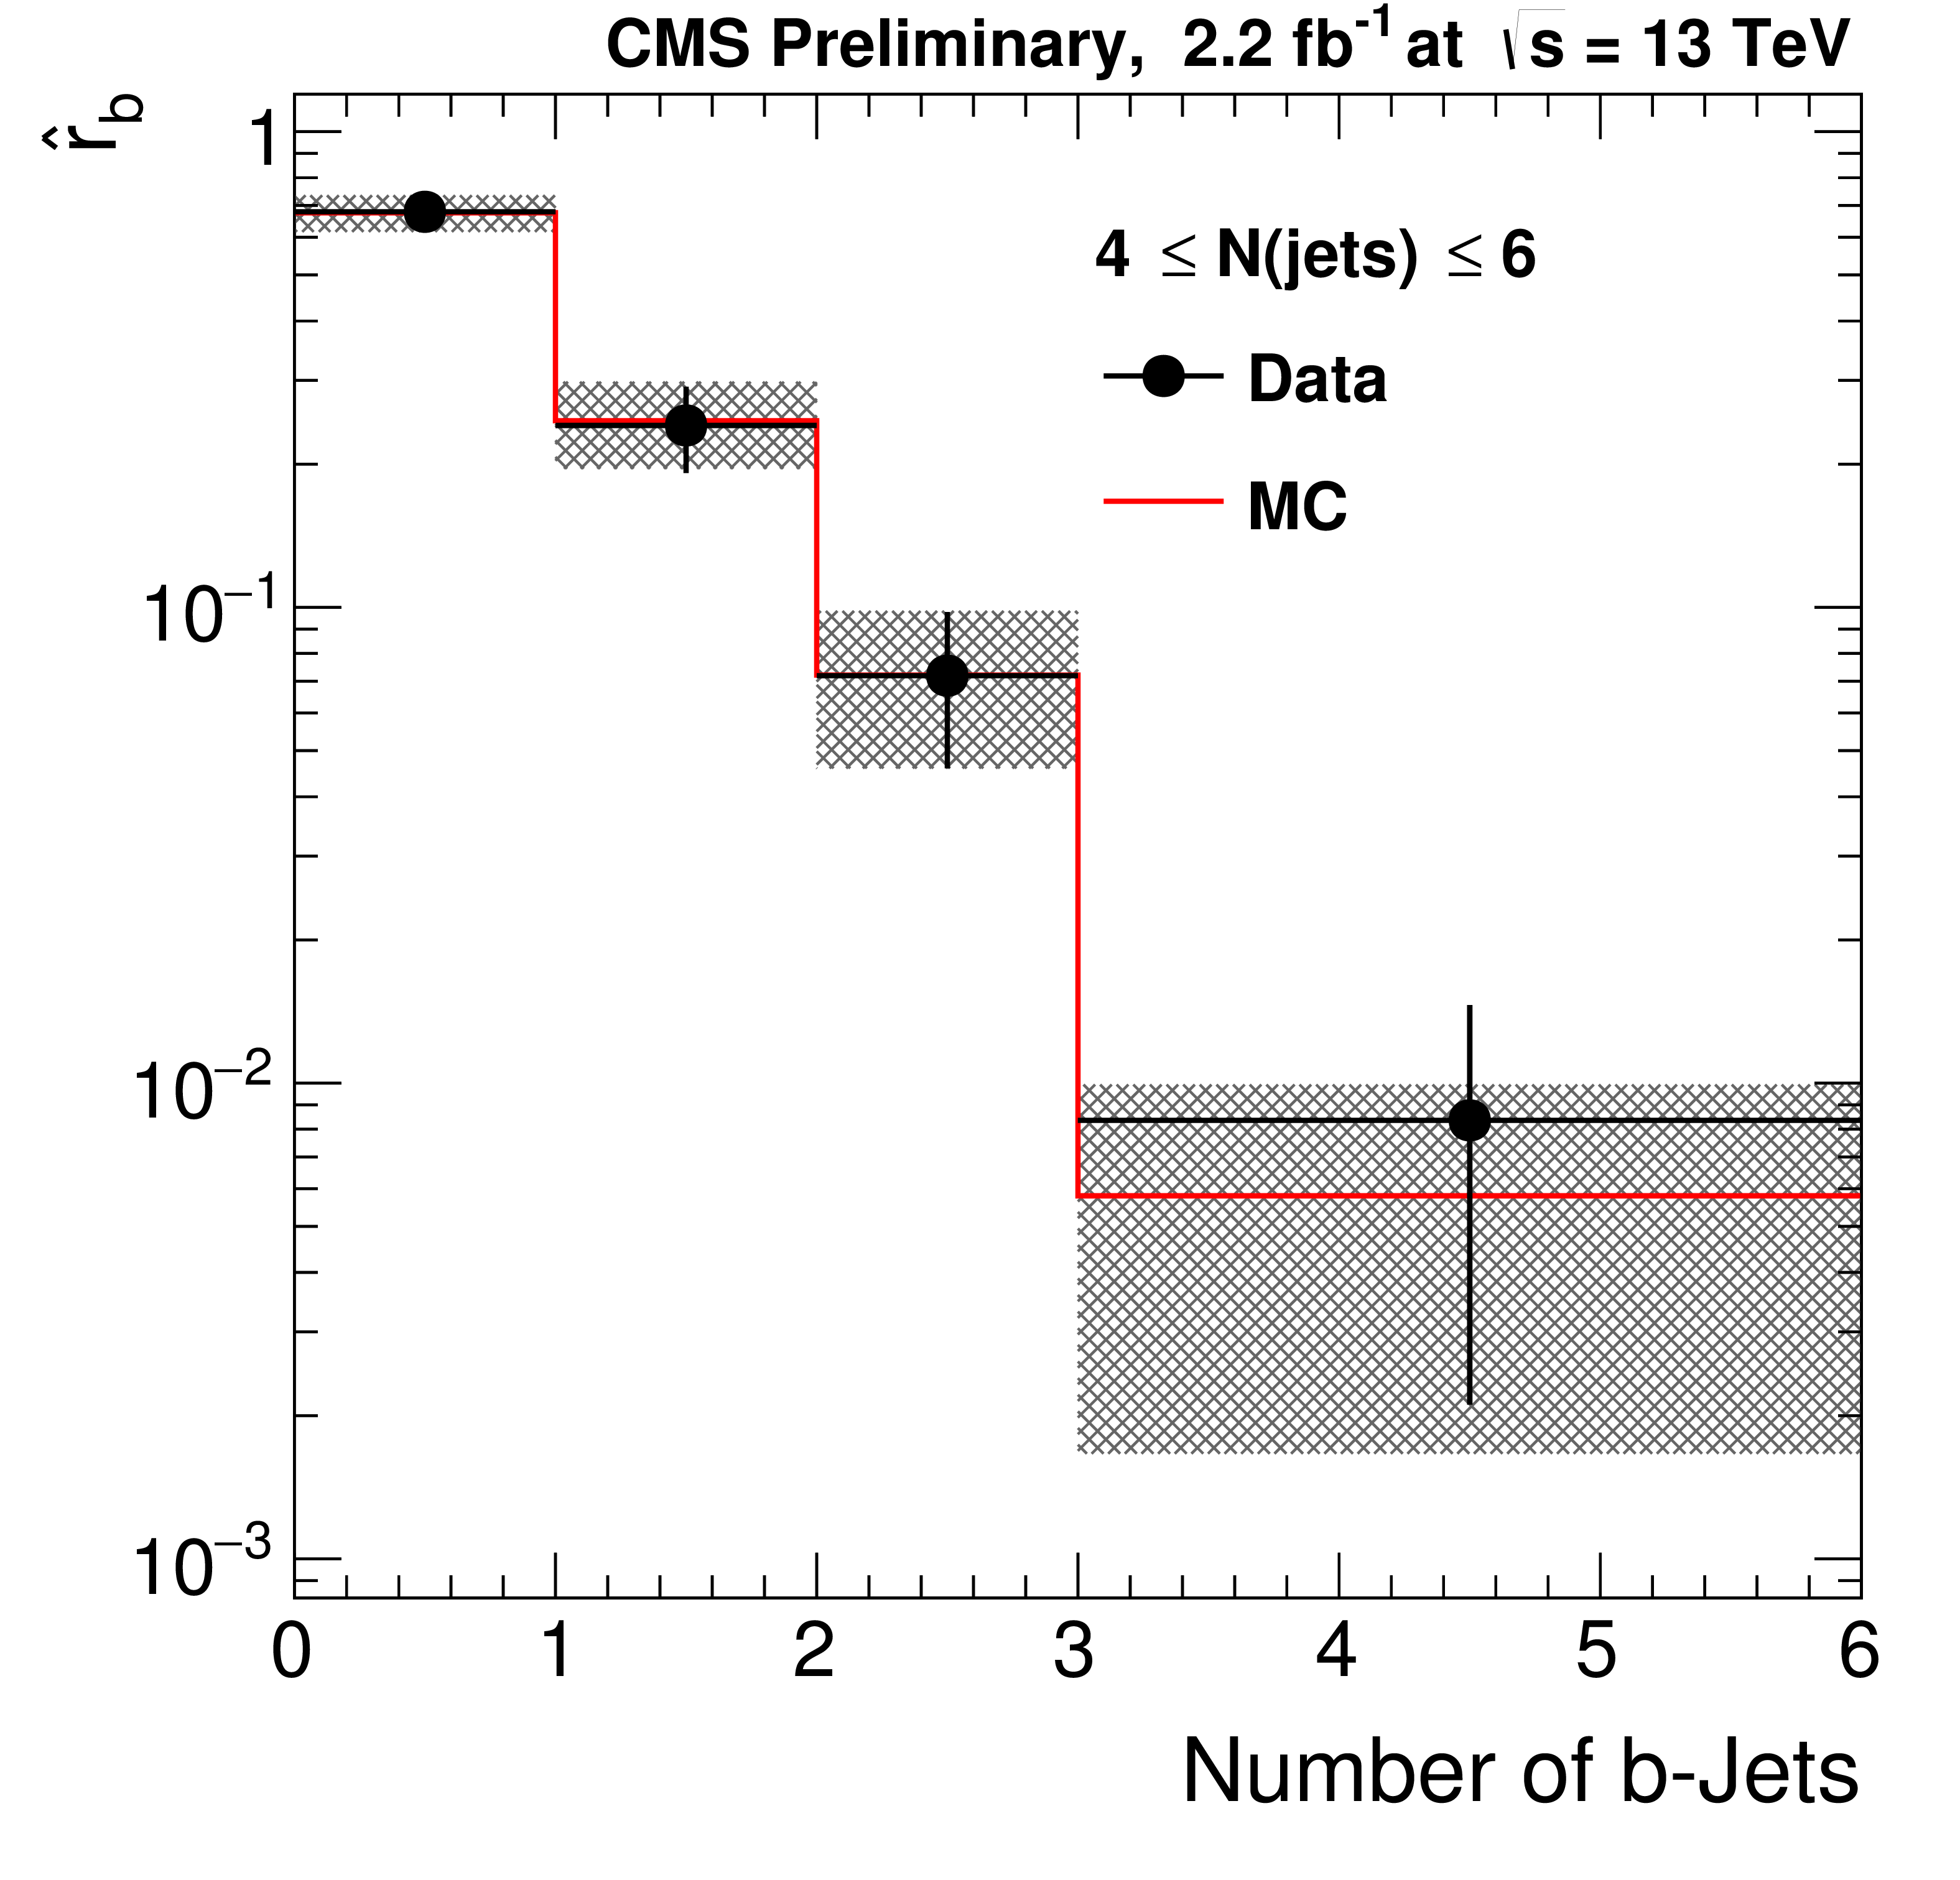
Figure 5-b:
Values of $f_j$ (a) and $r_b$ (b) measured in data after requiring $ {\Delta \phi _{\mathrm {min}}} <$ 0.3 radians and 100 $< M_{\mathrm{T2}} <$ 200 GeV. The bands represent both statistical and systematic uncertainties. |

png pdf |
Figure 6:
Comparison of the data-driven predictions of the multi-jet background in the toppological regions ($ M_{\mathrm{T2}} >$ 200 GeV) from the R\&S method and the $ {\Delta \phi _{\mathrm {min}}} $-ratio method. The uncertainties are statistical and systematic. Within each of the four $ H_{\mathrm{T}} $ categories, all the estimates from the $ {\Delta \phi _{\mathrm {min}}} $-ratio method are correlated because they are derived from the same fit to the $ {\Delta \phi _{\mathrm {min}}} $-ratio data. |

png pdf |
Figure 7-a:
(a) Comparison of estimated background and observed data events in each topological region. Hatched bands represent the full uncertainty on the background estimate. (b) Same for individual $ M_{\mathrm{T2}} $ signal bins in the medium $ H_{\mathrm{T}} $ region. On the $x$-axis, the $ M_{\mathrm{T2}} $ binning is shown (in GeV). Bins with no entry for data have an observed count of 0. |
png pdf |
Figure 7-b:
(a) Comparison of estimated background and observed data events in each topological region. Hatched bands represent the full uncertainty on the background estimate. (b) Same for individual $ M_{\mathrm{T2}} $ signal bins in the medium $ H_{\mathrm{T}} $ region. On the $x$-axis, the $ M_{\mathrm{T2}} $ binning is shown (in GeV). Bins with no entry for data have an observed count of 0. |

png pdf |
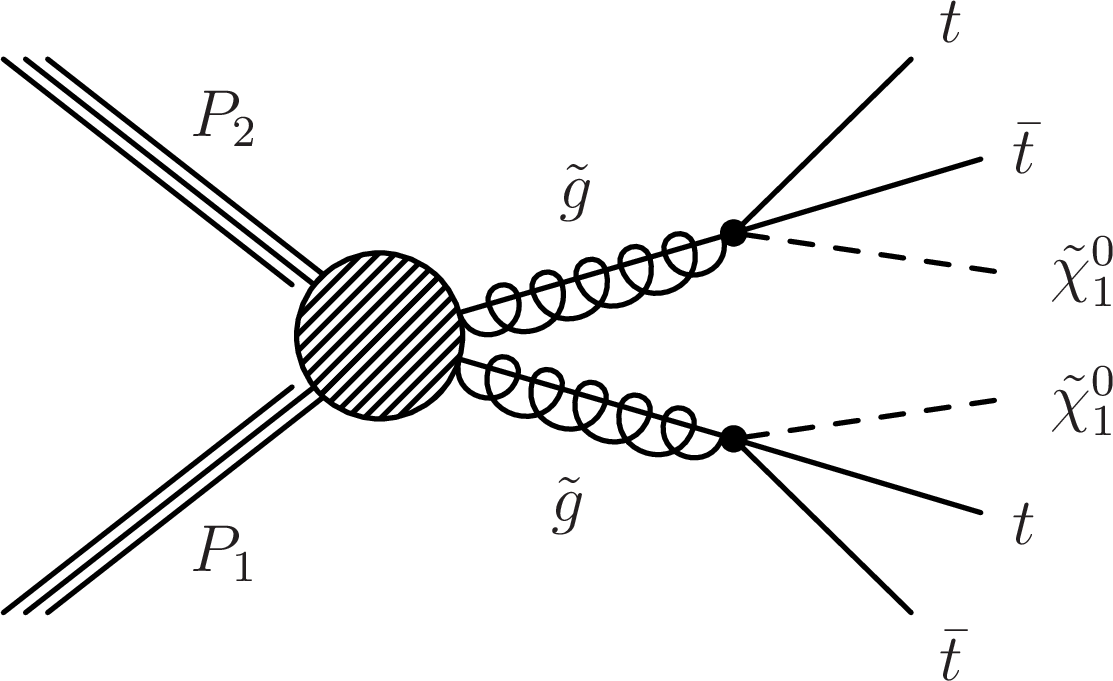
Figure 8-a:
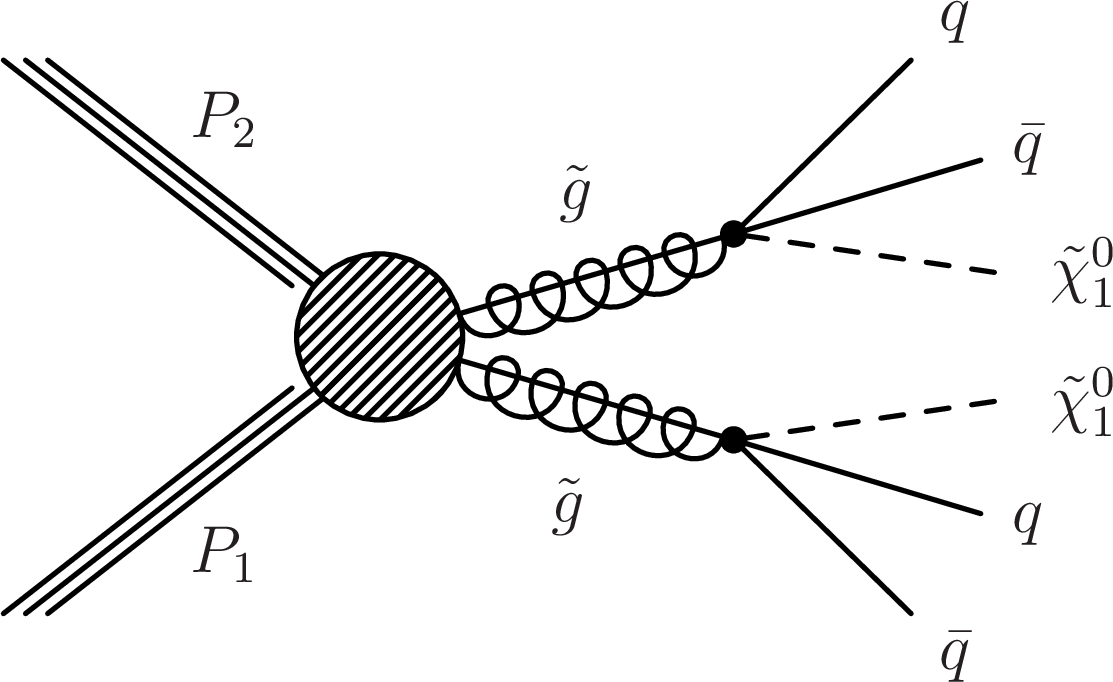
Diagrams for the three scenarios of gluino mediated bottom squark, top squark and light flavor squark production considered. |
png pdf |
Figure 8-b:
Diagrams for the three scenarios of gluino mediated bottom squark, top squark and light flavor squark production considered. |
png pdf |
Figure 8-c:
Diagrams for the three scenarios of gluino mediated bottom squark, top squark and light flavor squark production considered. |
png pdf |
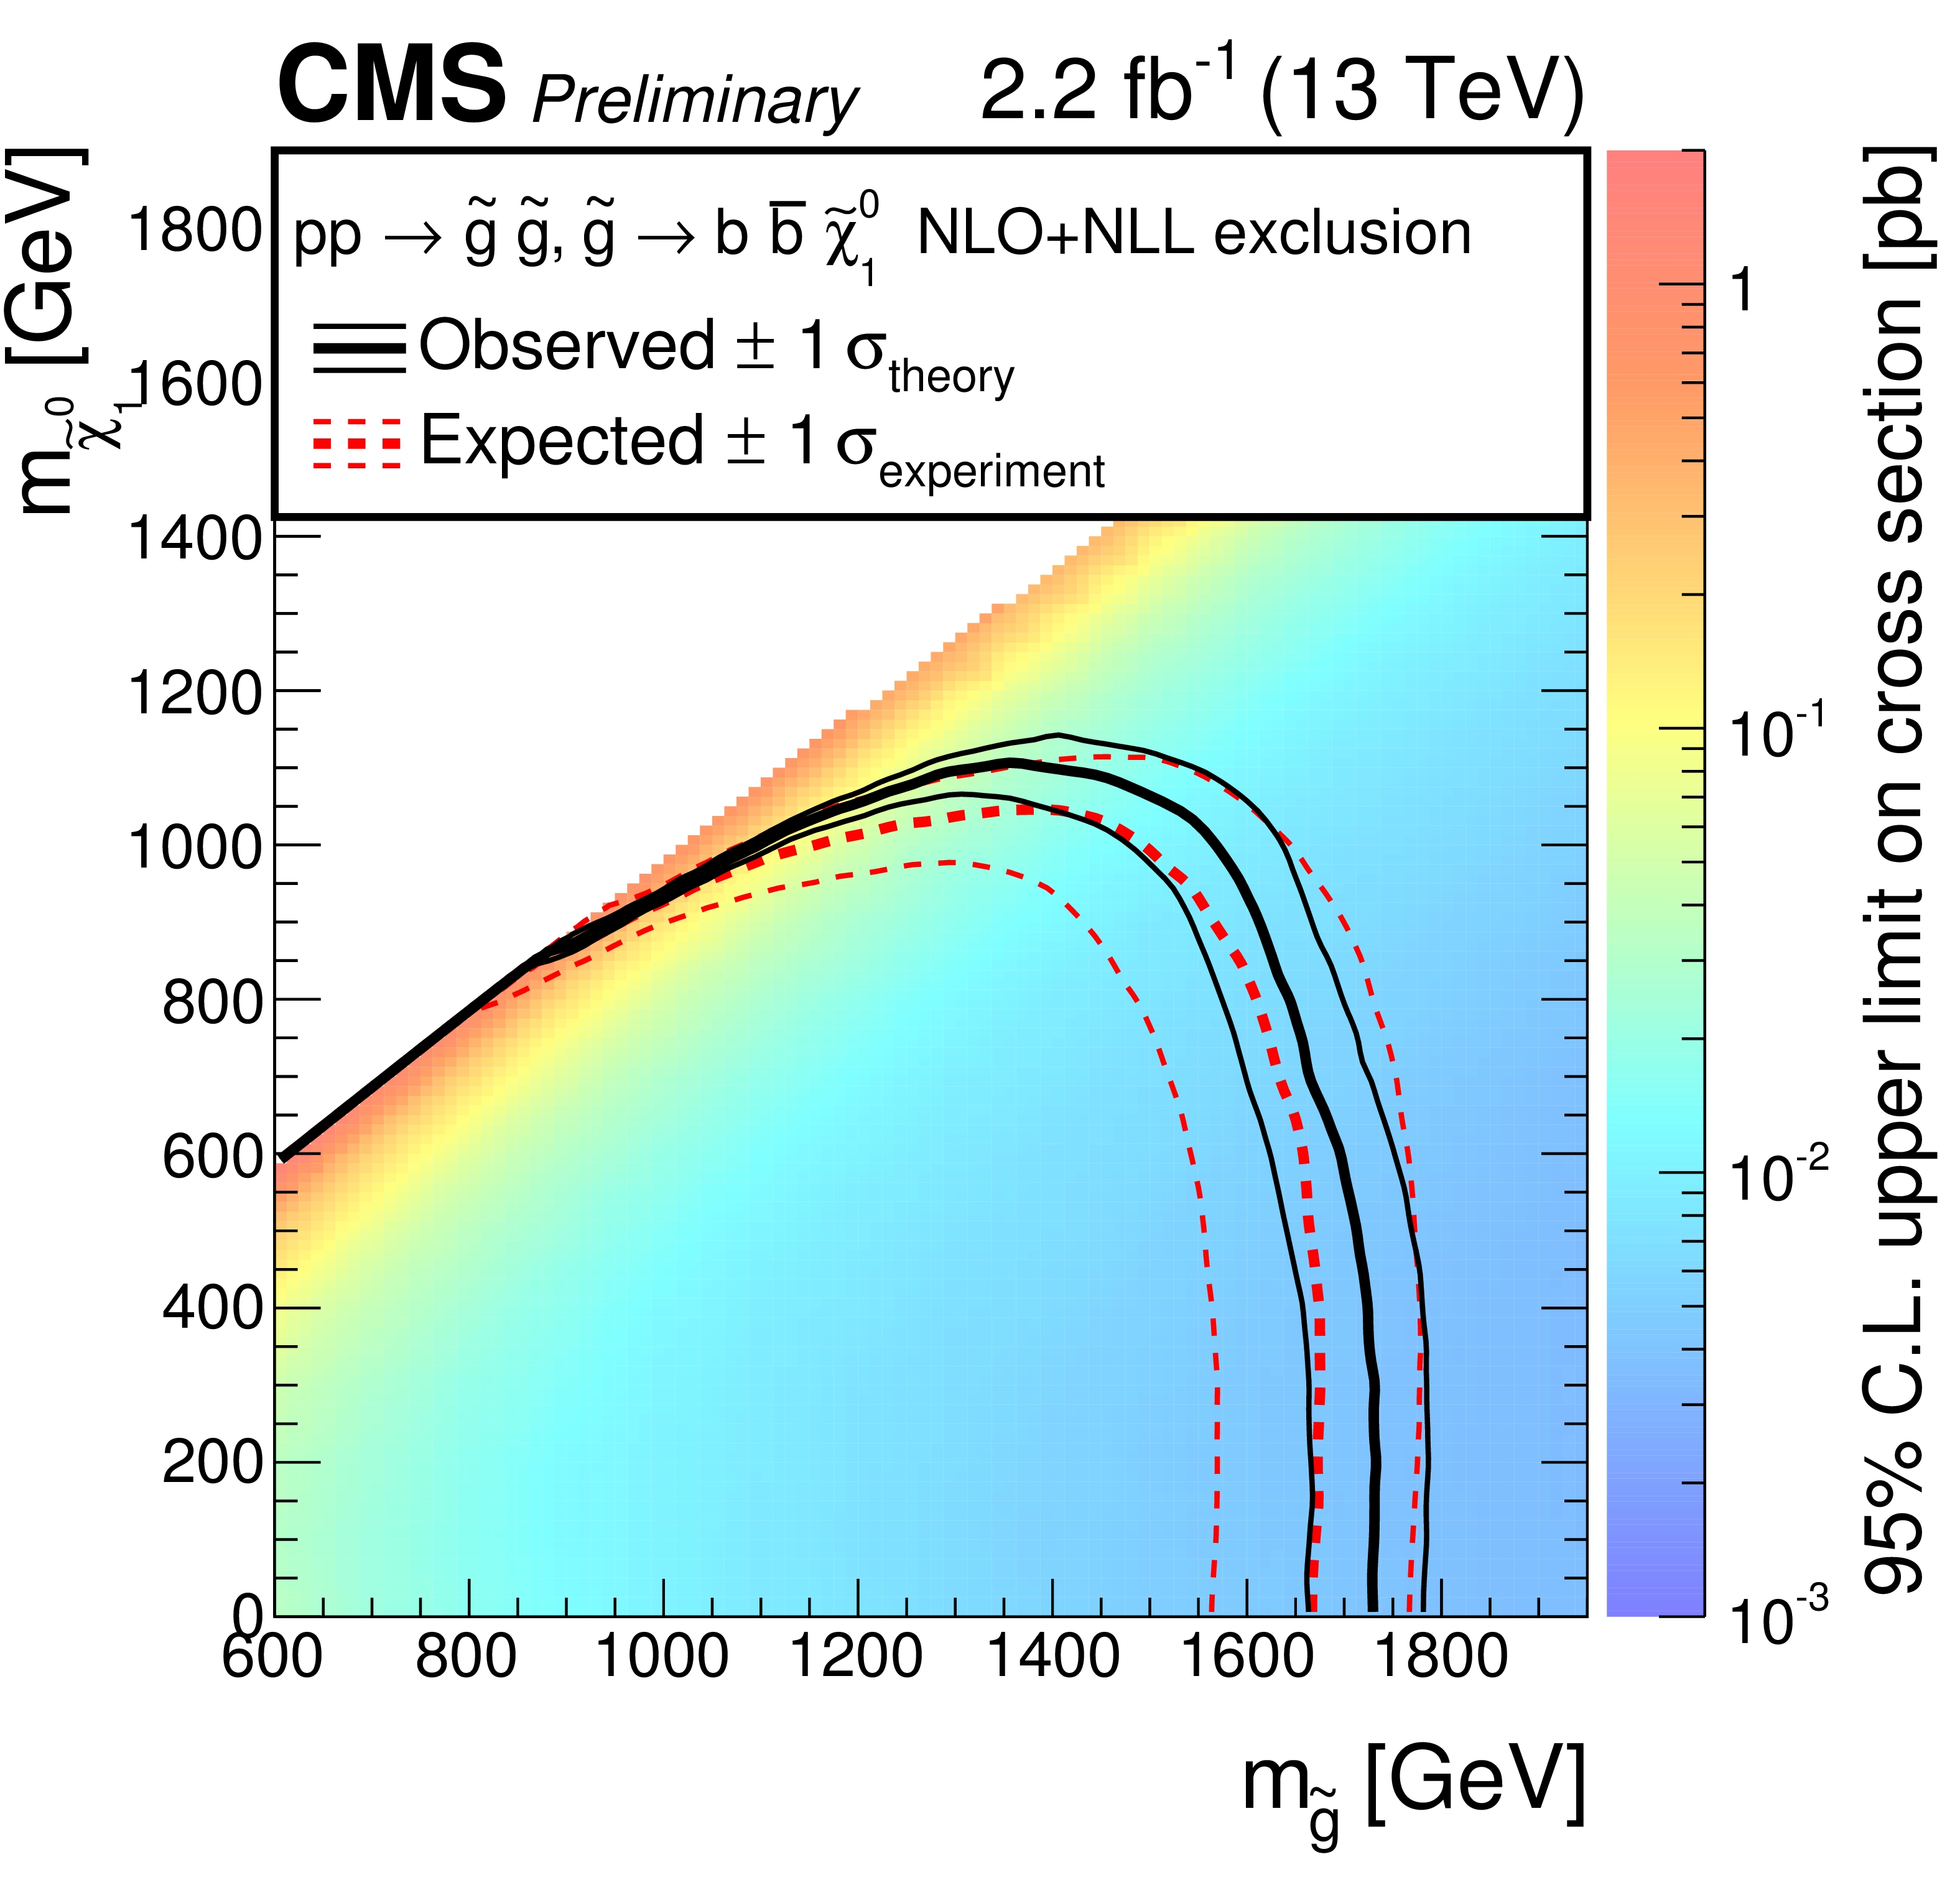
Figure 9:
Exclusion limit at 95% CL for gluino mediated bottom-squark production. The area to the left of and below the thick black curve represents the observed exclusion region, while the dashed red lines indicate the expected limit and $\pm $1 standard-deviation. The thin black lines show the effect of the theoretical cross section uncertainties. |
png pdf |
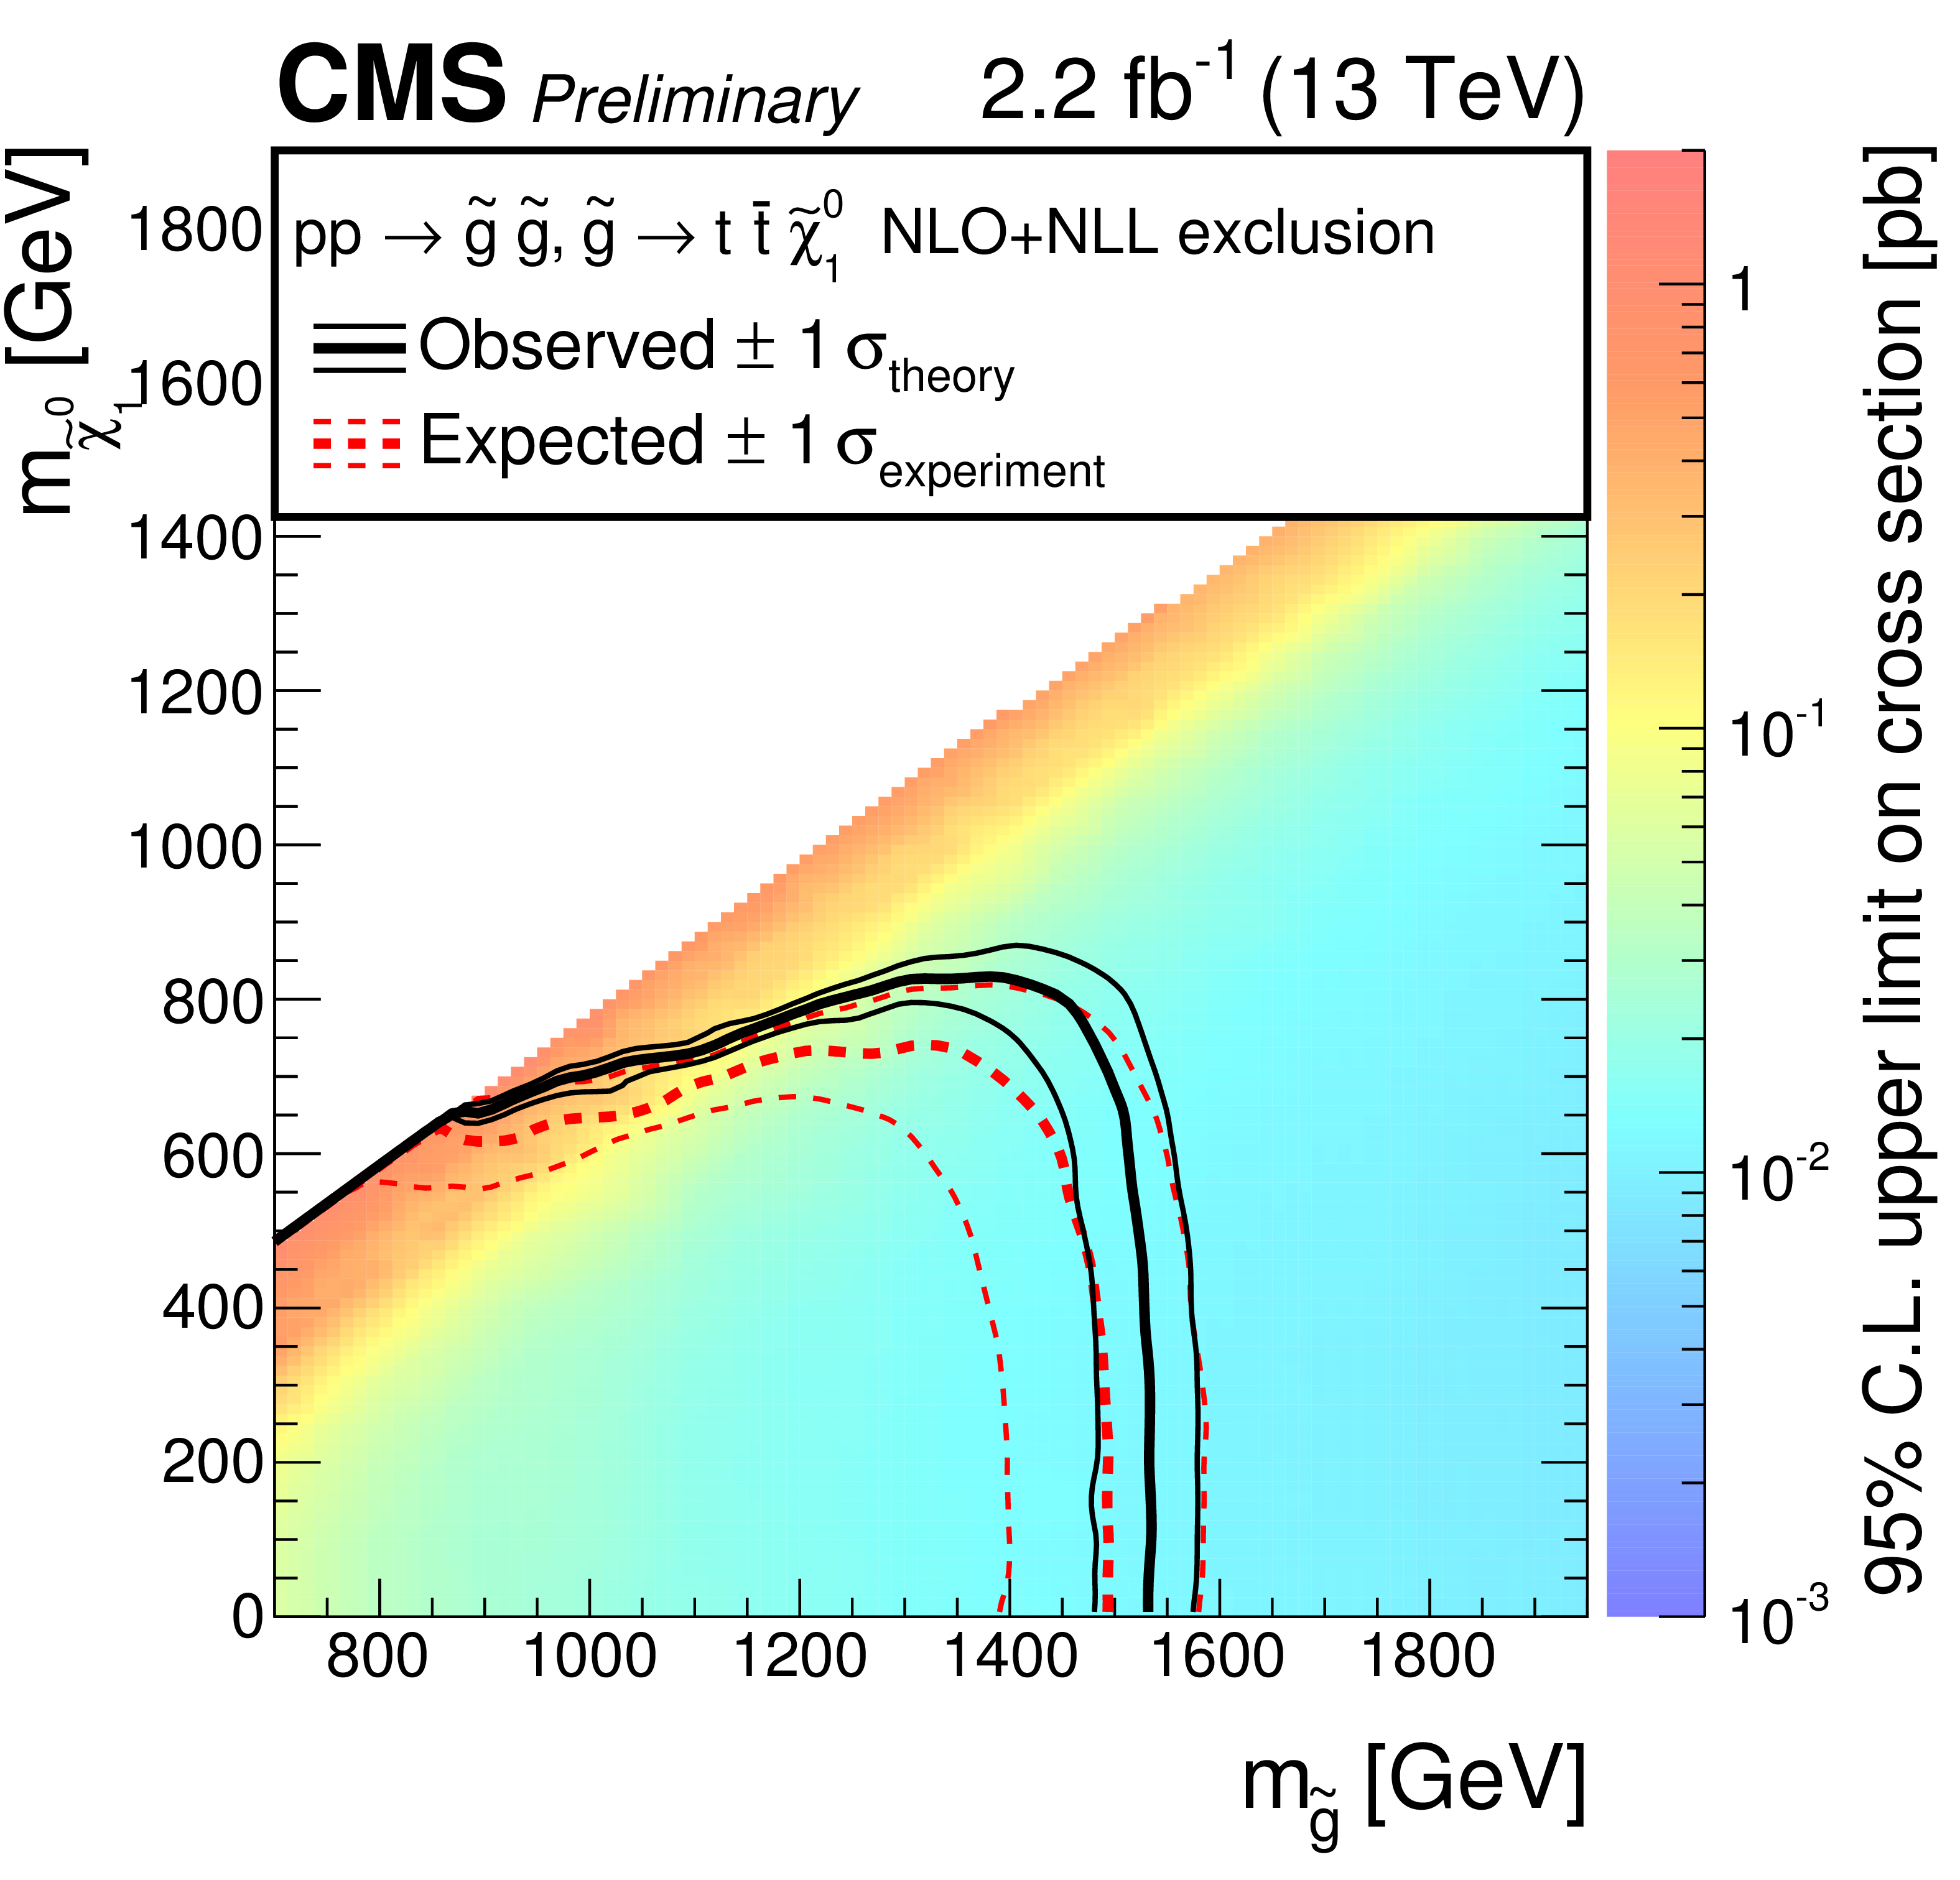
Figure 10:
Exclusion limit at 95% CL for gluino mediated top-squark production. The area to the left of and below the thick black curve represents the observed exclusion region, while the dashed red lines indicate the expected limit and $\pm $1 standard-deviation. The thin black lines show the effect of the theoretical cross section uncertainties. |
png pdf |
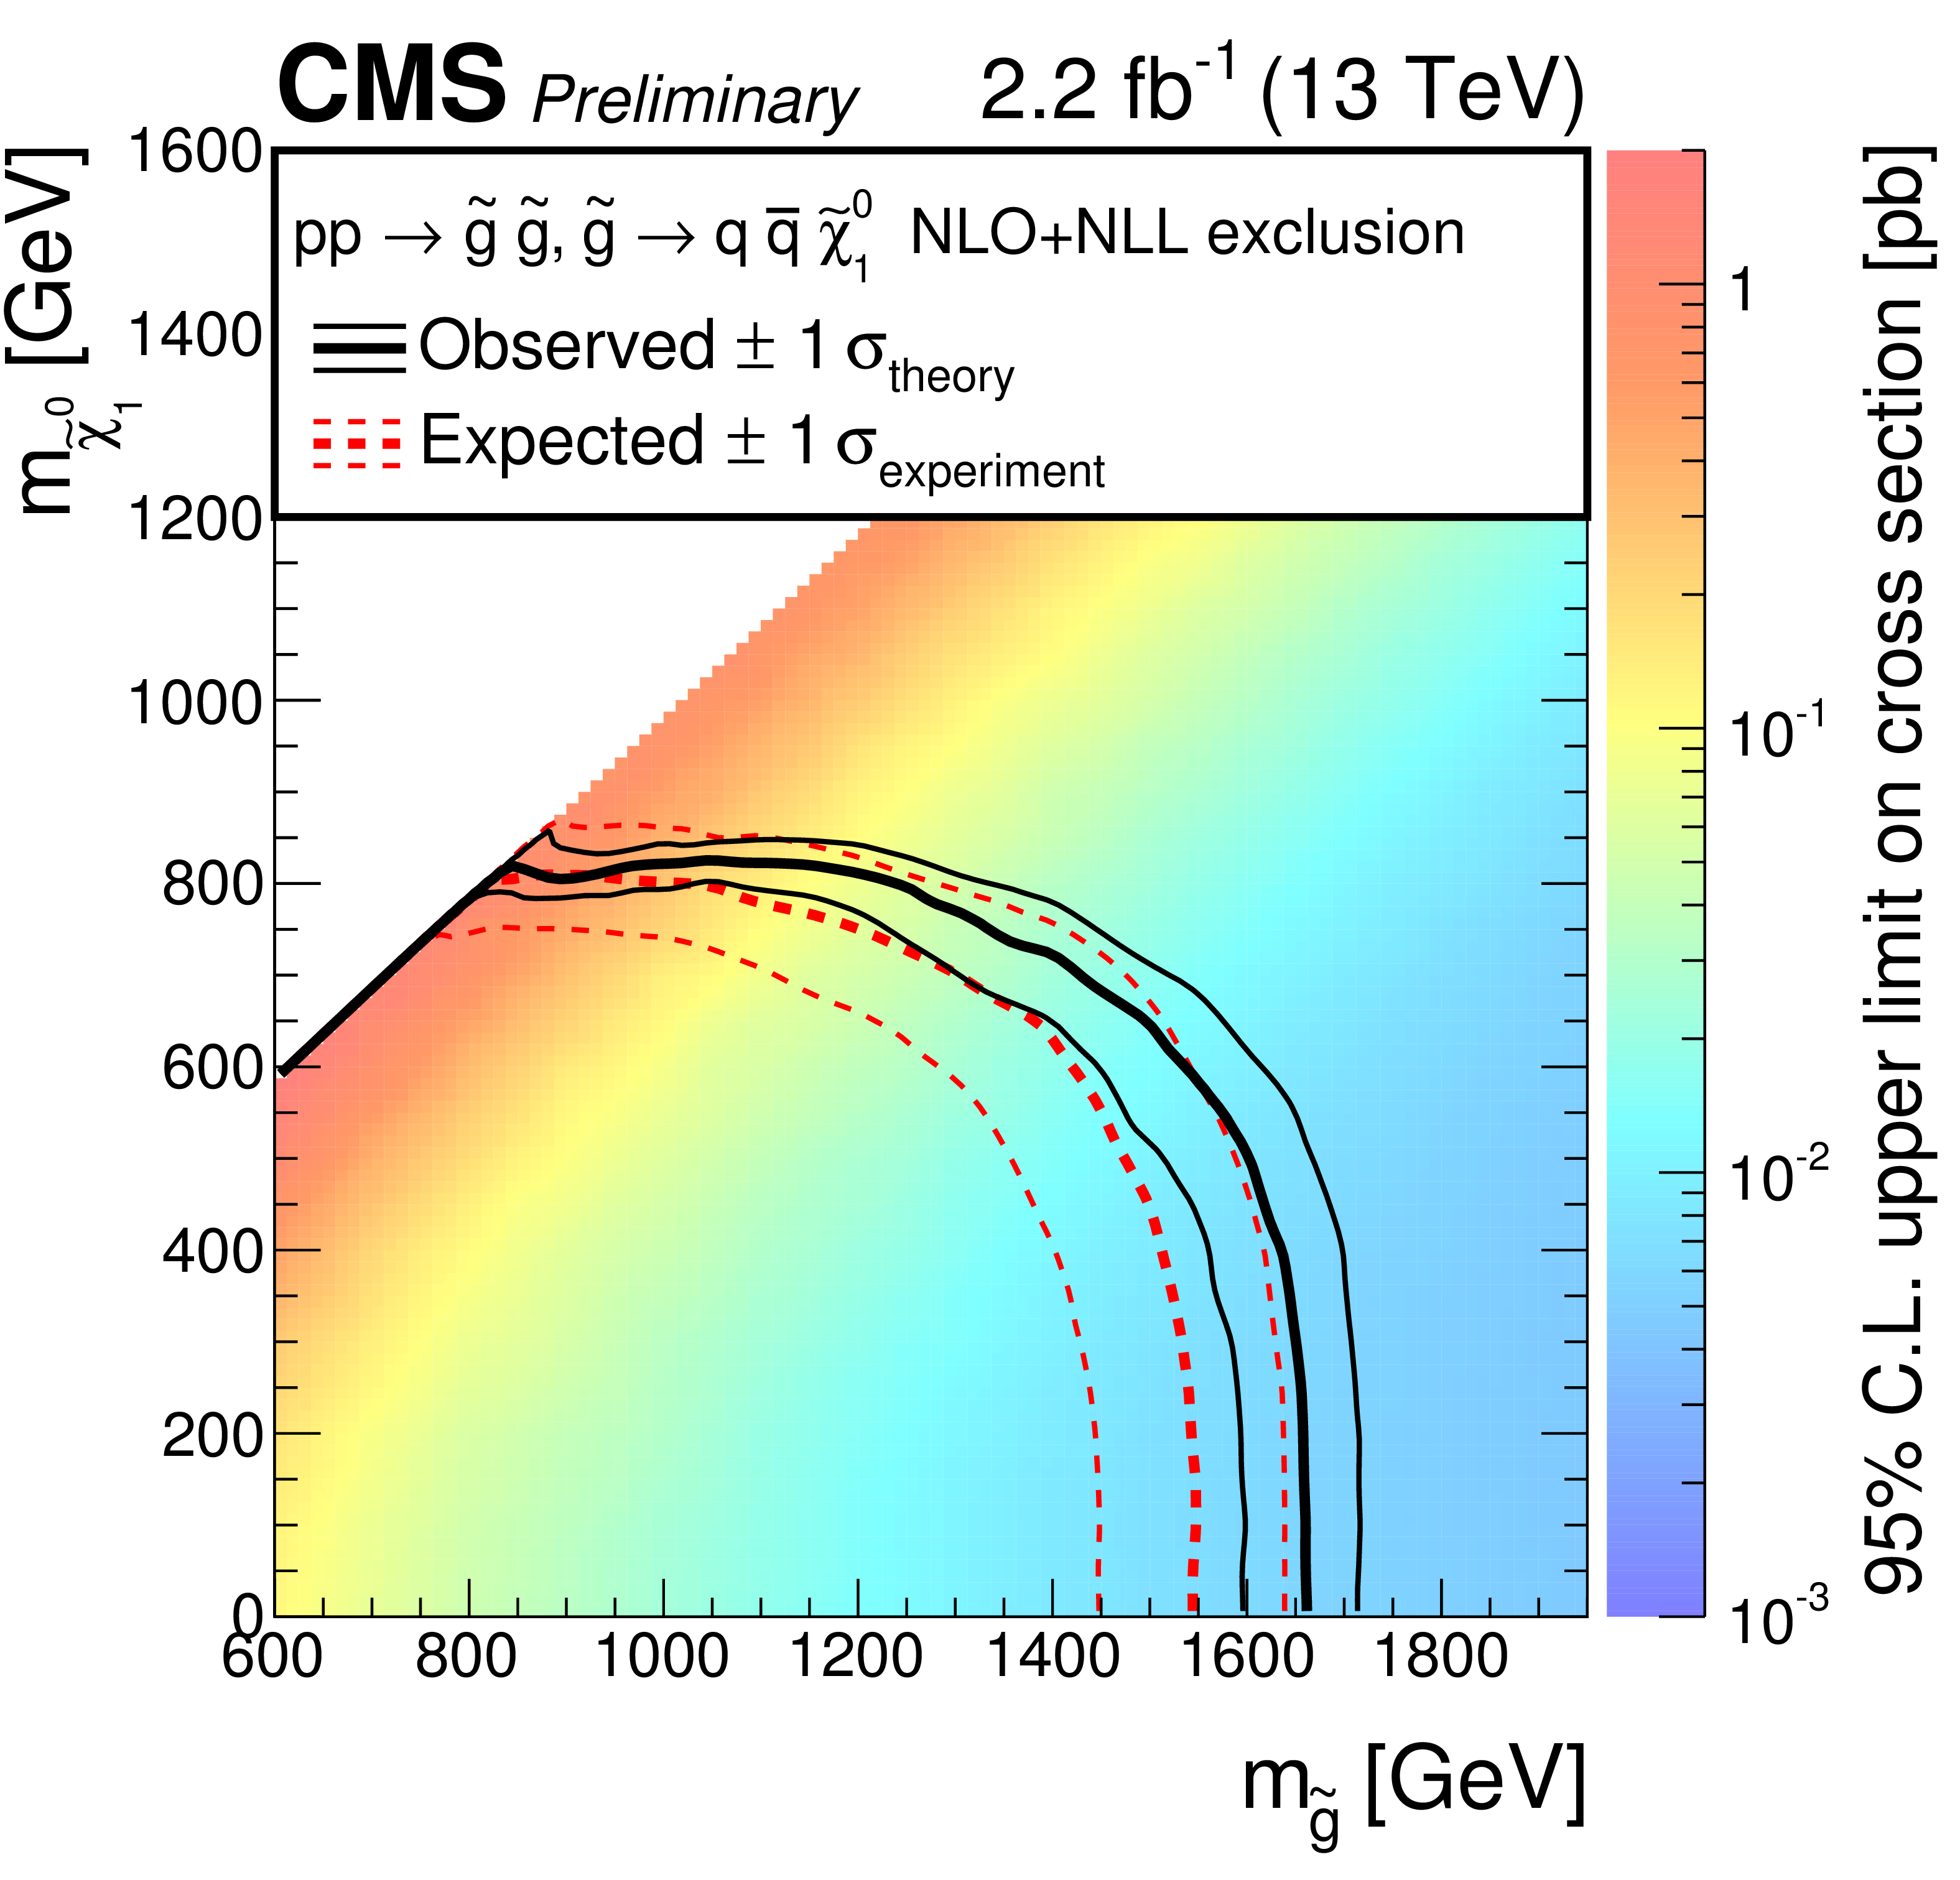
Figure 11:
Exclusion limit at 95% CL for gluino mediated squark production, where the squark can be any of the first two generations. The area to the left of and below the thick black curve represents the observed exclusion region, while the dashed red lines indicate the expected limit and $\pm $1 standard-deviation. The thin black lines show the effect of the theoretical cross section uncertainties. |
png pdf |
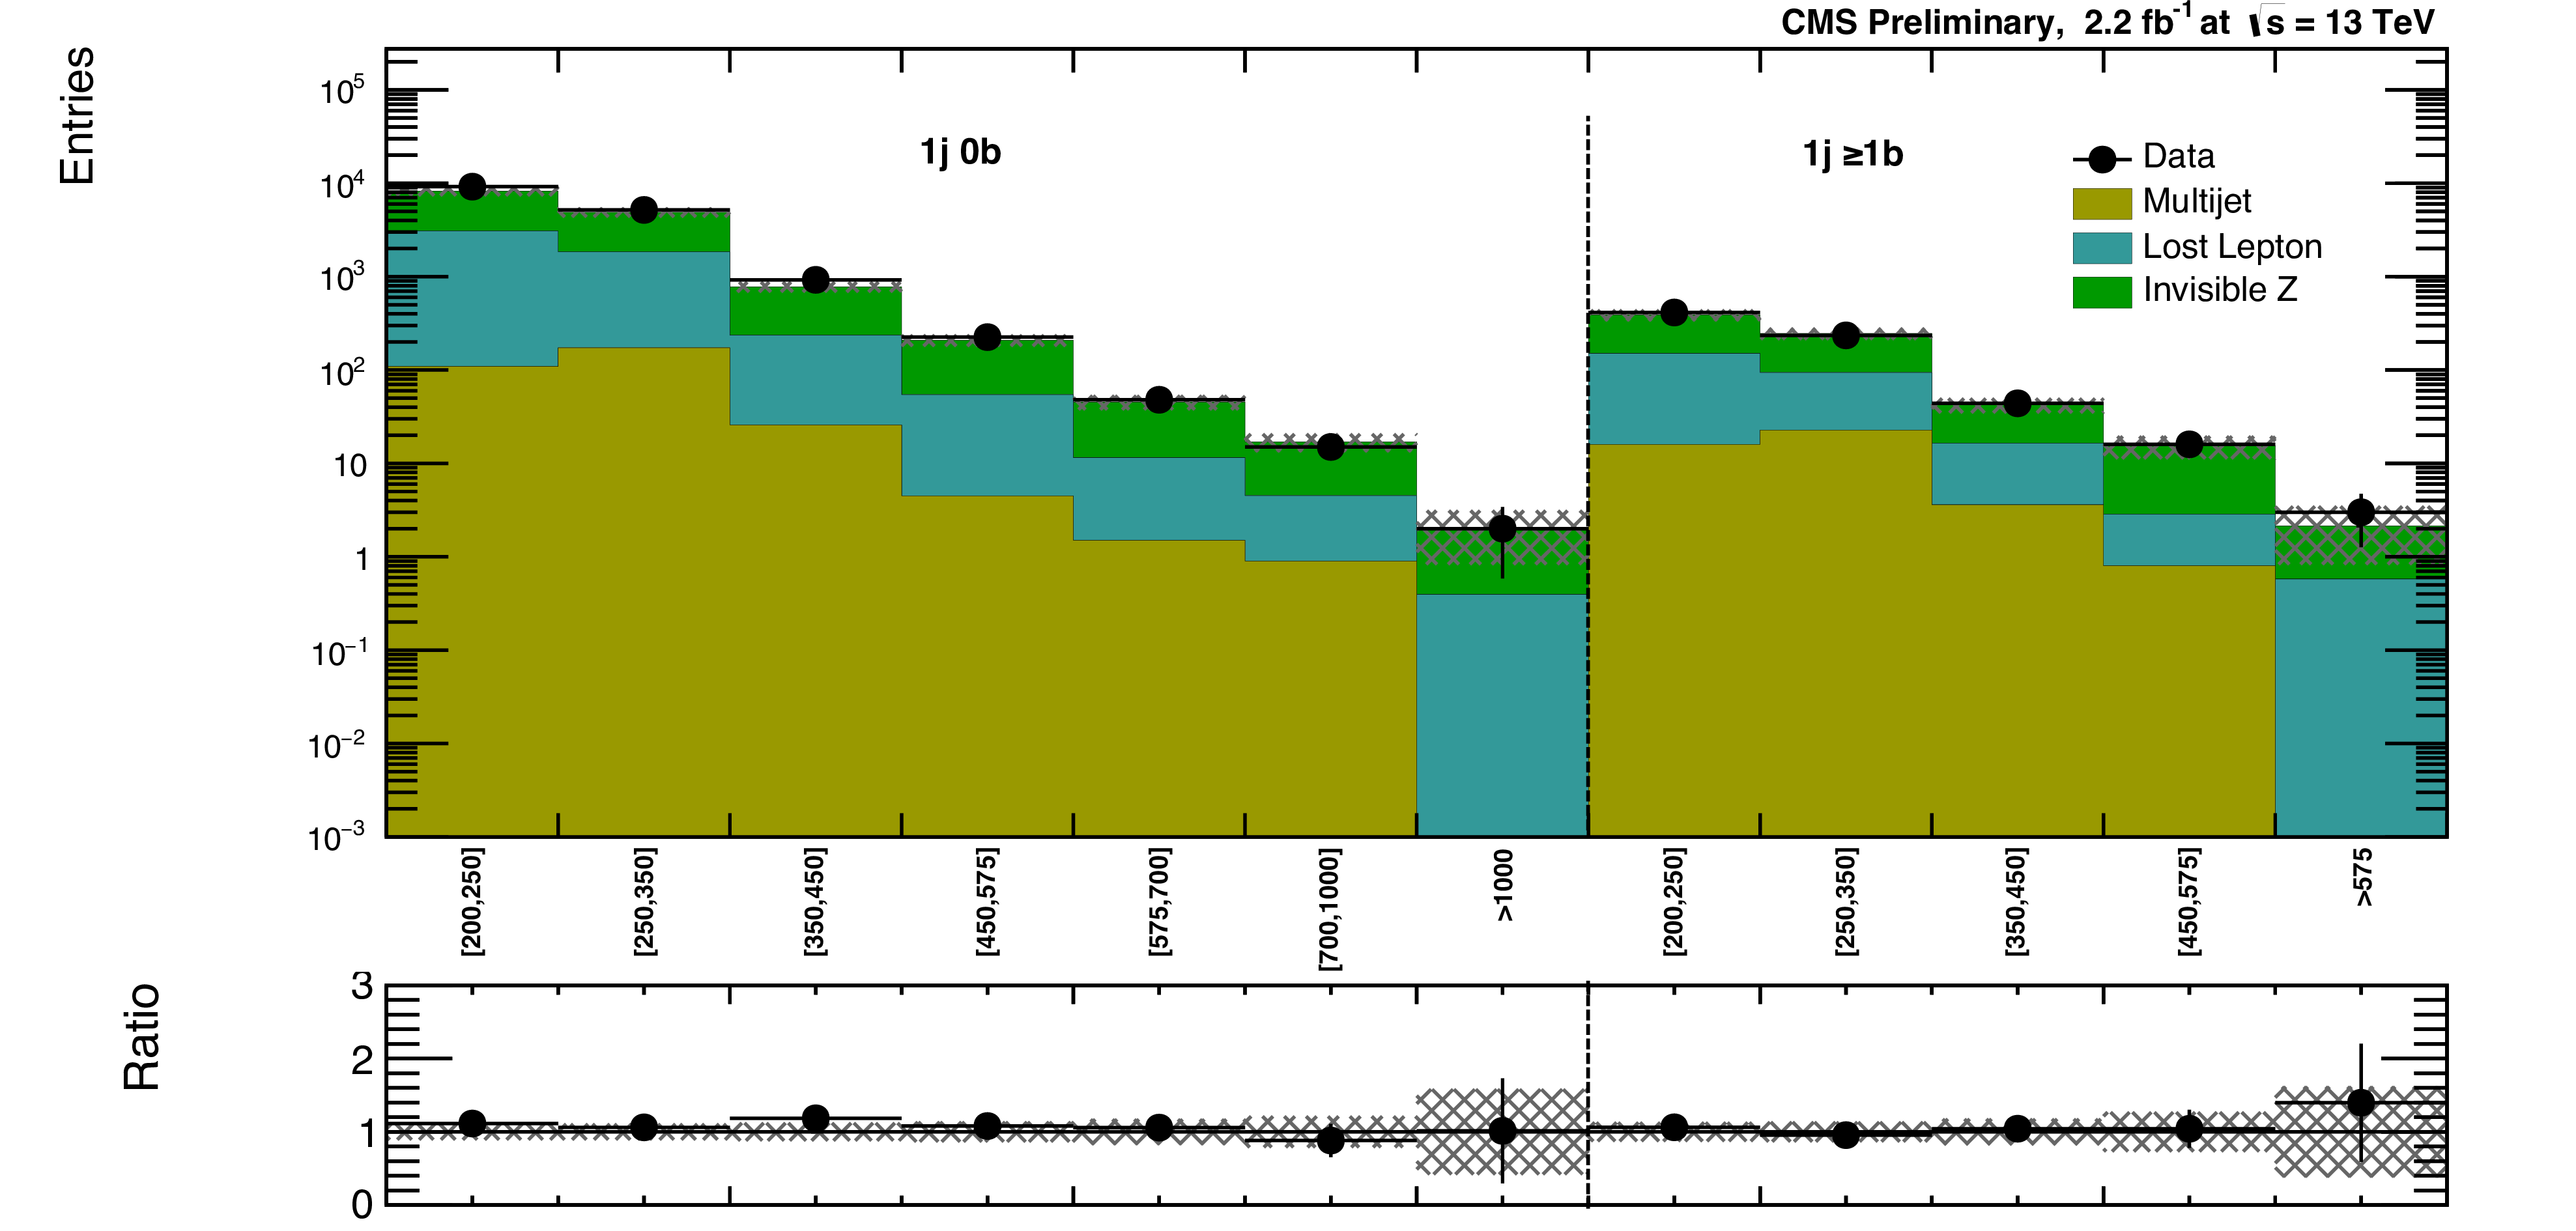
Figure 12-a:
(a) Comparison of the estimated background and observed data events in each signal bin in the mono-jet region. On the $x$-axis, the $ H_{\mathrm{T}} $ binning is shown (in GeV). Hatched bands represent the full uncertainty on the background estimate. (Below) Same for the very low $ H_{\mathrm{T}} $ region. On the $x$-axis, the $ M_{\mathrm{T2}} $ binning is shown (in GeV). Bins with no entry for data have an observed count of 0. |
png pdf |
Figure 12-b:
(a) Comparison of the estimated background and observed data events in each signal bin in the mono-jet region. On the $x$-axis, the $ H_{\mathrm{T}} $ binning is shown (in GeV). Hatched bands represent the full uncertainty on the background estimate. (Below) Same for the very low $ H_{\mathrm{T}} $ region. On the $x$-axis, the $ M_{\mathrm{T2}} $ binning is shown (in GeV). Bins with no entry for data have an observed count of 0. |
png pdf |
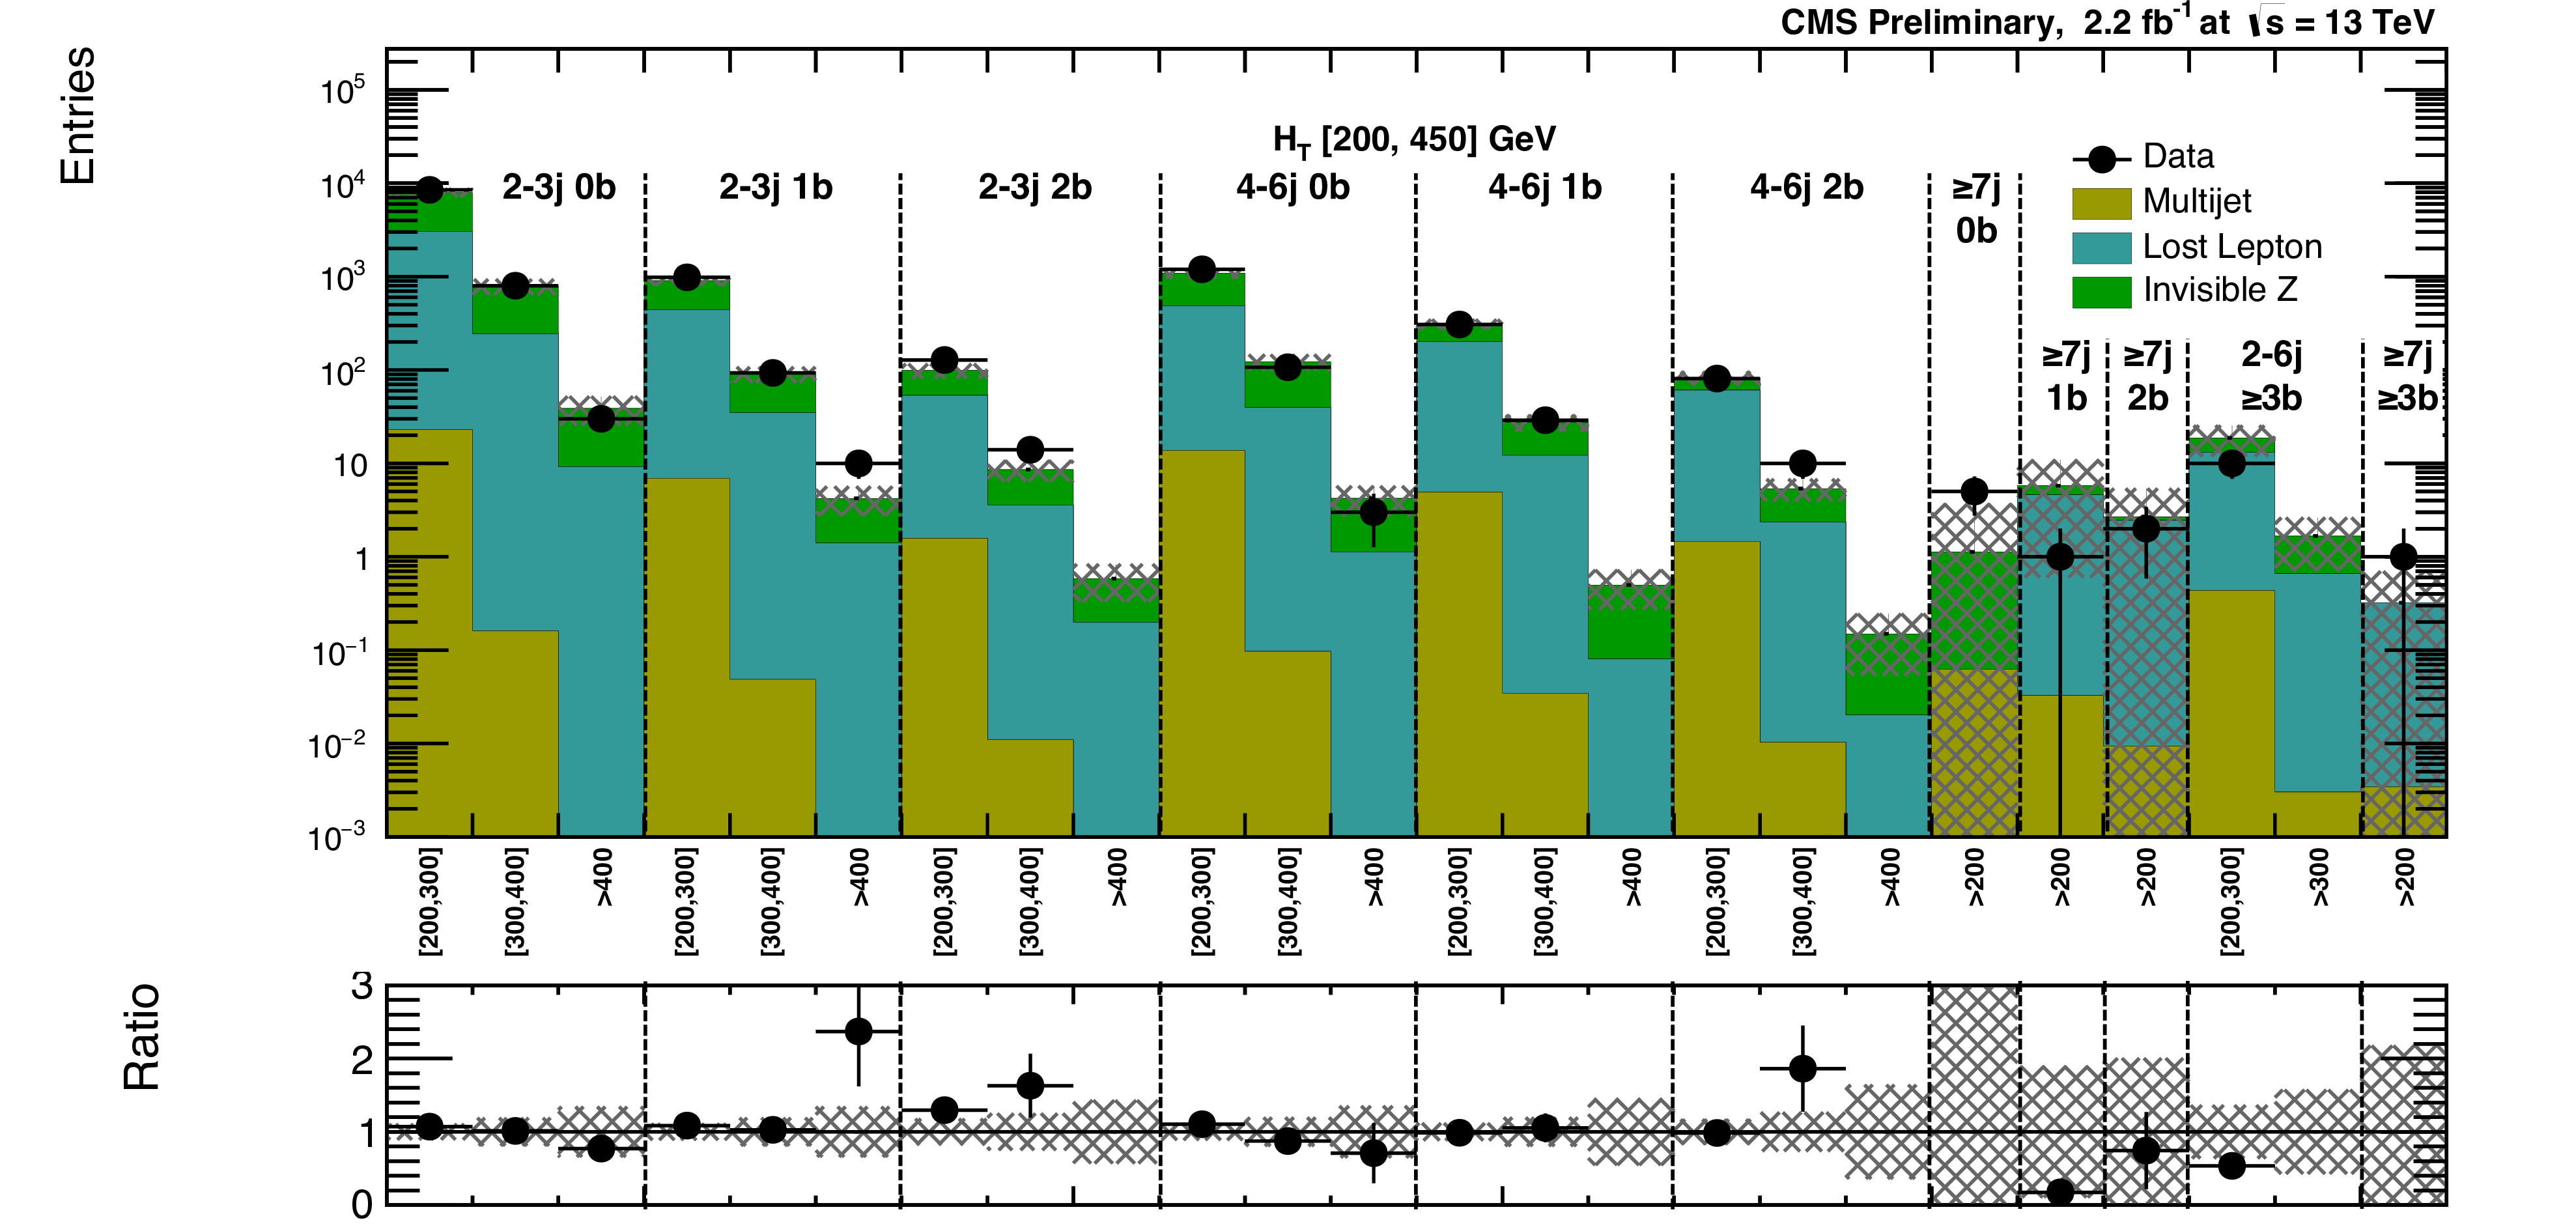
Figure 13-a:
(a) Comparison of the estimated background and observed data events in each signal bin in the low $ H_{\mathrm{T}} $ region. Hatched bands represent the full uncertainty on the background estimate. Same for the high (middle) and extreme (b) $ H_{\mathrm{T}} $ regions. On the $x$-axis, the $ M_{\mathrm{T2}} $ binning is shown (in GeV). Bins with no entry for data have an observed count of 0. |

png pdf |
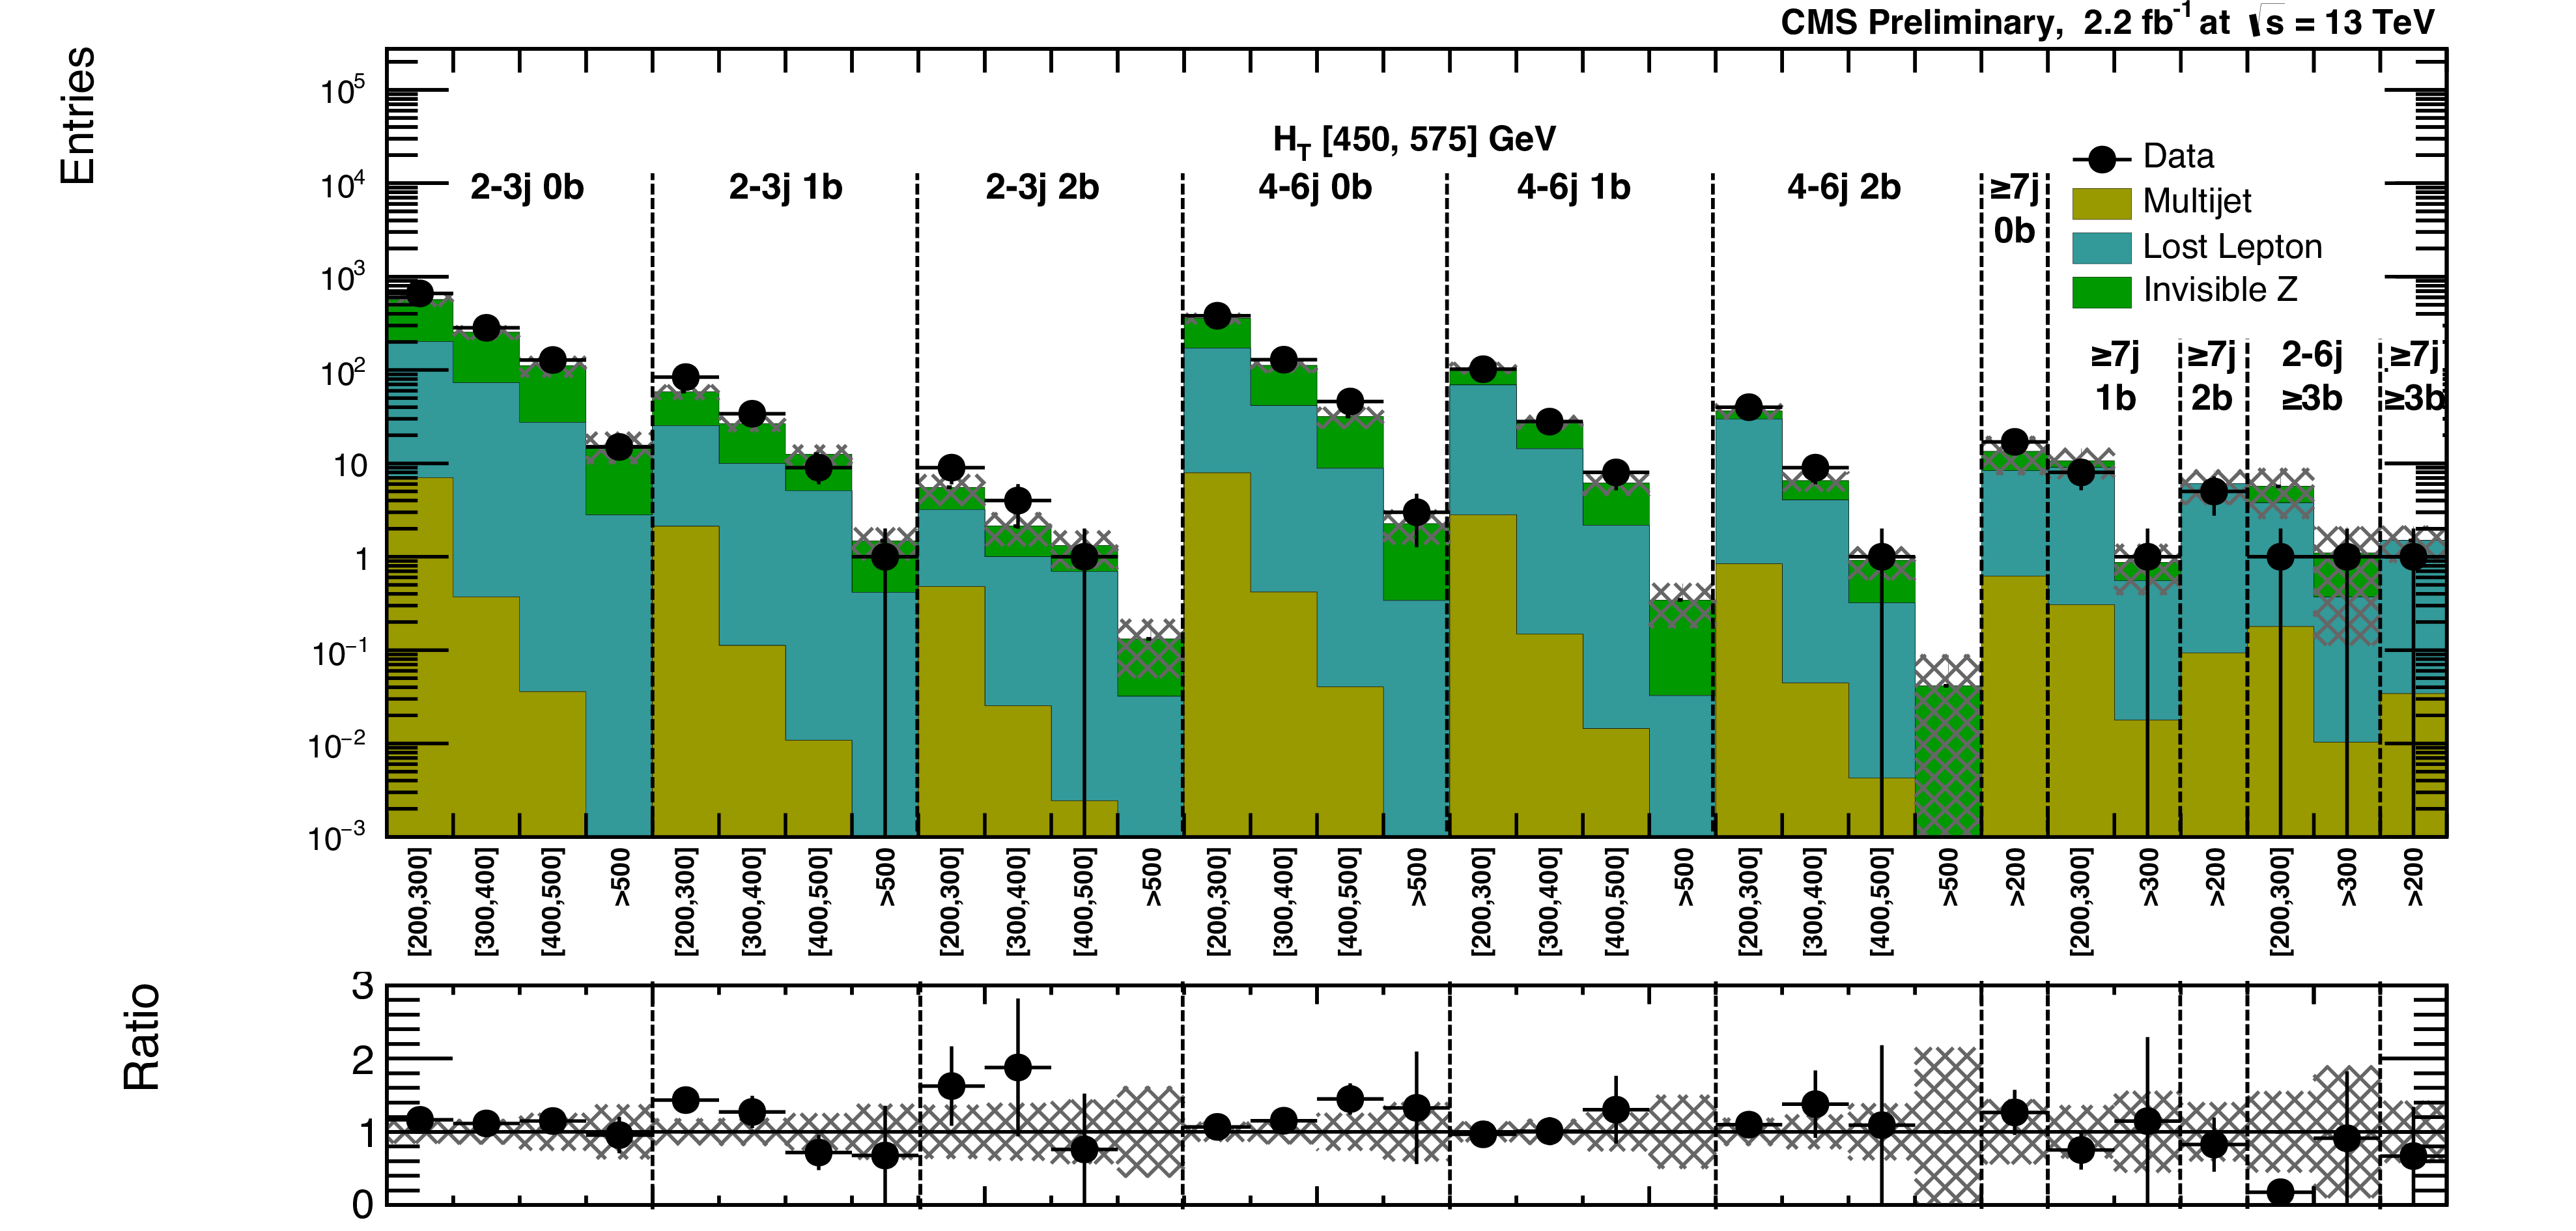
Figure 13-b:
(a) Comparison of the estimated background and observed data events in each signal bin in the low $ H_{\mathrm{T}} $ region. Hatched bands represent the full uncertainty on the background estimate. Same for the high (middle) and extreme (b) $ H_{\mathrm{T}} $ regions. On the $x$-axis, the $ M_{\mathrm{T2}} $ binning is shown (in GeV). Bins with no entry for data have an observed count of 0. |
png pdf |
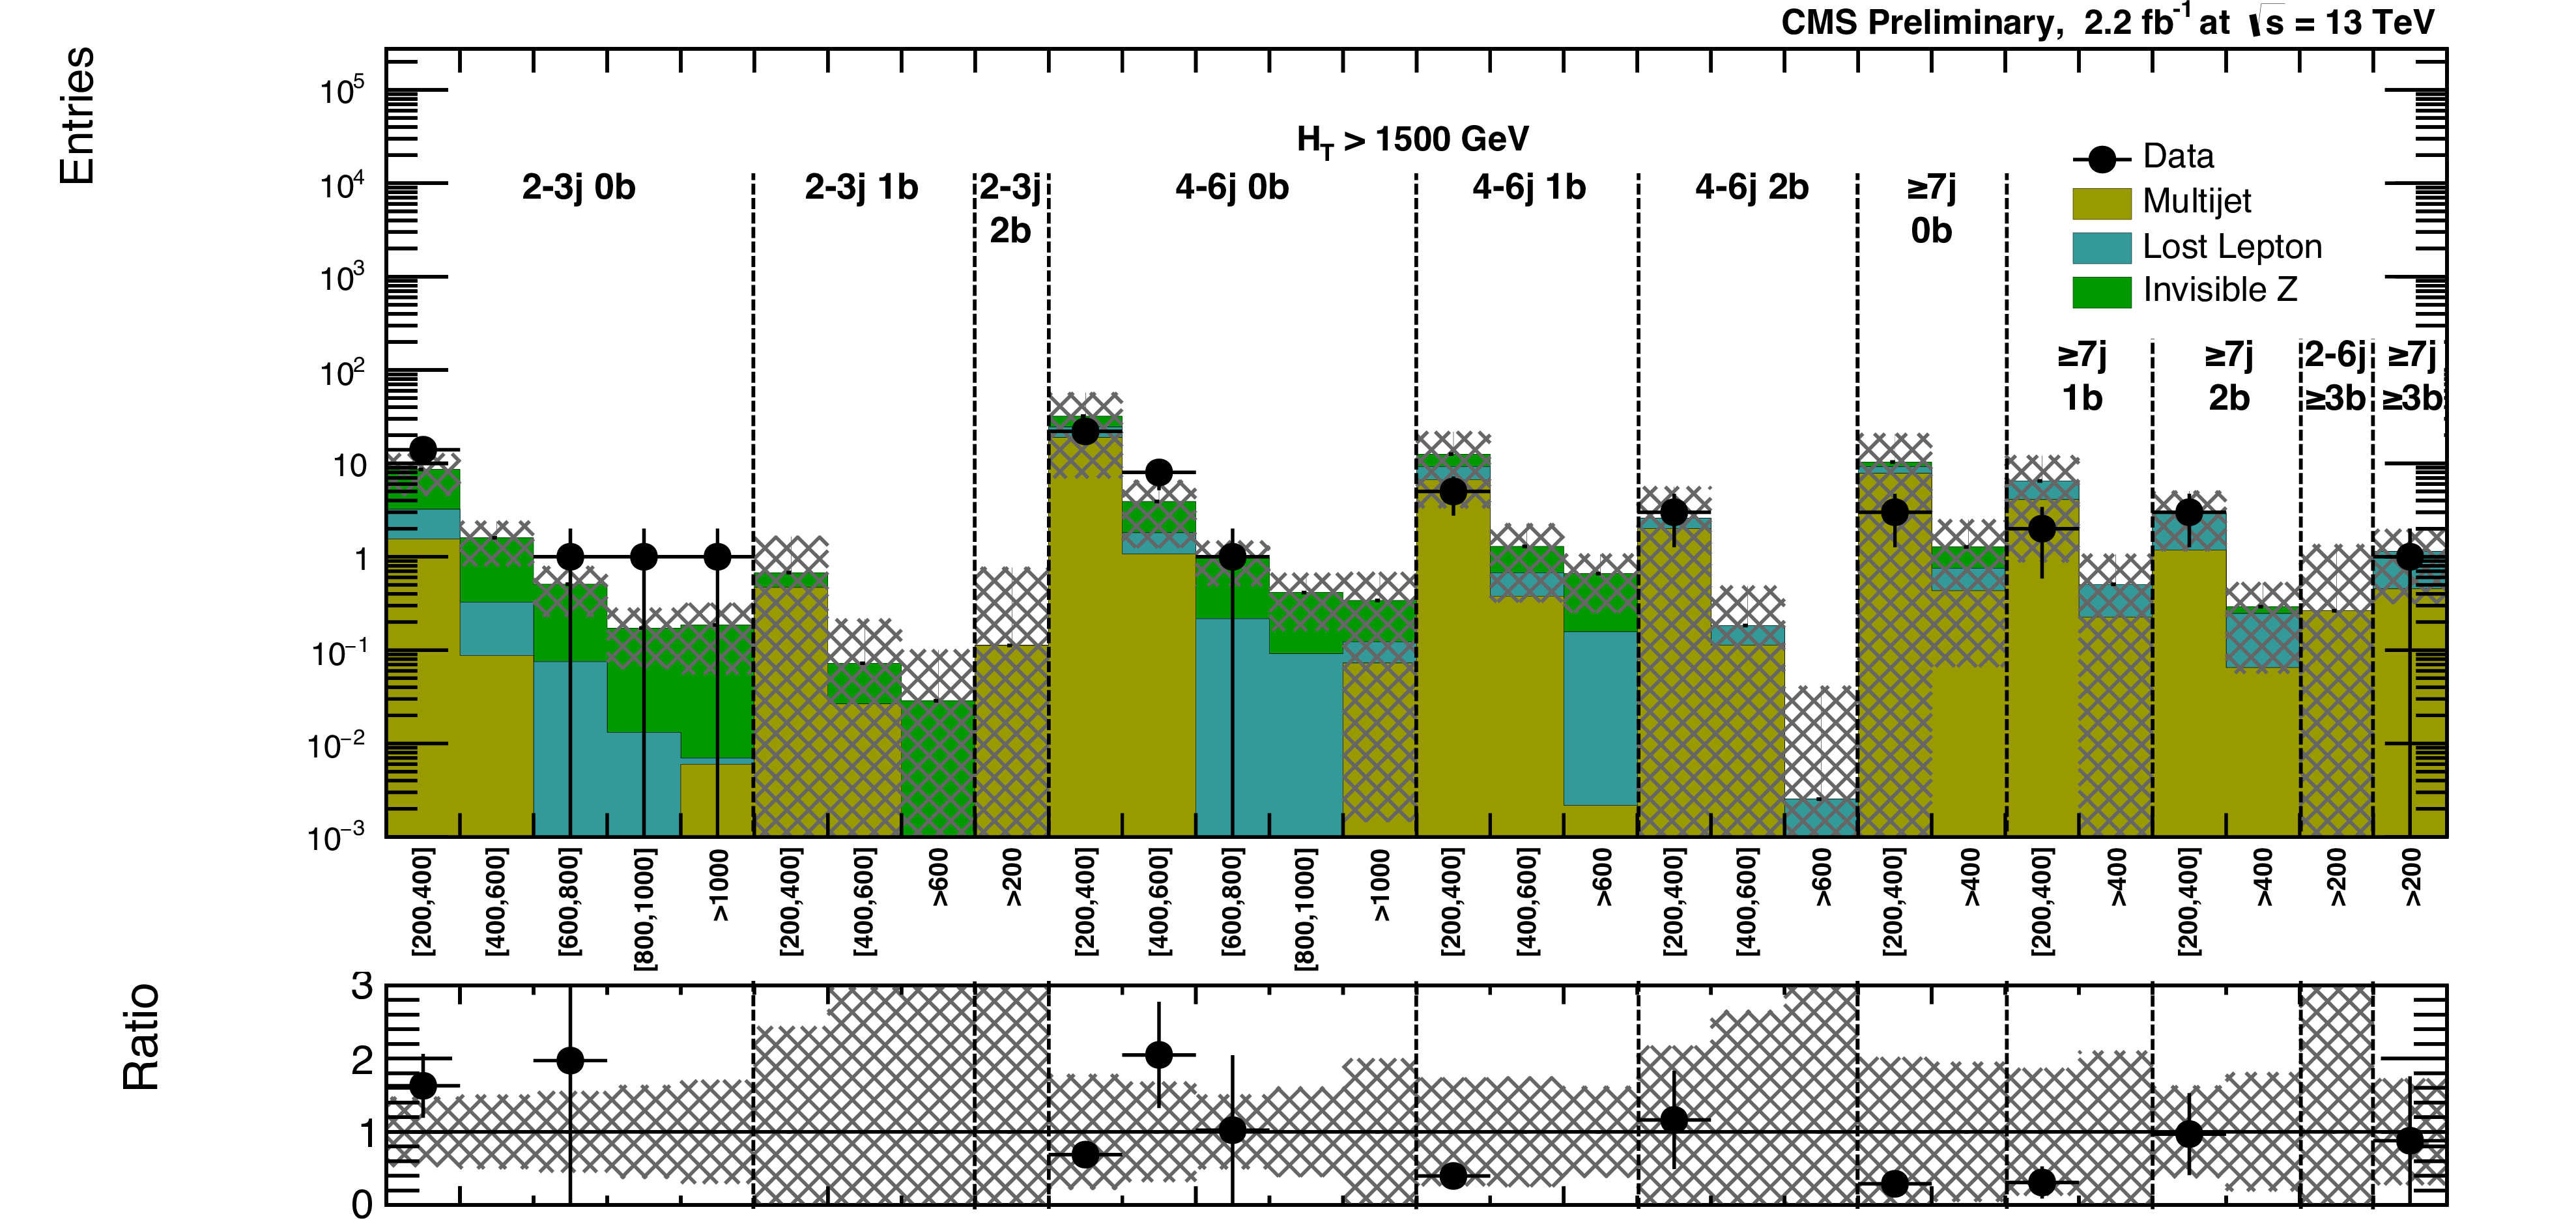
Figure 13-c:
(a) Comparison of the estimated background and observed data events in each signal bin in the low $ H_{\mathrm{T}} $ region. Hatched bands represent the full uncertainty on the background estimate. Same for the high (middle) and extreme (b) $ H_{\mathrm{T}} $ regions. On the $x$-axis, the $ M_{\mathrm{T2}} $ binning is shown (in GeV). Bins with no entry for data have an observed count of 0. |
png pdf |
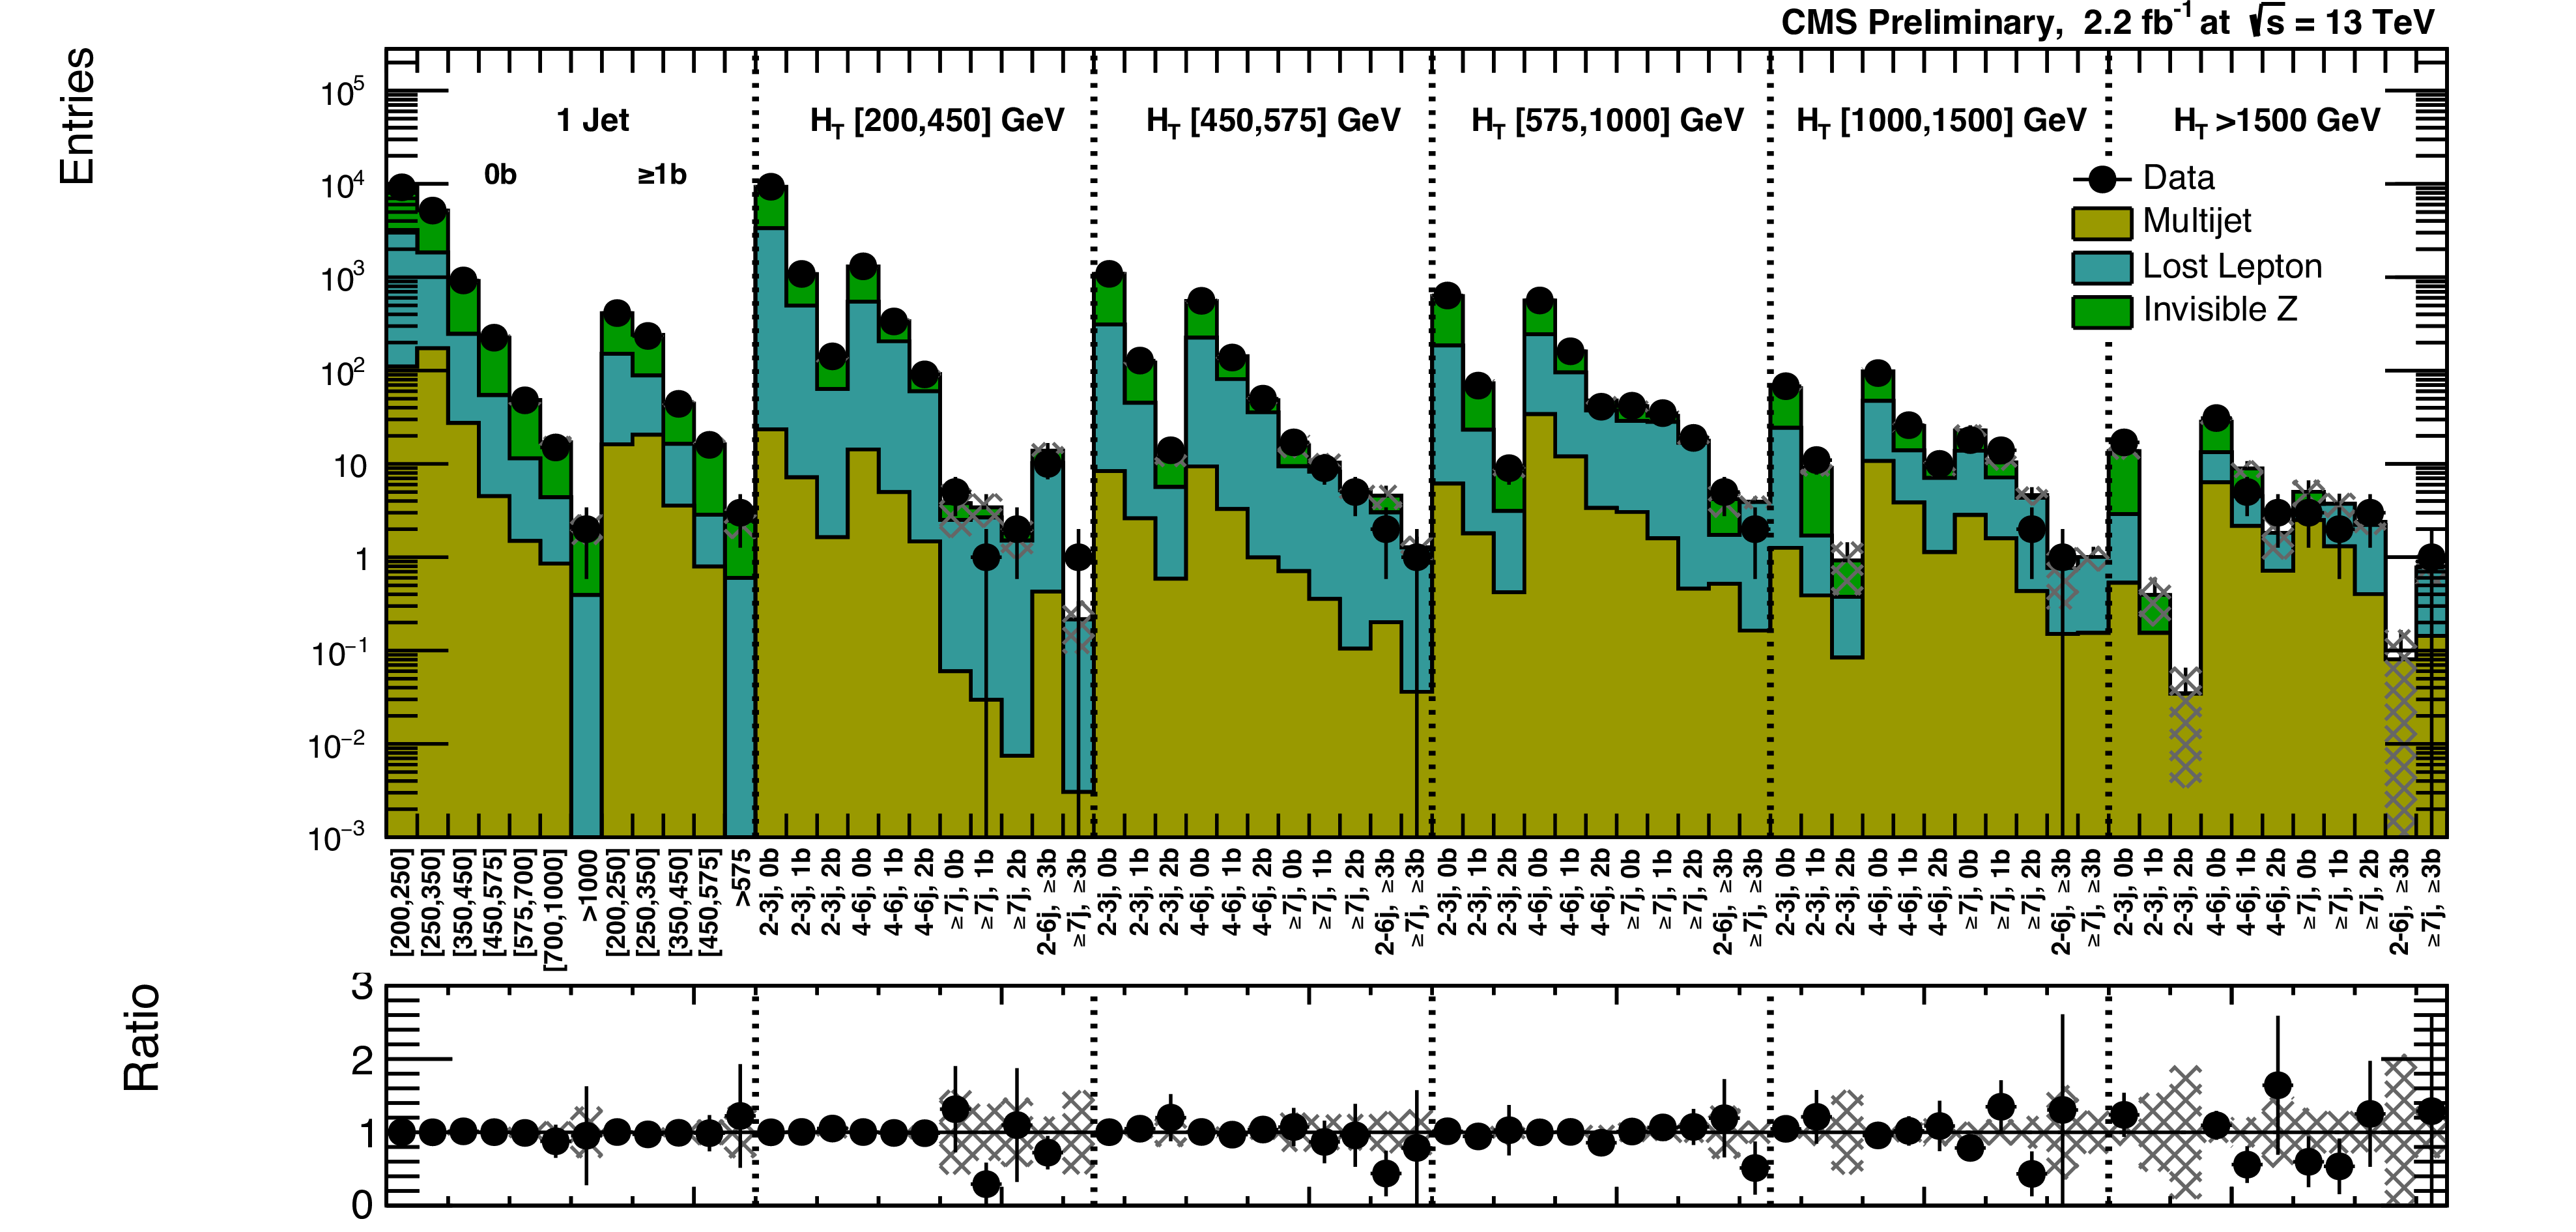
Figure 14:
Comparison of post-fit background prediction and observed data events in each topological region. Hatched bands represent the post-fit uncertainty on the background prediction. For the monojet, on the $x$-axis the $ H_{\mathrm{T}} $ binning is shown (in GeV). |
png pdf |
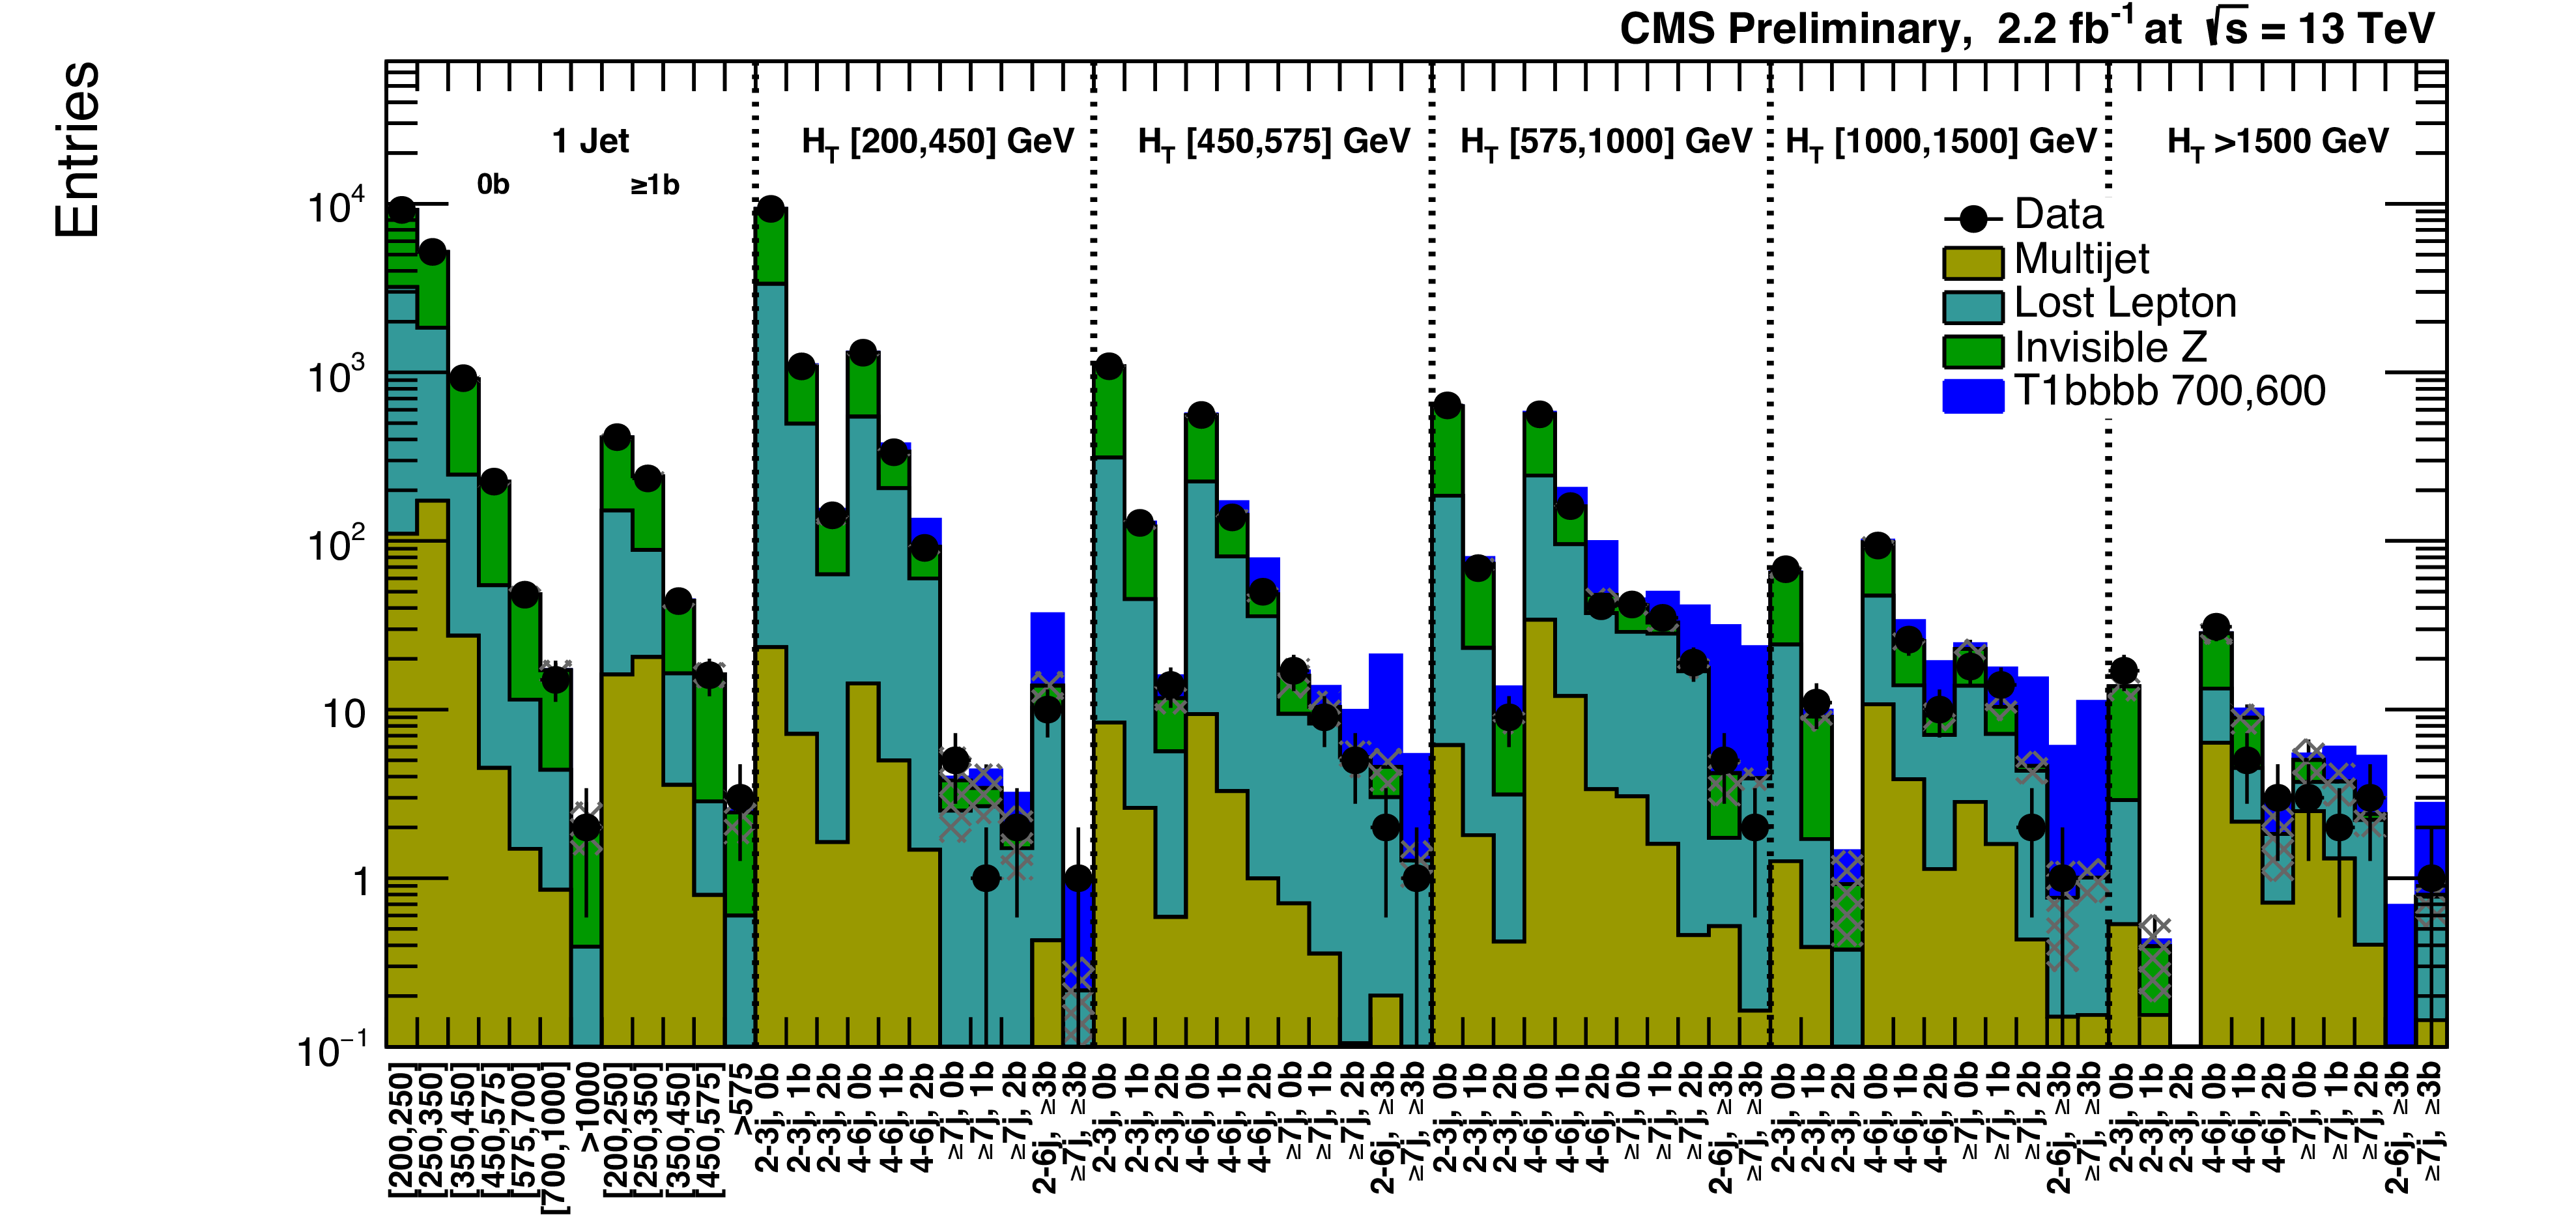
Figure 15:
Post-fit background prediction, expected signal yields and observed data events in each topological region. Hatched bands represent the post-fit uncertainty on the background prediction. For the monojet, on the $x$-axis the $ H_{\mathrm{T}} $ binning is shown (in GeV). The compressed-spectra signal model considered here is gluino-mediated bottom-squark production with mass of the gluino and LSP equal to 700 and 600 GeV, respectively. |
png pdf |
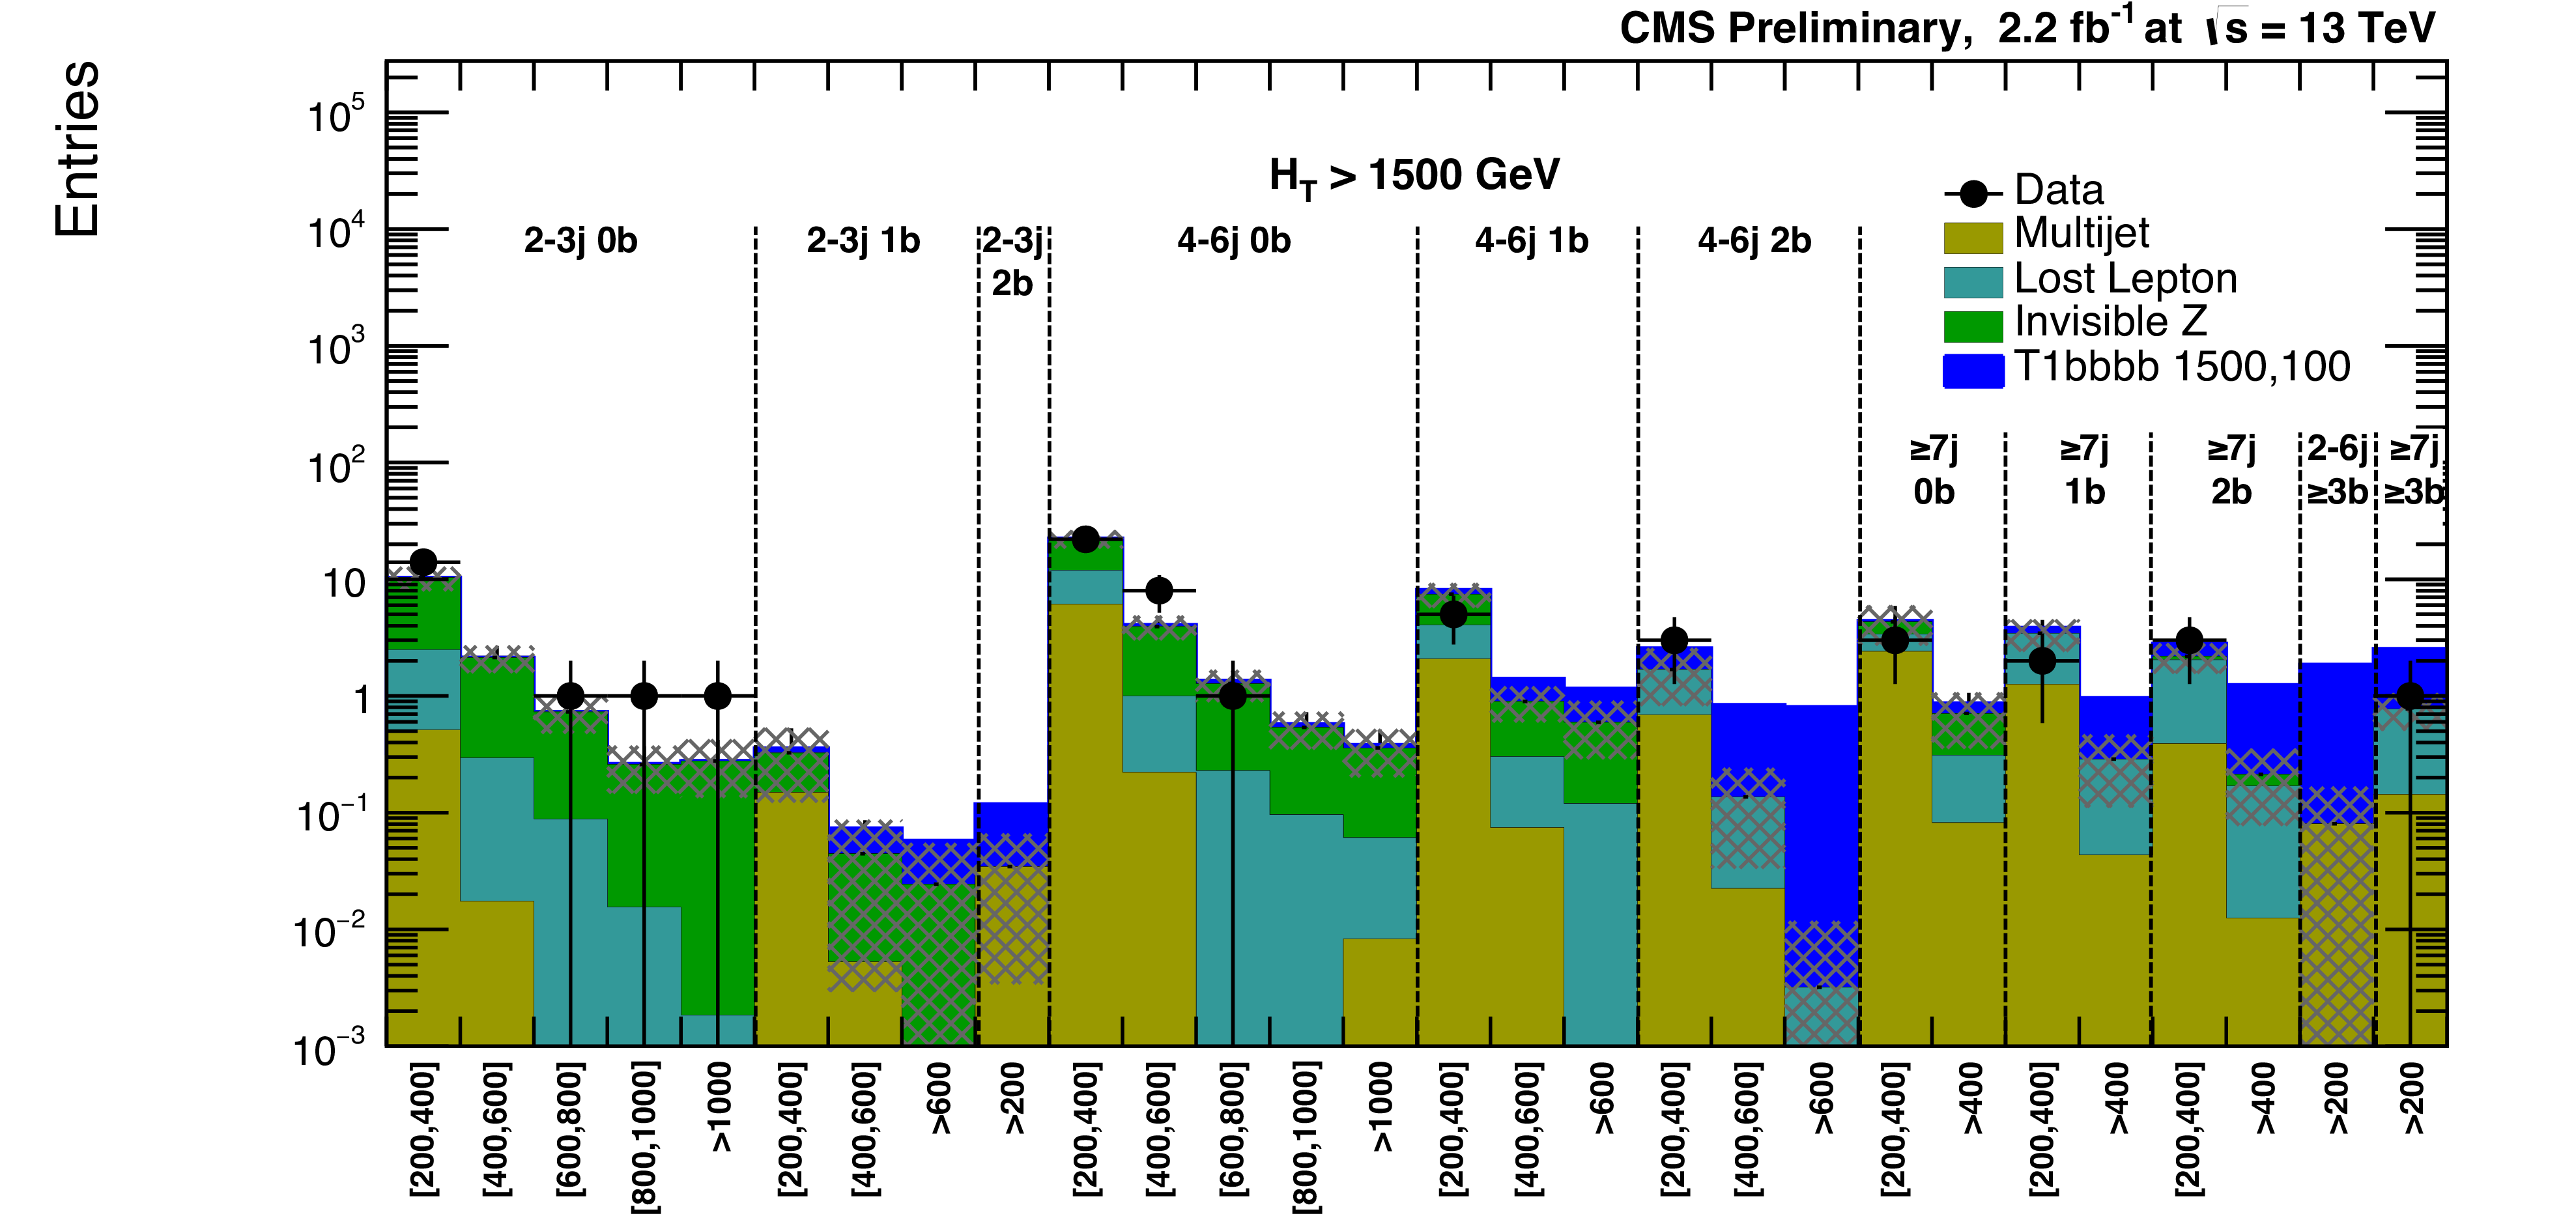
Figure 16:
Post-fit background prediction, expected signal yields and observed data events in each signal bin in the extreme $ H_{\mathrm{T}} $ region. Hatched bands represent the post-fit uncertainty on the background prediction. On the $x$-axis the $ M_{\mathrm{T2}} $ binning is shown (in GeV). The open-spectra signal model considered here is gluino-mediated bottom-squark production with mass of the gluino and LSP equal to 1500 and 100 GeV, respectively. |
| References | ||||
| 1 | ATLAS Collaboration | Summary of the searches for squarks and gluinos using $ \sqrt{s}=8 $ TeV pp collisions with the ATLAS experiment at the LHC | JHEP 10 (2015) 054 | 1507.05525 |
| 2 | ATLAS Collaboration | ATLAS Run 1 searches for direct pair production of third-generation squarks at the Large Hadron Collider | EPJC75 (2015), no. 10, 510 | 1506.08616 |
| 3 | CMS Collaboration | Searches for Supersymmetry using the M$ _{T2} $ Variable in Hadronic Events Produced in pp Collisions at 8 TeV | JHEP 05 (2015) 078 | CMS-SUS-13-019 1502.04358 |
| 4 | CMS Collaboration | Search for Supersymmetry Using Razor Variables in Events with $ b $-Tagged Jets in $ pp $ Collisions at $ \sqrt{s} = $ 8 TeV | PRD91 (2015) 052018 | CMS-SUS-13-004 1502.00300 |
| 5 | CMS Collaboration | Search for new physics in the multijet and missing transverse momentum final state in proton-proton collisions at $ \sqrt{s} $= 8 TeV | JHEP 06 (2014) 055 | CMS-SUS-13-012 1402.4770 |
| 6 | CMS Collaboration | Search for gluino mediated bottom- and top-squark production in multijet final states in pp collisions at 8 TeV | PLB725 (2013) 243--270 | CMS-SUS-12-024 1305.2390 |
| 7 | CMS Collaboration | Search for supersymmetry in hadronic final states with missing transverse energy using the variables $ \alpha_T $ and b-quark multiplicity in pp collisions at $ \sqrt s=8 $ TeV | EPJC73 (2013), no. 9 | CMS-SUS-12-028 1303.2985 |
| 8 | CMS Collaboration | Search for supersymmetry in hadronic final states using $ M_\mathrm{T2} $ in pp collisions at $ \sqrt{s} = 7 $ TeV | JHEP 10 (2012) 018 | CMS-SUS-12-002 1207.1798 |
| 9 | C. G. Lester and D. J. Summers | Measuring masses of semiinvisibly decaying particles pair produced at hadron colliders | PLB 463 (1999) 99 | hep-ph/9906349 |
| 10 | CMS Collaboration | Particle-Flow Event Reconstruction in CMS and Performance for Jets, Taus, and MET | Technical Report CMS-PAS-PFT-09-001, CERN | |
| 11 | CMS Collaboration | Commissioning of the Particle-flow Event Reconstruction with the first LHC collisions recorded in the CMS detector | CDS | |
| 12 | M. Cacciari, G. P. Salam, and G. Soyez | The anti-$ k_t $ jet clustering algorithm | JHEP 04 (2008) 063 | 0802.1189 |
| 13 | CMS Collaboration | Determination of jet energy calibration and transverse momentum resolution in CMS | JINST 6 (2011) P11002 | CMS-JME-10-011 1107.4277 |
| 14 | CMS Collaboration | Performance of b-Tagging Algorithms in 50ns Data at 13 TeV | CDS | |
| 15 | CMS Collaboration | Electron reconstruction and identification at sqrt(s) = 7 TeV | CDS | |
| 16 | CMS Collaboration | Performance of CMS muon reconstruction in $ pp $ collision events at $ \sqrt{s}=7 $ TeV | JINST 7 (2012) P10002 | CMS-MUO-10-004 1206.4071 |
| 17 | CMS Collaboration | Jet Performance in pp Collisions at 7 TeV | CDS | |
| 18 | T. Sj\"ostrand | The Lund Monte Carlo for e$ ^{+} $e$ ^{-} $ Jet Physics | CPC 28 (1983) 229 | |
| 19 | T. Sj\"ostrand, S. Mrenna, and P. Skands | PYTHIA 6.4 physics and manual | JHEP 05 (2006) 026 | hep-ph/0603175 |
| 20 | CMS Collaboration | Missing transverse energy performance of the CMS detector | JINST 6 (2011) P09001 | CMS-JME-10-009 1106.5048 |
| 21 | J. Alwall et al. | MadGraph 5: going beyond | JHEP 06 (2011) 128 | 1106.0522 |
| 22 | T. Sjostrand, S. Mrenna, and P. Z. Skands | A Brief Introduction to PYTHIA 8.1 | CPC 178 (2008) 852--867 | 0710.3820 |
| 23 | GEANT4 Collaboration | GEANT4---a simulation toolkit | NIMA 506 (2003) 250 | |
| 24 | S. Abdullin et al. | The fast simulation of the CMS detector at LHC | J. Phys. Conf. Ser. 331 (2011) 032049 | |
| 25 | CMS Collaboration | Search for New Physics with Jets and Missing Transverse Momentum in $ pp $ collisions at $ \sqrt{s}=7 $ TeV | JHEP 08 (2011) 155 | CMS-SUS-10-005 1106.4503 |
| 26 | A. L. Read | Presentation of search results: The $ CL_{s} $ technique | JPG 28 (2002) 2693 | |
| 27 | A. L. Read | Modified frequentist analysis of search results (The $ CL_{s} $ method) | CERN-OPEN 205(2000) | |
| 28 | G. Cowan, K. Cranmer, E. Gross, and O. Vitells | Asymptotic formulae for likelihood-based tests of new physics | EPJC 71 (2011) 1554 | 1007.1727 |
| 29 | ATLAS and CMS Collaborations | Procedure for the LHC Higgs boson search combination in summer 2011 | CMS-NOTE-2011-005 | |
| 30 | CMS Collaboration | Search for top-squark pair production in the single-lepton final state in pp collisions at $ \sqrt{s} $ = 8 TeV | EPJC73 (2013), no. 12 | CMS-SUS-13-011 1308.1586 |
|
|
Compact Muon Solenoid LHC, CERN |
|

|

|

|

|

|