

Compact Muon Solenoid
LHC, CERN
| CMS-PAS-SMP-14-023 | ||
| Differential cross section measurements of W bosons produced in association with jets in proton-proton collisions at $\sqrt{s}= $ 8 TeV | ||
| CMS Collaboration | ||
| April 2016 | ||
| Abstract: Measurements of the differential cross-sections for a $\mathrm{W}(\rightarrow \mu\nu)$ boson produced in association with jets are presented here. The measurements use a data sample of proton-proton collisions at a center-of-mass energy of 8 TeV that was recorded by the CMS detector at the LHC, and corresponds to an integrated luminosity of 19.6 fb$^{-1}$. The cross sections are reported as a function of jet multiplicity, the jet transverse momenta, and the scalar sum of jet transverse momenta ($H_\mathrm{T}$) for different jet multiplicities. Several angular correlation distributions among the jets and the muon are also examined, as well as the distributions of the average number of jets as a function of $H_\mathrm{T}$ and as a function of angular variables. Such angular distributions are sensitive to the modeling of higher order corrections, and to the modeling of parton emissions. The cross section measurements are then compared with the predictions from leading-order and multileg next-to-leading-order Monte Carlo generators, fixed order next-to-leading-order theoretical predictions for up to four jets as well as next-to-next-to-leading-order predictions of W+1 jet. | ||
|
Links:
CDS record (PDF) ;
CADI line (restricted) ;
These preliminary results are superseded in this paper, PRD 95 (2017) 052002. The superseded preliminary plots can be found here. |
||
| Figures | |

png pdf |
Figure 1-a:
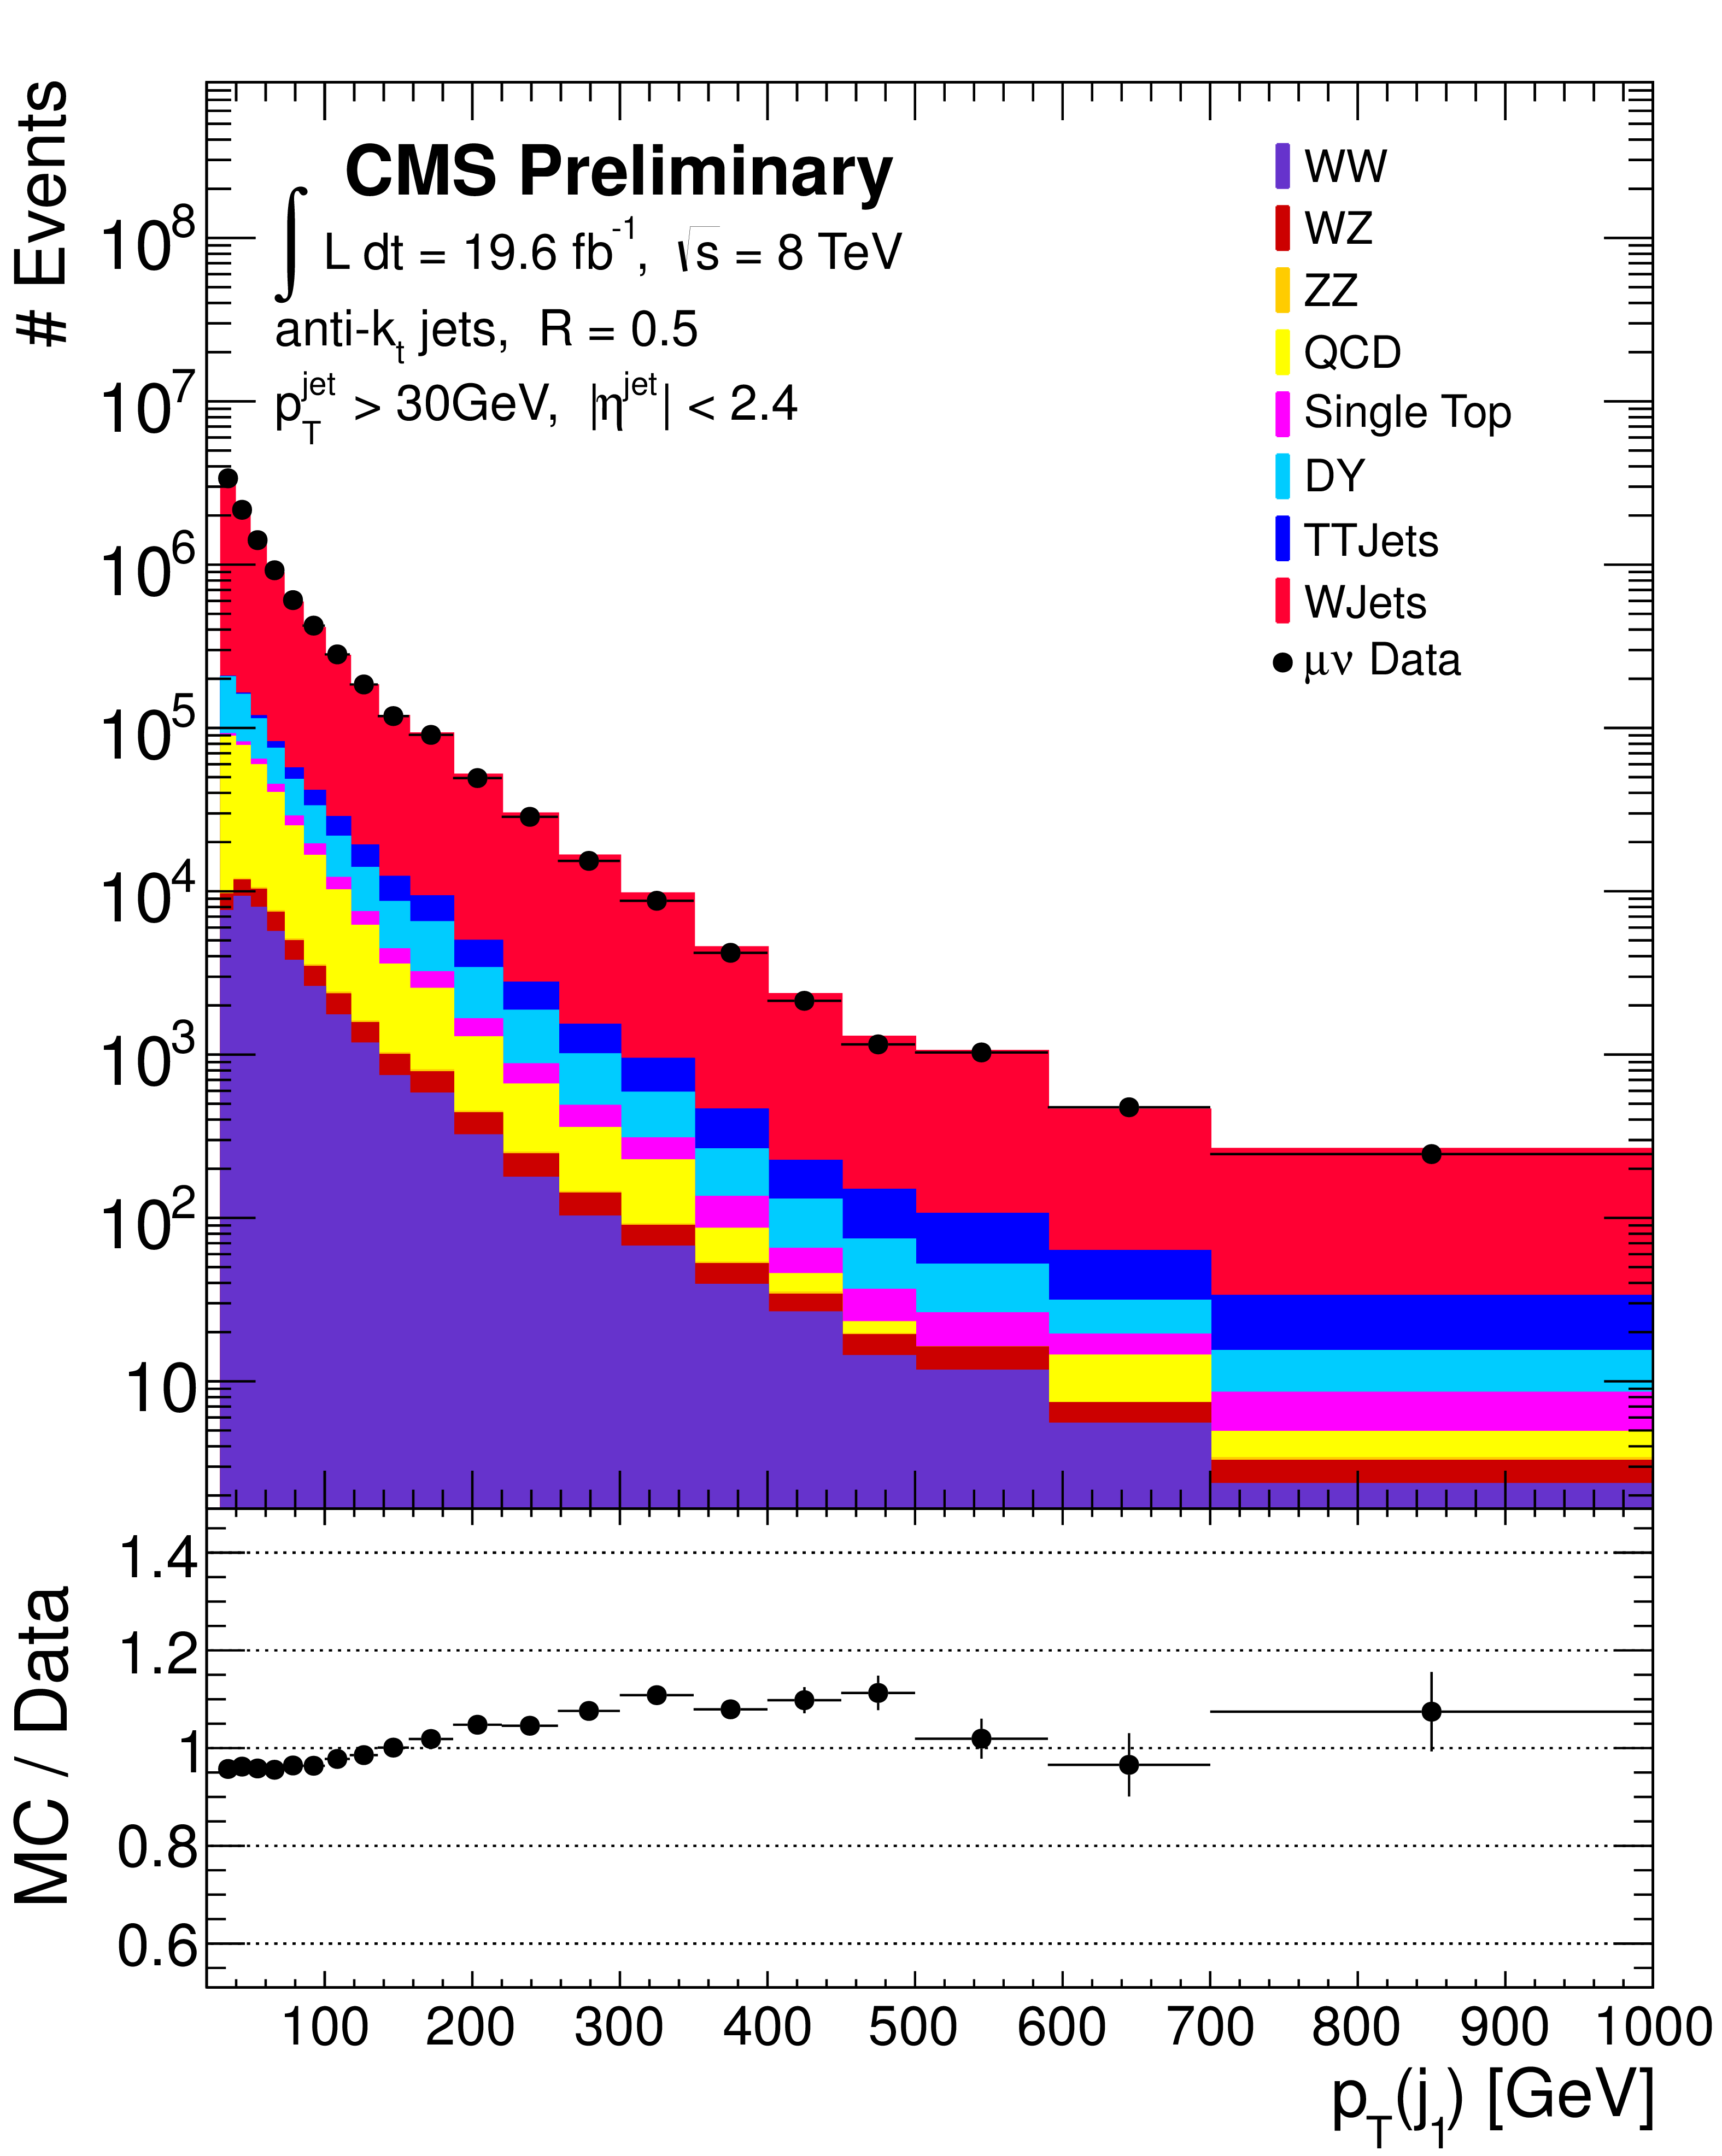
Reconstructed data and simulated signal and backgrounds for inclusive jet multiplicity (a) and the $ {p_{\mathrm {T}}} $ of the leading jet (b) in $\mathrm{ W } + \geq 1$ jet events. |
png pdf |
Figure 1-b:
Reconstructed data and simulated signal and backgrounds for inclusive jet multiplicity (a) and the $ {p_{\mathrm {T}}} $ of the leading jet (b) in $\mathrm{ W } + \geq 1$ jet events. |
png pdf |
Figure 2:
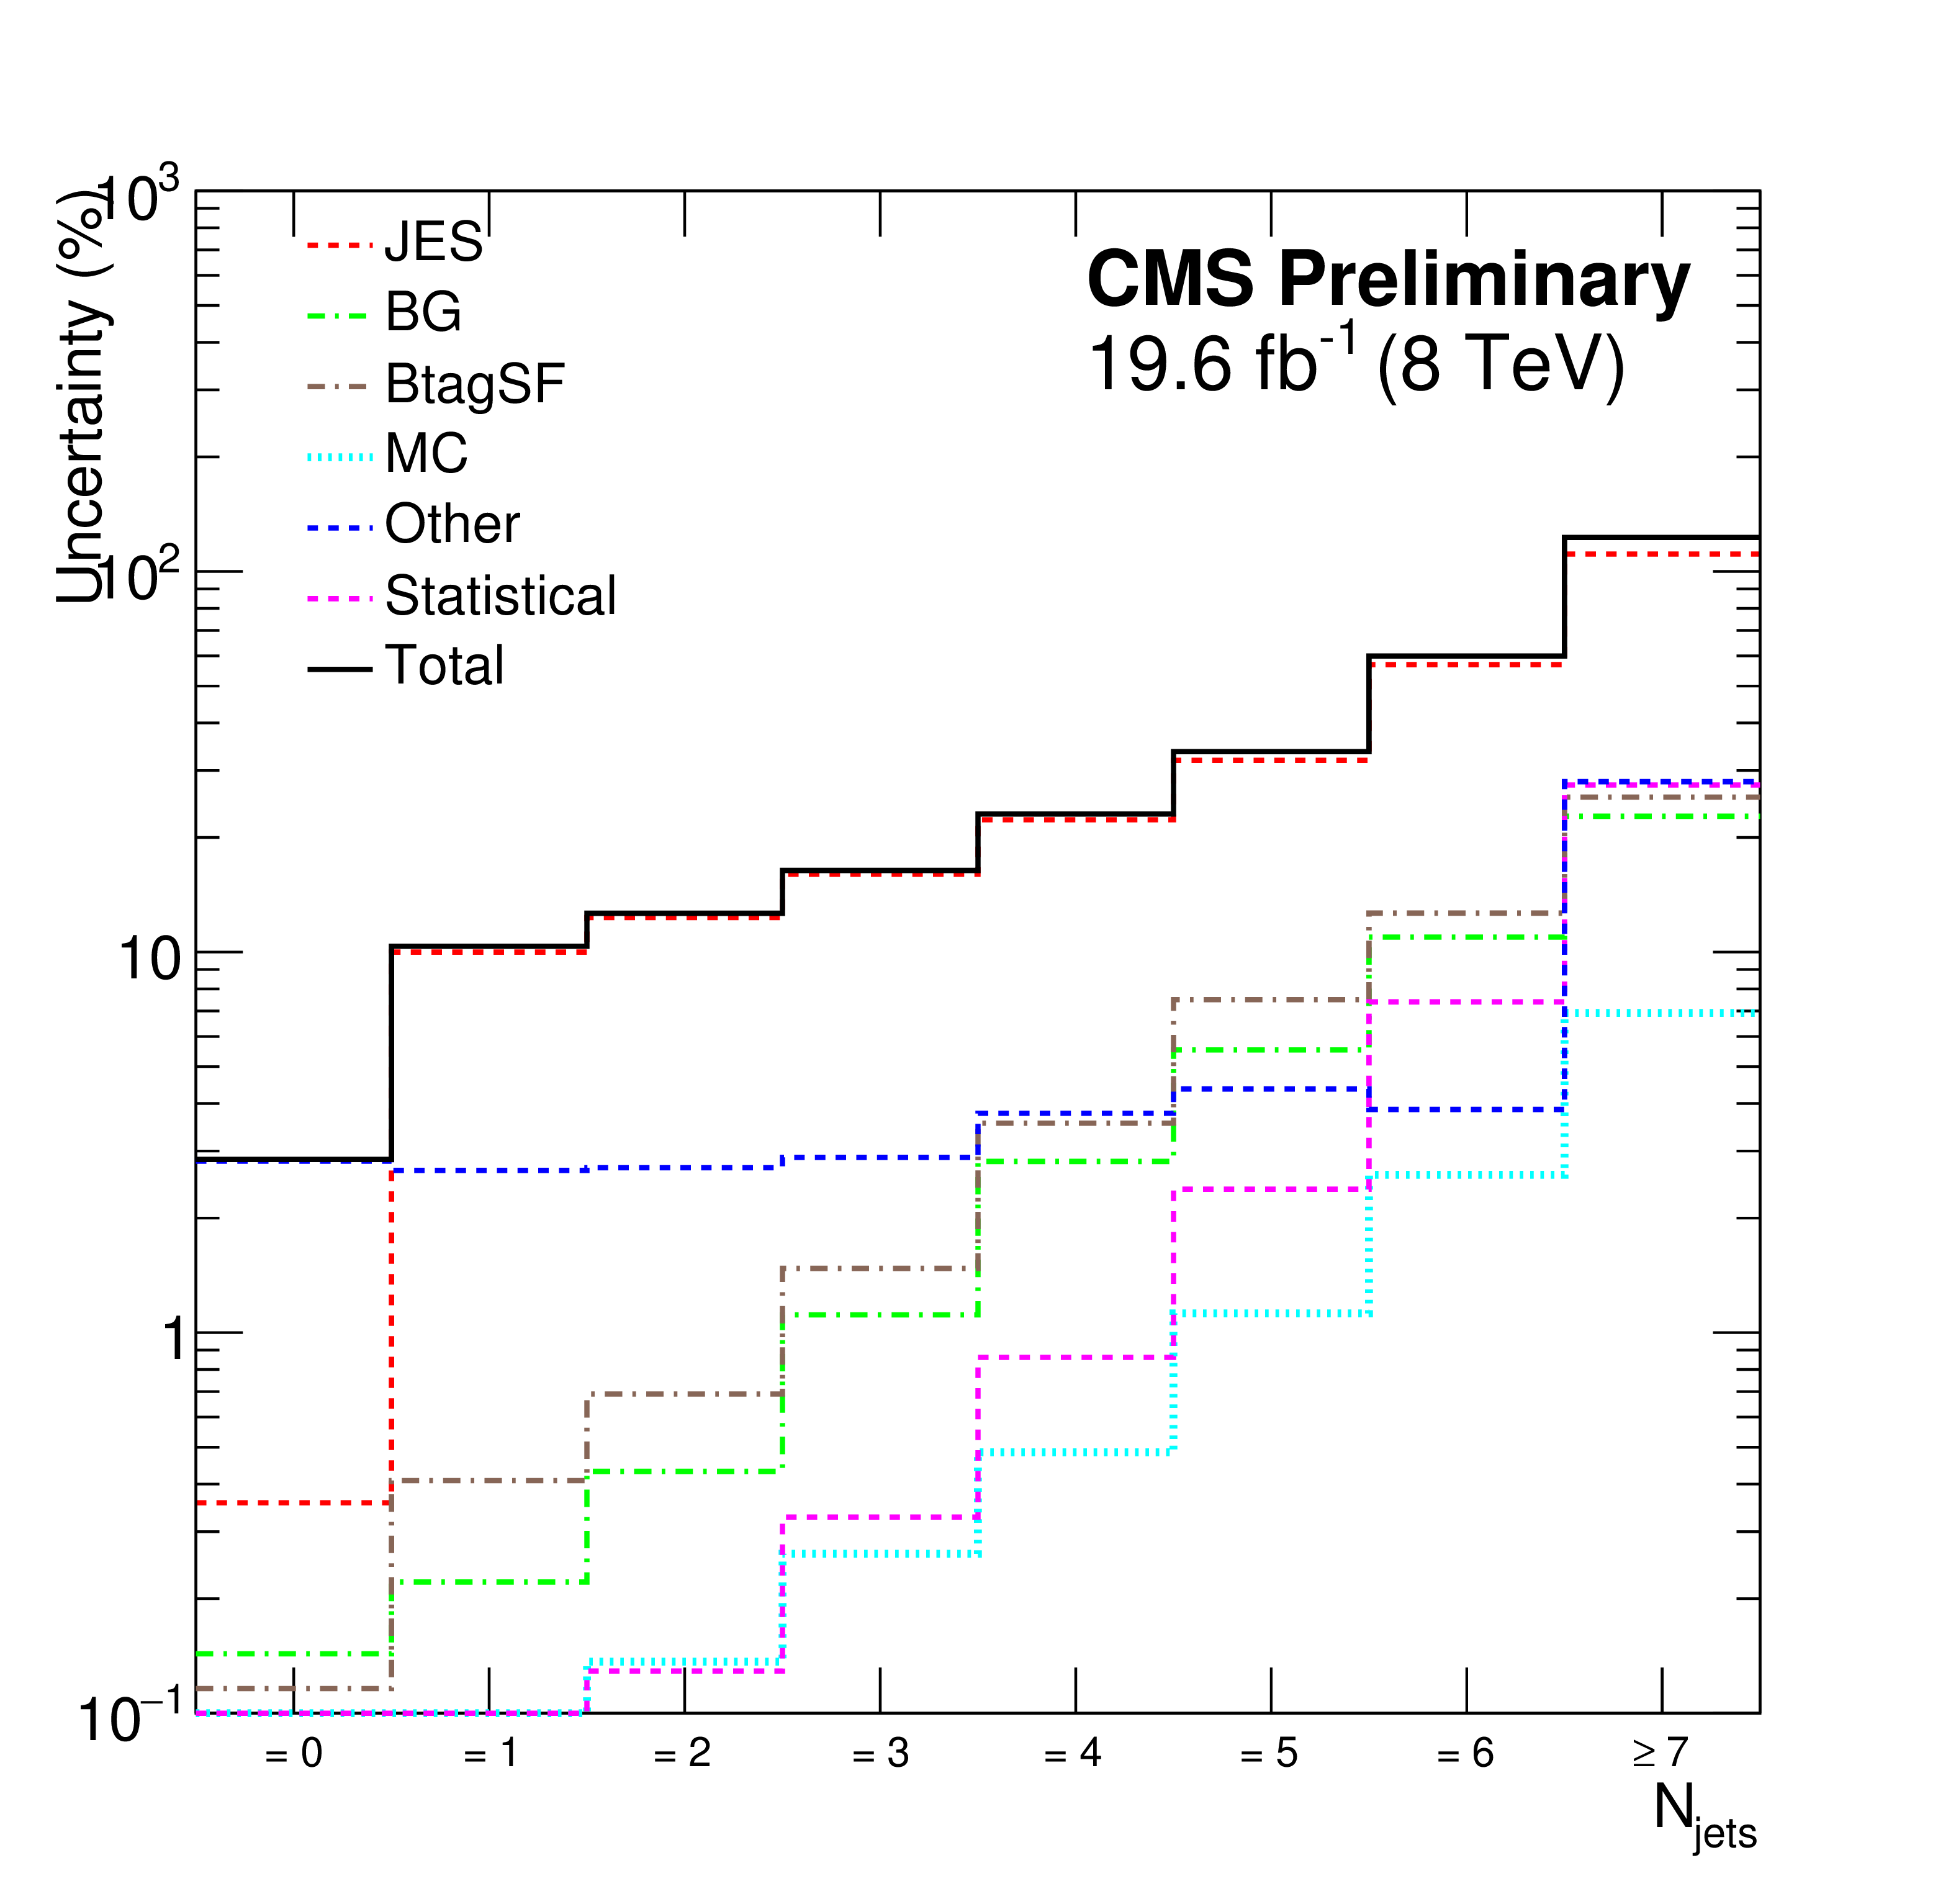
Systematic uncertainties on measured cross section as a function of jet multiplicity. Shown in the figure are uncertainties due to jet energy scale (JES), background normalisation (BG), the b-tagging efficiency (BtagSF), the finite number of simulated events used to construct the response matrix (MC), and other systematic uncertainties mentioned in Section {systematics}. |

png pdf |
Figure 3-a:
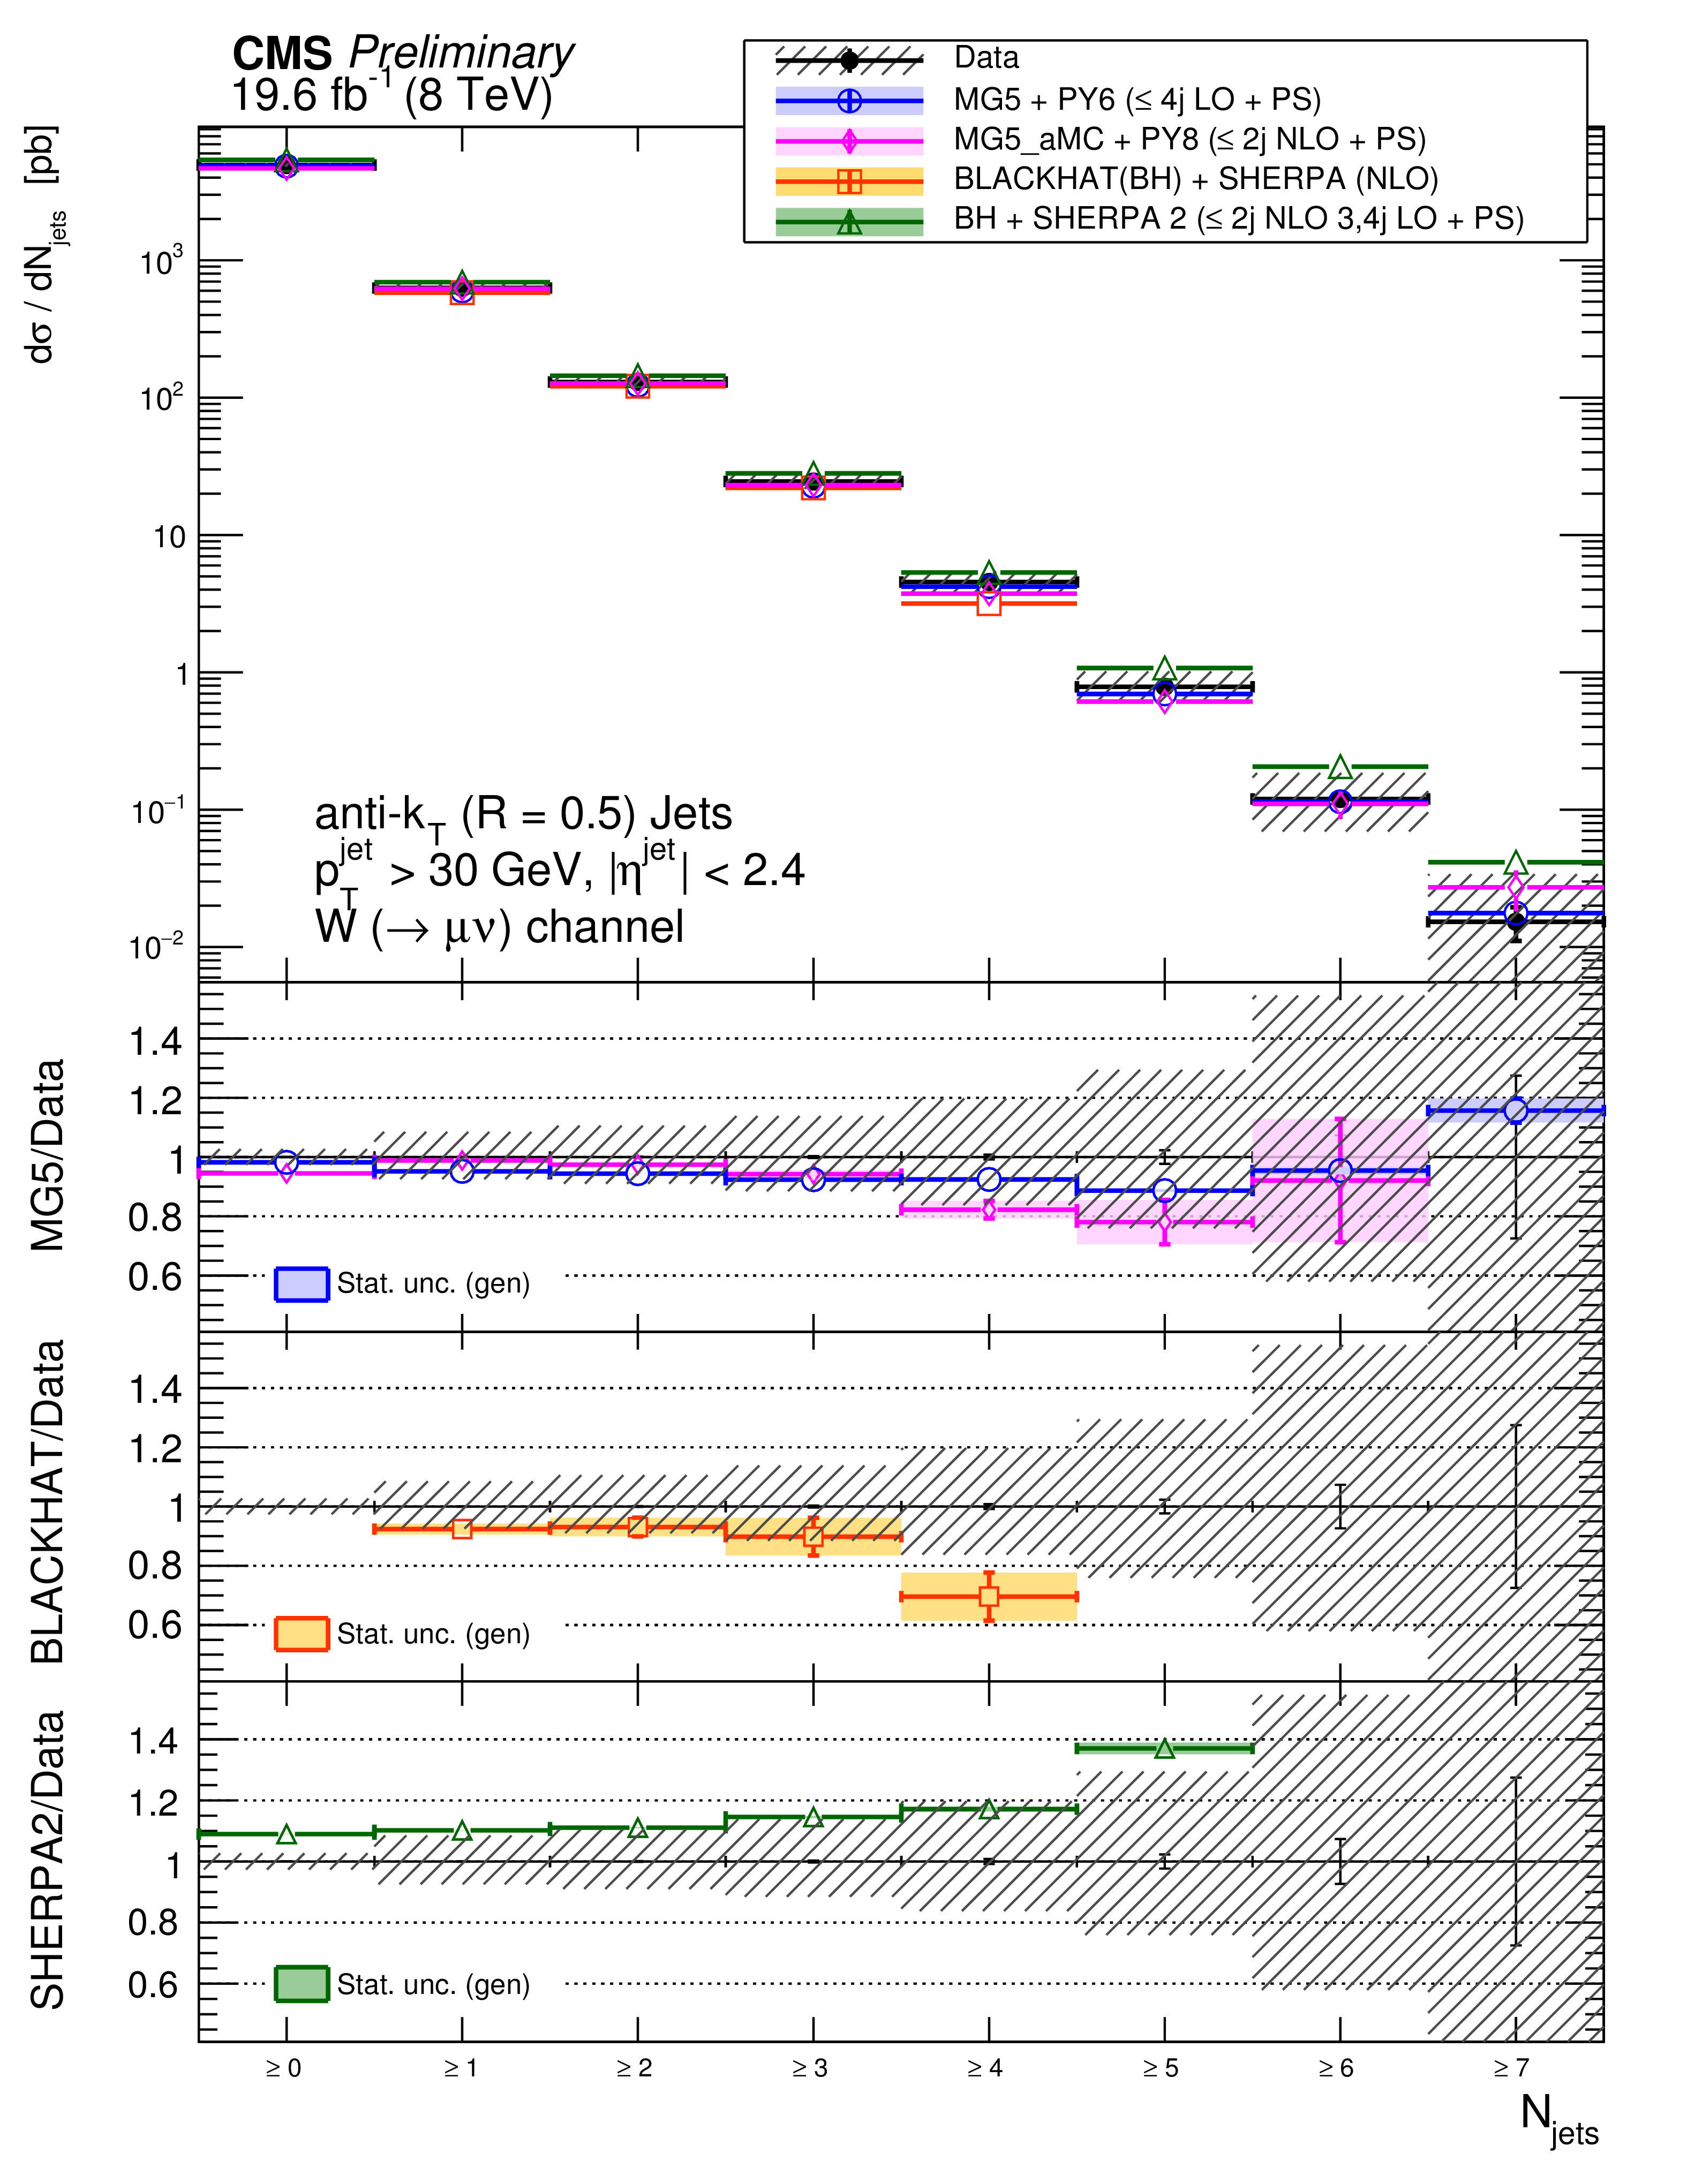
The cross section measurement for the exclusive and inclusive jet multiplicities, compared to the prediction of MadGraph , MadGraph5$\_$aMC@NLO, SHERPA-2, and BLACKHAT+SHERPA (corrected for hadronization and multiple-parton interactions). Black circular markers with the grey hatched band represent the unfolded data measurement and its uncertainty. Overlaid are the predictions together with their statistical uncertainties (Theory stat.). The BLACKHAT+SHERPA uncertainty also contains theoretical systematic uncertainties (Theory syst.) described in Section 9. The lower plots show the ratio of each prediction to the unfolded data. |
png pdf |
Figure 3-b:
The cross section measurement for the exclusive and inclusive jet multiplicities, compared to the prediction of MadGraph , MadGraph5$\_$aMC@NLO, SHERPA-2, and BLACKHAT+SHERPA (corrected for hadronization and multiple-parton interactions). Black circular markers with the grey hatched band represent the unfolded data measurement and its uncertainty. Overlaid are the predictions together with their statistical uncertainties (Theory stat.). The BLACKHAT+SHERPA uncertainty also contains theoretical systematic uncertainties (Theory syst.) described in Section 9. The lower plots show the ratio of each prediction to the unfolded data. |

png pdf |
Figure 4-a:
The differential cross section measurement for the leading four jets' transverse momenta, compared to the prediction of MadGraph, MadGraph5$\_$aMC@NLO, SHERPA-2, BLACKHAT+SHERPA , and NNLO inclusive 1 jet production (indicated as NNLO1j). BLACKHAT+SHERPA and NNLO1j are corrected for hadronisation and multiple-parton interactions effects. Black circular markers with the grey hatched band represent the unfolded data measurement and its uncertainty. Overlaid are the predictions together with their statistical uncertainties (Theory stat.). The BLACKHAT+SHERPA and the NNLO1j uncertainties also contain theoretical systematic uncertainties (Theory syst.) described in Section 9. The lower plots show the ratio of each prediction to the unfolded data. |
png pdf |
Figure 4-b:
The differential cross section measurement for the leading four jets' transverse momenta, compared to the prediction of MadGraph, MadGraph5$\_$aMC@NLO, SHERPA-2, BLACKHAT+SHERPA , and NNLO inclusive 1 jet production (indicated as NNLO1j). BLACKHAT+SHERPA and NNLO1j are corrected for hadronisation and multiple-parton interactions effects. Black circular markers with the grey hatched band represent the unfolded data measurement and its uncertainty. Overlaid are the predictions together with their statistical uncertainties (Theory stat.). The BLACKHAT+SHERPA and the NNLO1j uncertainties also contain theoretical systematic uncertainties (Theory syst.) described in Section 9. The lower plots show the ratio of each prediction to the unfolded data. |
png pdf |
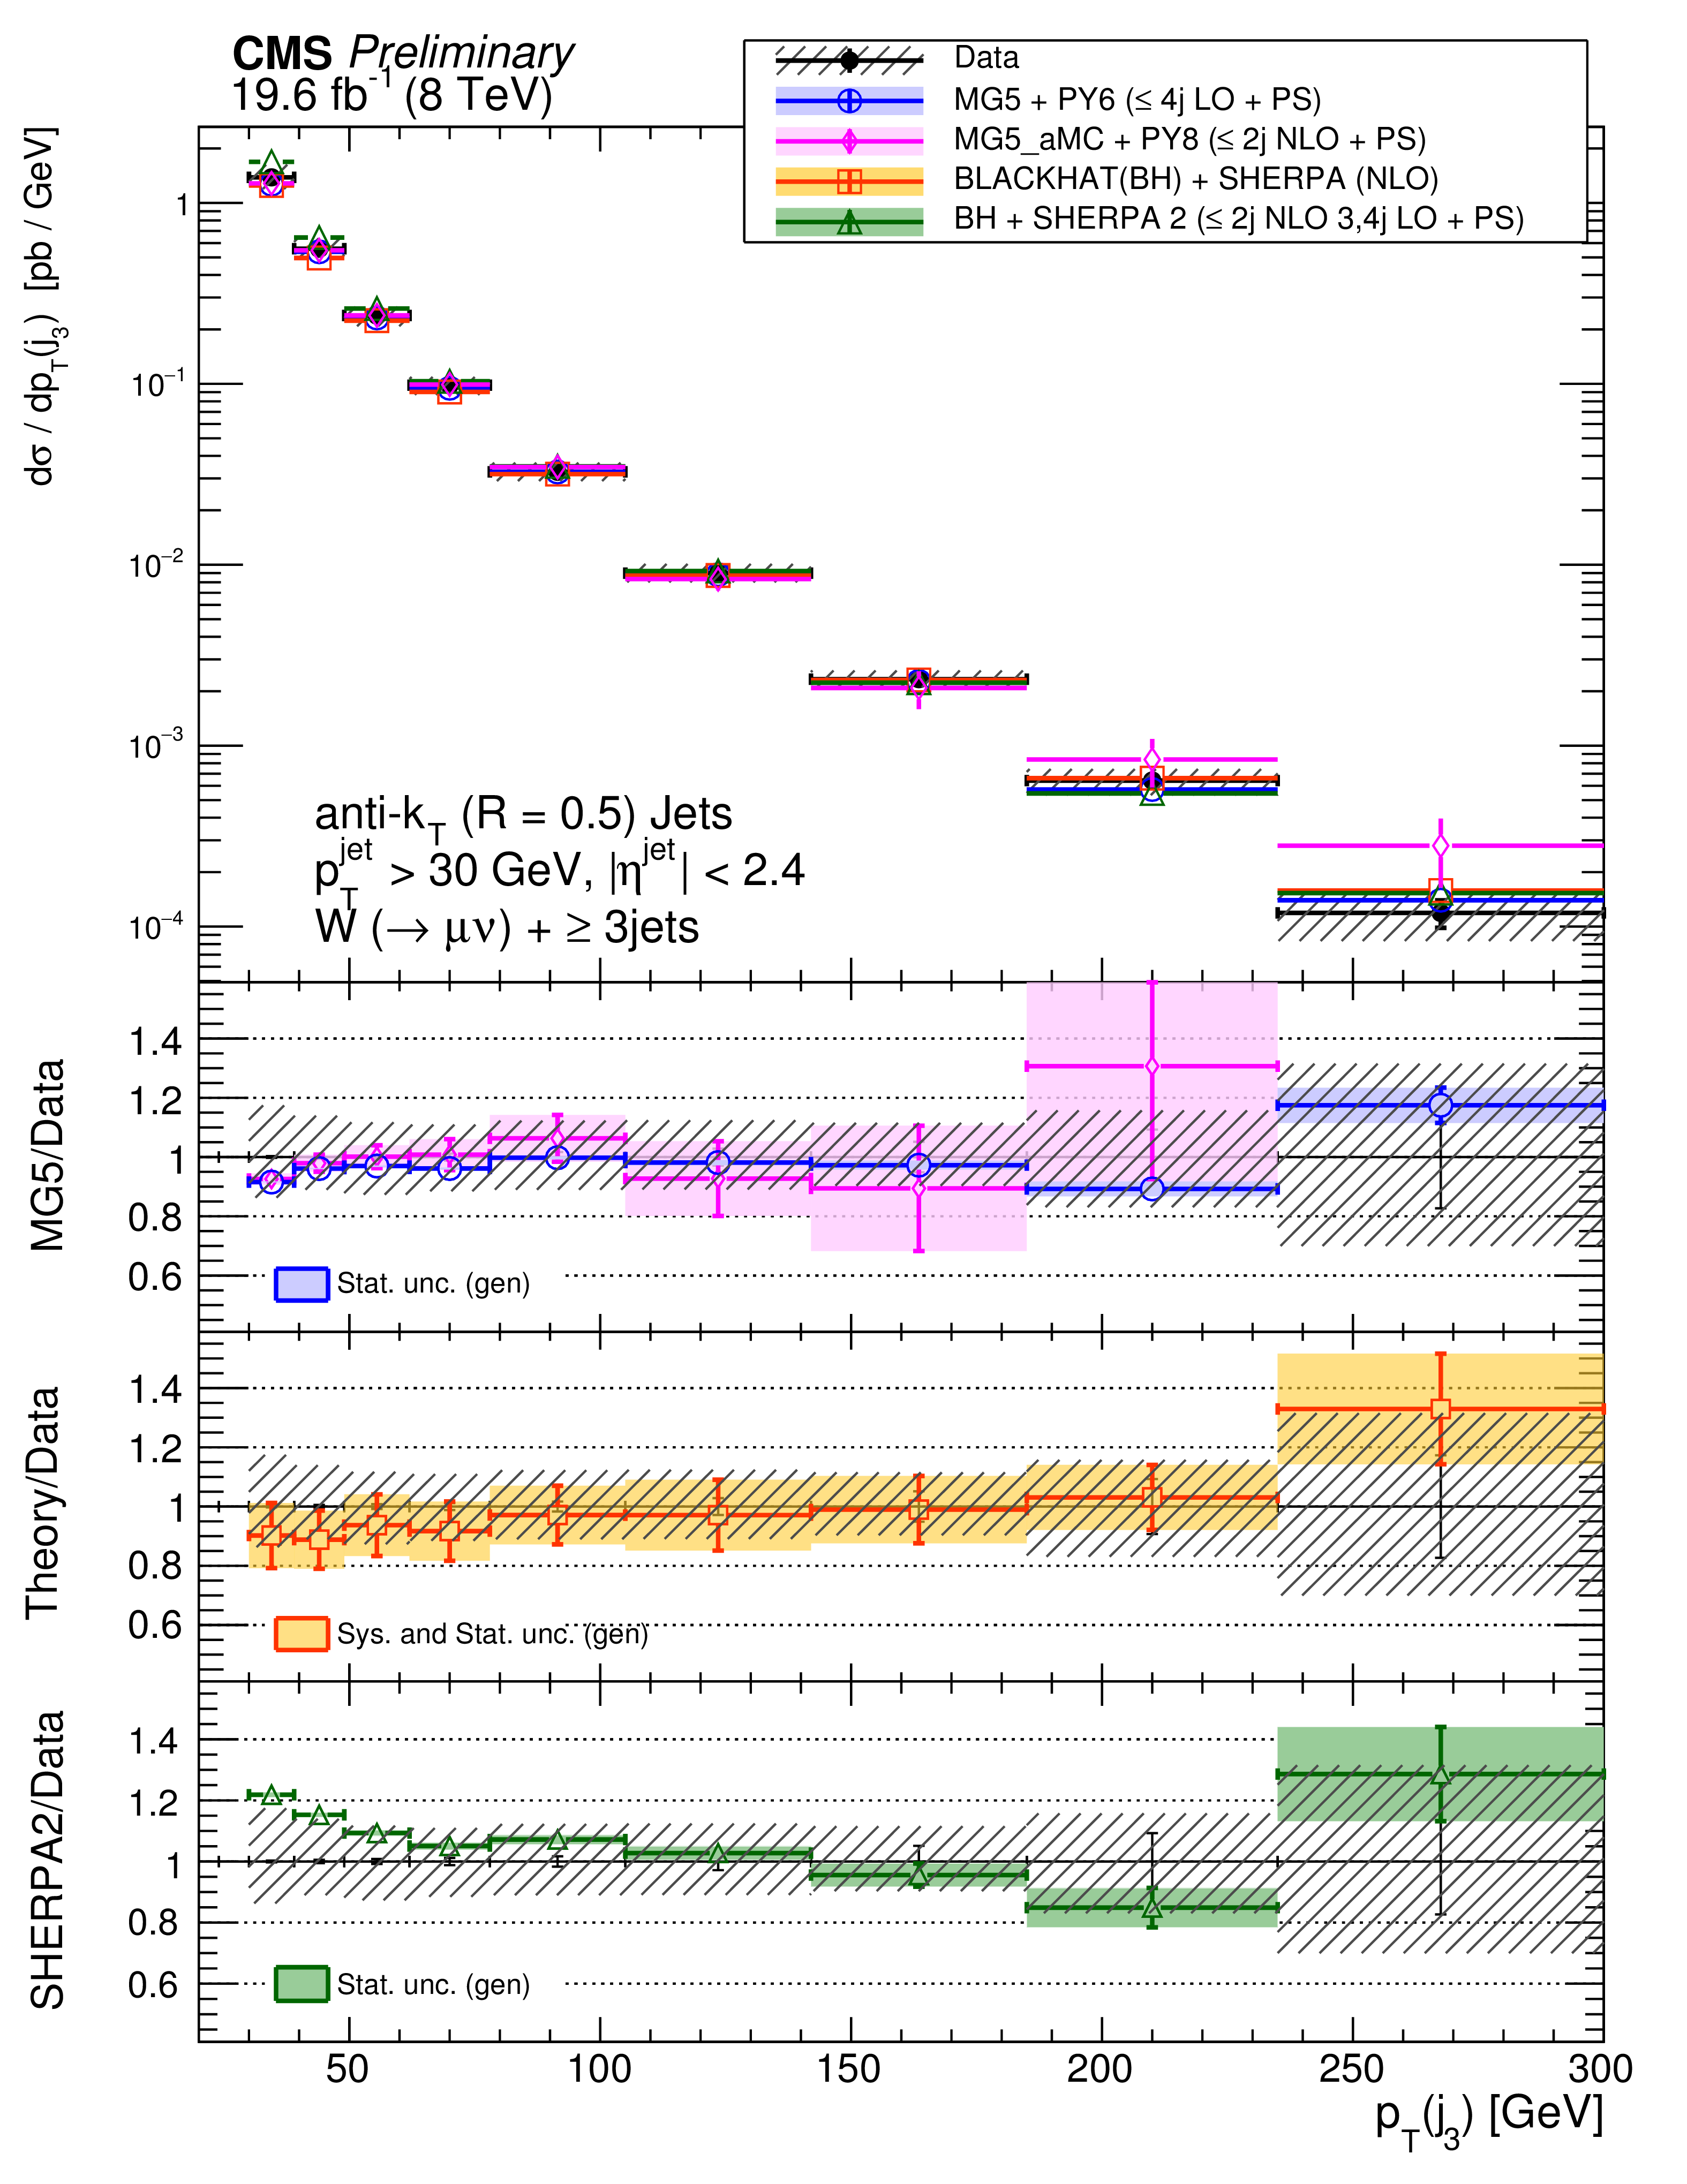
Figure 4-c:
The differential cross section measurement for the leading four jets' transverse momenta, compared to the prediction of MadGraph, MadGraph5$\_$aMC@NLO, SHERPA-2, BLACKHAT+SHERPA , and NNLO inclusive 1 jet production (indicated as NNLO1j). BLACKHAT+SHERPA and NNLO1j are corrected for hadronisation and multiple-parton interactions effects. Black circular markers with the grey hatched band represent the unfolded data measurement and its uncertainty. Overlaid are the predictions together with their statistical uncertainties (Theory stat.). The BLACKHAT+SHERPA and the NNLO1j uncertainties also contain theoretical systematic uncertainties (Theory syst.) described in Section 9. The lower plots show the ratio of each prediction to the unfolded data. |

png pdf |
Figure 4-d:
The differential cross section measurement for the leading four jets' transverse momenta, compared to the prediction of MadGraph, MadGraph5$\_$aMC@NLO, SHERPA-2, BLACKHAT+SHERPA , and NNLO inclusive 1 jet production (indicated as NNLO1j). BLACKHAT+SHERPA and NNLO1j are corrected for hadronisation and multiple-parton interactions effects. Black circular markers with the grey hatched band represent the unfolded data measurement and its uncertainty. Overlaid are the predictions together with their statistical uncertainties (Theory stat.). The BLACKHAT+SHERPA and the NNLO1j uncertainties also contain theoretical systematic uncertainties (Theory syst.) described in Section 9. The lower plots show the ratio of each prediction to the unfolded data. |
png pdf |
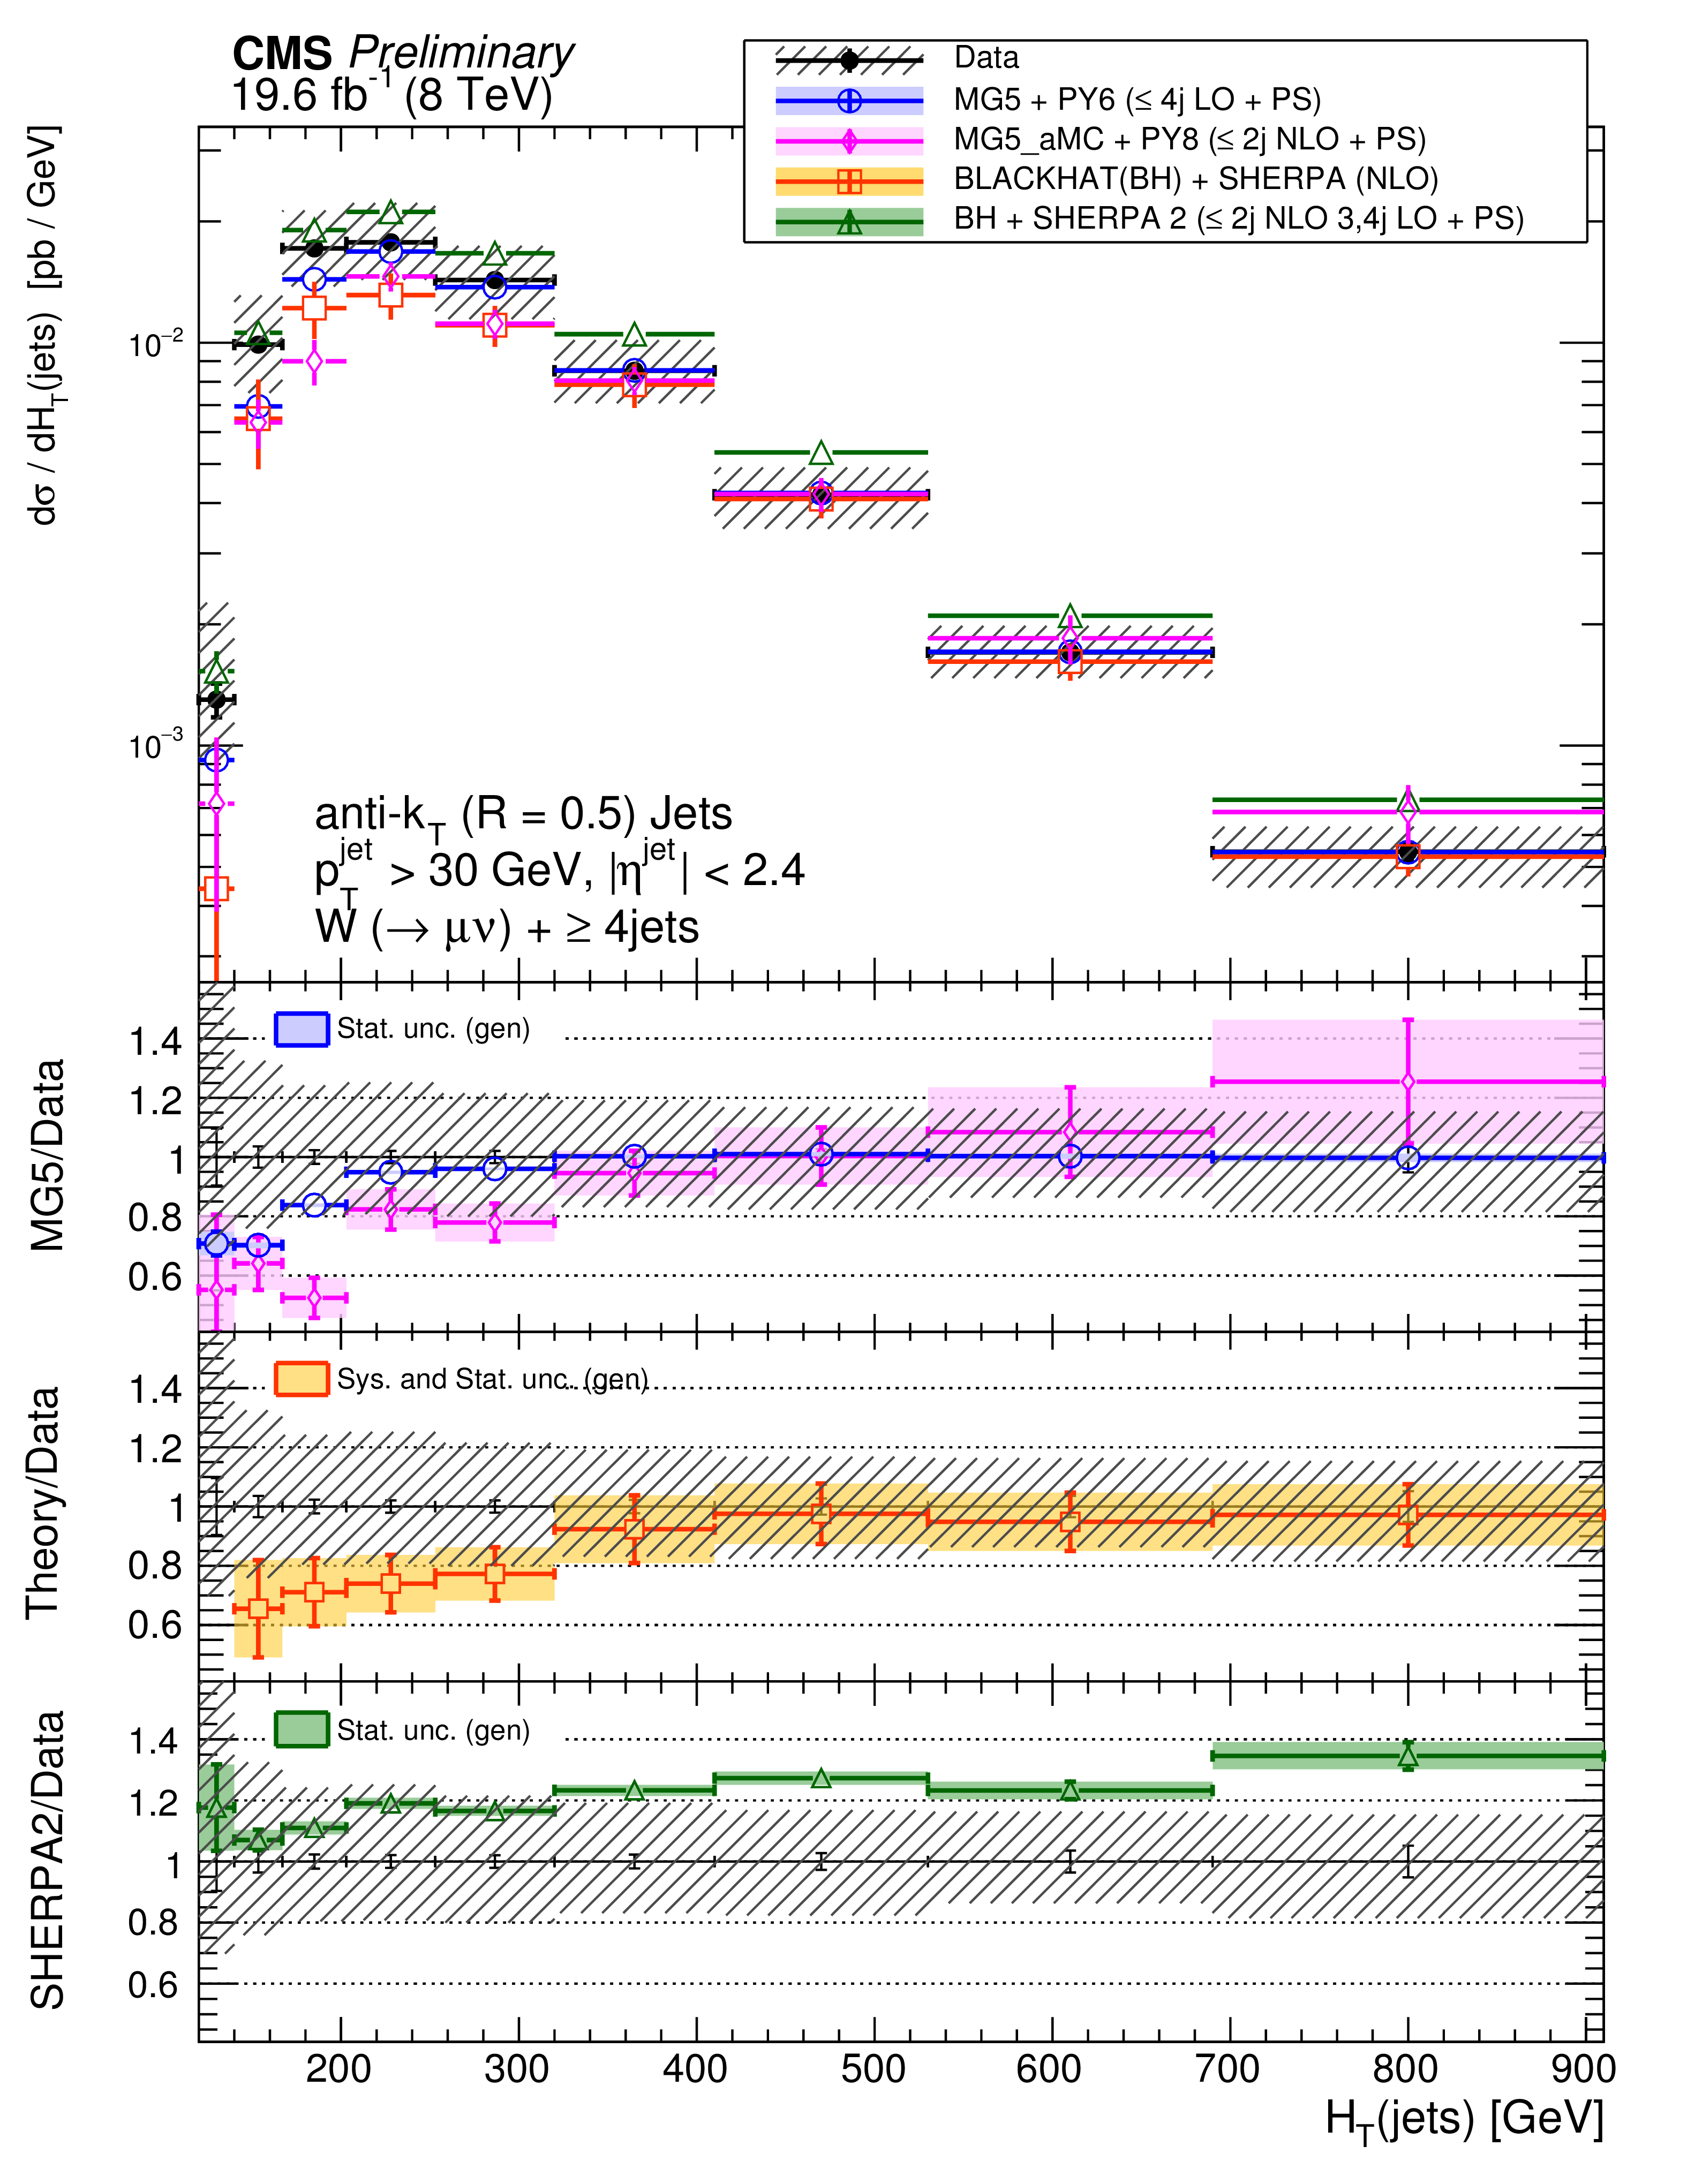
Figure 5-a:
The differential cross section measurement for $ {H_{\mathrm {T}}} $ for inclusive jet multiplicities 1-4, compared to the prediction of MadGraph , MadGraph5$\_$aMC@NLO, SHERPA-2, BLACKHAT+SHERPA , and NNLO inclusive 1 jet production (indicated as NNLO1j). BLACKHAT+SHERPA and NNLO1j are corrected for hadronisation and multiple-parton interactions effects. Black circular markers with the grey hatched band represent the unfolded data measurement and its uncertainty. Overlaid are the predictions together with their statistical uncertainties (Theory stat.). The BLACKHAT+SHERPA and NNLO1j uncertainties also contain theoretical systematic uncertainties (Theory syst.) described in Section 9. The lower plots show the ratio of each prediction to the unfolded data. |
png pdf |
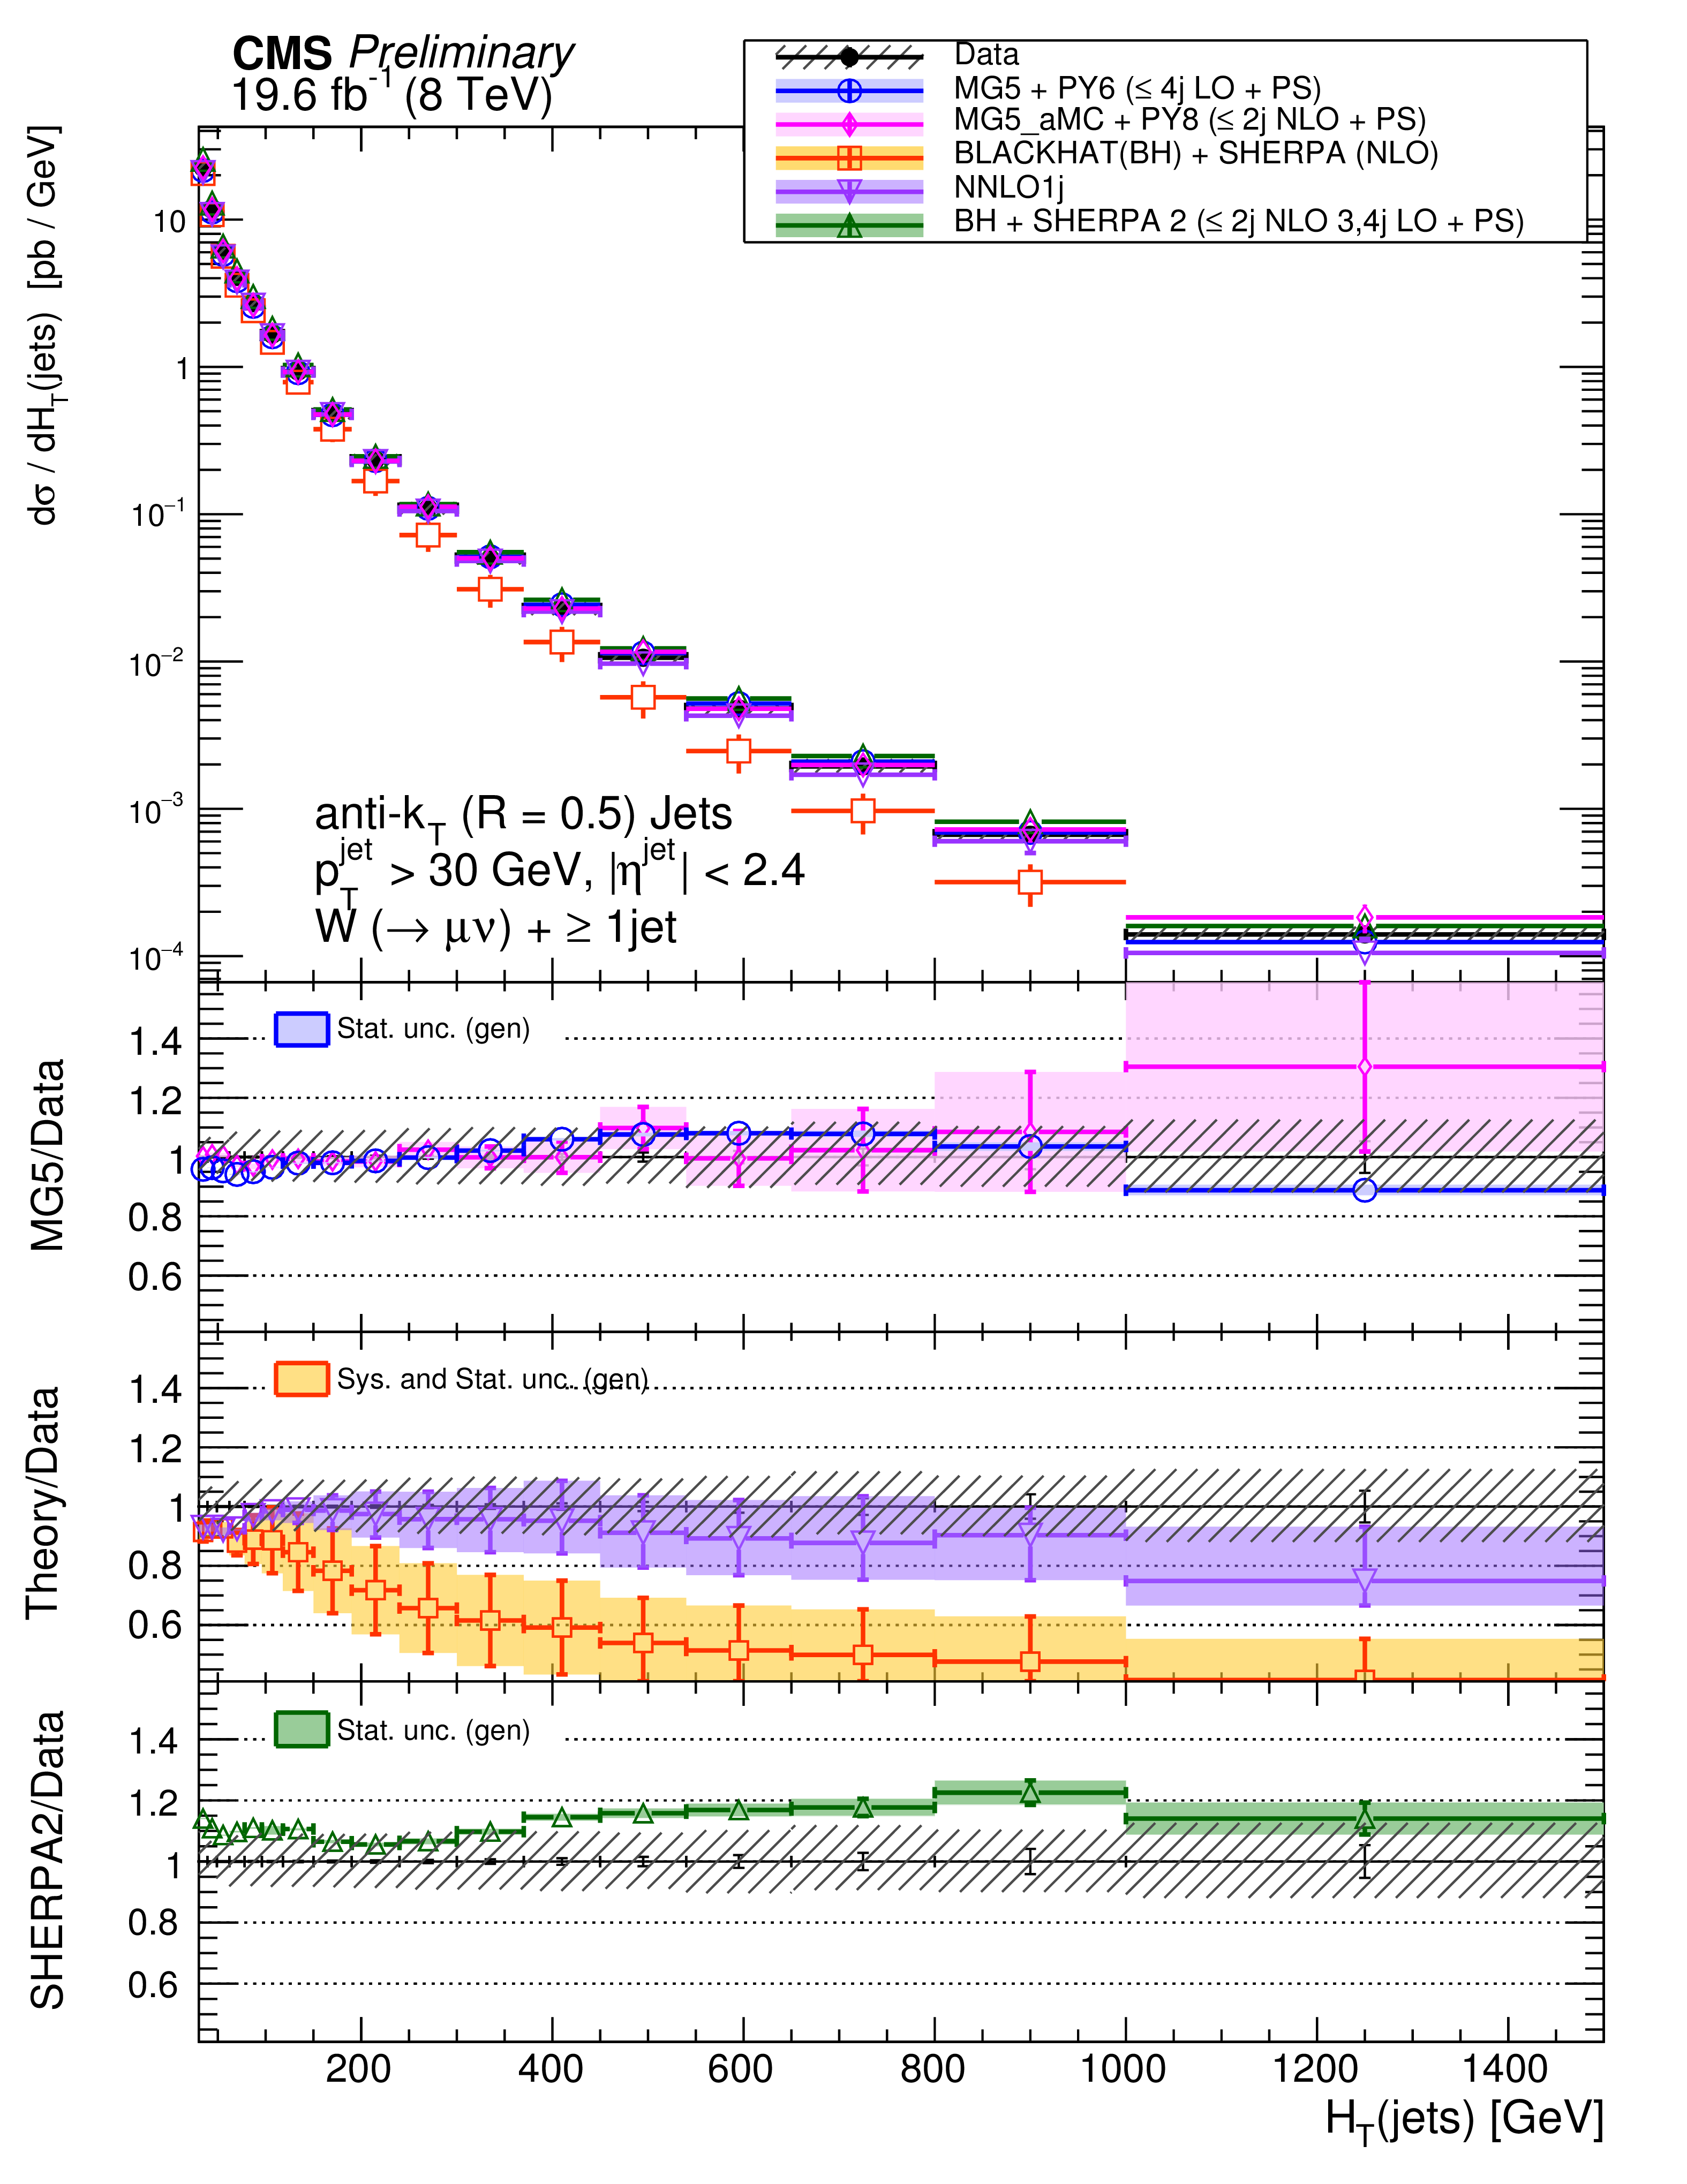
Figure 5-b:
The differential cross section measurement for $ {H_{\mathrm {T}}} $ for inclusive jet multiplicities 1-4, compared to the prediction of MadGraph , MadGraph5$\_$aMC@NLO, SHERPA-2, BLACKHAT+SHERPA , and NNLO inclusive 1 jet production (indicated as NNLO1j). BLACKHAT+SHERPA and NNLO1j are corrected for hadronisation and multiple-parton interactions effects. Black circular markers with the grey hatched band represent the unfolded data measurement and its uncertainty. Overlaid are the predictions together with their statistical uncertainties (Theory stat.). The BLACKHAT+SHERPA and NNLO1j uncertainties also contain theoretical systematic uncertainties (Theory syst.) described in Section 9. The lower plots show the ratio of each prediction to the unfolded data. |
png pdf |
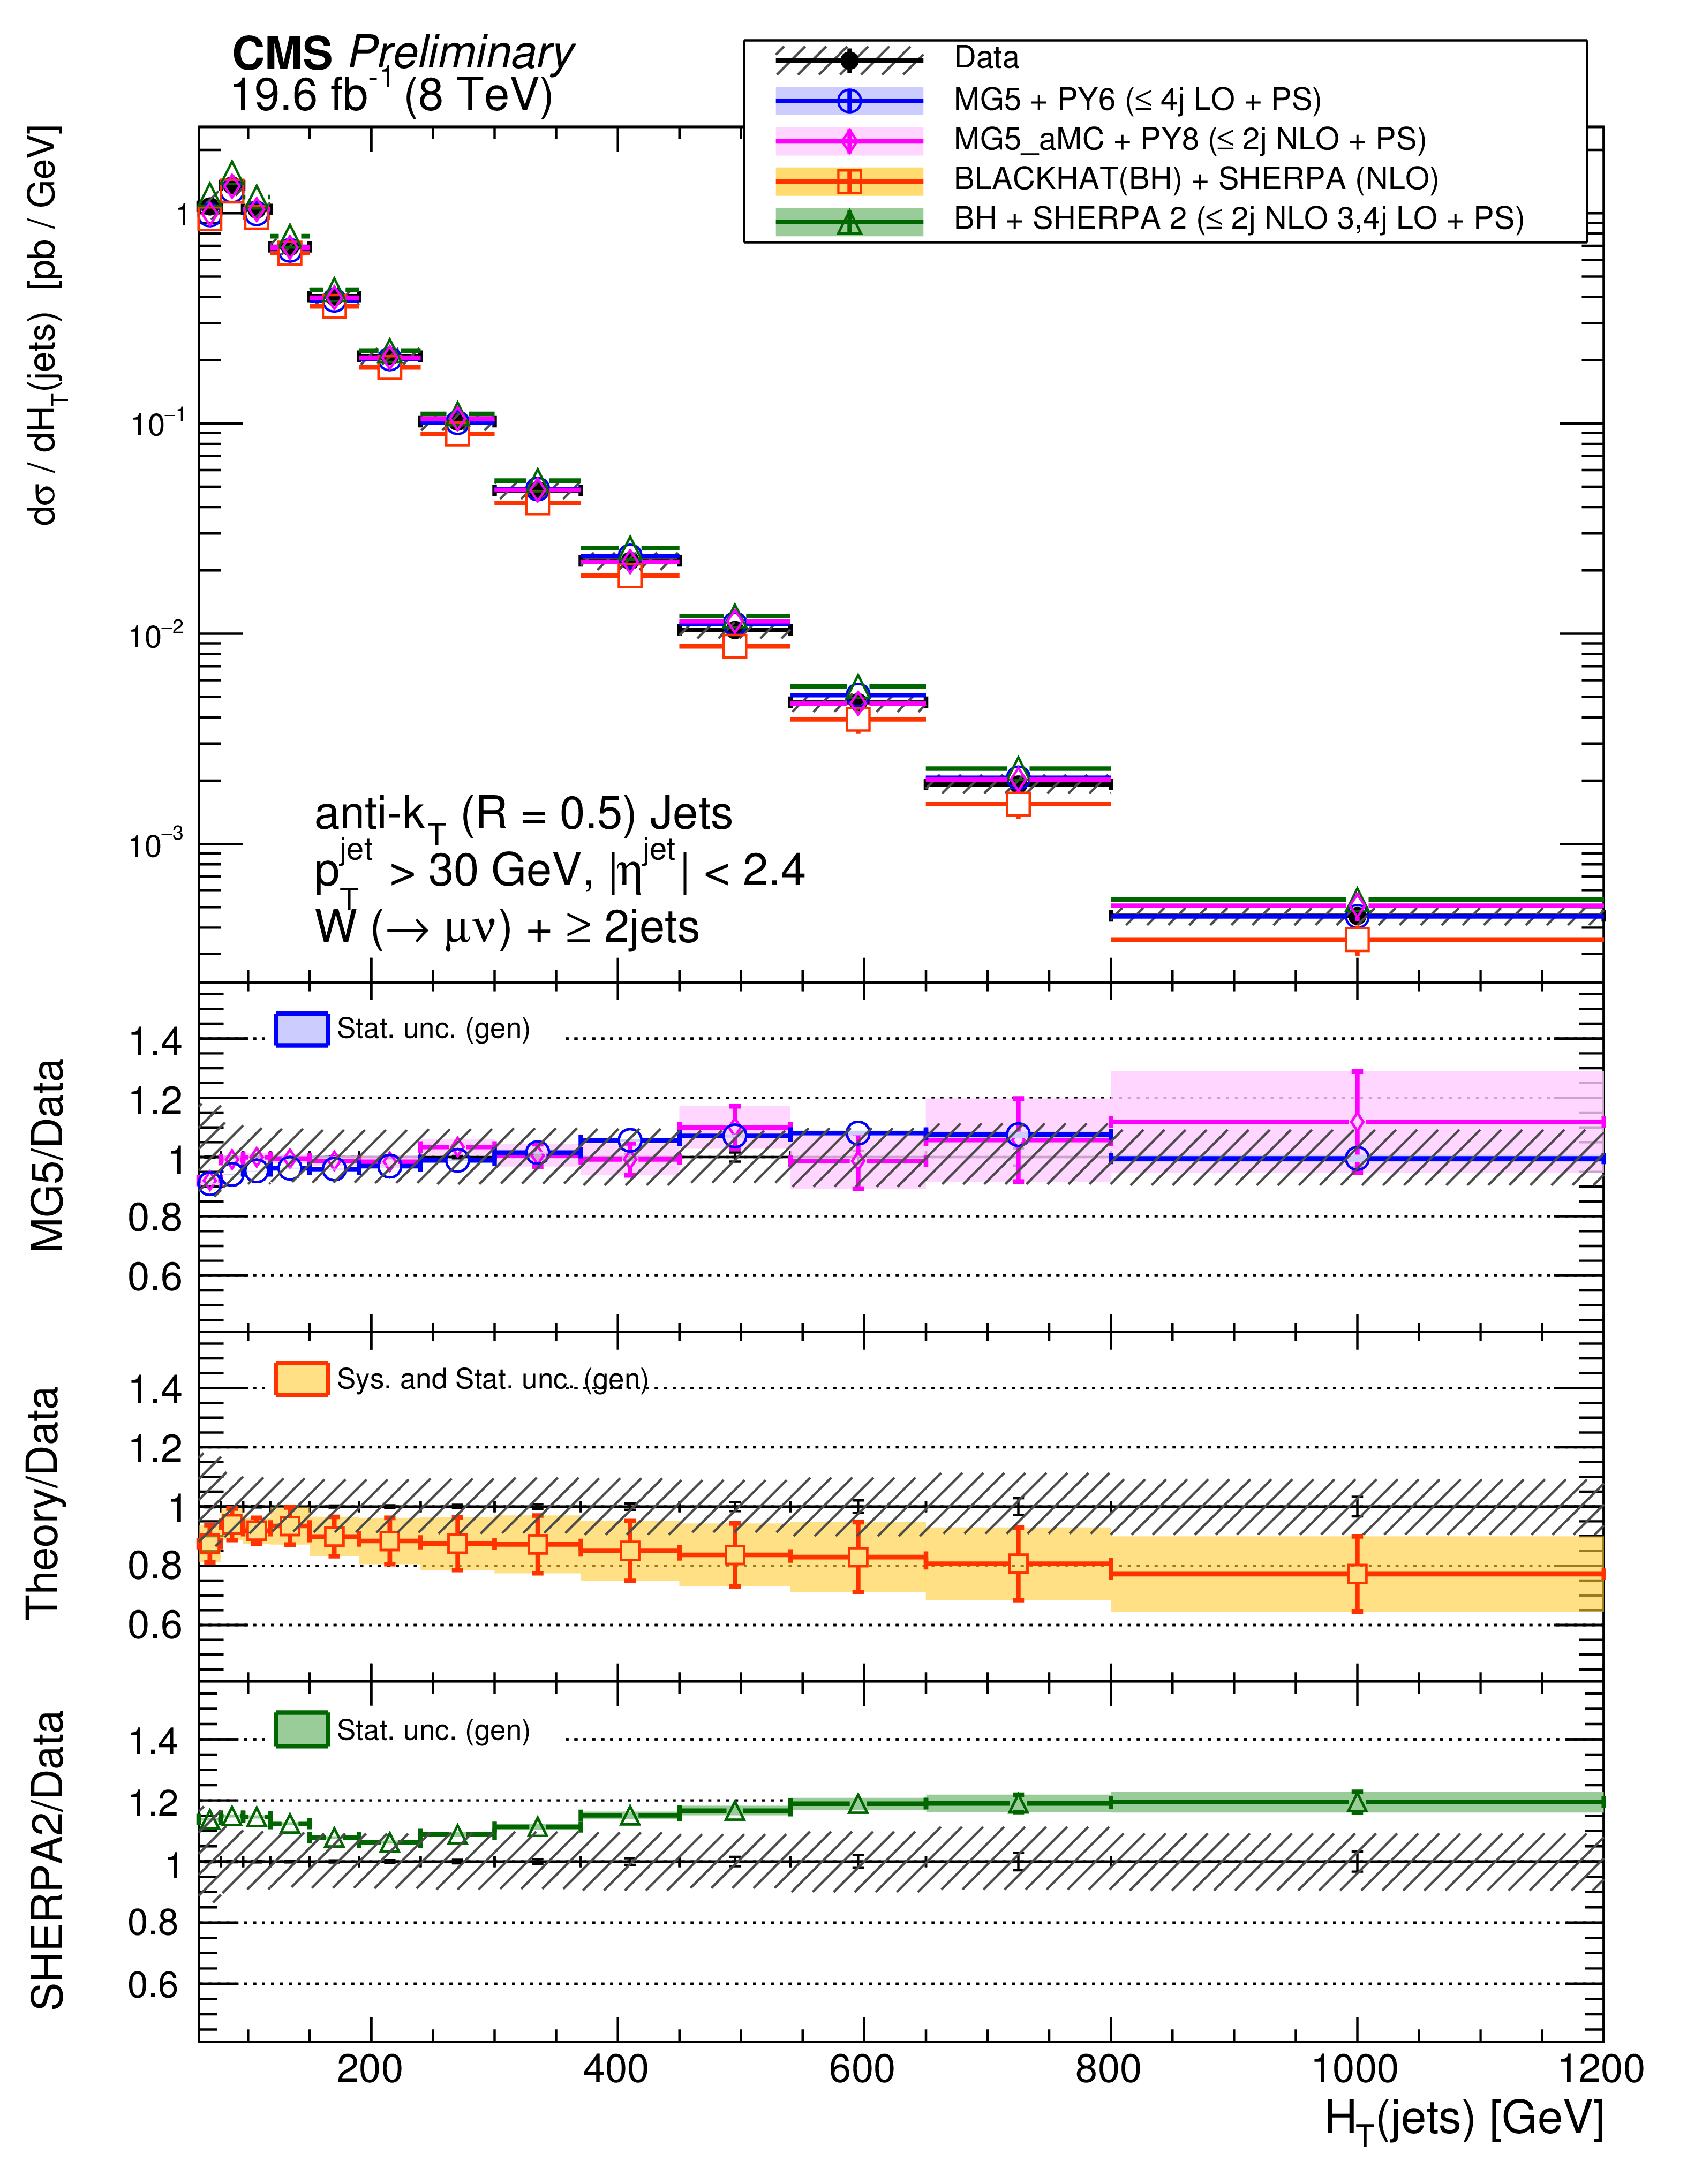
Figure 5-c:
The differential cross section measurement for $ {H_{\mathrm {T}}} $ for inclusive jet multiplicities 1-4, compared to the prediction of MadGraph , MadGraph5$\_$aMC@NLO, SHERPA-2, BLACKHAT+SHERPA , and NNLO inclusive 1 jet production (indicated as NNLO1j). BLACKHAT+SHERPA and NNLO1j are corrected for hadronisation and multiple-parton interactions effects. Black circular markers with the grey hatched band represent the unfolded data measurement and its uncertainty. Overlaid are the predictions together with their statistical uncertainties (Theory stat.). The BLACKHAT+SHERPA and NNLO1j uncertainties also contain theoretical systematic uncertainties (Theory syst.) described in Section 9. The lower plots show the ratio of each prediction to the unfolded data. |
png pdf |
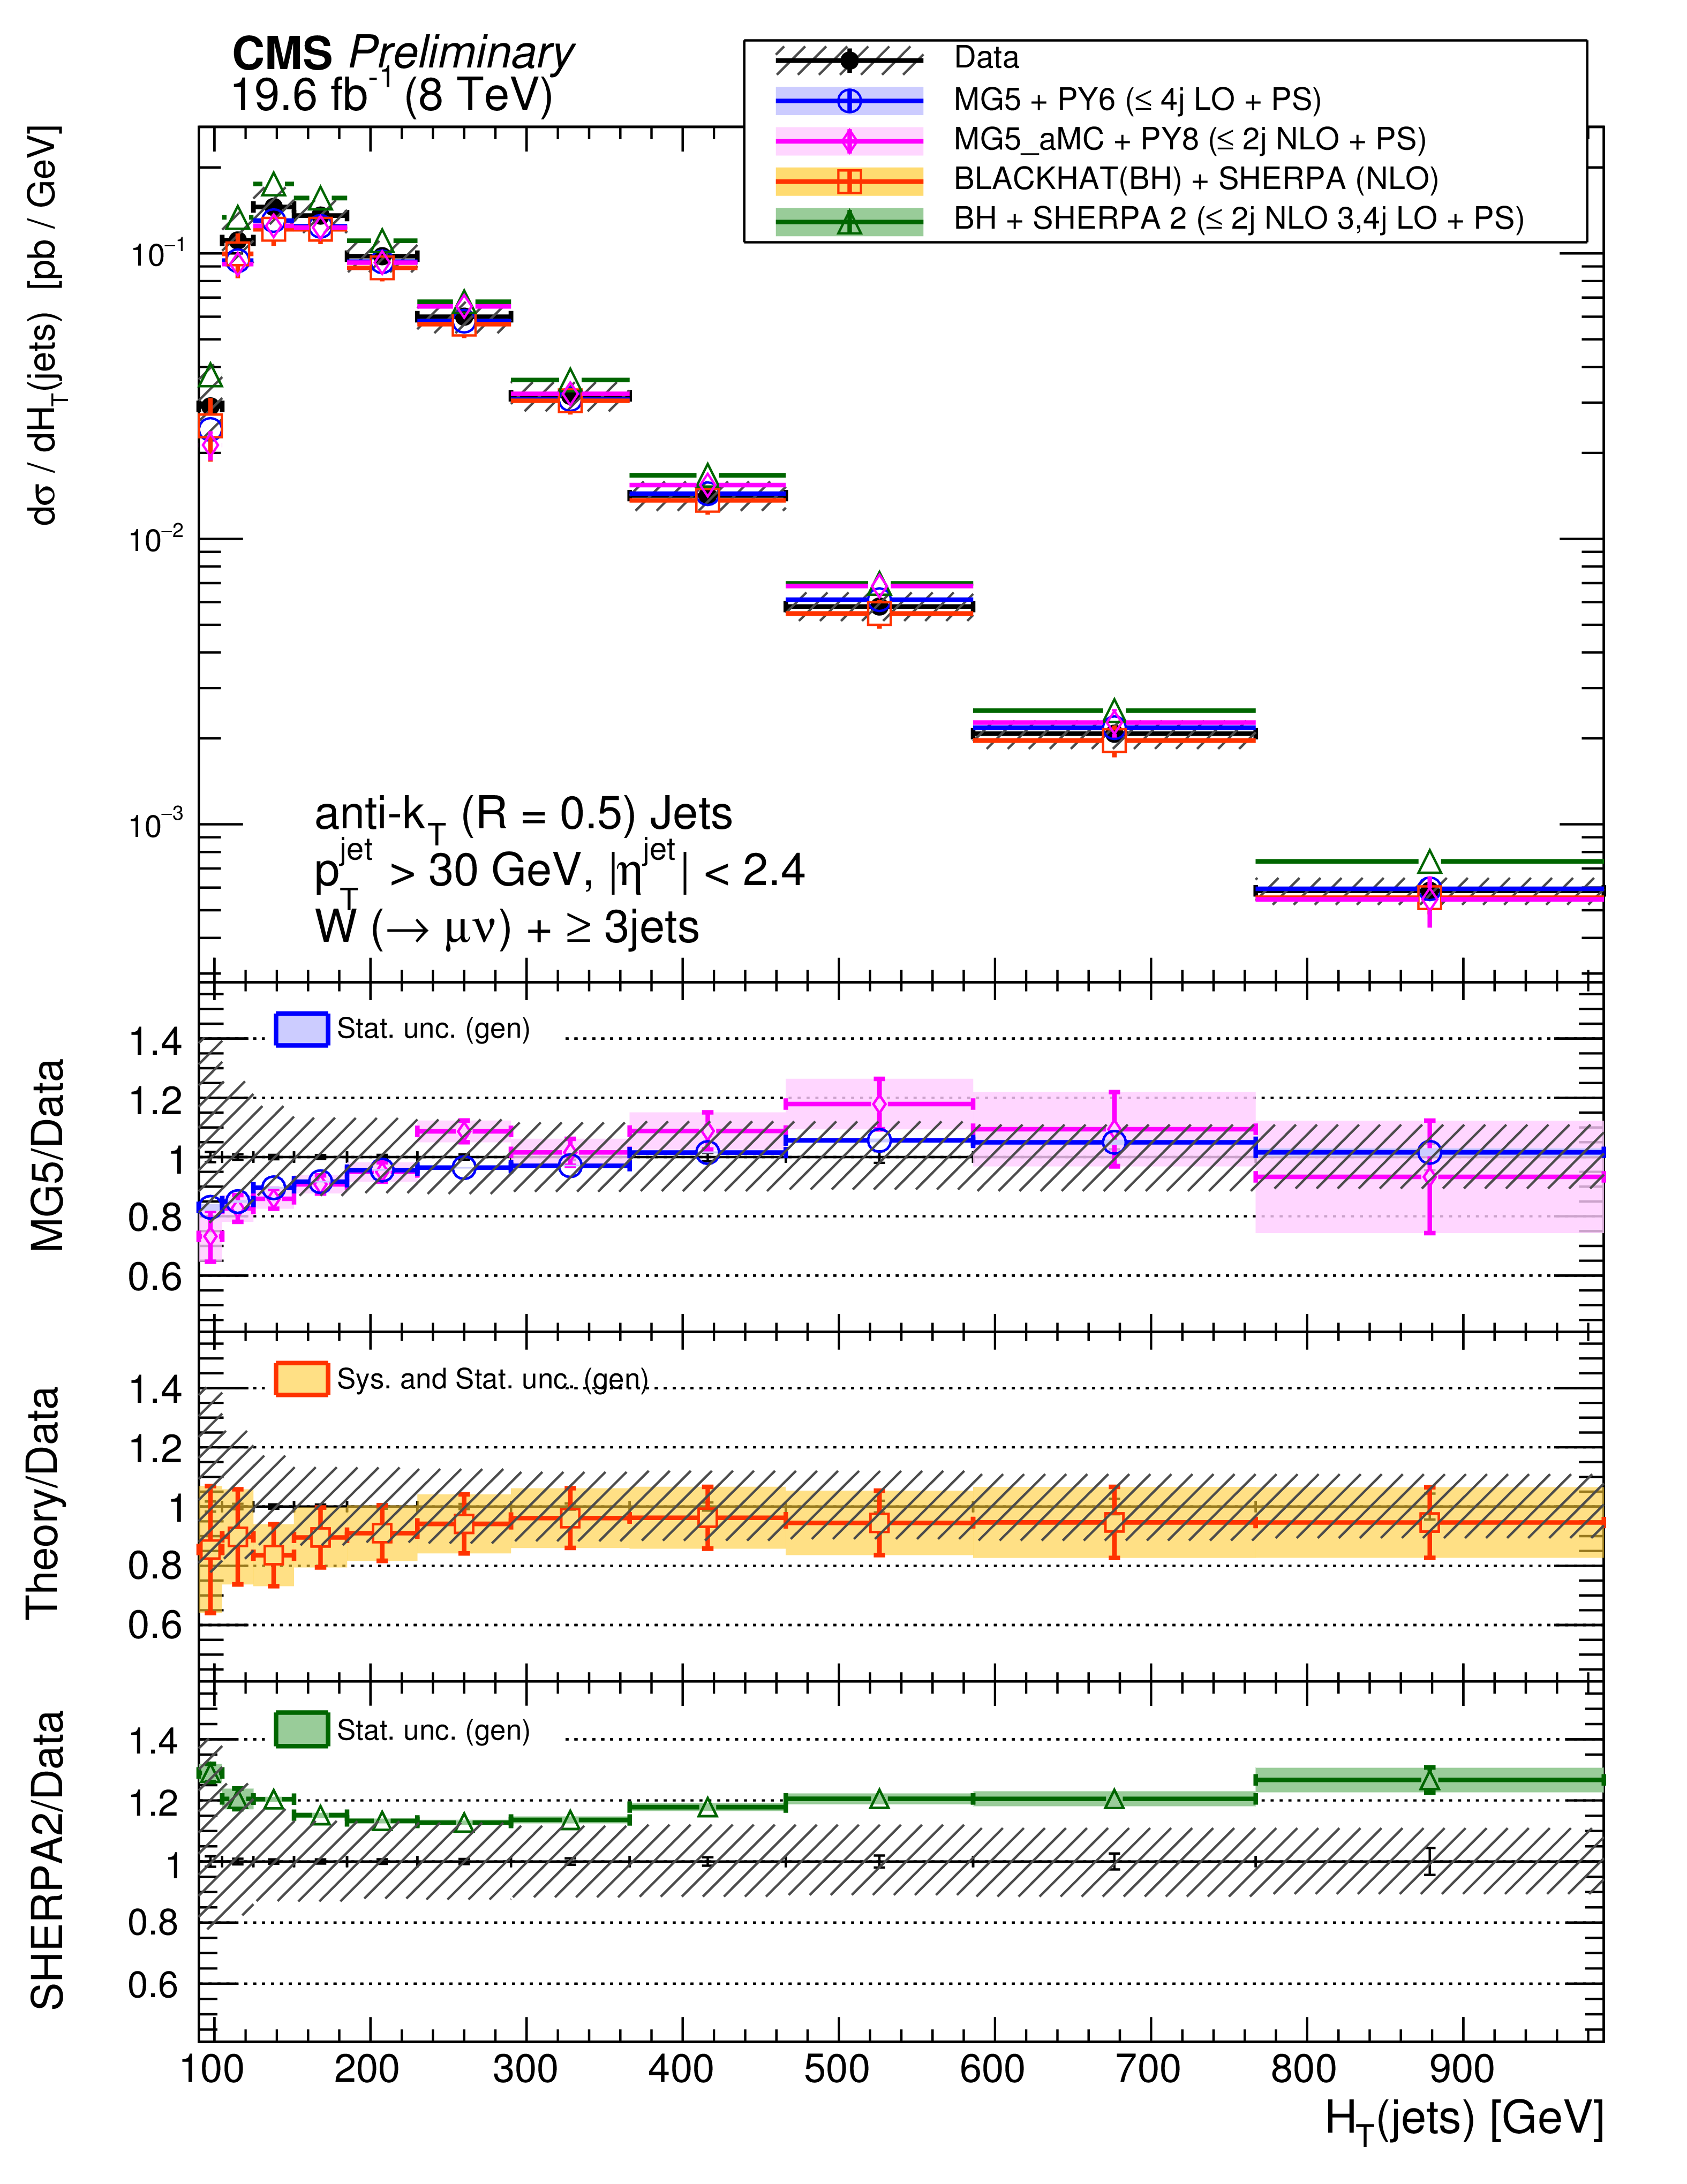
Figure 5-d:
The differential cross section measurement for $ {H_{\mathrm {T}}} $ for inclusive jet multiplicities 1-4, compared to the prediction of MadGraph , MadGraph5$\_$aMC@NLO, SHERPA-2, BLACKHAT+SHERPA , and NNLO inclusive 1 jet production (indicated as NNLO1j). BLACKHAT+SHERPA and NNLO1j are corrected for hadronisation and multiple-parton interactions effects. Black circular markers with the grey hatched band represent the unfolded data measurement and its uncertainty. Overlaid are the predictions together with their statistical uncertainties (Theory stat.). The BLACKHAT+SHERPA and NNLO1j uncertainties also contain theoretical systematic uncertainties (Theory syst.) described in Section 9. The lower plots show the ratio of each prediction to the unfolded data. |
png pdf |
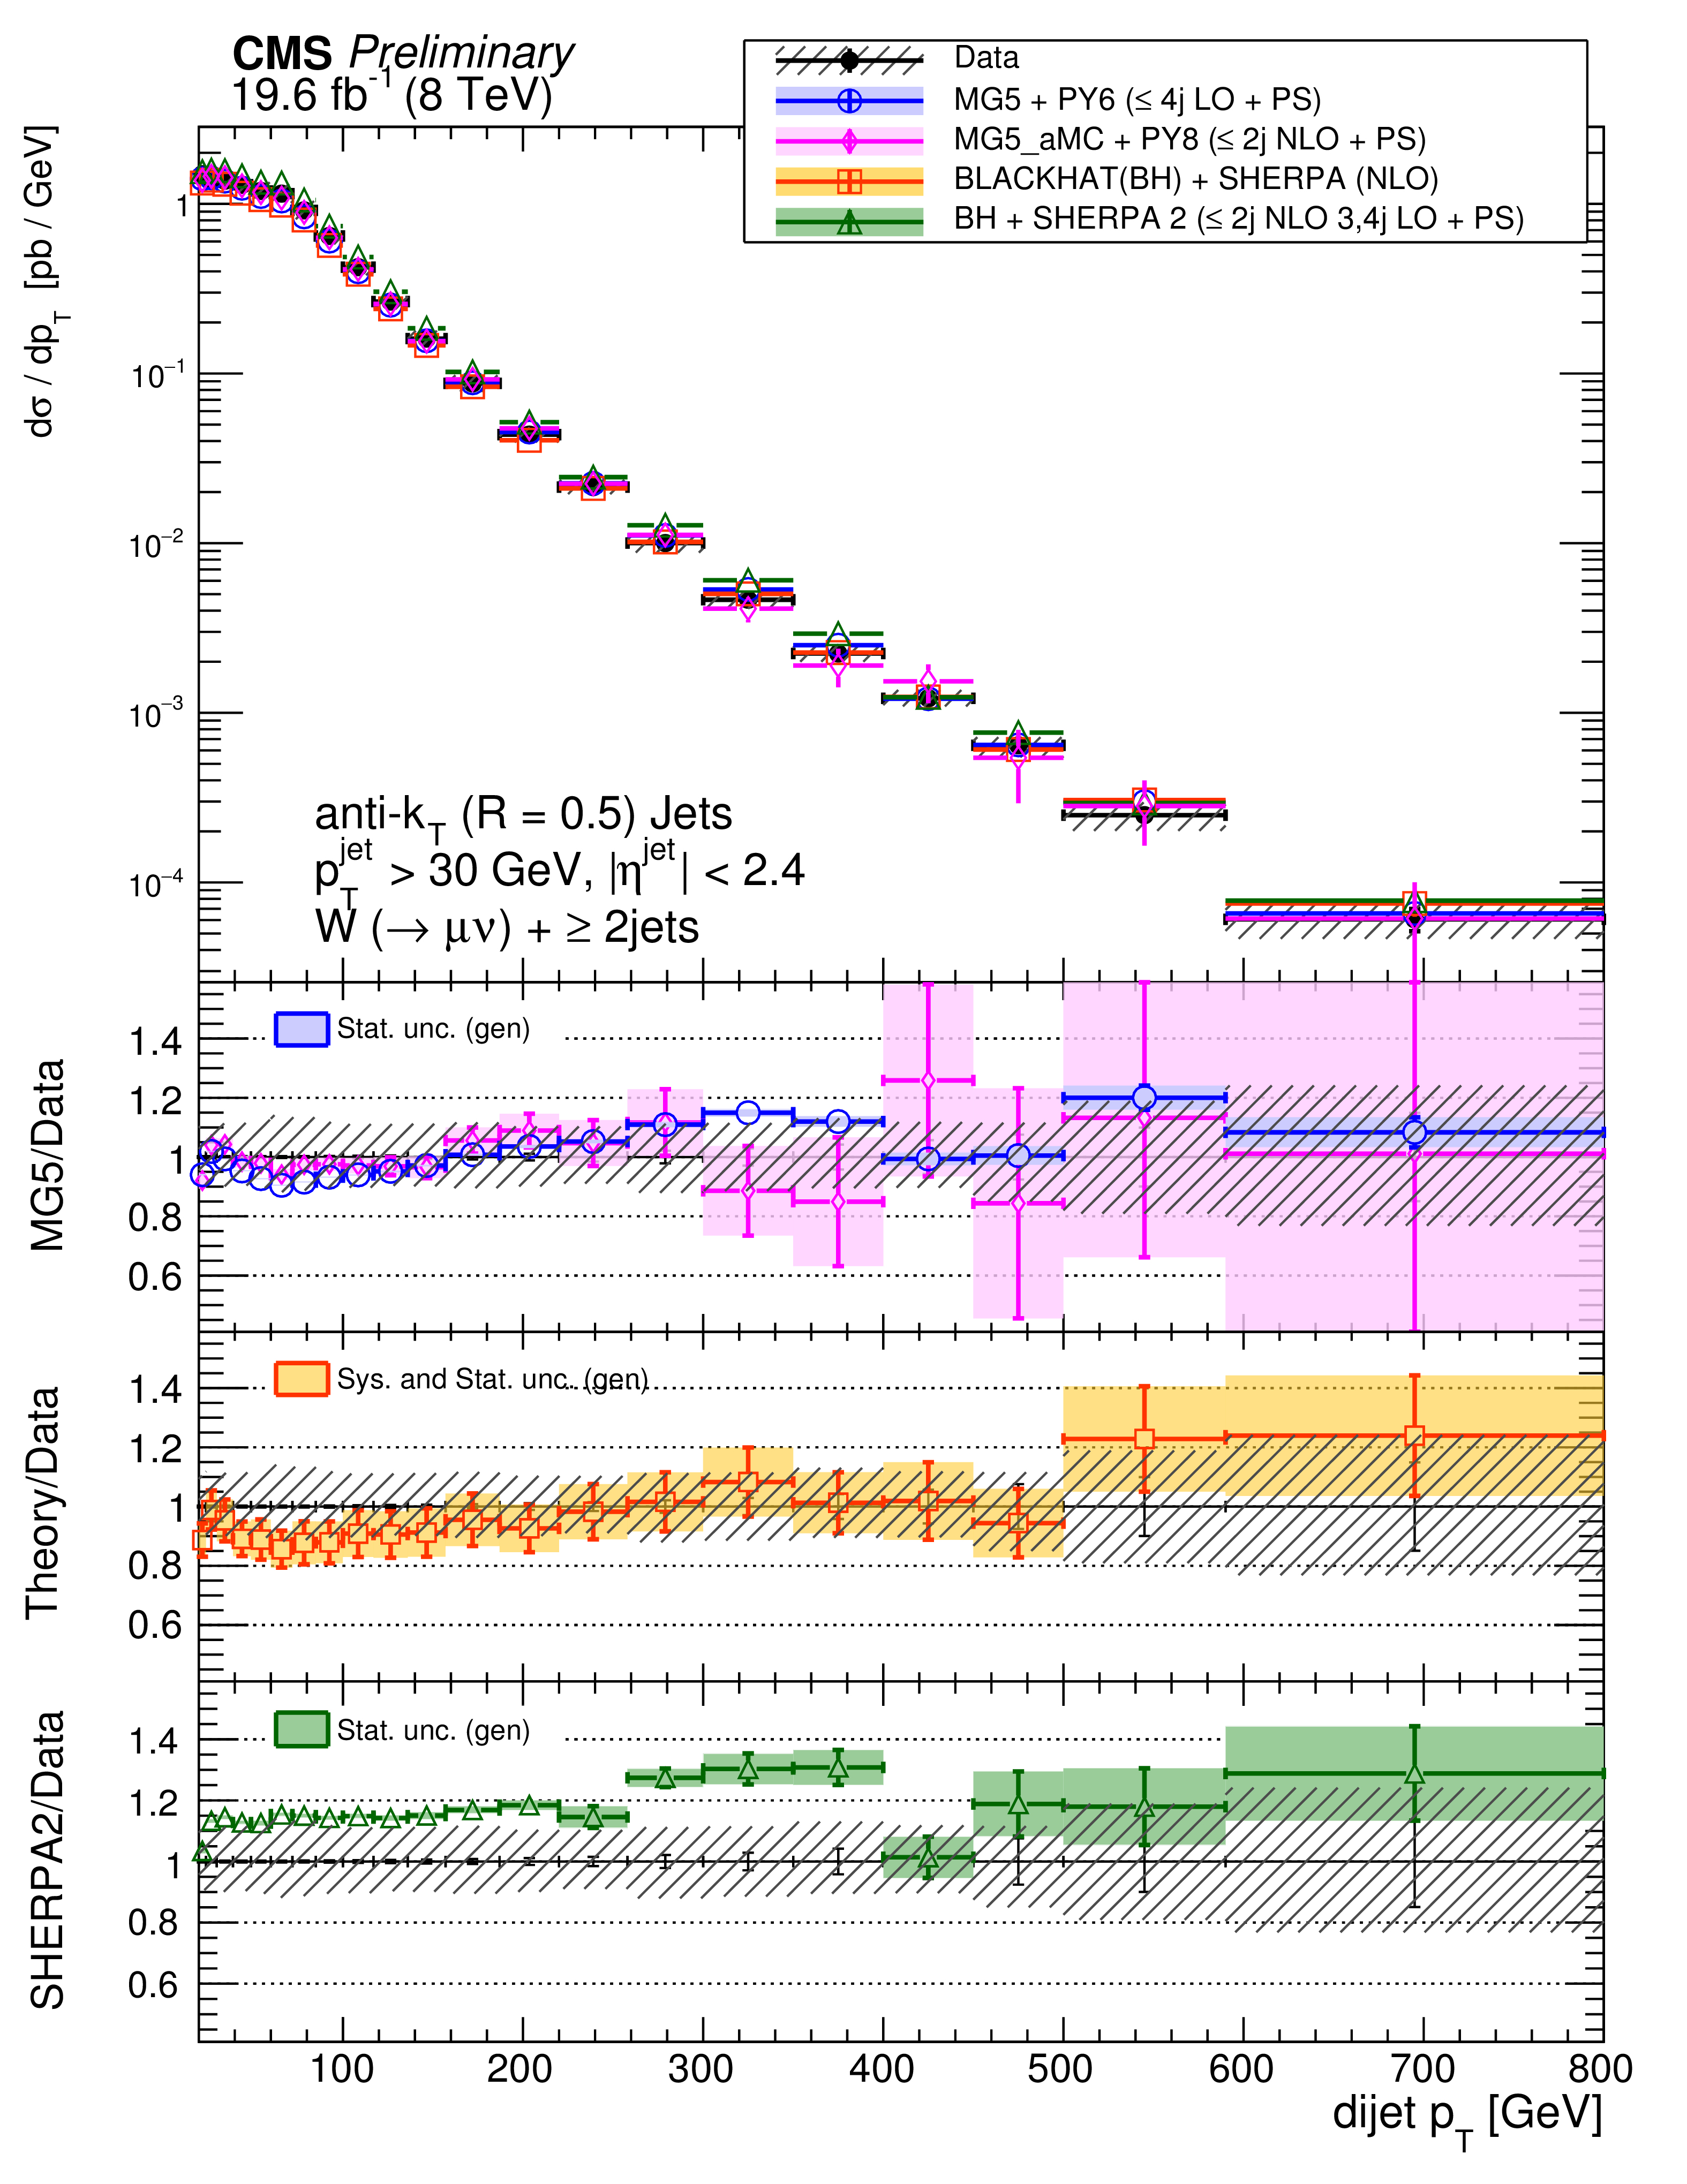
Figure 6-a:
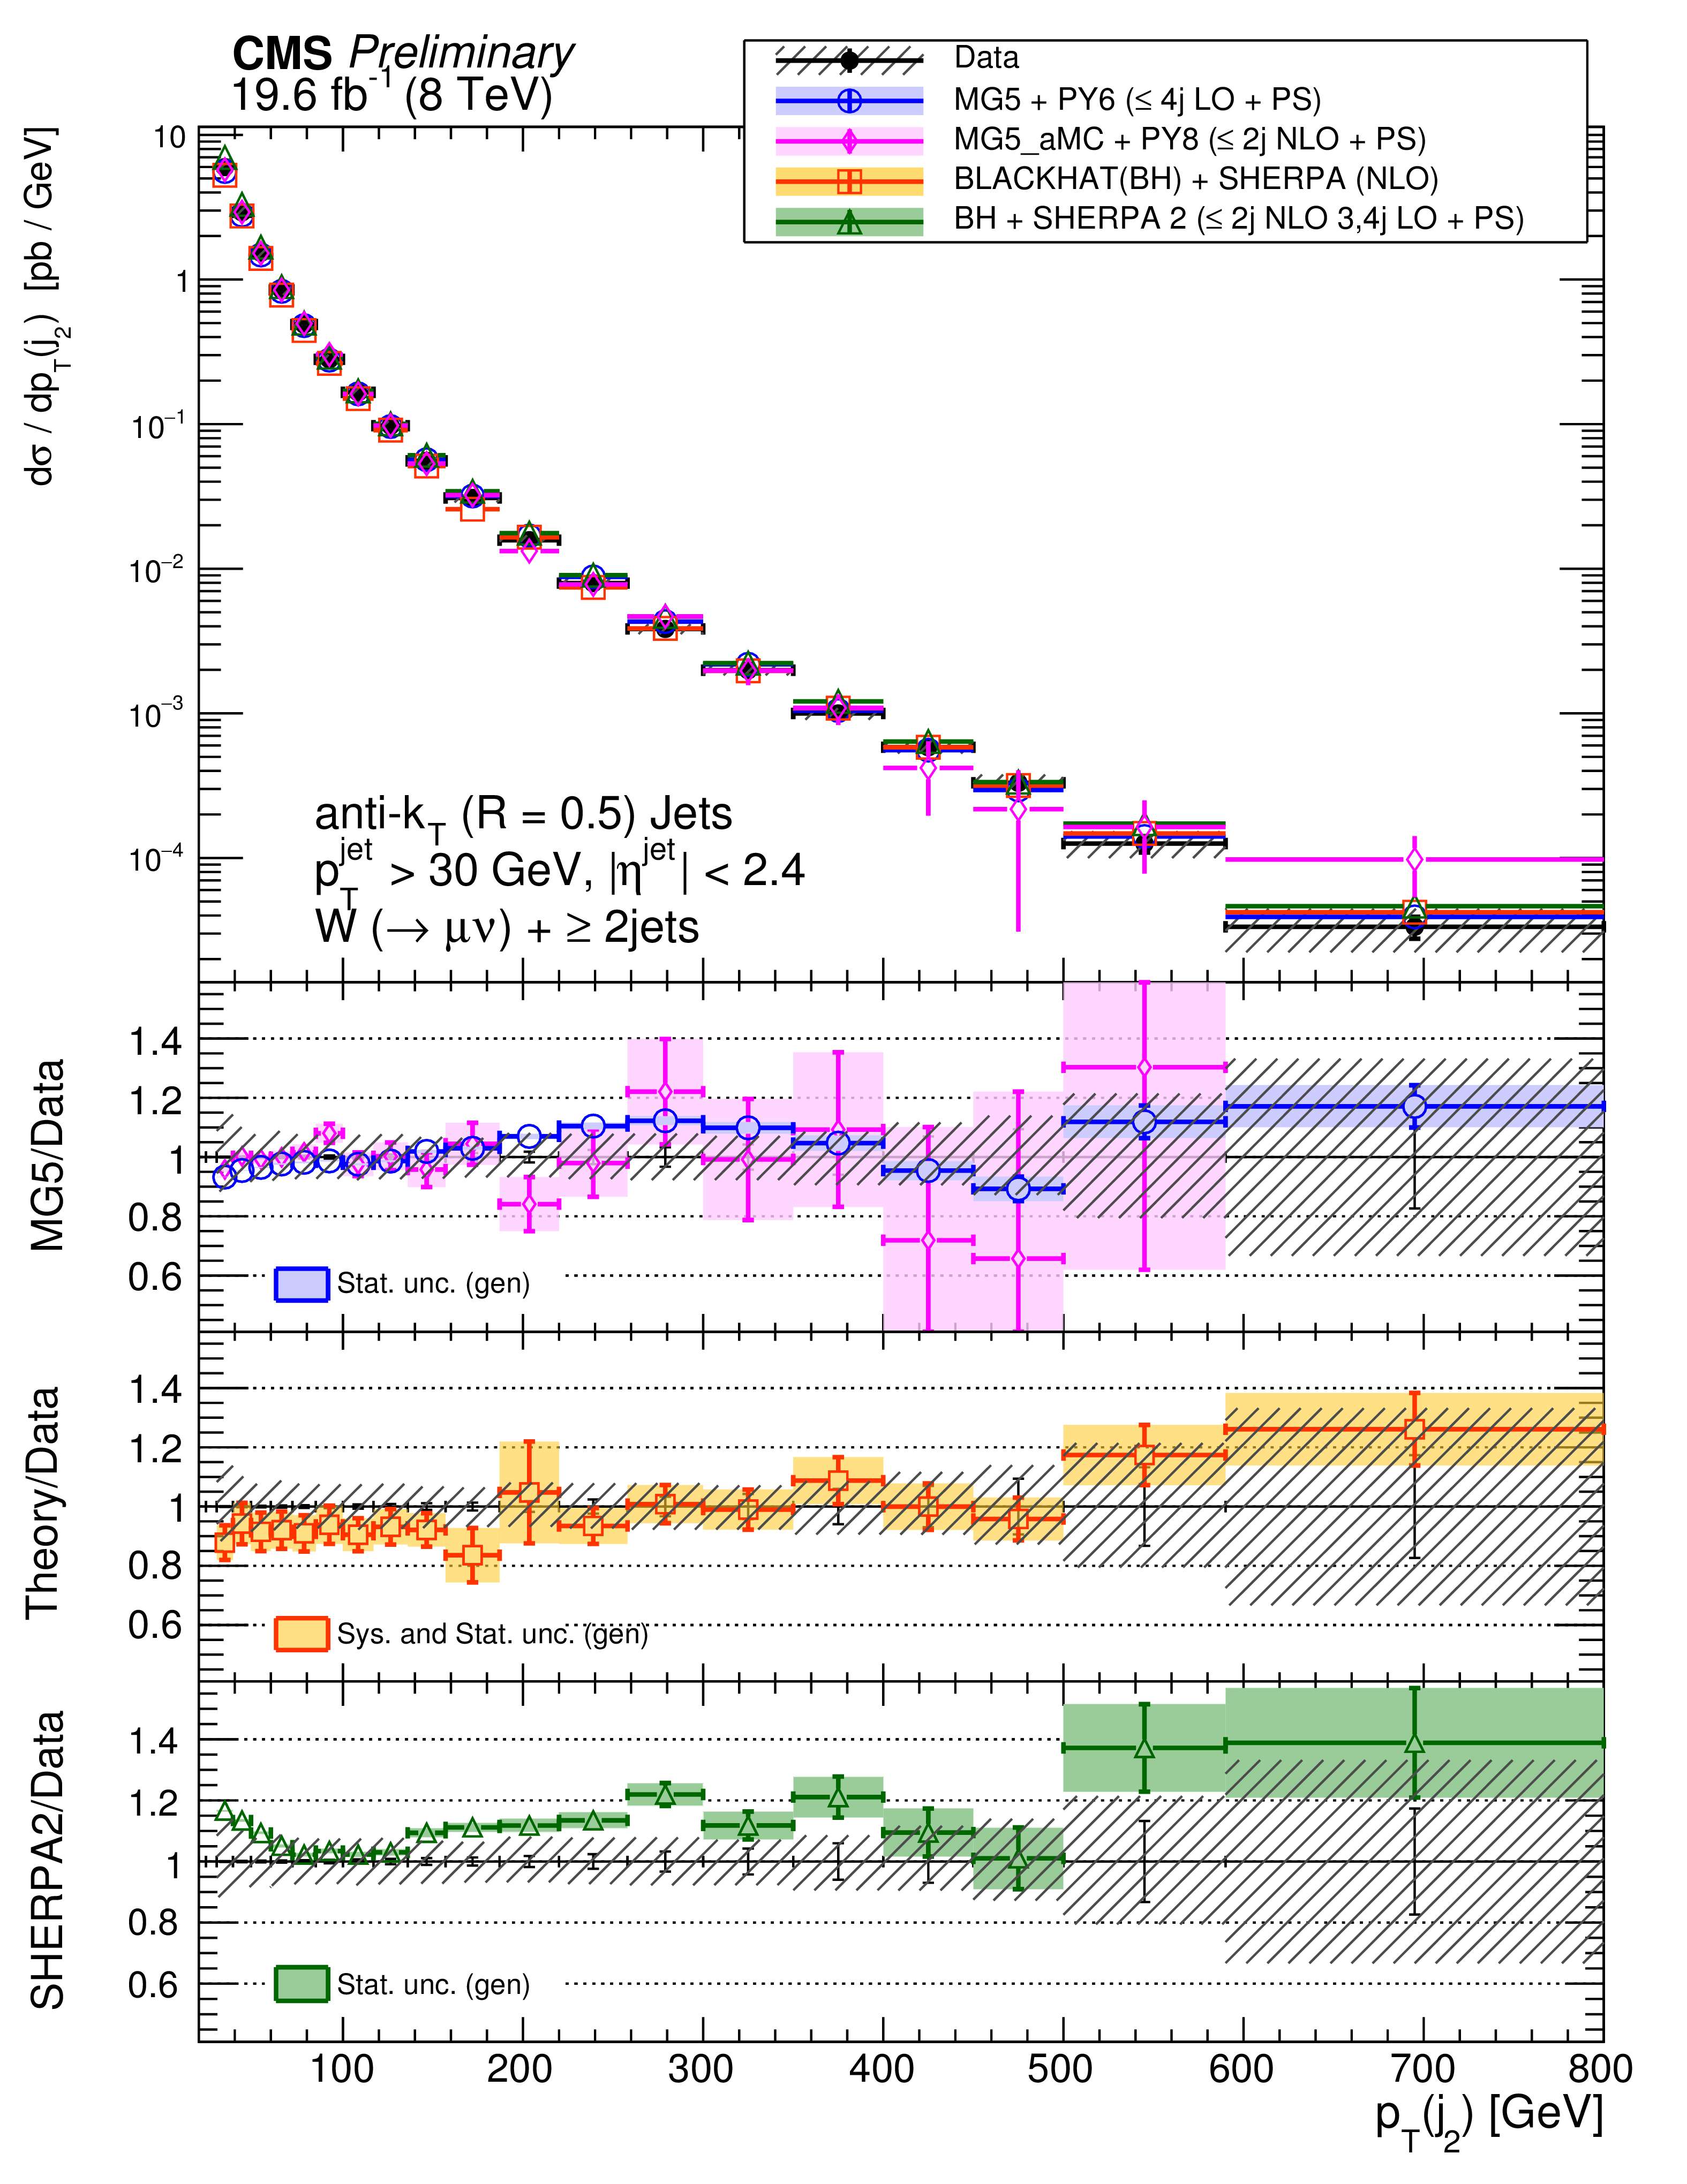
The differential cross section measurement for the dijet $ {p_{\mathrm {T}}} $ for inclusive jet multiplicities 2-4, compared to the prediction of MadGraph , MadGraph5$\_$aMC@NLO, SHERPA-2, and BLACKHAT+SHERPA (corrected for hadronization and multiple-parton interactions). Black circular markers with the grey hatched band represent the unfolded data measurement and its uncertainty. Overlaid are the predictions together with their statistical uncertainties (Theory stat.). The BLACKHAT+SHERPA uncertainty also contains theoretical systematic uncertainties (Theory syst.) described in Section 9. The lower plots show the ratio of each prediction to the unfolded data. |

png pdf |
Figure 6-b:
The differential cross section measurement for the dijet $ {p_{\mathrm {T}}} $ for inclusive jet multiplicities 2-4, compared to the prediction of MadGraph , MadGraph5$\_$aMC@NLO, SHERPA-2, and BLACKHAT+SHERPA (corrected for hadronization and multiple-parton interactions). Black circular markers with the grey hatched band represent the unfolded data measurement and its uncertainty. Overlaid are the predictions together with their statistical uncertainties (Theory stat.). The BLACKHAT+SHERPA uncertainty also contains theoretical systematic uncertainties (Theory syst.) described in Section 9. The lower plots show the ratio of each prediction to the unfolded data. |

png pdf |
Figure 6-c:
The differential cross section measurement for the dijet $ {p_{\mathrm {T}}} $ for inclusive jet multiplicities 2-4, compared to the prediction of MadGraph , MadGraph5$\_$aMC@NLO, SHERPA-2, and BLACKHAT+SHERPA (corrected for hadronization and multiple-parton interactions). Black circular markers with the grey hatched band represent the unfolded data measurement and its uncertainty. Overlaid are the predictions together with their statistical uncertainties (Theory stat.). The BLACKHAT+SHERPA uncertainty also contains theoretical systematic uncertainties (Theory syst.) described in Section 9. The lower plots show the ratio of each prediction to the unfolded data. |
png pdf |
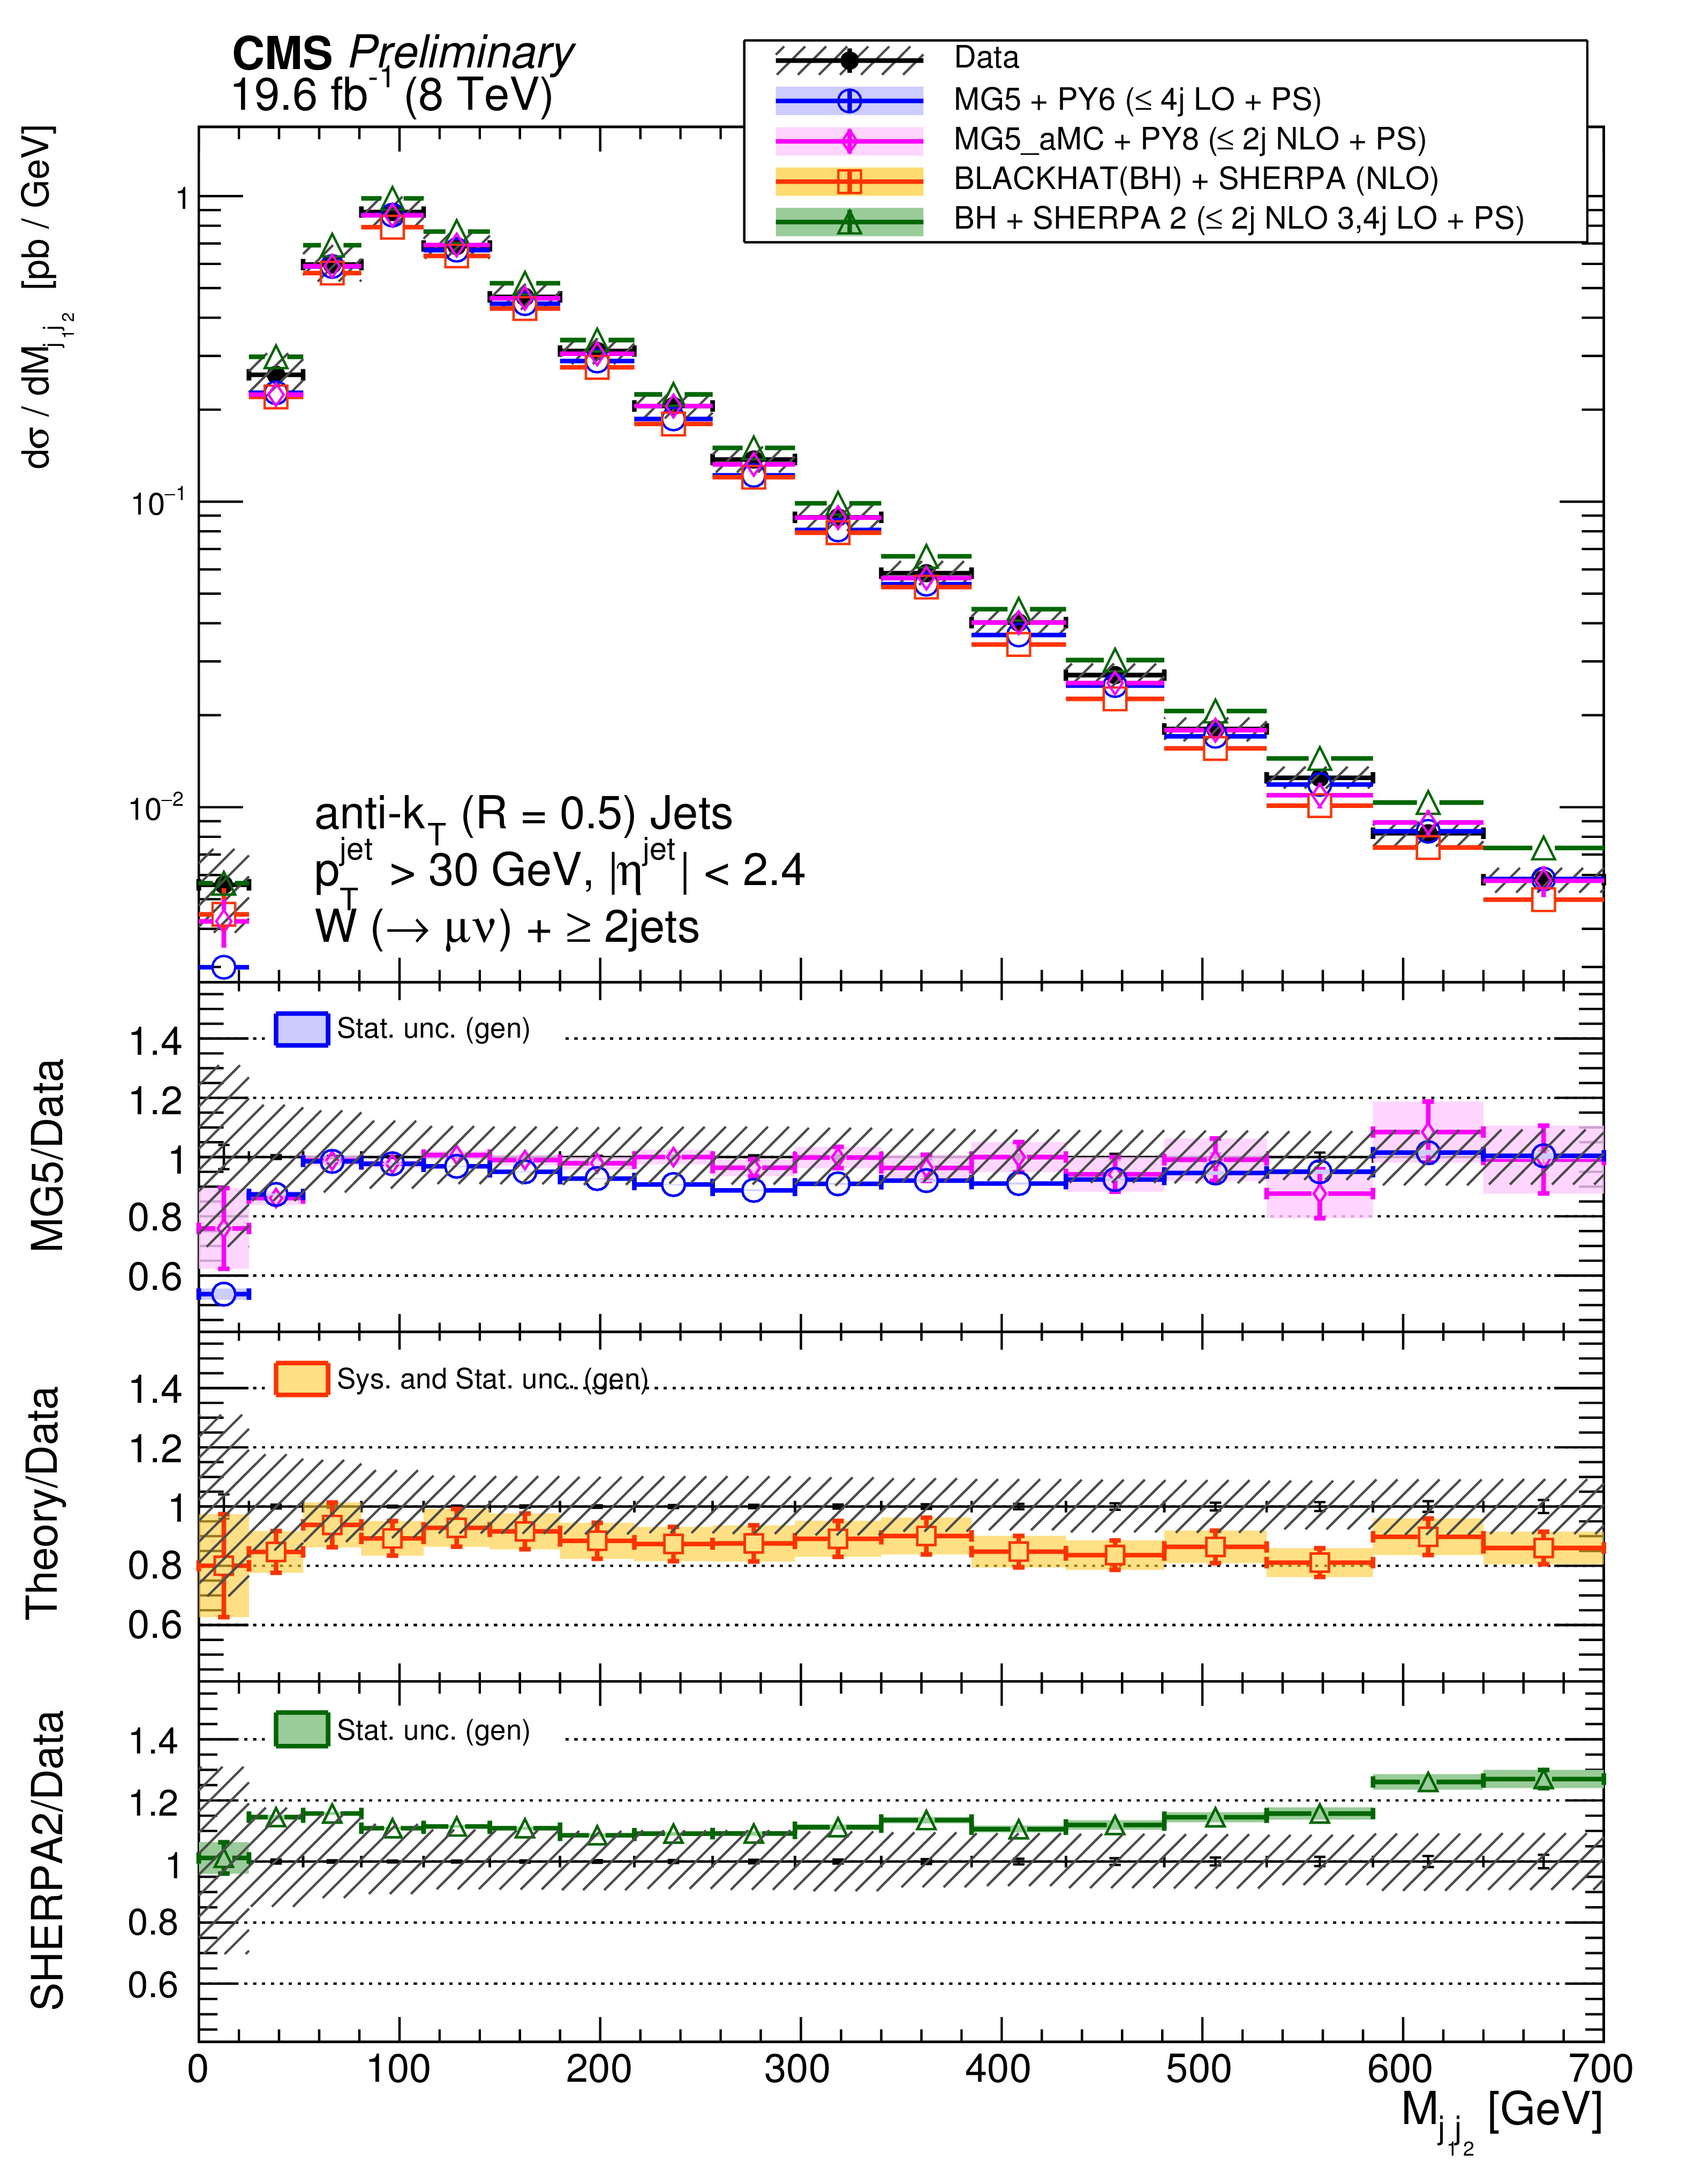
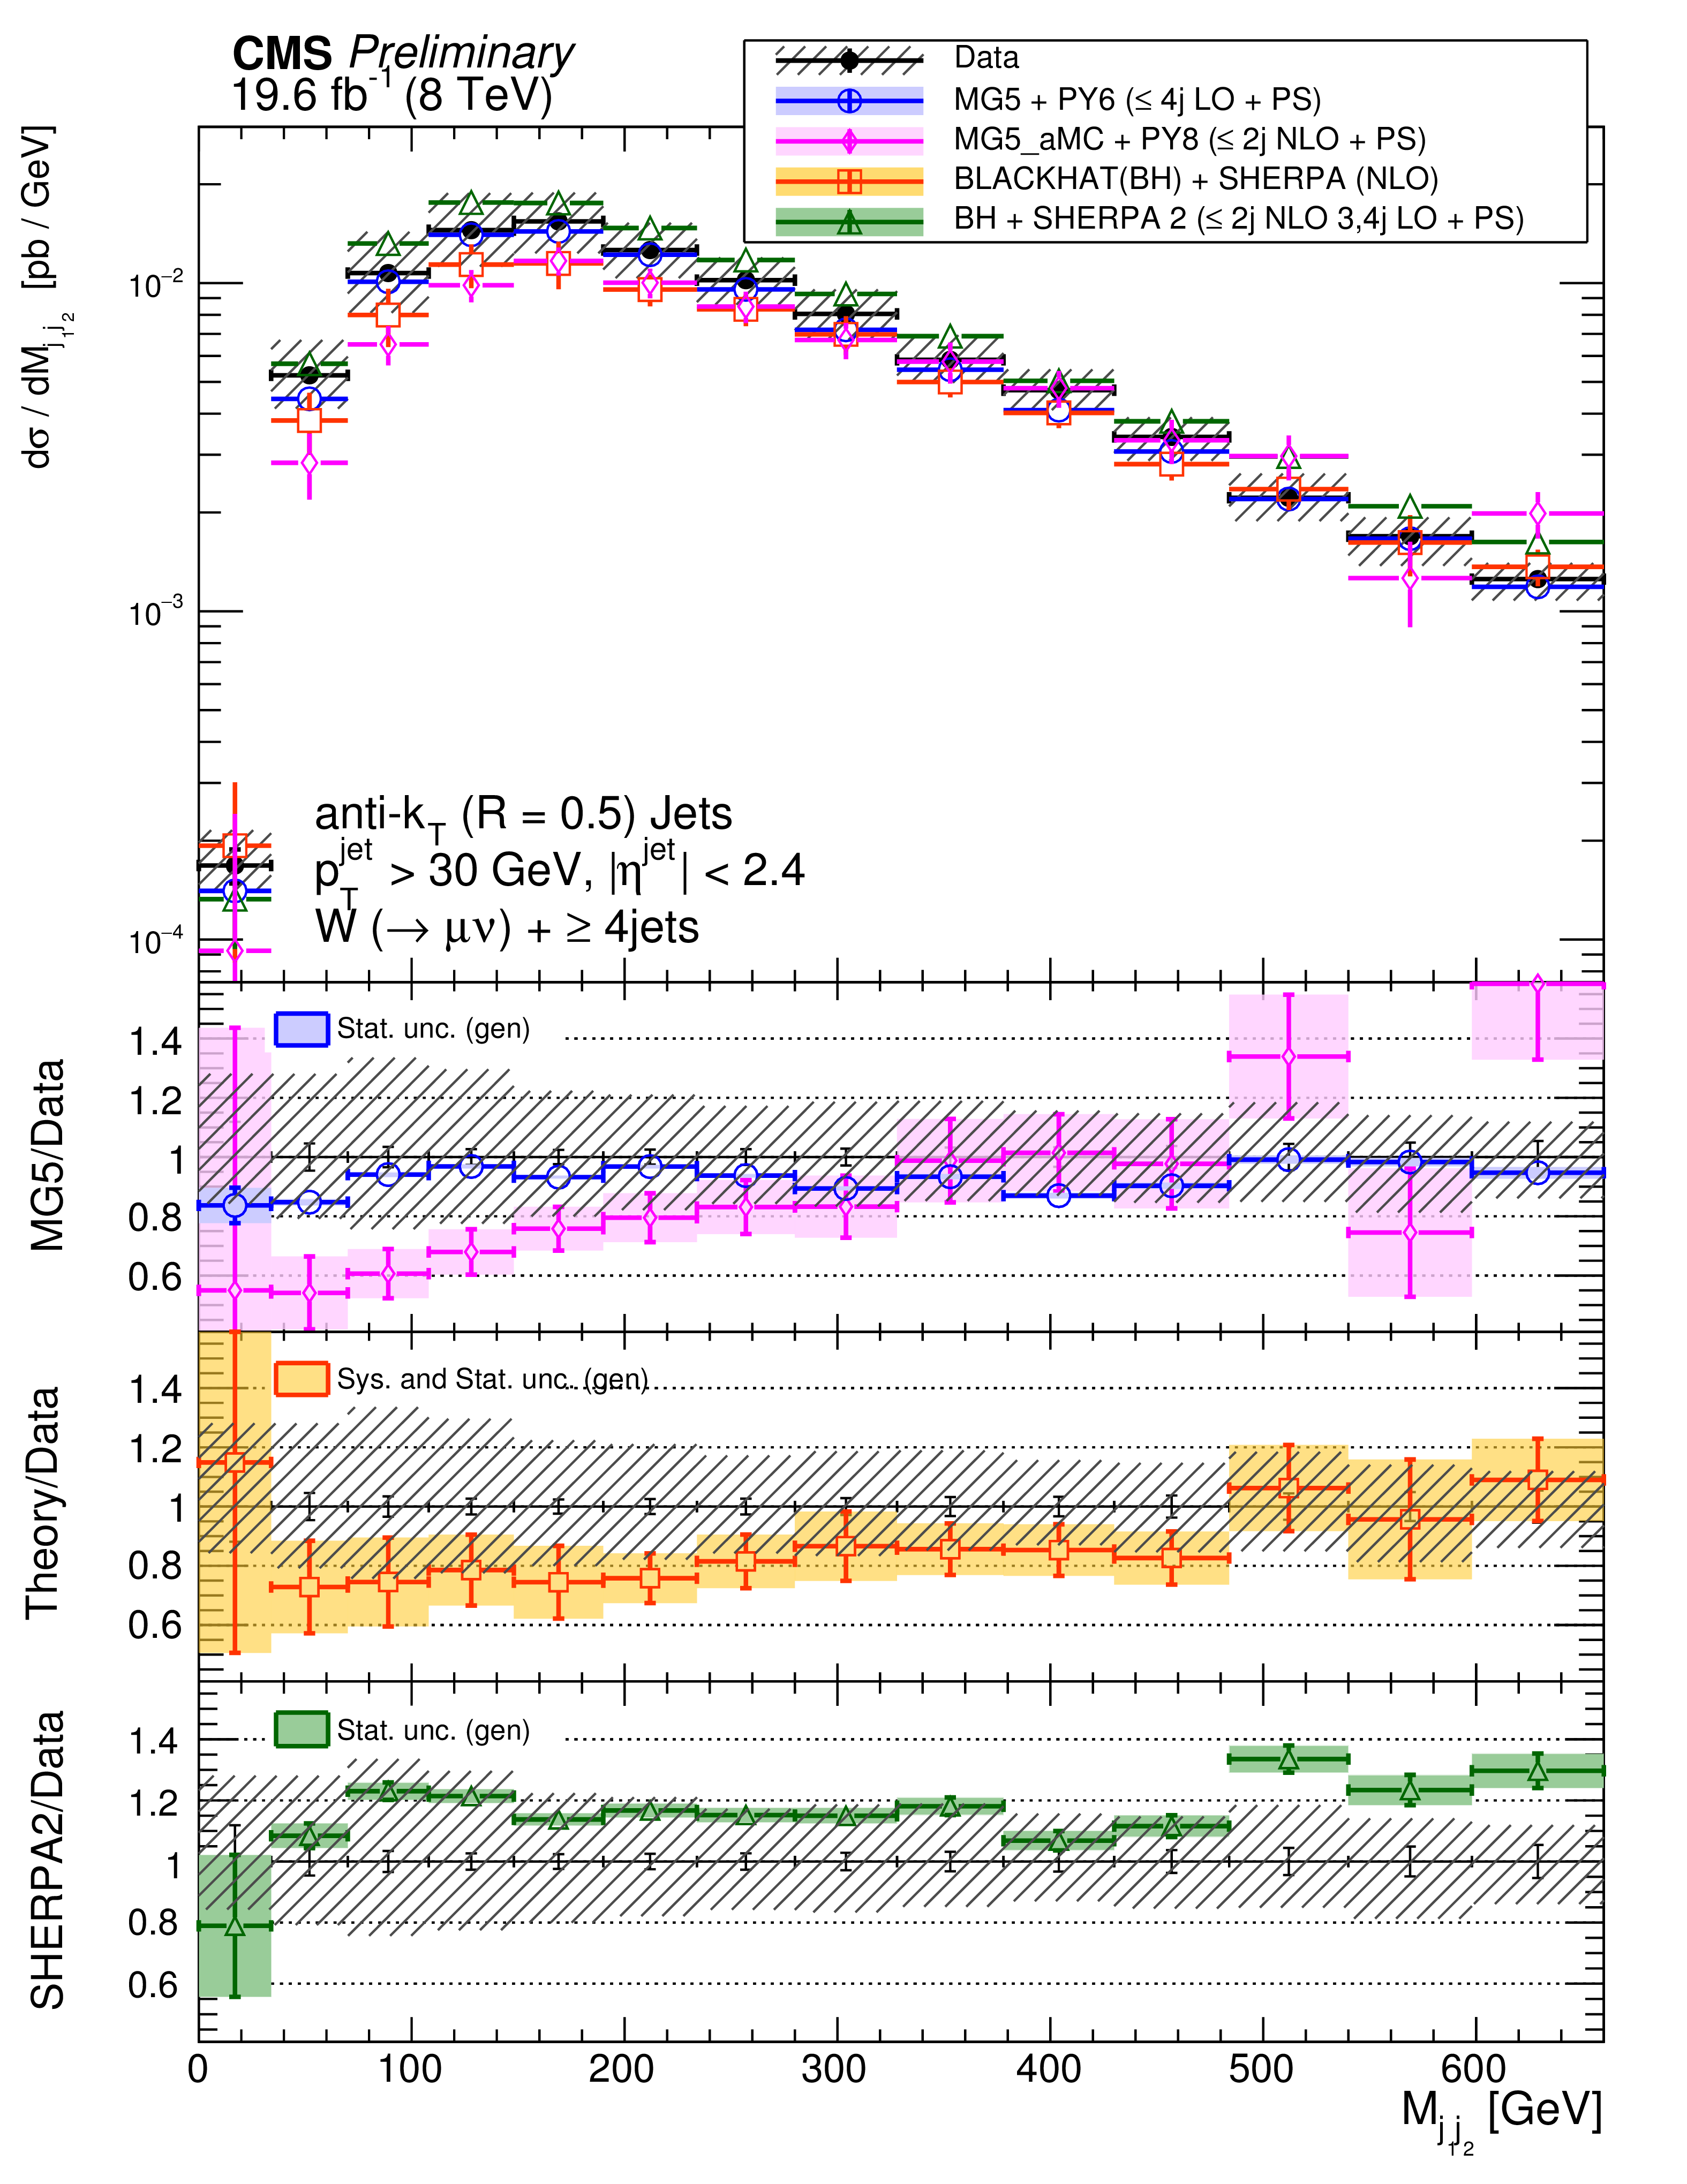
Figure 7-a:
The differential cross section measurement for the dijet invariant mass for inclusive jet multiplicities 2-4, compared to the prediction of MadGraph , MadGraph5$\_$aMC@NLO, SHERPA-2, and BLACKHAT+SHERPA (corrected for hadronization and multiple-parton interactions). Black circular markers with the grey hatched band represent the unfolded data measurement and its uncertainty. Overlaid are the predictions together with their statistical uncertainties (Theory stat.). The BLACKHAT+SHERPA uncertainty also contains theoretical systematic uncertainties (Theory syst.) described in Section 9. The lower plots show the ratio of each prediction to the unfolded data. |
png pdf |
Figure 7-b:
The differential cross section measurement for the dijet invariant mass for inclusive jet multiplicities 2-4, compared to the prediction of MadGraph , MadGraph5$\_$aMC@NLO, SHERPA-2, and BLACKHAT+SHERPA (corrected for hadronization and multiple-parton interactions). Black circular markers with the grey hatched band represent the unfolded data measurement and its uncertainty. Overlaid are the predictions together with their statistical uncertainties (Theory stat.). The BLACKHAT+SHERPA uncertainty also contains theoretical systematic uncertainties (Theory syst.) described in Section 9. The lower plots show the ratio of each prediction to the unfolded data. |
png pdf |
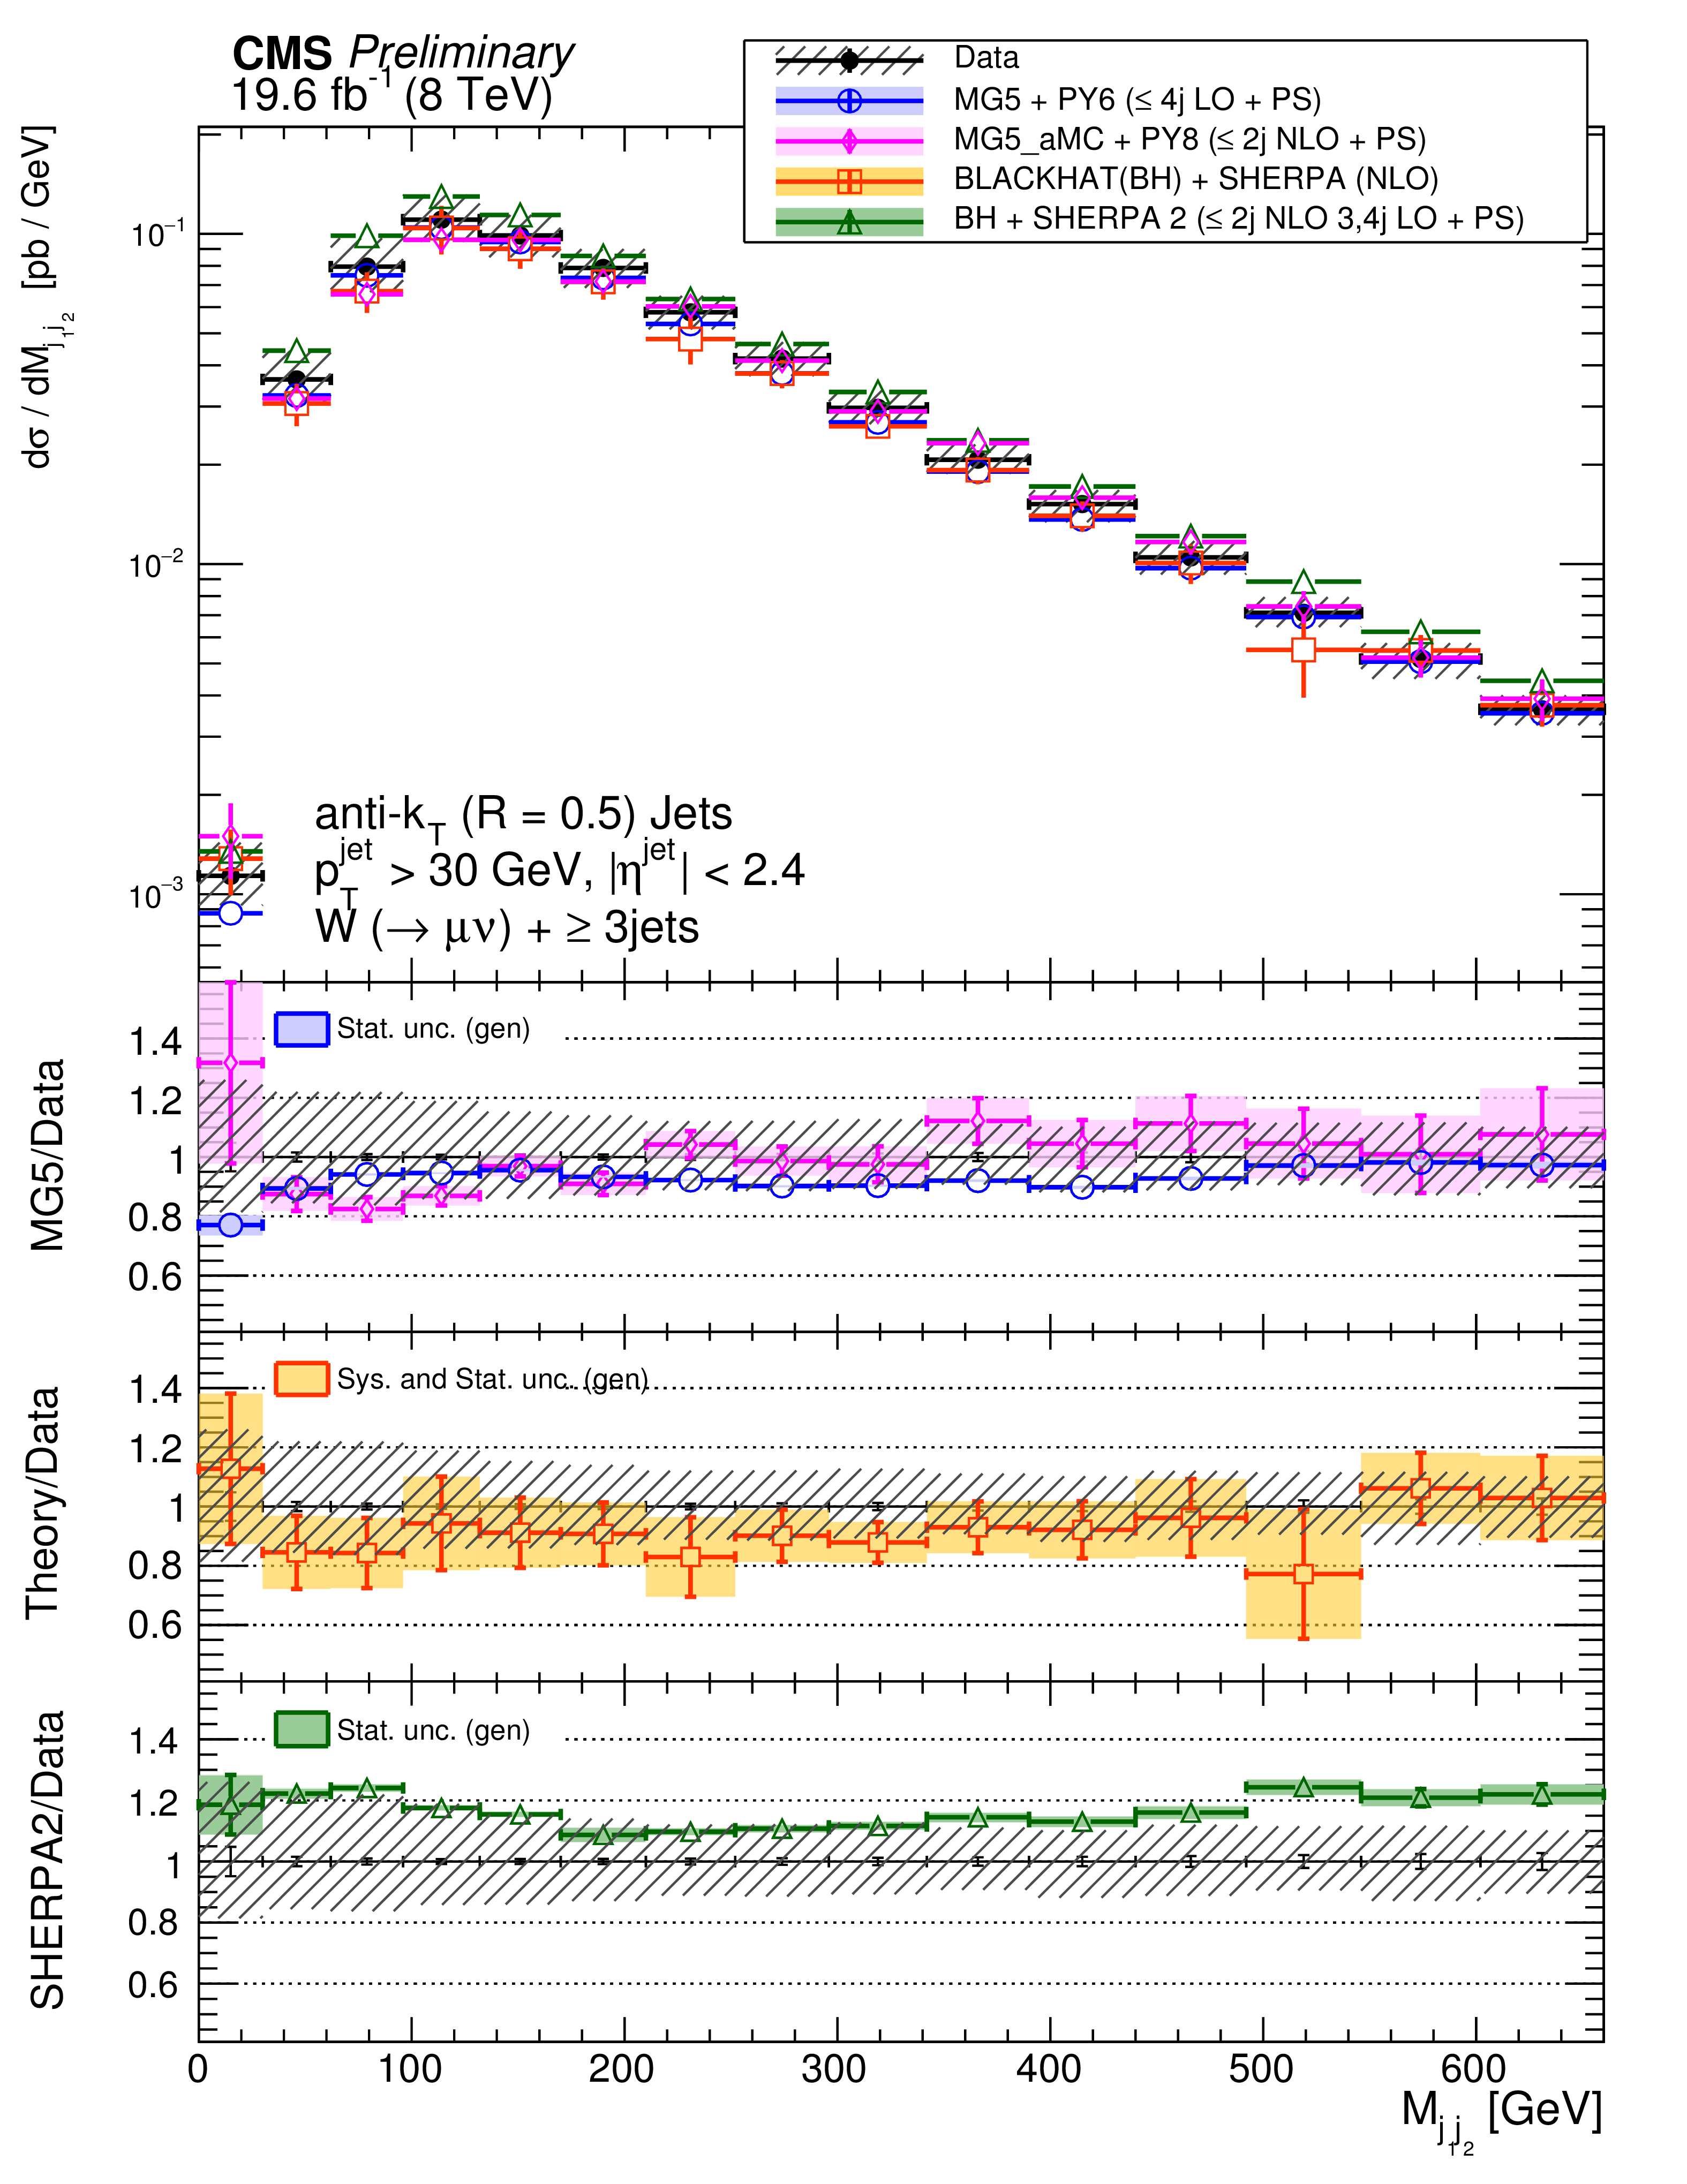
Figure 7-c:
The differential cross section measurement for the dijet invariant mass for inclusive jet multiplicities 2-4, compared to the prediction of MadGraph , MadGraph5$\_$aMC@NLO, SHERPA-2, and BLACKHAT+SHERPA (corrected for hadronization and multiple-parton interactions). Black circular markers with the grey hatched band represent the unfolded data measurement and its uncertainty. Overlaid are the predictions together with their statistical uncertainties (Theory stat.). The BLACKHAT+SHERPA uncertainty also contains theoretical systematic uncertainties (Theory syst.) described in Section 9. The lower plots show the ratio of each prediction to the unfolded data. |
png pdf |
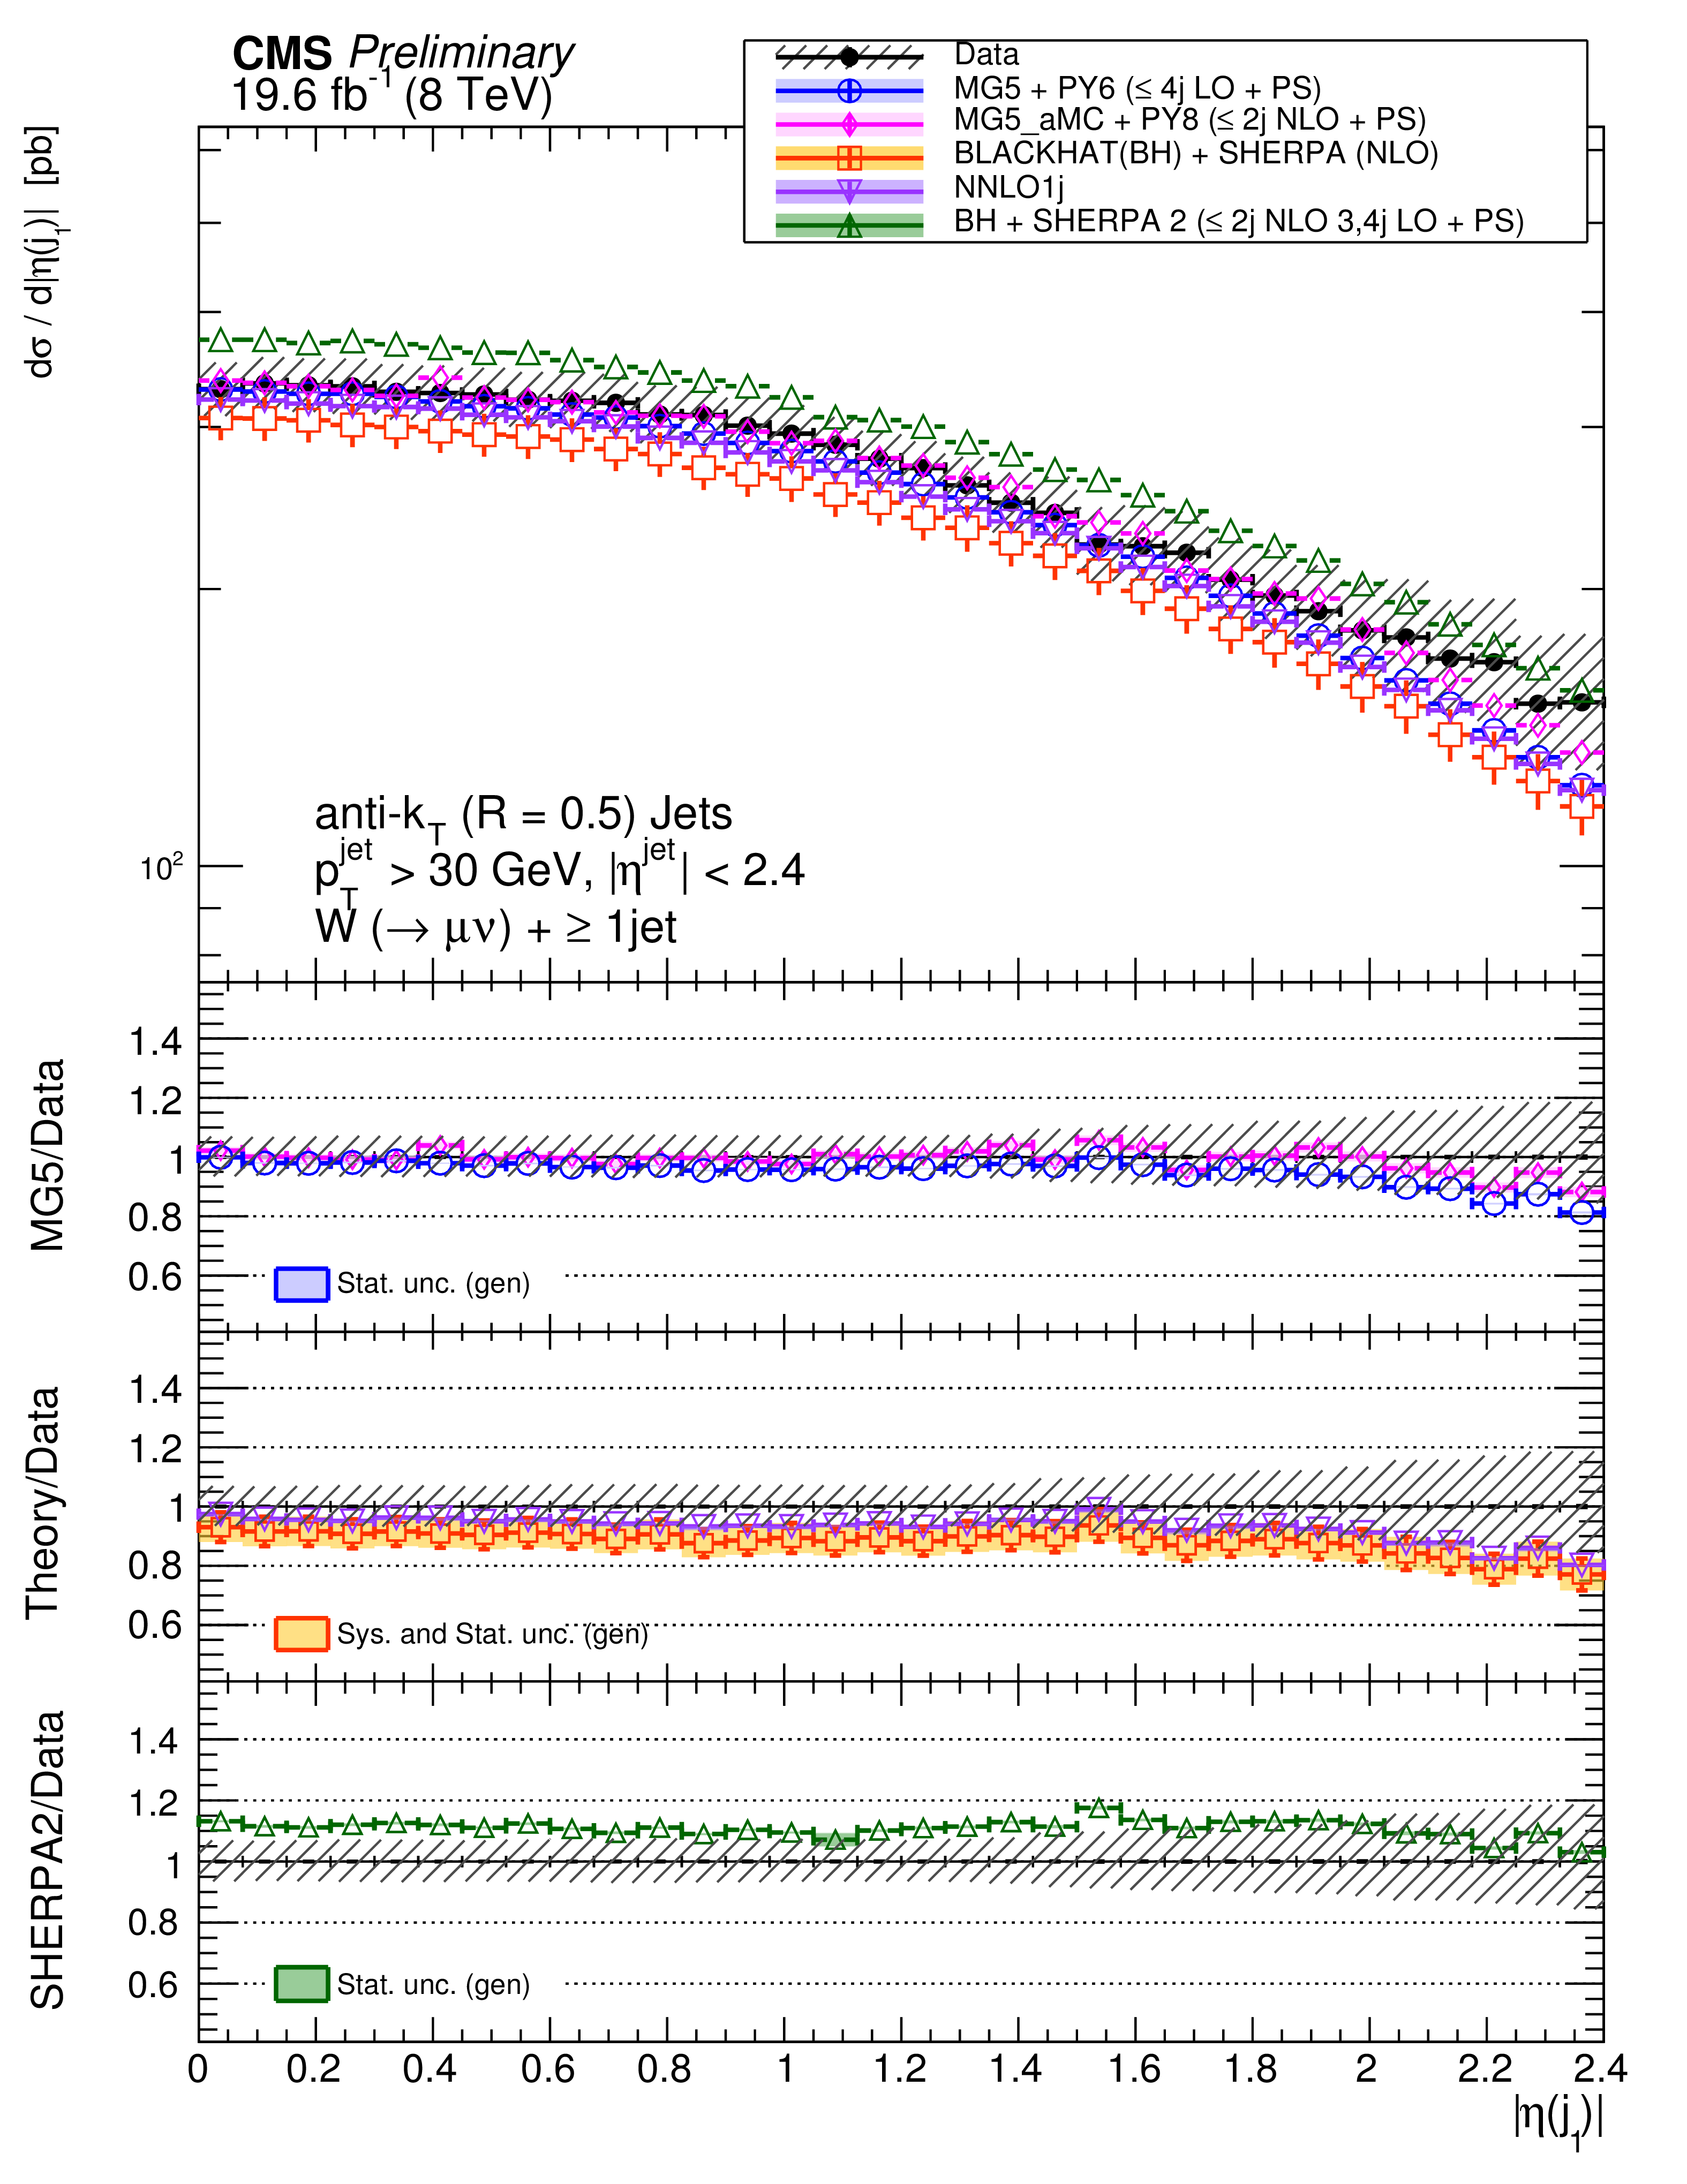
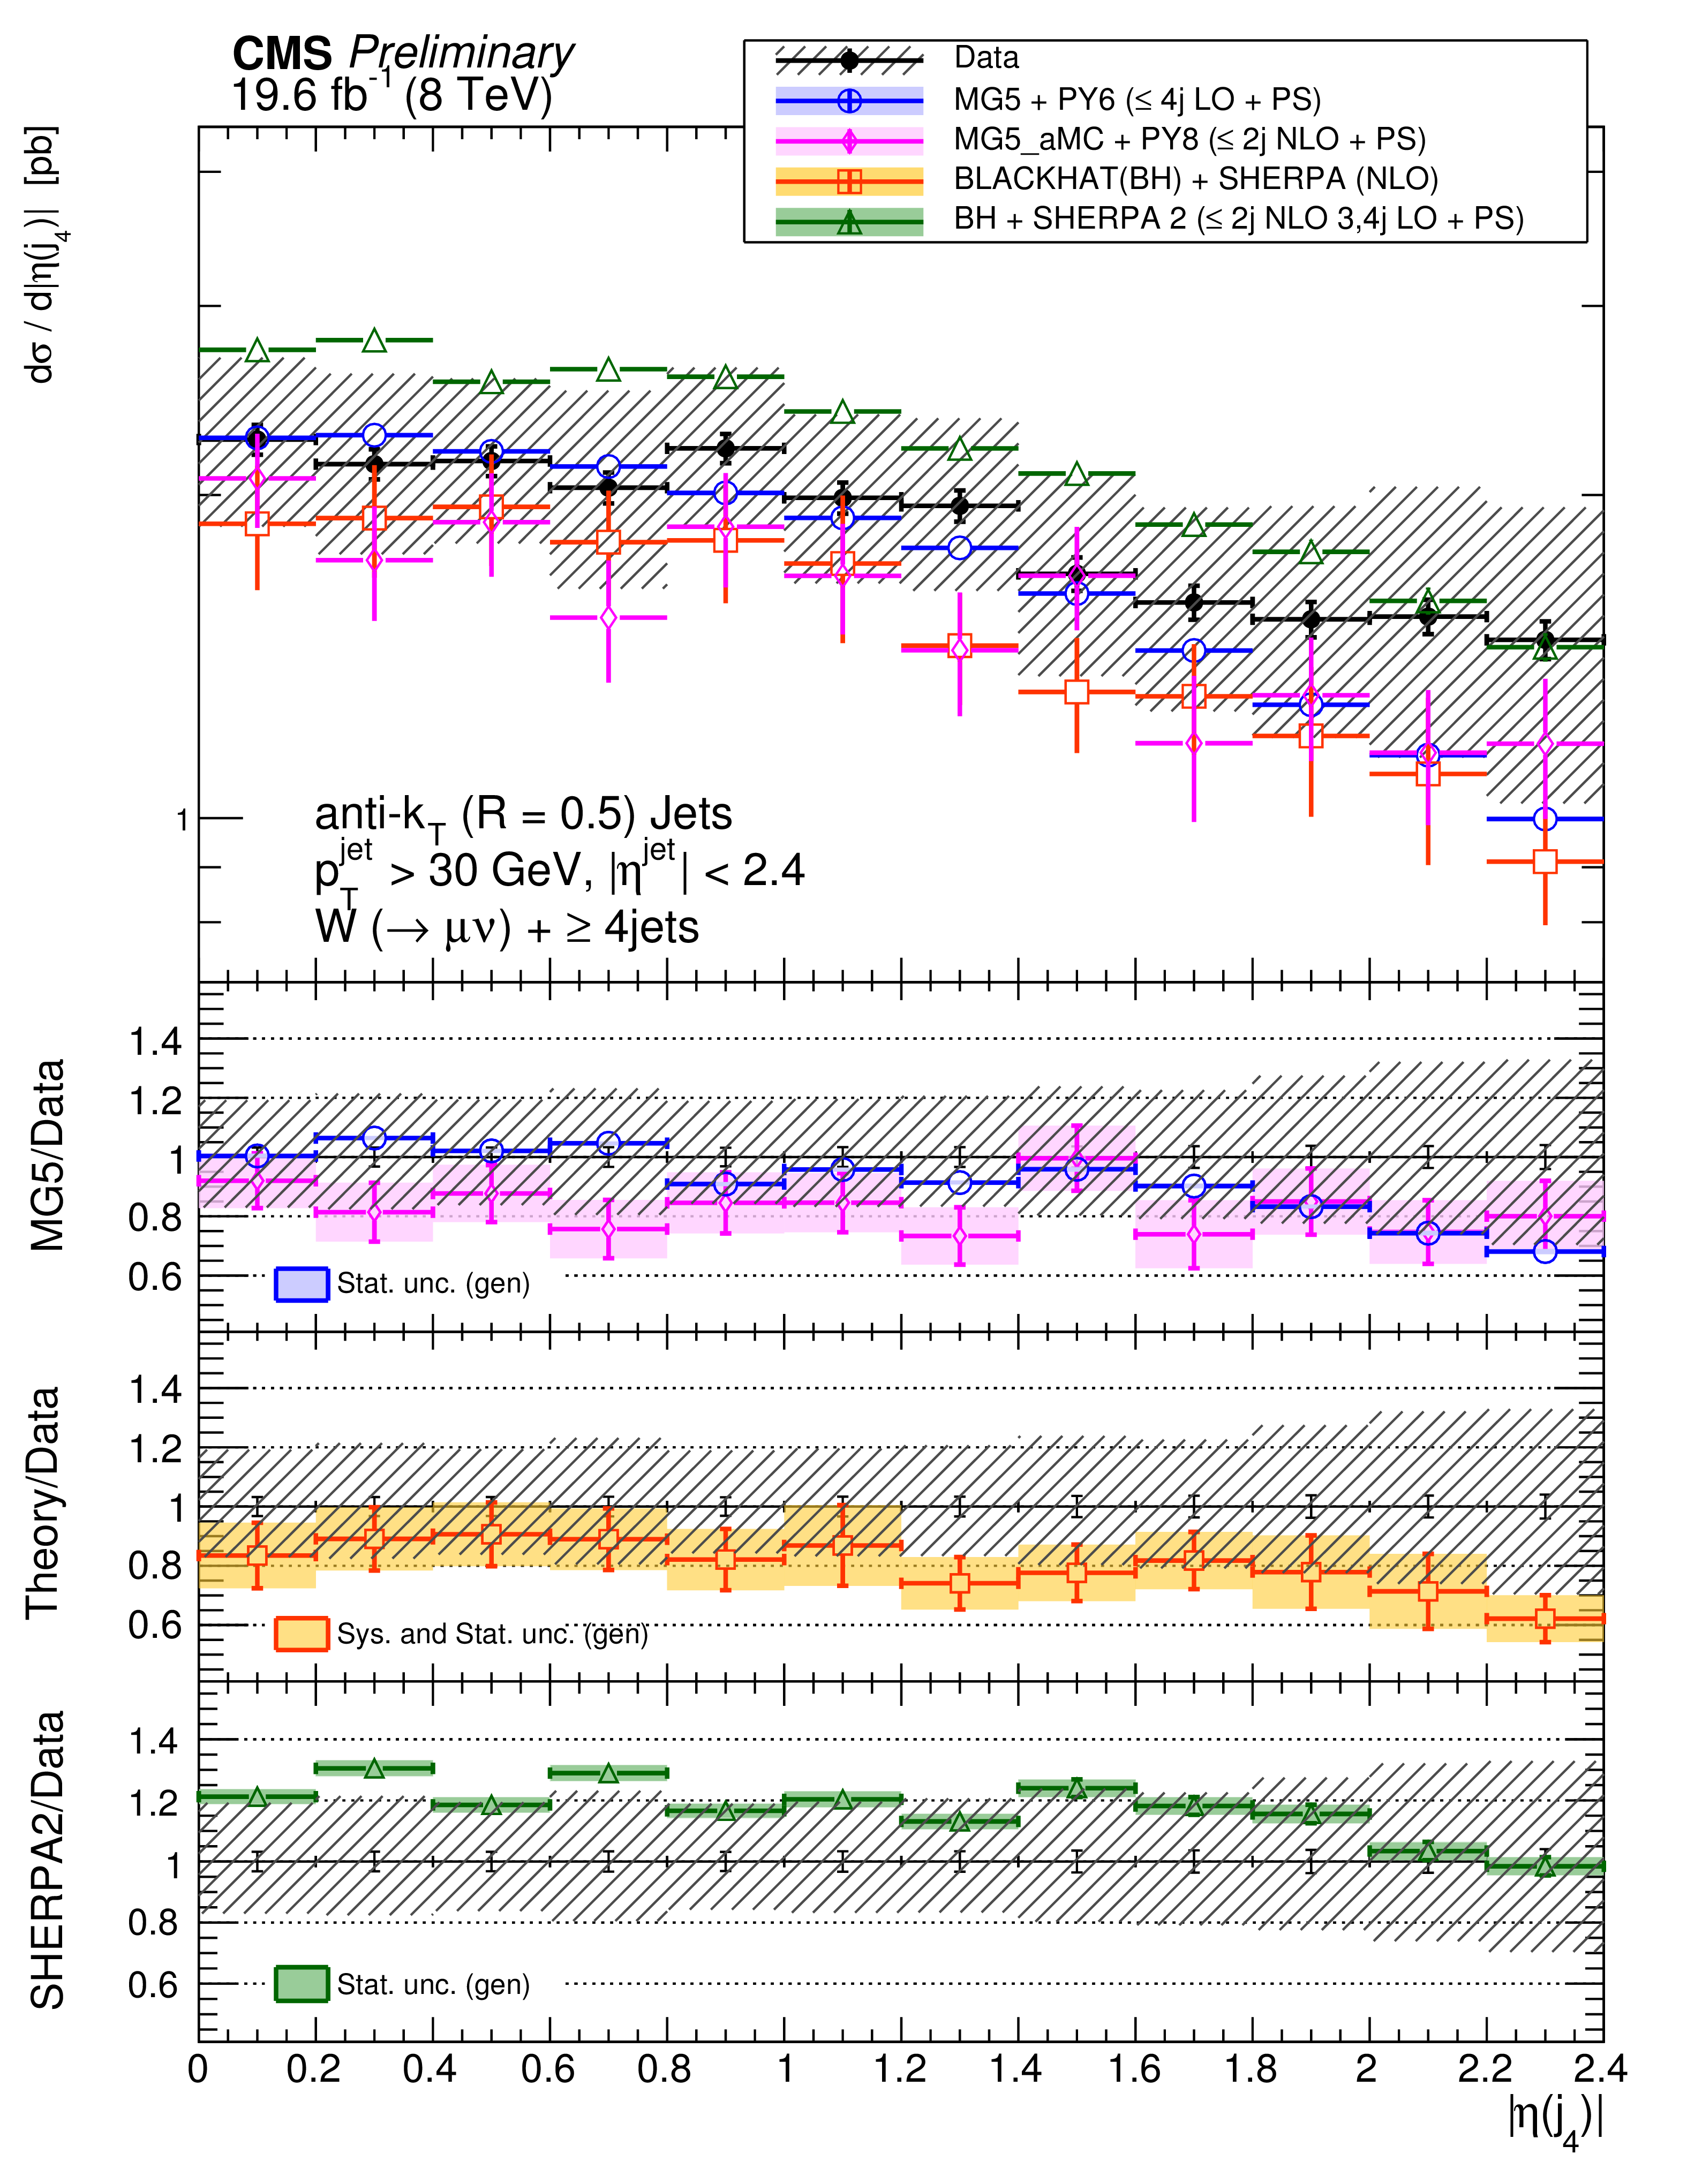
Figure 8-a:
The differential cross section measurement for the leading four jets' pseudorapidity, compared to the prediction of MadGraph , MadGraph5$\_$aMC@NLO, SHERPA-2, BLACKHAT+SHERPA , and NNLO inclusive 1 jet production (indicated as NNLO1j). BLACKHAT+SHERPA and NNLO1j are corrected for hadronisation and multiple-parton interactions effects. Black circular markers with the grey hatched band represent the unfolded data measurement and its uncertainty. Overlaid are the predictions together with their statistical uncertainties (Theory stat.). The BLACKHAT+SHERPA and the NNLO1j uncertainties also contain theoretical systematic uncertainties (Theory syst.) described in Section 9. The lower plots show the ratio of each prediction to the unfolded data. |
png pdf |
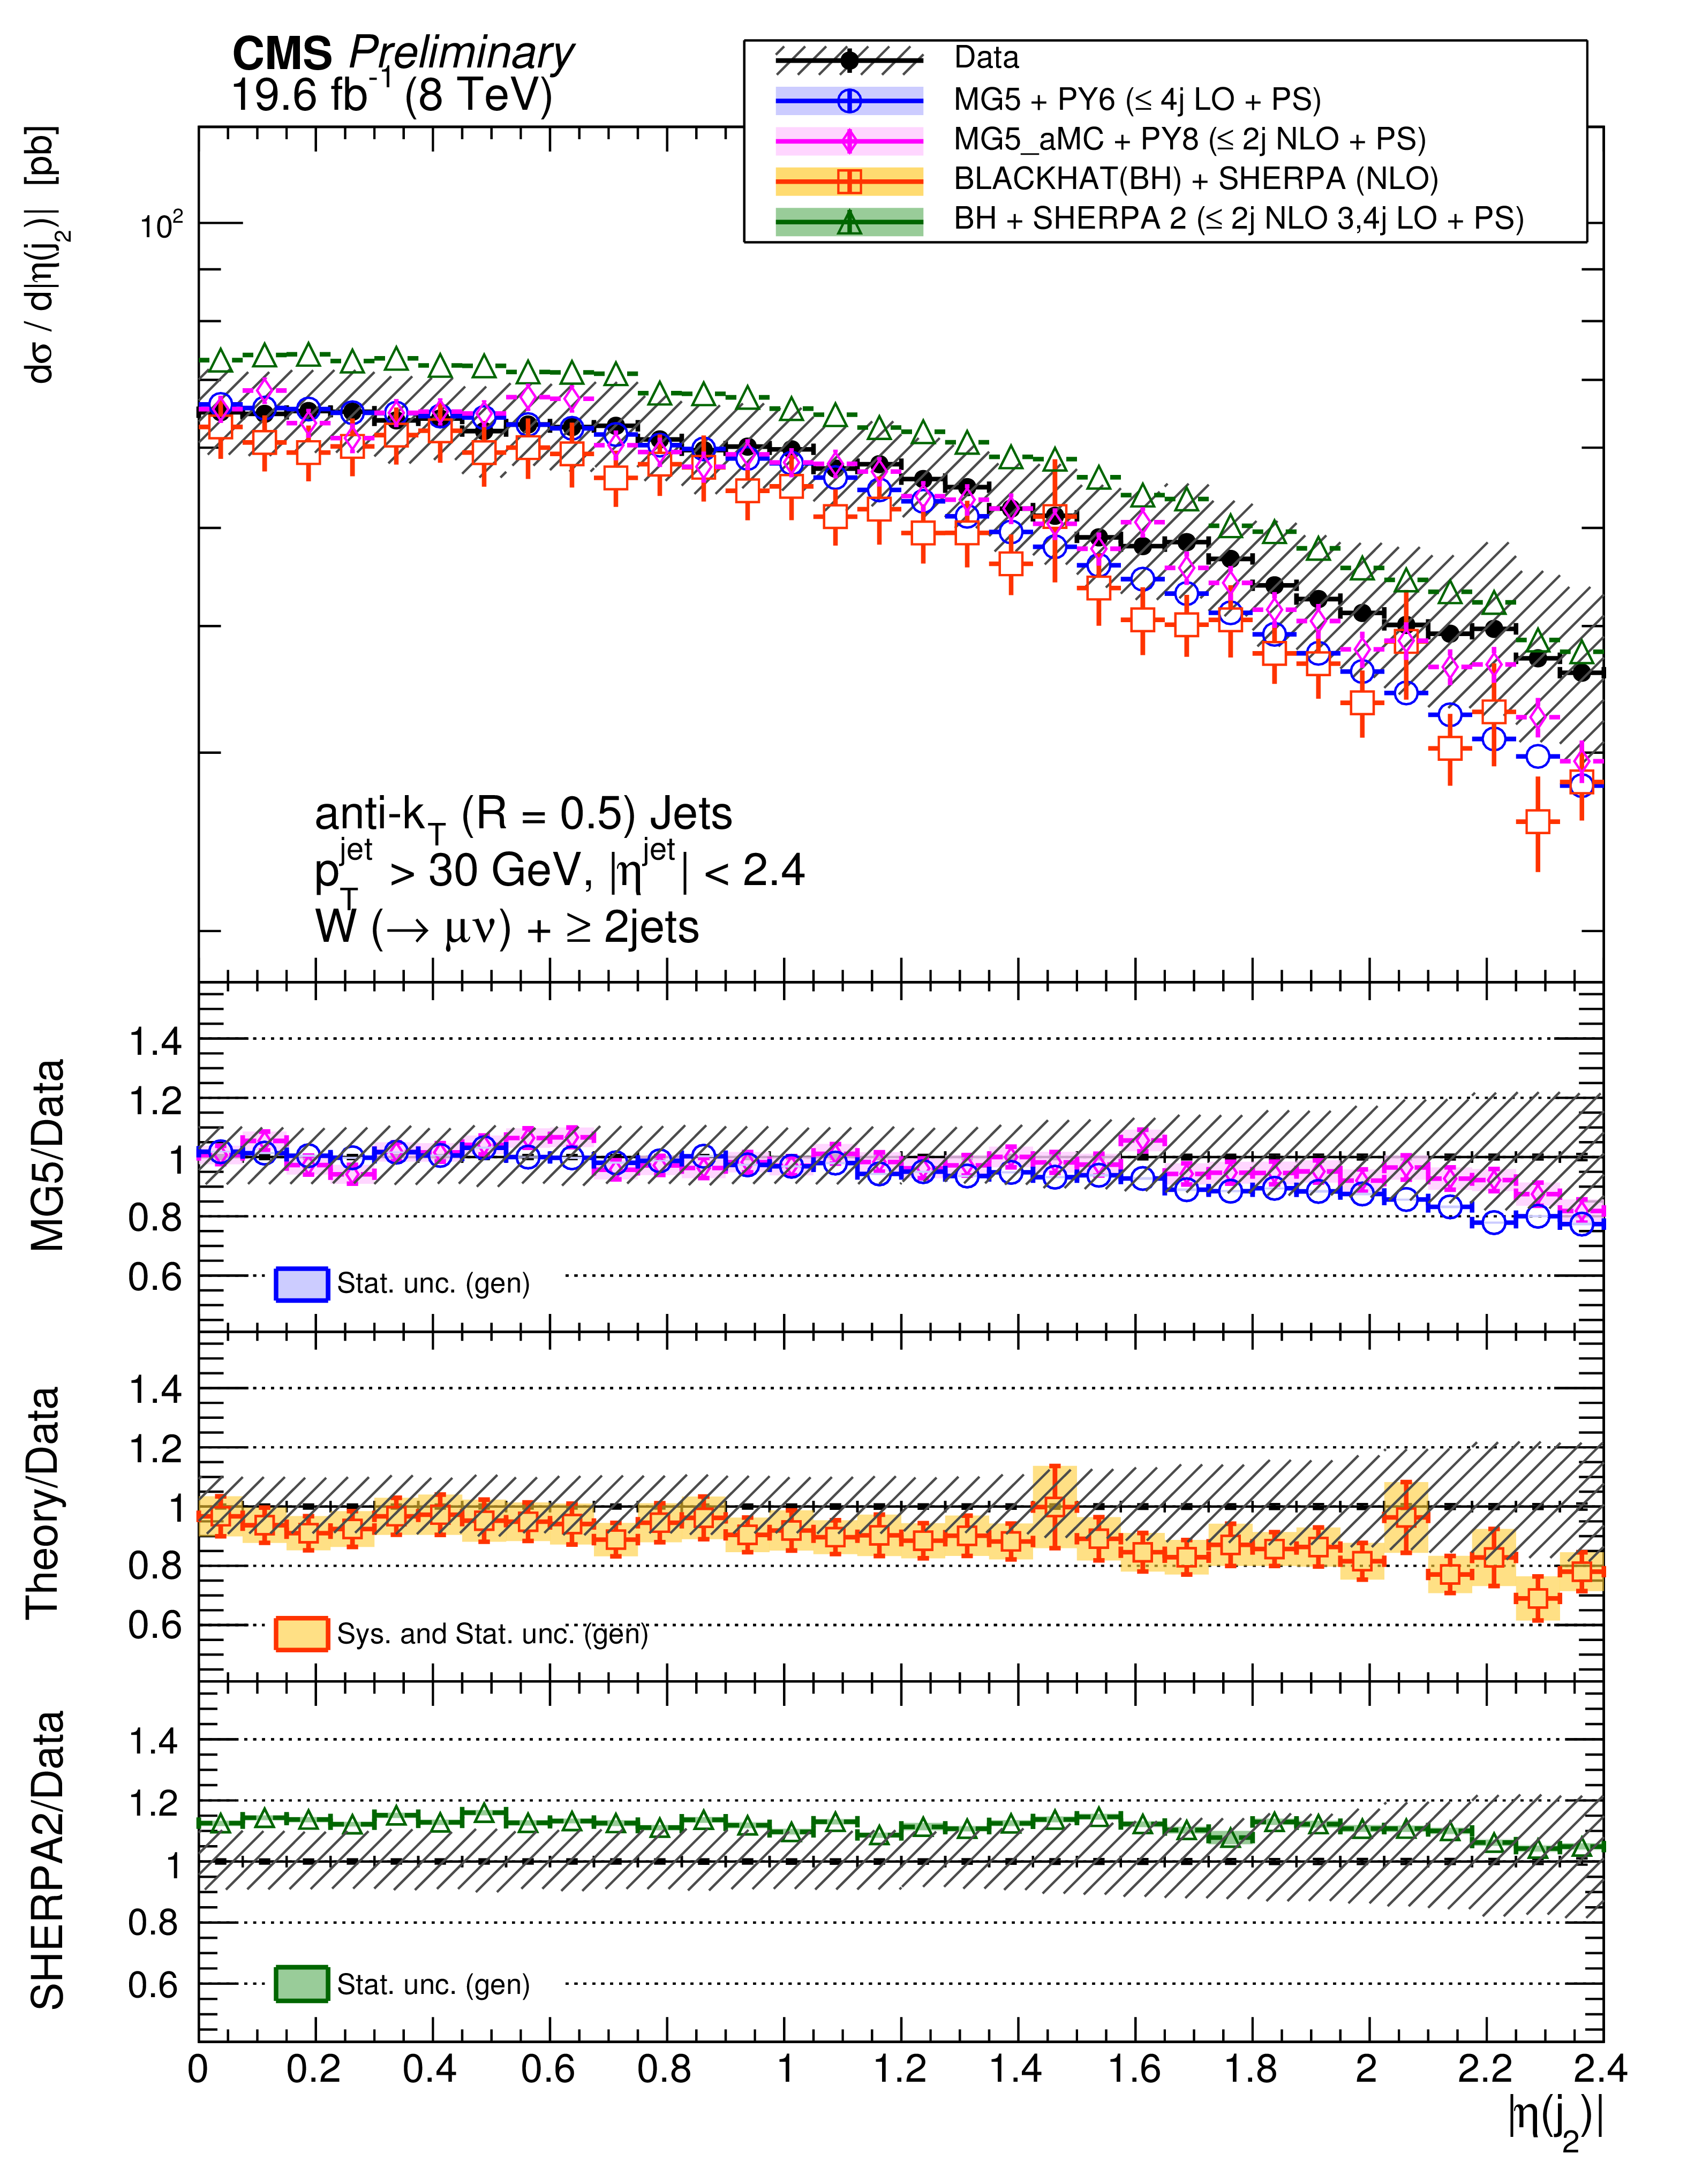
Figure 8-b:
The differential cross section measurement for the leading four jets' pseudorapidity, compared to the prediction of MadGraph , MadGraph5$\_$aMC@NLO, SHERPA-2, BLACKHAT+SHERPA , and NNLO inclusive 1 jet production (indicated as NNLO1j). BLACKHAT+SHERPA and NNLO1j are corrected for hadronisation and multiple-parton interactions effects. Black circular markers with the grey hatched band represent the unfolded data measurement and its uncertainty. Overlaid are the predictions together with their statistical uncertainties (Theory stat.). The BLACKHAT+SHERPA and the NNLO1j uncertainties also contain theoretical systematic uncertainties (Theory syst.) described in Section 9. The lower plots show the ratio of each prediction to the unfolded data. |
png pdf |
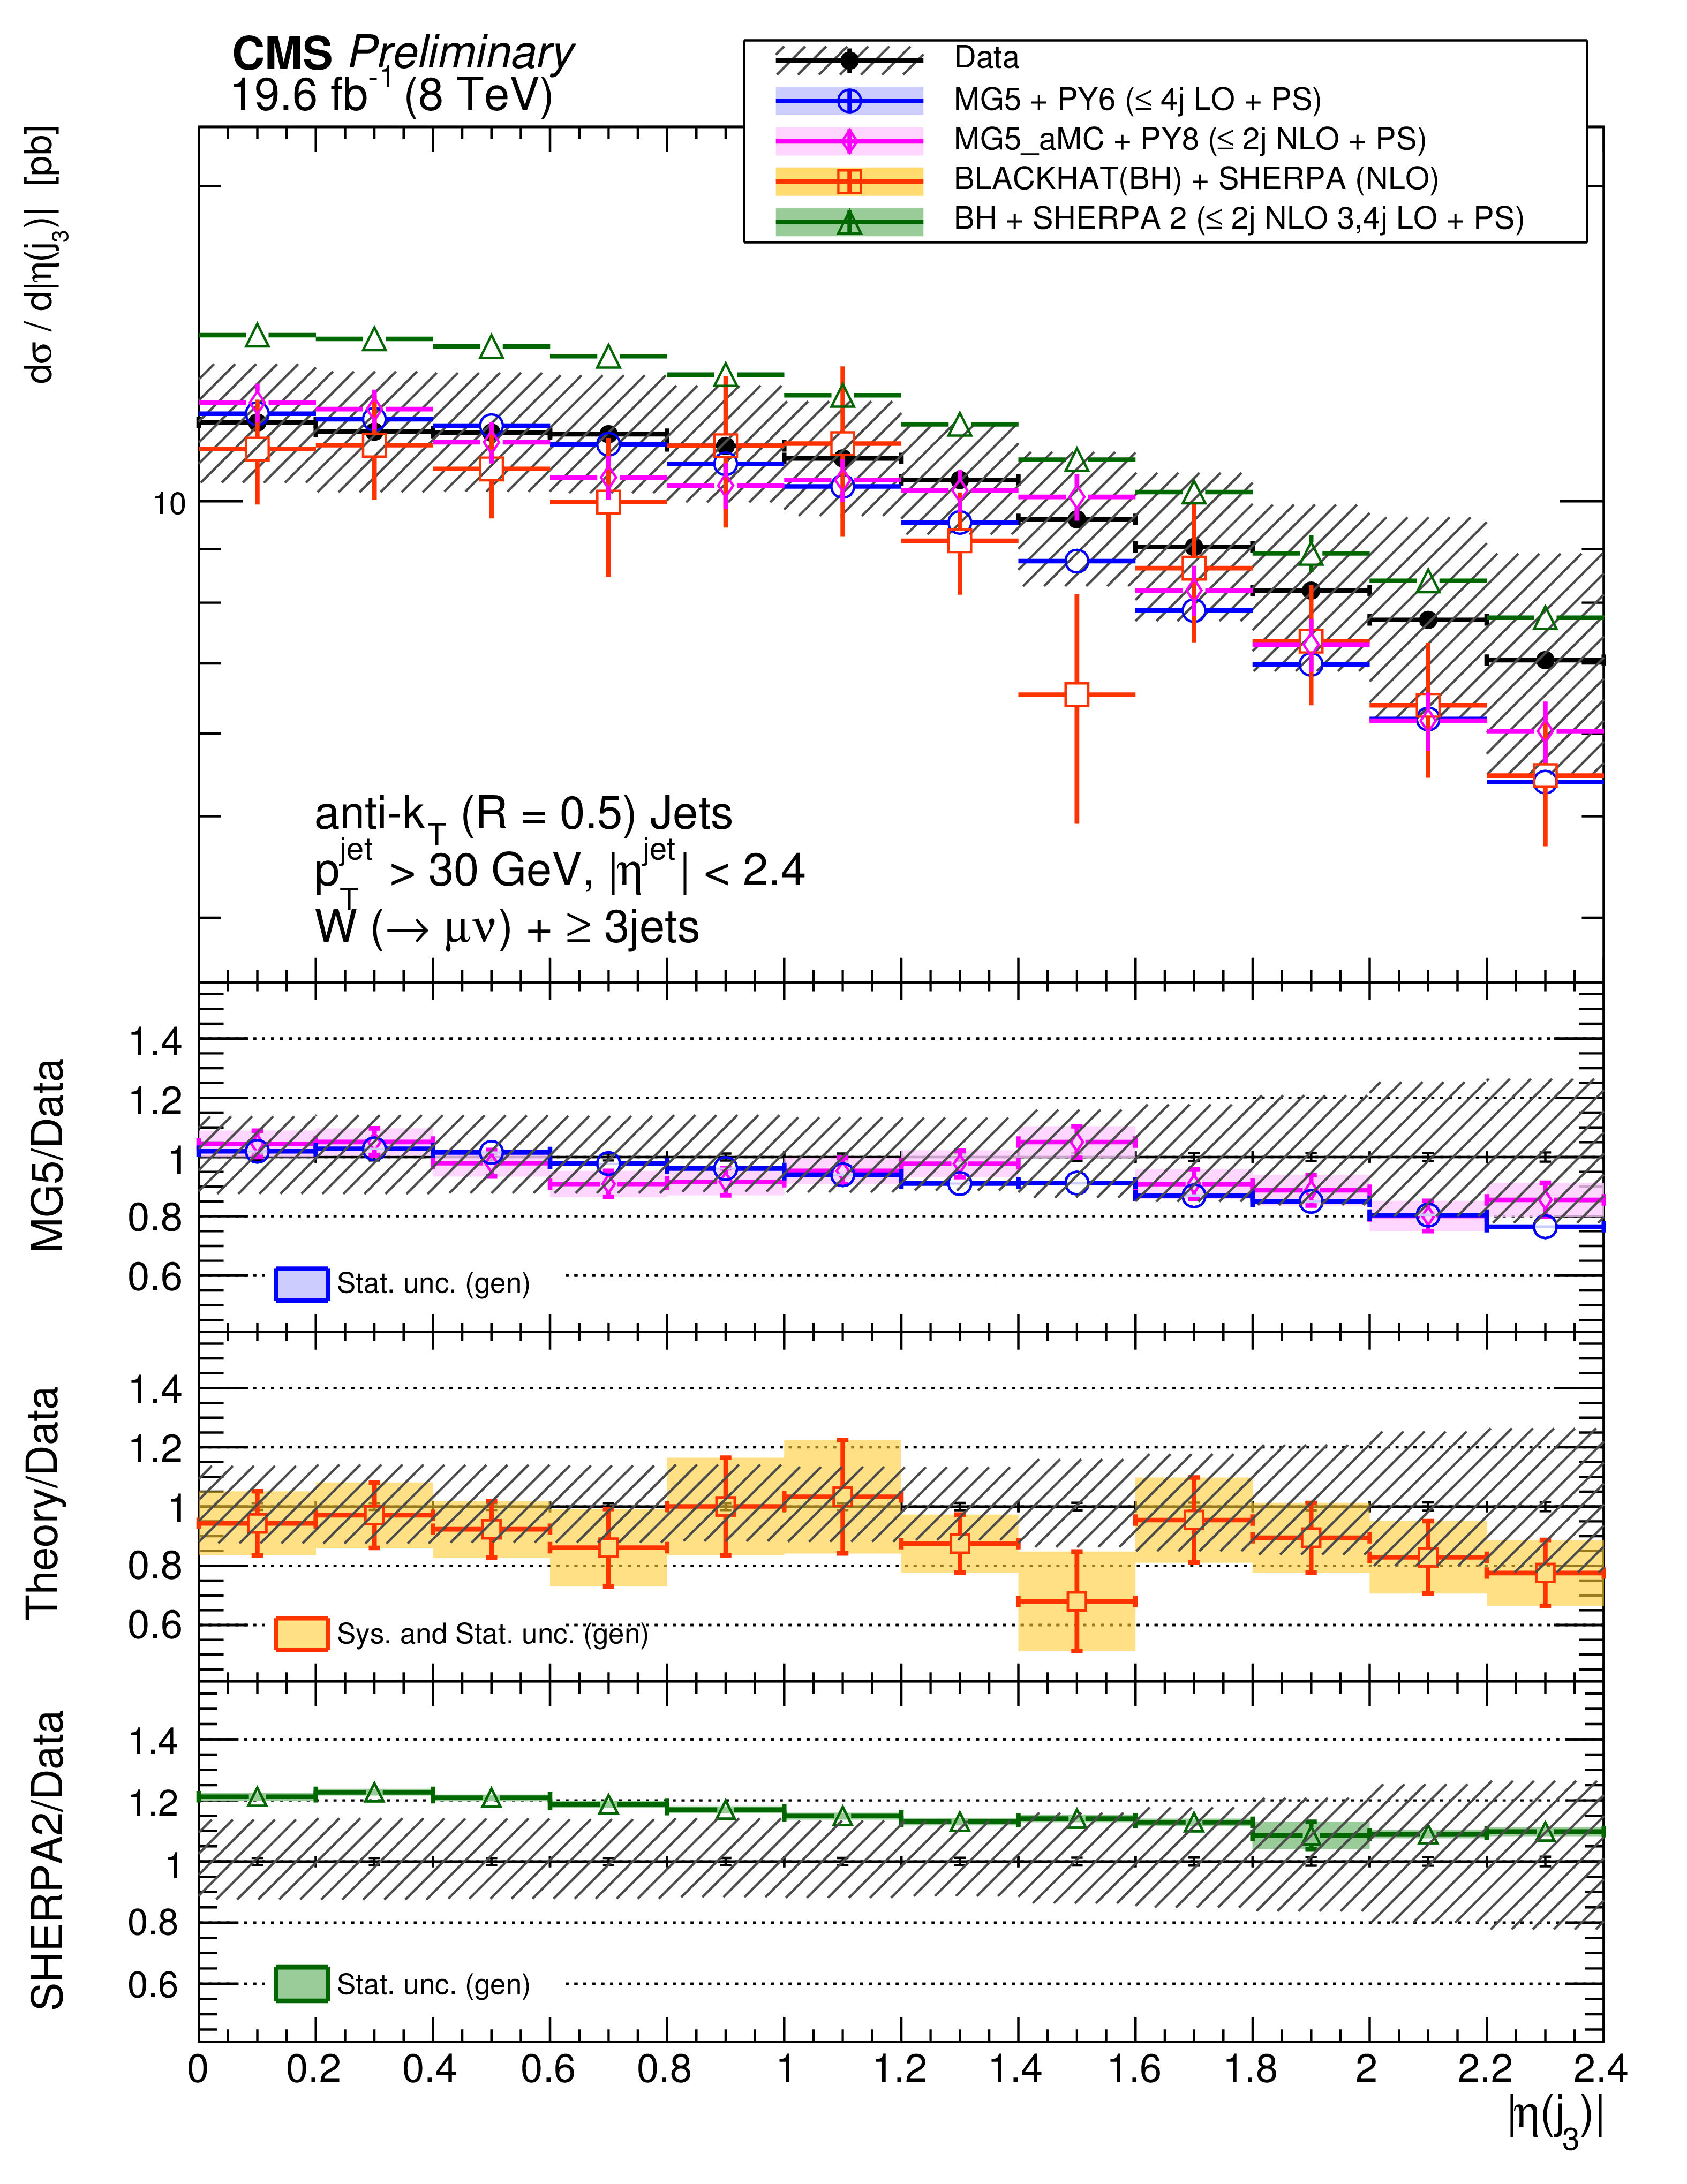
Figure 8-c:
The differential cross section measurement for the leading four jets' pseudorapidity, compared to the prediction of MadGraph , MadGraph5$\_$aMC@NLO, SHERPA-2, BLACKHAT+SHERPA , and NNLO inclusive 1 jet production (indicated as NNLO1j). BLACKHAT+SHERPA and NNLO1j are corrected for hadronisation and multiple-parton interactions effects. Black circular markers with the grey hatched band represent the unfolded data measurement and its uncertainty. Overlaid are the predictions together with their statistical uncertainties (Theory stat.). The BLACKHAT+SHERPA and the NNLO1j uncertainties also contain theoretical systematic uncertainties (Theory syst.) described in Section 9. The lower plots show the ratio of each prediction to the unfolded data. |
png pdf |
Figure 8-d:
The differential cross section measurement for the leading four jets' pseudorapidity, compared to the prediction of MadGraph , MadGraph5$\_$aMC@NLO, SHERPA-2, BLACKHAT+SHERPA , and NNLO inclusive 1 jet production (indicated as NNLO1j). BLACKHAT+SHERPA and NNLO1j are corrected for hadronisation and multiple-parton interactions effects. Black circular markers with the grey hatched band represent the unfolded data measurement and its uncertainty. Overlaid are the predictions together with their statistical uncertainties (Theory stat.). The BLACKHAT+SHERPA and the NNLO1j uncertainties also contain theoretical systematic uncertainties (Theory syst.) described in Section 9. The lower plots show the ratio of each prediction to the unfolded data. |
png pdf |
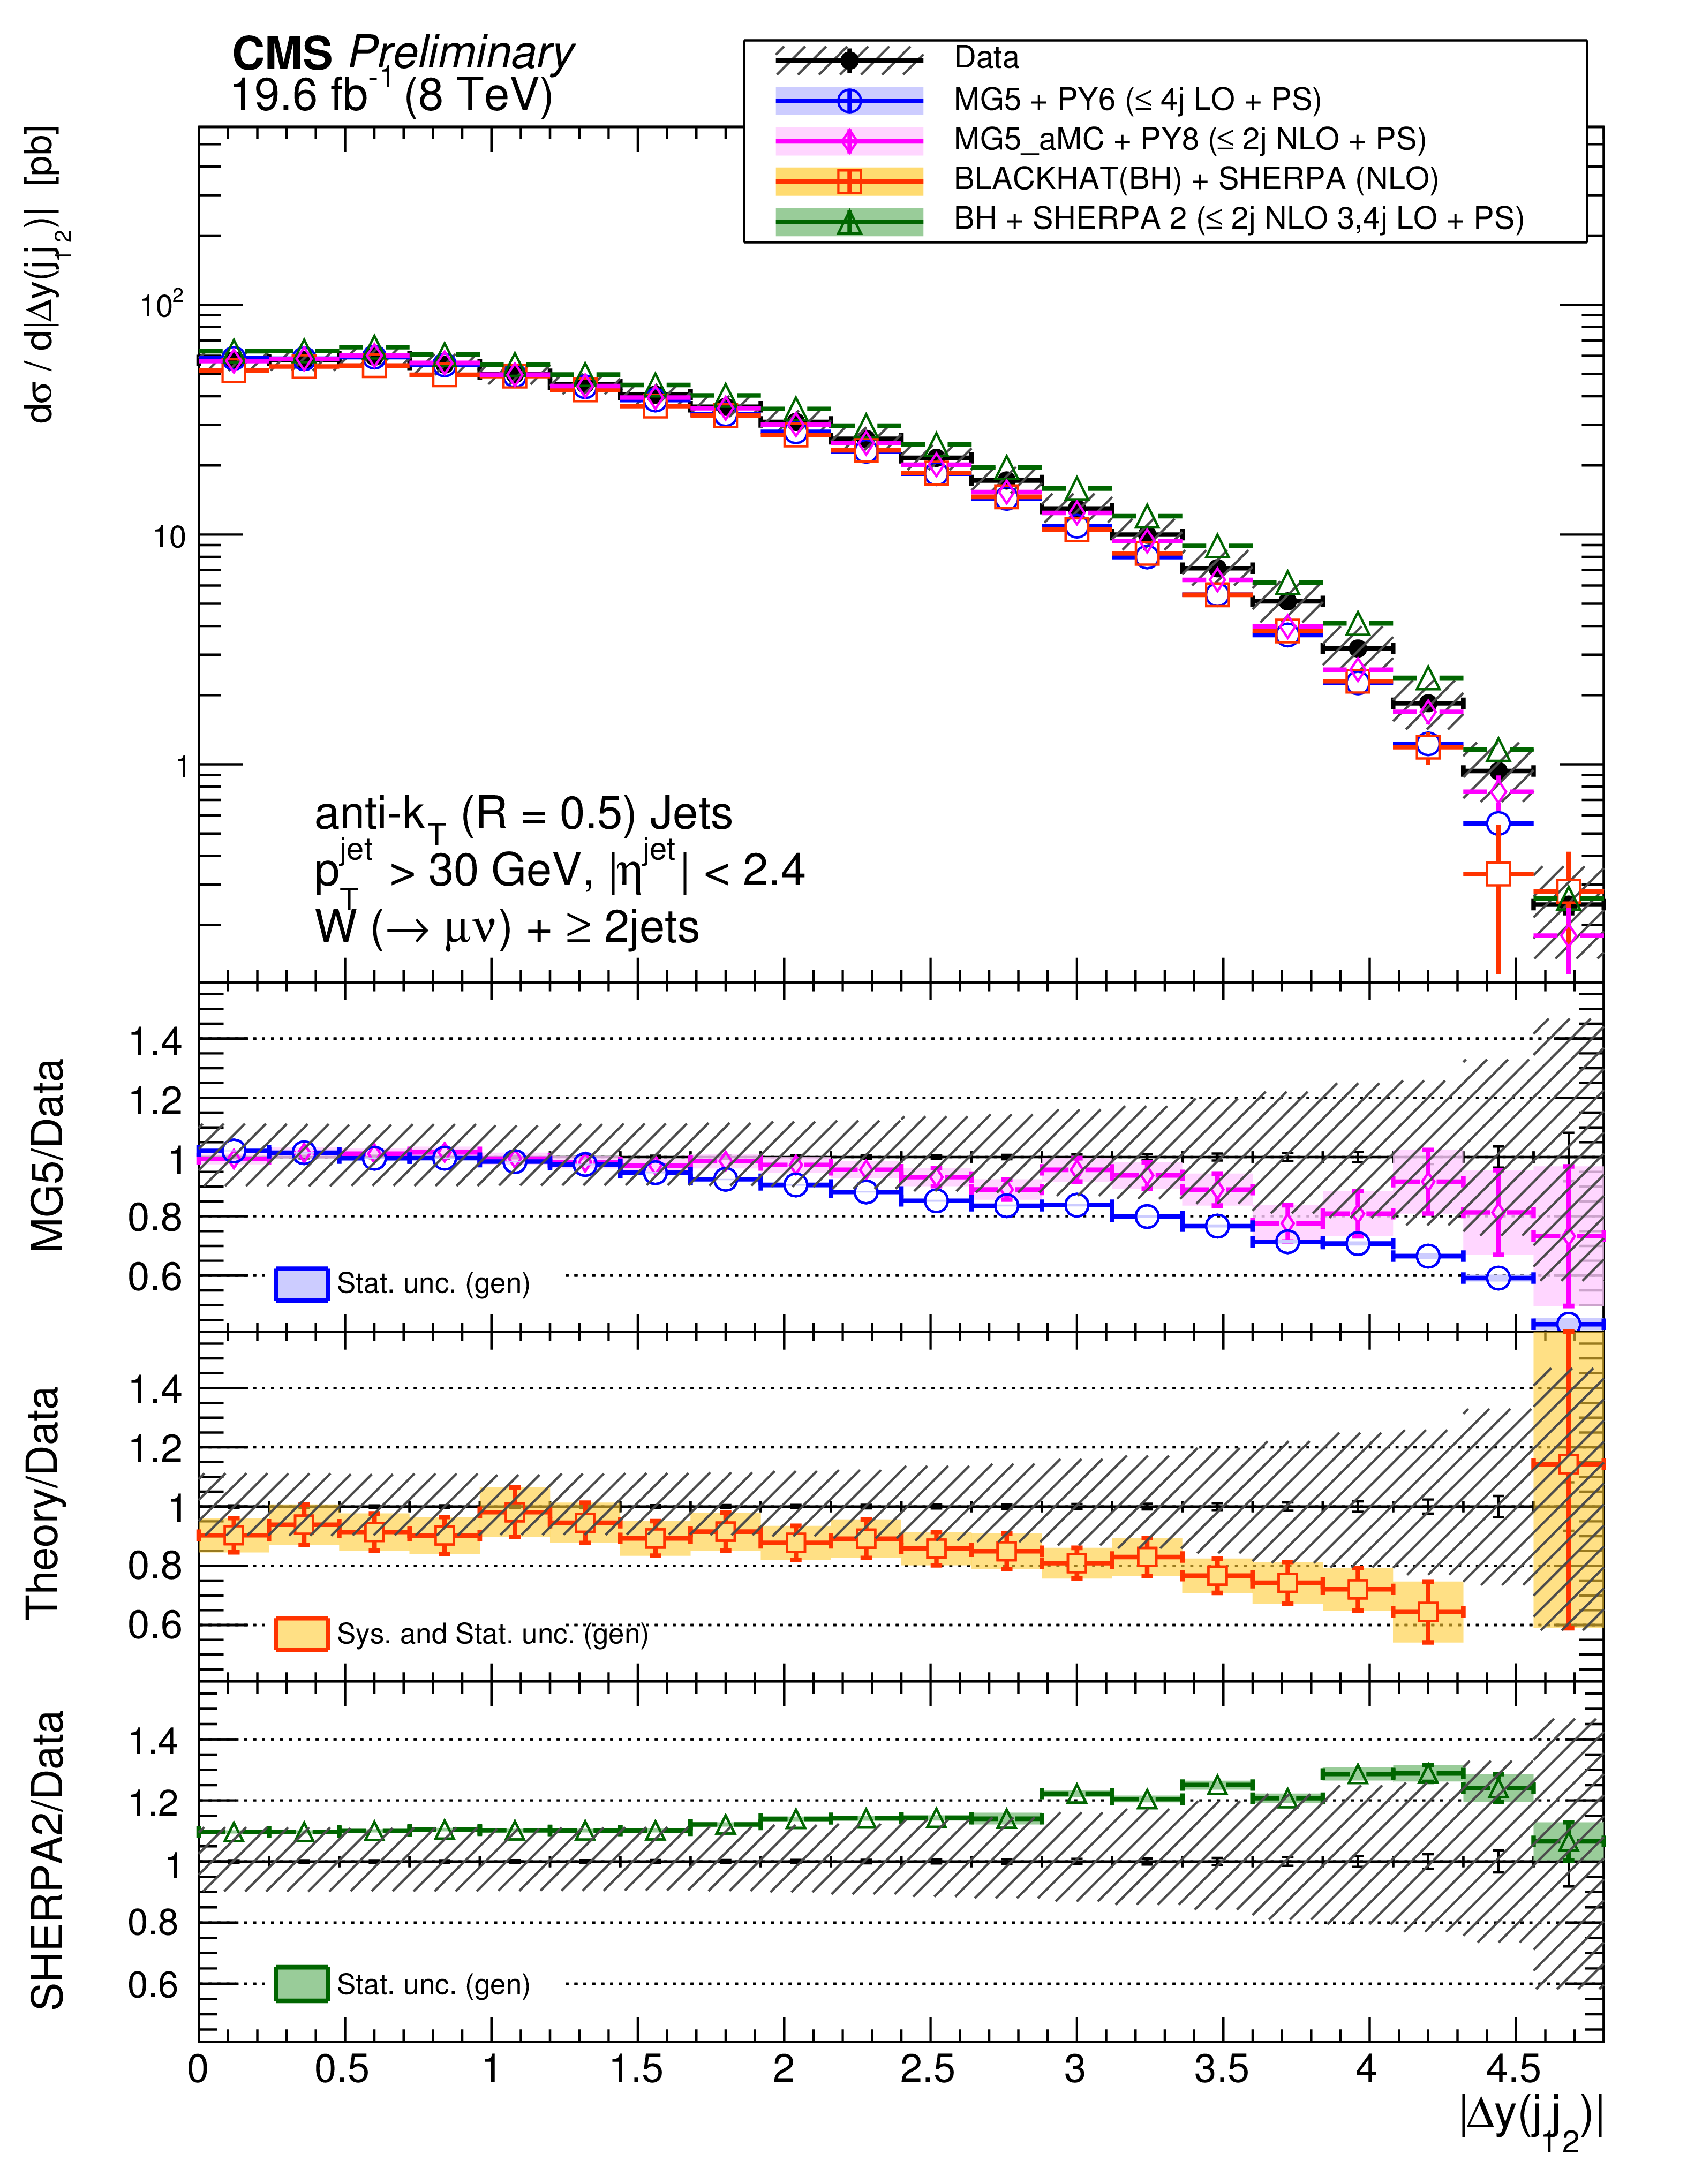
Figure 9-a:
The differential cross section measurement for $\Delta y(j_1,j_2)$ for inclusive jet multiplicities 2-4, compared to the prediction of MadGraph , MadGraph5$\_$aMC@NLO, SHERPA-2, and BLACKHAT+SHERPA (corrected for hadronization and multiple-parton interactions). Black circular markers with the grey hatched band represent the unfolded data measurement and its uncertainty. Overlaid are the predictions together with their statistical uncertainties (Theory stat.). The BLACKHAT+SHERPA uncertainty also contains theoretical systematic uncertainties (Theory syst.) described in Section 9. The lower plots show the ratio of each prediction to the unfolded data. |
png pdf |
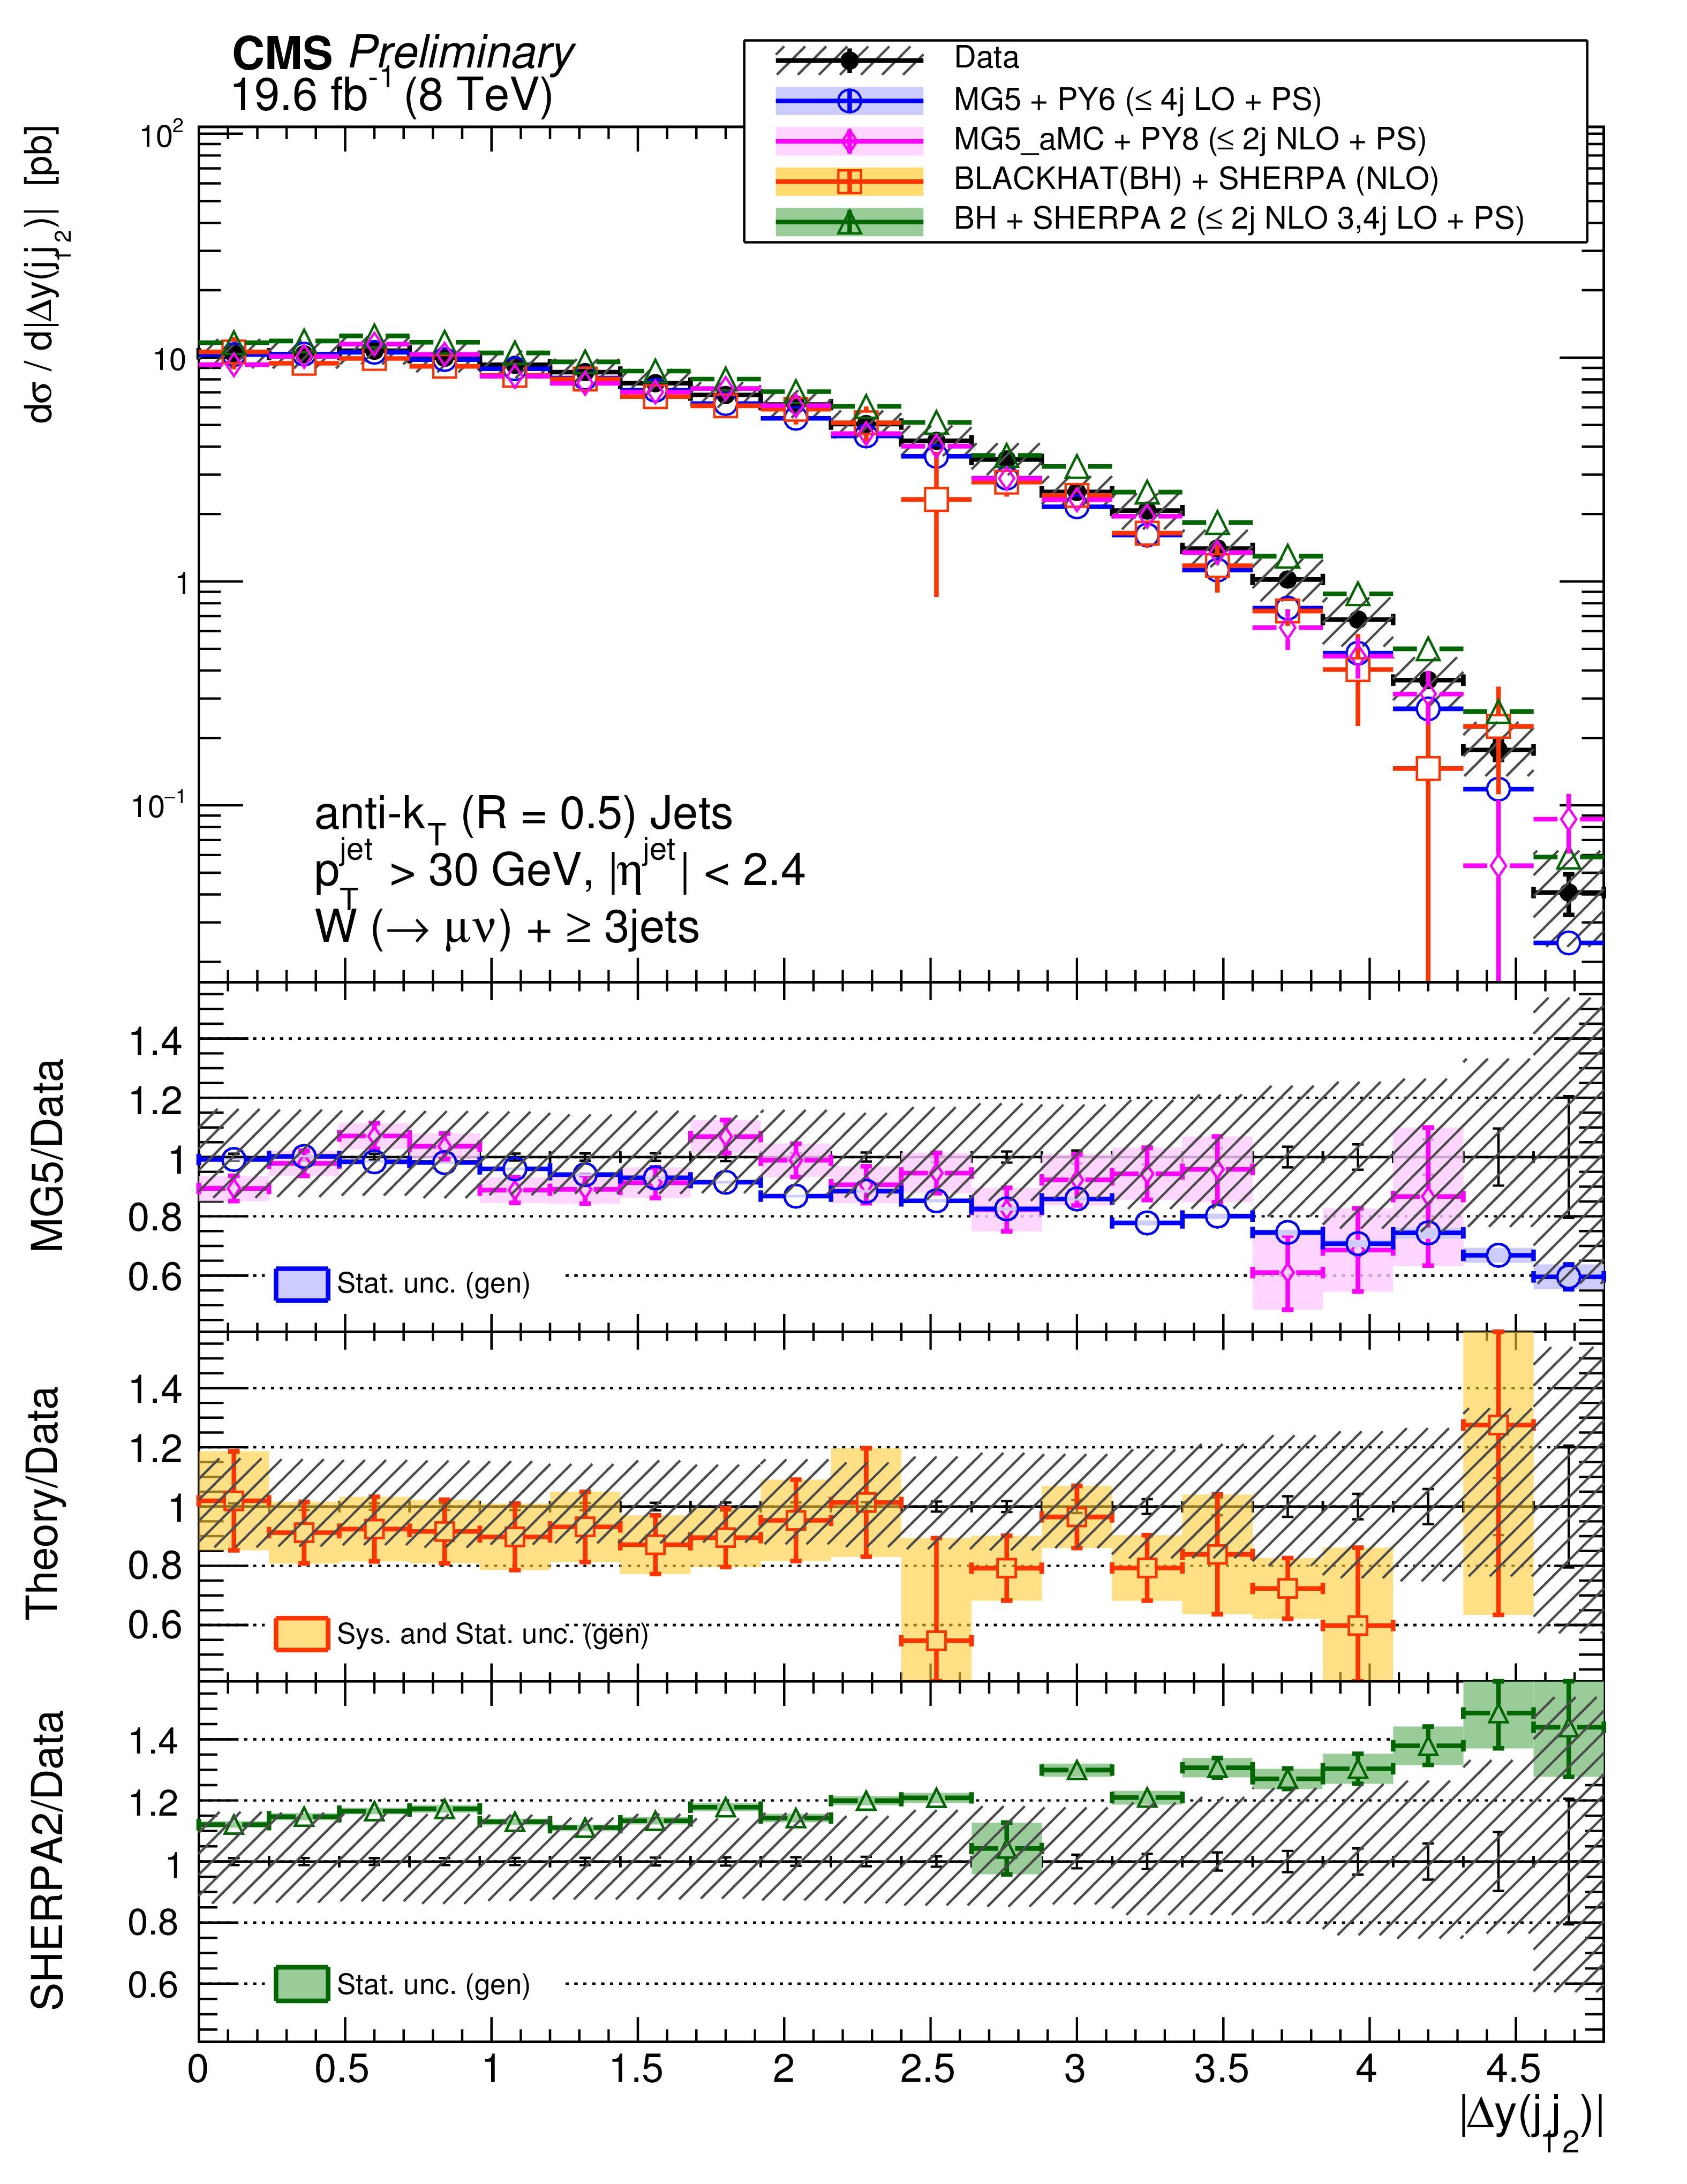
Figure 9-b:
The differential cross section measurement for $\Delta y(j_1,j_2)$ for inclusive jet multiplicities 2-4, compared to the prediction of MadGraph , MadGraph5$\_$aMC@NLO, SHERPA-2, and BLACKHAT+SHERPA (corrected for hadronization and multiple-parton interactions). Black circular markers with the grey hatched band represent the unfolded data measurement and its uncertainty. Overlaid are the predictions together with their statistical uncertainties (Theory stat.). The BLACKHAT+SHERPA uncertainty also contains theoretical systematic uncertainties (Theory syst.) described in Section 9. The lower plots show the ratio of each prediction to the unfolded data. |
png pdf |
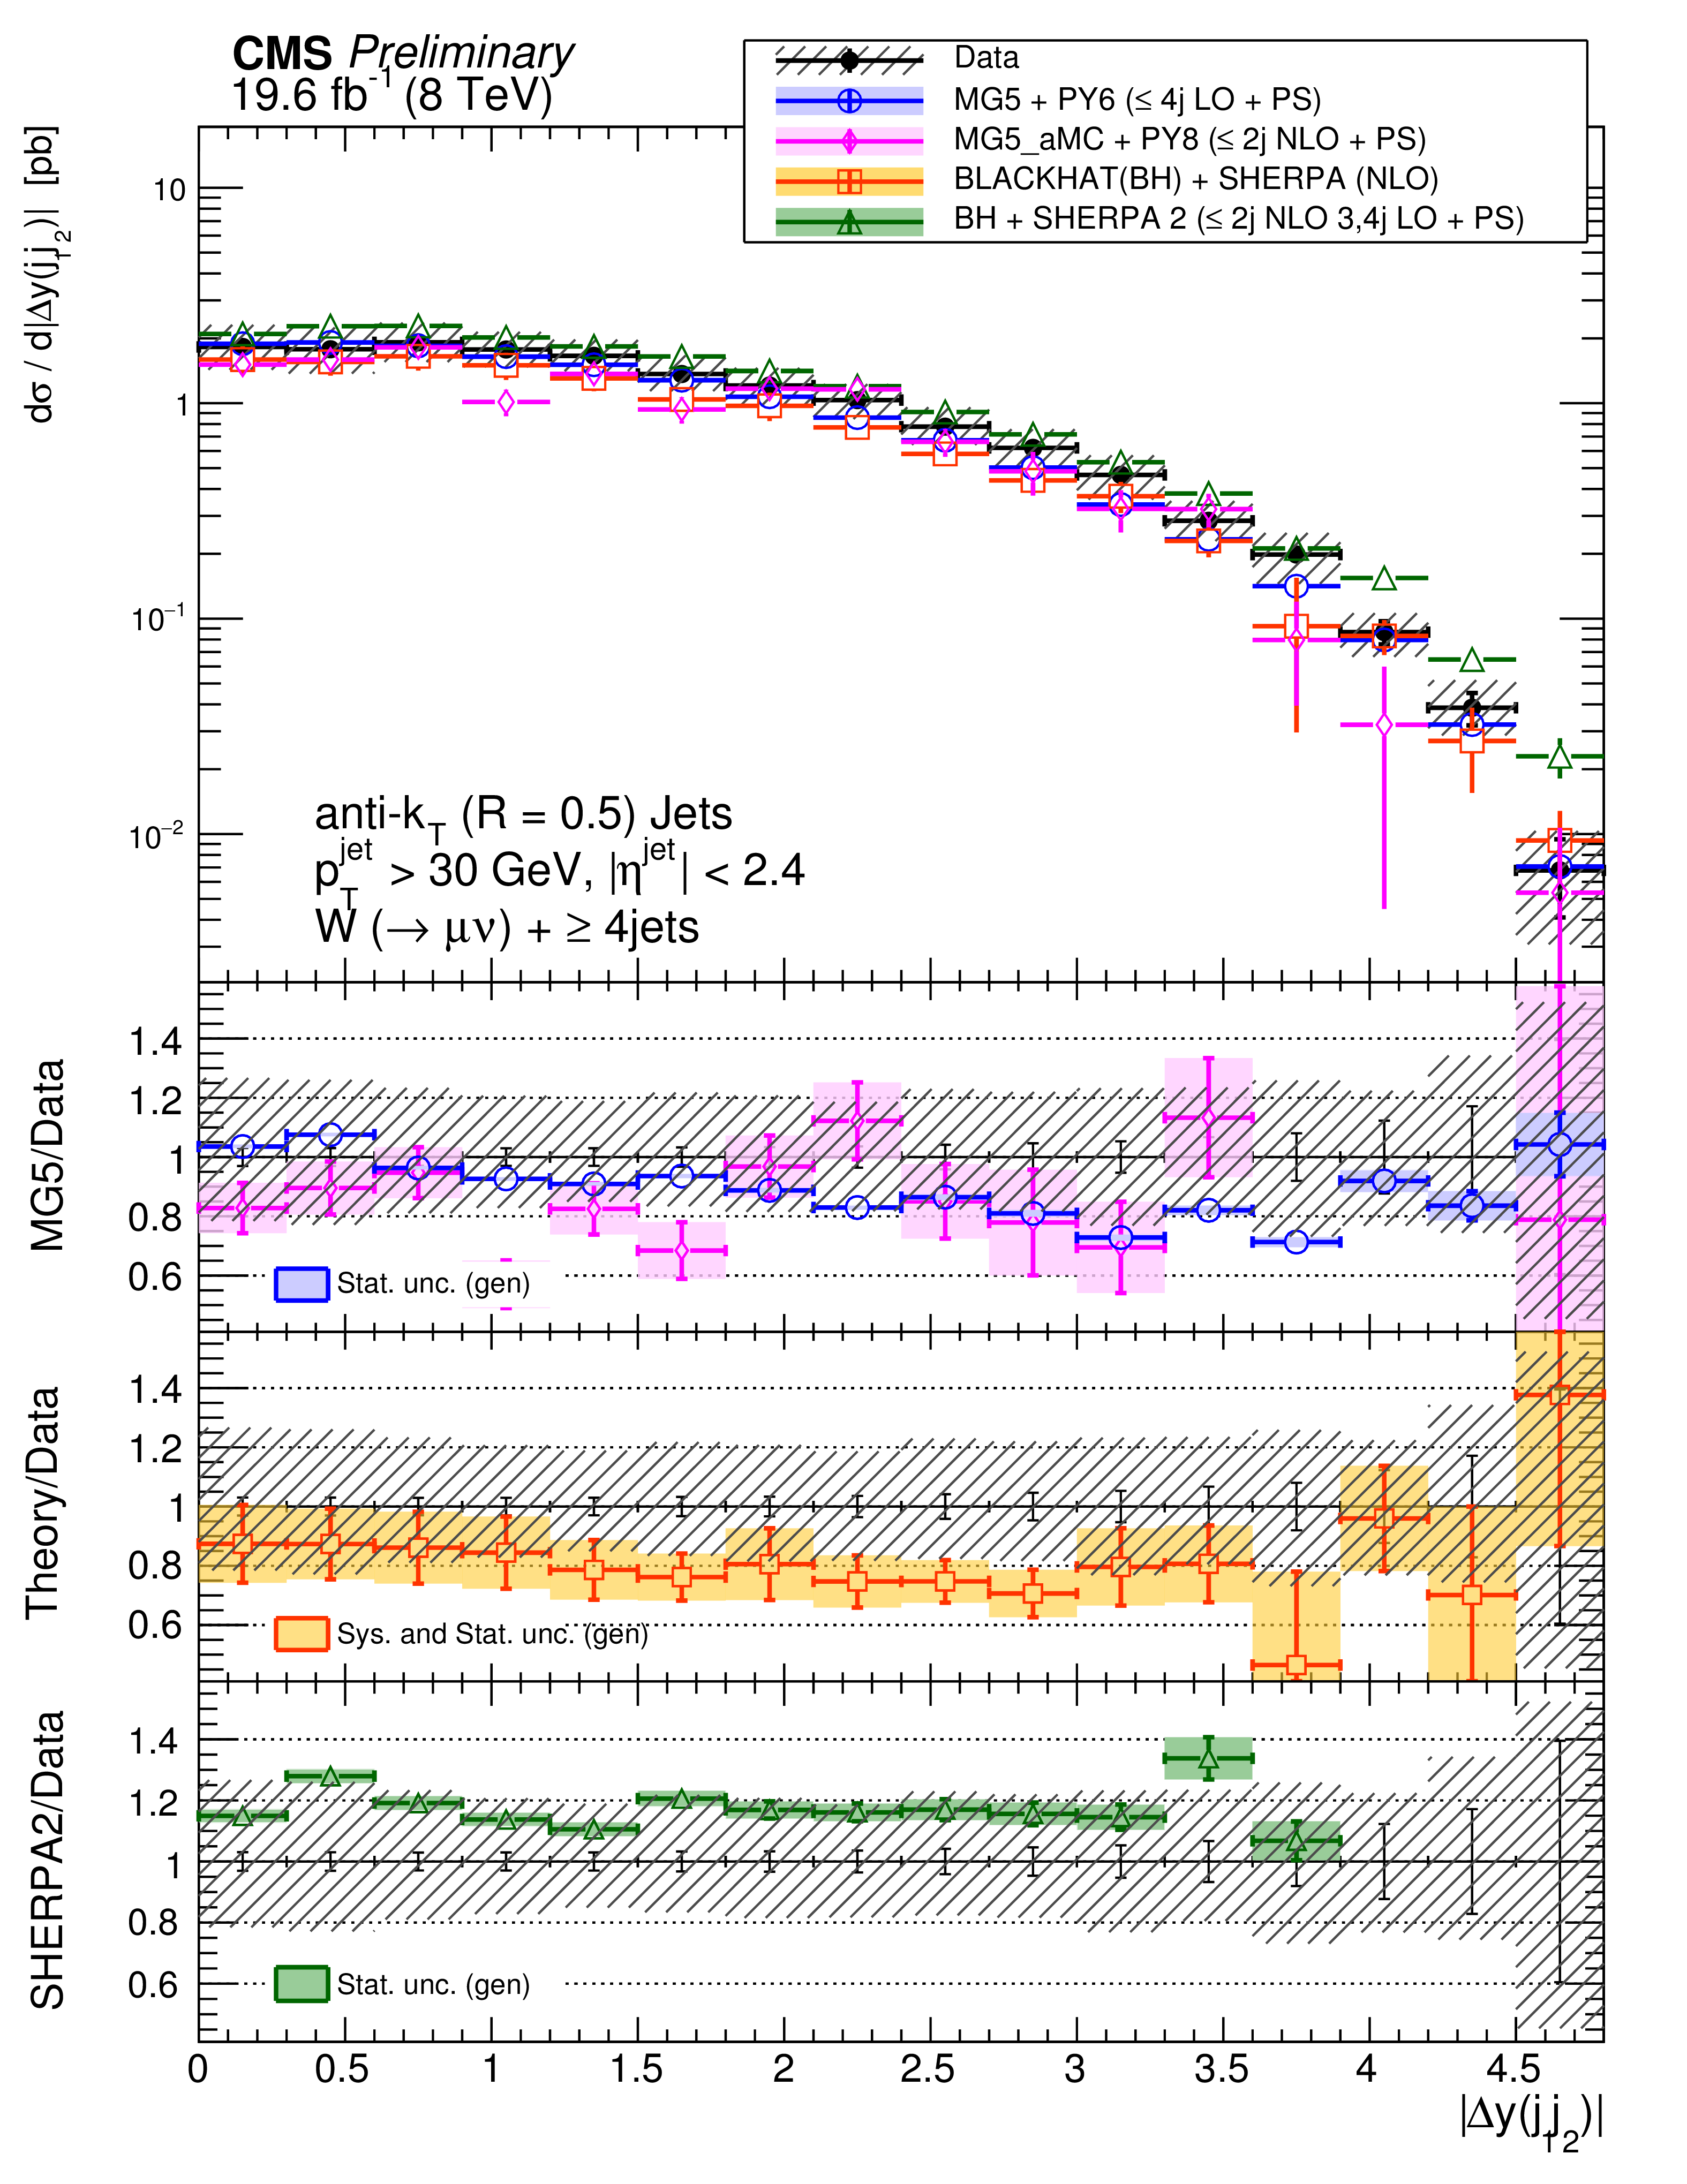
Figure 9-c:
The differential cross section measurement for $\Delta y(j_1,j_2)$ for inclusive jet multiplicities 2-4, compared to the prediction of MadGraph , MadGraph5$\_$aMC@NLO, SHERPA-2, and BLACKHAT+SHERPA (corrected for hadronization and multiple-parton interactions). Black circular markers with the grey hatched band represent the unfolded data measurement and its uncertainty. Overlaid are the predictions together with their statistical uncertainties (Theory stat.). The BLACKHAT+SHERPA uncertainty also contains theoretical systematic uncertainties (Theory syst.) described in Section 9. The lower plots show the ratio of each prediction to the unfolded data. |

png pdf |
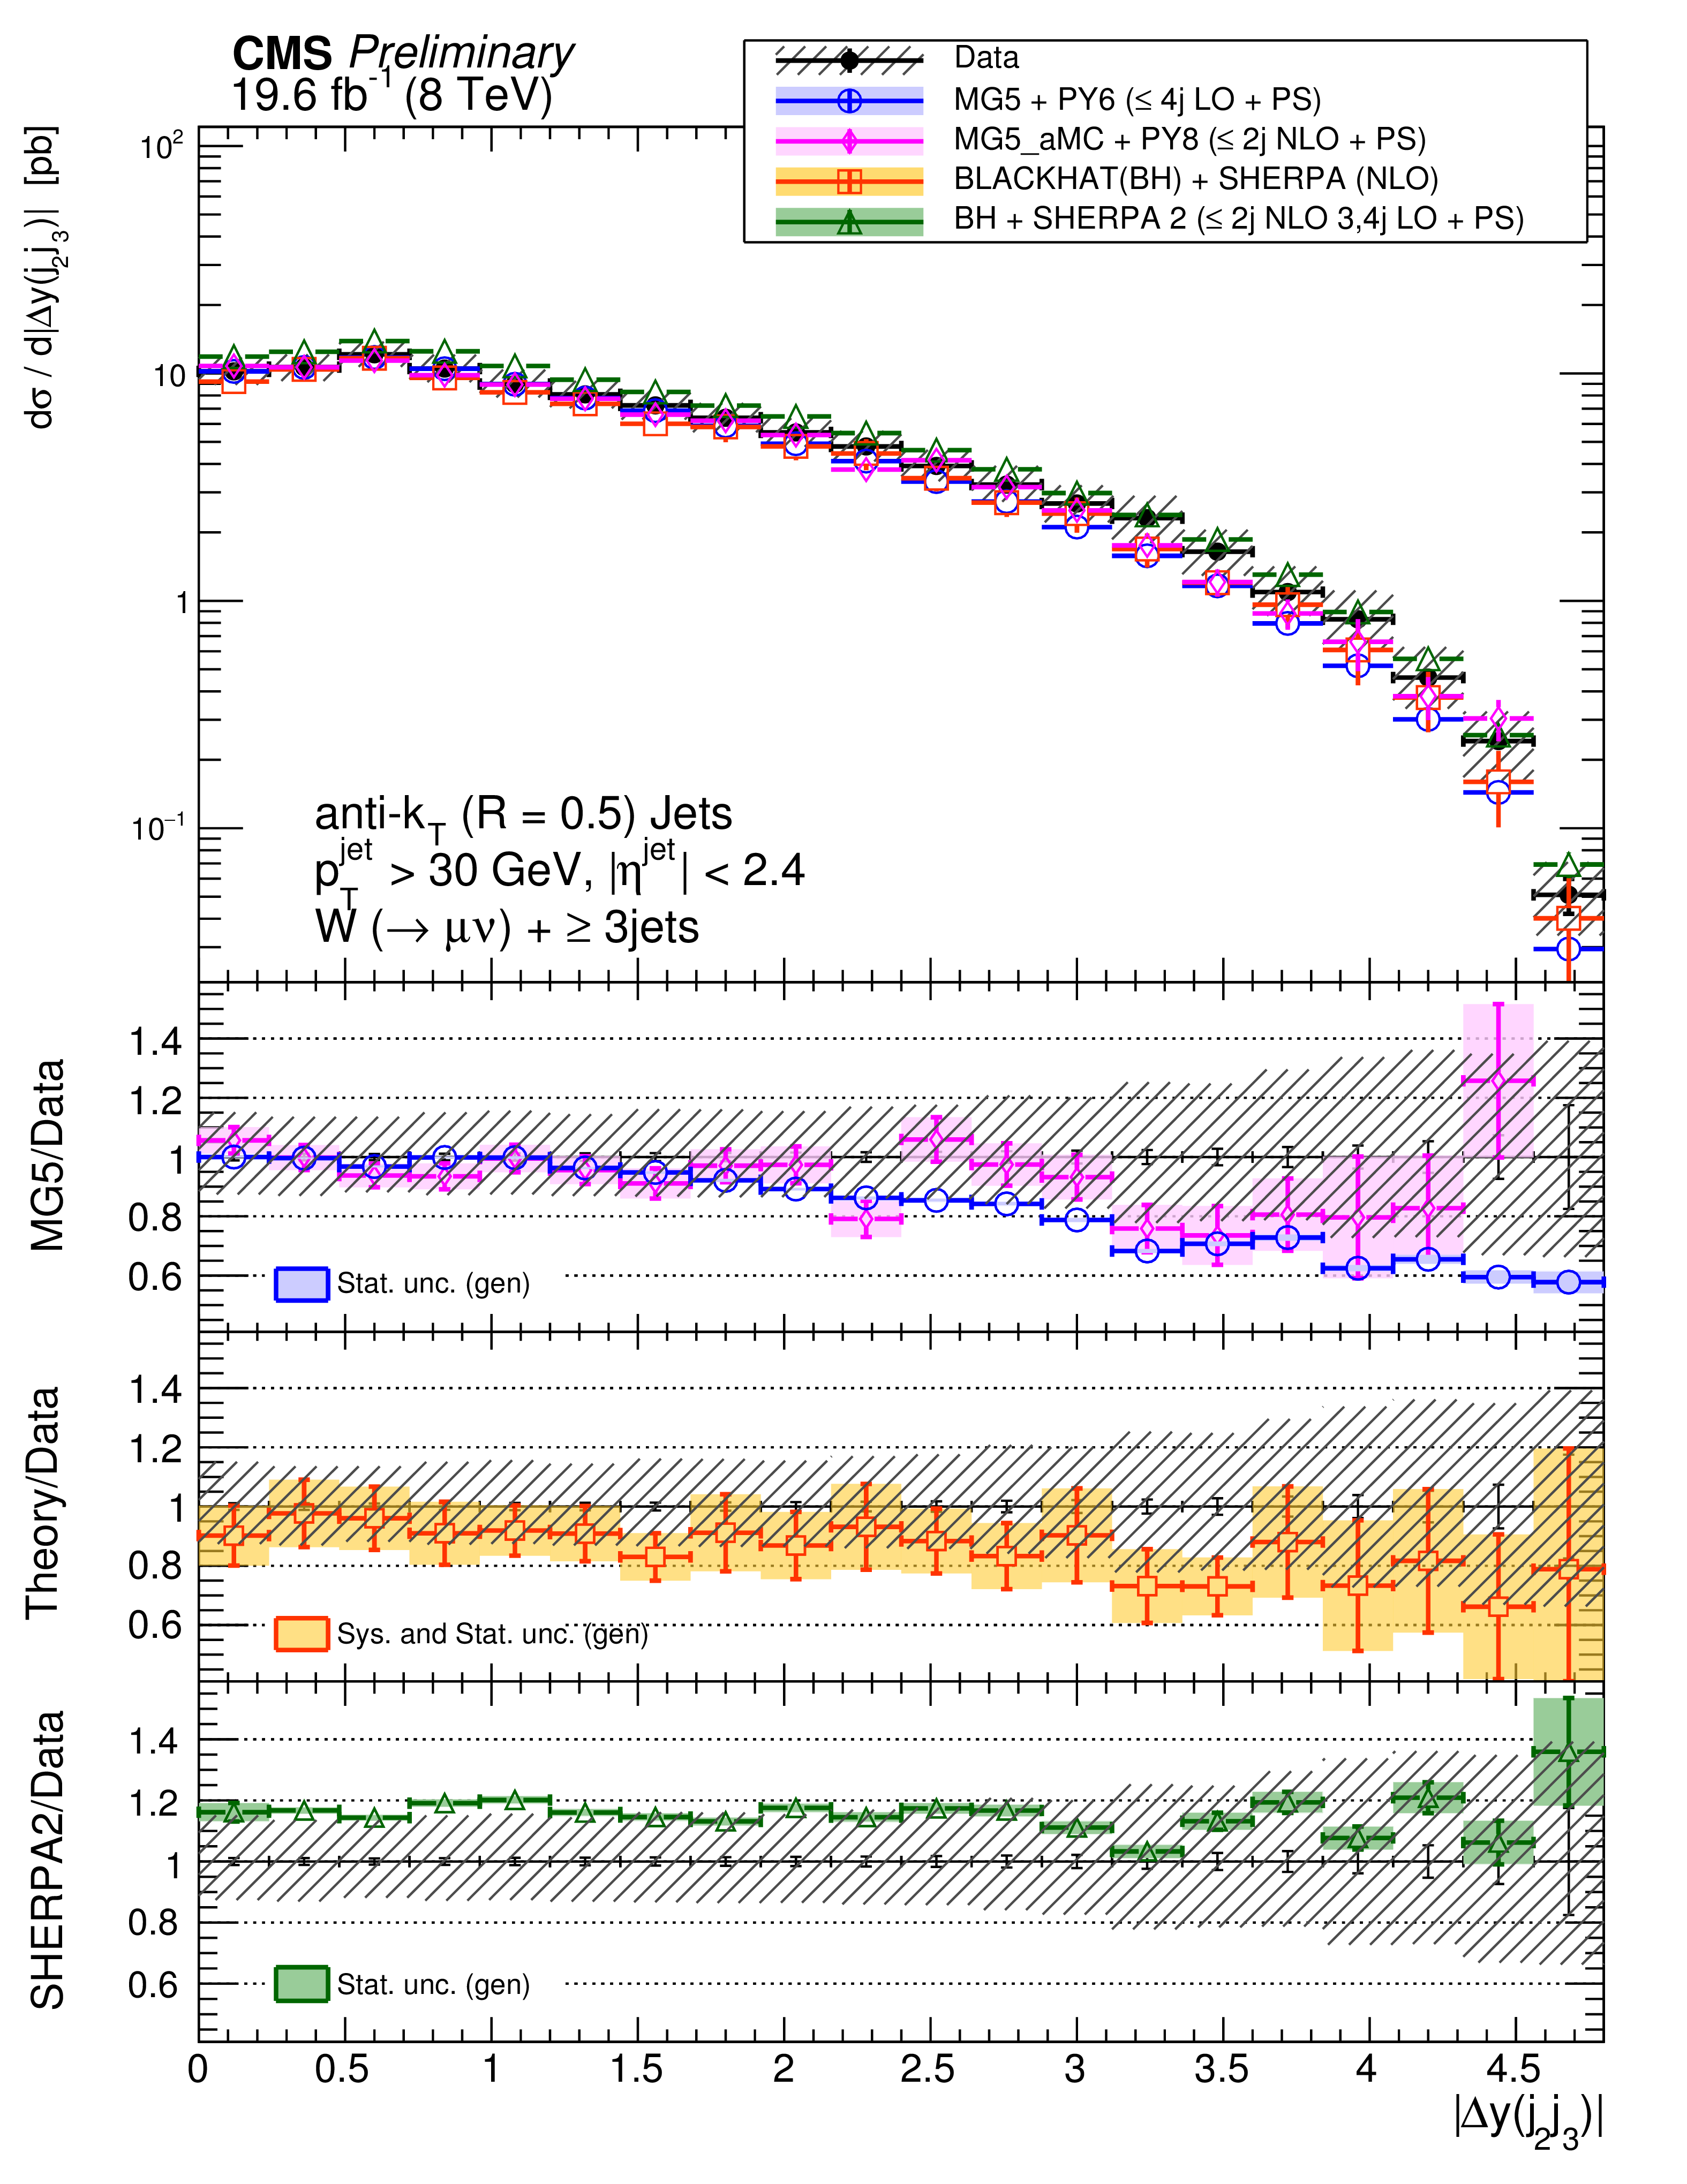
Figure 10-a:
The differential cross section measurement for $\Delta y(j_1,j_3)$ and $\Delta y(j_2,j_3)$ for an inclusive jet multiplicity of 3, compared to the prediction of MadGraph , MadGraph5$\_$aMC@NLO, SHERPA-2, and BLACKHAT+SHERPA (corrected for hadronization and multiple-parton interactions). Black circular markers with the grey hatched band represent the unfolded data measurement and its uncertainty. Overlaid are the predictions together with their statistical uncertainties (Theory stat.). The BLACKHAT+SHERPA uncertainty also contains theoretical systematic uncertainties (Theory syst.) described in Section 9. The lower plots show the ratio of each prediction to the unfolded data. |
png pdf |
Figure 10-b:
The differential cross section measurement for $\Delta y(j_1,j_3)$ and $\Delta y(j_2,j_3)$ for an inclusive jet multiplicity of 3, compared to the prediction of MadGraph , MadGraph5$\_$aMC@NLO, SHERPA-2, and BLACKHAT+SHERPA (corrected for hadronization and multiple-parton interactions). Black circular markers with the grey hatched band represent the unfolded data measurement and its uncertainty. Overlaid are the predictions together with their statistical uncertainties (Theory stat.). The BLACKHAT+SHERPA uncertainty also contains theoretical systematic uncertainties (Theory syst.) described in Section 9. The lower plots show the ratio of each prediction to the unfolded data. |
png pdf |
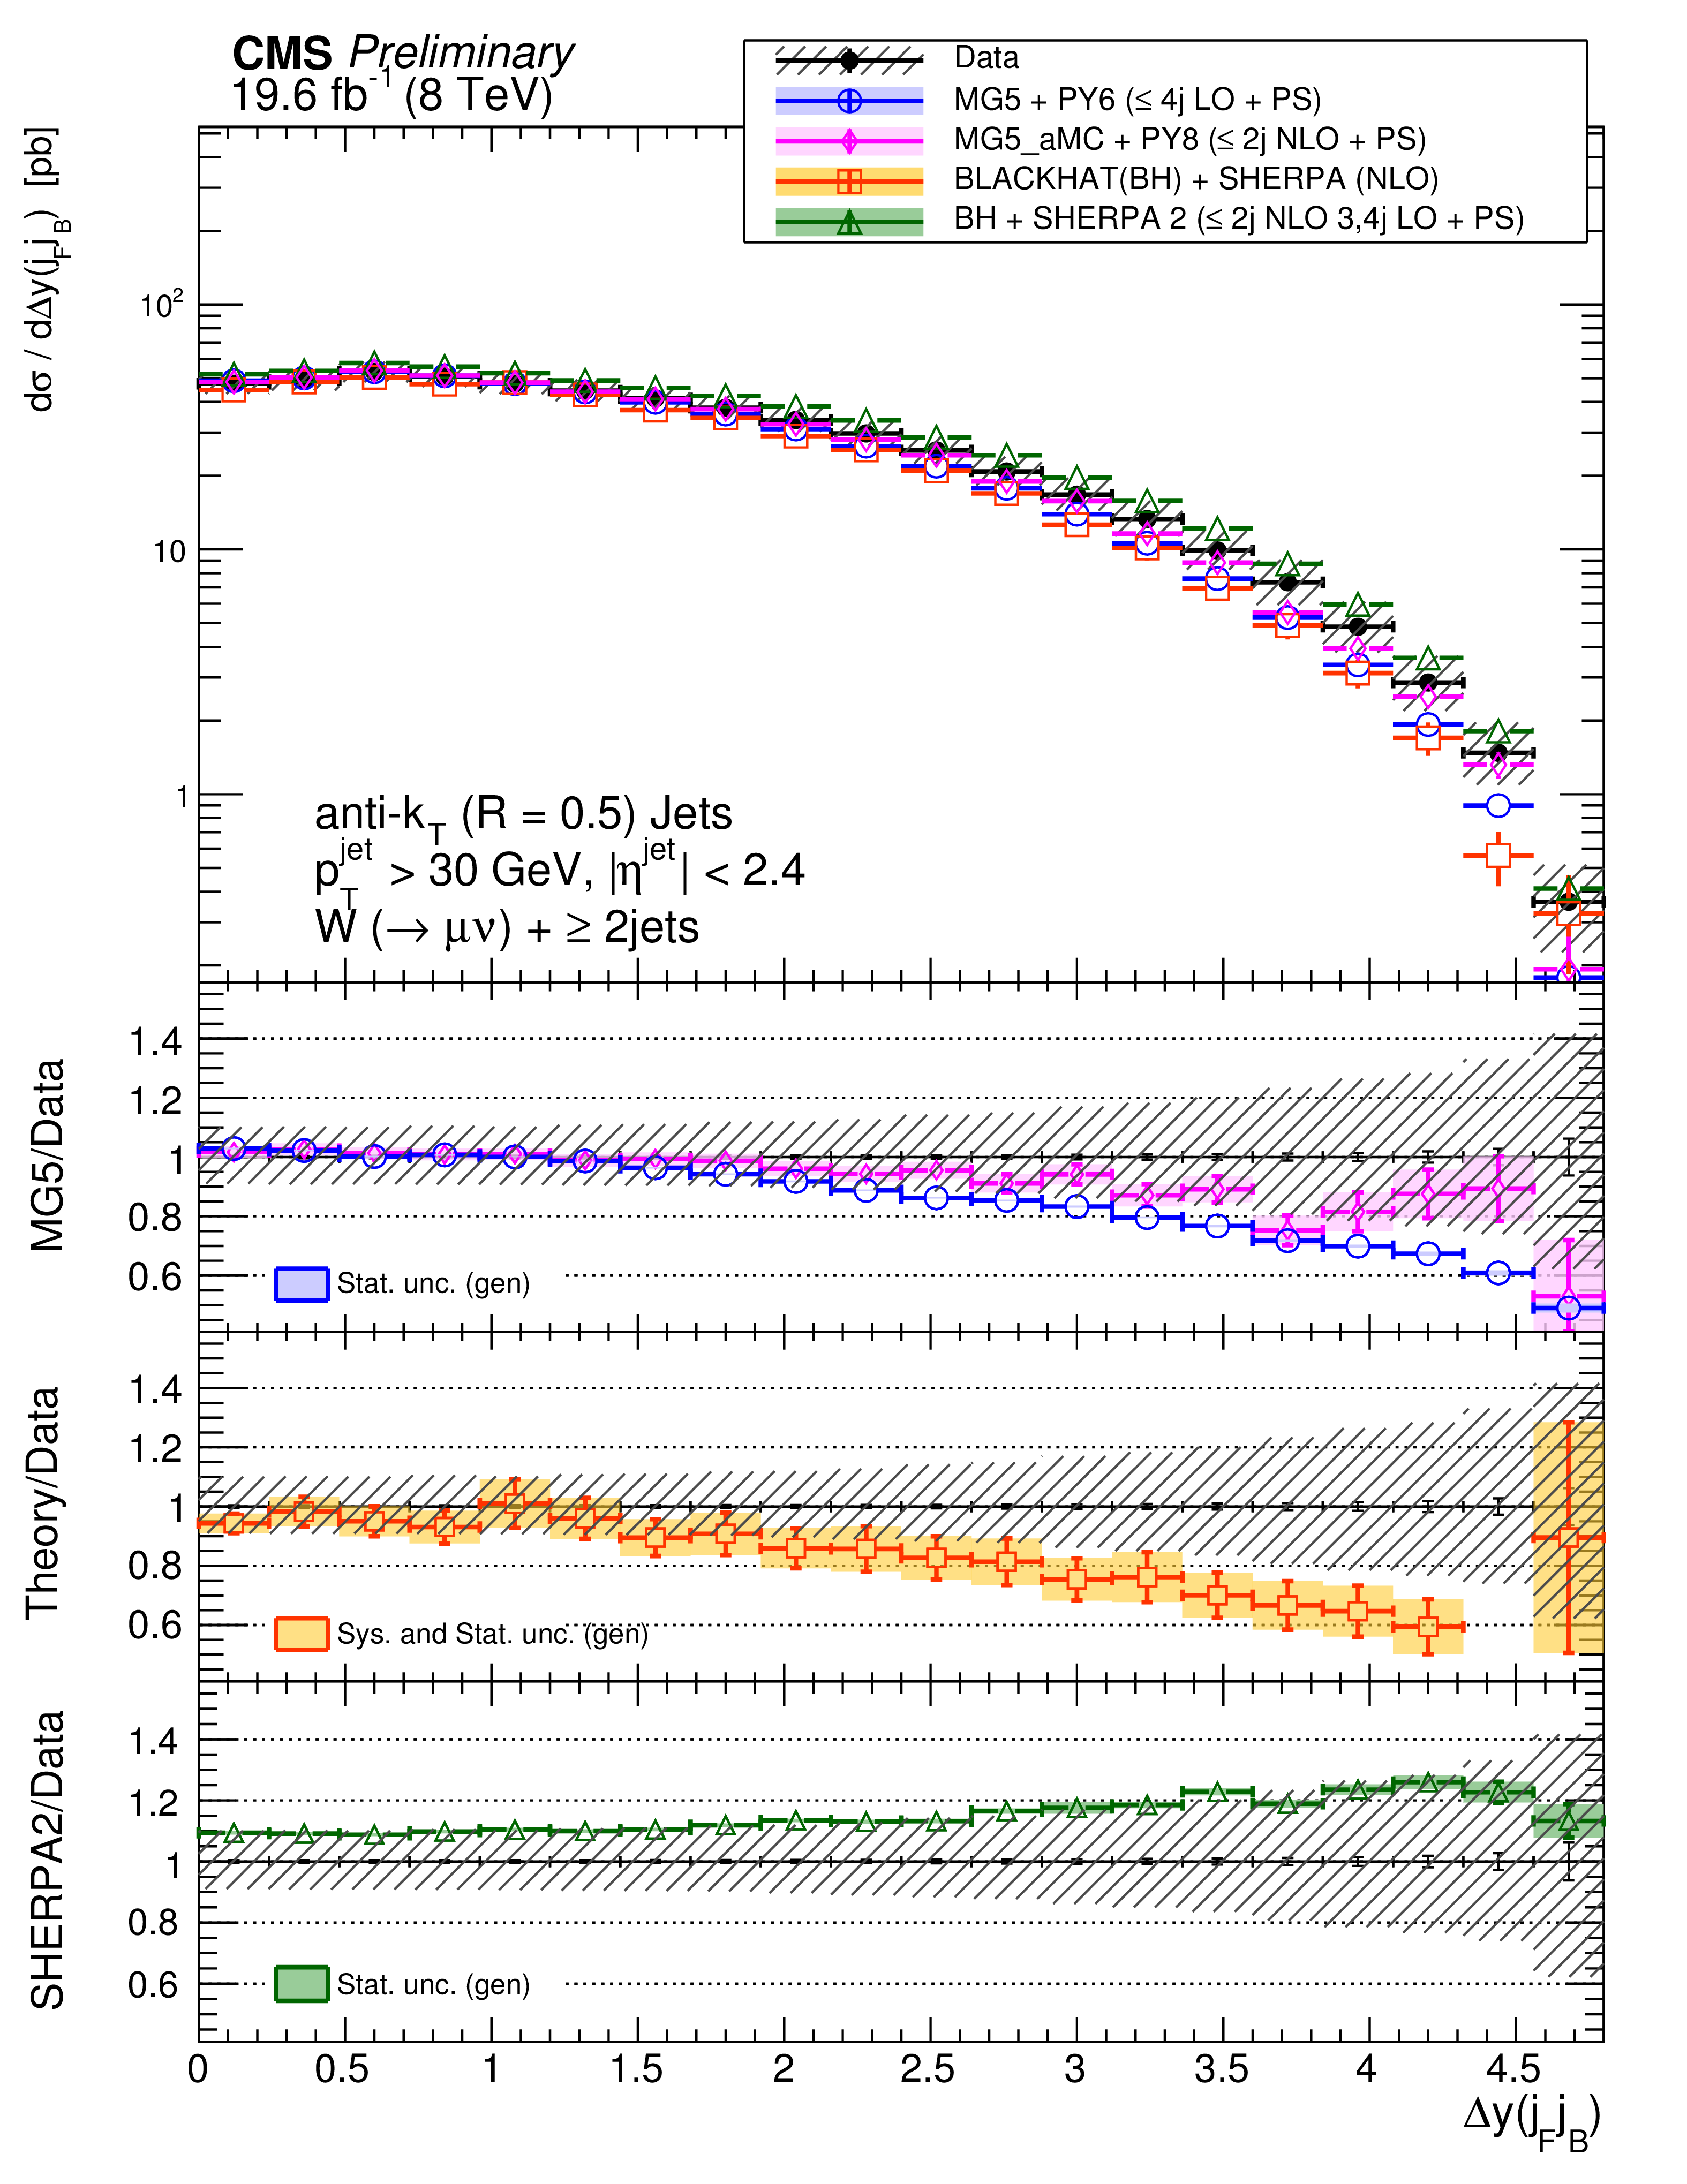
Figure 11-a:
The differential cross section measurement for $\Delta y(j_F,j_B)$ for inclusive jet multiplicities 2-4, compared to the prediction of MadGraph , MadGraph5$\_$aMC@NLO, SHERPA-2, and BLACKHAT+SHERPA (corrected for hadronization and multiple-parton interactions). Black circular markers with the grey hatched band represent the unfolded data measurement and its uncertainty. Overlaid are the predictions together with their statistical uncertainties (Theory stat.). The BLACKHAT+SHERPA uncertainty also contains theoretical systematic uncertainties (Theory syst.) described in Section 9. The lower plots show the ratio of each prediction to the unfolded data. |
png pdf |
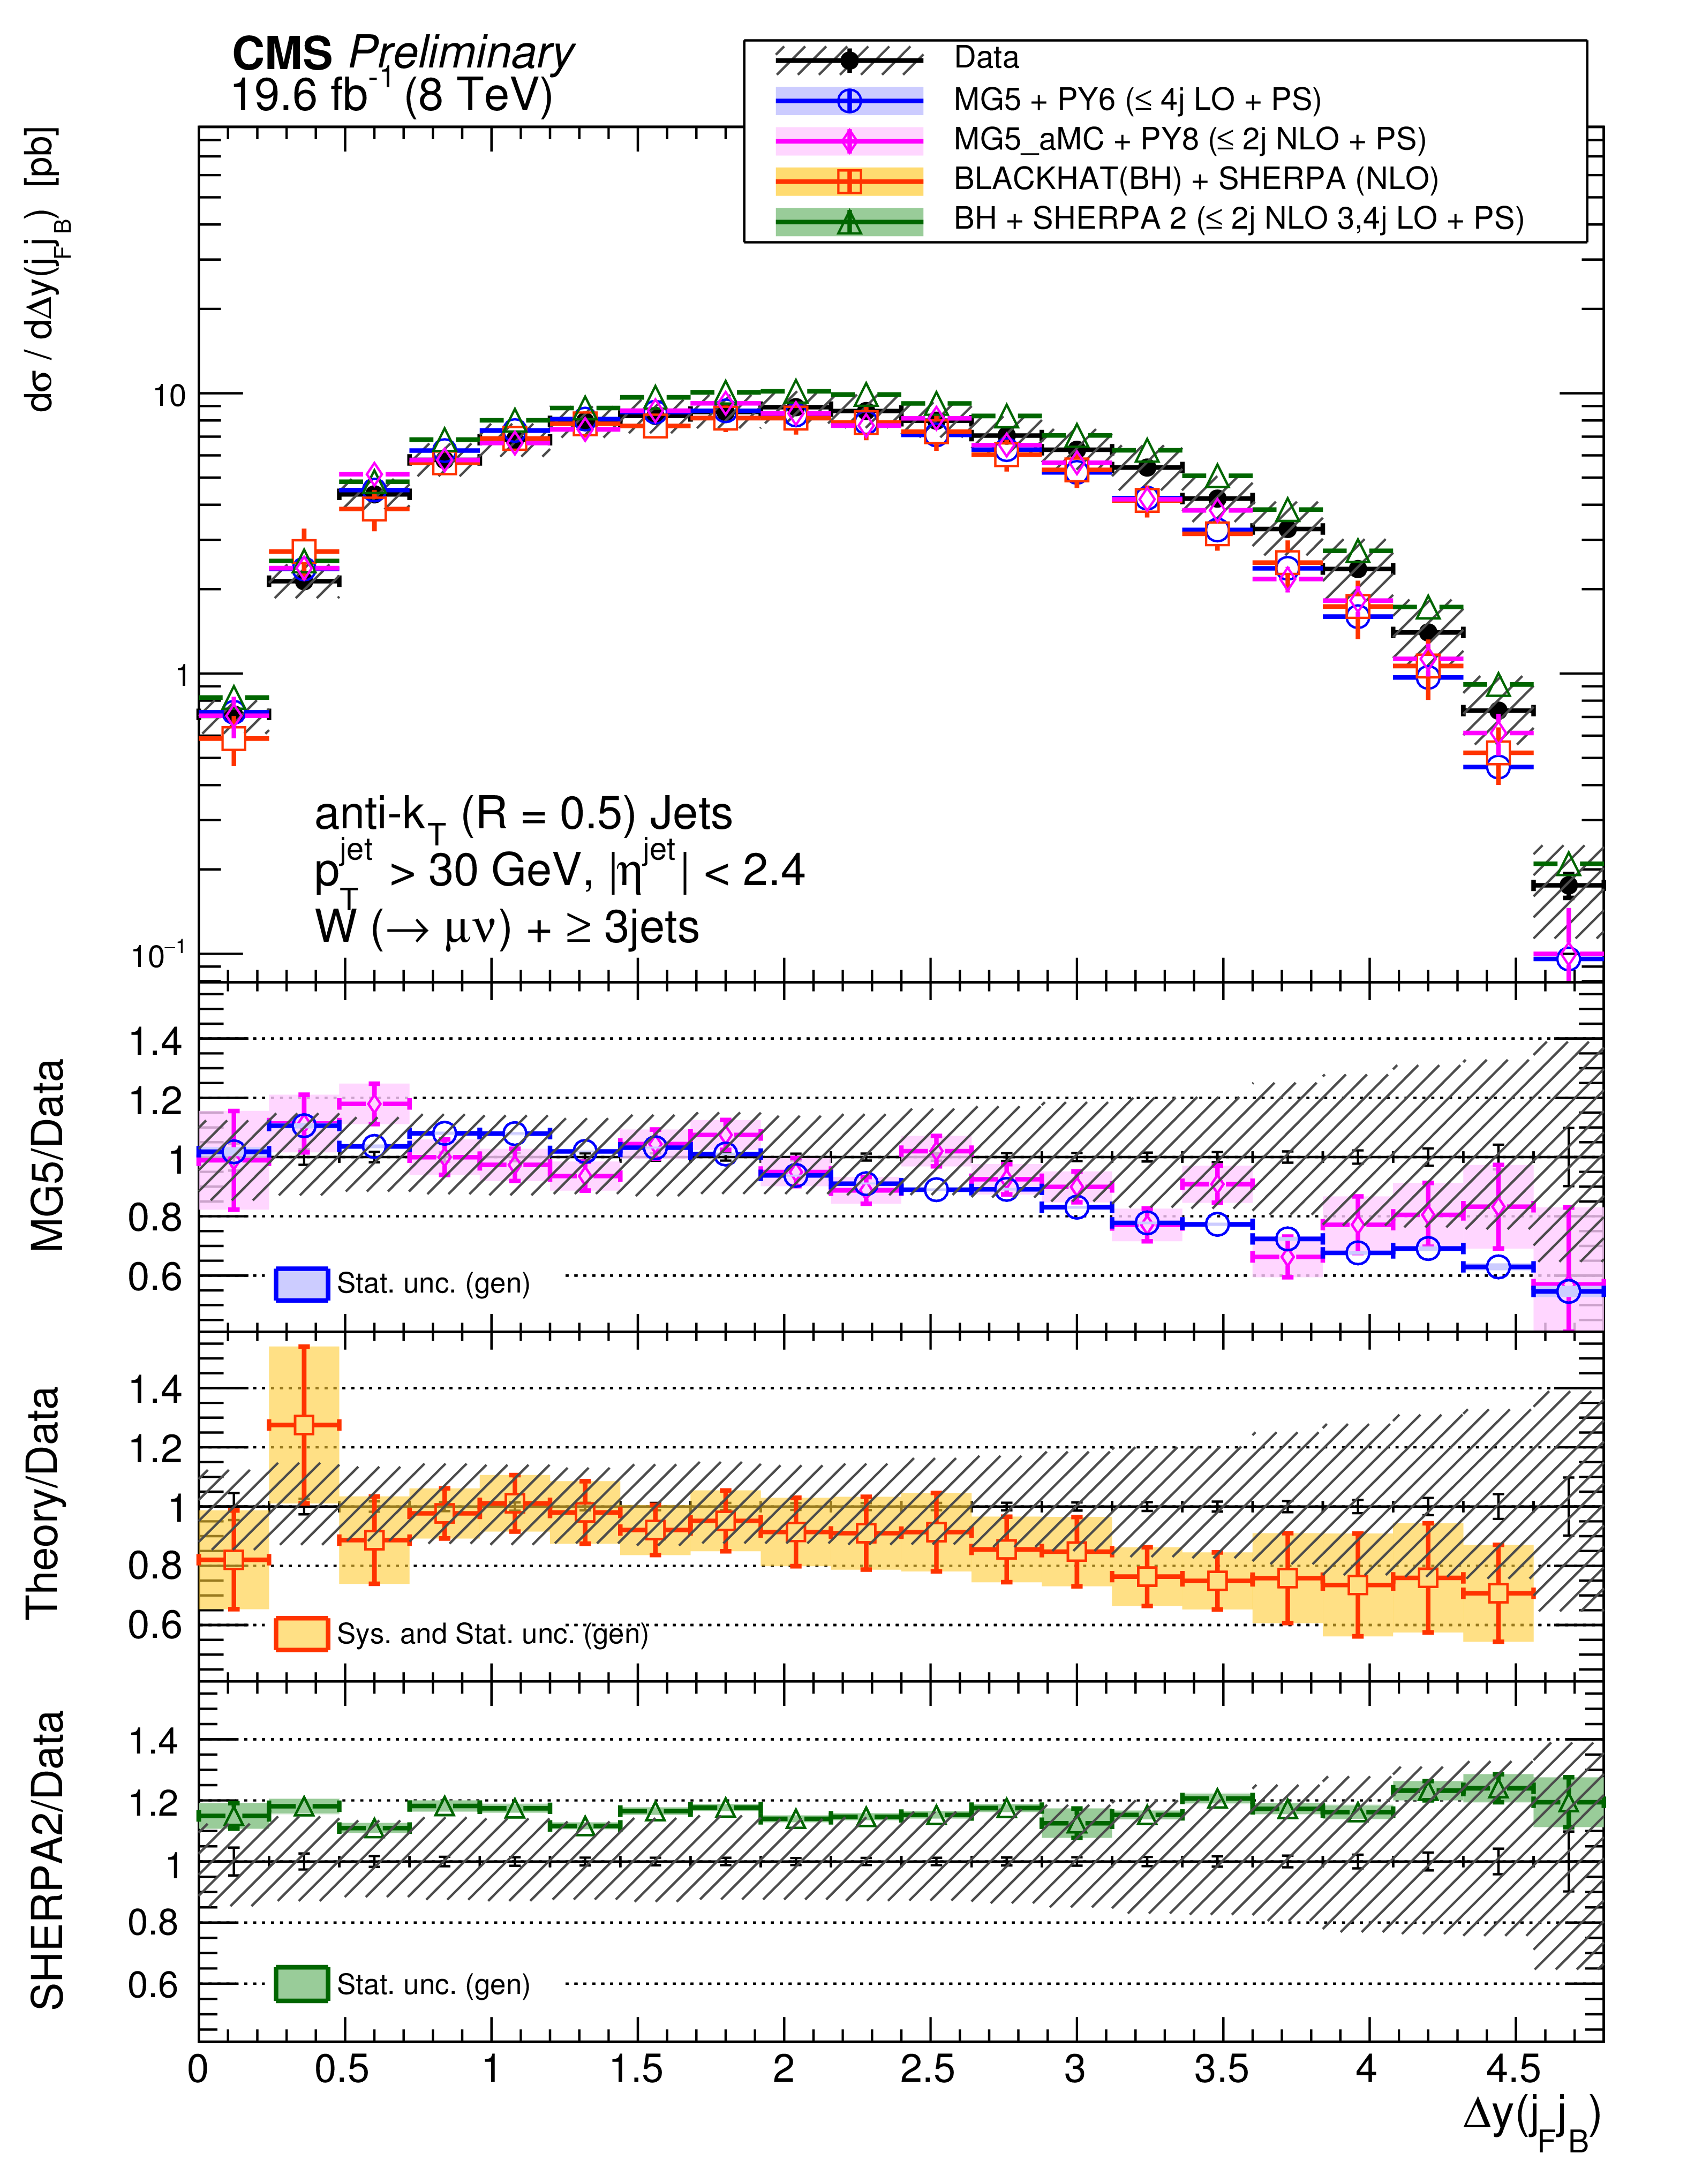
Figure 11-b:
The differential cross section measurement for $\Delta y(j_F,j_B)$ for inclusive jet multiplicities 2-4, compared to the prediction of MadGraph , MadGraph5$\_$aMC@NLO, SHERPA-2, and BLACKHAT+SHERPA (corrected for hadronization and multiple-parton interactions). Black circular markers with the grey hatched band represent the unfolded data measurement and its uncertainty. Overlaid are the predictions together with their statistical uncertainties (Theory stat.). The BLACKHAT+SHERPA uncertainty also contains theoretical systematic uncertainties (Theory syst.) described in Section 9. The lower plots show the ratio of each prediction to the unfolded data. |
png pdf |
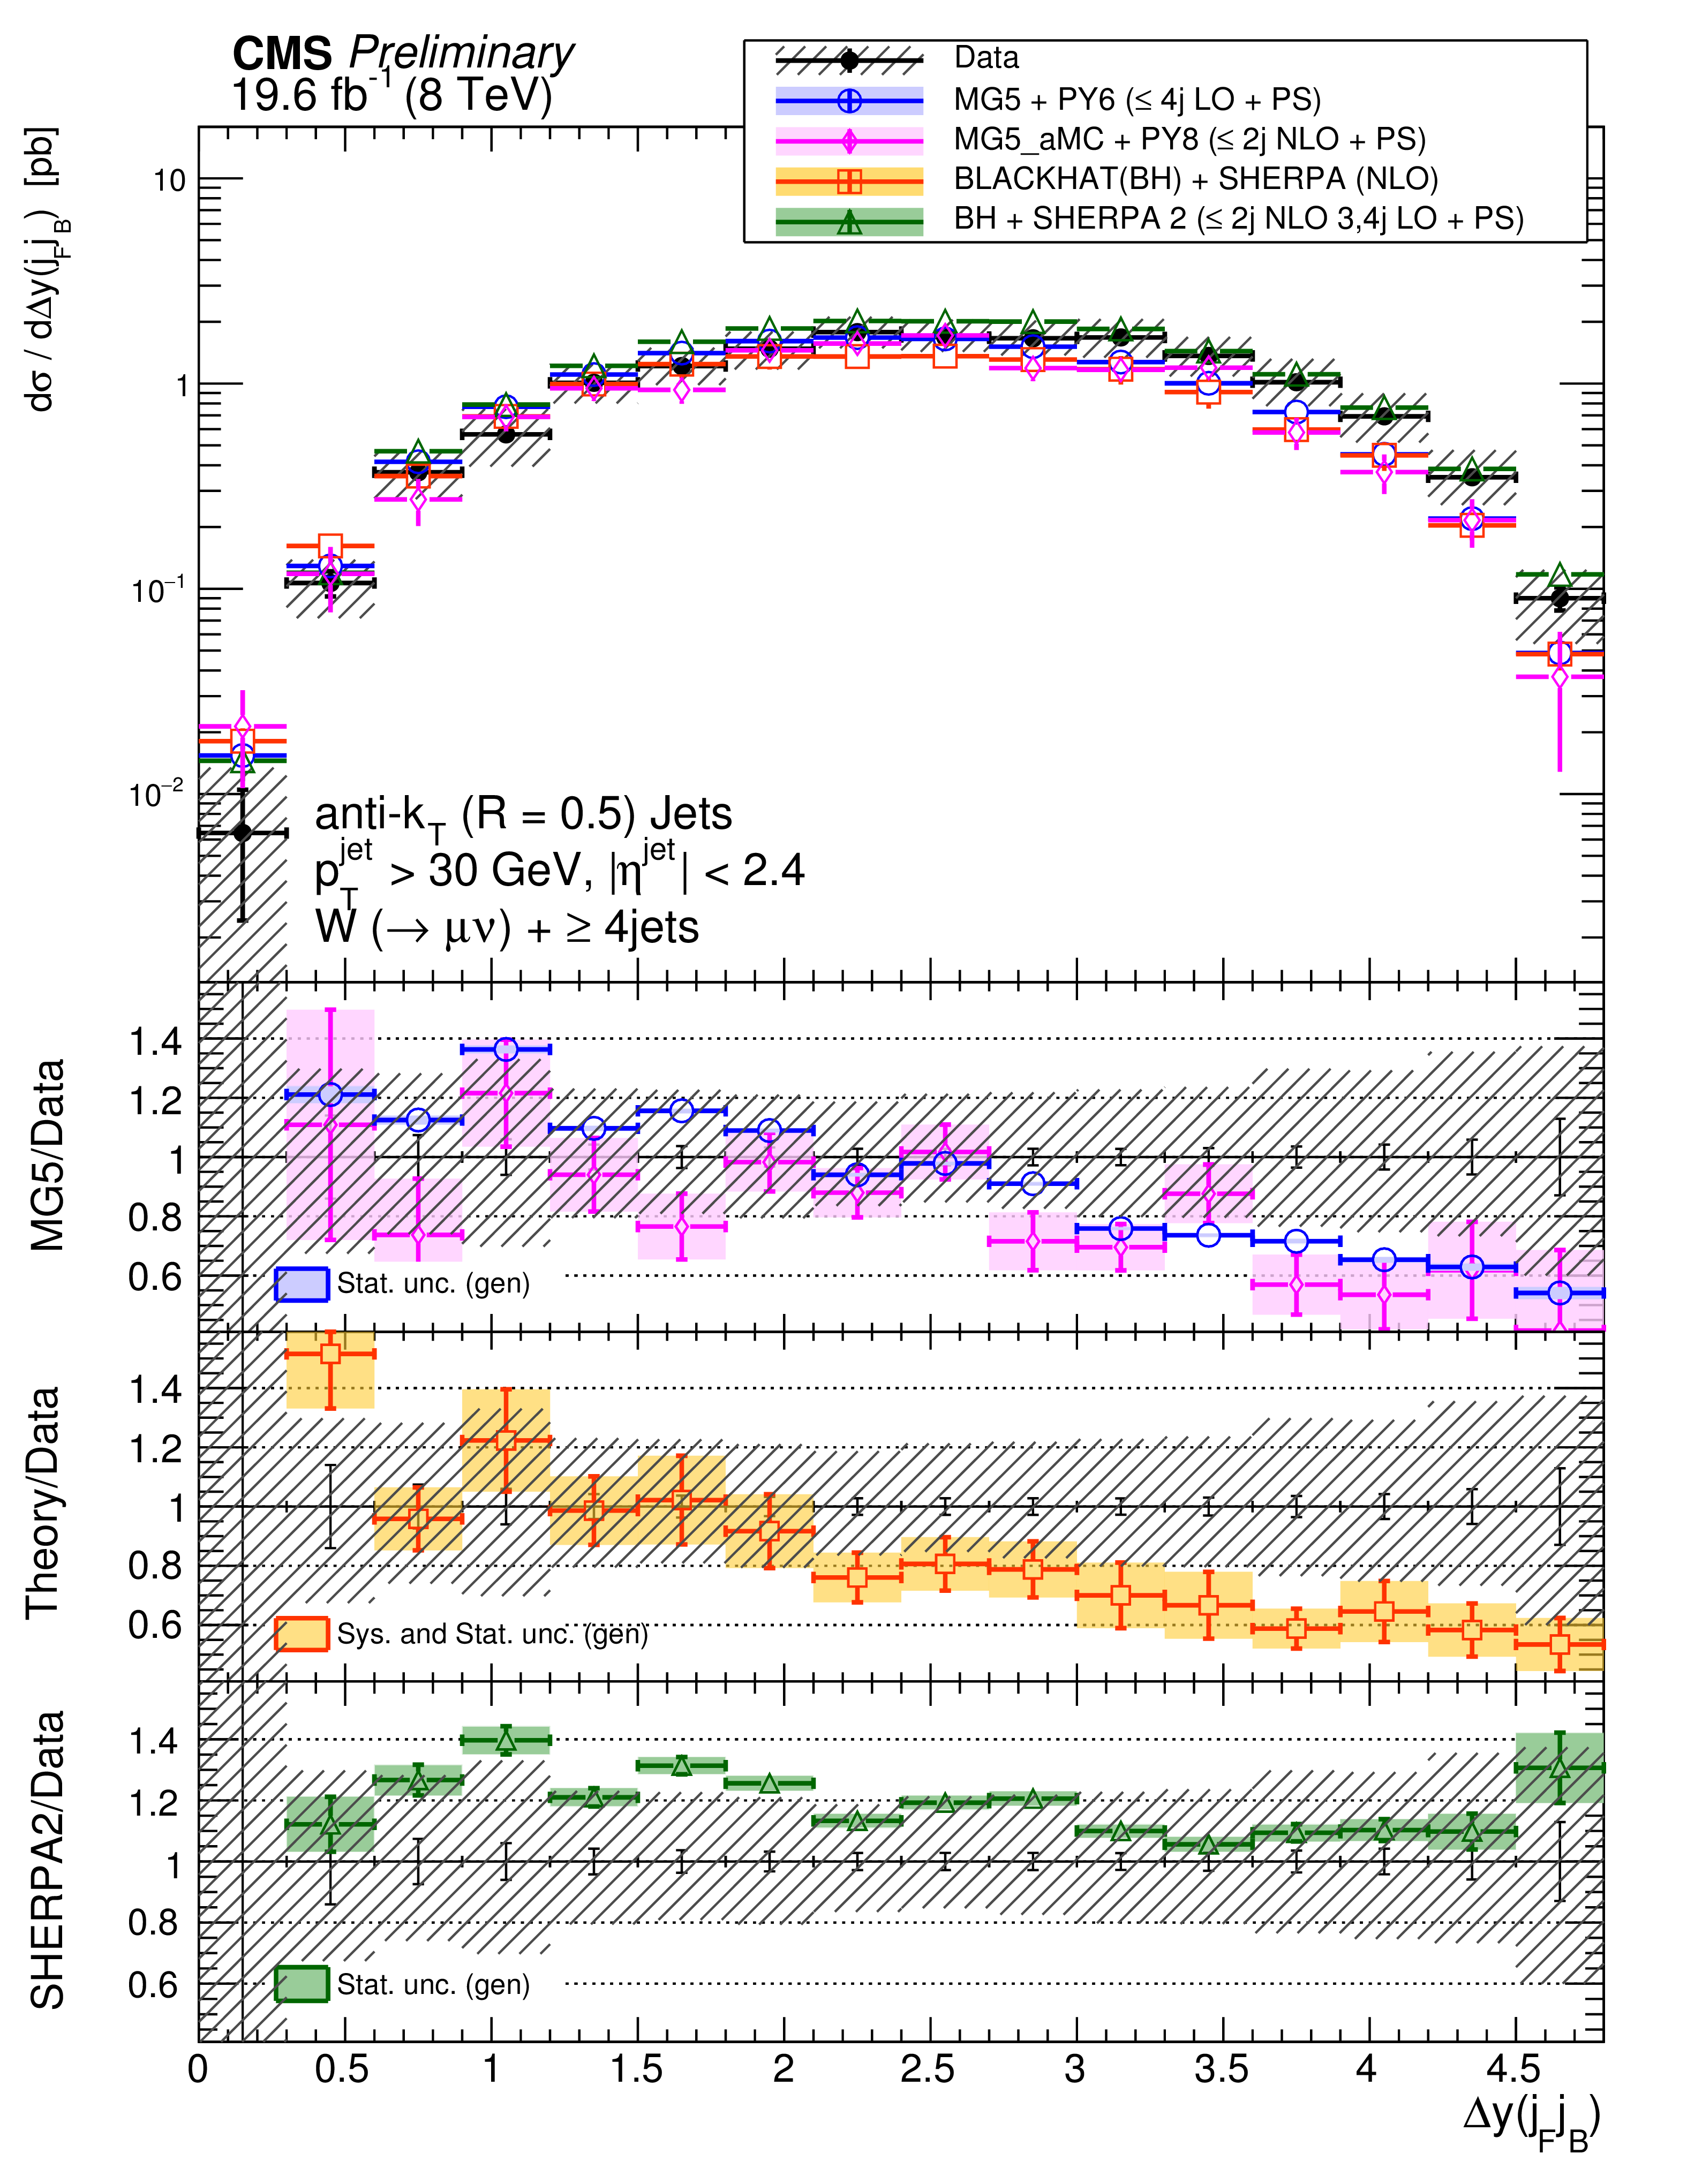
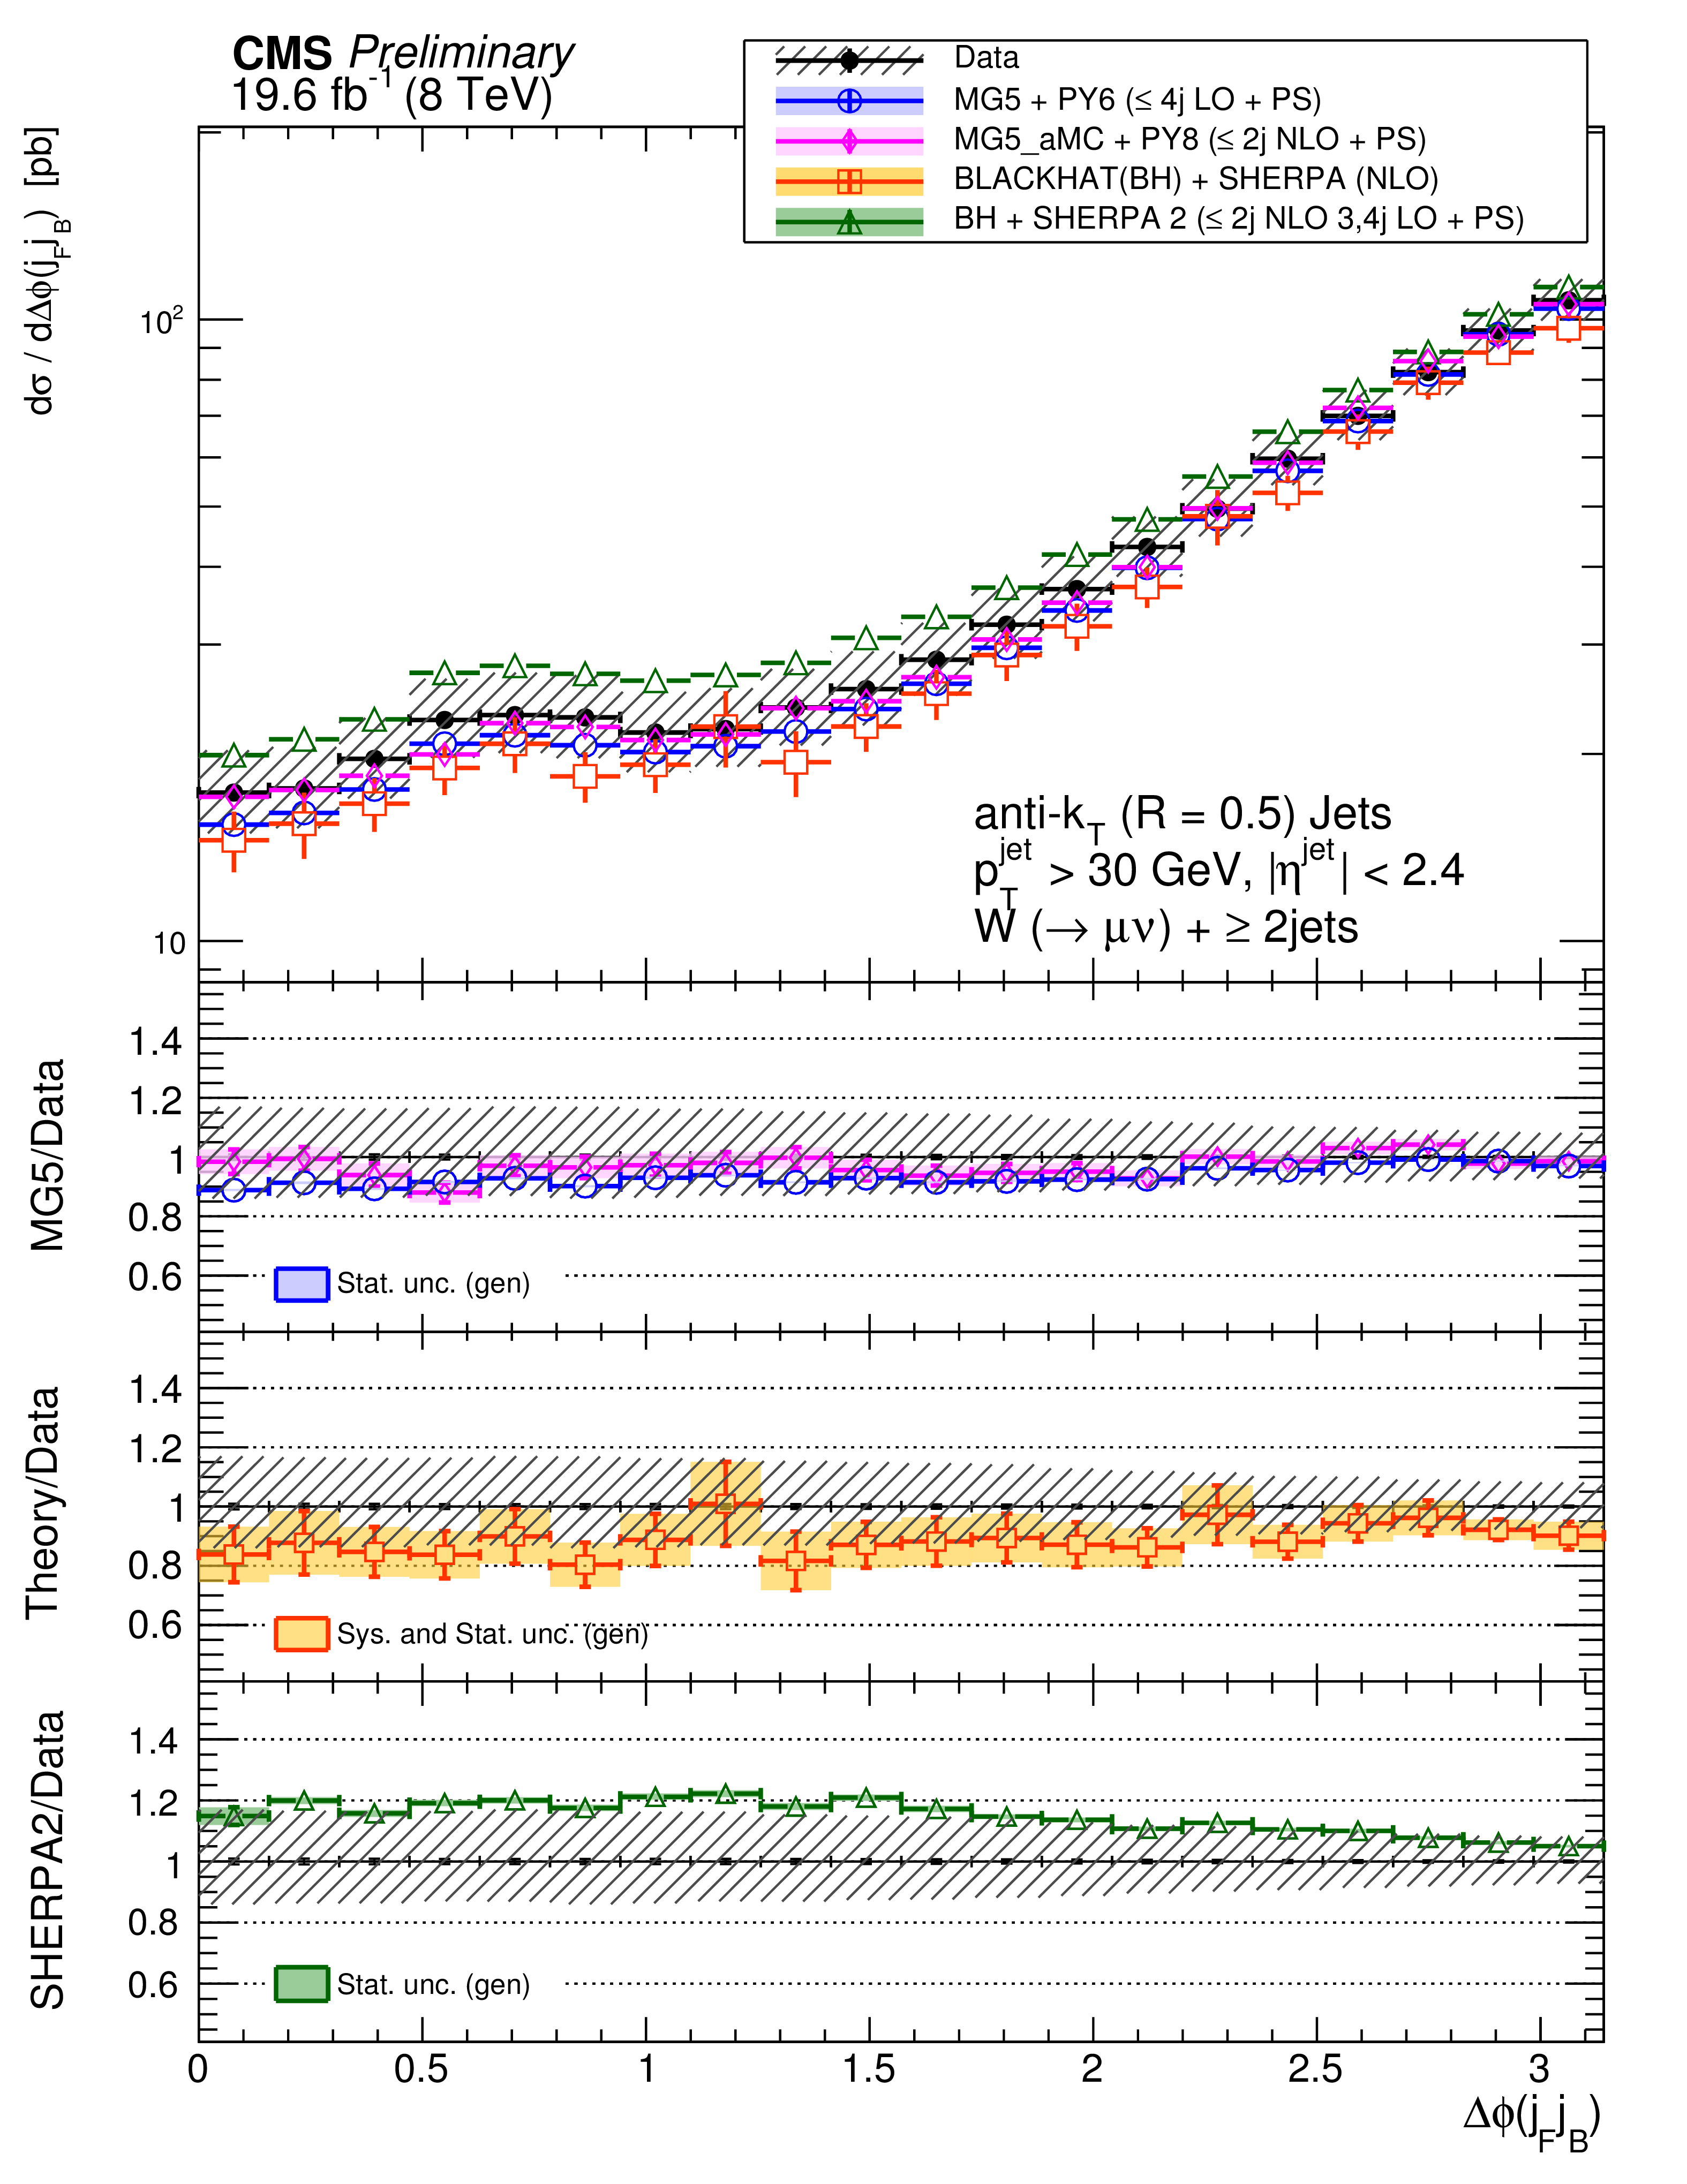
Figure 11-c:
The differential cross section measurement for $\Delta y(j_F,j_B)$ for inclusive jet multiplicities 2-4, compared to the prediction of MadGraph , MadGraph5$\_$aMC@NLO, SHERPA-2, and BLACKHAT+SHERPA (corrected for hadronization and multiple-parton interactions). Black circular markers with the grey hatched band represent the unfolded data measurement and its uncertainty. Overlaid are the predictions together with their statistical uncertainties (Theory stat.). The BLACKHAT+SHERPA uncertainty also contains theoretical systematic uncertainties (Theory syst.) described in Section 9. The lower plots show the ratio of each prediction to the unfolded data. |

png pdf |
Figure 12-a:
The differential cross section measurement for $\Delta \phi (j_1,j_2)$ and $\Delta \phi (j_F,j_B)$ for inclusive jet multiplicity of 2, compared to the prediction of MadGraph , MadGraph5$\_$aMC@NLO, SHERPA-2, and BLACKHAT+SHERPA (corrected for hadronization and multiple-parton interactions). Black circular markers with the grey hatched band represent the unfolded data measurement and its uncertainty. Overlaid are the predictions together with their statistical uncertainties (Theory stat.). The BLACKHAT+SHERPA uncertainty also contains theoretical systematic uncertainties (Theory syst.) described in Section 9. The lower plots show the ratio of each prediction to the unfolded data. |
png pdf |
Figure 12-b:
The differential cross section measurement for $\Delta \phi (j_1,j_2)$ and $\Delta \phi (j_F,j_B)$ for inclusive jet multiplicity of 2, compared to the prediction of MadGraph , MadGraph5$\_$aMC@NLO, SHERPA-2, and BLACKHAT+SHERPA (corrected for hadronization and multiple-parton interactions). Black circular markers with the grey hatched band represent the unfolded data measurement and its uncertainty. Overlaid are the predictions together with their statistical uncertainties (Theory stat.). The BLACKHAT+SHERPA uncertainty also contains theoretical systematic uncertainties (Theory syst.) described in Section 9. The lower plots show the ratio of each prediction to the unfolded data. |

png pdf |
Figure 13:
The differential cross section measurement for $\Delta R(j_{1},j_{2})$ for an inclusive jet multiplicity of 2, compared to the prediction of MadGraph , MadGraph5$\_$aMC@NLO, SHERPA-2, and BLACKHAT+SHERPA (corrected for hadronization and multiple-parton interactions). Black circular markers with the grey hatched band represent the unfolded data measurement and its uncertainty. Overlaid are the predictions together with their statistical uncertainties (Theory stat.). The BLACKHAT+SHERPA uncertainty also contains theoretical systematic uncertainties (Theory syst.) described in Section 9. The lower plots show the ratio of each prediction to the unfolded data. |
png pdf |
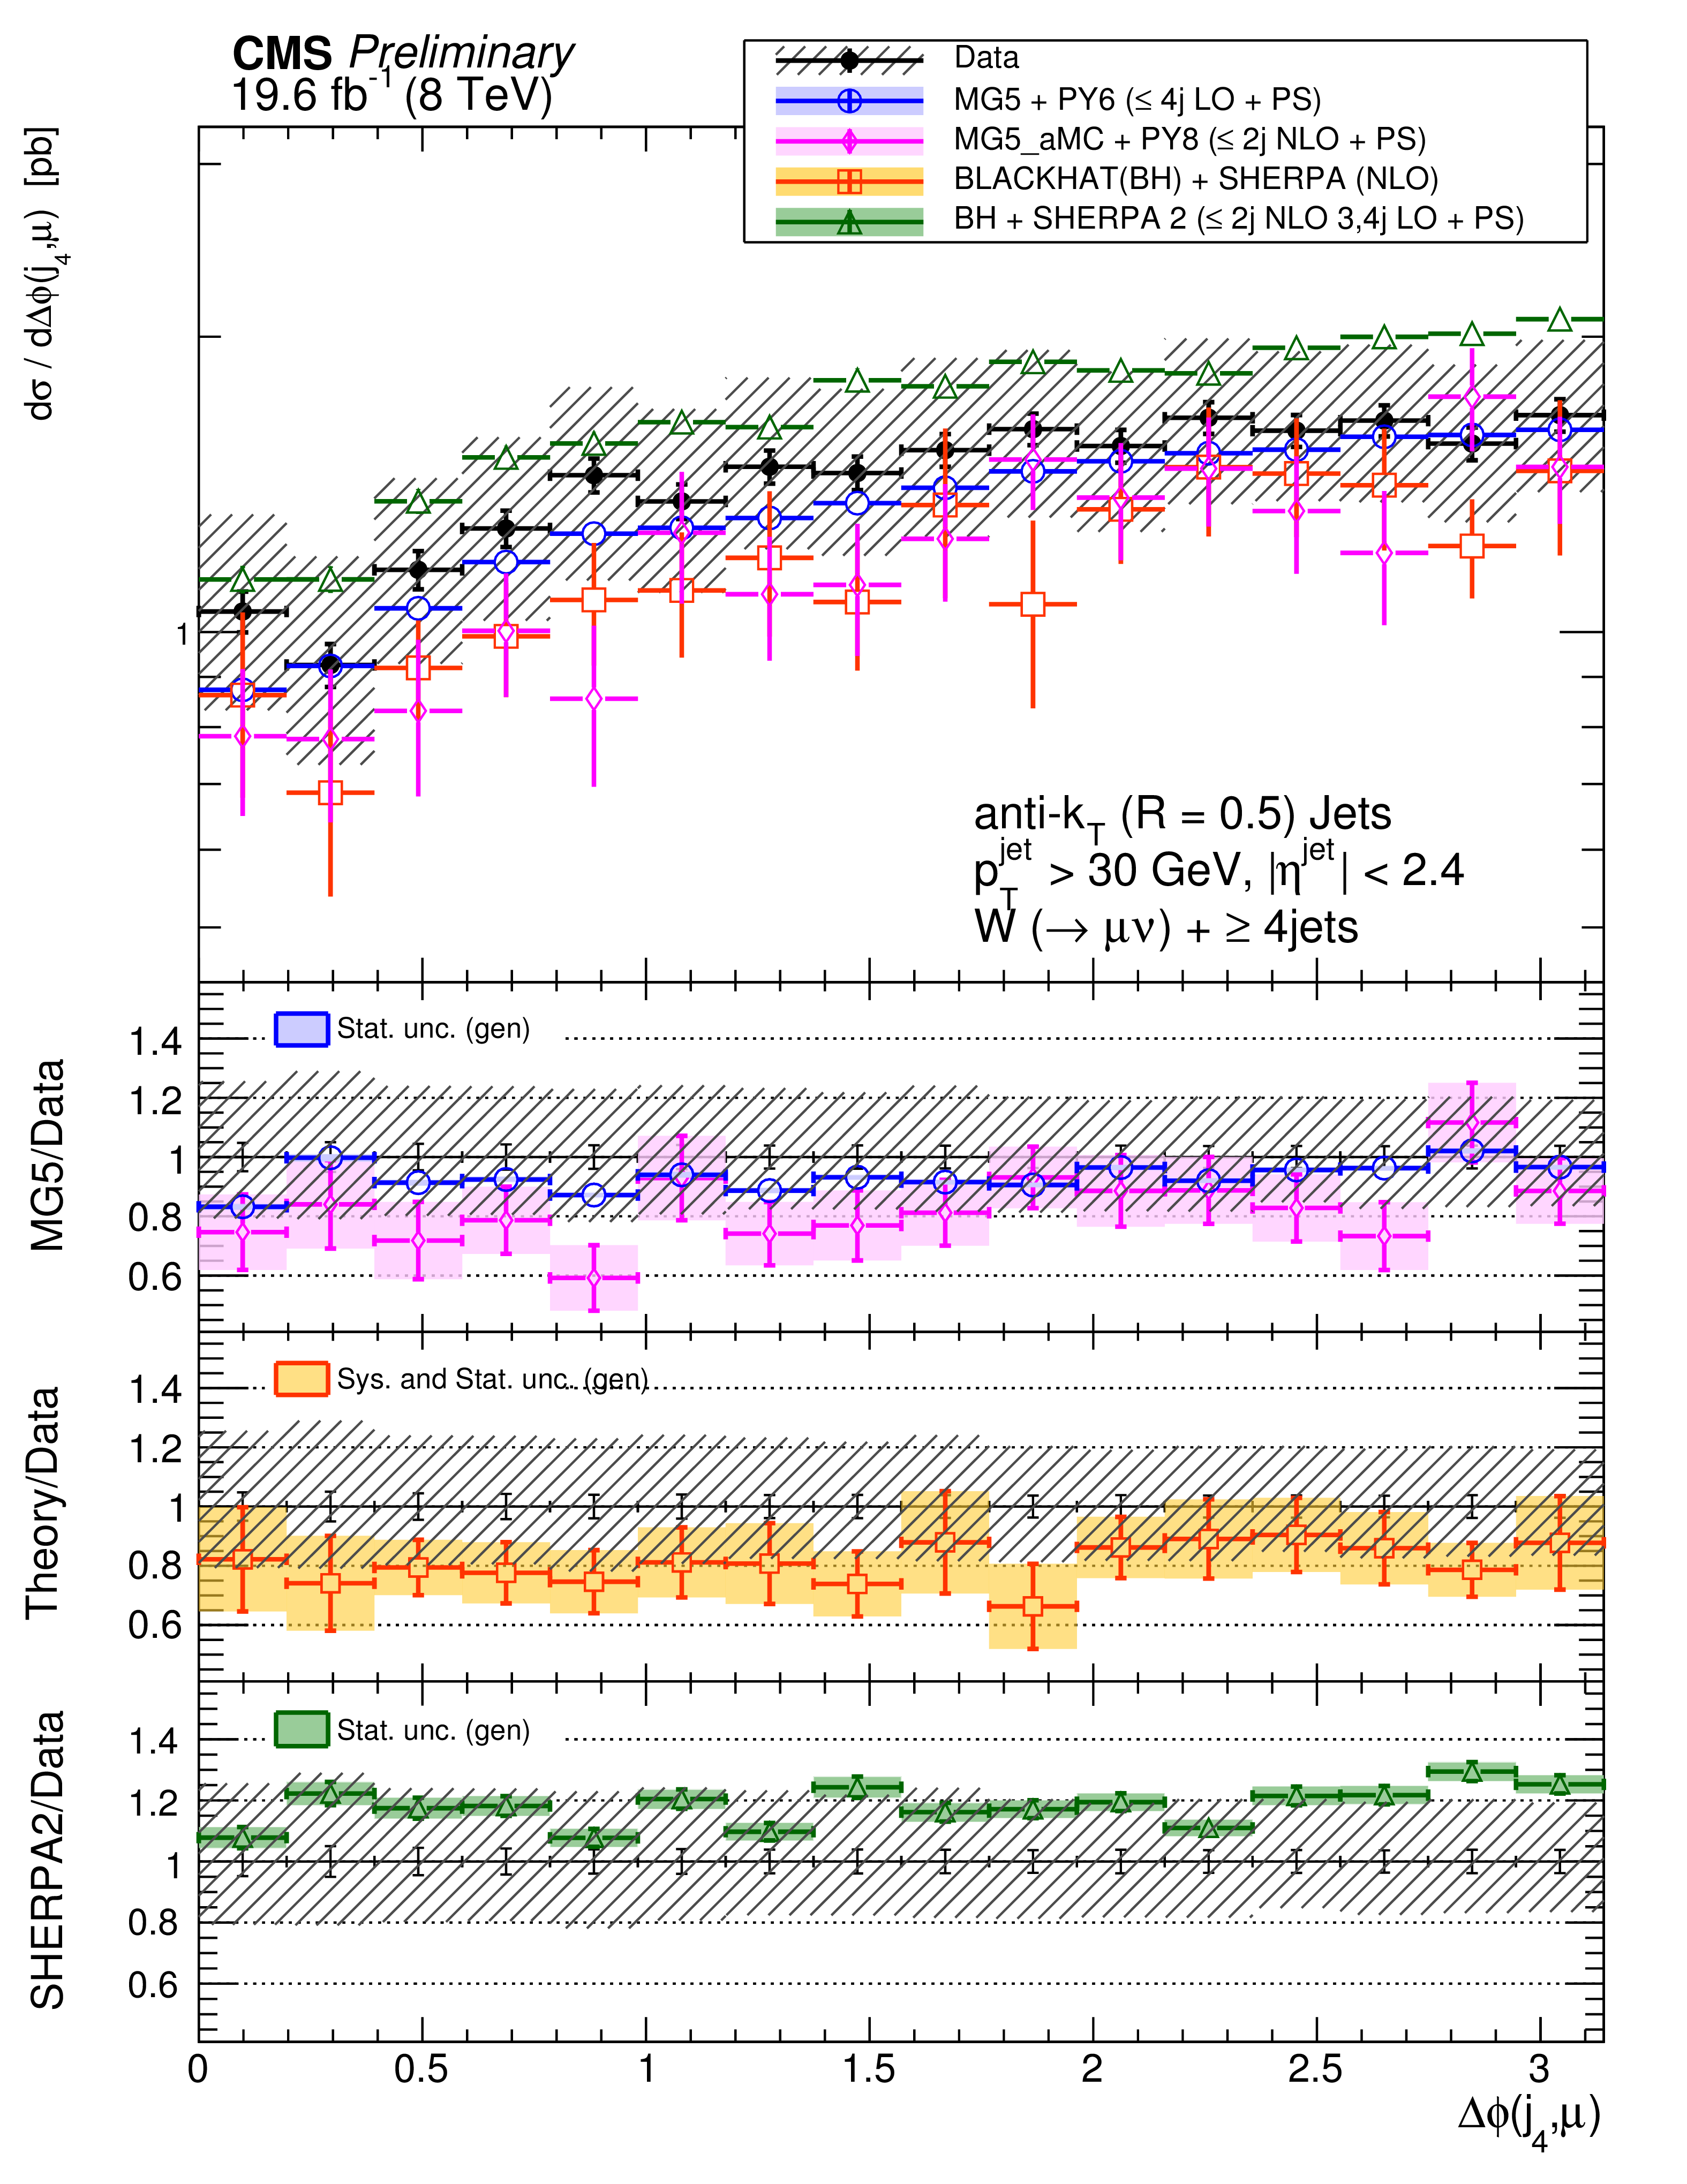
Figure 14-a:
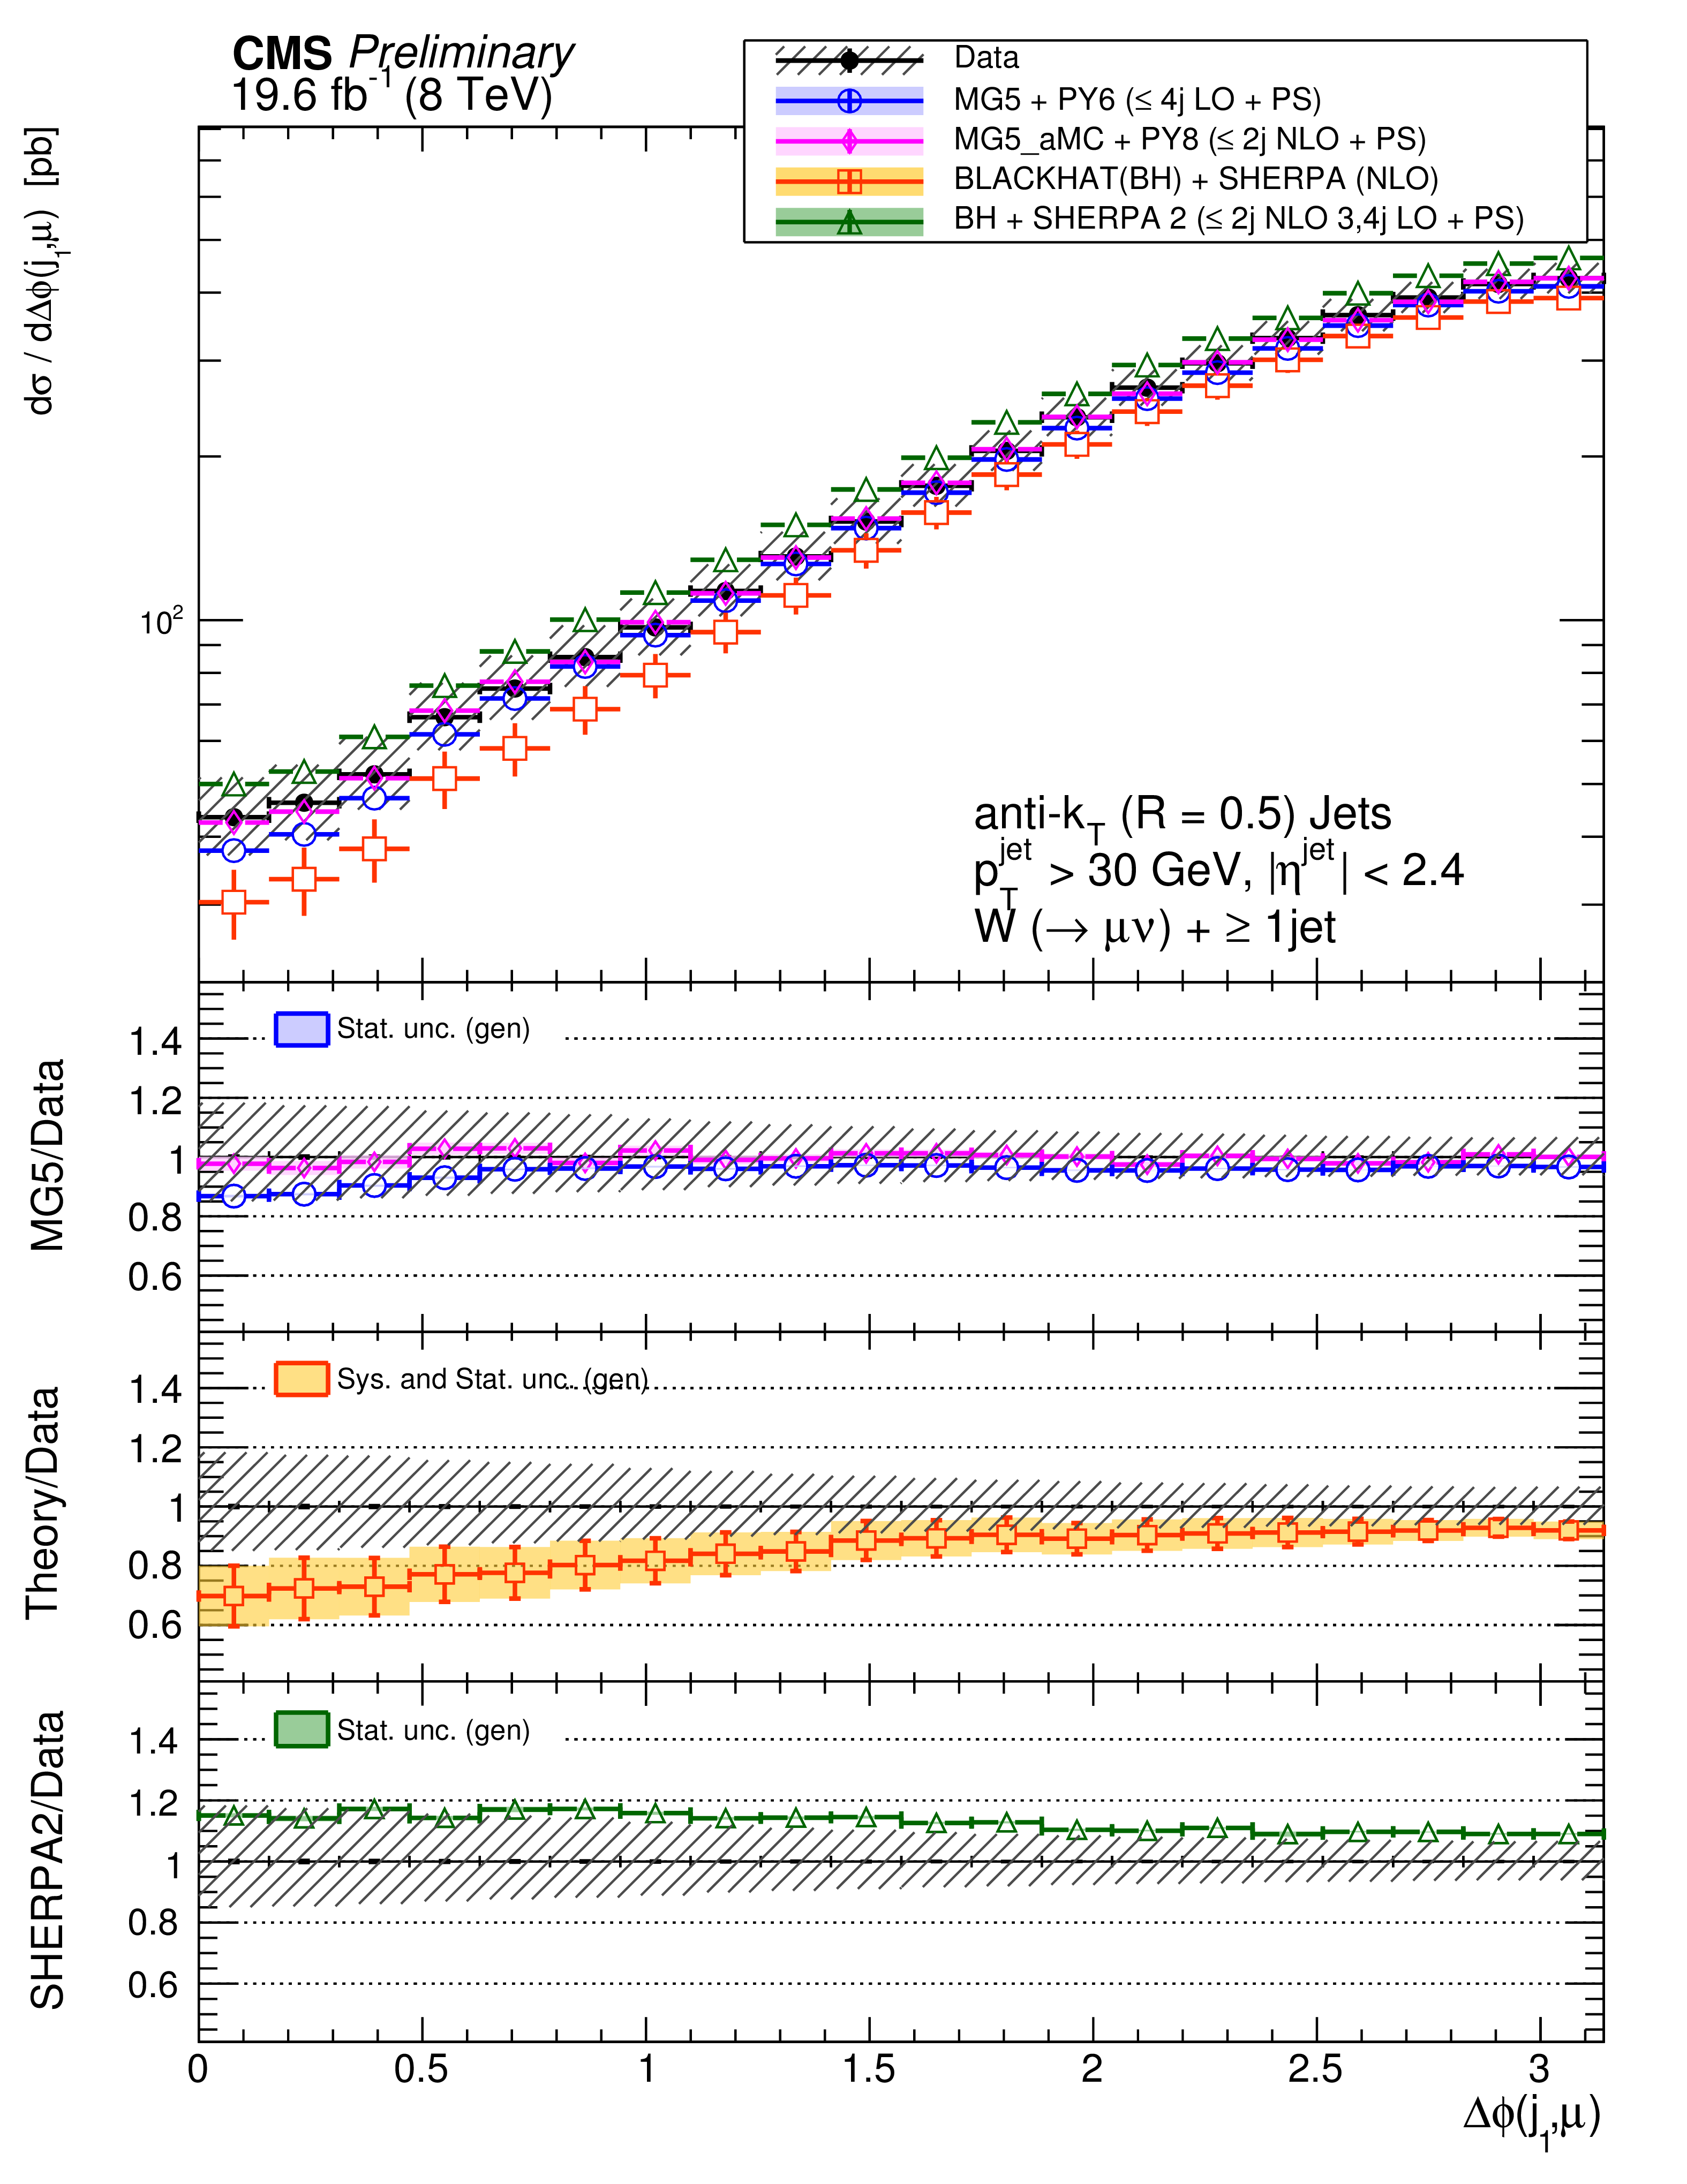
The differential cross section measurement for $\Delta \phi (j_{n},\mu )$ for inclusive jet multiplicities of n = 1-4, compared to the prediction of MadGraph ,MadGraph5$\_$aMC@NLO, SHERPA-2, and BLACKHAT+SHERPA (corrected for hadronization and multiple-parton interactions). Black circular markers with the grey hatched band represent the unfolded data measurement and its uncertainty. Overlaid are the predictions together with their statistical uncertainties (Theory stat.). The BLACKHAT+SHERPA uncertainty also contains theoretical systematic uncertainties (Theory syst.) described in Section 9. The lower plots show the ratio of each prediction to the unfolded data. |
png pdf |
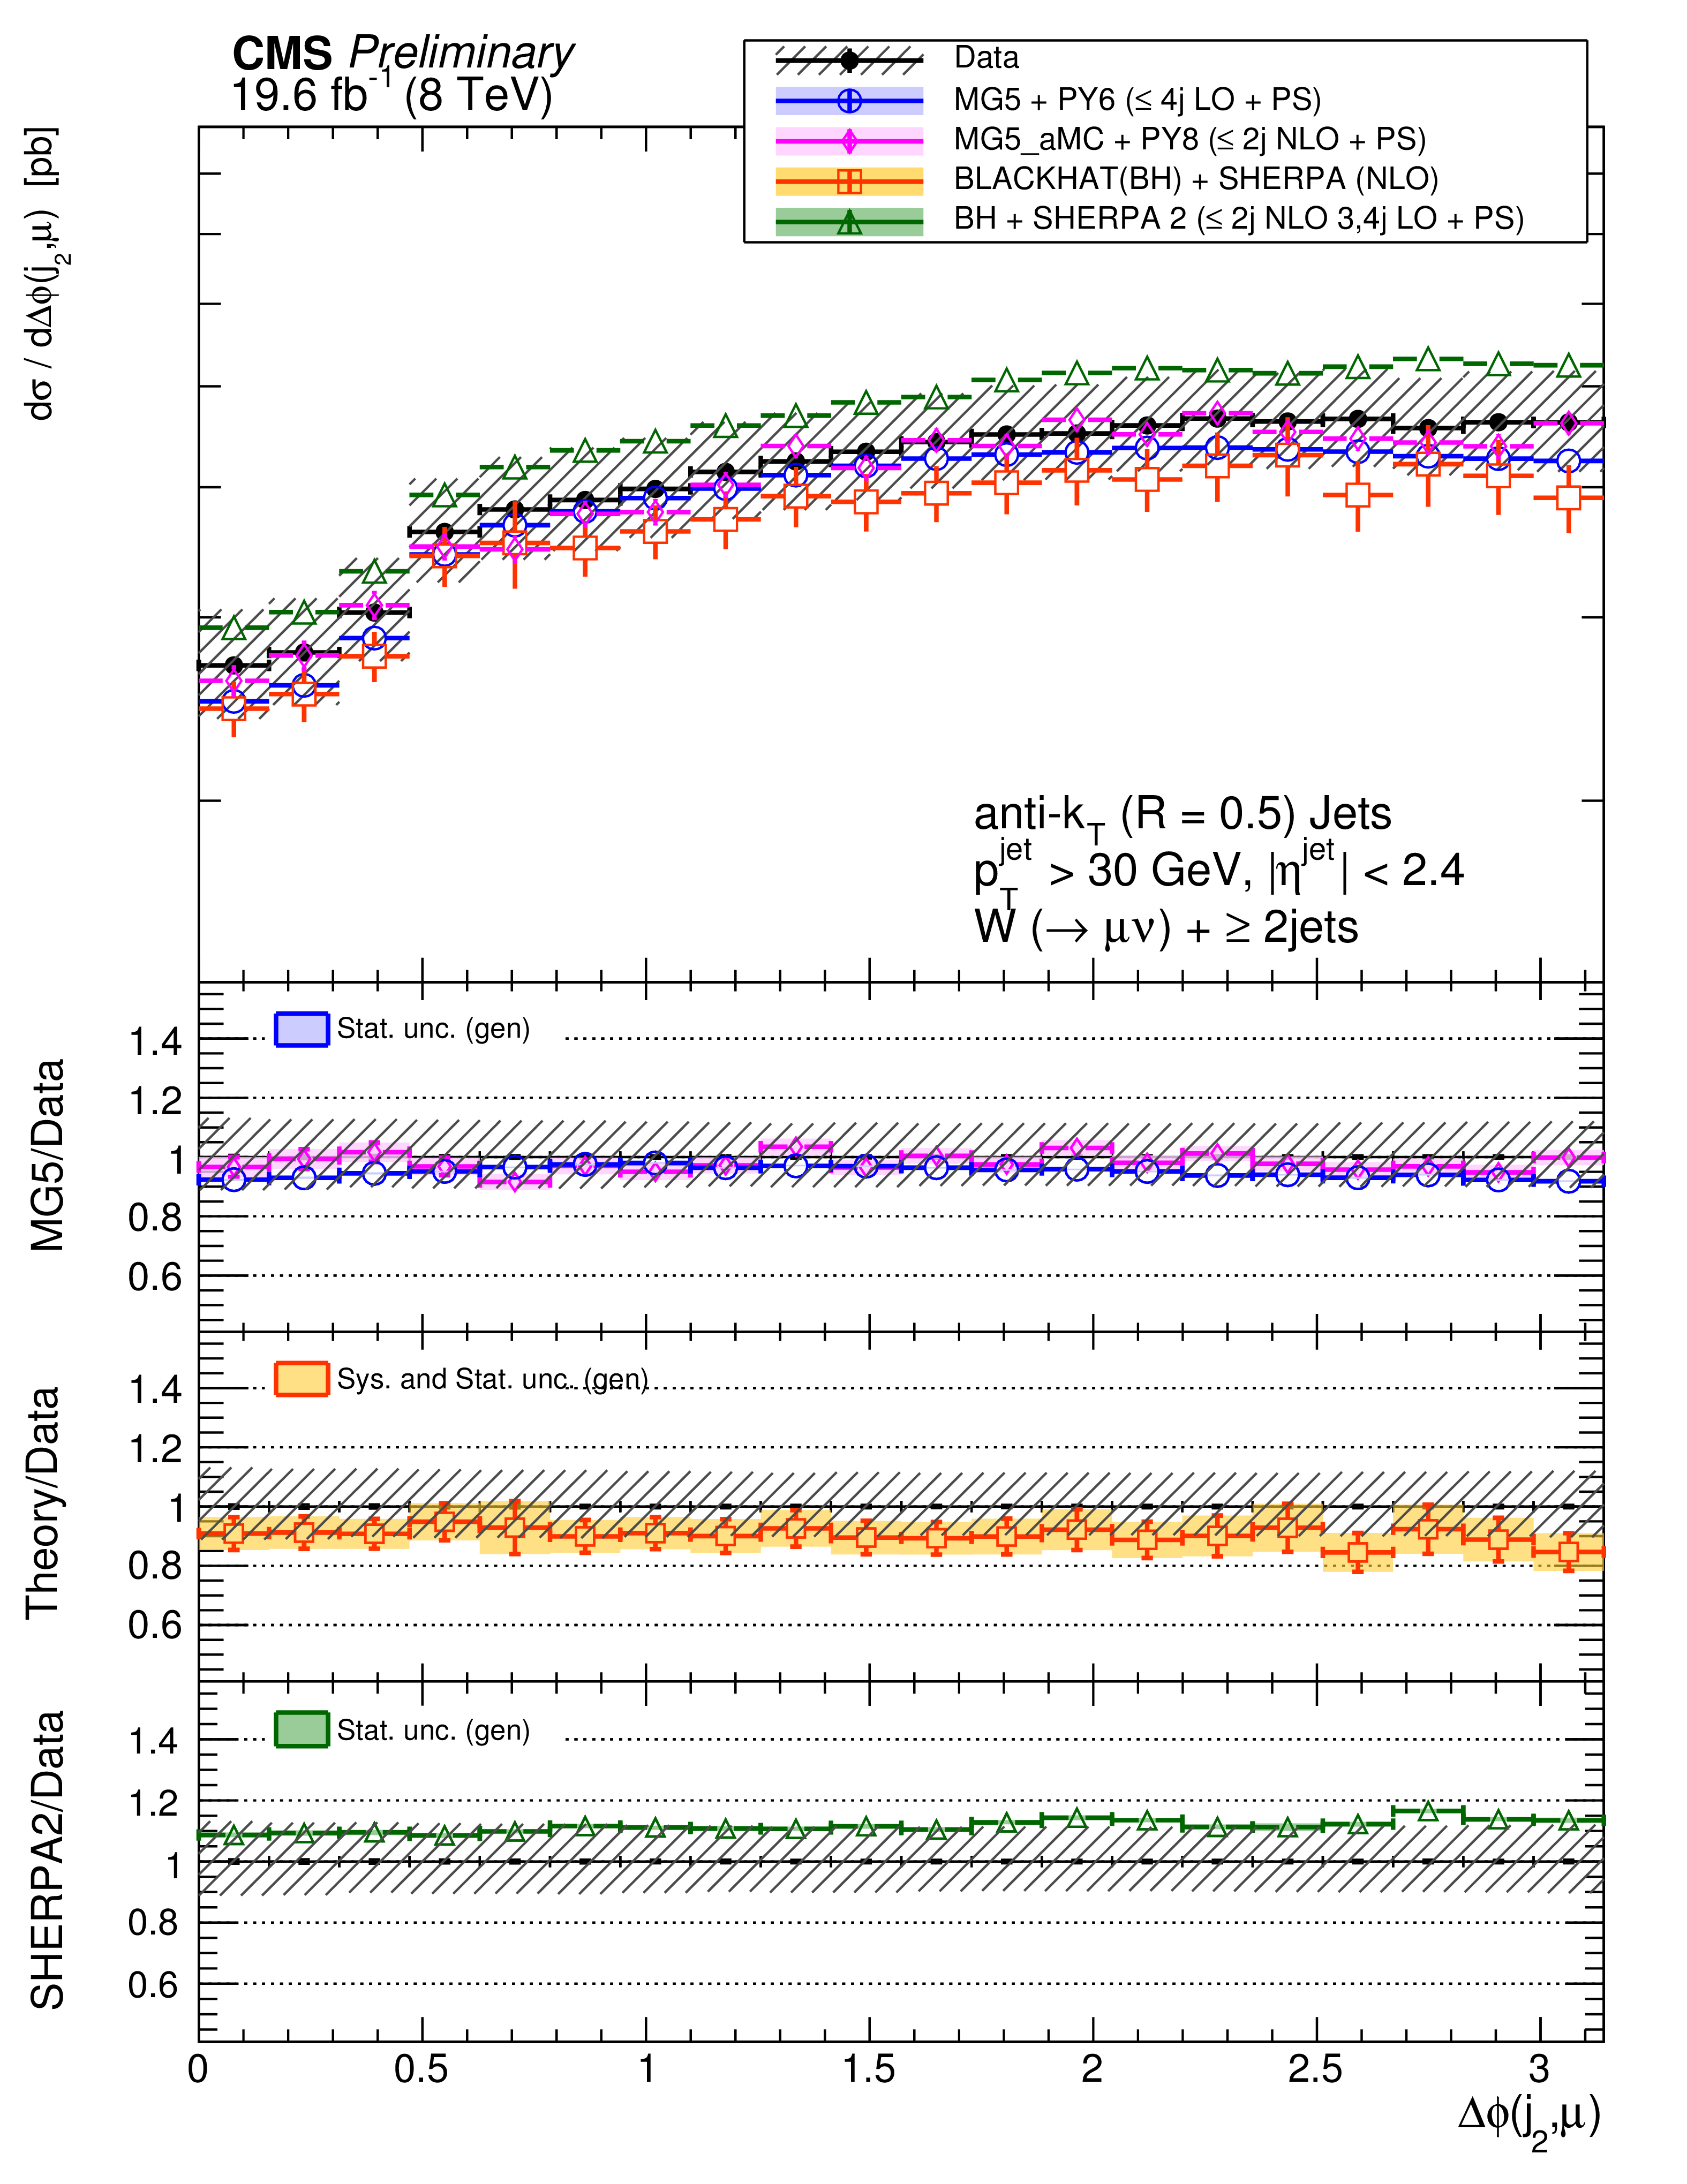
Figure 14-b:
The differential cross section measurement for $\Delta \phi (j_{n},\mu )$ for inclusive jet multiplicities of n = 1-4, compared to the prediction of MadGraph ,MadGraph5$\_$aMC@NLO, SHERPA-2, and BLACKHAT+SHERPA (corrected for hadronization and multiple-parton interactions). Black circular markers with the grey hatched band represent the unfolded data measurement and its uncertainty. Overlaid are the predictions together with their statistical uncertainties (Theory stat.). The BLACKHAT+SHERPA uncertainty also contains theoretical systematic uncertainties (Theory syst.) described in Section 9. The lower plots show the ratio of each prediction to the unfolded data. |
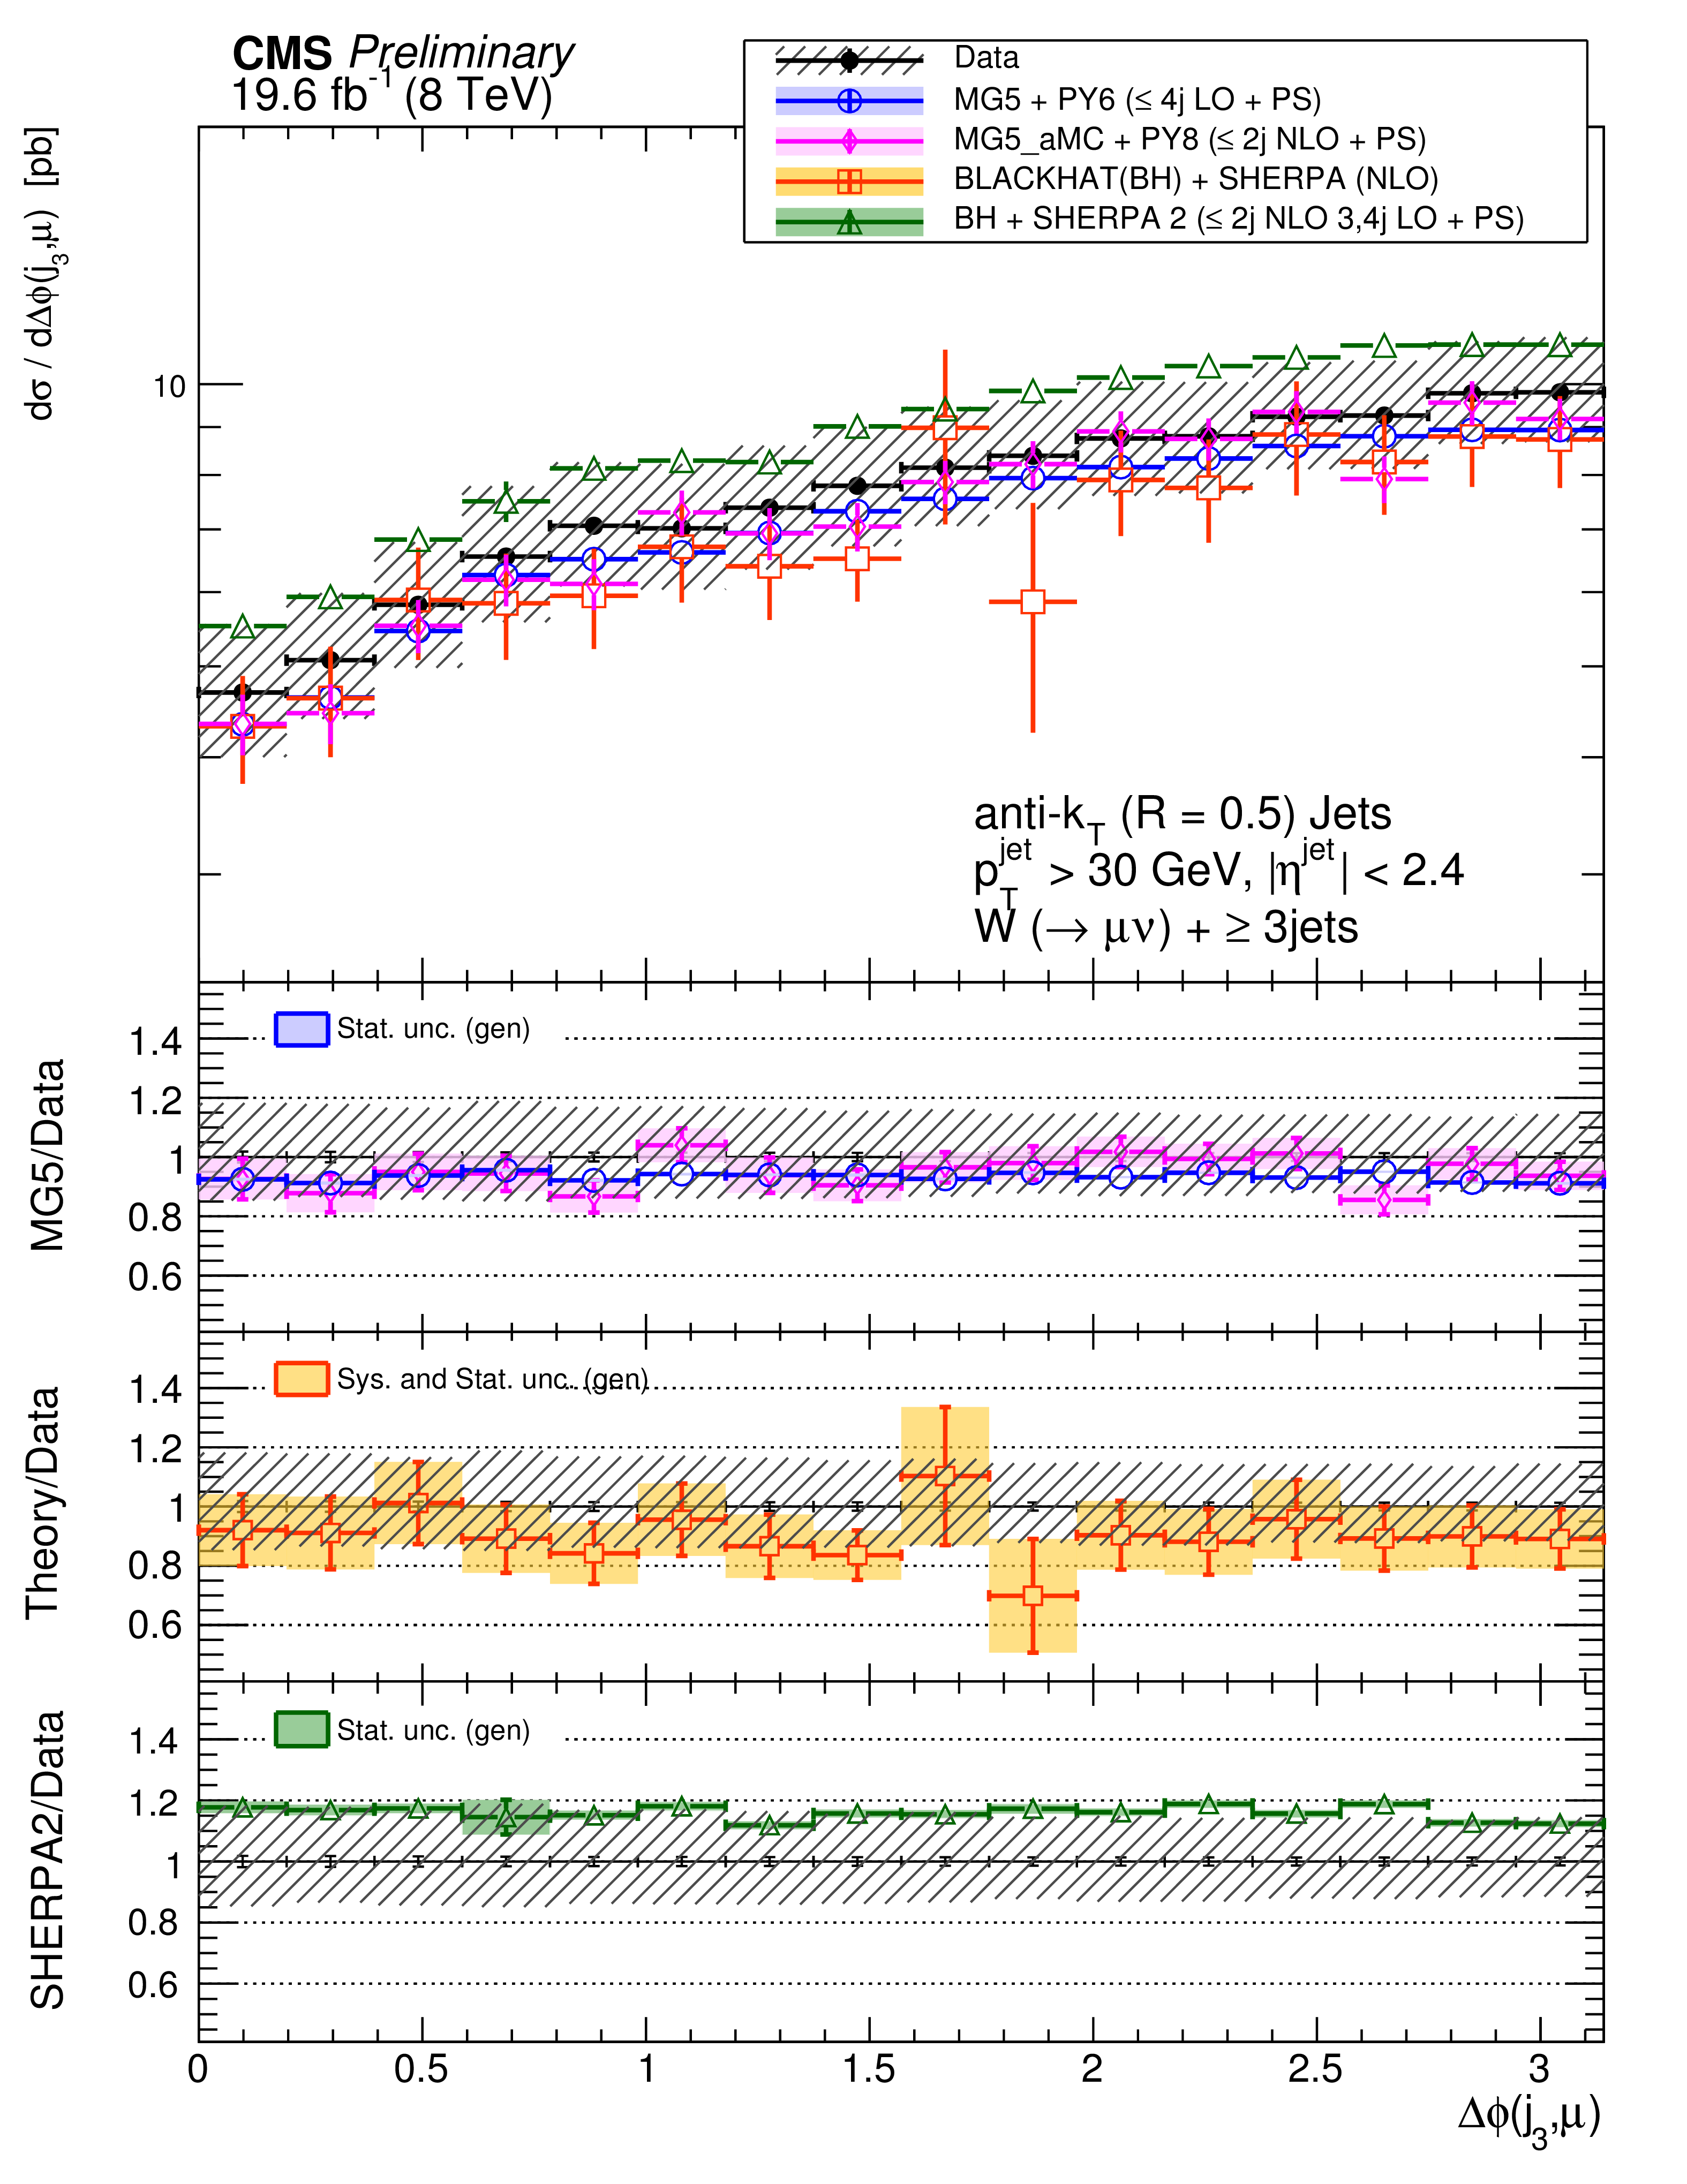
png pdf |
Figure 14-c:
The differential cross section measurement for $\Delta \phi (j_{n},\mu )$ for inclusive jet multiplicities of n = 1-4, compared to the prediction of MadGraph ,MadGraph5$\_$aMC@NLO, SHERPA-2, and BLACKHAT+SHERPA (corrected for hadronization and multiple-parton interactions). Black circular markers with the grey hatched band represent the unfolded data measurement and its uncertainty. Overlaid are the predictions together with their statistical uncertainties (Theory stat.). The BLACKHAT+SHERPA uncertainty also contains theoretical systematic uncertainties (Theory syst.) described in Section 9. The lower plots show the ratio of each prediction to the unfolded data. |
png pdf |
Figure 14-d:
The differential cross section measurement for $\Delta \phi (j_{n},\mu )$ for inclusive jet multiplicities of n = 1-4, compared to the prediction of MadGraph ,MadGraph5$\_$aMC@NLO, SHERPA-2, and BLACKHAT+SHERPA (corrected for hadronization and multiple-parton interactions). Black circular markers with the grey hatched band represent the unfolded data measurement and its uncertainty. Overlaid are the predictions together with their statistical uncertainties (Theory stat.). The BLACKHAT+SHERPA uncertainty also contains theoretical systematic uncertainties (Theory syst.) described in Section 9. The lower plots show the ratio of each prediction to the unfolded data. |
png pdf |
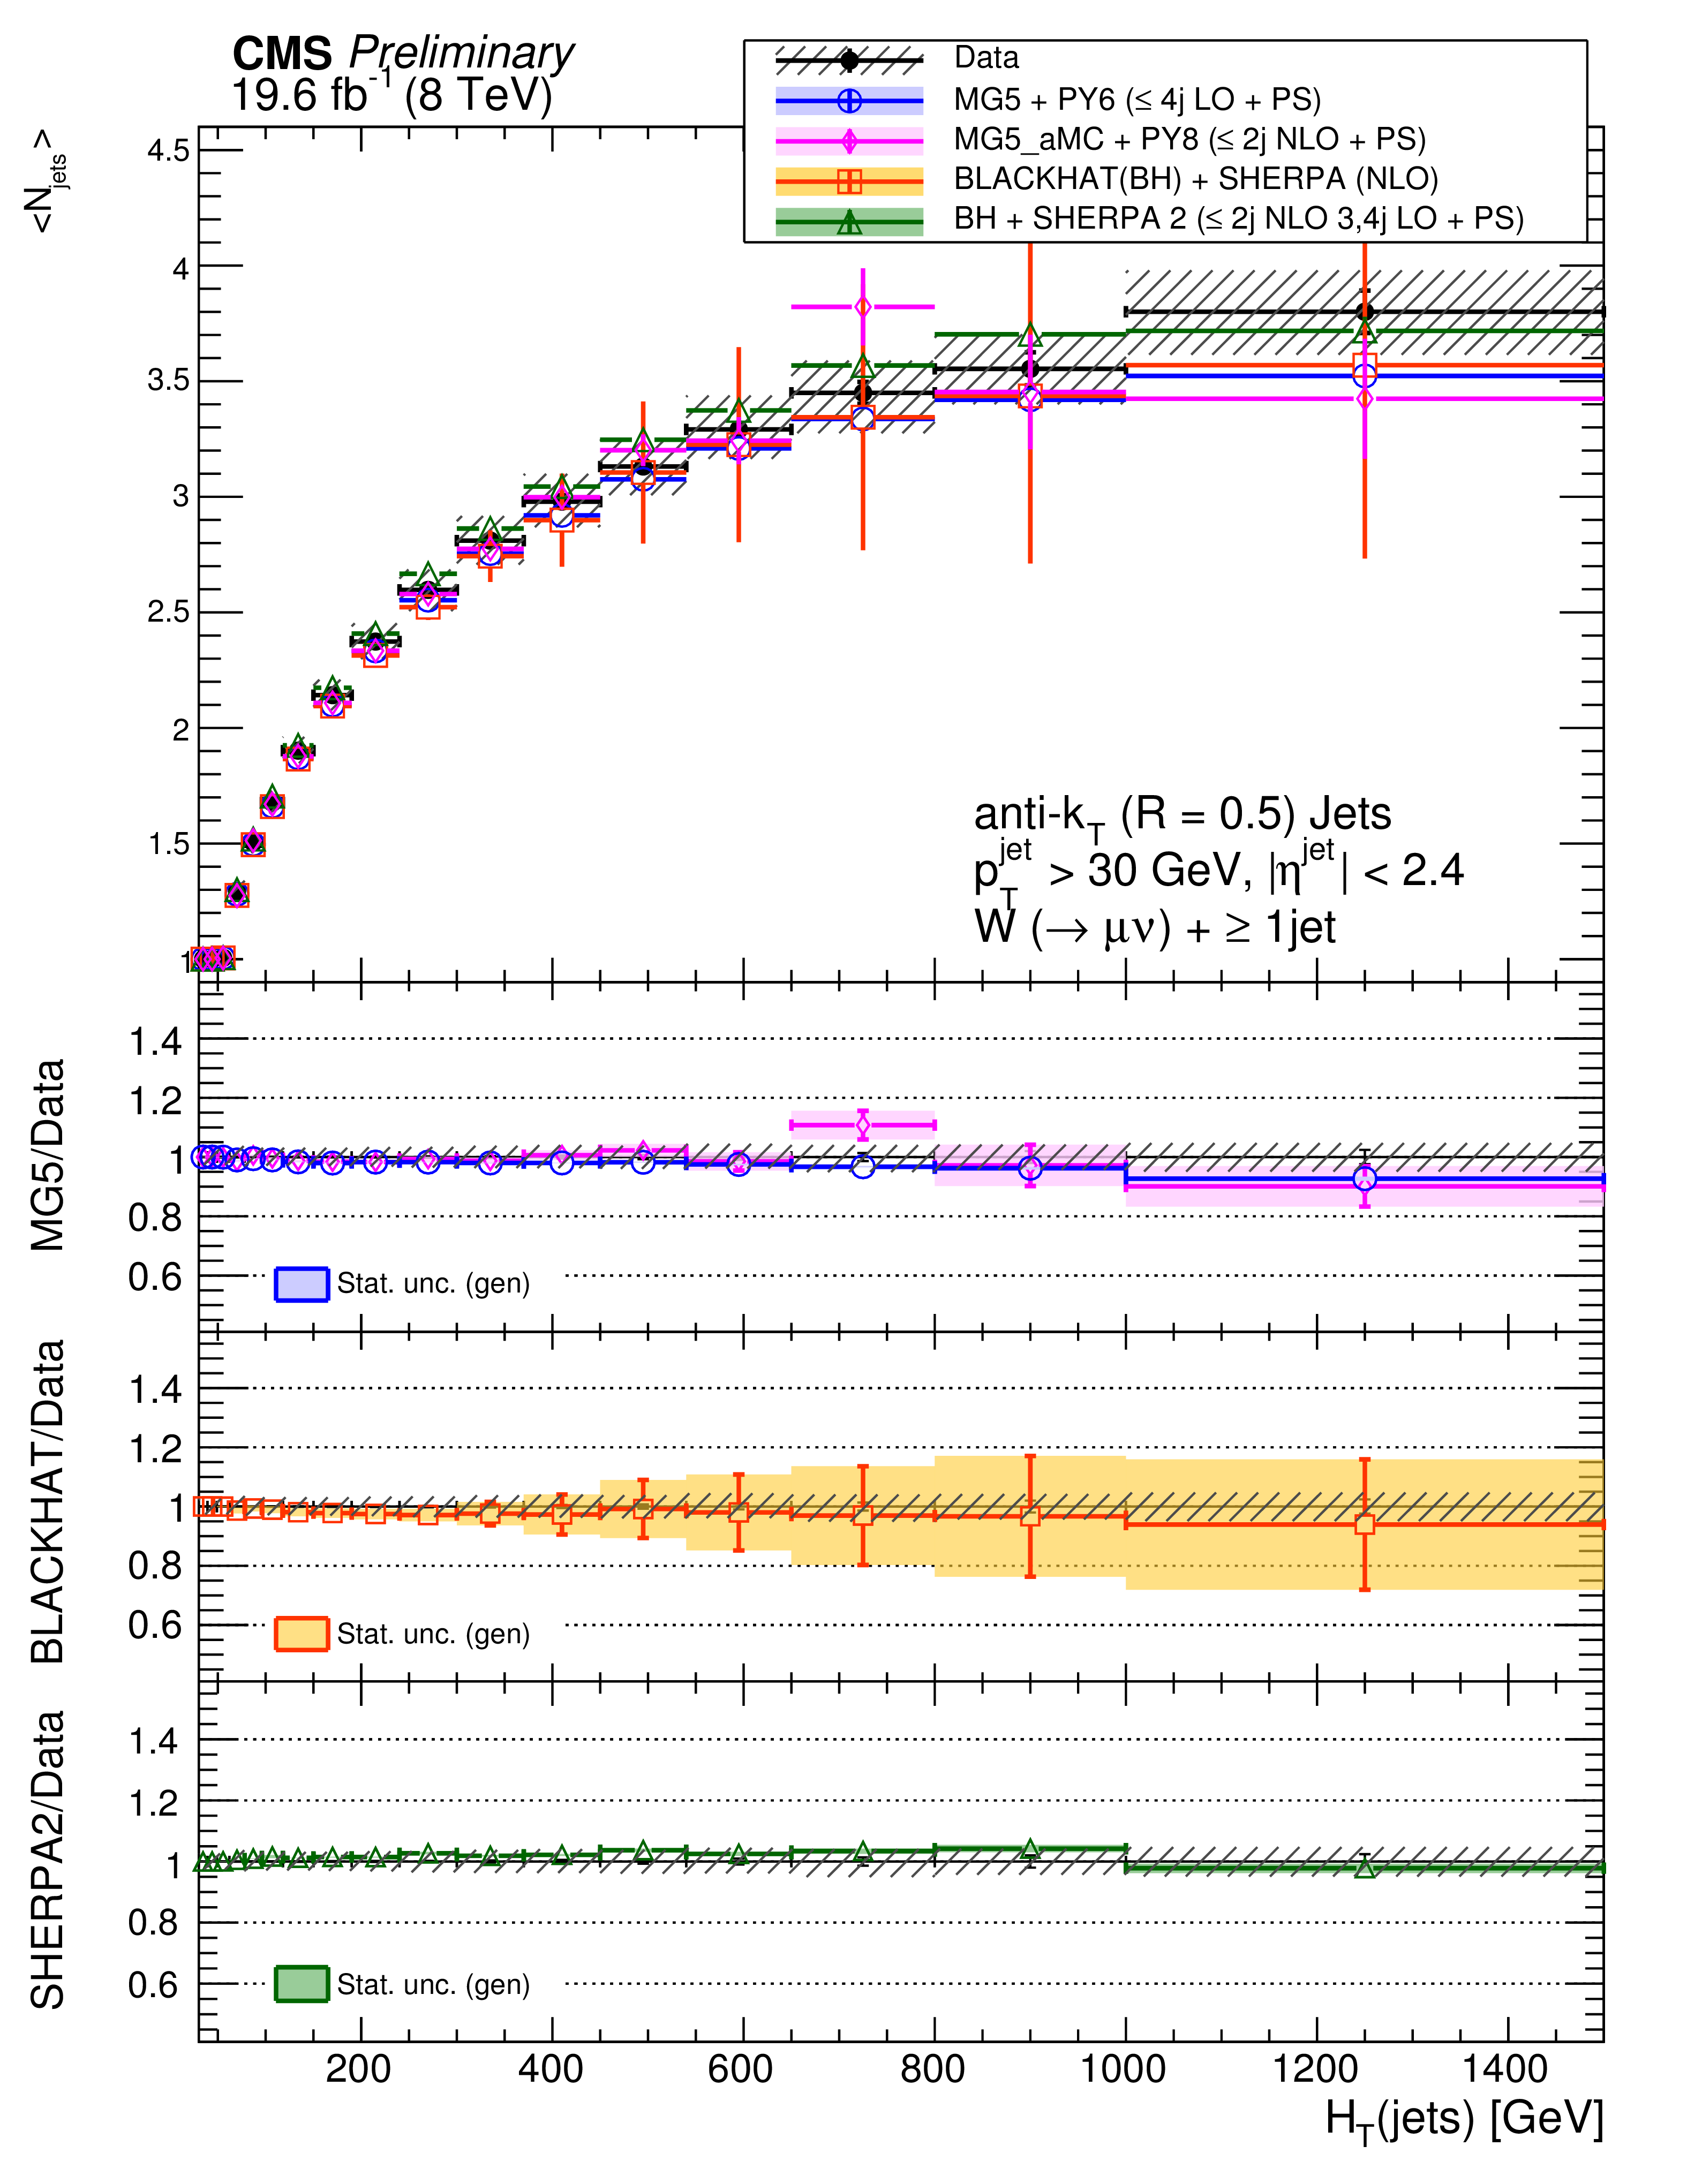
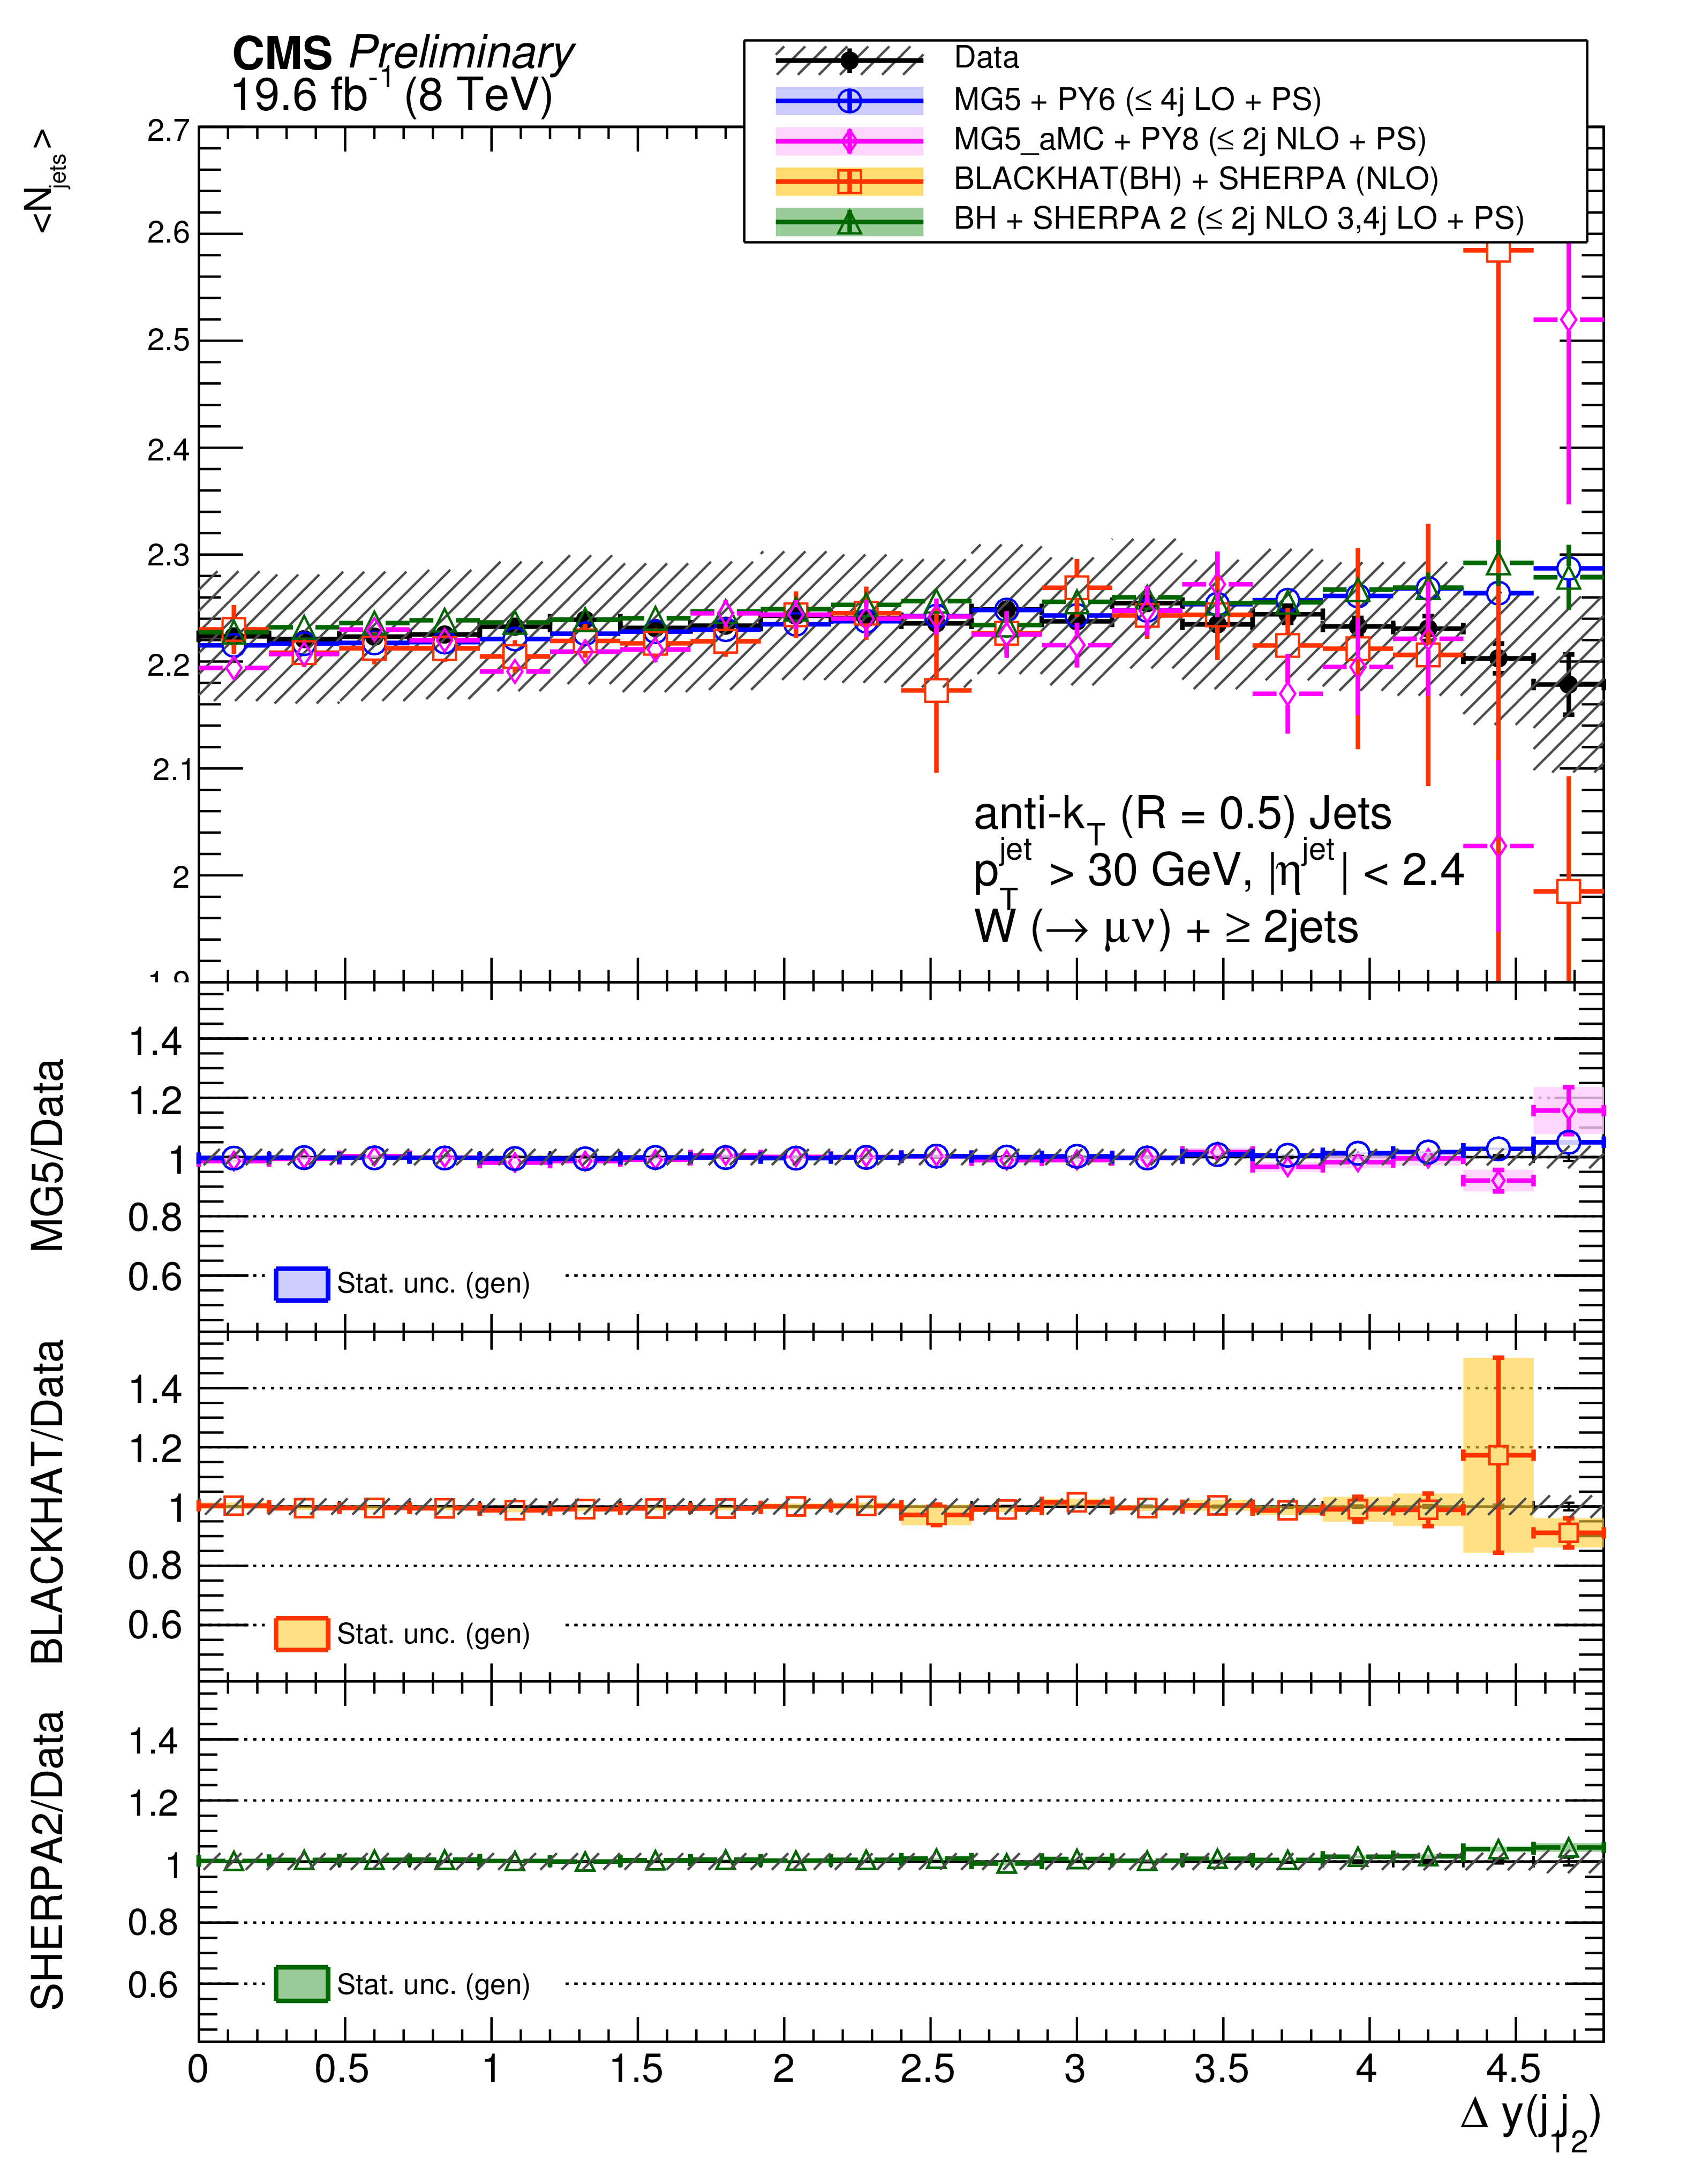
Figure 15-a:
The measurement of the mean number of jets as a function of $ {H_{\mathrm {T}}} $ for inclusive jet multiplicities 1-2, and as a function of $\Delta y(j_1,j_2)$, and of $\Delta y(j_F,j_B)$ for an inclusive jet multiplicity of 2, compared to the prediction of MadGraph , SHERPA-2, and BLACKHAT+SHERPA (corrected for hadronization and multiple-parton interactions). Black circular markers with the grey hatched band represent the unfolded data measurement and its uncertainty. Overlaid are the predictions together with their statistical uncertainties (Theory stat.). The BLACKHAT+SHERPA uncertainty also contains theoretical systematic uncertainties (Theory syst.) described in Section 9. The lower plots show the ratio of each prediction to the unfolded data. |

png pdf |
Figure 15-b:
The measurement of the mean number of jets as a function of $ {H_{\mathrm {T}}} $ for inclusive jet multiplicities 1-2, and as a function of $\Delta y(j_1,j_2)$, and of $\Delta y(j_F,j_B)$ for an inclusive jet multiplicity of 2, compared to the prediction of MadGraph , SHERPA-2, and BLACKHAT+SHERPA (corrected for hadronization and multiple-parton interactions). Black circular markers with the grey hatched band represent the unfolded data measurement and its uncertainty. Overlaid are the predictions together with their statistical uncertainties (Theory stat.). The BLACKHAT+SHERPA uncertainty also contains theoretical systematic uncertainties (Theory syst.) described in Section 9. The lower plots show the ratio of each prediction to the unfolded data. |
png pdf |
Figure 15-c:
The measurement of the mean number of jets as a function of $ {H_{\mathrm {T}}} $ for inclusive jet multiplicities 1-2, and as a function of $\Delta y(j_1,j_2)$, and of $\Delta y(j_F,j_B)$ for an inclusive jet multiplicity of 2, compared to the prediction of MadGraph , SHERPA-2, and BLACKHAT+SHERPA (corrected for hadronization and multiple-parton interactions). Black circular markers with the grey hatched band represent the unfolded data measurement and its uncertainty. Overlaid are the predictions together with their statistical uncertainties (Theory stat.). The BLACKHAT+SHERPA uncertainty also contains theoretical systematic uncertainties (Theory syst.) described in Section 9. The lower plots show the ratio of each prediction to the unfolded data. |

png pdf |
Figure 15-d:
The measurement of the mean number of jets as a function of $ {H_{\mathrm {T}}} $ for inclusive jet multiplicities 1-2, and as a function of $\Delta y(j_1,j_2)$, and of $\Delta y(j_F,j_B)$ for an inclusive jet multiplicity of 2, compared to the prediction of MadGraph , SHERPA-2, and BLACKHAT+SHERPA (corrected for hadronization and multiple-parton interactions). Black circular markers with the grey hatched band represent the unfolded data measurement and its uncertainty. Overlaid are the predictions together with their statistical uncertainties (Theory stat.). The BLACKHAT+SHERPA uncertainty also contains theoretical systematic uncertainties (Theory syst.) described in Section 9. The lower plots show the ratio of each prediction to the unfolded data. |
| Tables | |
png pdf |
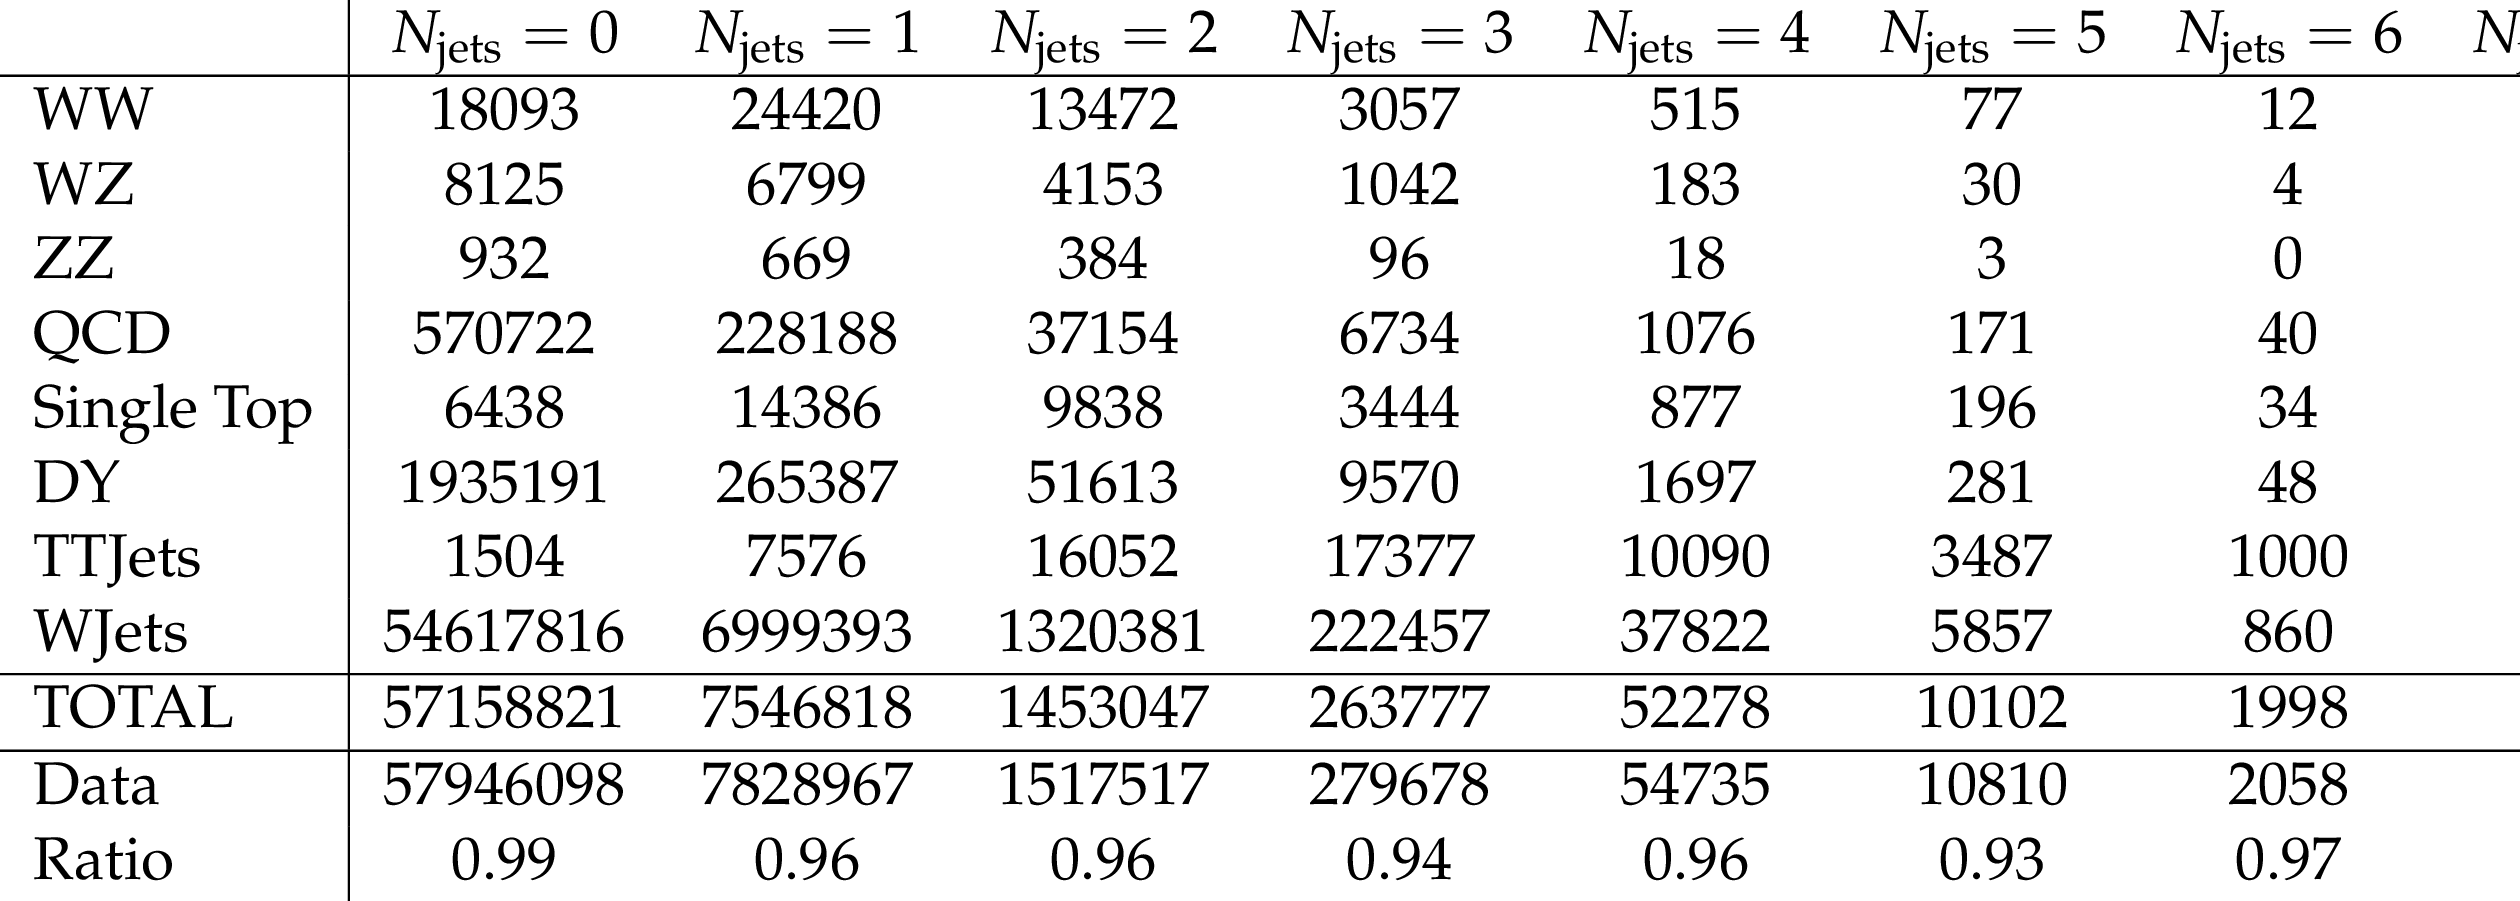
Table 1:
Number of events in data and simulation as a function of exclusive jet multiplicity. |
| Summary |
|
Measurements of the cross sections and differential cross sections for a $\mathrm{ W }$ boson produced in association with jets in pp collisions at a centre-of-mass energy of 8 TeV were presented. The data correspond to an integrated luminosity of 19.6 fb$^{-1}$ and were collected with the CMS detector during the 2012 proton-proton run of the LHC. Cross sections determined using the muon decay mode of the W boson were presented as functions of the jet multiplicity, the $p_{\mathrm{T}}$ and pseudorapidities of the four leading jets, the $H_{\mathrm{T}}$ for jet multiplicities up to four, and the dijet $p_{\mathrm{T}}$ and invariant mass. Cross sections were also presented as a function of several angular correlation variables: rapidity separation, azimuthal angle separation and $\Delta R$ separation among $p_{\mathrm{T}}$-ordered and rapidity-ordered jets, and azimuthal angle separation between the muon and the leading jet. The distribution of the mean number of jets as a function of $H_{\mathrm{T}}$ and rapidity differences among jets were examined. The results were corrected for all detector effects by means of regularised unfolding and compared with particle-level simulated predictions at LO (MADGRAPH+PYTHIA), NLO (SHERPA-2, MadGraph5$\_$aMC@NLO, and BLACKHAT+ sherpa) and NNLO. The predictions generally describe the jet multiplicity within the uncertainties, with increasing deviations observed in SHERPA-2 for jet multiplicities beyond four, where four corresponds to the number of partons included at CMS in the matrix element calculation for those generators. The cross sections as a function of the $p_{\mathrm{T}}$ of the leading, second-, and third-leading jets are overestimated by MADGRAPH+PYTHIA in a region of intermediate $p_{\mathrm{T}}$, and by SHERPA-2 at low-$p_{\mathrm{T}}$. The cross sections as a function of $p_{\mathrm{T}}$ predicted by BLACKHAT+ sherpa agree with the measurements within uncertainties. The predictions from MadGraph5$\_$aMC@NLO are very similar to the predictions of MADGRAPH+PYTHIA for most distributions. The predictions from BLACKHAT+ sherpa underestimate the measurement of the cross section as a function of $H_{\mathrm{T}}$ for $N_\text{jet} \geq 1$, since the contribution from $\mathrm{ W }$+$\geq$3 jets is missing from an NLO prediction of $\mathrm{ W }$+$\geq$1 jet. The cross sections as a function of $H_{\mathrm{T}}$ predicted by SHERPA-2 overestimate the measurement of the cross section, particularly at high $H_{\mathrm{T}}$. The jet $\abs{\eta}$ distribution shows some deviations for large values of $\abs{\eta}$ and the angular correlation distributions in rapidity difference show deviations for large opening angles. The distribution of the azimuthal angle between the muon and the leading jet is not well modelled by BLACKHAT+ sherpa for jet multiplicity of 1. The correlation distributions in azimuthal angle among jets agree with data, as do the mean number of jets distributions, both as a function of angular correlation variables and of $H_{\mathrm{T}}$. The NNLO predictions of $\mathrm{ W }$+1 jet were compared with the results of the leading jet $p_{\mathrm{T}}$, $H_{\mathrm{T}}$, and $\abs{\eta}$. They agree within uncertainties. |
| References | ||||
| 1 | J. Alwall et al. | MadGraph 5: going beyond | JHEP 06 (2011) 128 | 1106.0522 |
| 2 | T. Sjostrand, S. Mrenna, and P. Skands | PYTHIA 6.4 physics and manual | JHEP 05 (2006) 026 | hep-ph/0603175 |
| 3 | S. H\"oche, F. Krauss, M. Sch\"onherr, and F. Siegert | QCD matrix elements + parton showers: The NLO case | JHEP 1304 (2013) 027 | 1207.5030 |
| 4 | Z. Bern et al. | Ntuples for NLO events at hadron colliders | CPC 185 (2014) 1443 | 1310.7439 |
| 5 | R. Boughezal, C. Focke, X. Liu, and F. Petriello | $ W $-boson production in association with a jet at next-to-next-to-leading order in perturbative QCD | PRL 115 (2015) 062002 | 1504.02131 |
| 6 | CDF Collaboration | Measurement of the cross section for W-boson production in association with jets in p$ \overline{\text{p}} $ collisions at $ \sqrt{s} = 1.96 $ TeV | PRD 77 (2008) 011108 | 0711.4044 |
| 7 | D0 Collaboration | Measurements of inclusive $ \mathrm{ W } $+jets production rates as a function of jet transverse momentum in p$ \overline{\text{p}} $ collisions at $ \sqrt{s} = 1.96 $~TeV | PLB 705 (2011) 200 | 1106.1457 |
| 8 | D0 Collaboration | Studies of $ \mathrm{ W } $ boson plus jets production in p$ \overline{\text{p}} $ collisions at $ \sqrt{s} = 1.96 $~TeV | PRD 88 (2013) 092001 | 1302.6508 |
| 9 | ATLAS Collaboration | Measurements of the W production cross sections in association with jets with the ATLAS detector | EPJC 75 (2015) 82 | 1409.8639 |
| 10 | CMS Collaboration | Measurement of the Differential Cross Section of W-Bosons Produced in Association with Jets in pp collisions at $ \sqrt{s} $ = 7 TeV | PLB 741 (2015) 12 | CMS-SMP-12-023 1406.7533 |
| 11 | CMS Collaboration | The CMS experiment at the CERN LHC | JINST 3 (2008) S08004 | CMS-00-001 |
| 12 | GEANT4 Collaboration | GEANT4---a simulation toolkit | NIMA 506 (2003) 250 | |
| 13 | J. Pumplin et al. | New generation of parton distributions with uncertainties from global QCD analysis | JHEP 07 (2002) 012 | hep-ph/0201195 |
| 14 | K. Melnikov and F. Petriello | Electroweak gauge boson production at hadron colliders through O($ \alpha_{S}^2) $ | PRD 74 (2006) 114017 | hep-ph/0609070 |
| 15 | J. Alwall et al. | Comparative study of various algorithms for the merging of parton showers and matrix elements in hadronic collisions | EPJC 53 (2008) 473 | 0706.2569 |
| 16 | P. Nason | A new method for combining NLO QCD with shower Monte Carlo algorithms | JHEP 11 (2004) 040 | hep-ph/0409146 |
| 17 | S. Frixione, P. Nason, and C. Oleari | Matching NLO QCD computations with parton shower simulations: the POWHEG method | JHEP 11 (2007) 070 | 0709.2092 |
| 18 | S. Alioli, P. Nason, C. Oleari, and E. Re | A general framework for implementing NLO calculations in shower Monte Carlo programs: the POWHEG BOX | JHEP 06 (2010) 043 | 1002.2581 |
| 19 | S. Alioli, P. Nason, C. Oleari, and E. Re | NLO single-top production matched with shower in POWHEG: $ s $- and $ t $-channel contributions | JHEP 09 (2009) 111 | 0907.4076 |
| 20 | CMS Collaboration | Charged particle multiplicities in pp interactions at $ \sqrt{s} = 0.9 $, 2.36, and 7\TeV | JHEP 01 (2010) 079 | CMS-QCD-10-004 1011.5531 |
| 21 | J. Campbell, R. K. Ellis, and F. Tramontano | Single top-quark production and decay at next-to-leading order | PRD 70 (2004) 094012 | hep-ph/0408158 |
| 22 | J. Campbell and F. Tramontano | Next-to-leading order corrections to Wt production and decay | Nucl. Phys. B 726 (2005) 109 | hep-ph/0506289 |
| 23 | J. M. Campbell, R. Frederix, F. Maltoni, and F. Tramontano | Next-to-Leading-Order Predictions for $ t $-Channel Single-Top Production at Hadron Colliders | PRL 102 (2009) 182003 | 0903.0005 |
| 24 | J. M. Campbell, R. K. Ellis, and C. Williams | Vector boson pair production at the LHC | JHEP 07 (2011) 018 | 1105.0020 |
| 25 | M. Czakon, P. Fiedler, and A. Mitov | The total top quark pair production cross-section at hadron colliders through O($ \alpha_S^4 $) | PRL 110 (2013) 252004 | 1303.6254 |
| 26 | CMS Collaboration | Particle--Flow Event Reconstruction in CMS and Performance for Jets, Taus, and \MET | CDS | |
| 27 | CMS Collaboration | Commissioning of the Particle-flow Event Reconstruction with the first LHC collisions recorded in the CMS detector | CDS | |
| 28 | CMS Collaboration | Performance of CMS muon reconstruction in pp collision events at $ \sqrt{s} = 7 $\TeV | JINST 7 (2012) P10002 | CMS-MUO-10-004 1206.4071 |
| 29 | M. Cacciari, G. P. Salam, and G. Soyez | The anti-$ k_t $ jet clustering algorithm | JHEP 04 (2008) 063 | 0802.1189 |
| 30 | M. Cacciari, G. P. Salam, and G. Soyez | FastJet user manual | EPJC 72 (2012) 1896 | 1111.6097 |
| 31 | CMS Collaboration | Determination of jet energy calibration and transverse momentum resolution in CMS | JINST 6 (2011) 11002 | CMS-JME-10-011 1107.4277 |
| 32 | CMS Collaboration | Identification of b-quark jets with the CMS experiment | JINST 8 (2013) 04013 | CMS-BTV-12-001 1211.4462 |
| 33 | G. D'Agostini | A multidimensional unfolding method based on Bayes theorem | Nucl. Instr. Meth. A 362 (1995) 487 | |
| 34 | T. Adye | Unfolding algorithms and tests using RooUnfold | 1105.1160 | |
| 35 | J. Campbell and R. Ellis | Next-to-leading order corrections to W+2 jet and Z+2 jet production at hadron colliders | link | |
| 36 | CMS Collaboration | Absolute Calibration of the Luminosity Measurement at CMS: Winter 2012 Update | CDS | |
| 37 | CMS Collaboration | Measurement of the inelastic proton-proton cross section at $ \sqrt{s} = $ 7 TeV | PLB 722 (2013) 5 | CMS-FWD-11-001 1210.6718 |
| 38 | C. F. Berger et al. | Next-to-leading order QCD predictions for W+3-Jet distributions at hadron colliders | PRD 80 (2009) 074036 | 0907.1984 |
| 39 | J. Alwall et al. | The automated computation of tree-level and next-to-leading order differential cross sections, and their matching to parton shower simulations | JHEP 07 (2014) 079 | arXiv:1405.0301 |
| 40 | M. Ubiali | Towards the NNPDF3.0 parton set for the second LHC run | PoS DIS2014 07 (2014) 041 | arXiv:1407.3122 |
| 41 | T. Gleisberg et al. | Event generation with SHERPA 1.1 | JHEP 02 (2009) 007 | 0811.4622 |
| 42 | C. Berger et al. | One-Loop Calculations with BlackHat | Nucl.Phys.Proc.Suppl. 183 (2008) 313--319 | 0807.3705 |
| 43 | C. Berger et al. | Vector Boson + Jets with BlackHat and Sherpa | Nucl.Phys.Proc.Suppl. 205-206 (2010) 92--97 | 1005.3728 |
| 44 | S. Hoeche, F. Krauss, M. Schonherr, and F. Siegert | A critical appraisal of NLO+PS matching methods | JHEP 09 (2012) 049 | 1111.1220 |
| 45 | A. Buckley et al. | Rivet user manual | CPC 184 (2013) 2803 | 1003.0694 |
| 46 | S. Alekhin et al. | The PDF4LHC Working Group Interim Report | 1101.0536 | |
| 47 | M. Botje et al. | The PDF4LHC Working Group Interim Recommendations | 1101.0538 | |
| 48 | D. Ma\^itre and S. Sapeta | Simulated NNLO for high-$ p_\text{T} $ observables in vector boson + jets production at the LHC | EPJC 73 (2013) 2663 | 1307.2252 |
|
|
Compact Muon Solenoid LHC, CERN |
|

|

|

|

|

|