

Compact Muon Solenoid
LHC, CERN
| CMS-PAS-SMP-14-020 | ||
| Measurement of the W boson production cross section in association with two b jets in pp collisions at $\sqrt{s} =$ 8 TeV | ||
| CMS Collaboration | ||
| January 2016 | ||
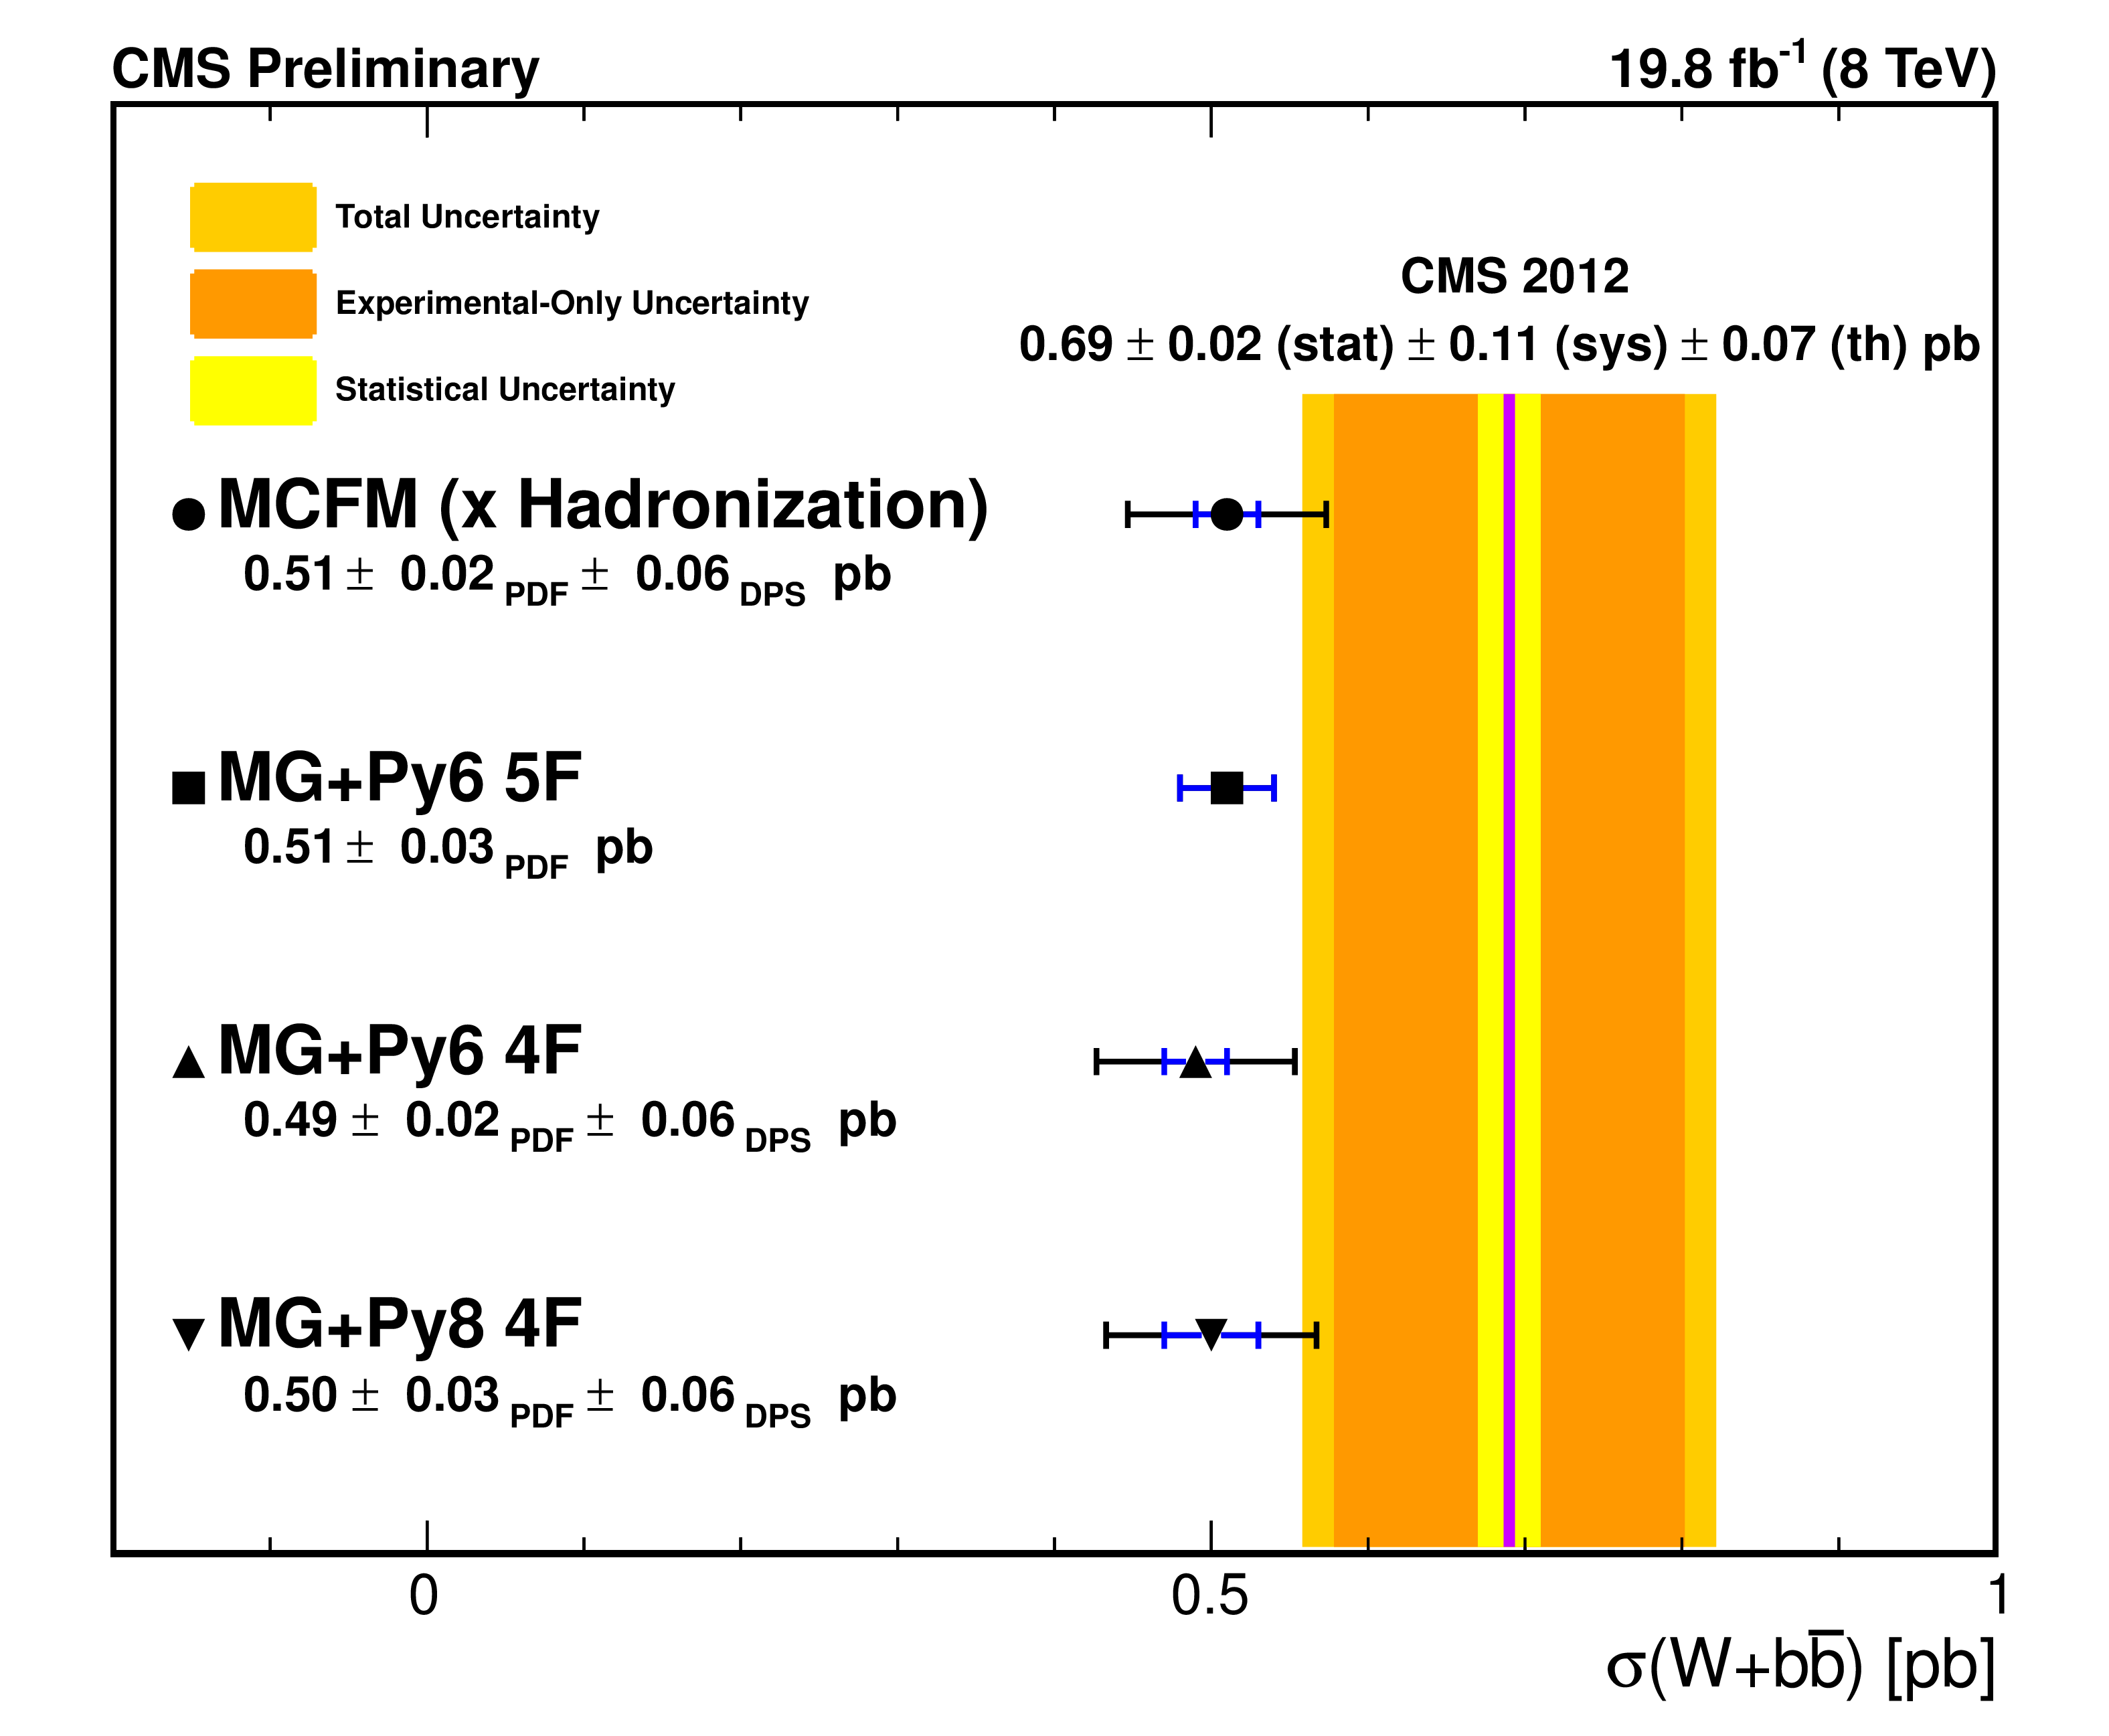
| Abstract: The production cross section of the W boson in association with two b jets is measured using a sample of proton-proton collisions collected by the CMS experiment at the LHC at $\sqrt{s} =$ 8 TeV. The data sample corresponds to an integrated luminosity of 19.8 fb$^{-1}$. The W bosons are reconstructed via their leptonic decays to muons ($\mathrm{W}\rightarrow\mu\nu$) and electrons ($\mathrm{W}\rightarrow\mathrm{e}\nu$). The $\mathrm{ W+b \bar{b} }$ production cross section, $\sigma ( \mathrm{ pp \rightarrow W (\ell\nu)+ b \bar{b} })= $ 0.69 $\pm$ 0.02 (stat) $\pm$ 0.11 (syst) $\pm$ 0.07 (theo) $\pm$ 0.02 (lumi) pb, measured in a fiducial region, $p_T^{\ell}>$ 30 GeV, $|\eta^{\ell}| <$ 2.1, with exactly two b-tagged jets having $p_{\mathrm{T}} >$ 25 GeV and $|\eta|<$ 2.4 , agrees with standard model predictions. | ||
|
Links:
CDS record (PDF) ;
CADI line (restricted) ;
These preliminary results are superseded in this paper, EPJC 77 (2017) 92. The superseded preliminary plots can be found here. |
||
| Figures | |

png ; pdf ; |
Figure 1-a:
The transverse mass distributions in the $ \mathrm{ t \bar{t} } $-multijet phase space after fitting to obtain the b-tag rescale factors. The lepton channels are shown separately with the muon sample (a) and the electron sample (b). The highest bin contains overflow events. The shaded area represents the total uncertainty on the simulation as output from the fit. |

png ; pdf ; |
Figure 1-b:
The transverse mass distributions in the $ \mathrm{ t \bar{t} } $-multijet phase space after fitting to obtain the b-tag rescale factors. The lepton channels are shown separately with the muon sample (a) and the electron sample (b). The highest bin contains overflow events. The shaded area represents the total uncertainty on the simulation as output from the fit. |
png ; pdf ; |
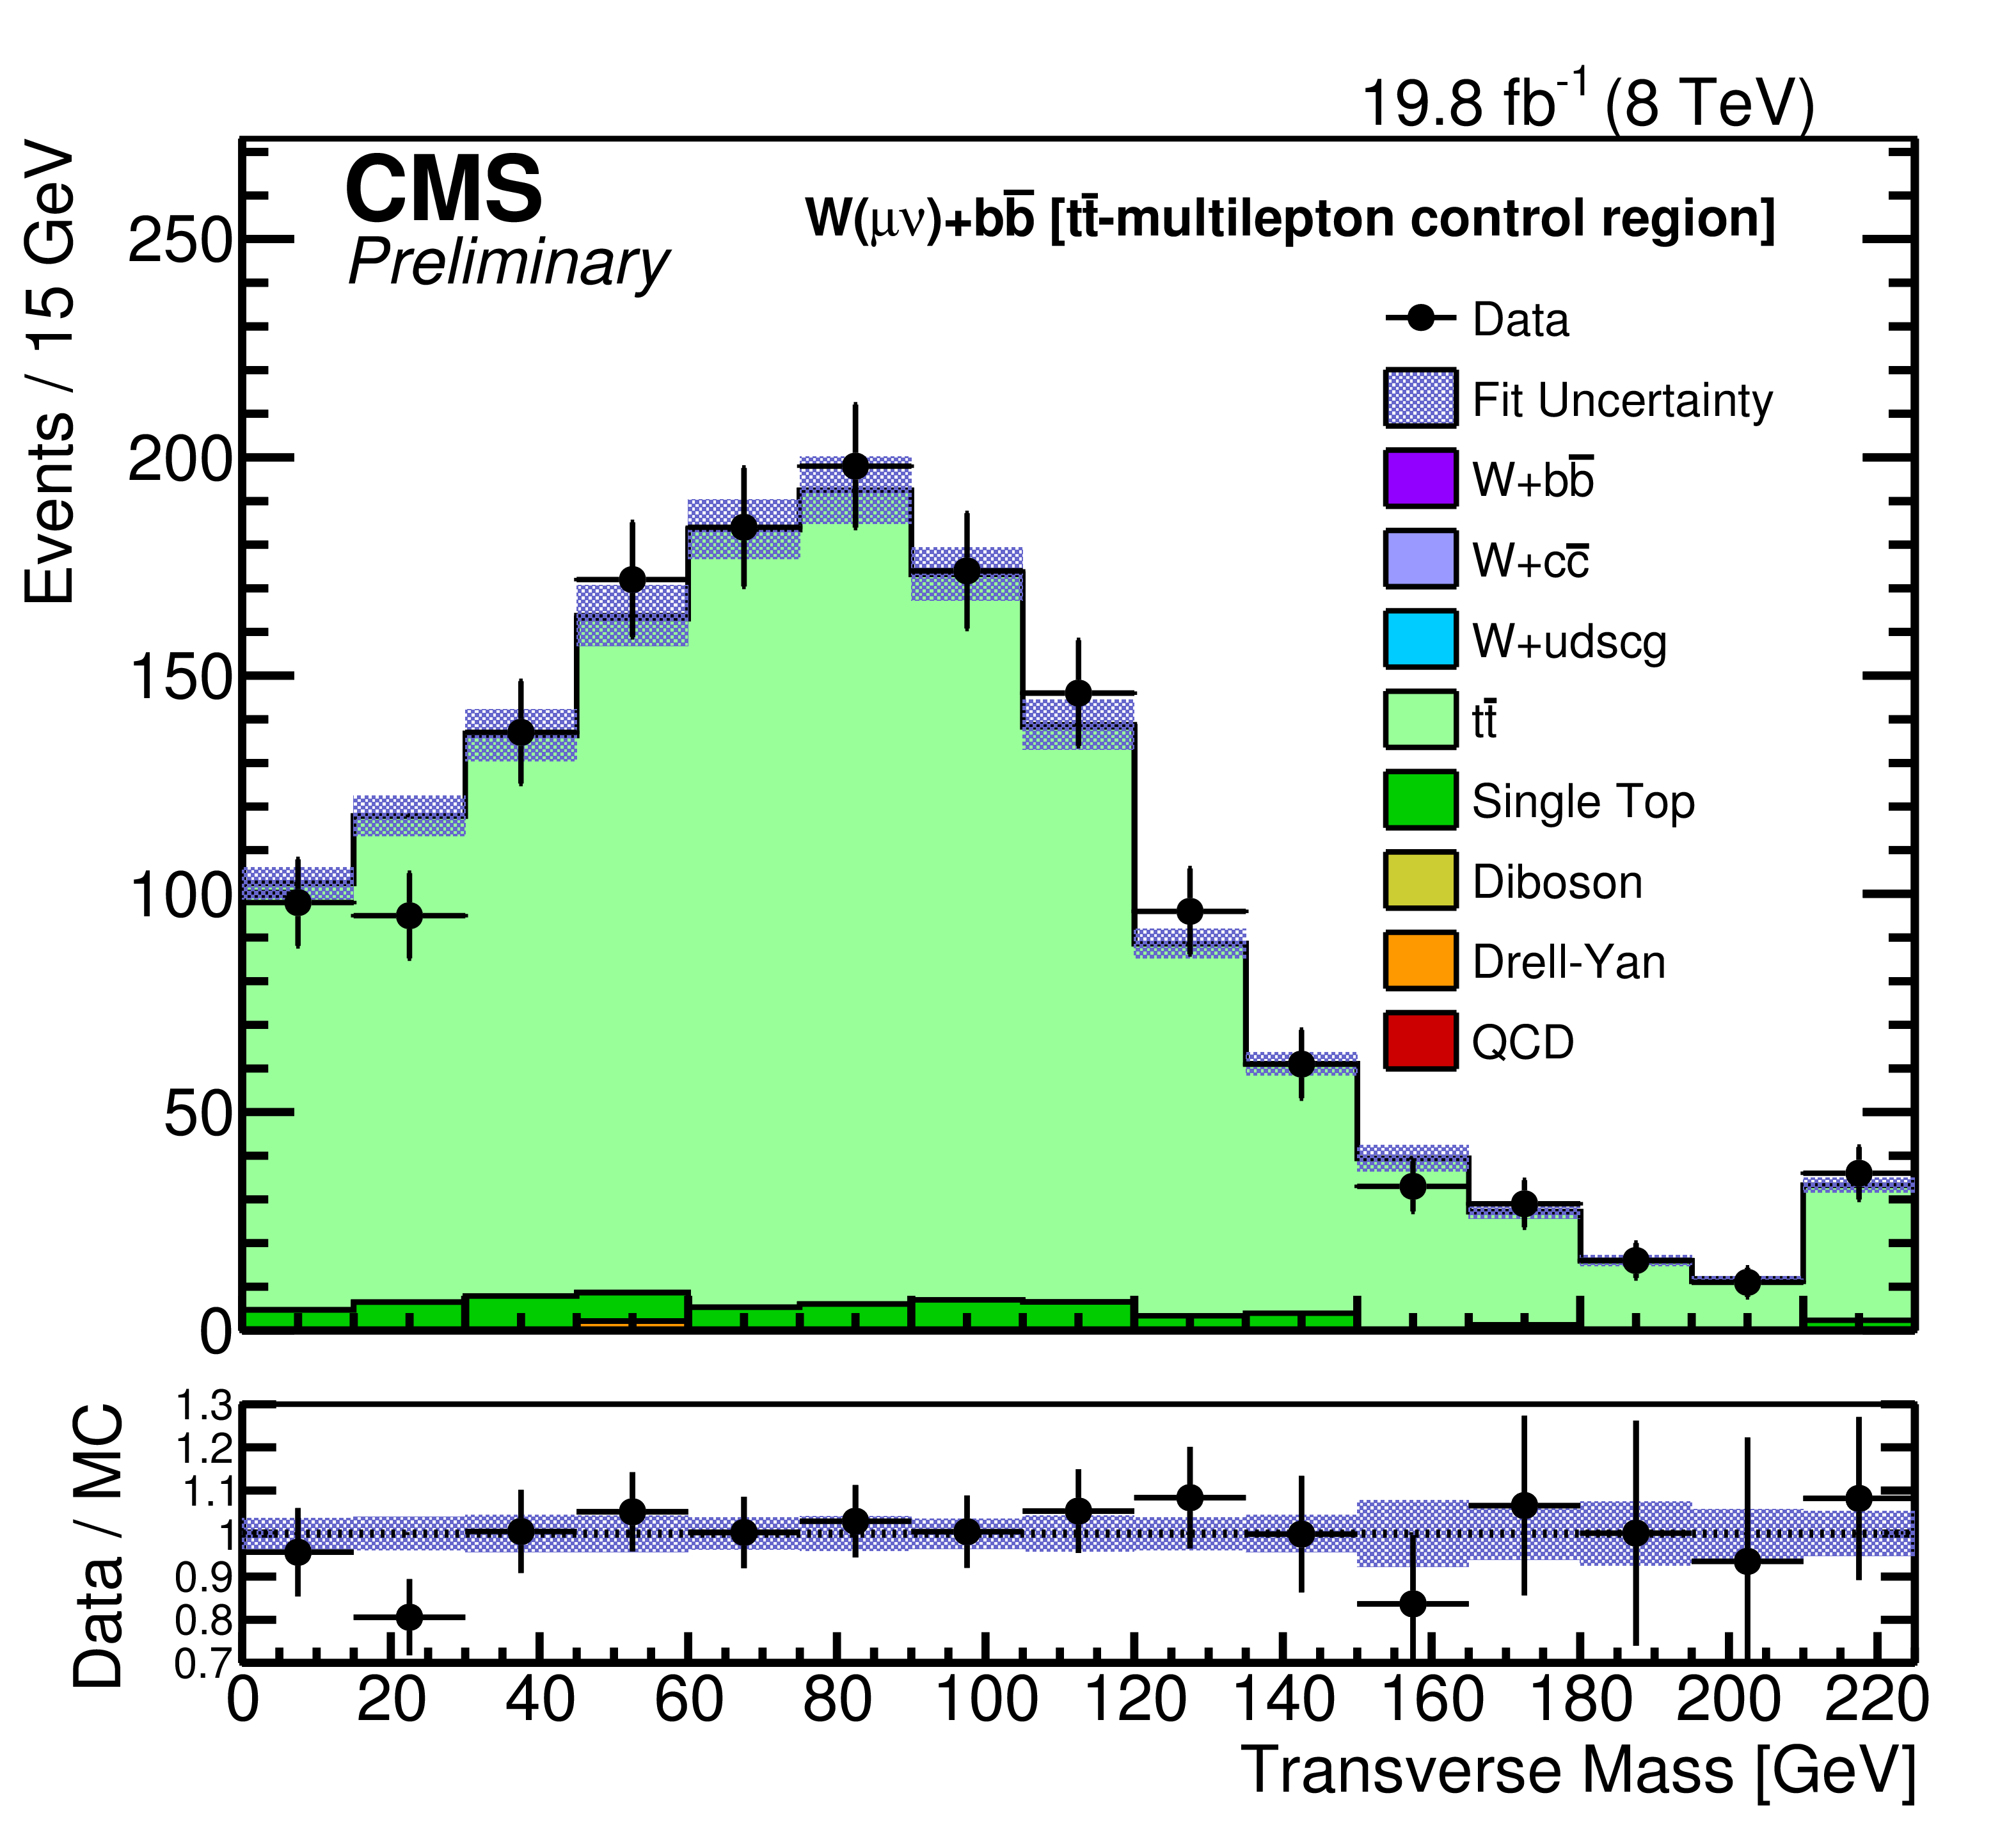
Figure 2-a:
The transverse mass distributions in the $ \mathrm{ t \bar{t} } $-multilepton phase space after fitting to find the appropriate jet energy scale. The lepton channels are shown separately with the muon sample (a) and the electron sample (b). The highest bin contains overflow events. The shaded area represents the total uncertainty on the simulation as output from the fit. |

png ; pdf ; |
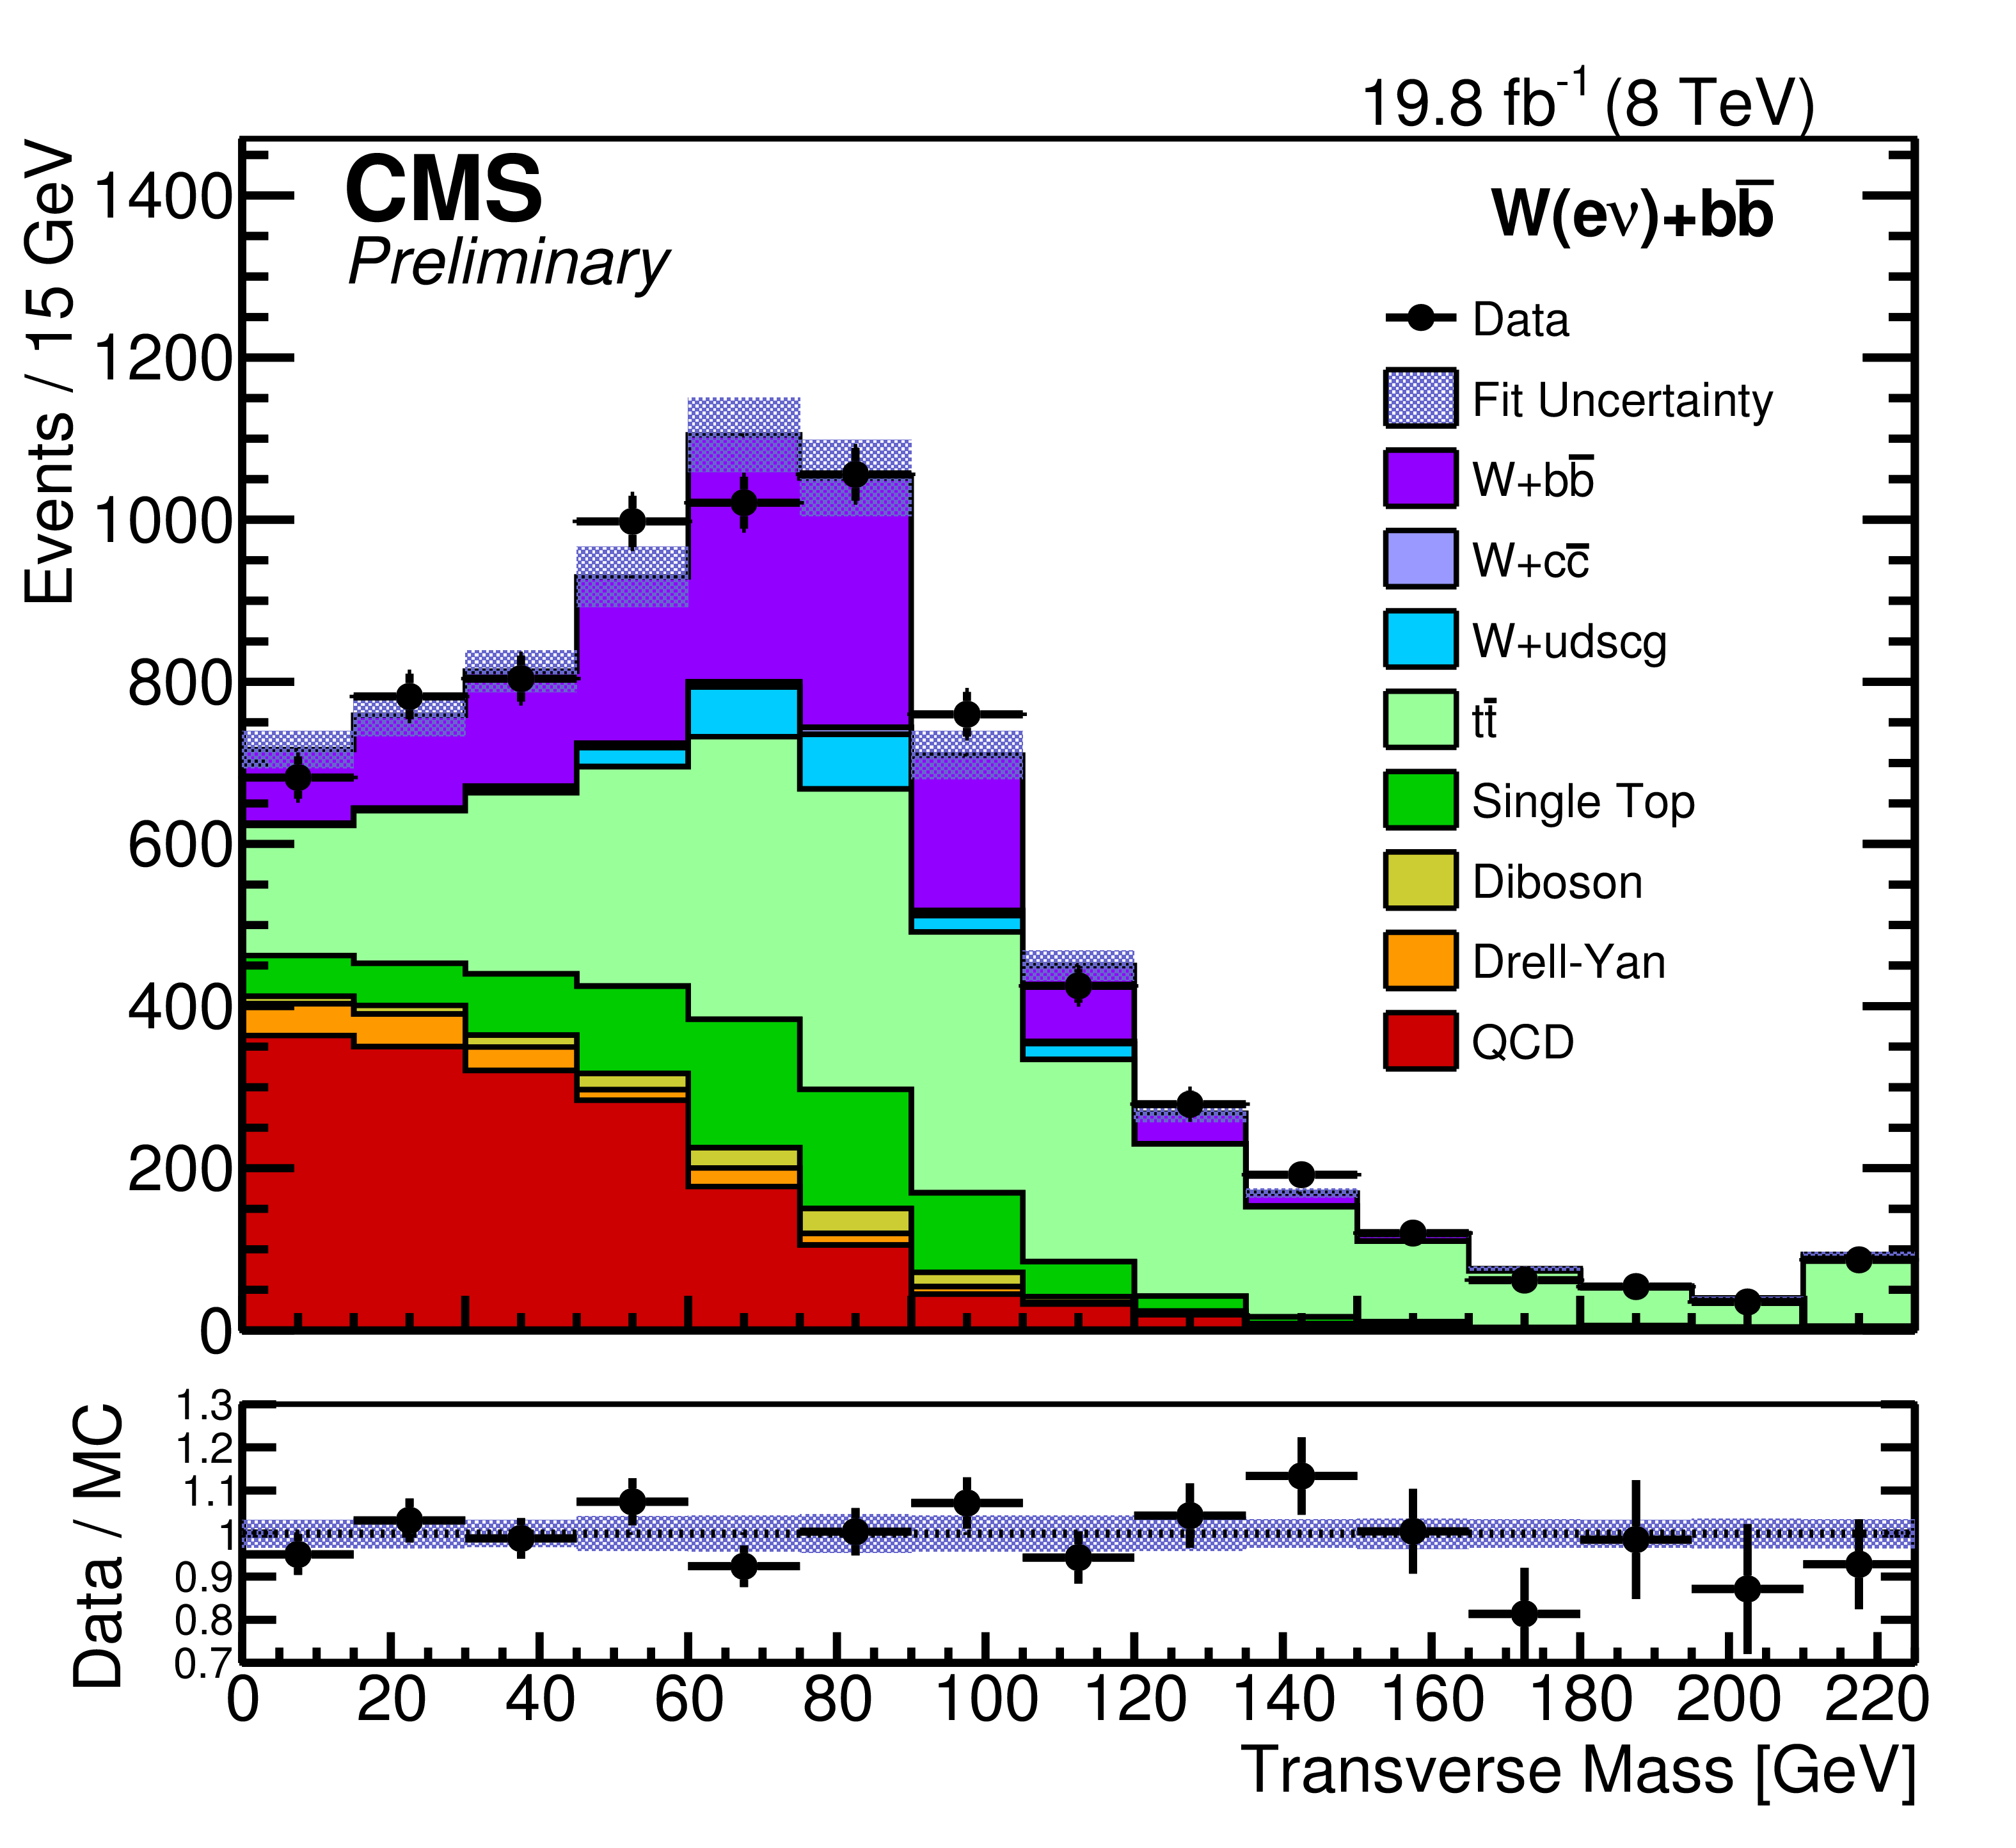
Figure 2-b:
The transverse mass distributions in the $ \mathrm{ t \bar{t} } $-multilepton phase space after fitting to find the appropriate jet energy scale. The lepton channels are shown separately with the muon sample (a) and the electron sample (b). The highest bin contains overflow events. The shaded area represents the total uncertainty on the simulation as output from the fit. |

png ; pdf ; |
Figure 3-a:
Transverse mass distributions in the $ \mathrm{ W + b \bar{b} } $ signal region after fitting simultaneously muon and electron decay channels. The lepton channels are shown separately with the muon sample (a) and the electron sample (b). The highest bin contains overflow events. The shaded area represents the total uncertainty on the simulation as output from the fit. |
png ; pdf ; |
Figure 3-b:
Transverse mass distributions in the $ \mathrm{ W + b \bar{b} } $ signal region after fitting simultaneously muon and electron decay channels. The lepton channels are shown separately with the muon sample (a) and the electron sample (b). The highest bin contains overflow events. The shaded area represents the total uncertainty on the simulation as output from the fit. |
png ; pdf ; |
Figure 4:
Comparison between the measured $ \mathrm{ W + b \bar{b} } $ cross section and various QCD predictions. The blue error bars on the predictions represent the uncertainty in the given sample associated with PDF choice and the black bars represent the total uncertainty. In the case of the MadGraph + PYTHIA-6 (5F) sample, the effects of DPS are already included in the generated sample so the extra DPS factor was not needed and the blue and black error bars overlap perfectly. |
| Tables | |
png ; pdf |
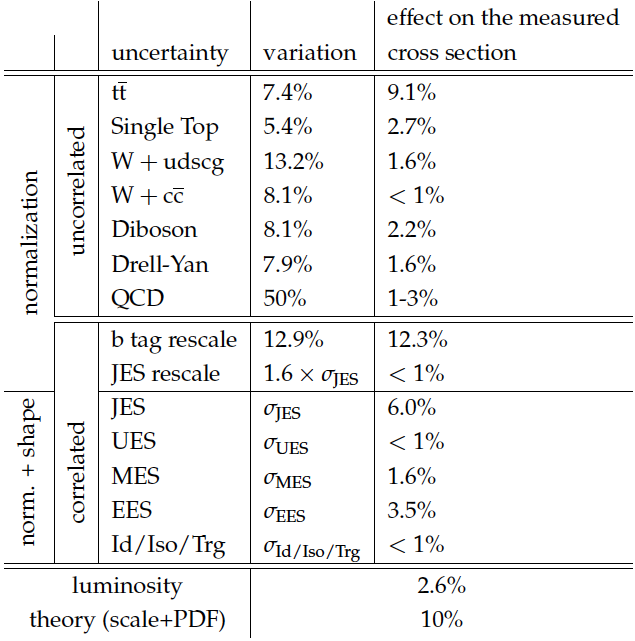
Table 1:
Breakdown of the major sources of systematic uncertainty in the $ \mathrm{ W + b \bar{b} } $ phase space. The last column indicates the contribution of the given systematic to the overall uncertainty on the measured cross section. The uncertainty labeled "b tag rescale" is the uncertainty associated with the rescaling of the b tag efficiency scale factors. In the "variation" column, the uncertainties which are correlated across all simulated samples and affect both shape and normalization are indicated by $\sigma _{\mathrm {UNC}}$ to indicate that an input variation of one standard deviation is set on the uncertainty UNC in the fitting procedure. UES refers to the energy scale of energy deposits not clustered into jets and MES and EES refer to the muon and electron energy scales. The uncertainty labeled as "Id/Iso/Trg" is the uncertainty associated with the efficiency of the lepton identification, isolation, and triggering. The uncertainty on the luminosity and the uncertainty on the acceptance due to PDF and scale choices are not included in the fit, and are treated separately. |

png ; pdf |
Table 2:
Initial and final yields obtained in the $ {\mathrm{ W + b \bar{b} } } $ signal region. The uncertainties on the signal strength represent the total uncertainty of the measurement. |
png ; pdf |
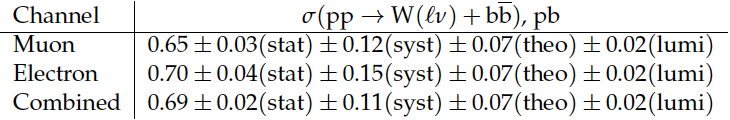
Table 3:
Measured cross sections in the muon, electron, and combined lepton channels. |
|
|
Compact Muon Solenoid LHC, CERN |
|

|

|

|

|

|