

Compact Muon Solenoid
LHC, CERN
| CMS-PAS-SMP-13-012 | ||
| Measurement of the cross section of the electroweak production of a W boson with two jets in pp collisions at $\sqrt{s} =$ 8 TeV | ||
| CMS Collaboration | ||
| July 2015 | ||
| Abstract: We present a measurement of the electroweak production cross section of a W boson in association with two jets events in pp collisions at $\sqrt{s} =$ 8 TeV. The analyzed dataset corresponds to an integrated luminosity of 19.3 fb$^{-1}$ collected by the CMS detector at the LHC. The measured value of the cross section in the fiducial region for electroweak production of W (W $\to\ell\nu$, with $\ell={\mathrm{e}},{{\mu}}$)+2 jets is 0.42 $\pm$ 0.04 (stat.) $\pm$ 0.09 (syst.) $\pm$ 0.01 (lumi.) pb, which is consistent with the standard model prediction of 0.50 $\pm$ 0.02 (scale) $\pm$ 0.02 (PDF) pb obtained by MADGRAPH interfaced to PYTHIA 6. | ||
|
Links:
CDS record (PDF) ;
Public twiki page ;
CADI line (restricted) ; Figures are also available from the CDS record. These preliminary results are superseded in this paper, JHEP 11 (2016) 147. The superseded preliminary plots can be found here. |
||
| Figures | |
png ; pdf |
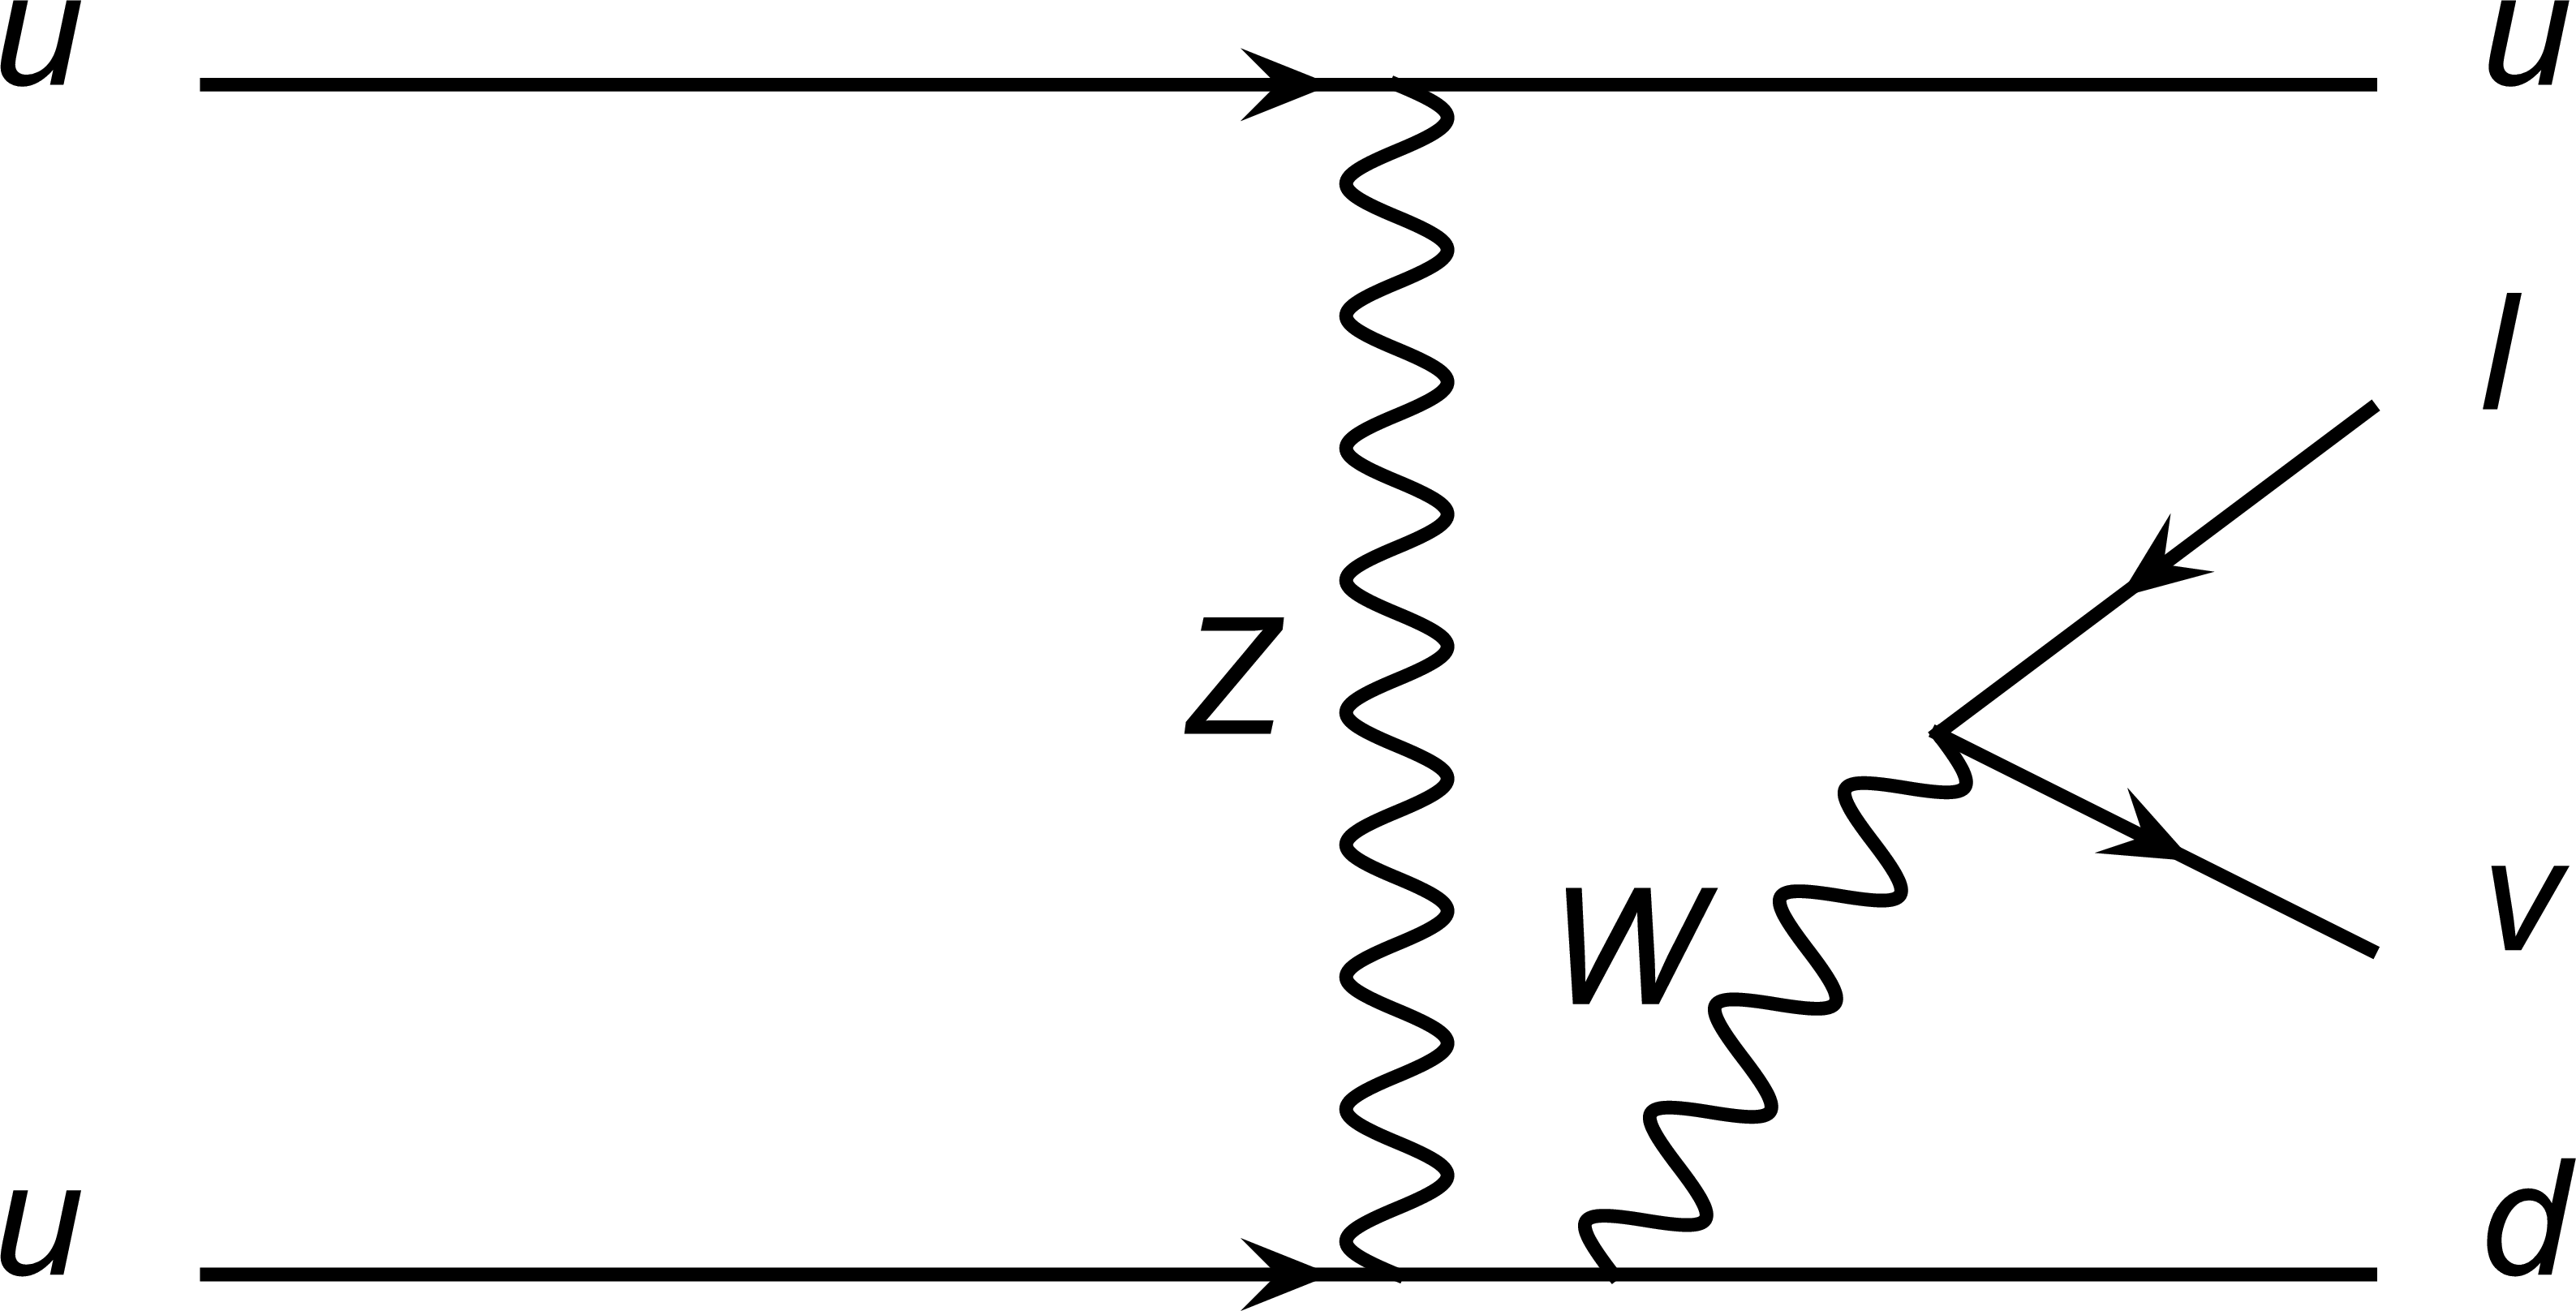
Figure 1-a:
Representative diagrams for EWK $\ell \nu \mathrm{jj} $ productions at the LHC: (a) Bremsstrahlung, (b) VBF, and (c) Multiperipheral processes. |
png ; pdf |
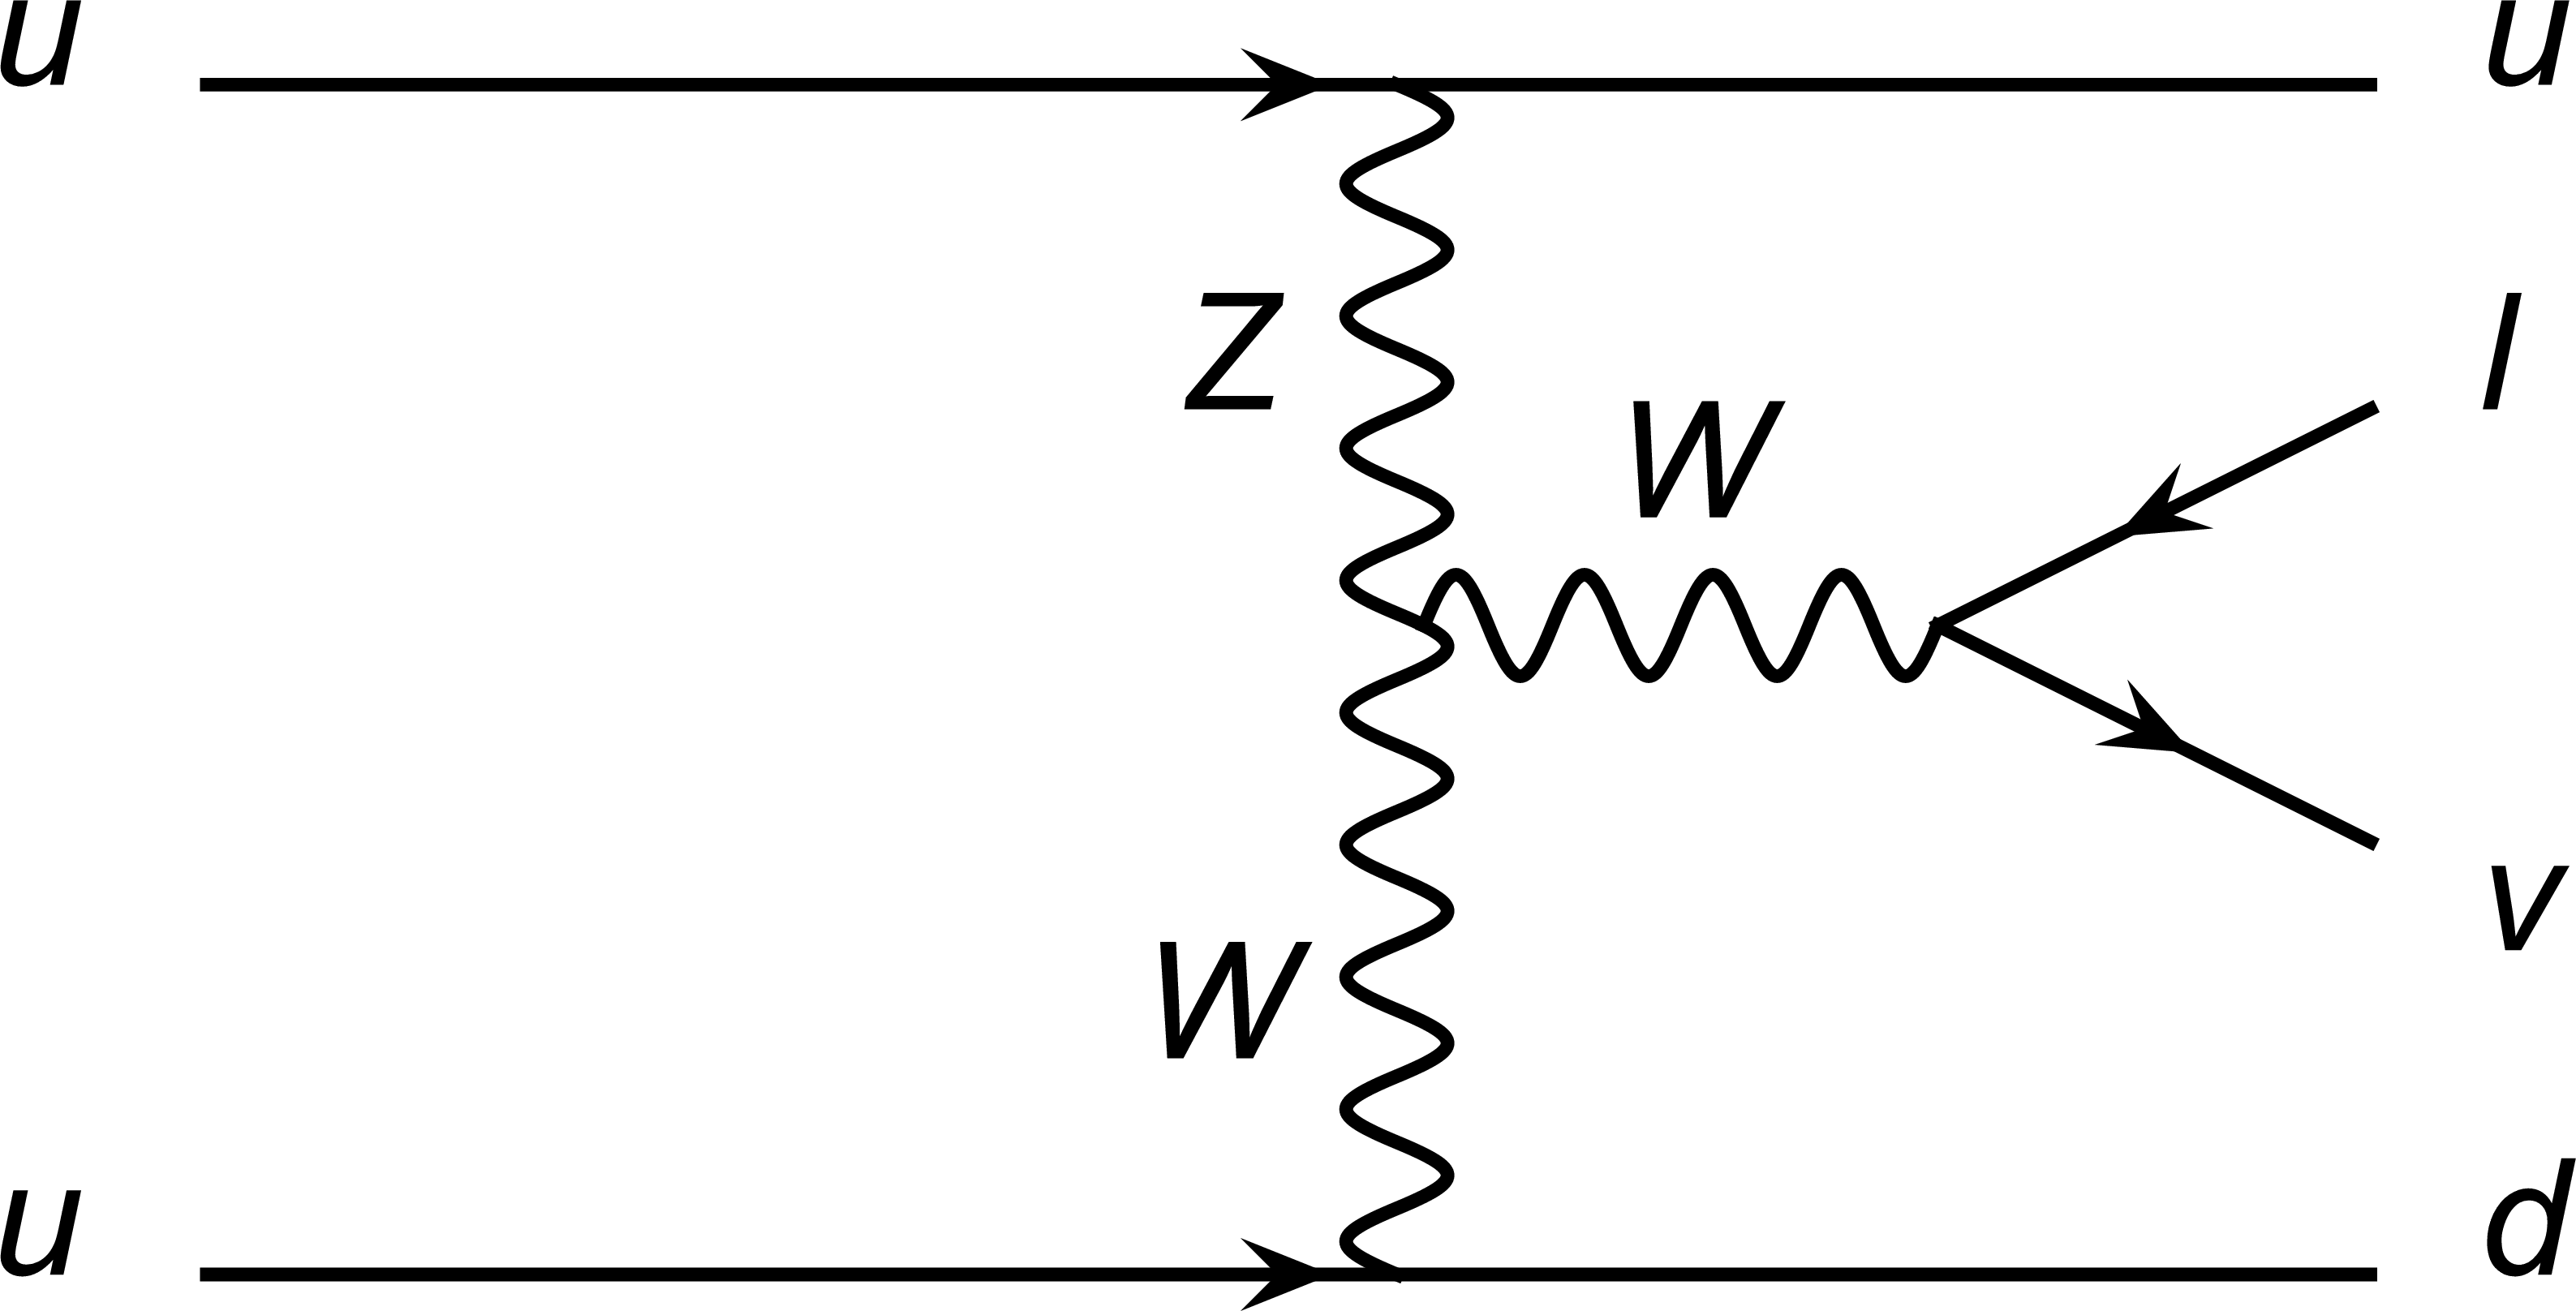
Figure 1-b:
Representative diagrams for EWK $\ell \nu \mathrm{jj} $ productions at the LHC: (a) Bremsstrahlung, (b) VBF, and (c) Multiperipheral processes. |
png ; pdf |
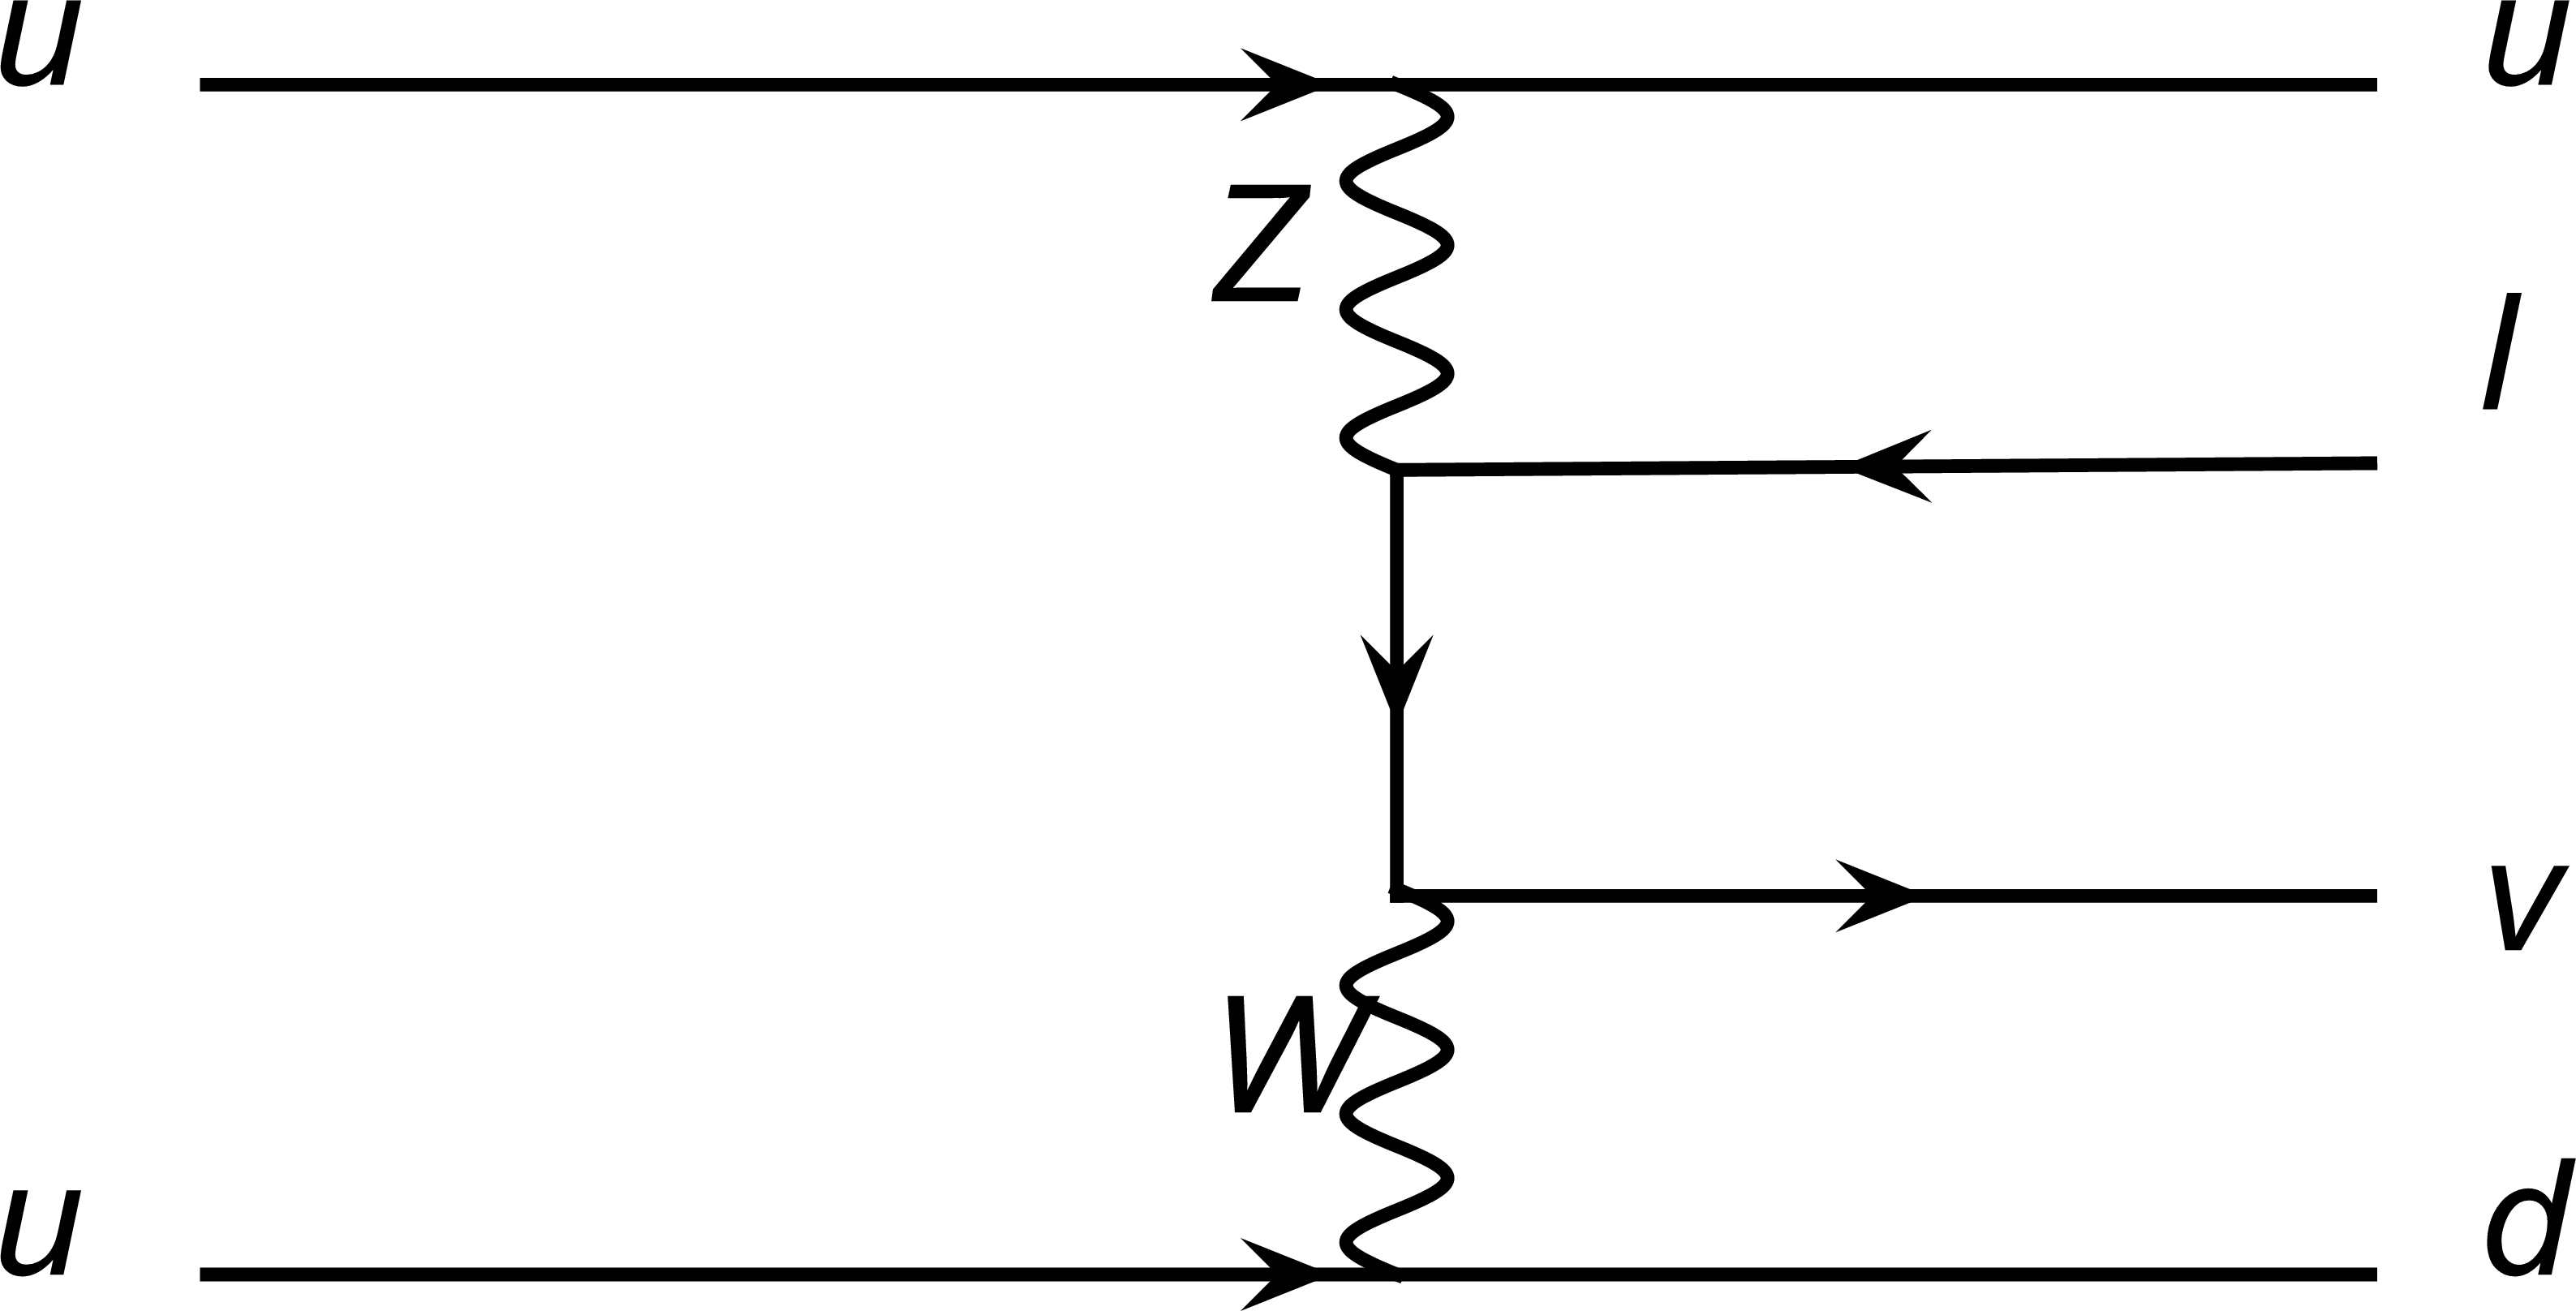
Figure 1-c:
Representative diagrams for EWK $\ell \nu \mathrm{jj} $ productions at the LHC: (a) Bremsstrahlung, (b) VBF, and (c) Multiperipheral processes. |

png ; pdf |
Figure 2-a:
BDT discriminant output in muon (a) and electron (b) channel. |
png ; pdf |
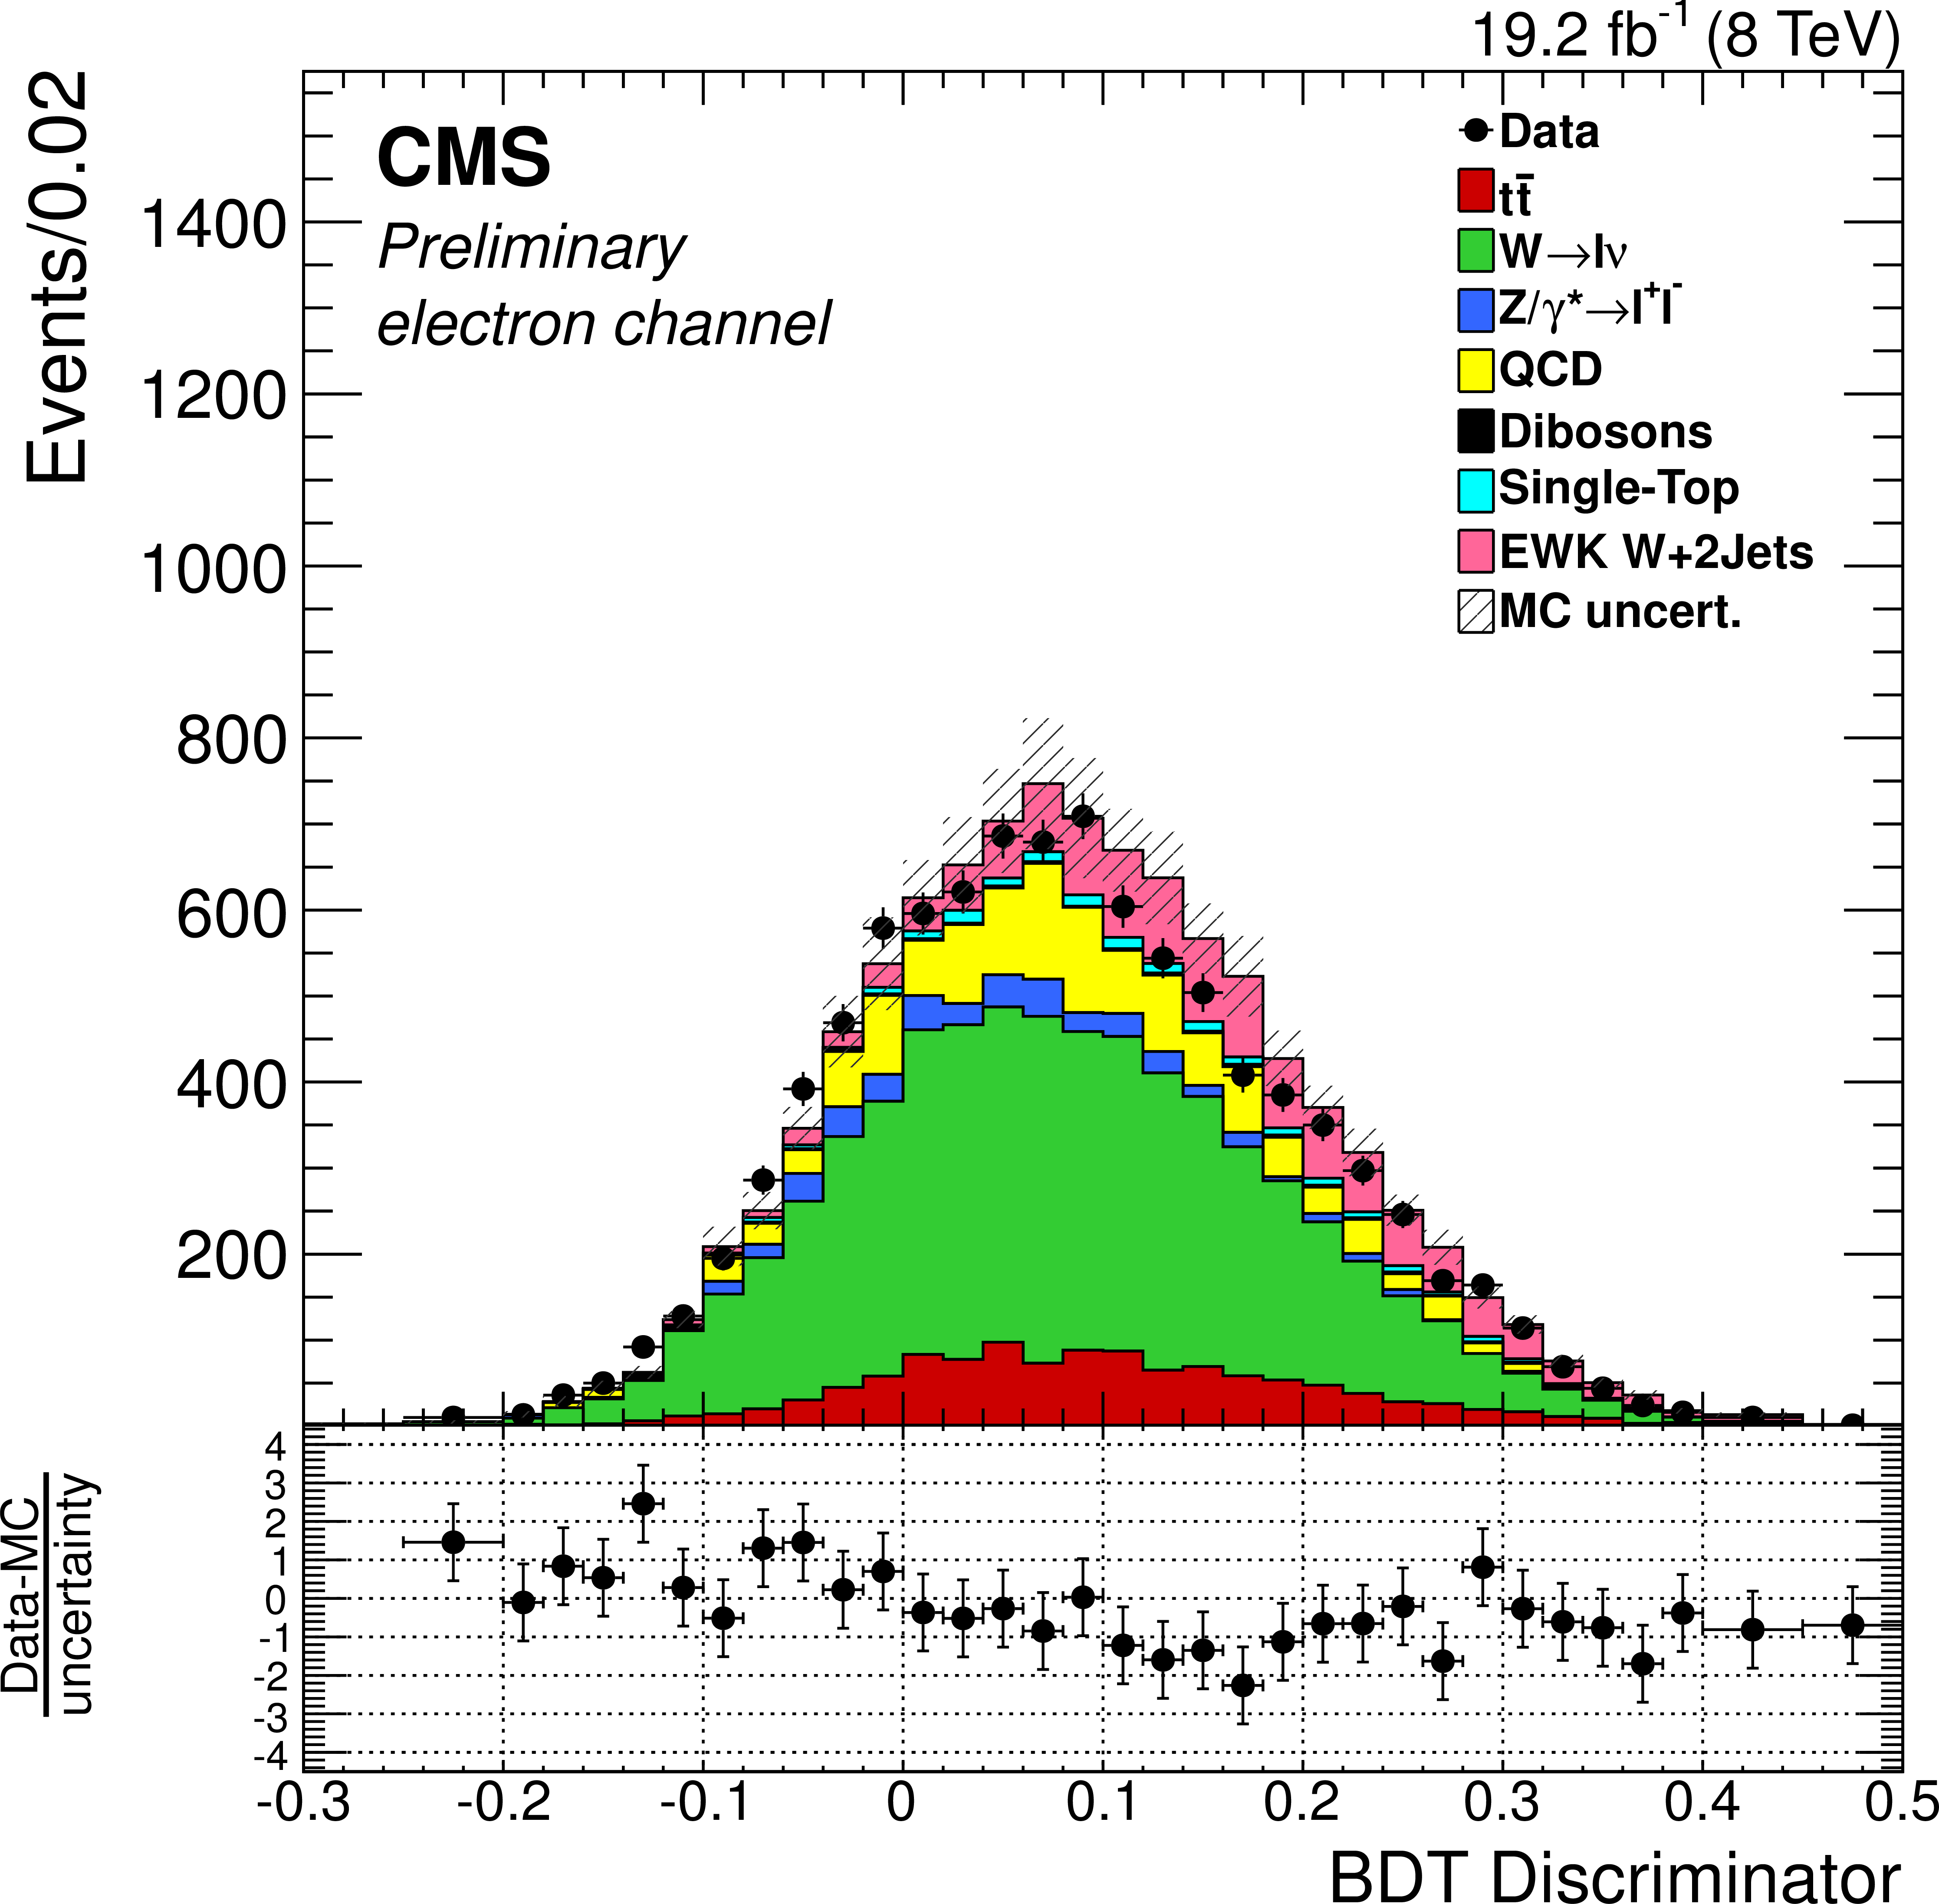
Figure 2-b:
BDT discriminant output in muon (a) and electron (b) channel. |
png ; pdf |
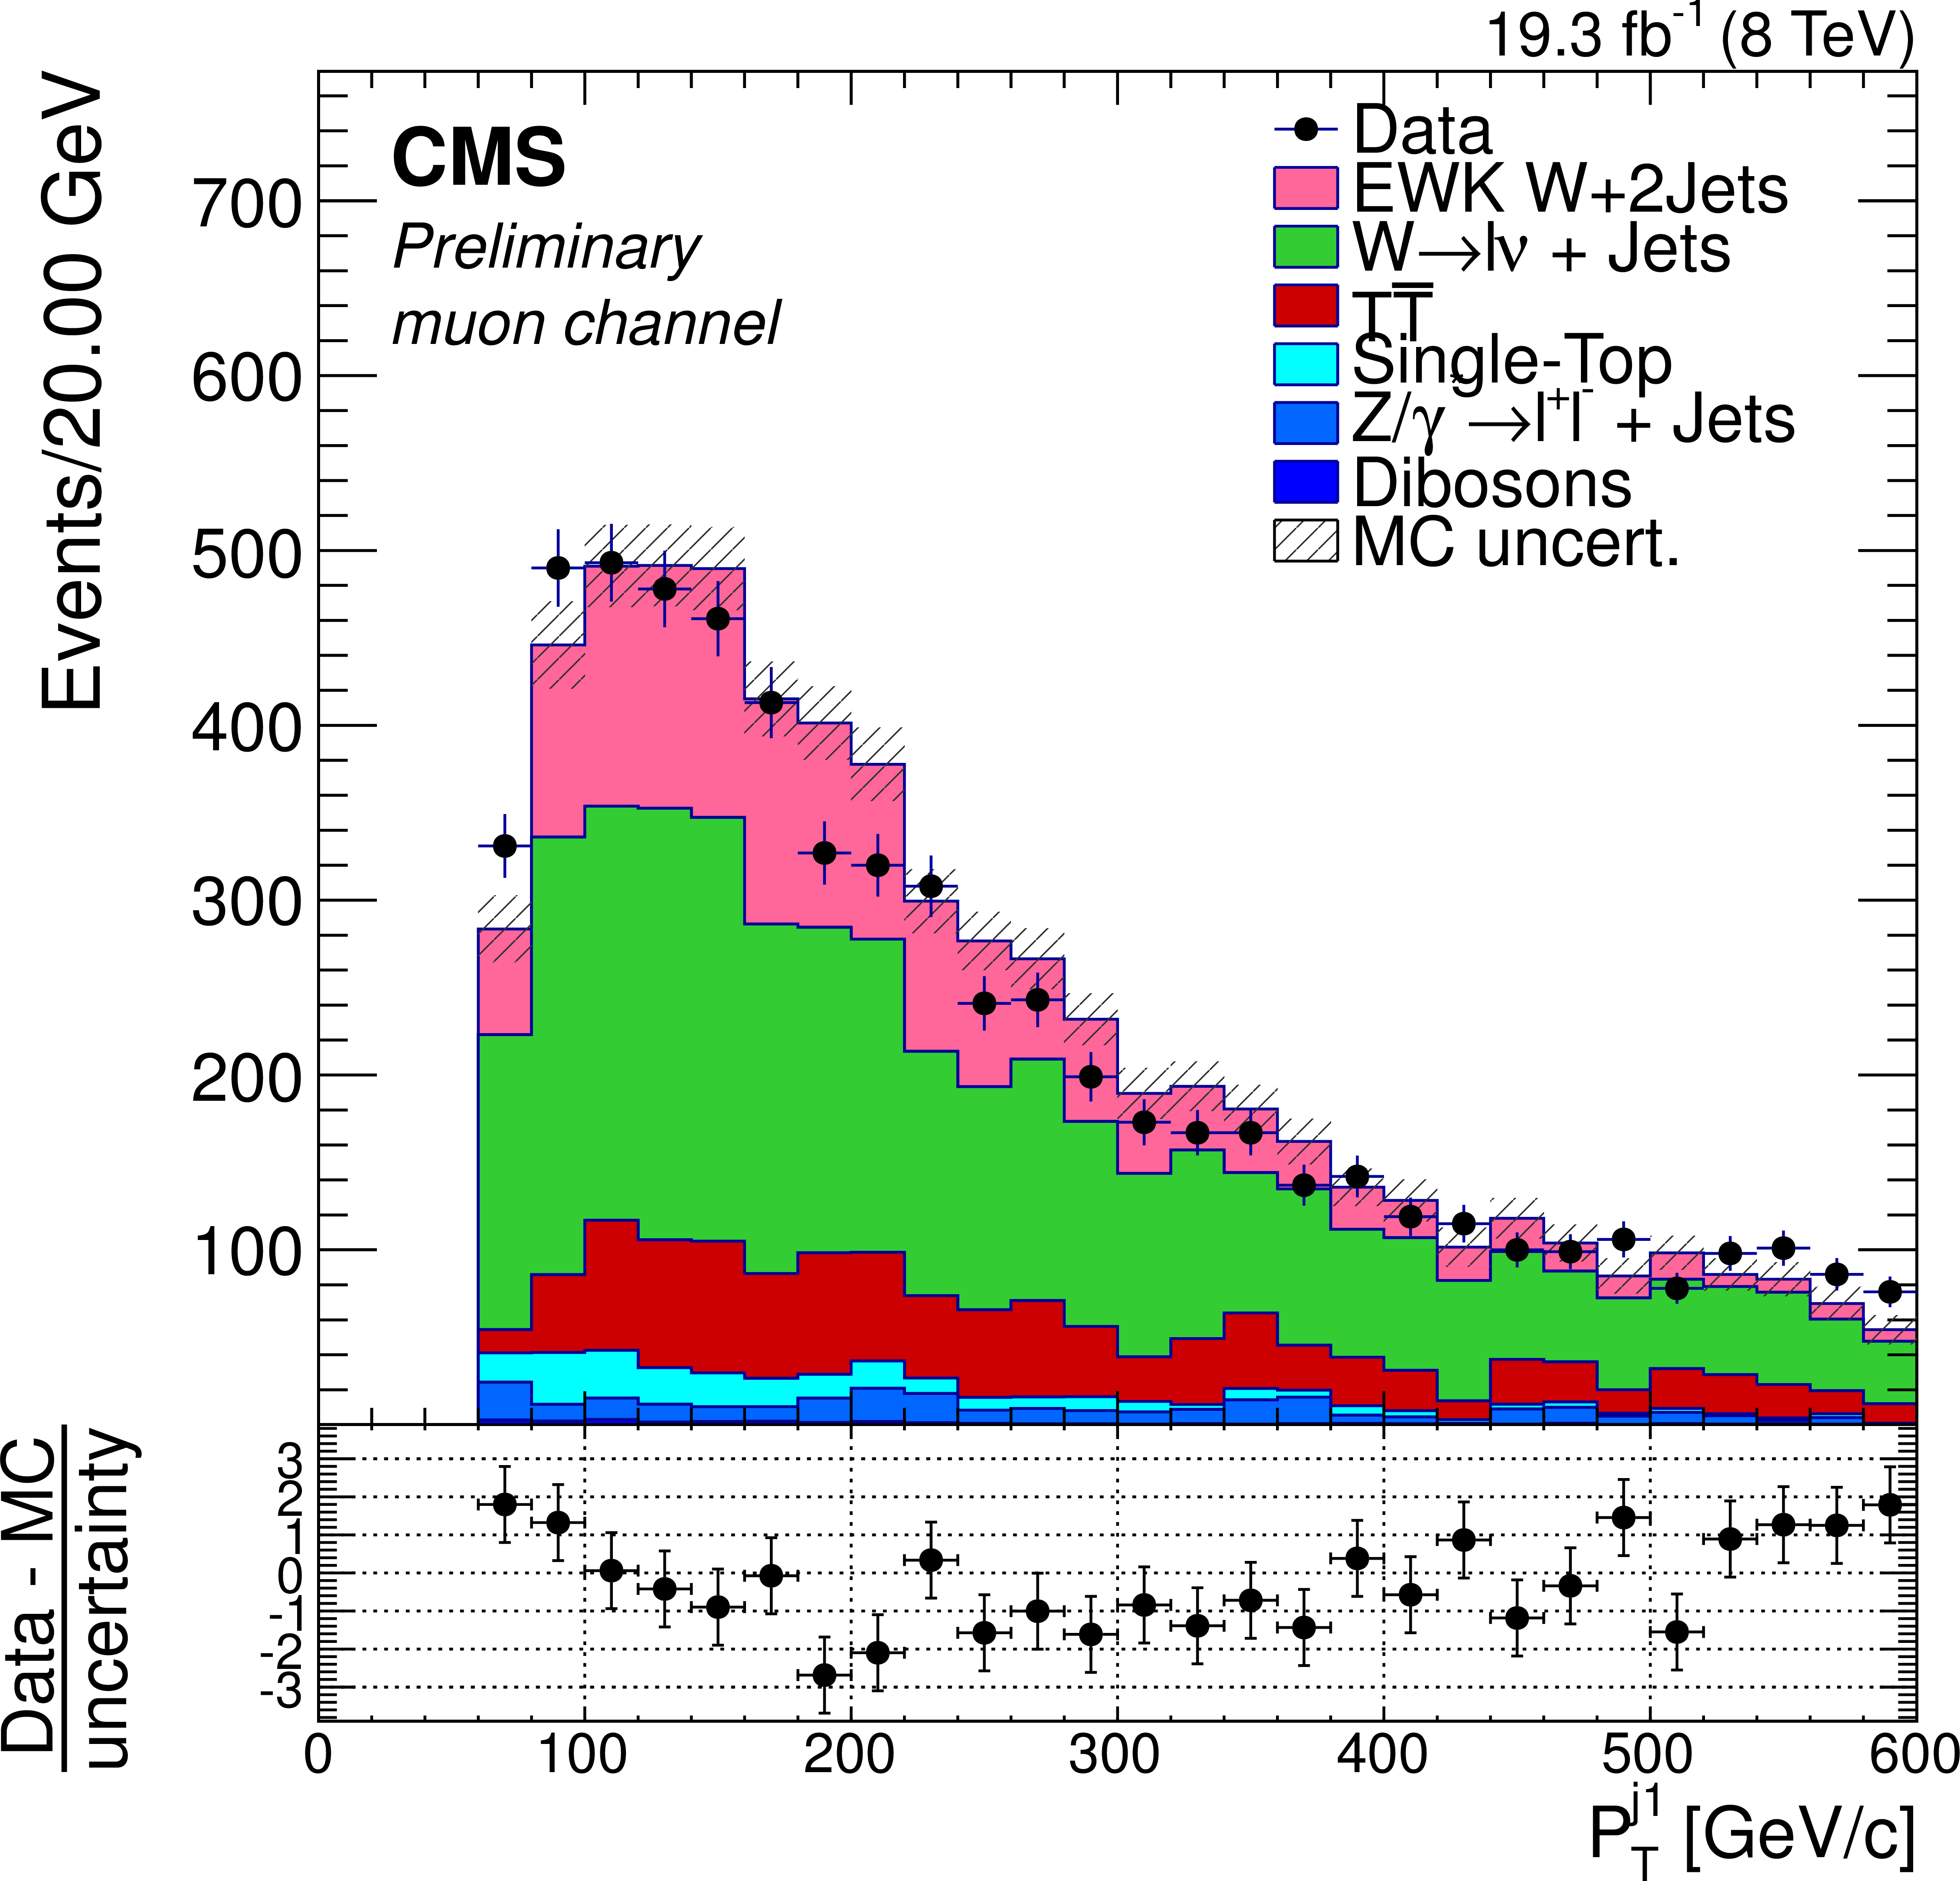
Figure 3-a:
Comparison of the leading jet $p_{\mathrm{T}}$ distributions between data and MC for muon (a) and electron (b) channel. |

png ; pdf |
Figure 3-b:
Comparison of the leading jet $p_{\mathrm{T}}$ distributions between data and MC for muon (a) and electron (b) channel. |
png ; pdf |
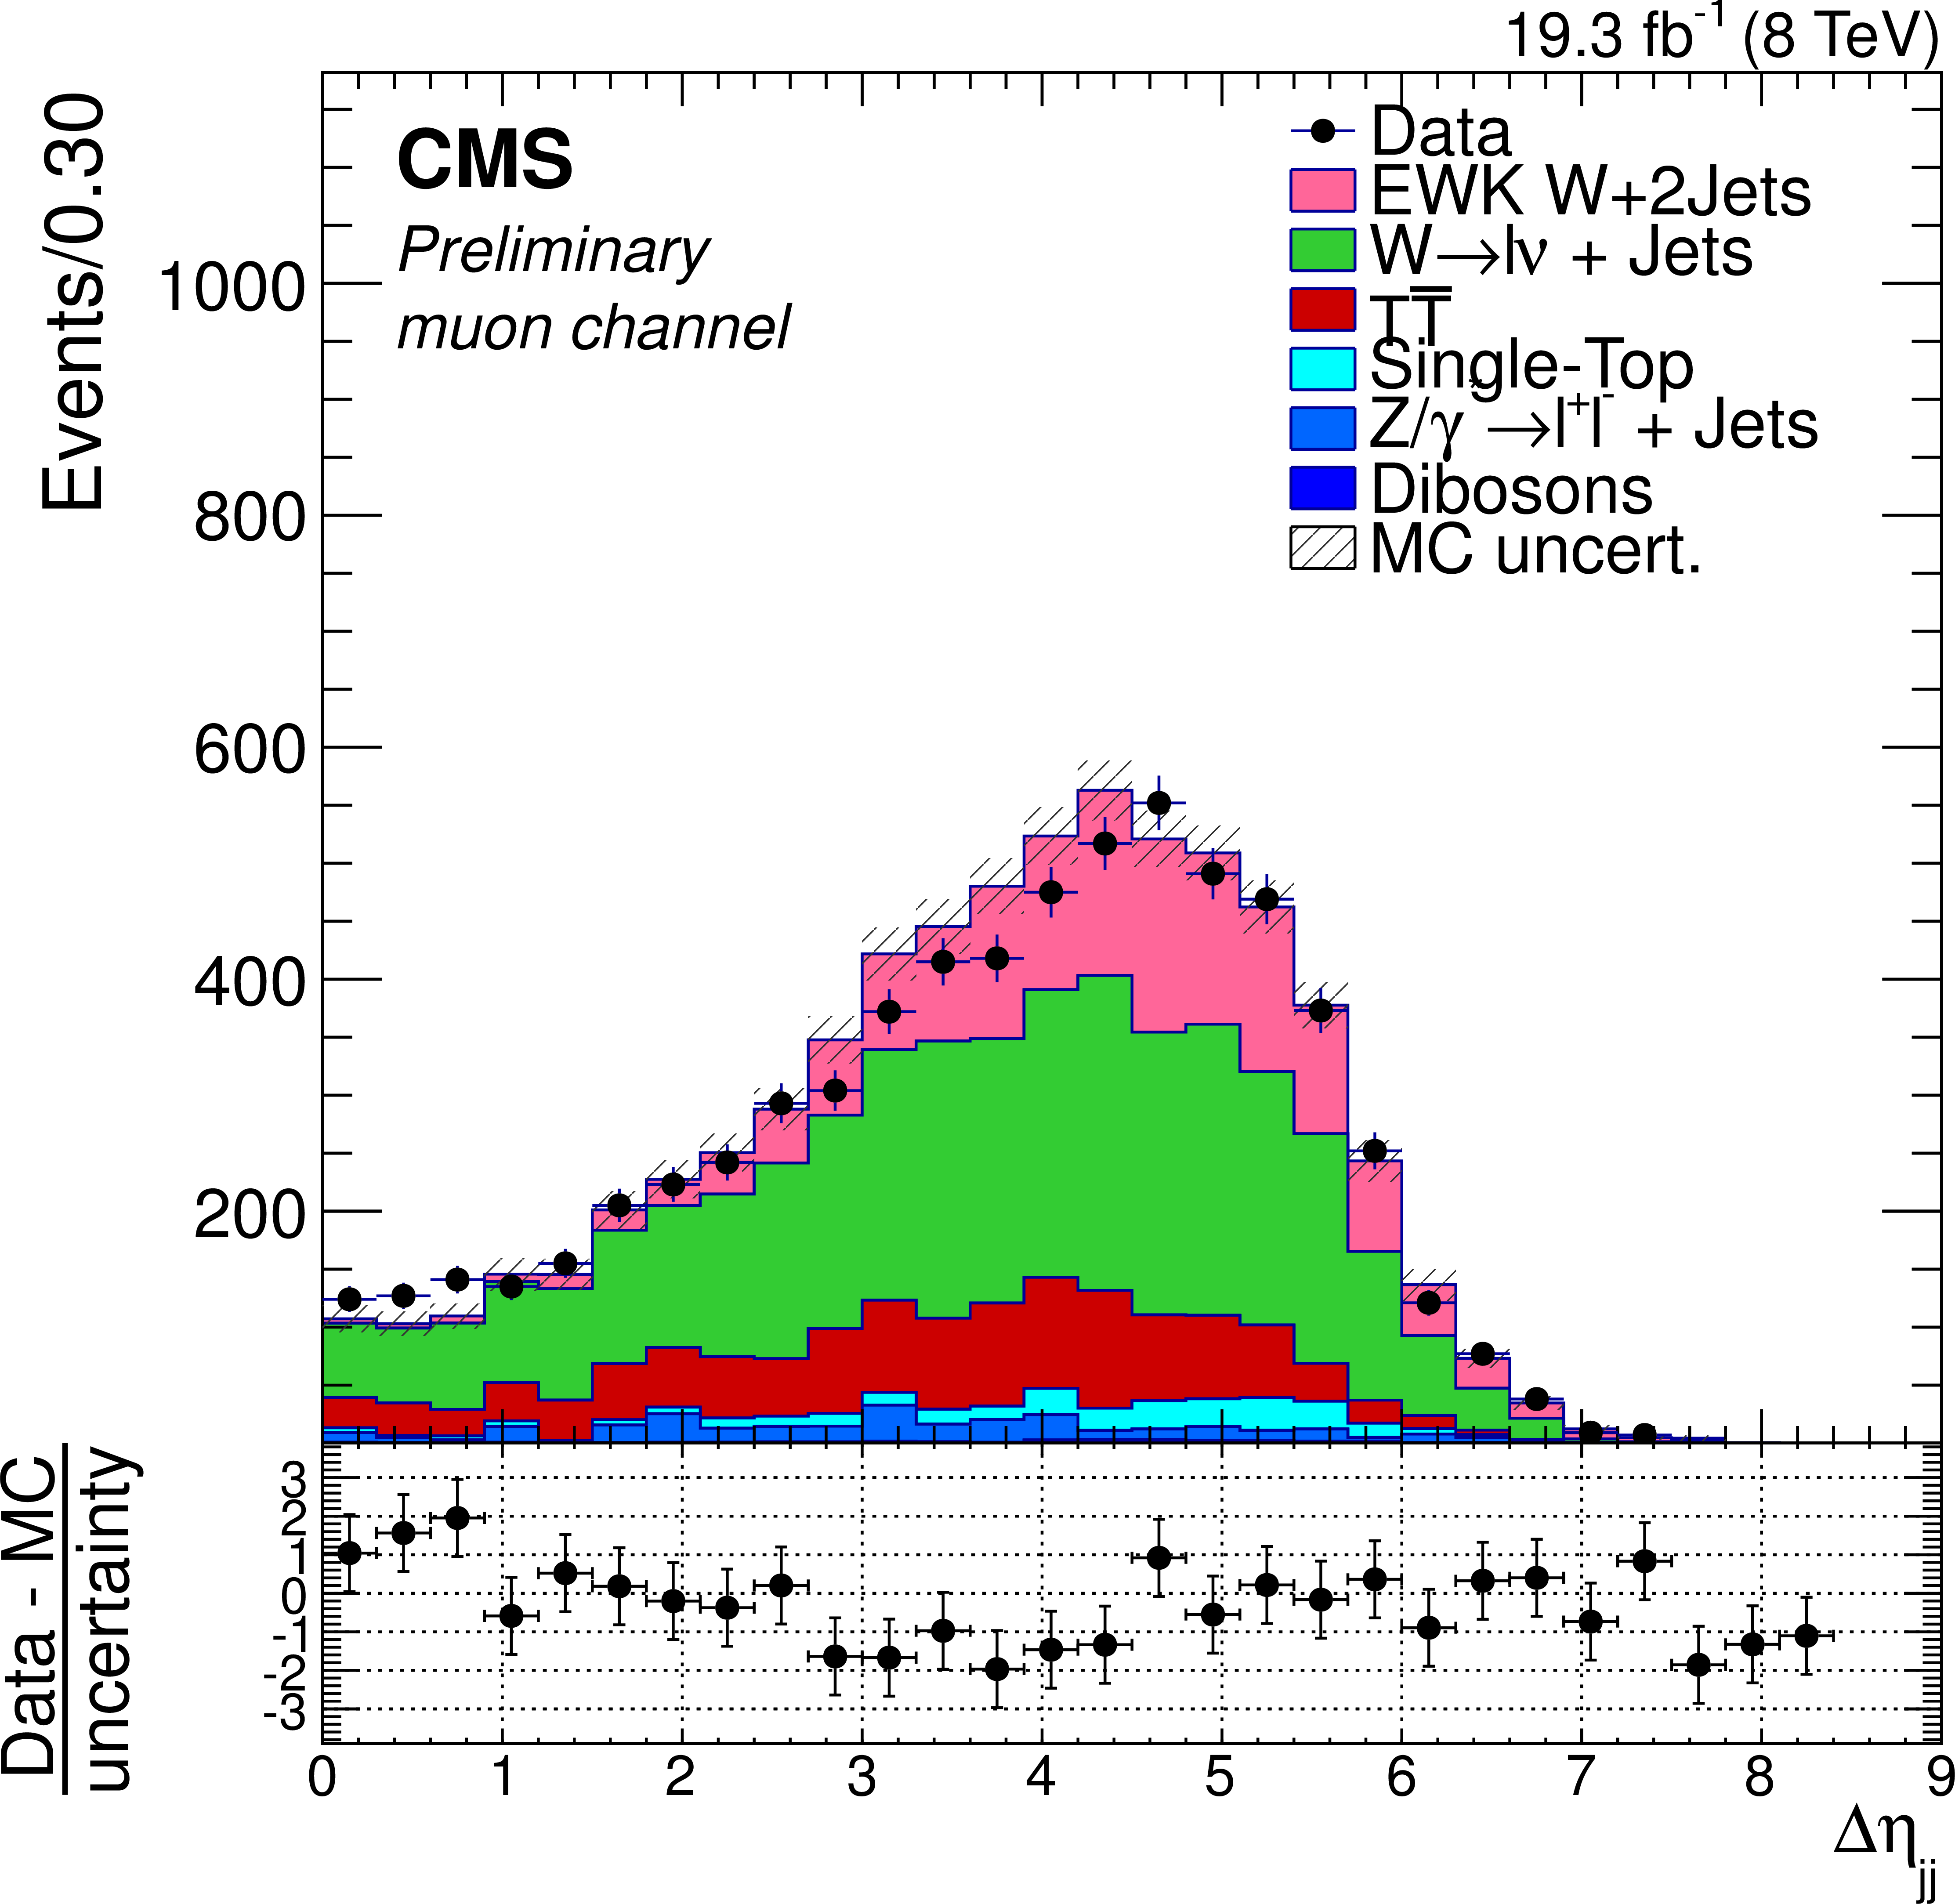
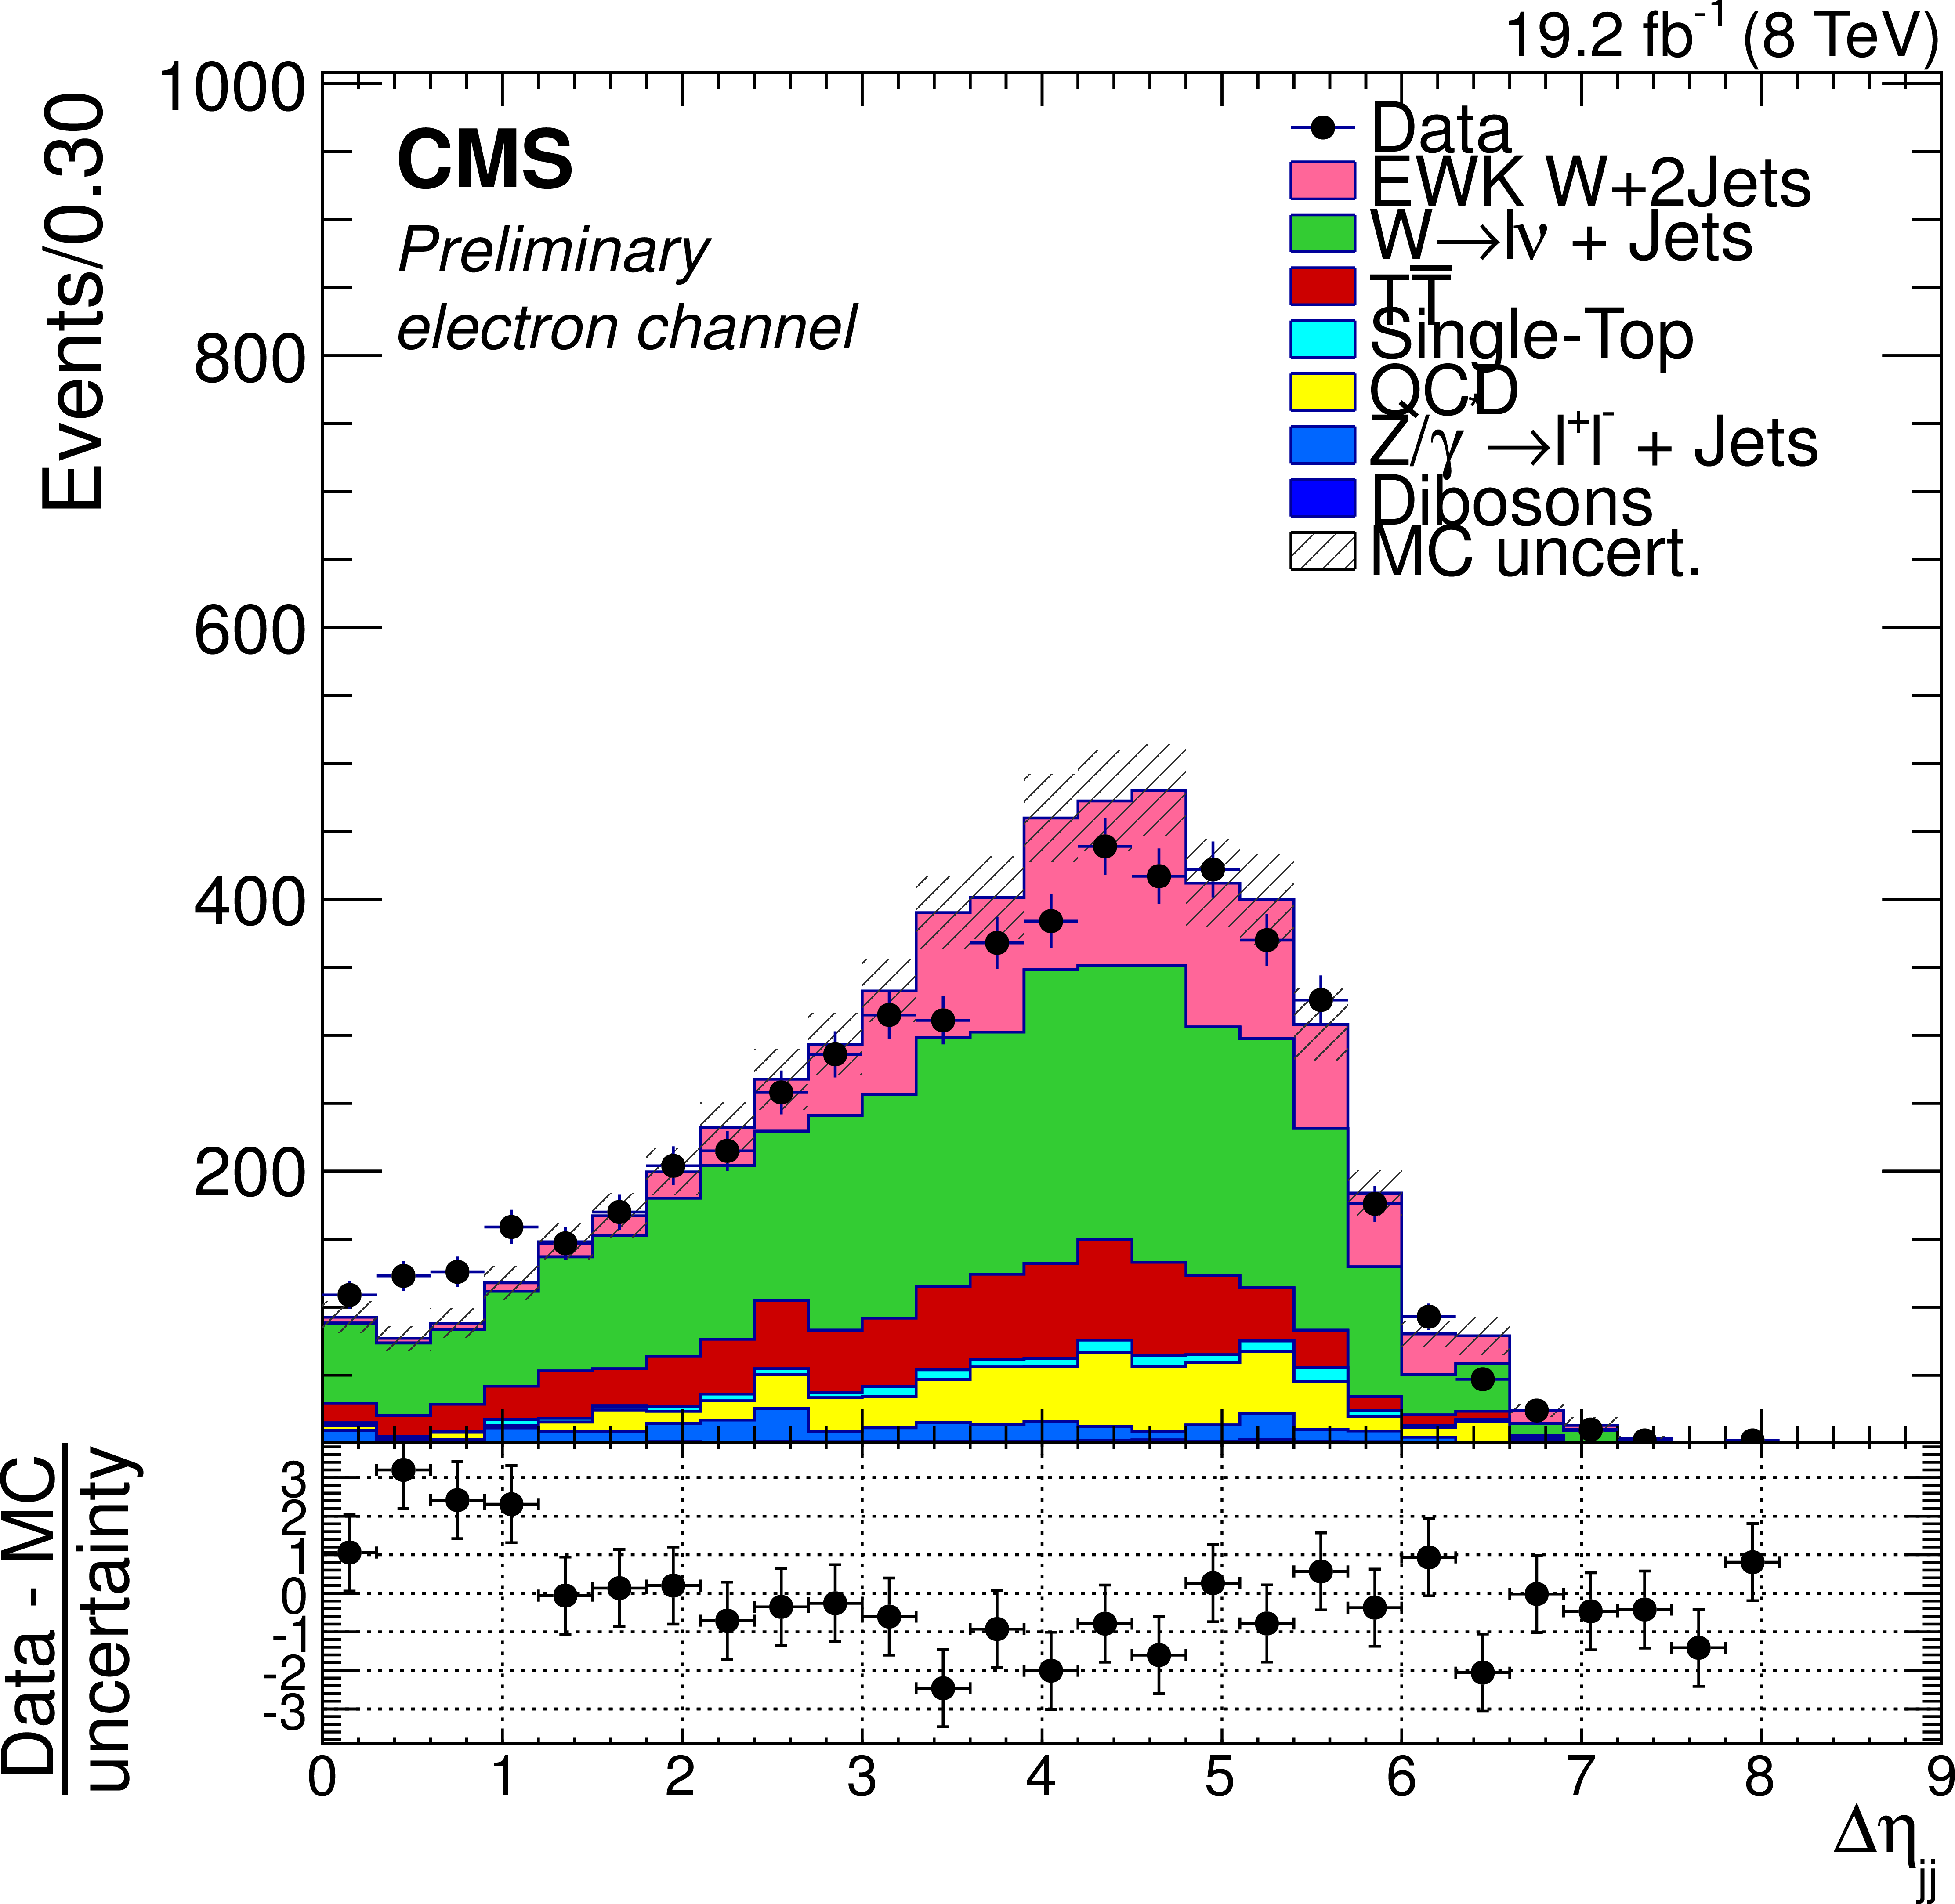
Figure 4-a:
Comparison of the $\Delta \eta $ between the two tag jets distributions between data and MC for the muon (a) and electron (b) channel. |
png ; pdf |
Figure 4-b:
Comparison of the $\Delta \eta $ between the two tag jets distributions between data and MC for the muon (a) and electron (b) channel. |

png ; pdf |
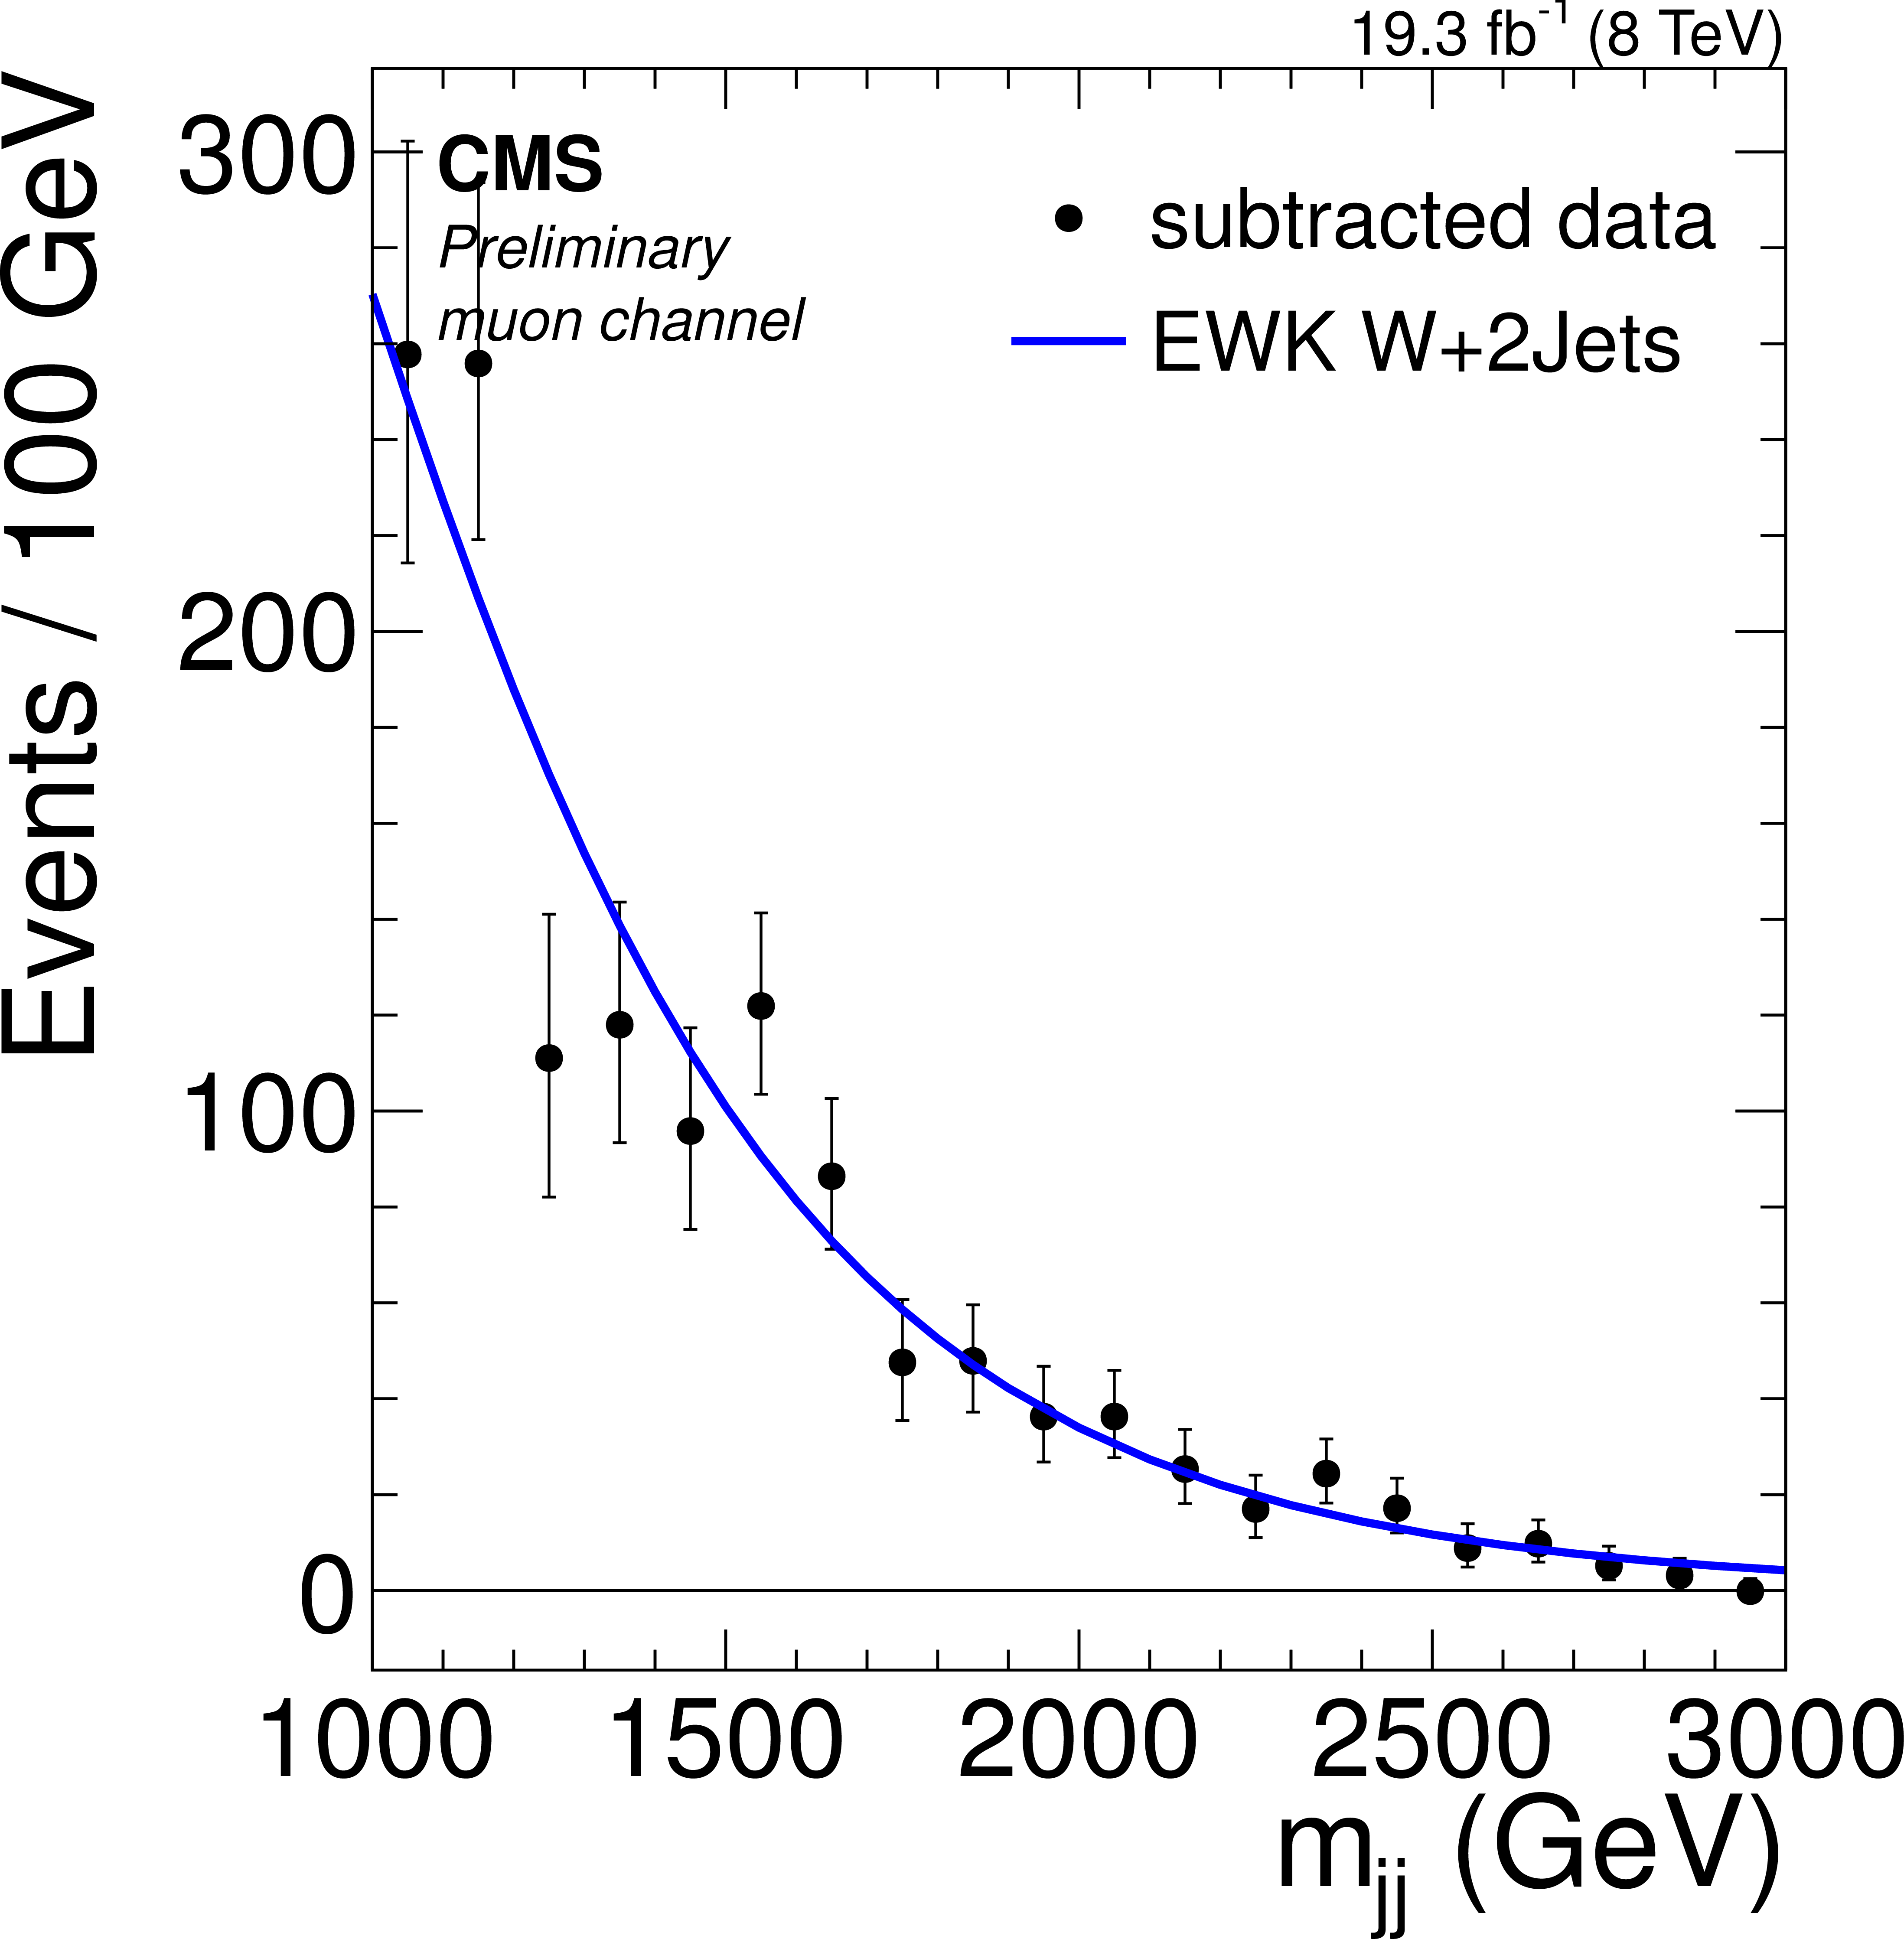
Figure 5-a:
(a,d) Distribution of the $m_{\mathrm{jj}}$ for muon (a,b,c) and electron (d,e,f) channel. (b,e) The $m_{jj}$ after subtraction of all components except the EWK W+2 jets process. The error bars represent the statistical uncertainties. (a,d) The distribution of $(\text {data} - \text {fit})/(\text {uncertainty})$. |
png ; pdf |
Figure 5-b:
(a,d) Distribution of the $m_{\mathrm{jj}}$ for muon (a,b,c) and electron (d,e,f) channel. (b,e) The $m_{jj}$ after subtraction of all components except the EWK W+2 jets process. The error bars represent the statistical uncertainties. (a,d) The distribution of $(\text {data} - \text {fit})/(\text {uncertainty})$. |

png ; pdf |
Figure 5-c:
(a,d) Distribution of the $m_{\mathrm{jj}}$ for muon (a,b,c) and electron (d,e,f) channel. (b,e) The $m_{jj}$ after subtraction of all components except the EWK W+2 jets process. The error bars represent the statistical uncertainties. (a,d) The distribution of $(\text {data} - \text {fit})/(\text {uncertainty})$. |

png ; pdf |
Figure 5-d:
(a,d) Distribution of the $m_{\mathrm{jj}}$ for muon (a,b,c) and electron (d,e,f) channel. (b,e) The $m_{jj}$ after subtraction of all components except the EWK W+2 jets process. The error bars represent the statistical uncertainties. (a,d) The distribution of $(\text {data} - \text {fit})/(\text {uncertainty})$. |
png ; pdf |
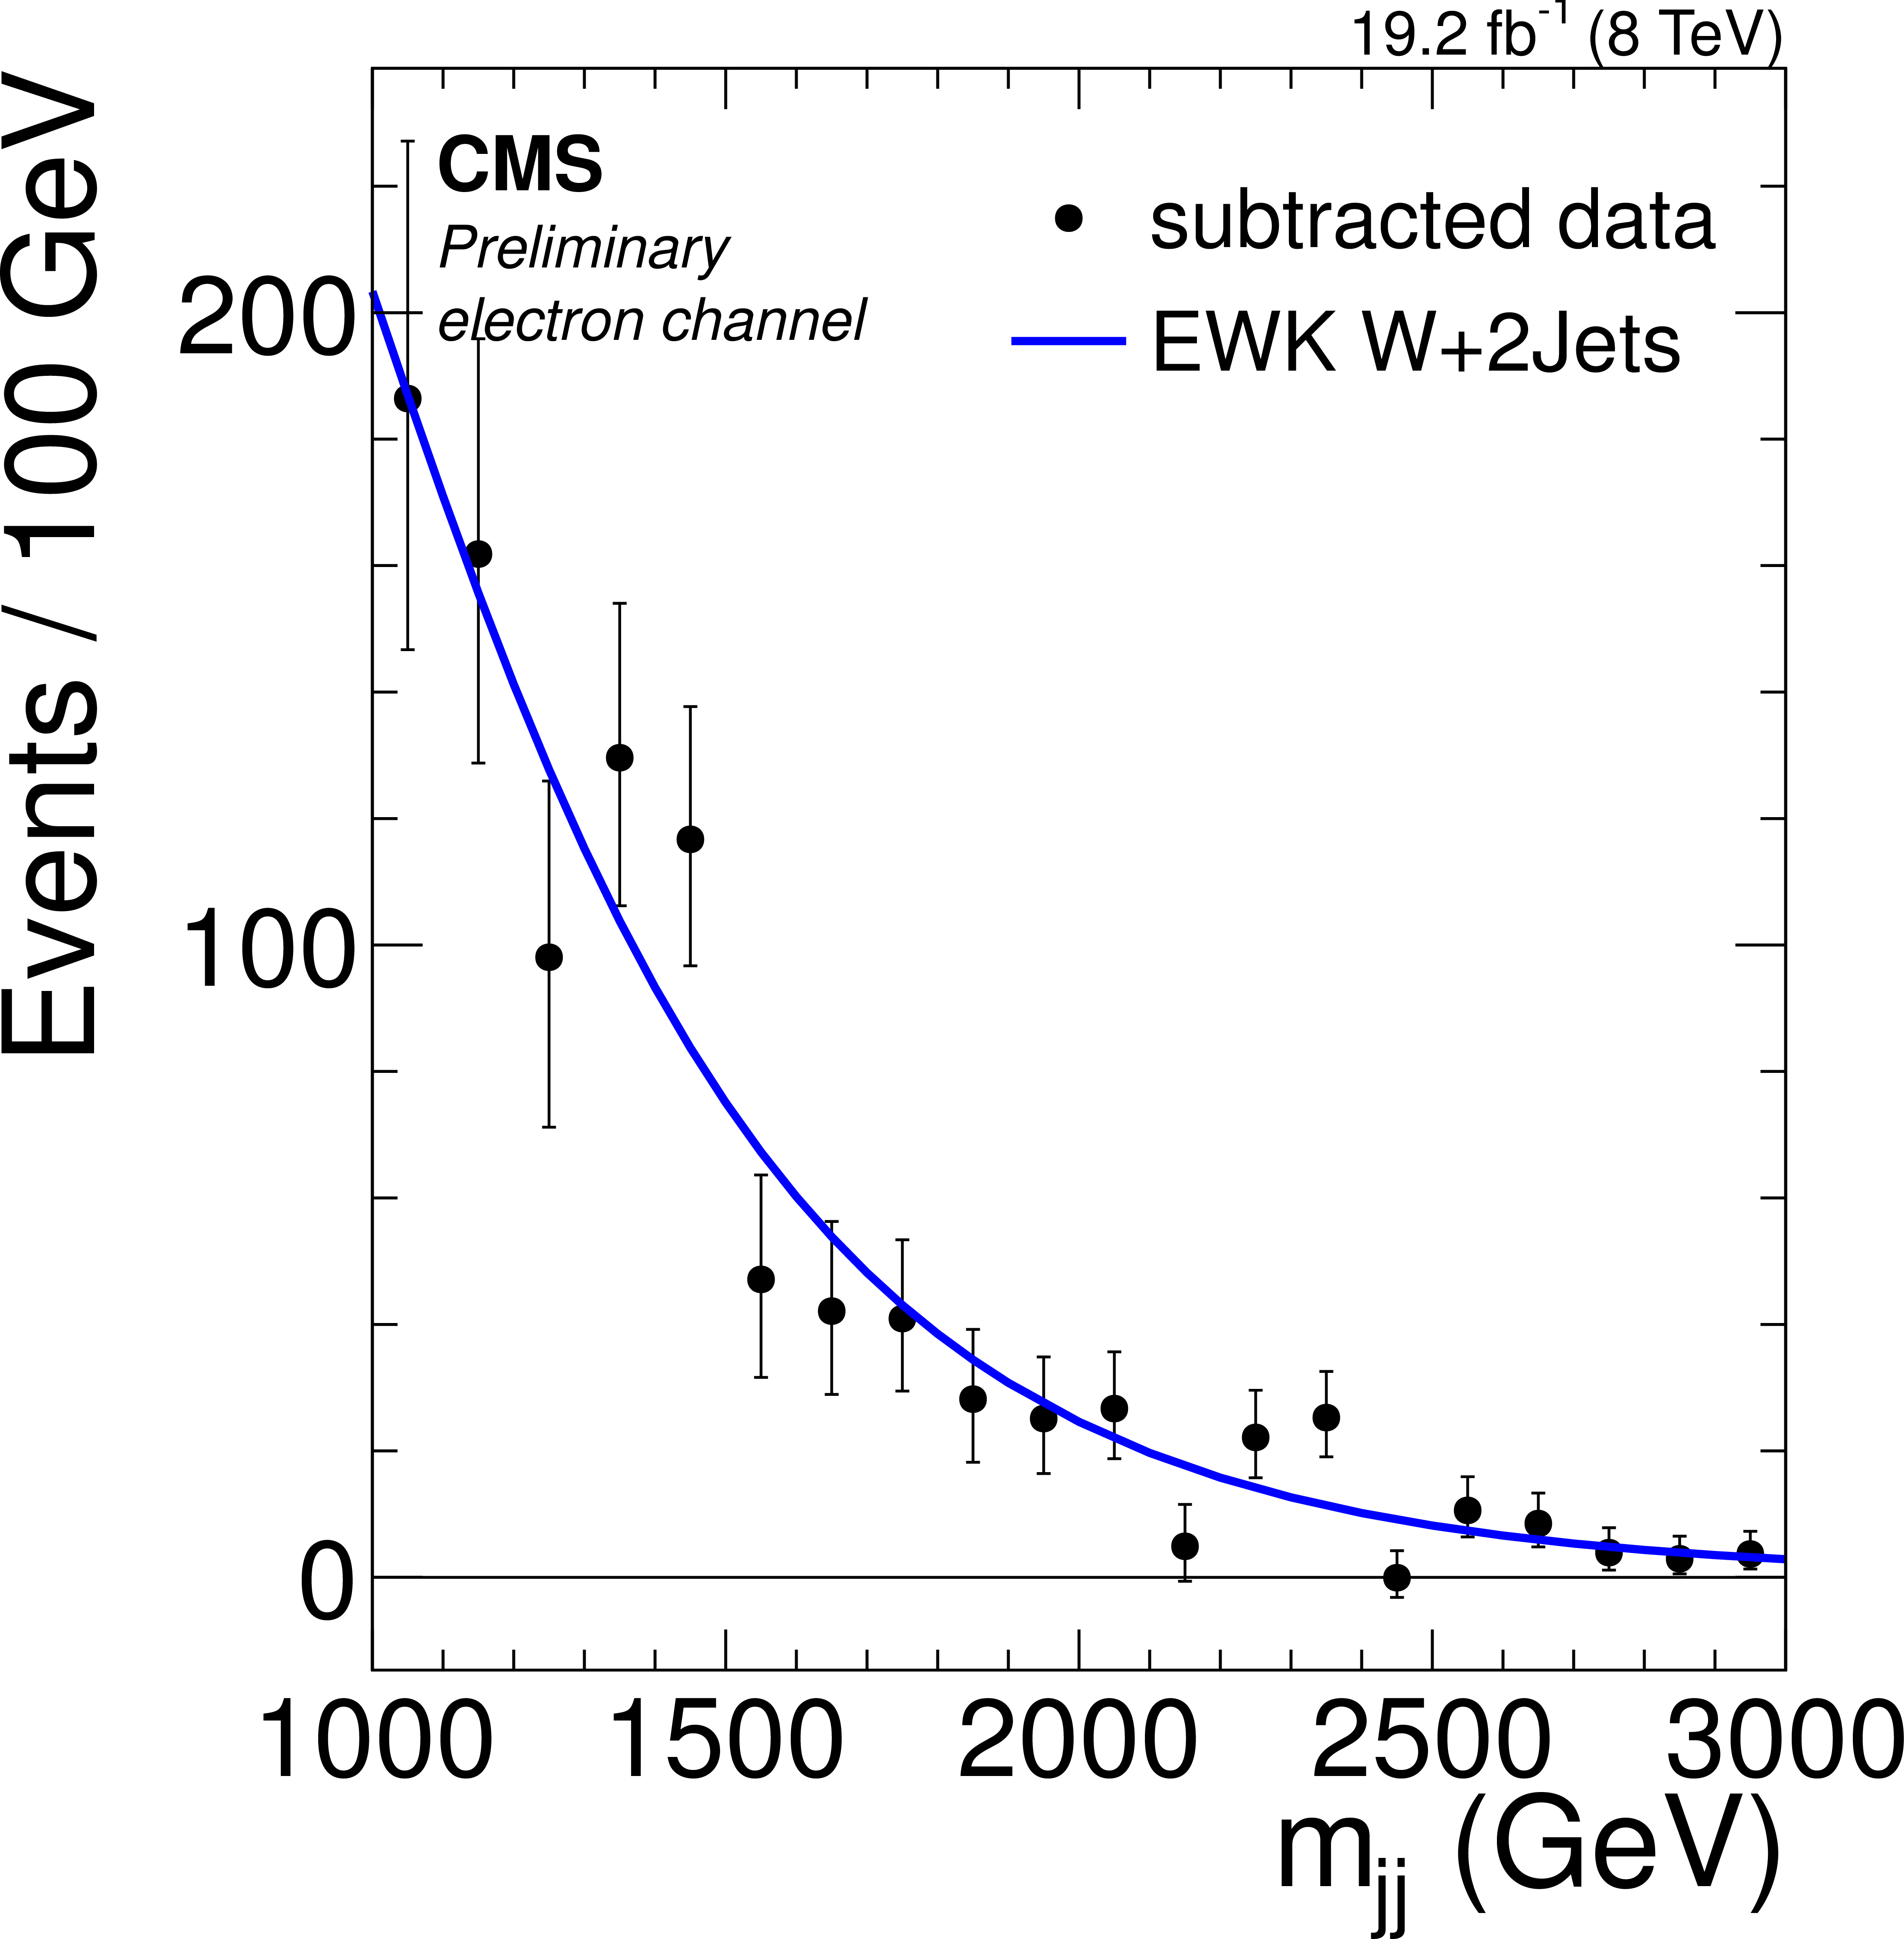
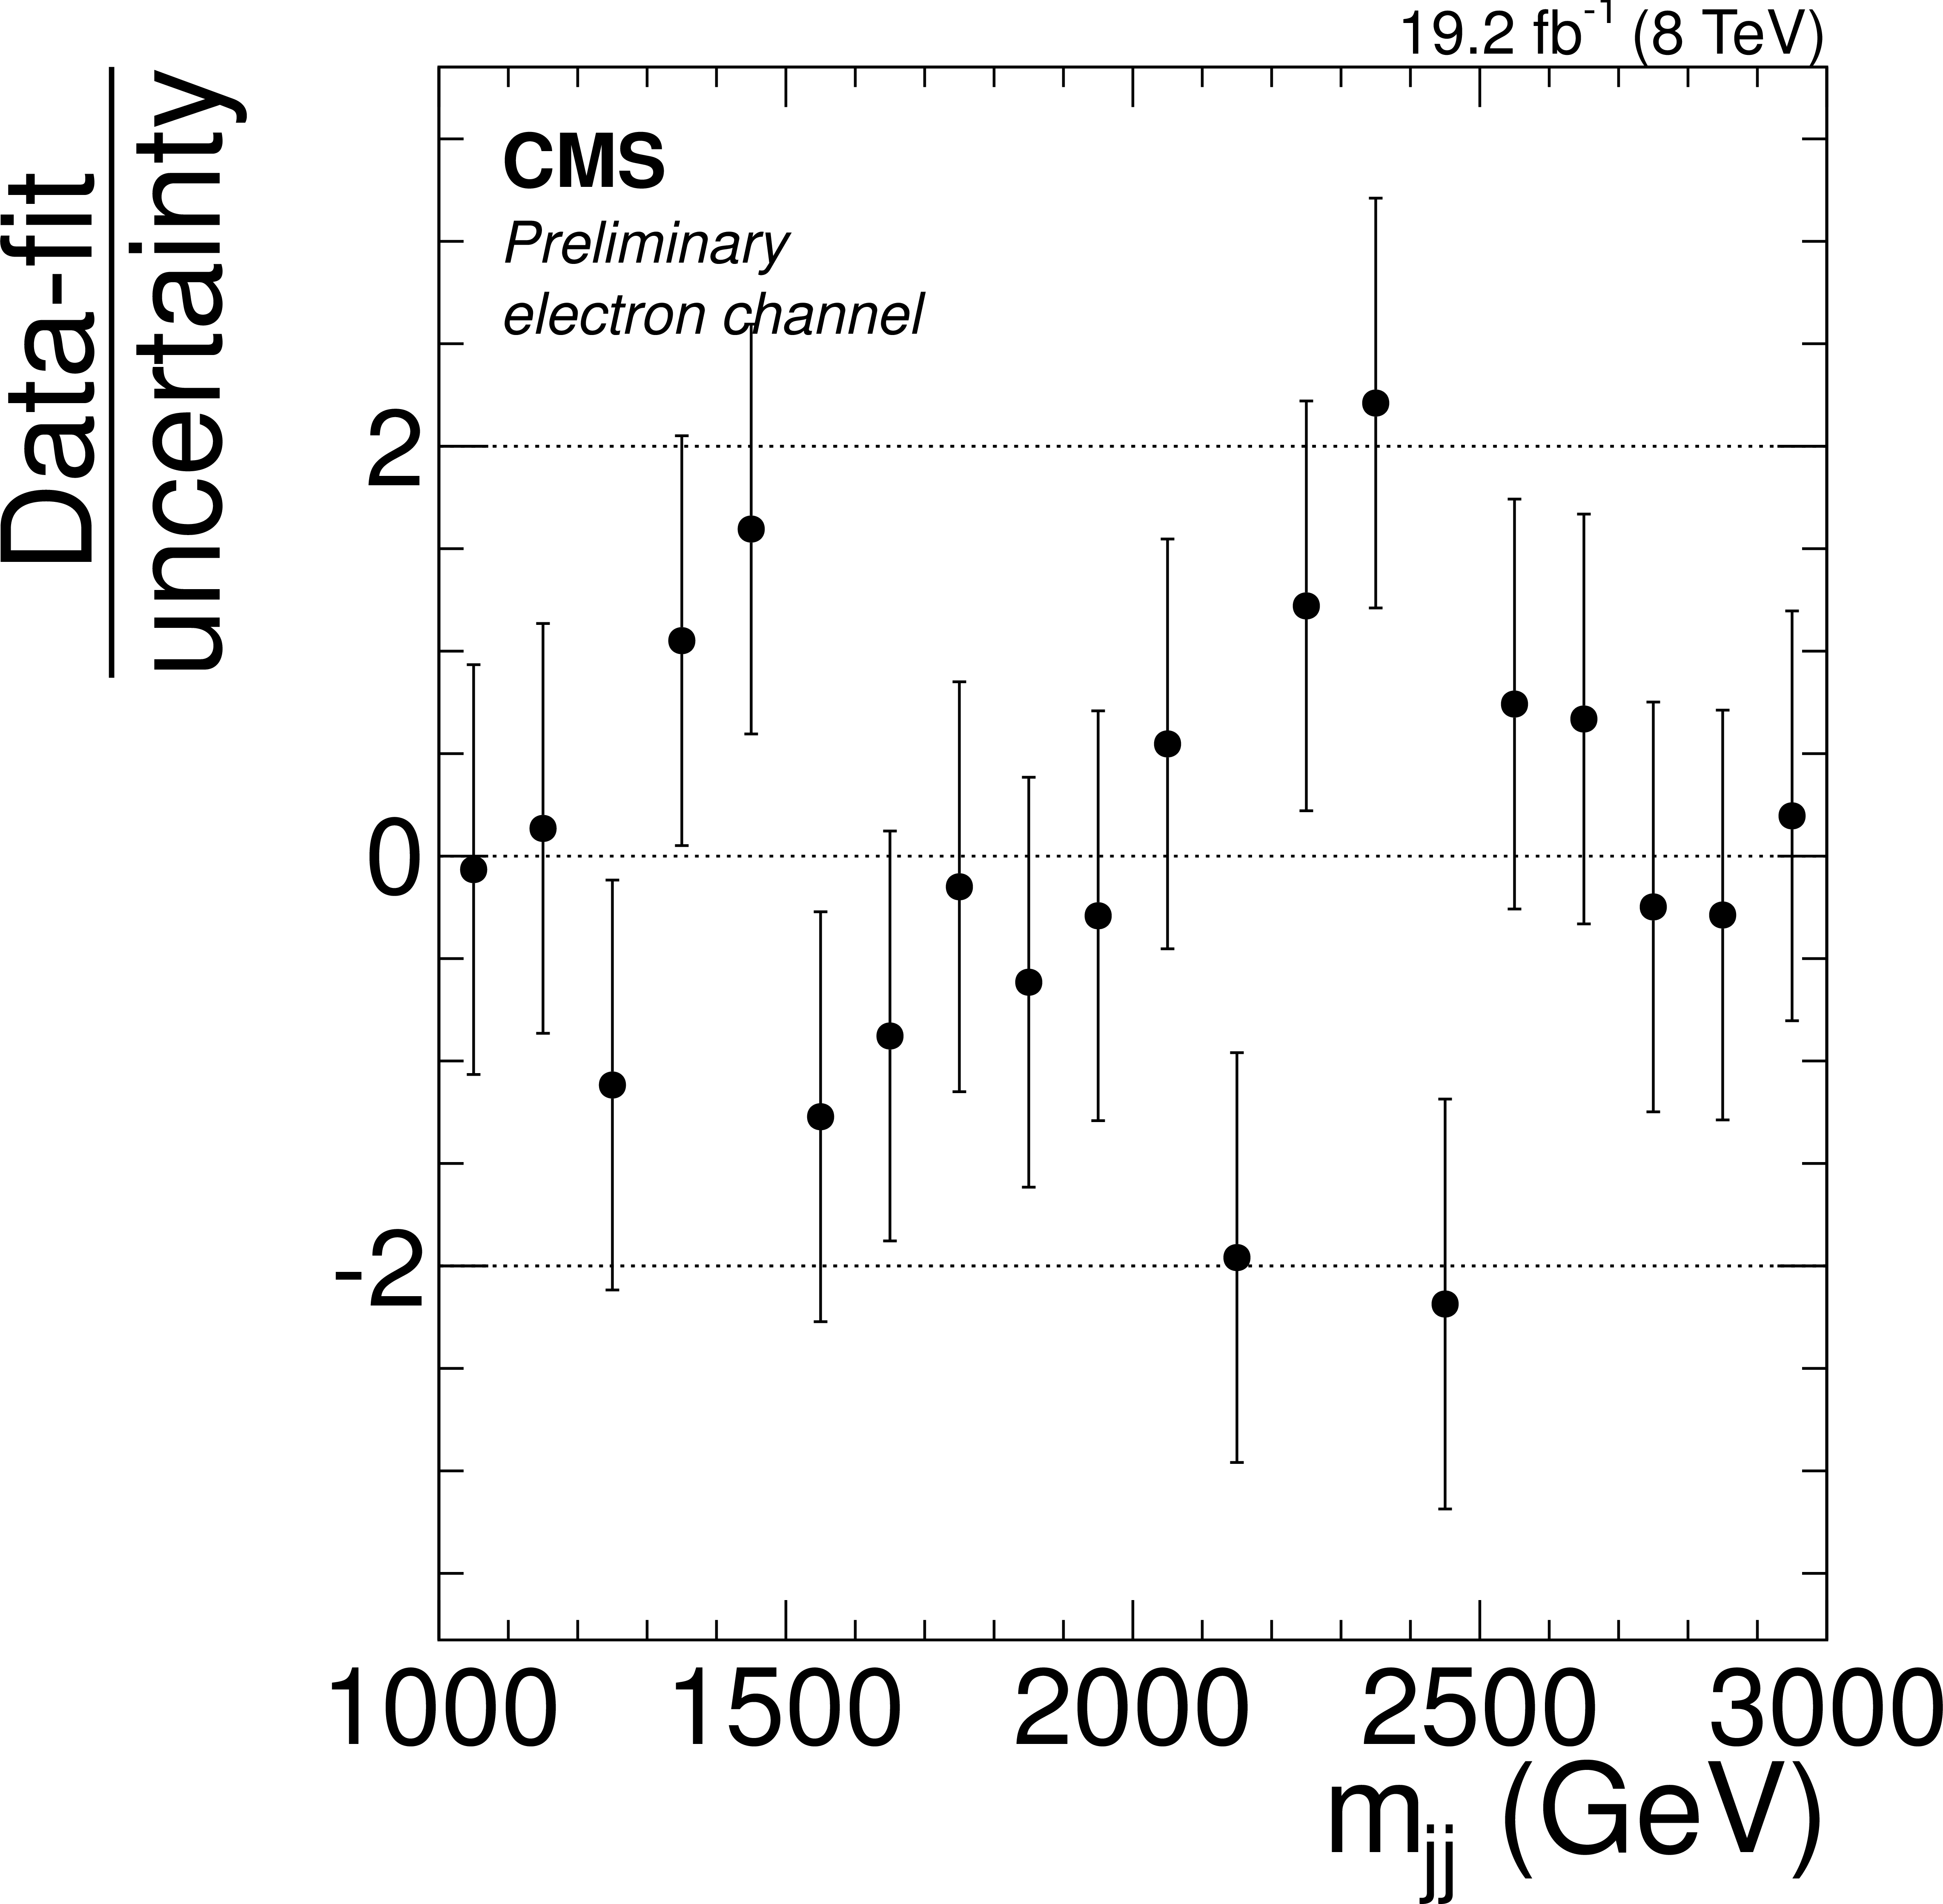
Figure 5-e:
(a,d) Distribution of the $m_{\mathrm{jj}}$ for muon (a,b,c) and electron (d,e,f) channel. (b,e) The $m_{jj}$ after subtraction of all components except the EWK W+2 jets process. The error bars represent the statistical uncertainties. (a,d) The distribution of $(\text {data} - \text {fit})/(\text {uncertainty})$. |
png ; pdf |
Figure 5-f:
(a,d) Distribution of the $m_{\mathrm{jj}}$ for muon (a,b,c) and electron (d,e,f) channel. (b,e) The $m_{jj}$ after subtraction of all components except the EWK W+2 jets process. The error bars represent the statistical uncertainties. (a,d) The distribution of $(\text {data} - \text {fit})/(\text {uncertainty})$. |
|
|
Compact Muon Solenoid LHC, CERN |
|

|

|

|

|

|