

Compact Muon Solenoid
LHC, CERN
| CMS-PAS-HIN-21-006 | ||
| Two-particle femtoscopic correlation measurements of $\mathrm{K^{0}_{S}}$ and $\Lambda (\overline{\Lambda})$ particles in PbPb collisions at ${\sqrt {\smash [b]{s_{_{\mathrm {NN}}}}}}= $ 5.02 TeV | ||
| CMS Collaboration | ||
| June 2022 | ||
| Abstract: Two-particle correlations as a function of relative momentum are presented for $\mathrm{K^{0}_{S}}$, $\Lambda$, and $\overline{\Lambda}$ strange hadrons produced in lead-lead collisions at ${\sqrt {\smash [b]{s_{_{\mathrm {NN}}}}}}= $ 5.02 TeV. The data were obtained using the CMS detector at the LHC. Such correlations are sensitive to quantum statistics and to possible final-state interactions between the particles. Source radii extracted from $\mathrm{K^{0}_{S}K^{0}_{S}}$ correlations in different centrality regions are found to decrease in going from central to peripheral collisions. Strong-interaction scattering parameters (i.e., scattering length and effective range) are determined from $\Lambda\mathrm{K^{0}_{S}}\oplus\overline{\Lambda}\mathrm{K^{0}_{S}}$ and $\Lambda\Lambda\oplus\overline{\Lambda}\overline{\Lambda}$ correlations using the Lednicky-Lyuboshits model and compared to other experimental and theoretical results. | ||
|
Links:
CDS record (PDF) ;
CADI line (restricted) ;
These preliminary results are superseded in this paper, Submitted to PLB. The superseded preliminary plots can be found here. |
||
| Figures | |
png pdf |
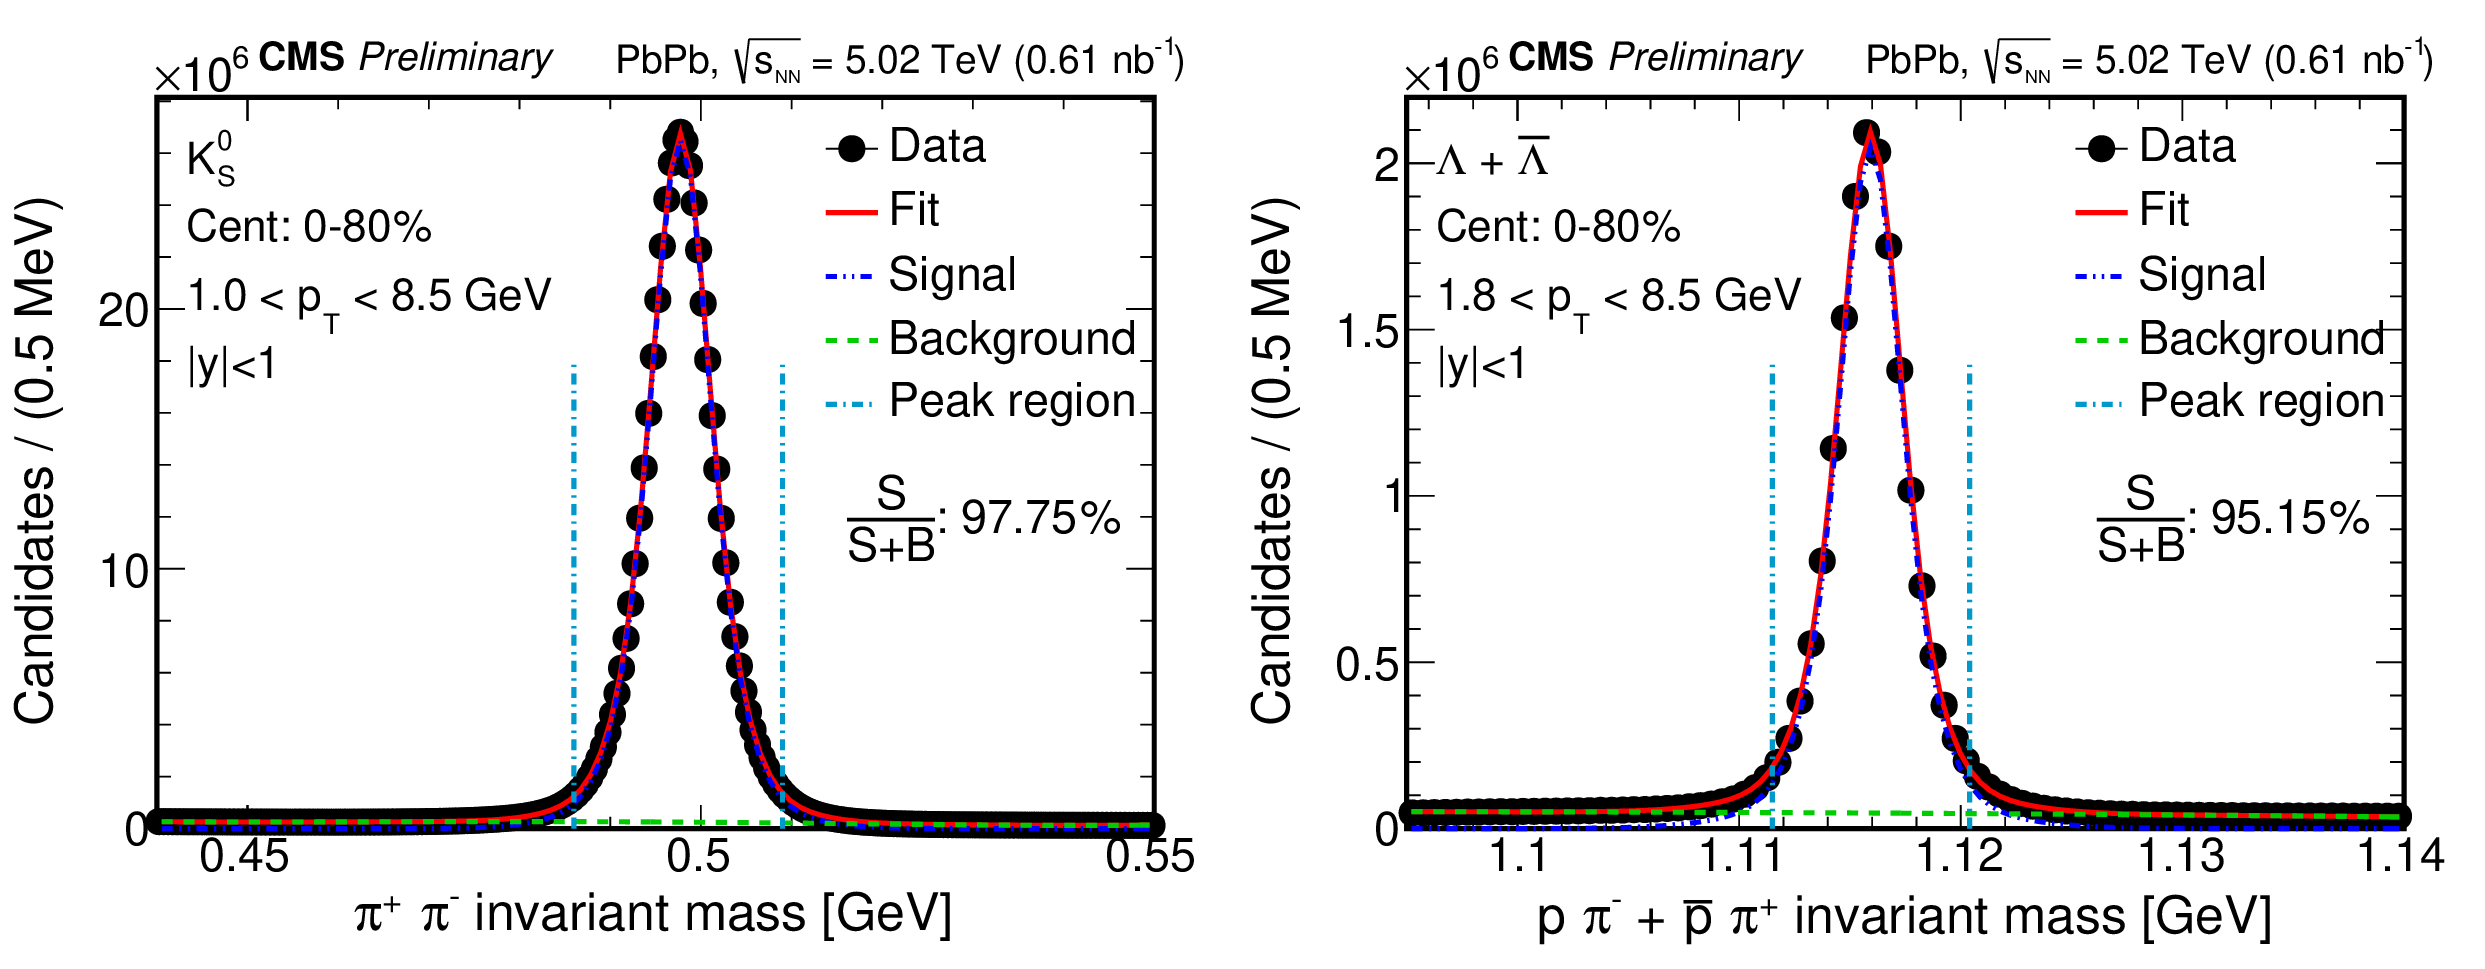
Figure 1:
The invariant mass of ${\mathrm {K^0_S}}$ (left) and $\Lambda{+}\overline {\Lambda}$ (right), and their corresponding fits in the 0-80% centrality range. The circles are the data, and the fit is shown with a solid curve for the total fit, a dashed-dotted curve for the signal component, and a dashed curve for the background component. The vertical lines indicate the $ \pm $2$ \sigma $ peak region. |
png pdf |
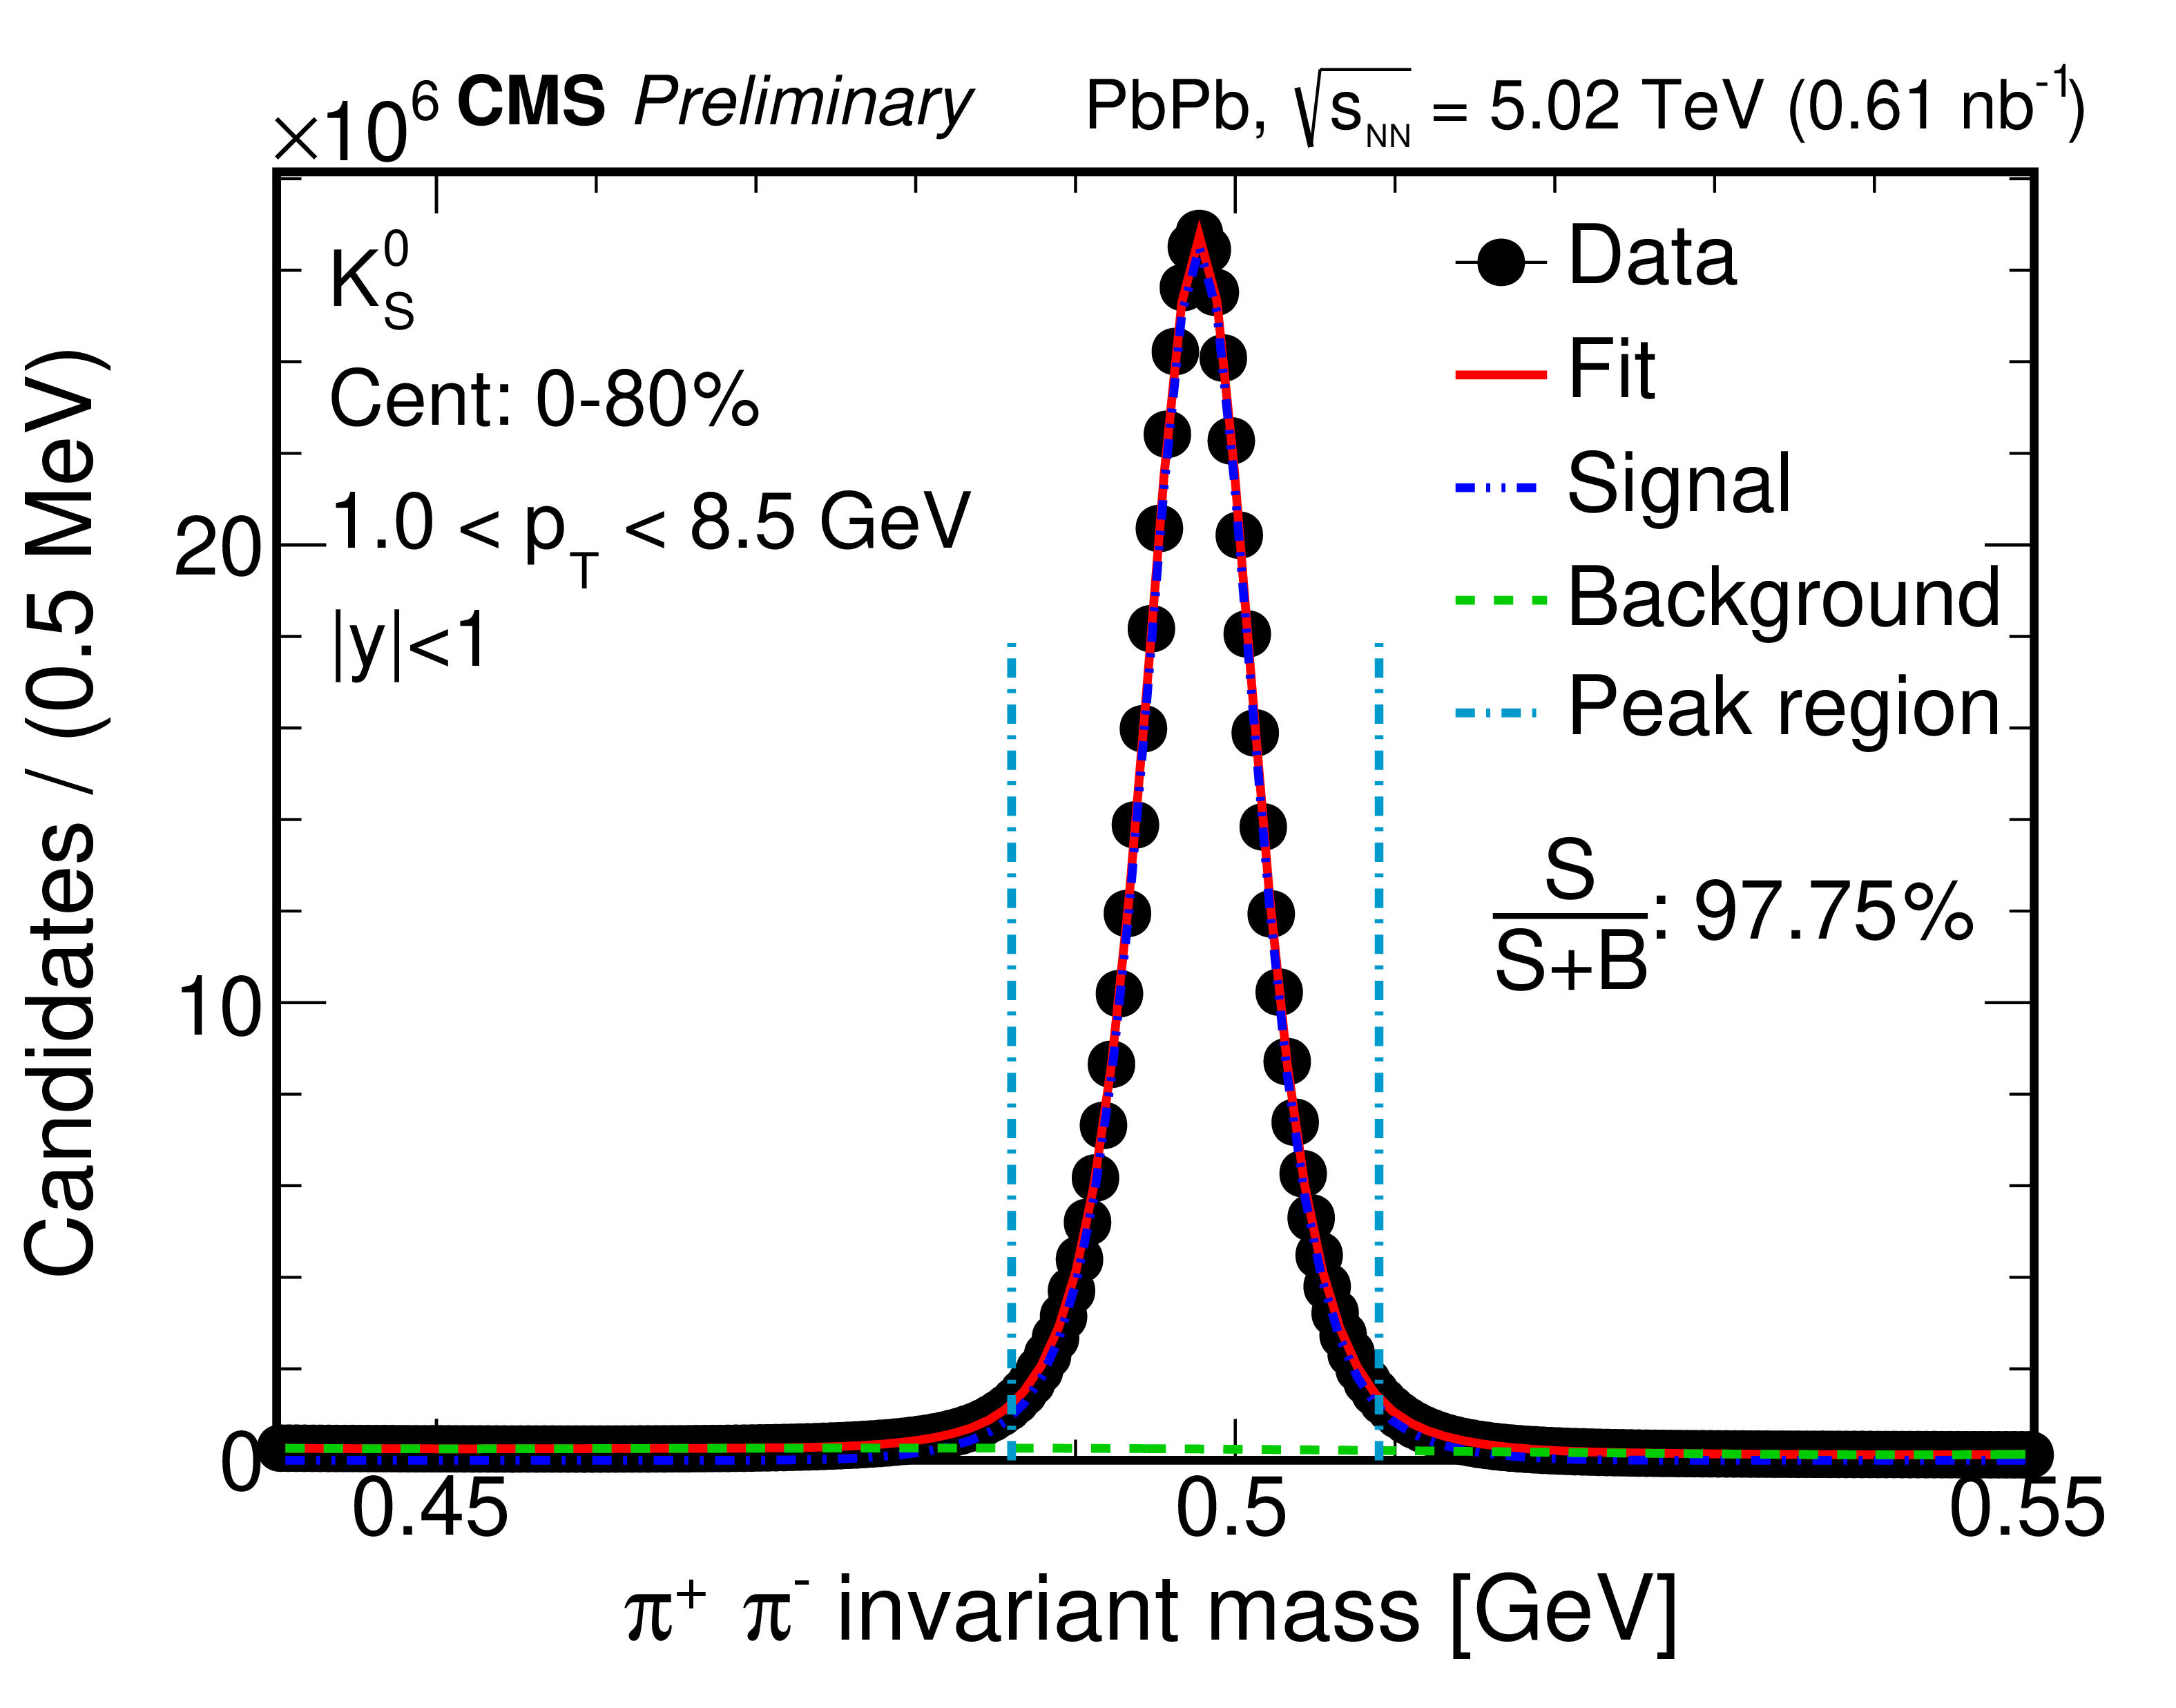
Figure 1-a:
The invariant mass of ${\mathrm {K^0_S}}$ (left) and $\Lambda{+}\overline {\Lambda}$ (right), and their corresponding fits in the 0-80% centrality range. The circles are the data, and the fit is shown with a solid curve for the total fit, a dashed-dotted curve for the signal component, and a dashed curve for the background component. The vertical lines indicate the $ \pm $2$ \sigma $ peak region. |
png pdf |
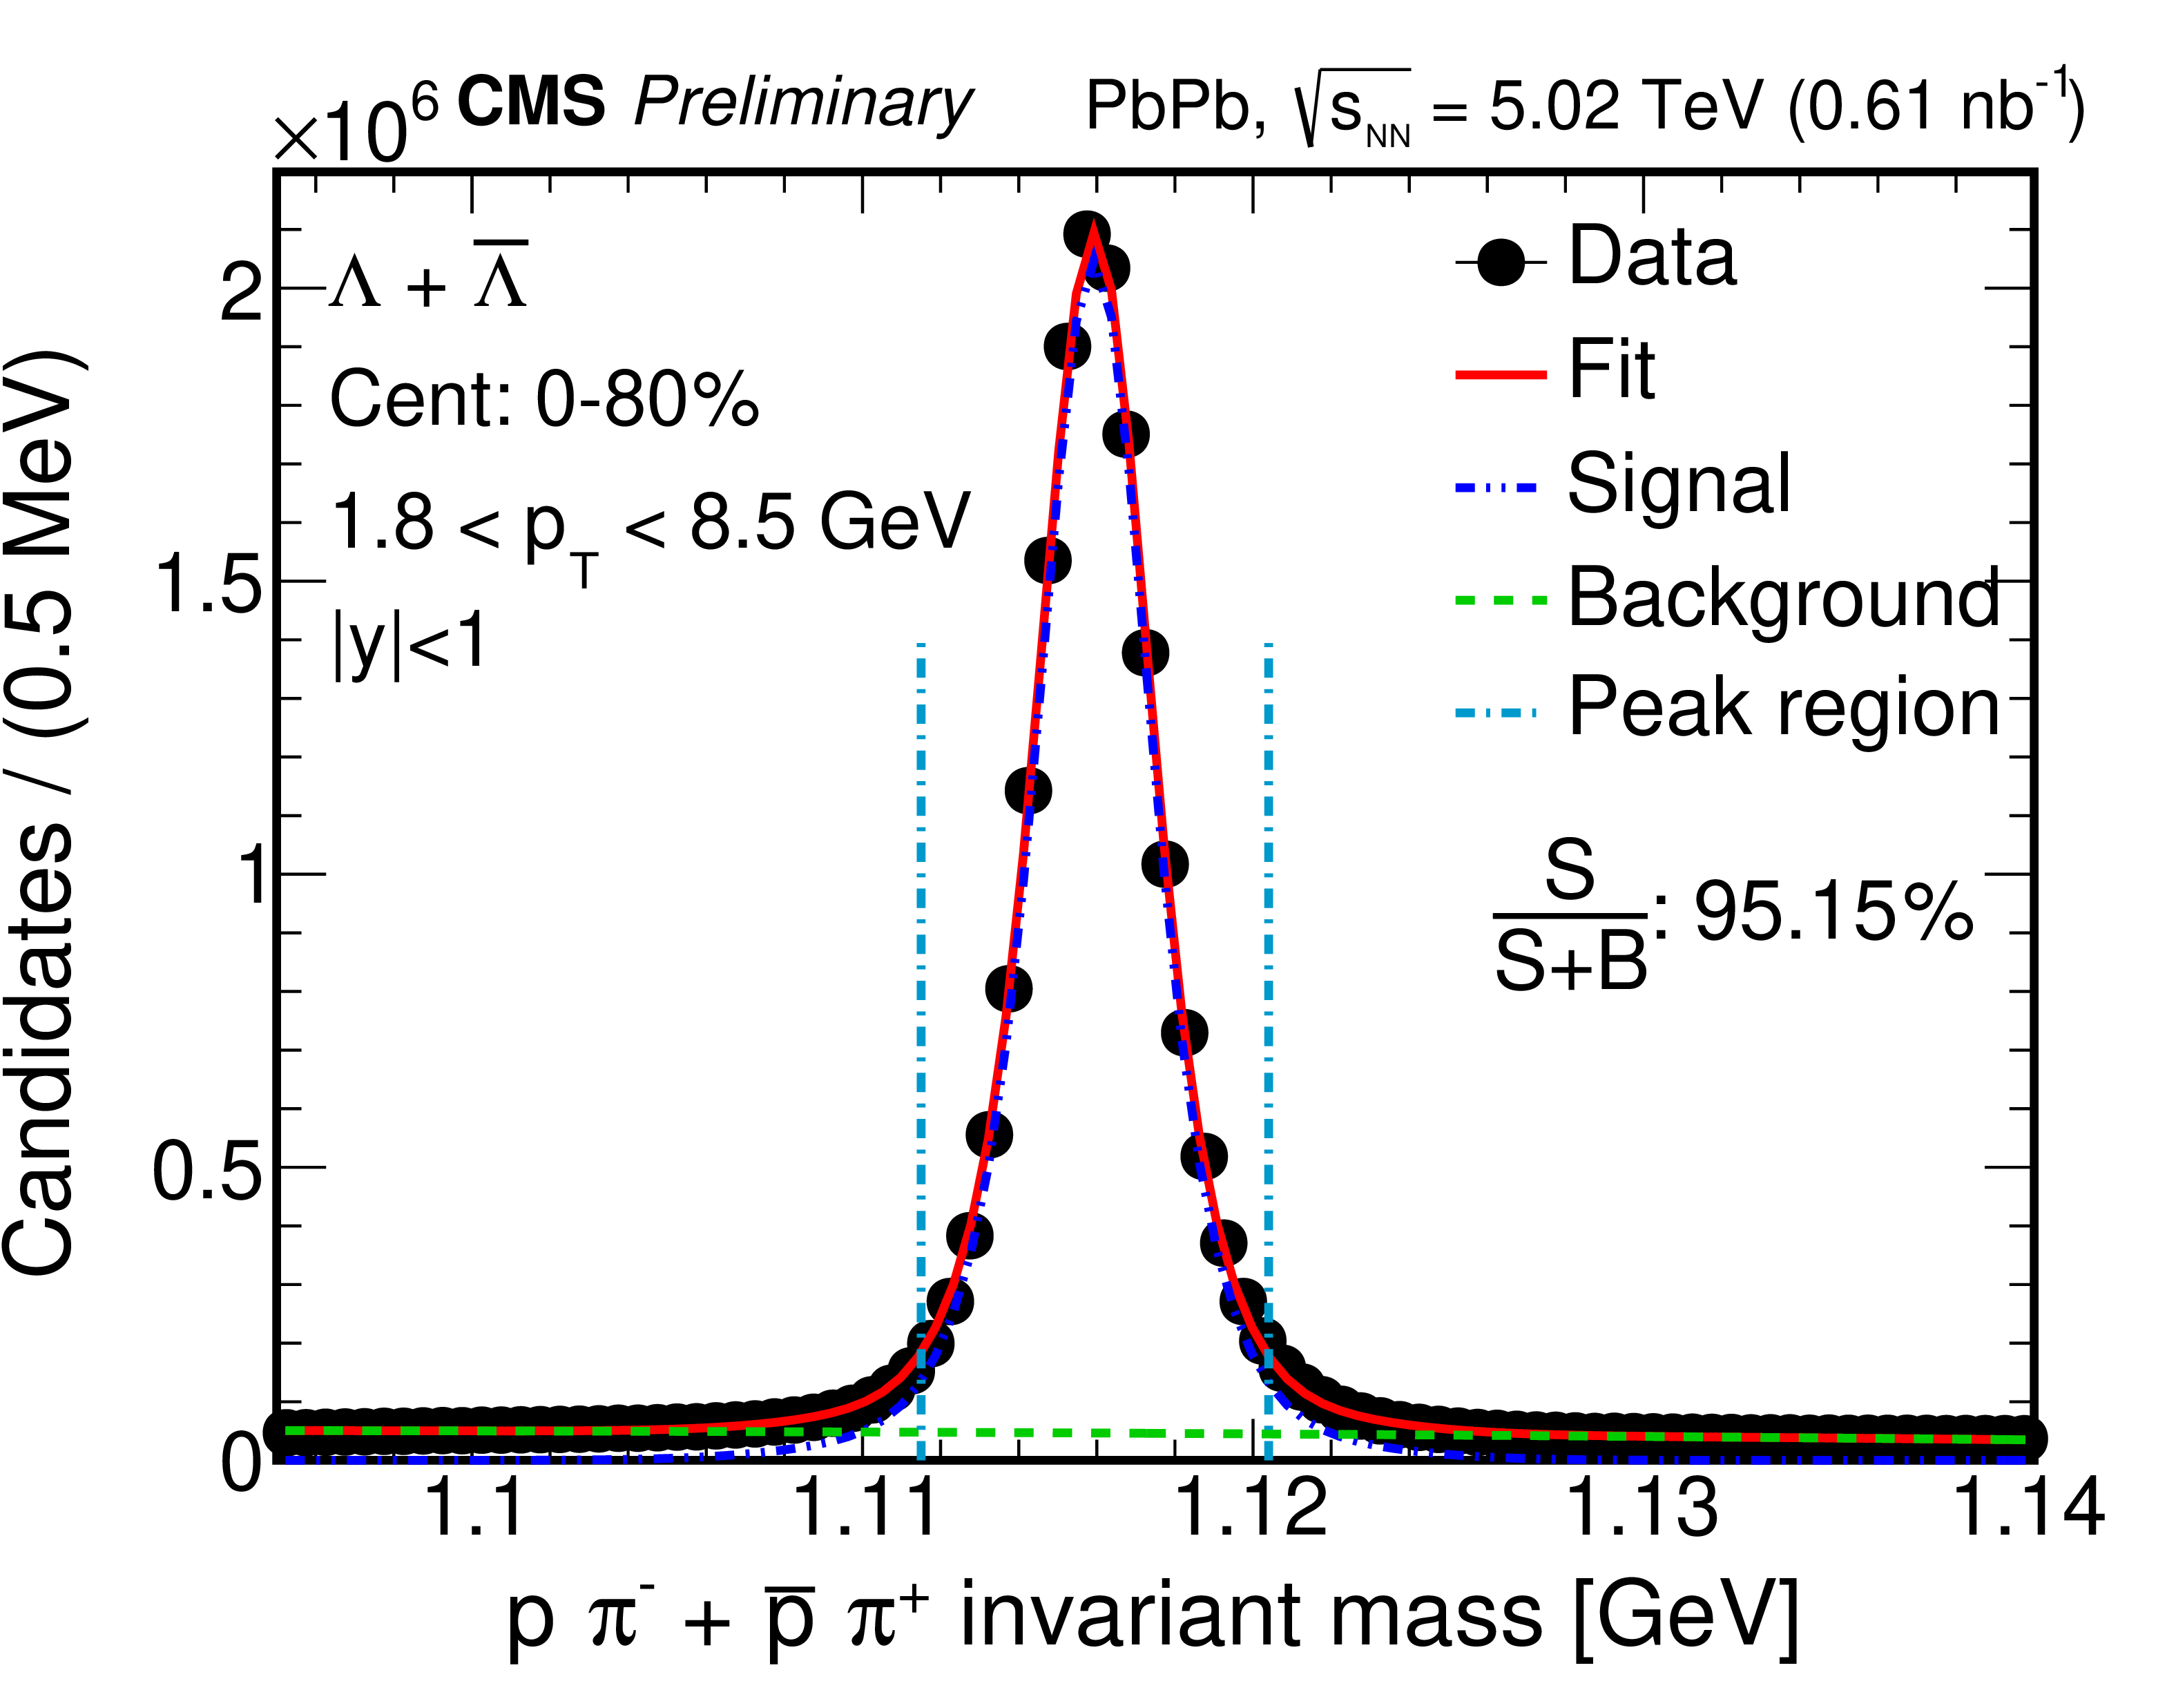
Figure 1-b:
The invariant mass of ${\mathrm {K^0_S}}$ (left) and $\Lambda{+}\overline {\Lambda}$ (right), and their corresponding fits in the 0-80% centrality range. The circles are the data, and the fit is shown with a solid curve for the total fit, a dashed-dotted curve for the signal component, and a dashed curve for the background component. The vertical lines indicate the $ \pm $2$ \sigma $ peak region. |
png pdf |
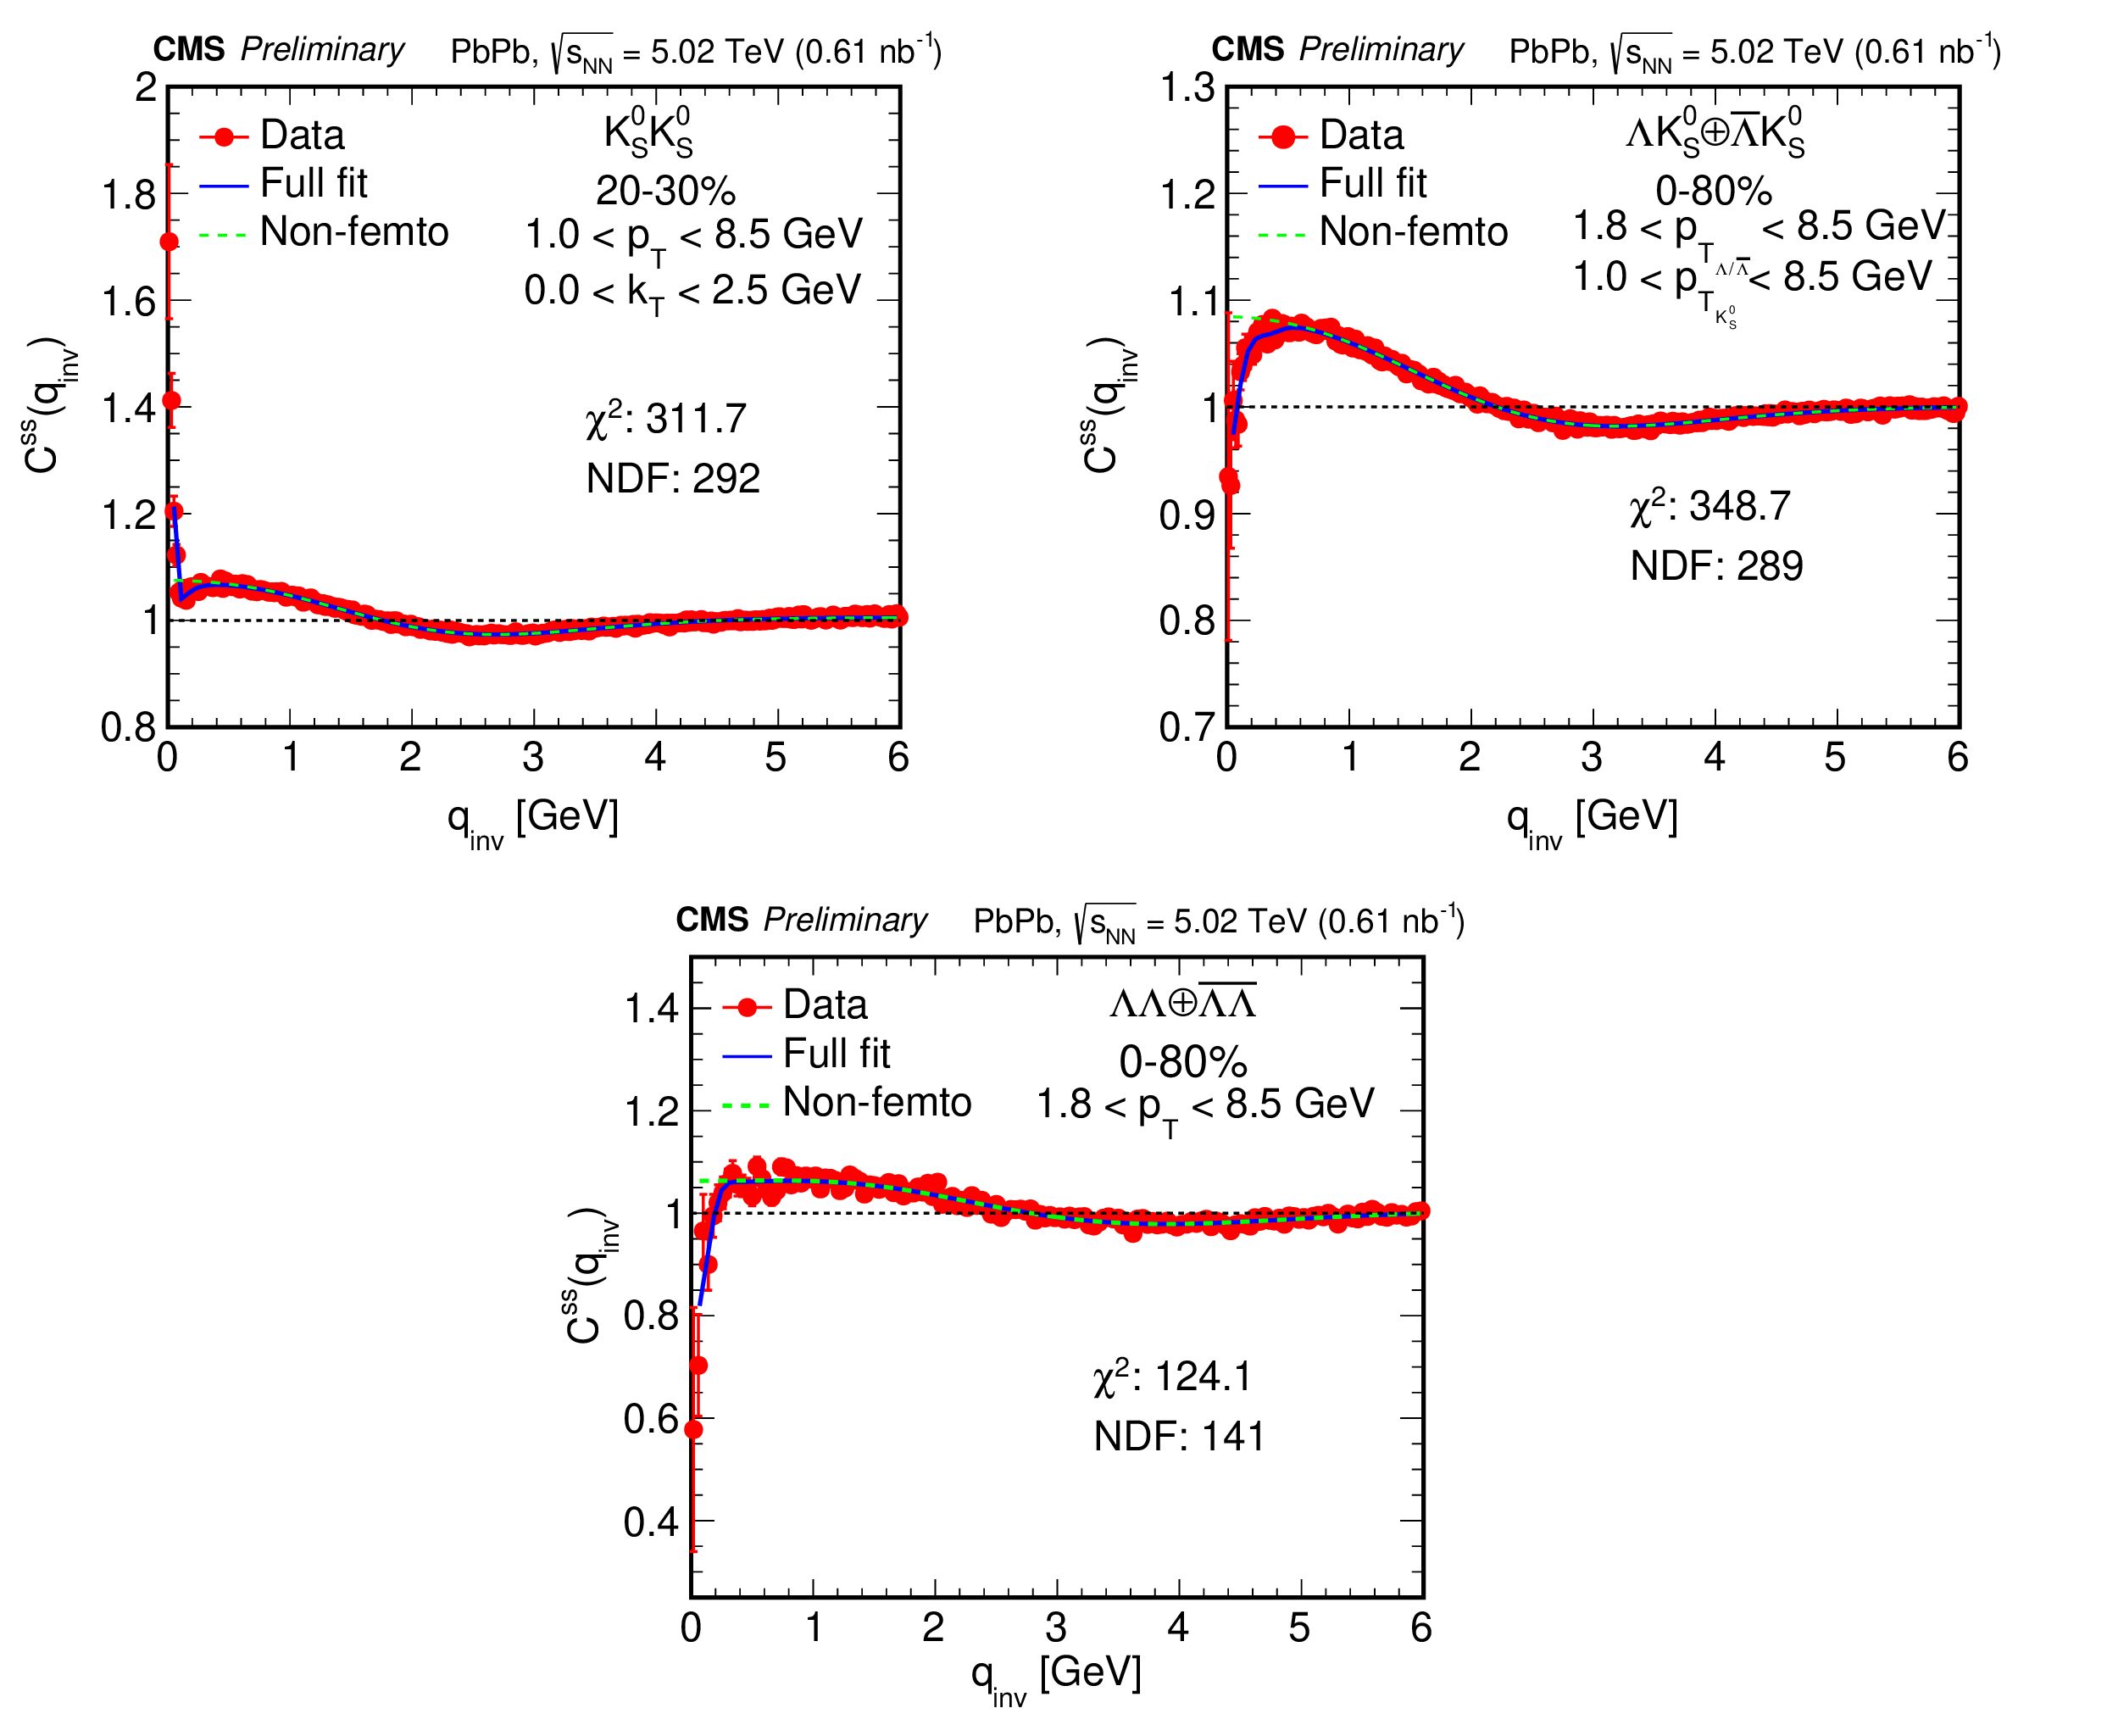
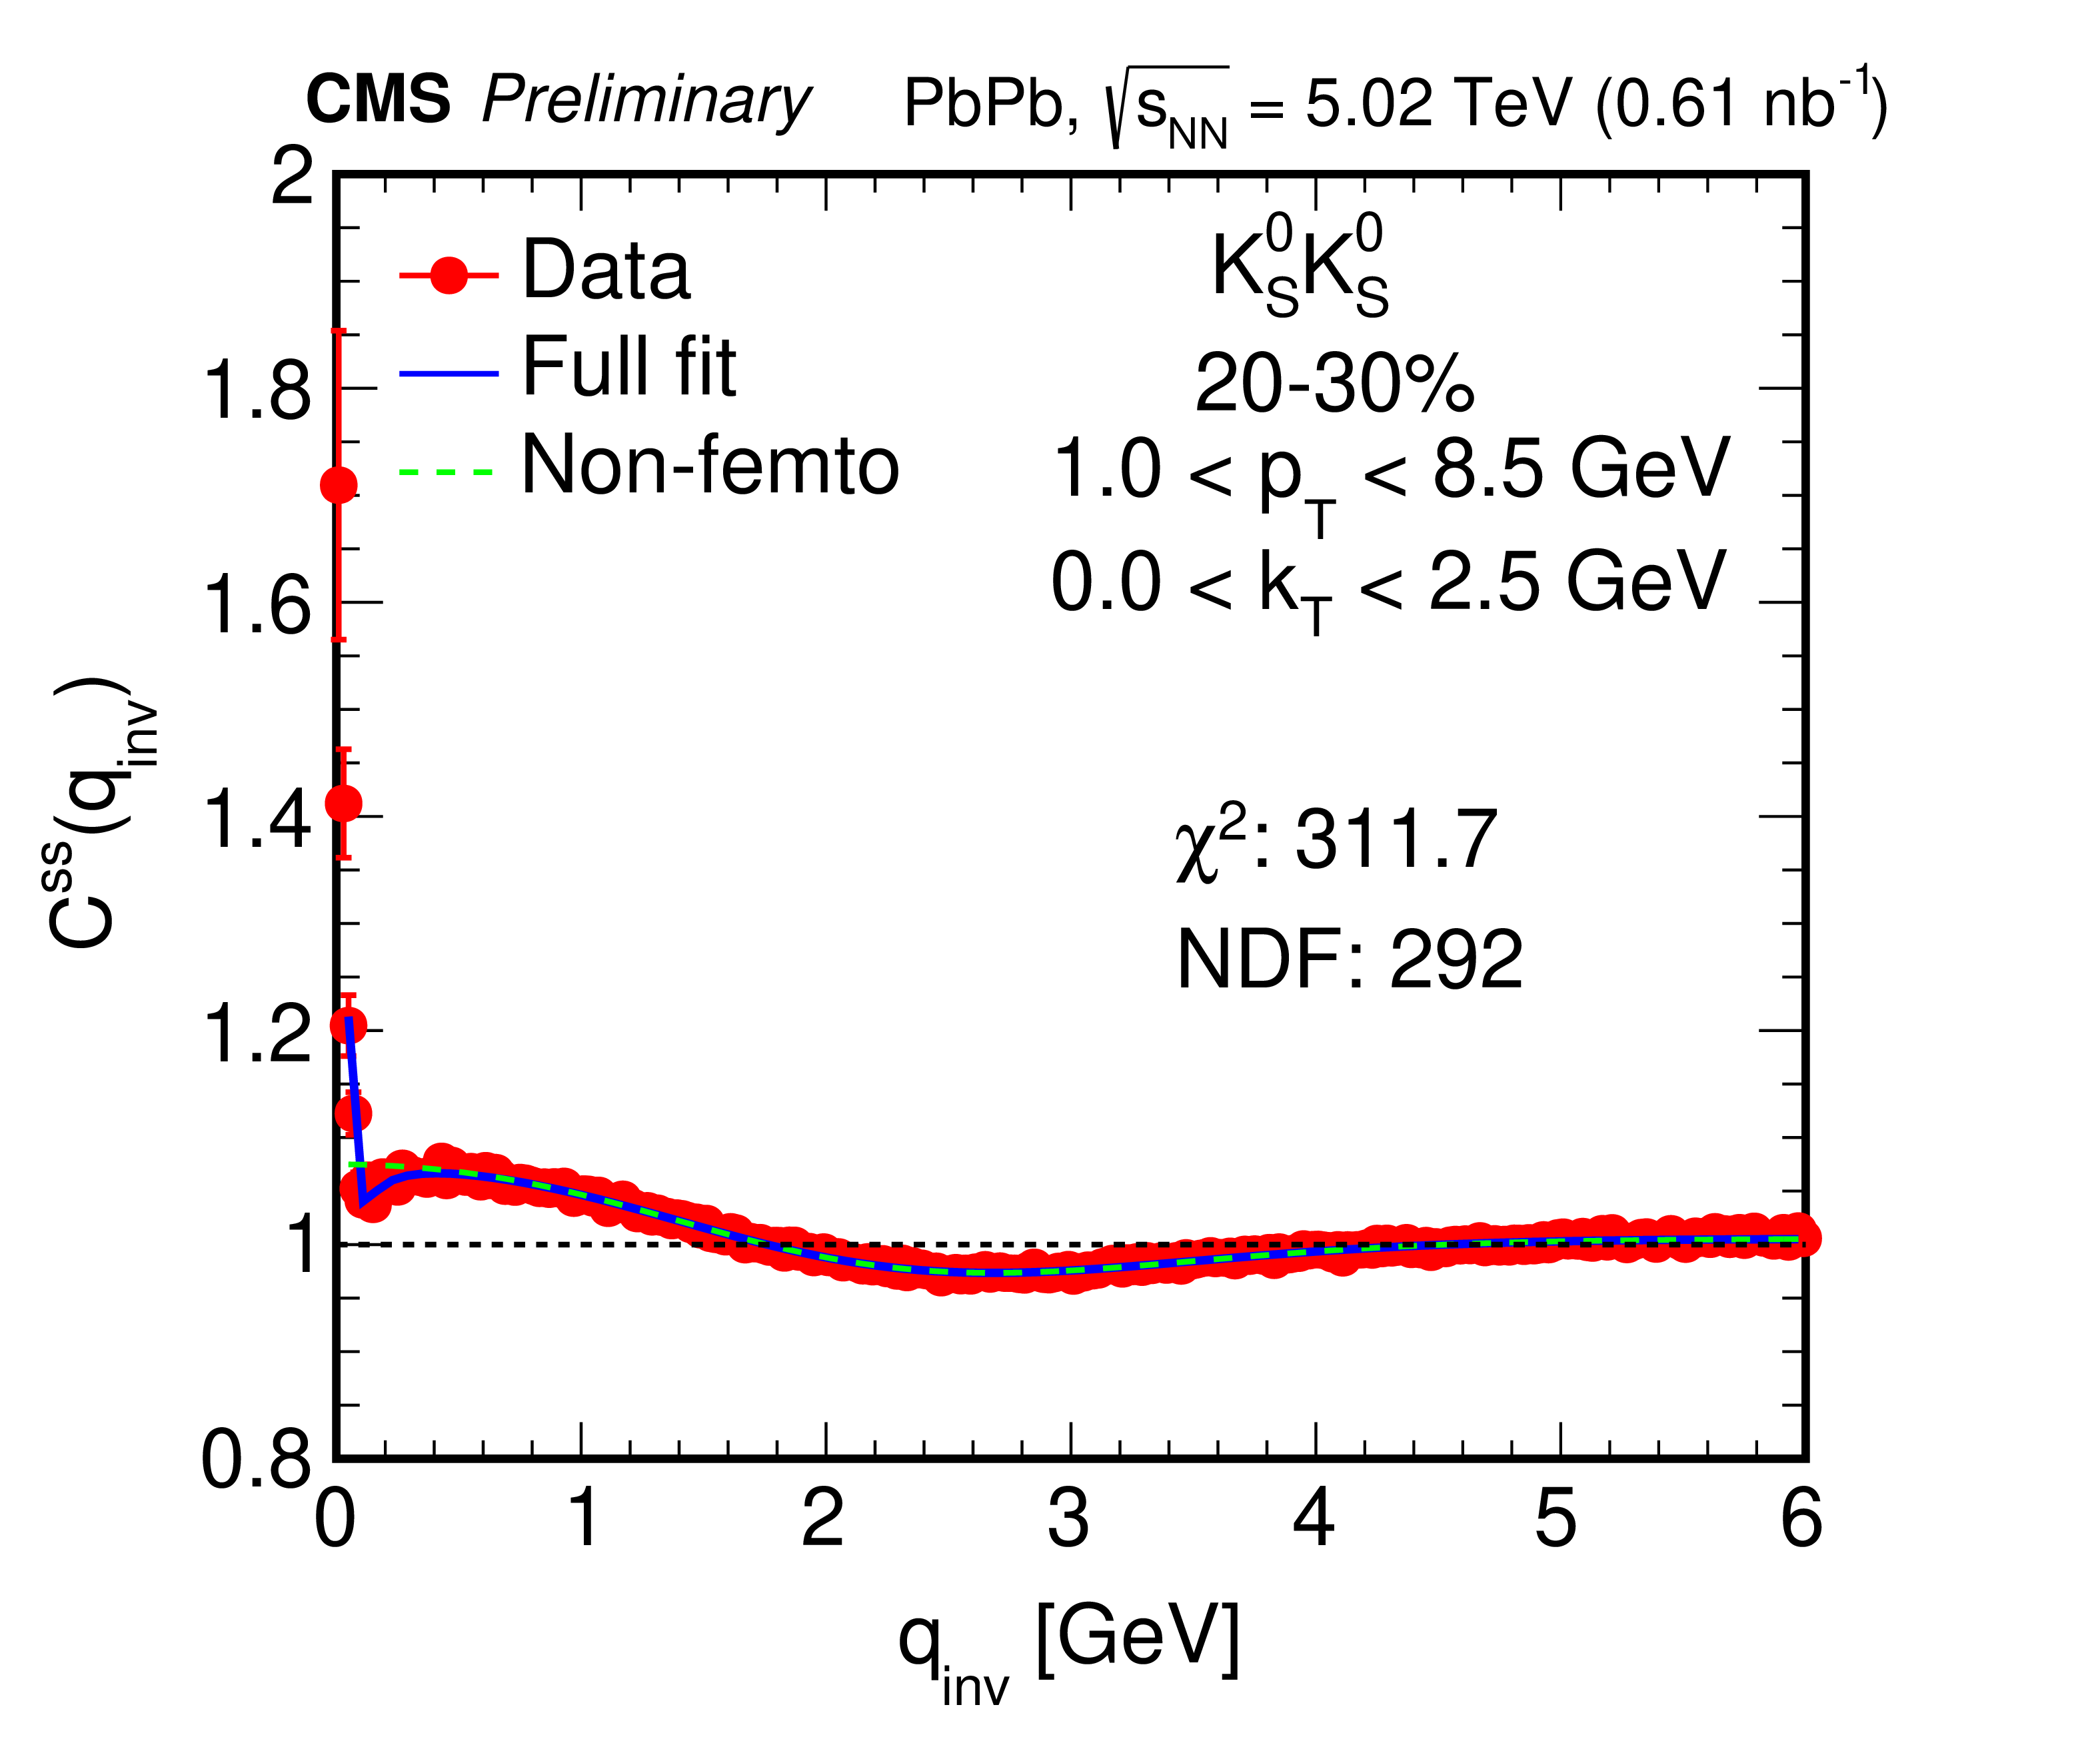
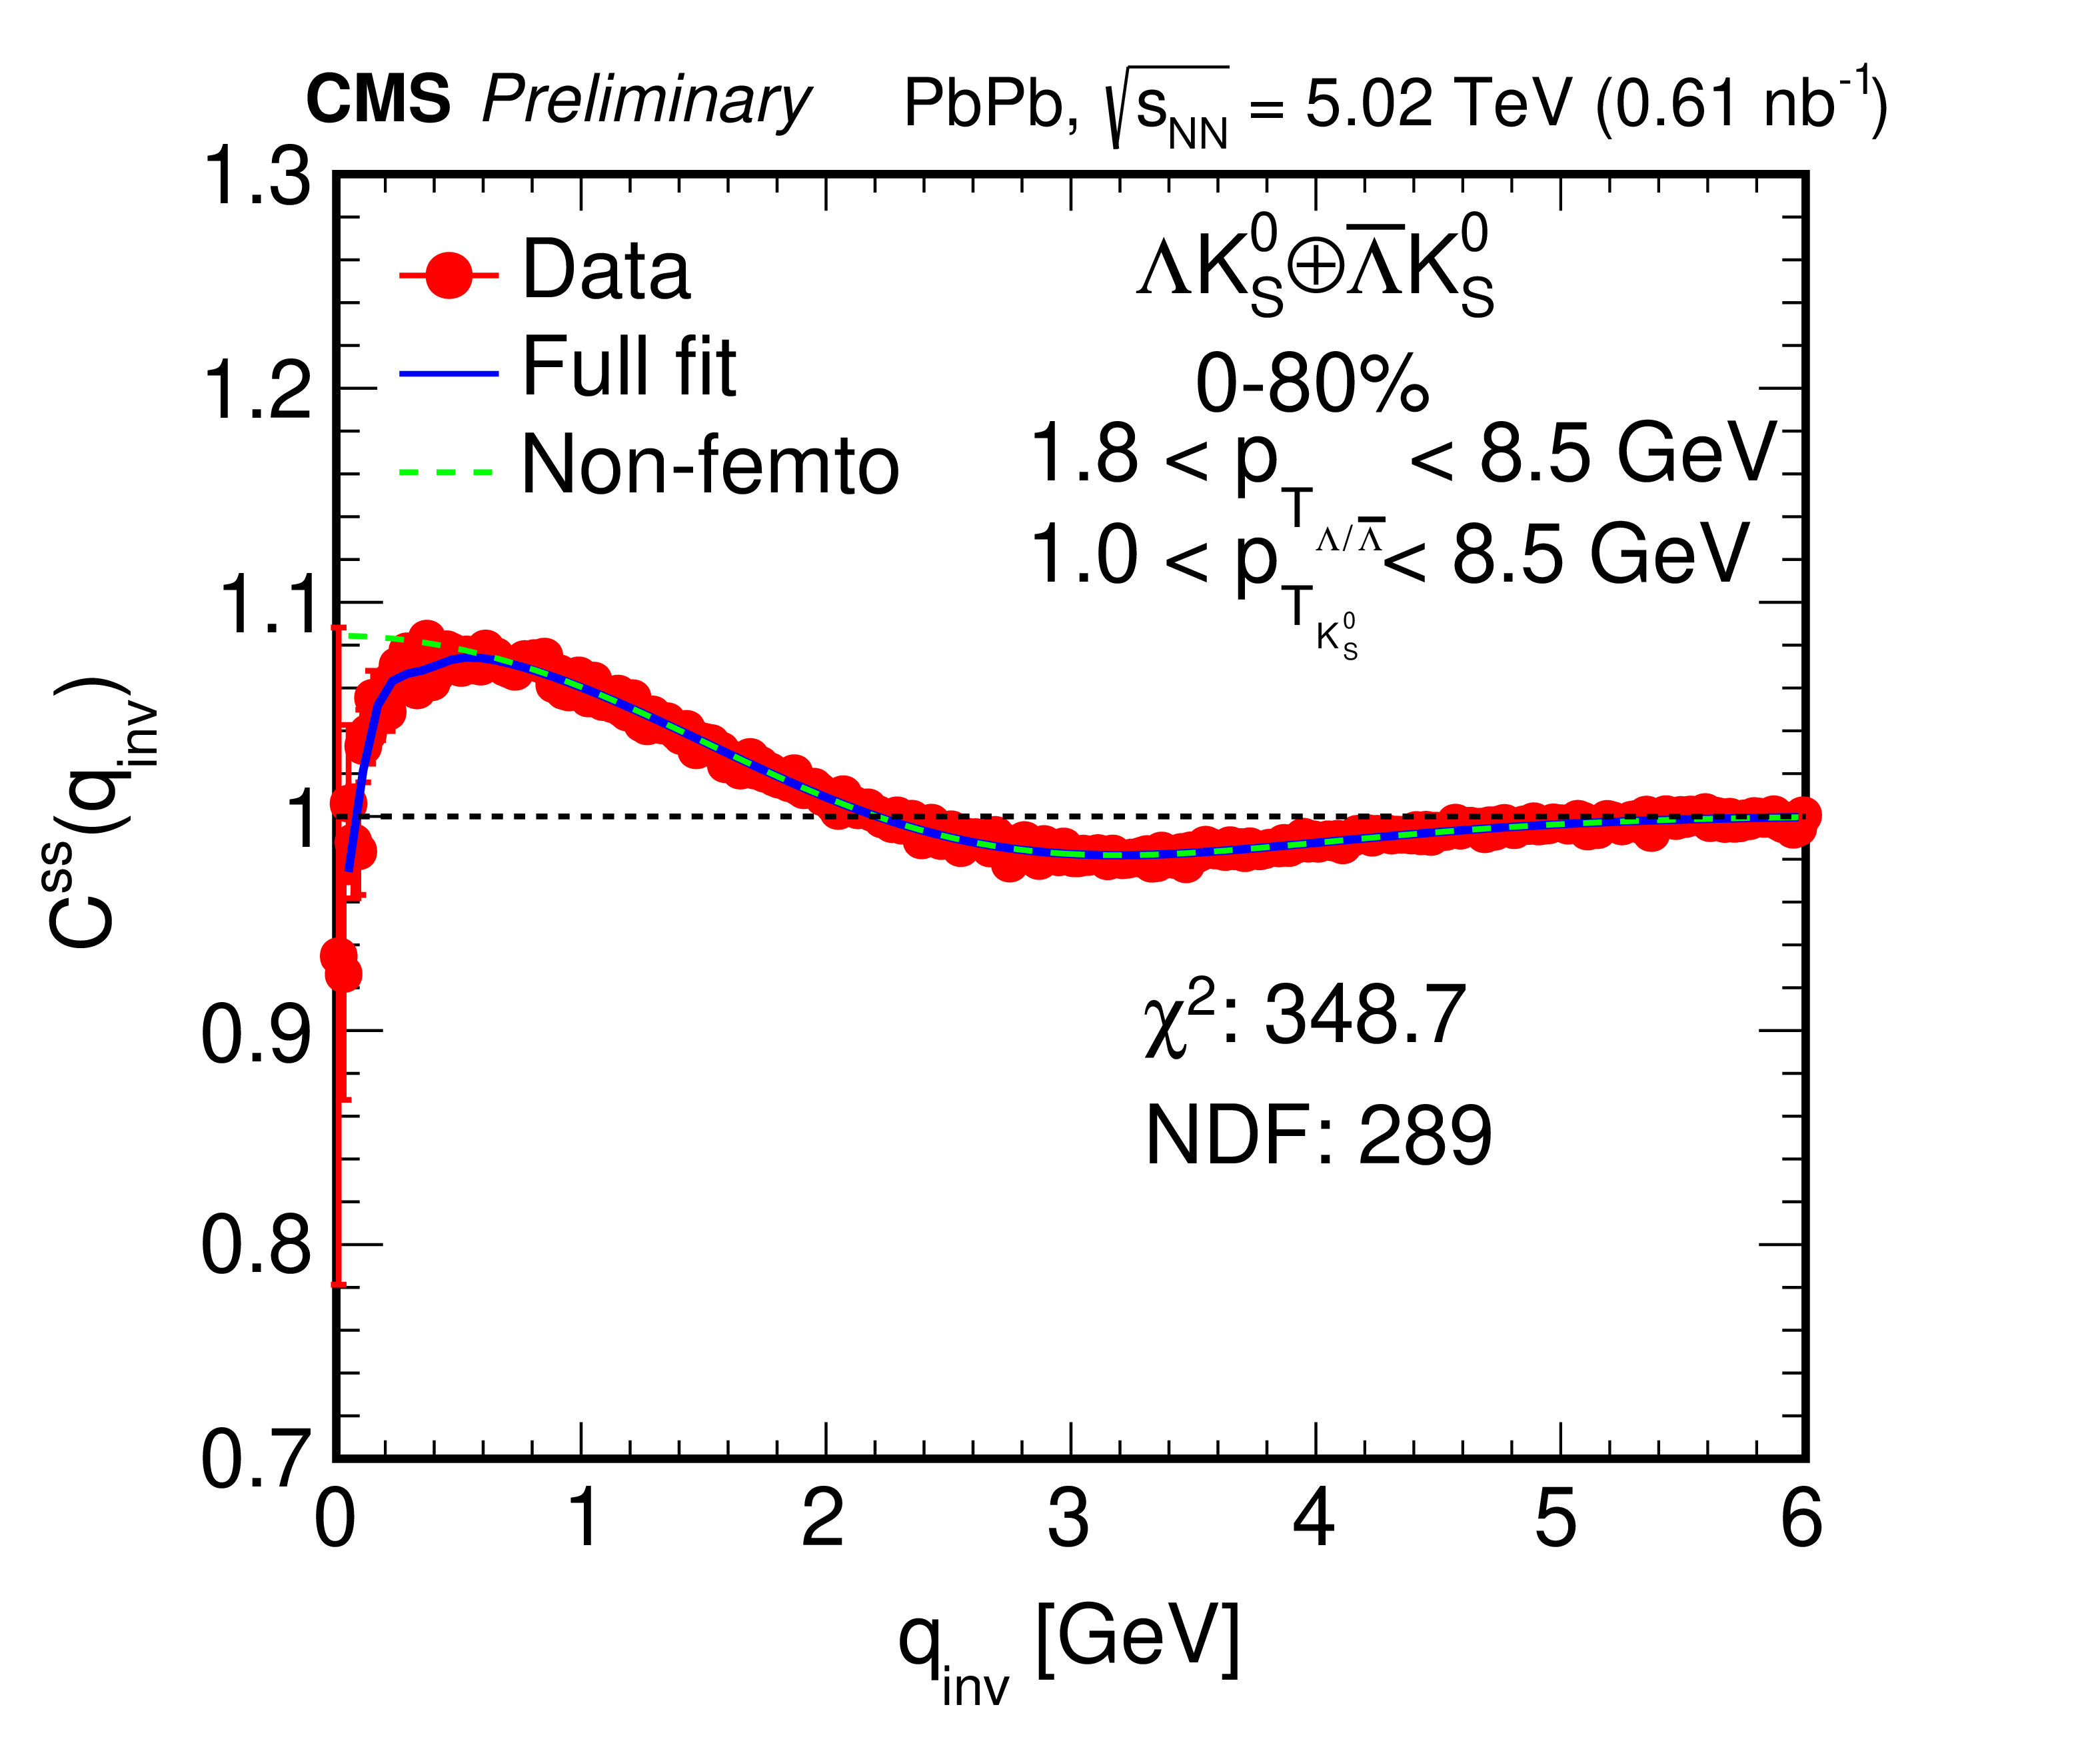
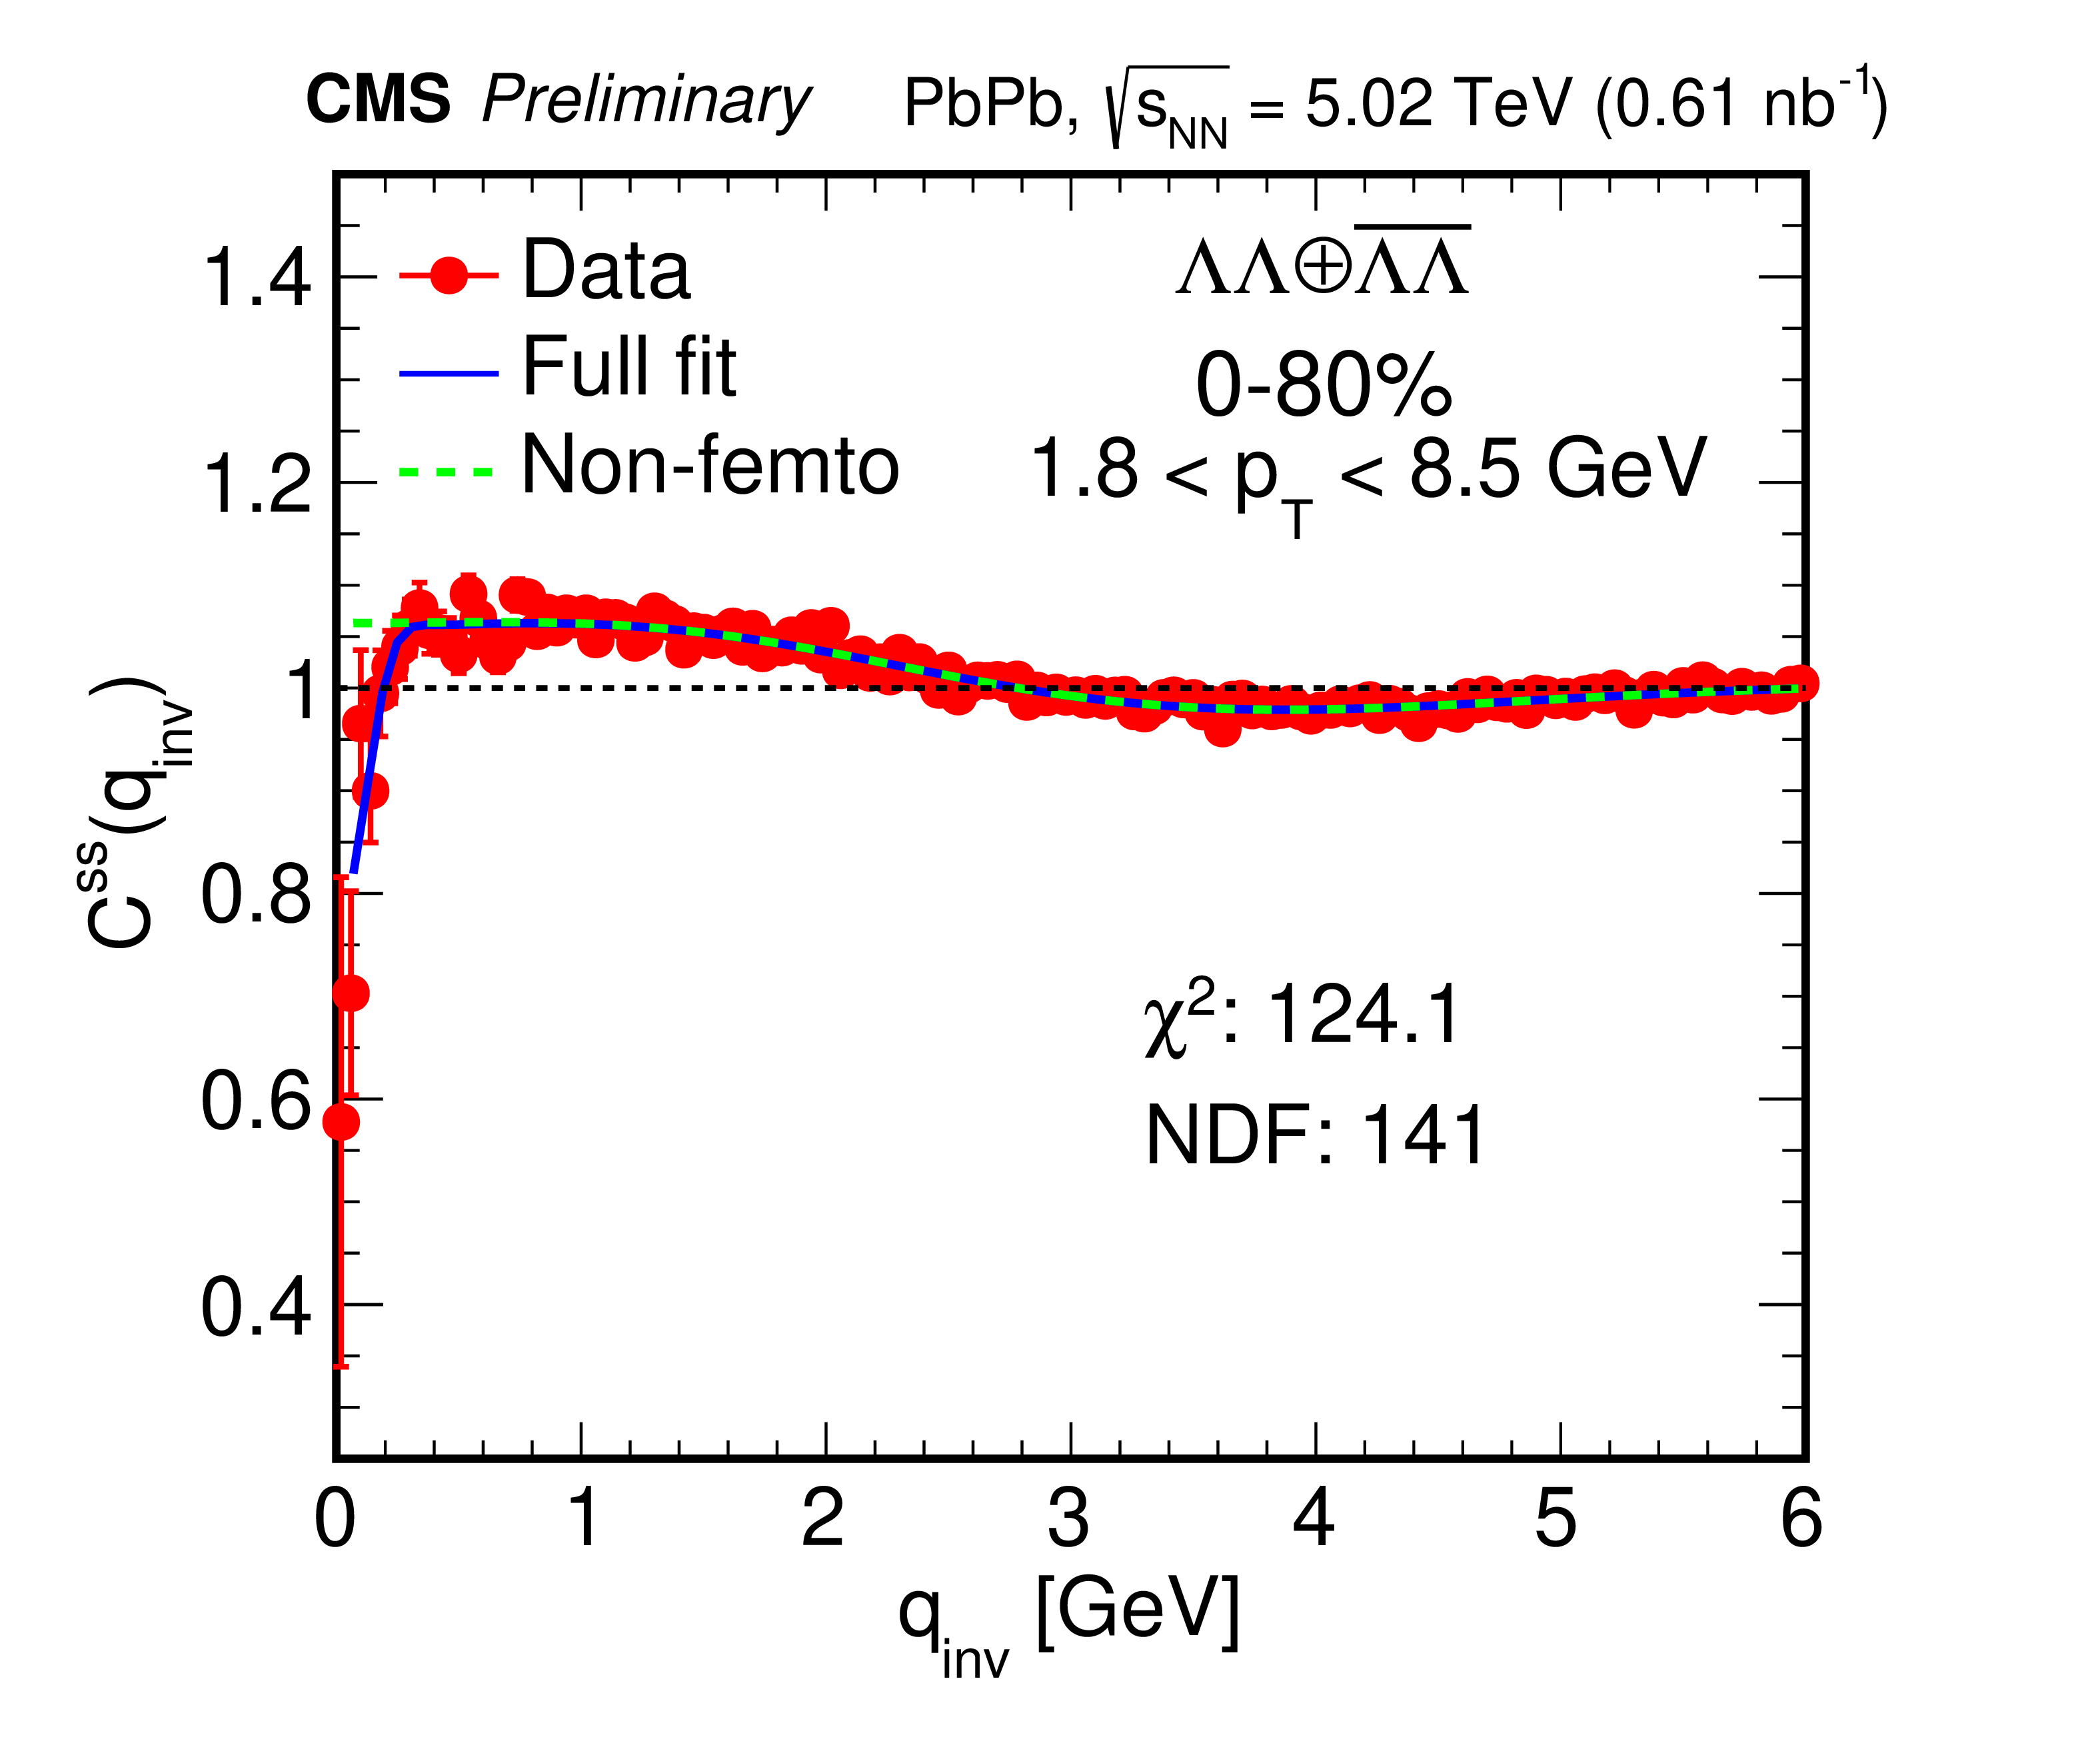
Figure 2:
The correlation distributions and fits for the ${\mathrm {K^{0}_{S}K^{0}_{S}}}$ pair for the 20-30% centrality range (left), and the ${\Lambda \mathrm {K^0_S}\oplus \overline {\Lambda}\mathrm {K^0_S}}$ (right) and ${\Lambda \Lambda \oplus \overline {\Lambda}\overline {\Lambda}}$ (bottom) pairs with 0-80% centrality. In these plots, red circles are the experimental results, the blue solid line is the fit using Eq. (7), and the green dotted line is the nonfemtoscopic background from Eq. (6). |
png pdf |
Figure 2-a:
The correlation distributions and fits for the ${\mathrm {K^{0}_{S}K^{0}_{S}}}$ pair for the 20-30% centrality range (left), and the ${\Lambda \mathrm {K^0_S}\oplus \overline {\Lambda}\mathrm {K^0_S}}$ (right) and ${\Lambda \Lambda \oplus \overline {\Lambda}\overline {\Lambda}}$ (bottom) pairs with 0-80% centrality. In these plots, red circles are the experimental results, the blue solid line is the fit using Eq. (7), and the green dotted line is the nonfemtoscopic background from Eq. (6). |
png pdf |
Figure 2-b:
The correlation distributions and fits for the ${\mathrm {K^{0}_{S}K^{0}_{S}}}$ pair for the 20-30% centrality range (left), and the ${\Lambda \mathrm {K^0_S}\oplus \overline {\Lambda}\mathrm {K^0_S}}$ (right) and ${\Lambda \Lambda \oplus \overline {\Lambda}\overline {\Lambda}}$ (bottom) pairs with 0-80% centrality. In these plots, red circles are the experimental results, the blue solid line is the fit using Eq. (7), and the green dotted line is the nonfemtoscopic background from Eq. (6). |
png pdf |
Figure 2-c:
The correlation distributions and fits for the ${\mathrm {K^{0}_{S}K^{0}_{S}}}$ pair for the 20-30% centrality range (left), and the ${\Lambda \mathrm {K^0_S}\oplus \overline {\Lambda}\mathrm {K^0_S}}$ (right) and ${\Lambda \Lambda \oplus \overline {\Lambda}\overline {\Lambda}}$ (bottom) pairs with 0-80% centrality. In these plots, red circles are the experimental results, the blue solid line is the fit using Eq. (7), and the green dotted line is the nonfemtoscopic background from Eq. (6). |
png pdf |
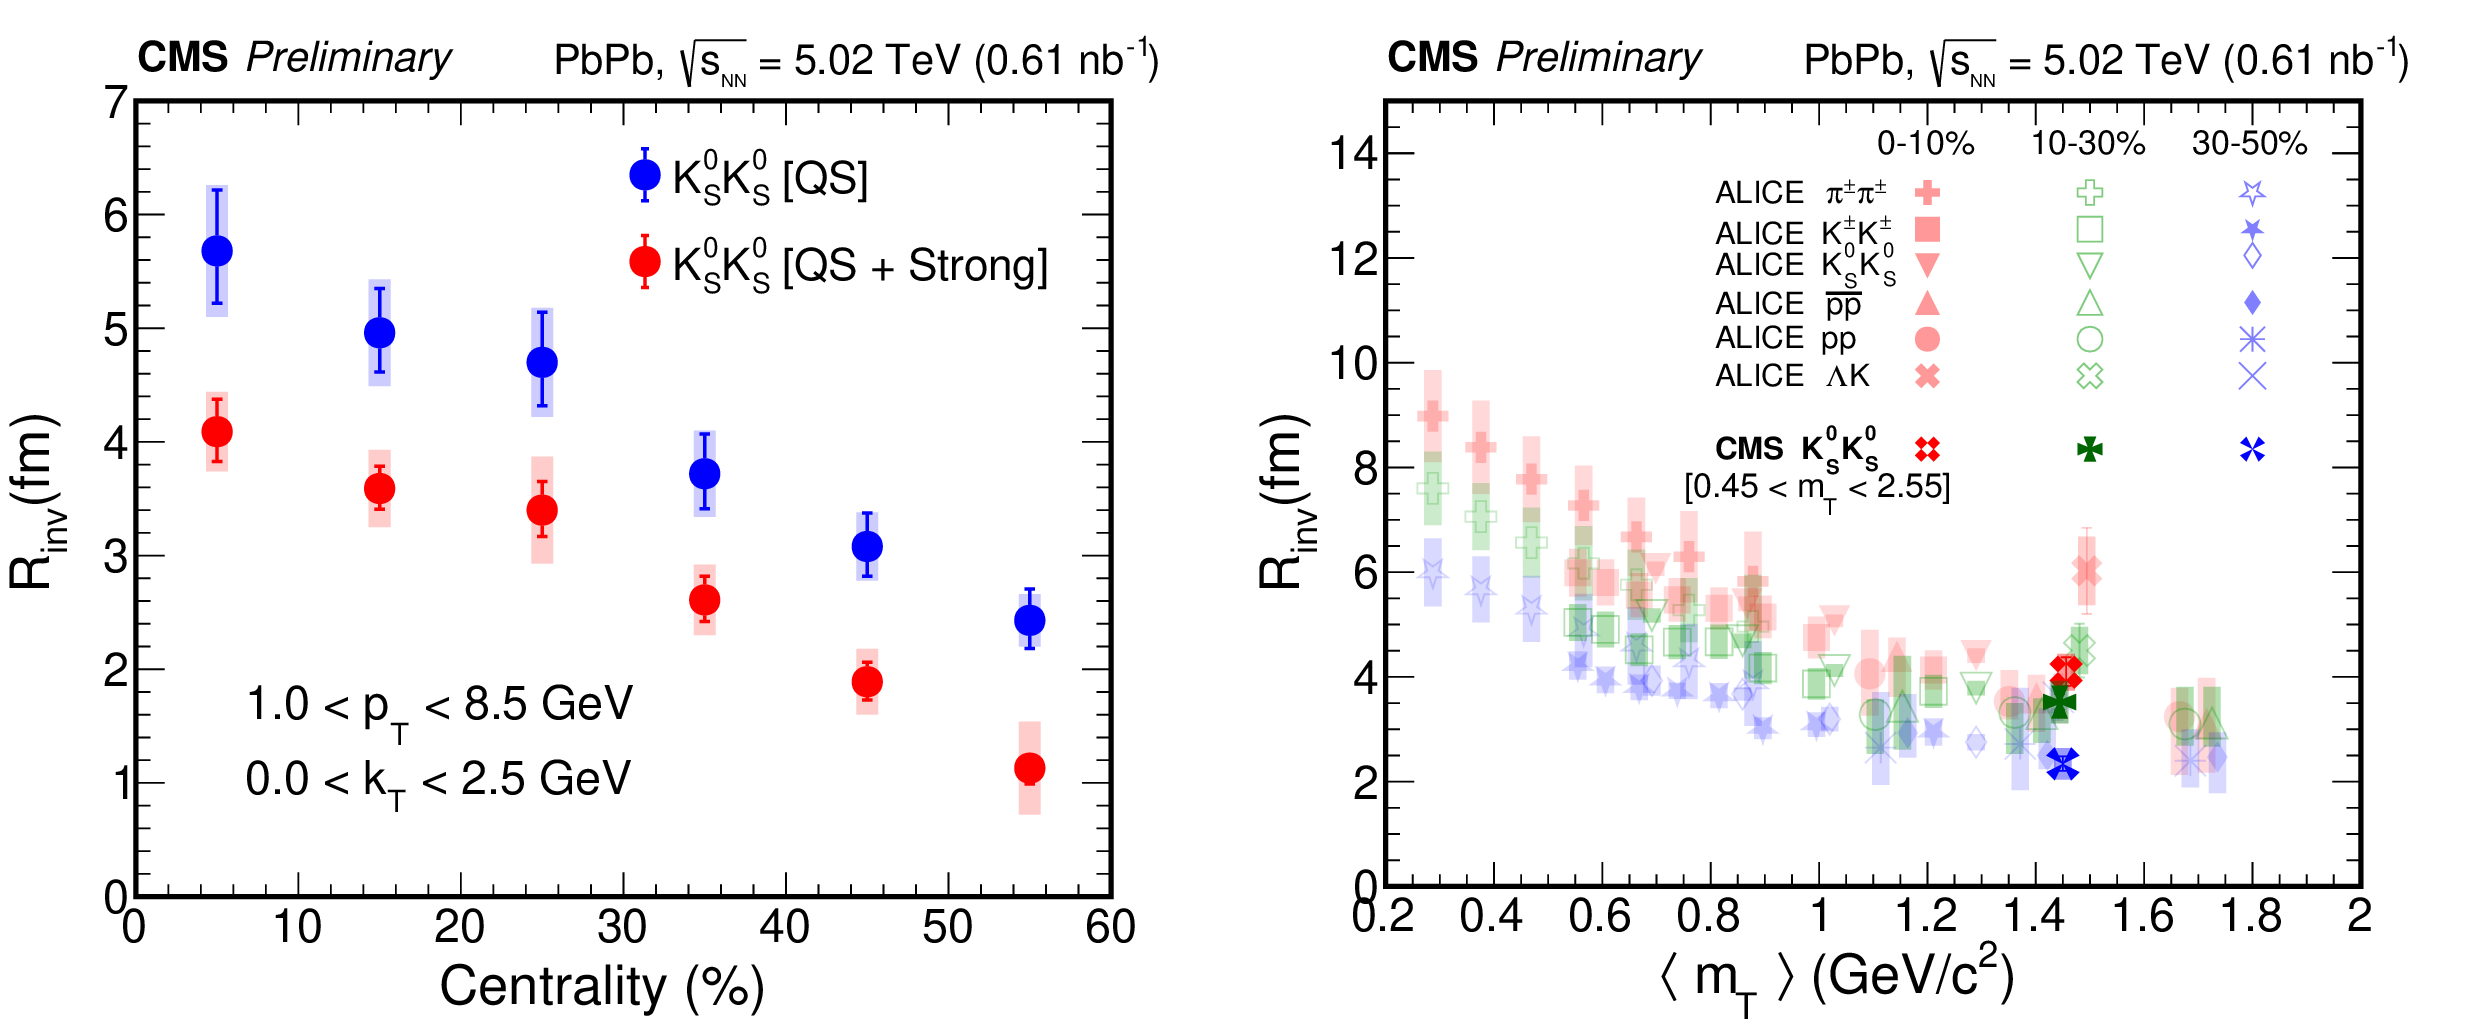
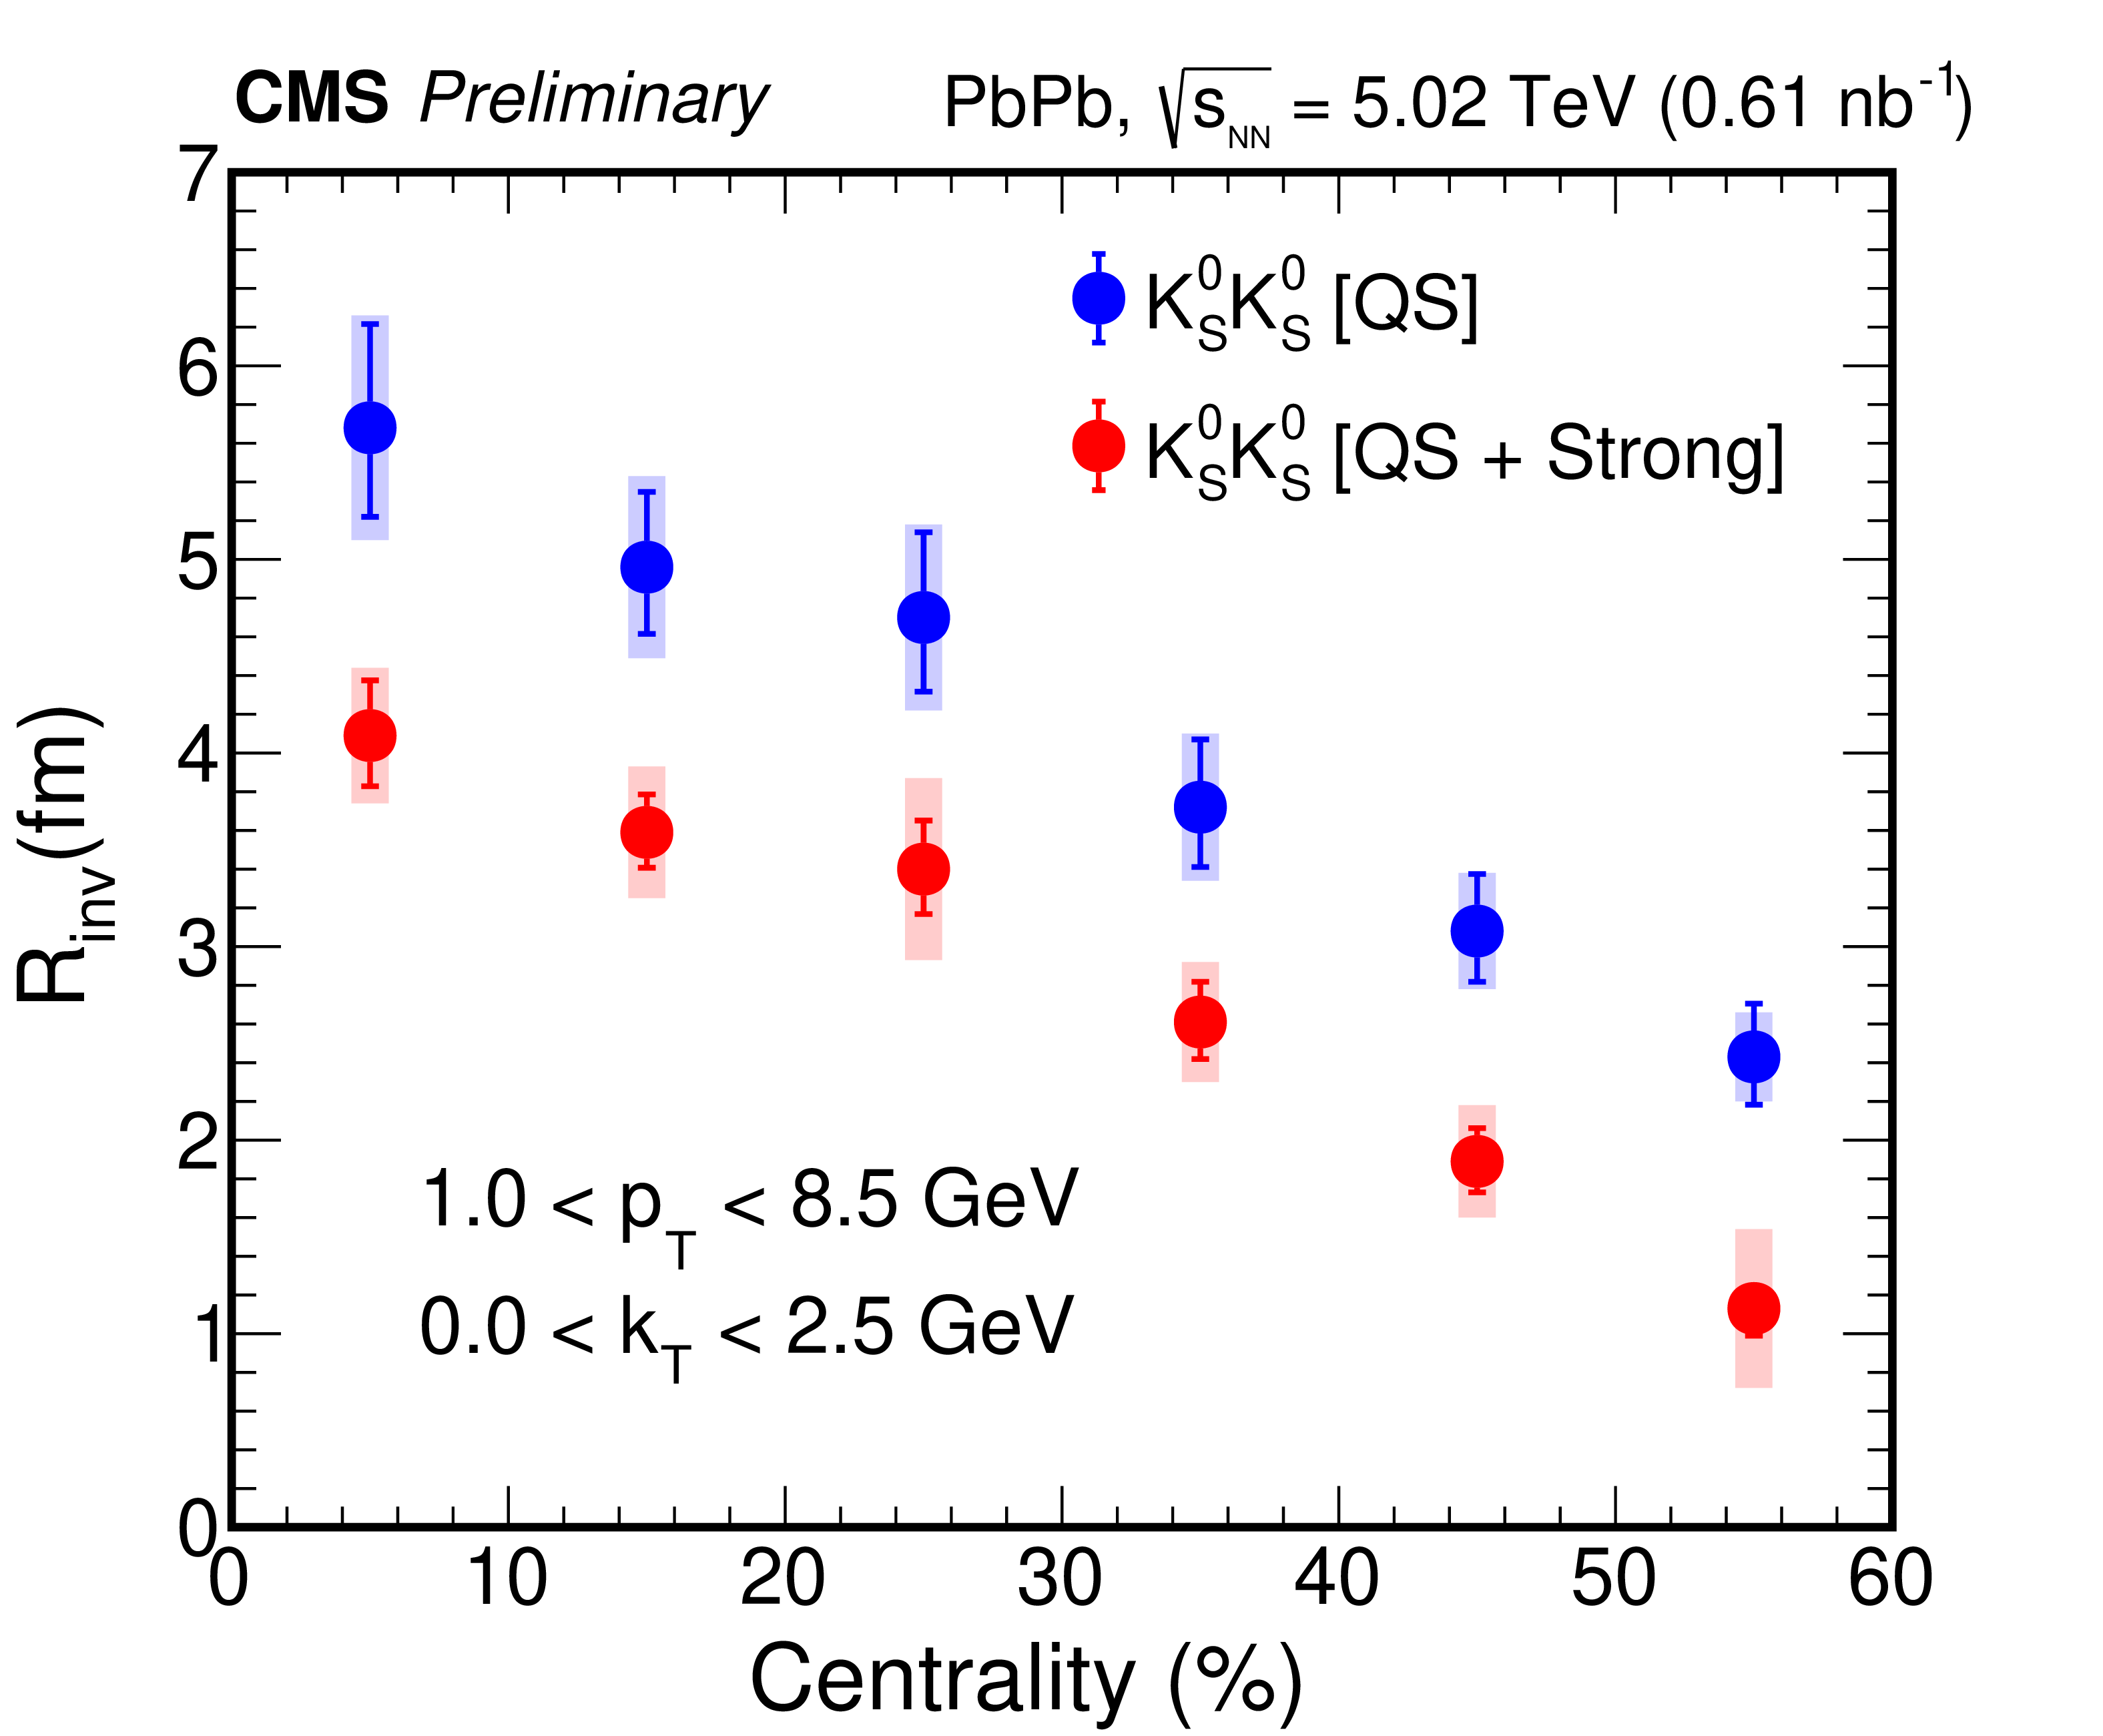
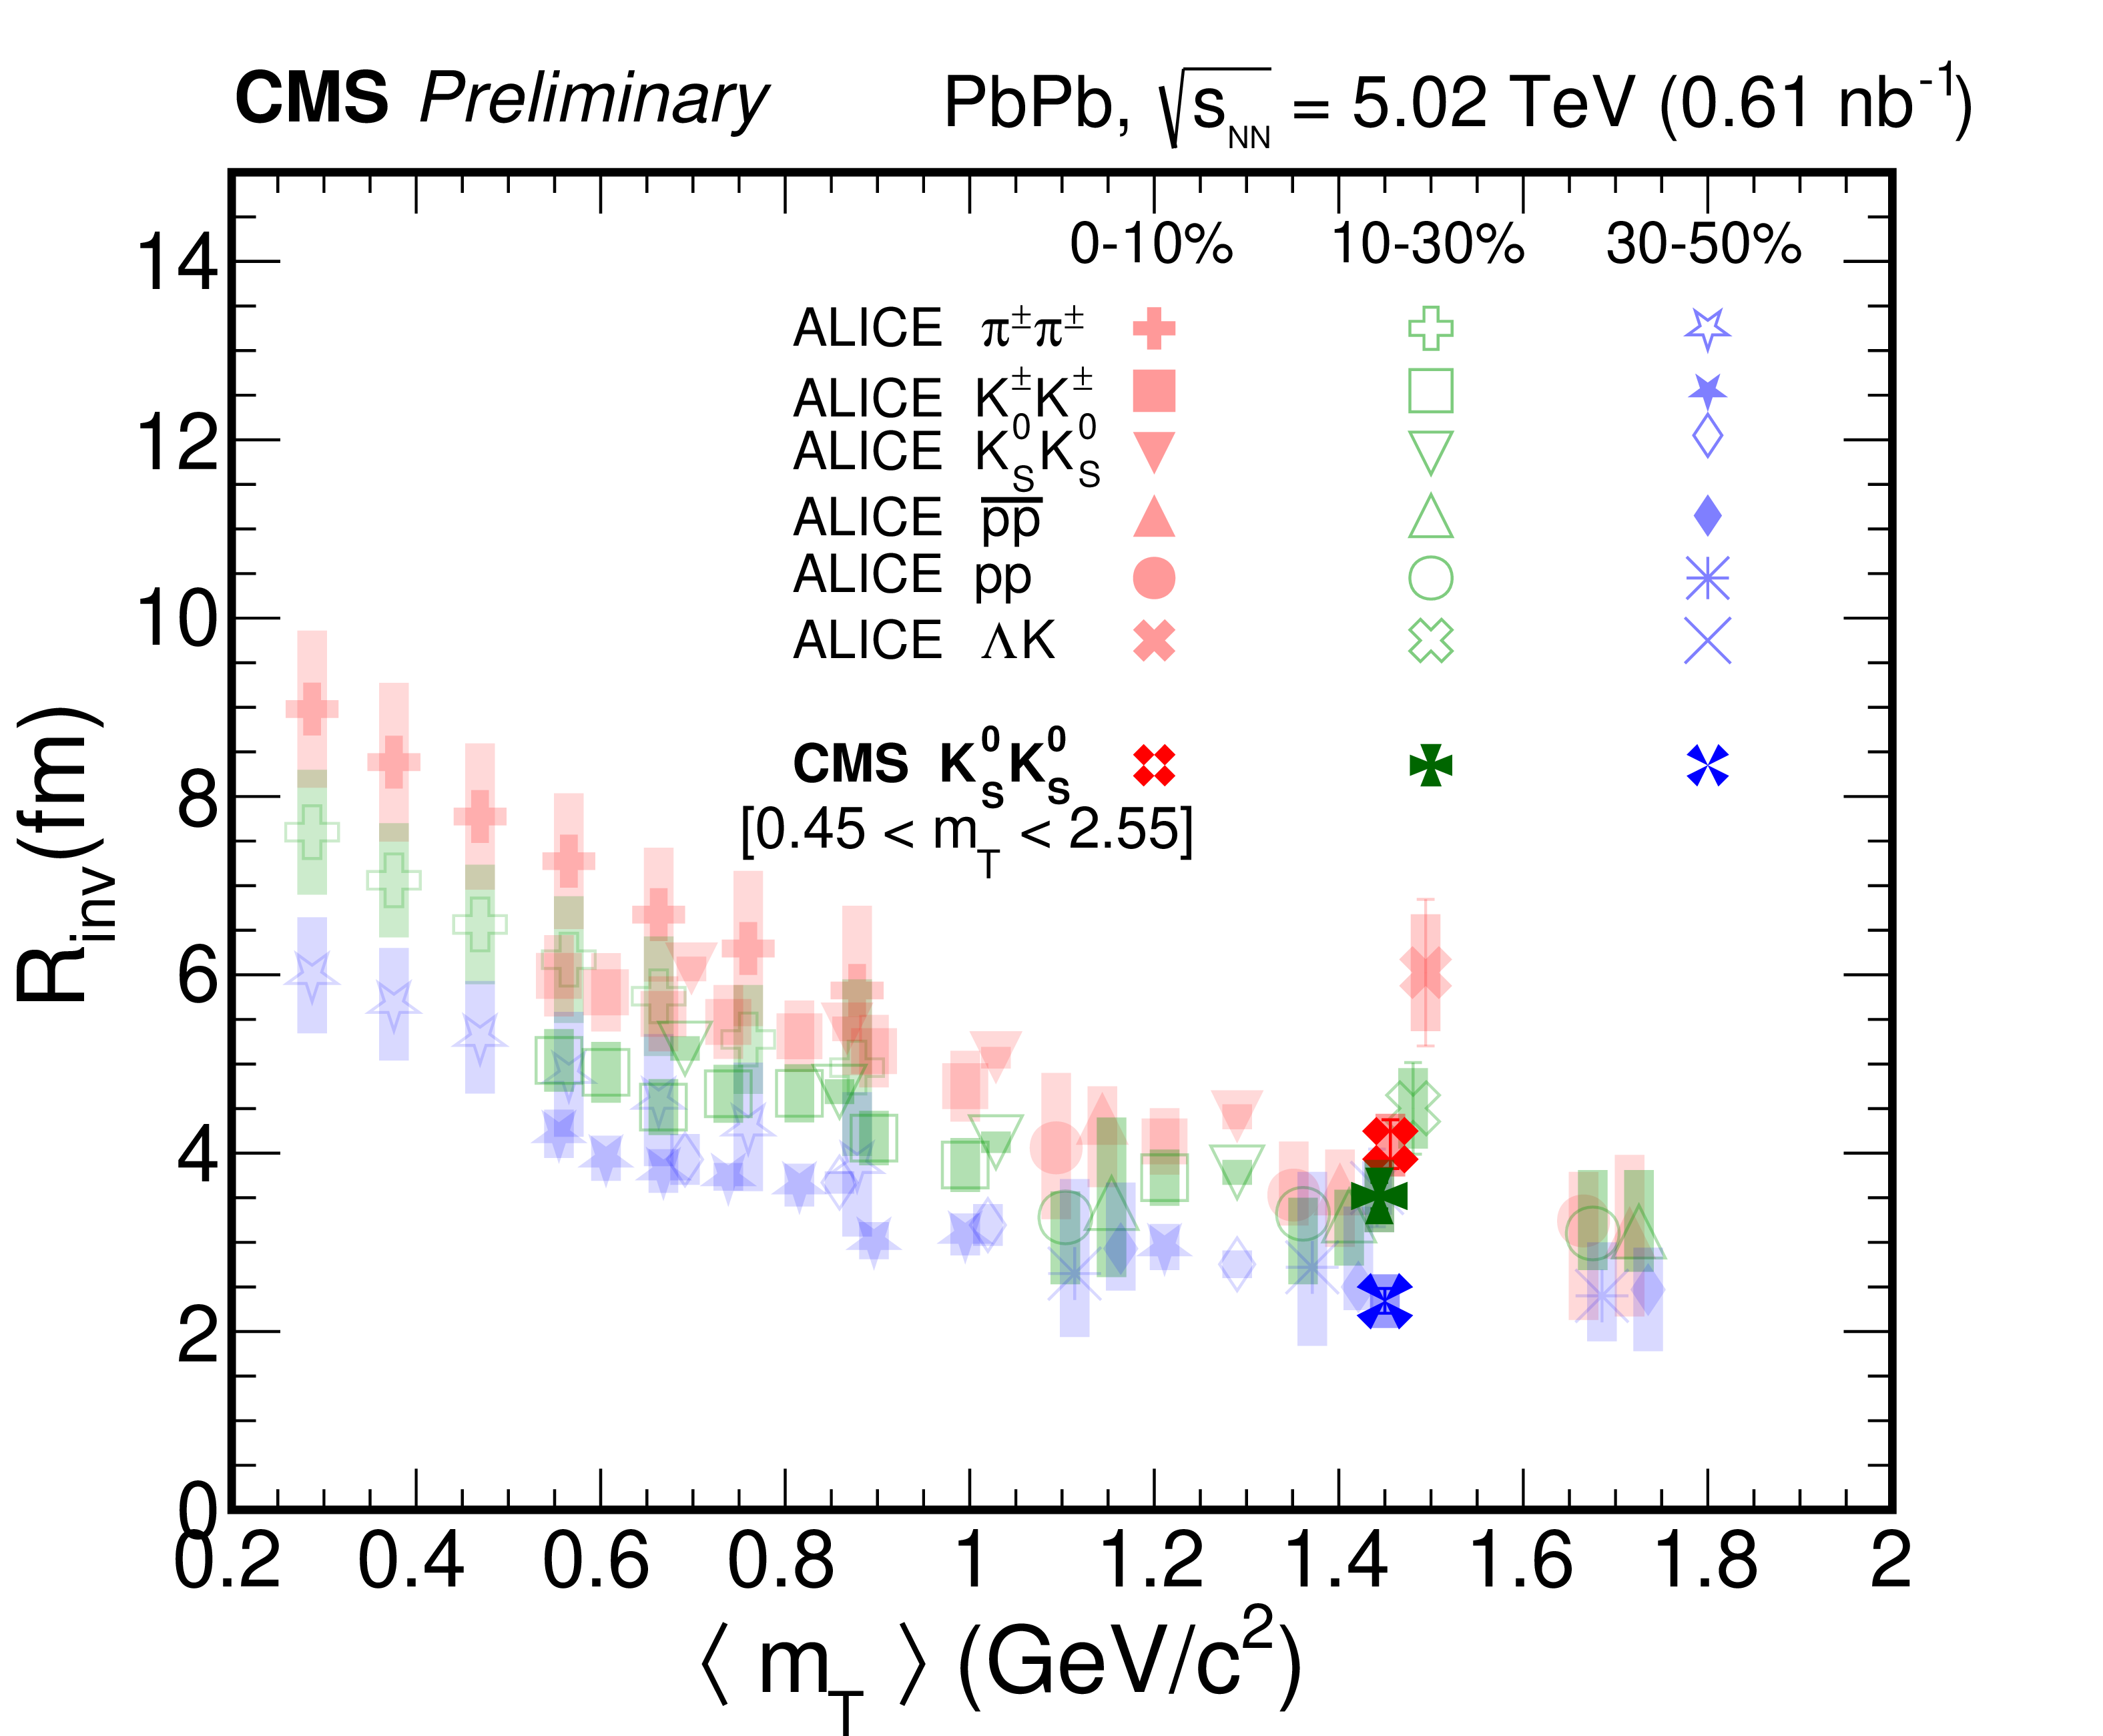
Figure 3:
Left: $R_{\text {inv}}$ as a function of centrality by considering only the QS (blue circle), and both the QS and FSI effects (red circles). Right: $R_{\text {inv}}$ as a function of $m_{\mathrm {T}}$ (dark markers) and compared with ALICE data (light markers) for PbPb collisions at ${\sqrt {\smash [b]{s_{_{\mathrm {NN}}}}}} = $ 2.76 TeV [27] in 0-10, 10-30, and 30-50% centrality classes. For each data point, the line and shaded area indicate the statistical and systematic uncertainty, respectively. |
png pdf |
Figure 3-a:
Left: $R_{\text {inv}}$ as a function of centrality by considering only the QS (blue circle), and both the QS and FSI effects (red circles). Right: $R_{\text {inv}}$ as a function of $m_{\mathrm {T}}$ (dark markers) and compared with ALICE data (light markers) for PbPb collisions at ${\sqrt {\smash [b]{s_{_{\mathrm {NN}}}}}} = $ 2.76 TeV [27] in 0-10, 10-30, and 30-50% centrality classes. For each data point, the line and shaded area indicate the statistical and systematic uncertainty, respectively. |
png pdf |
Figure 3-b:
Left: $R_{\text {inv}}$ as a function of centrality by considering only the QS (blue circle), and both the QS and FSI effects (red circles). Right: $R_{\text {inv}}$ as a function of $m_{\mathrm {T}}$ (dark markers) and compared with ALICE data (light markers) for PbPb collisions at ${\sqrt {\smash [b]{s_{_{\mathrm {NN}}}}}} = $ 2.76 TeV [27] in 0-10, 10-30, and 30-50% centrality classes. For each data point, the line and shaded area indicate the statistical and systematic uncertainty, respectively. |
png pdf |
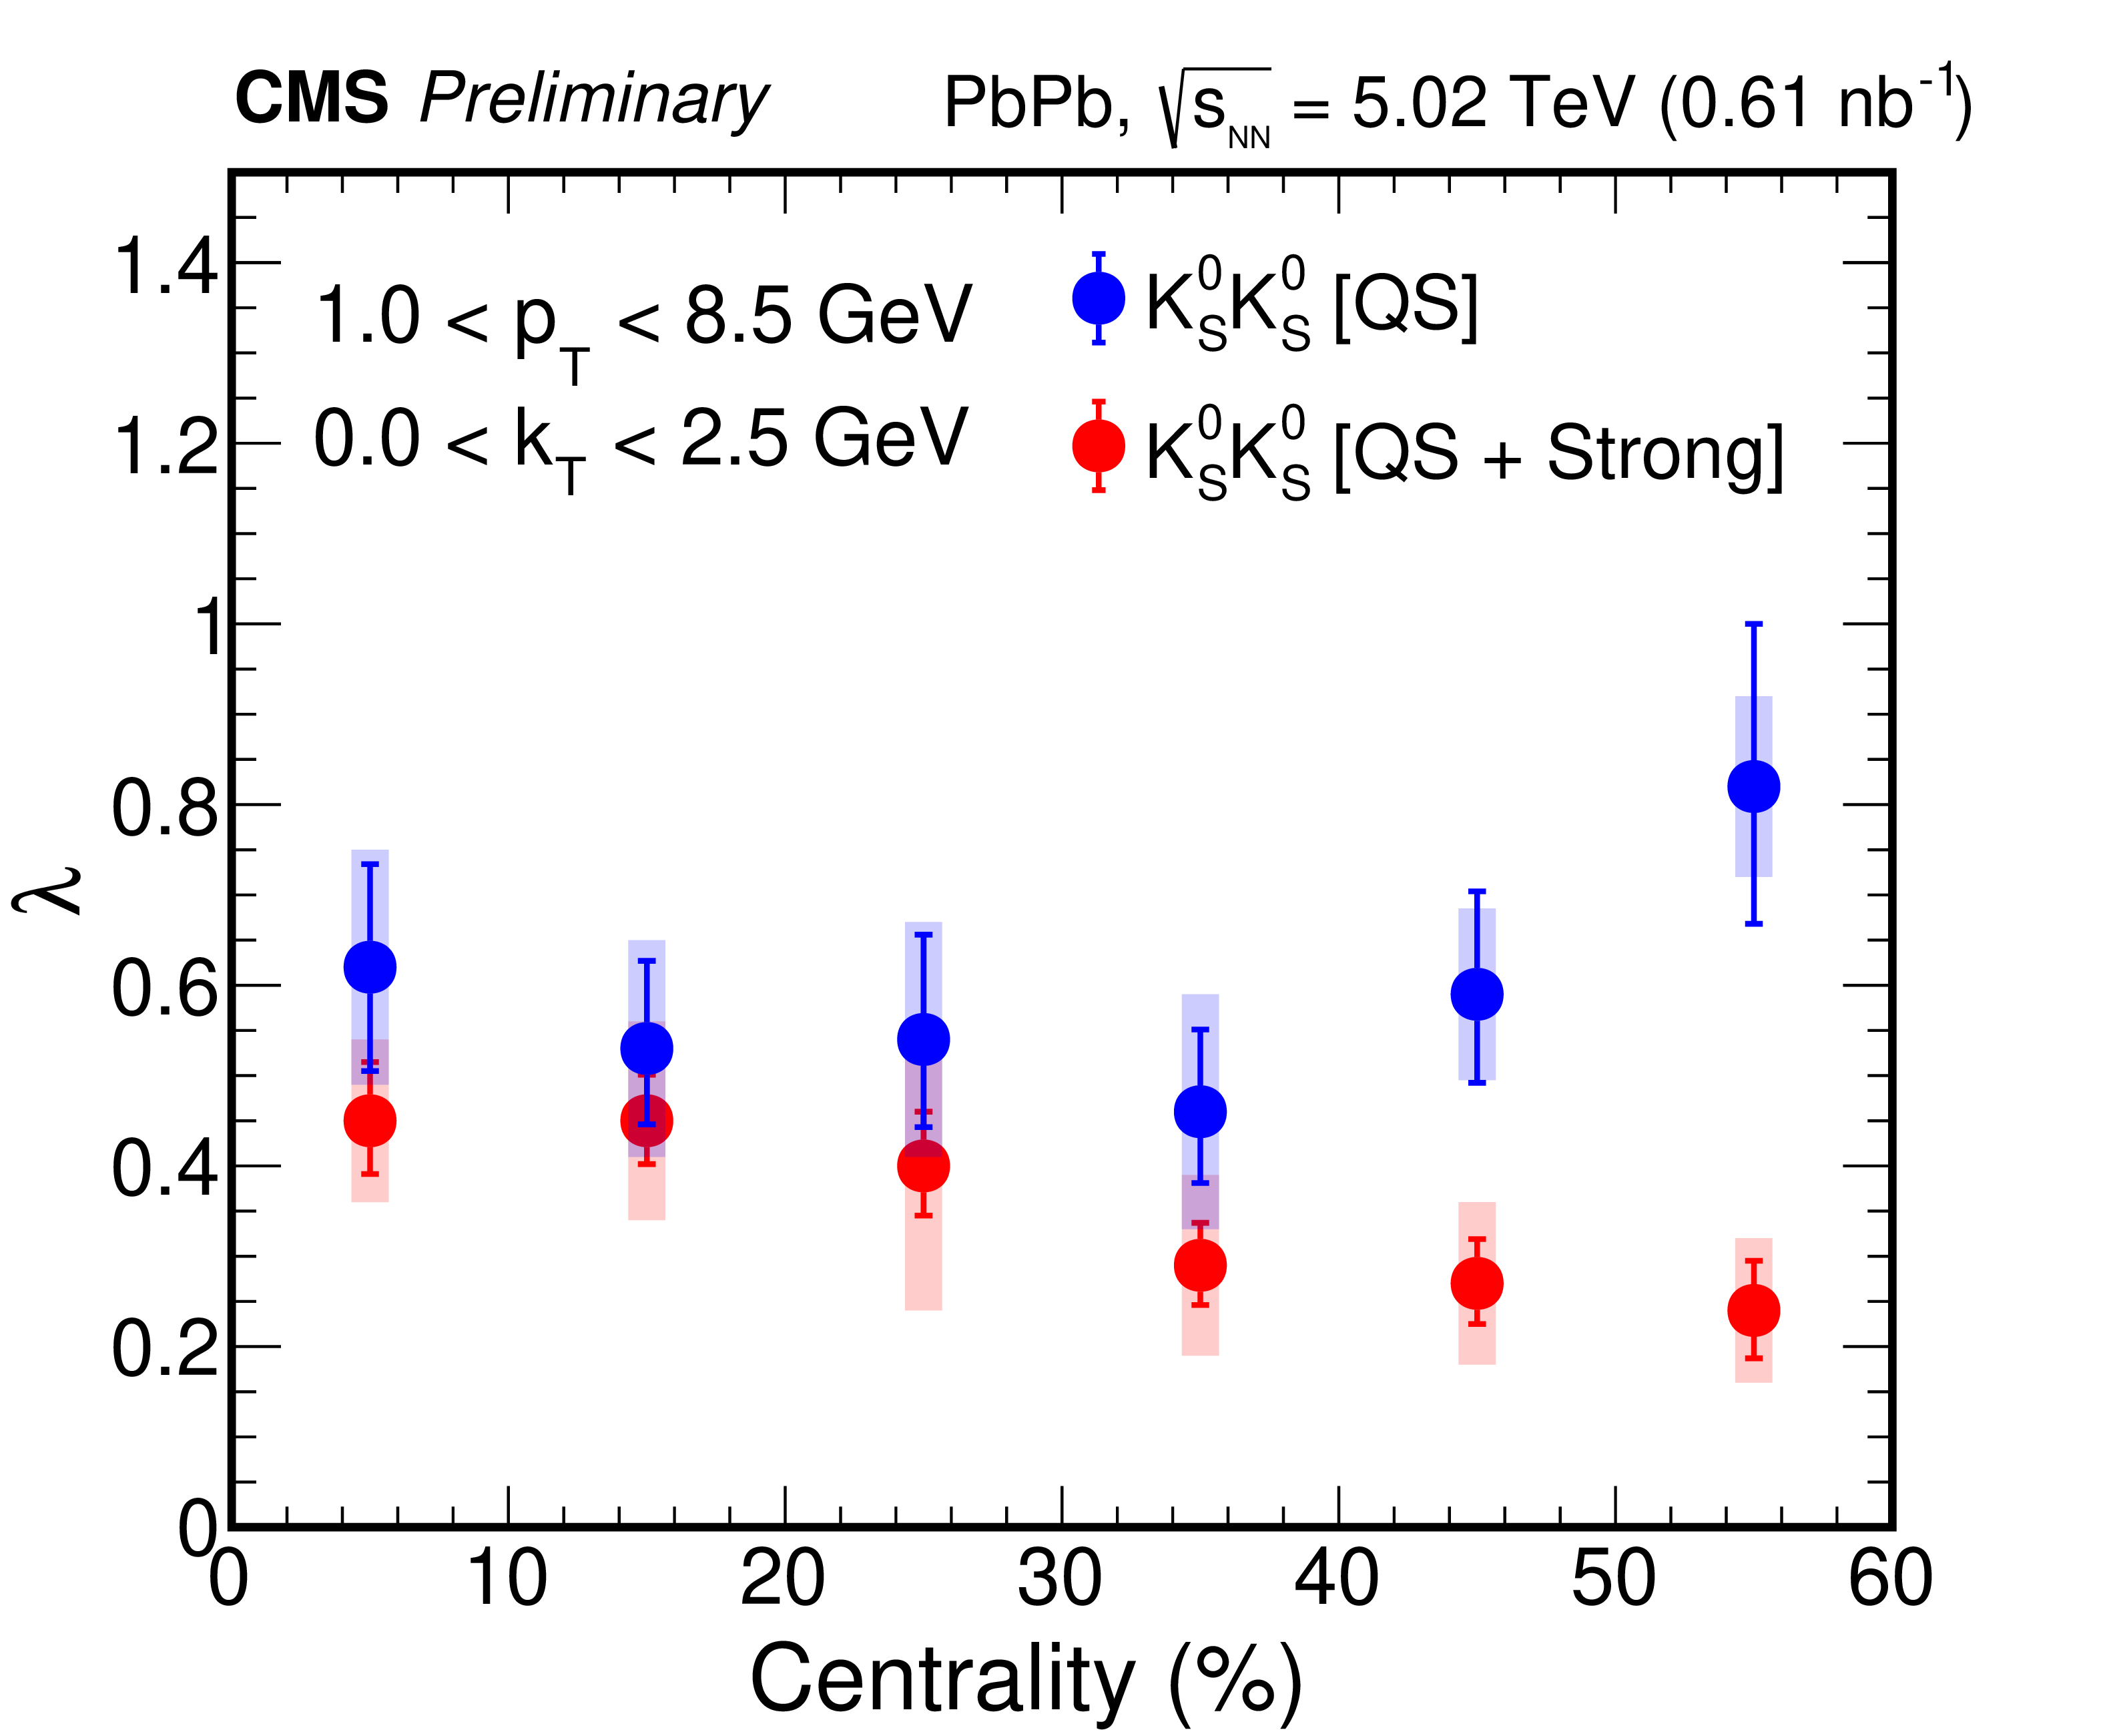
Figure 4:
The $\lambda $ parameter as a function of centrality by considering only the QS (blue circles) and both the QS and FSI effects (red circles). For each data point, the line and shaded area indicate the statistical and systematic uncertainty, respectively. |
png pdf |
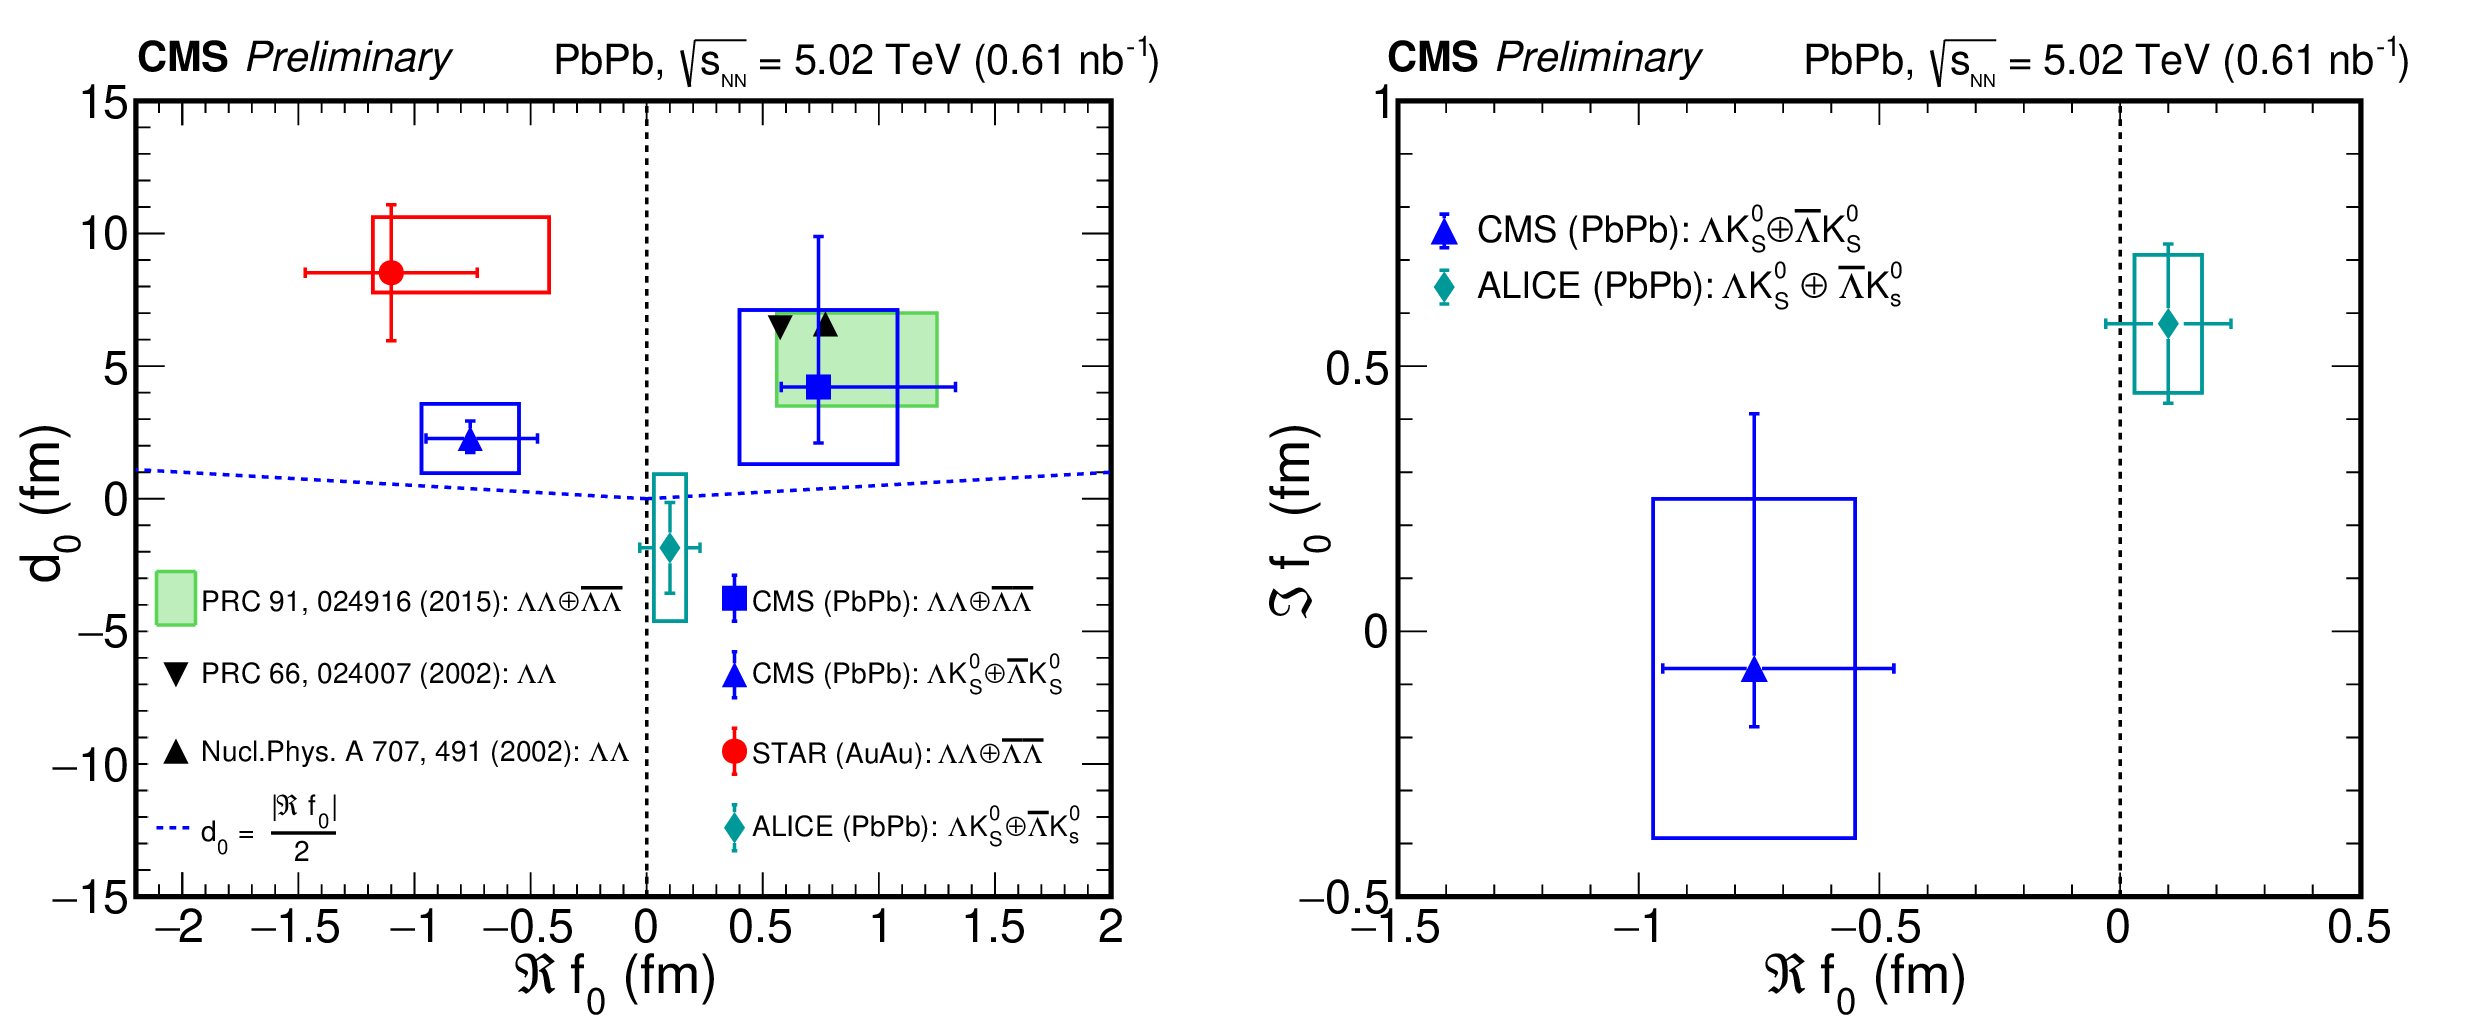
Figure 5:
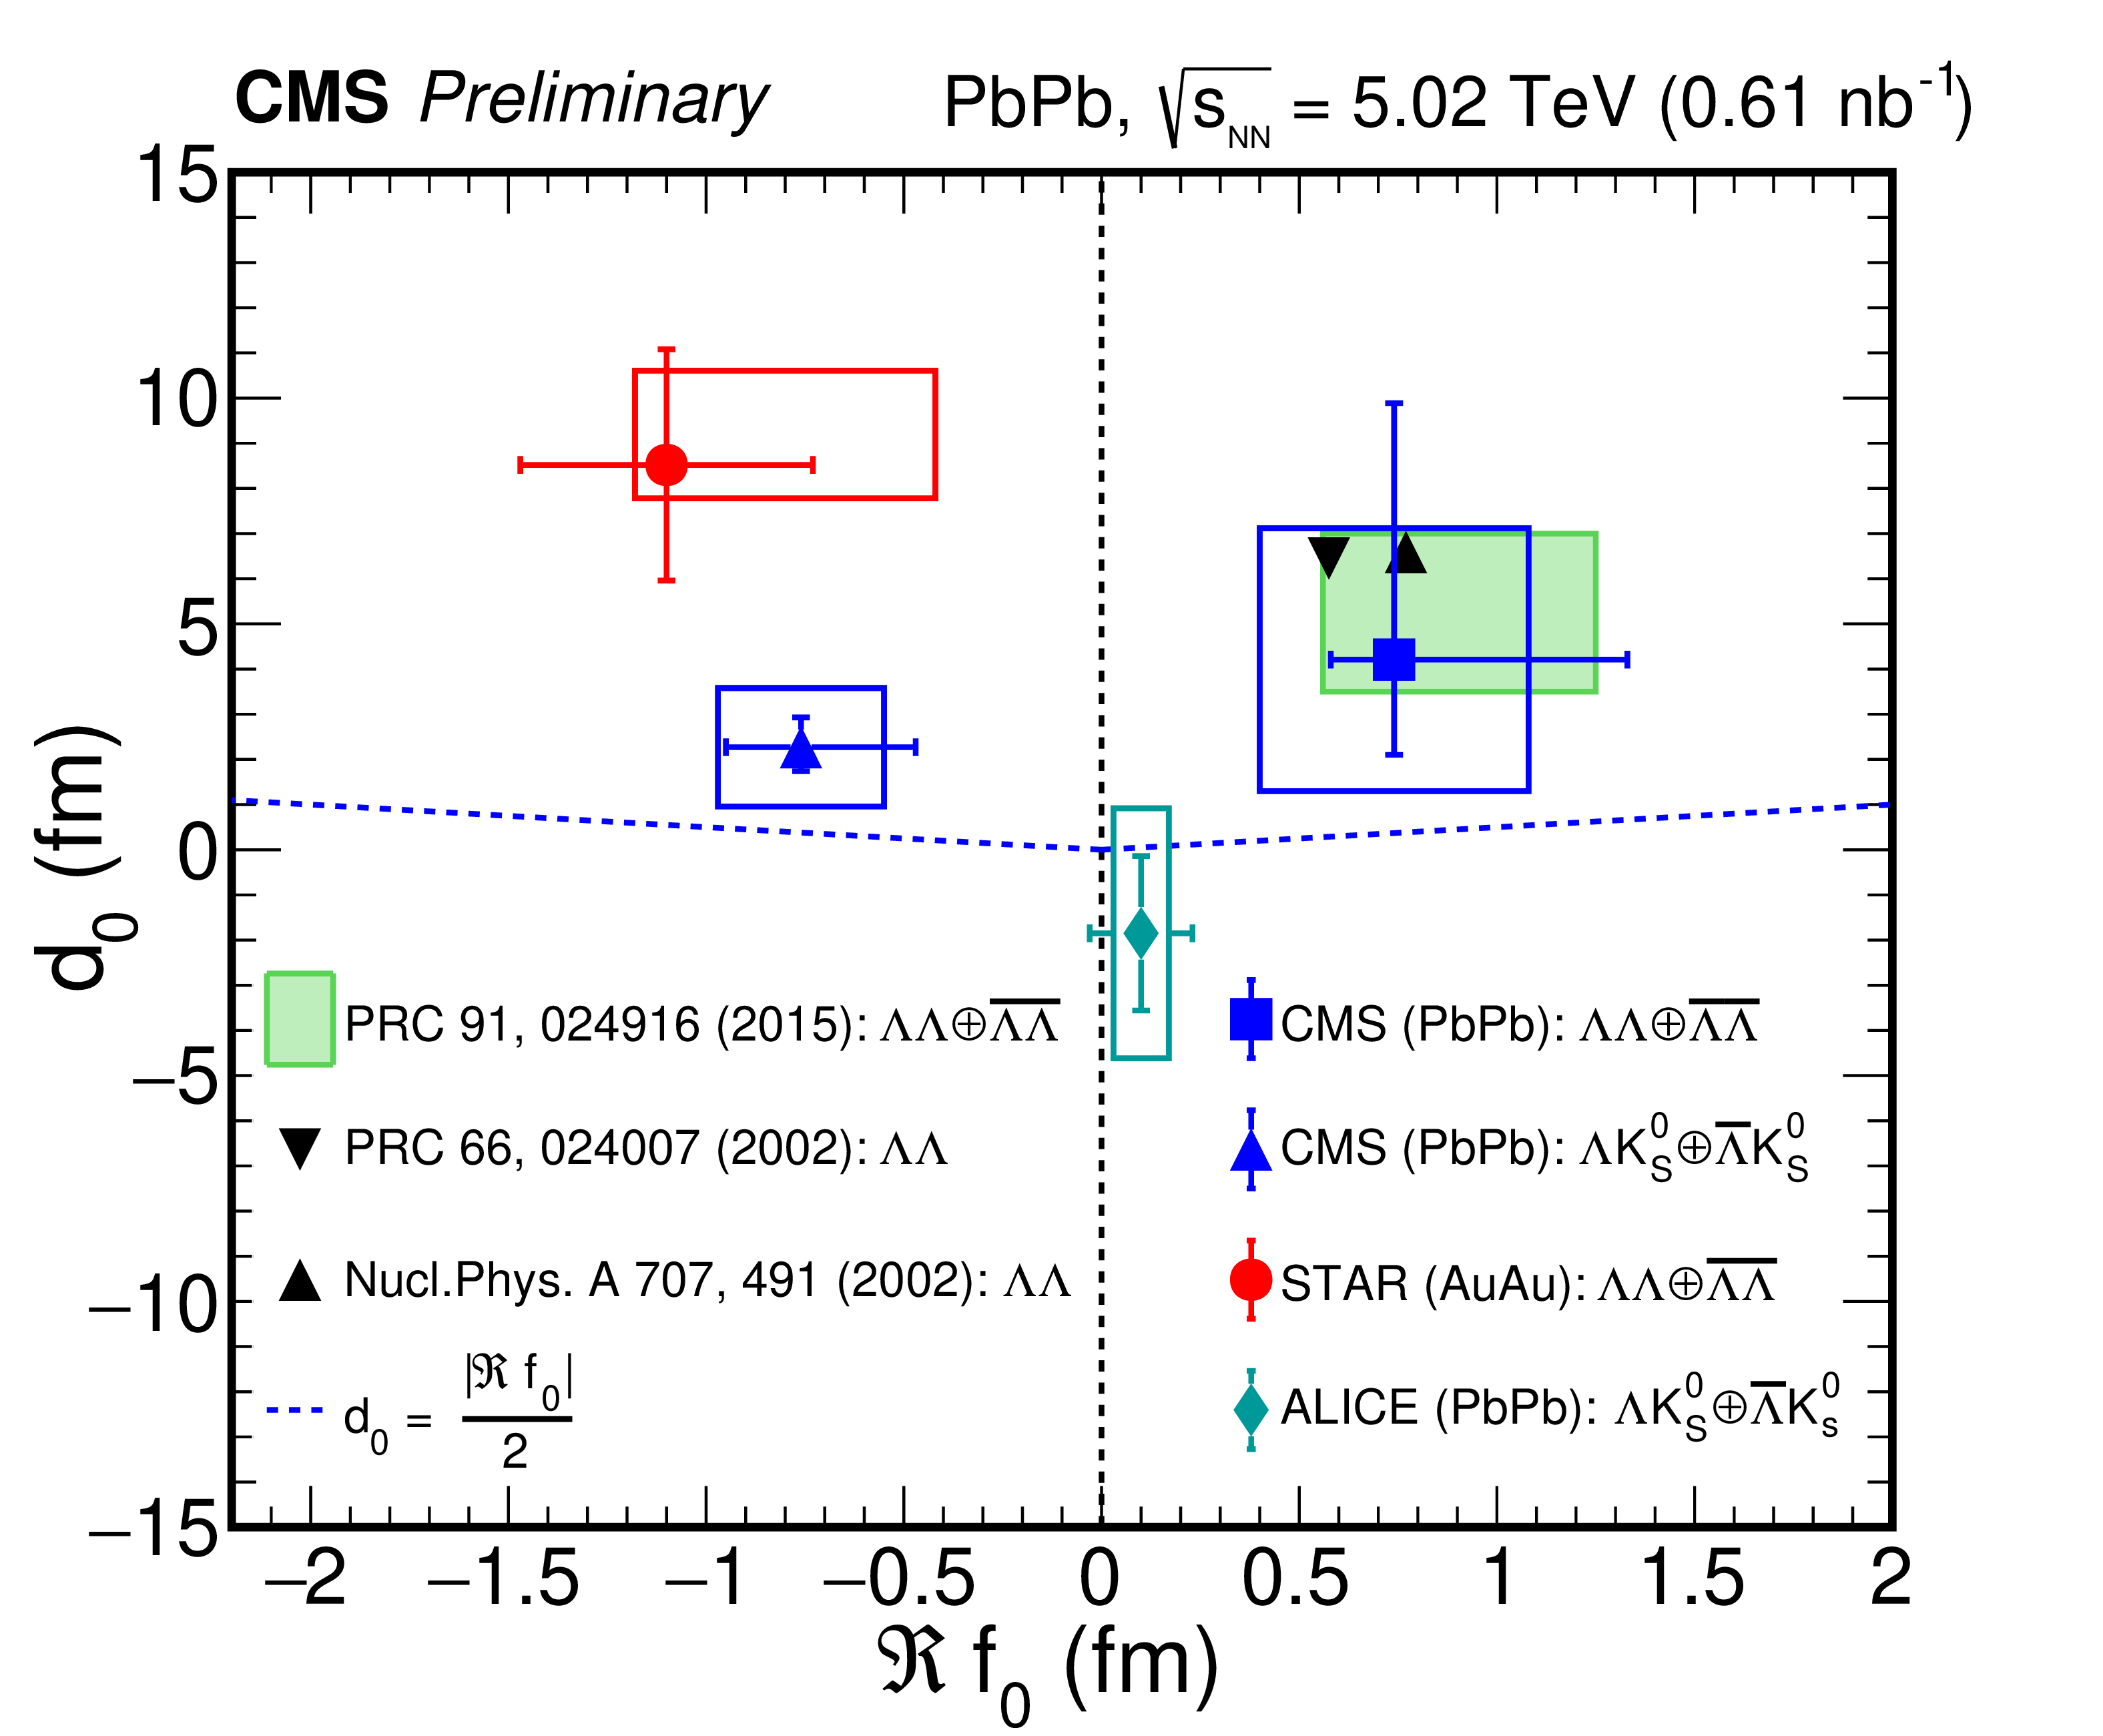
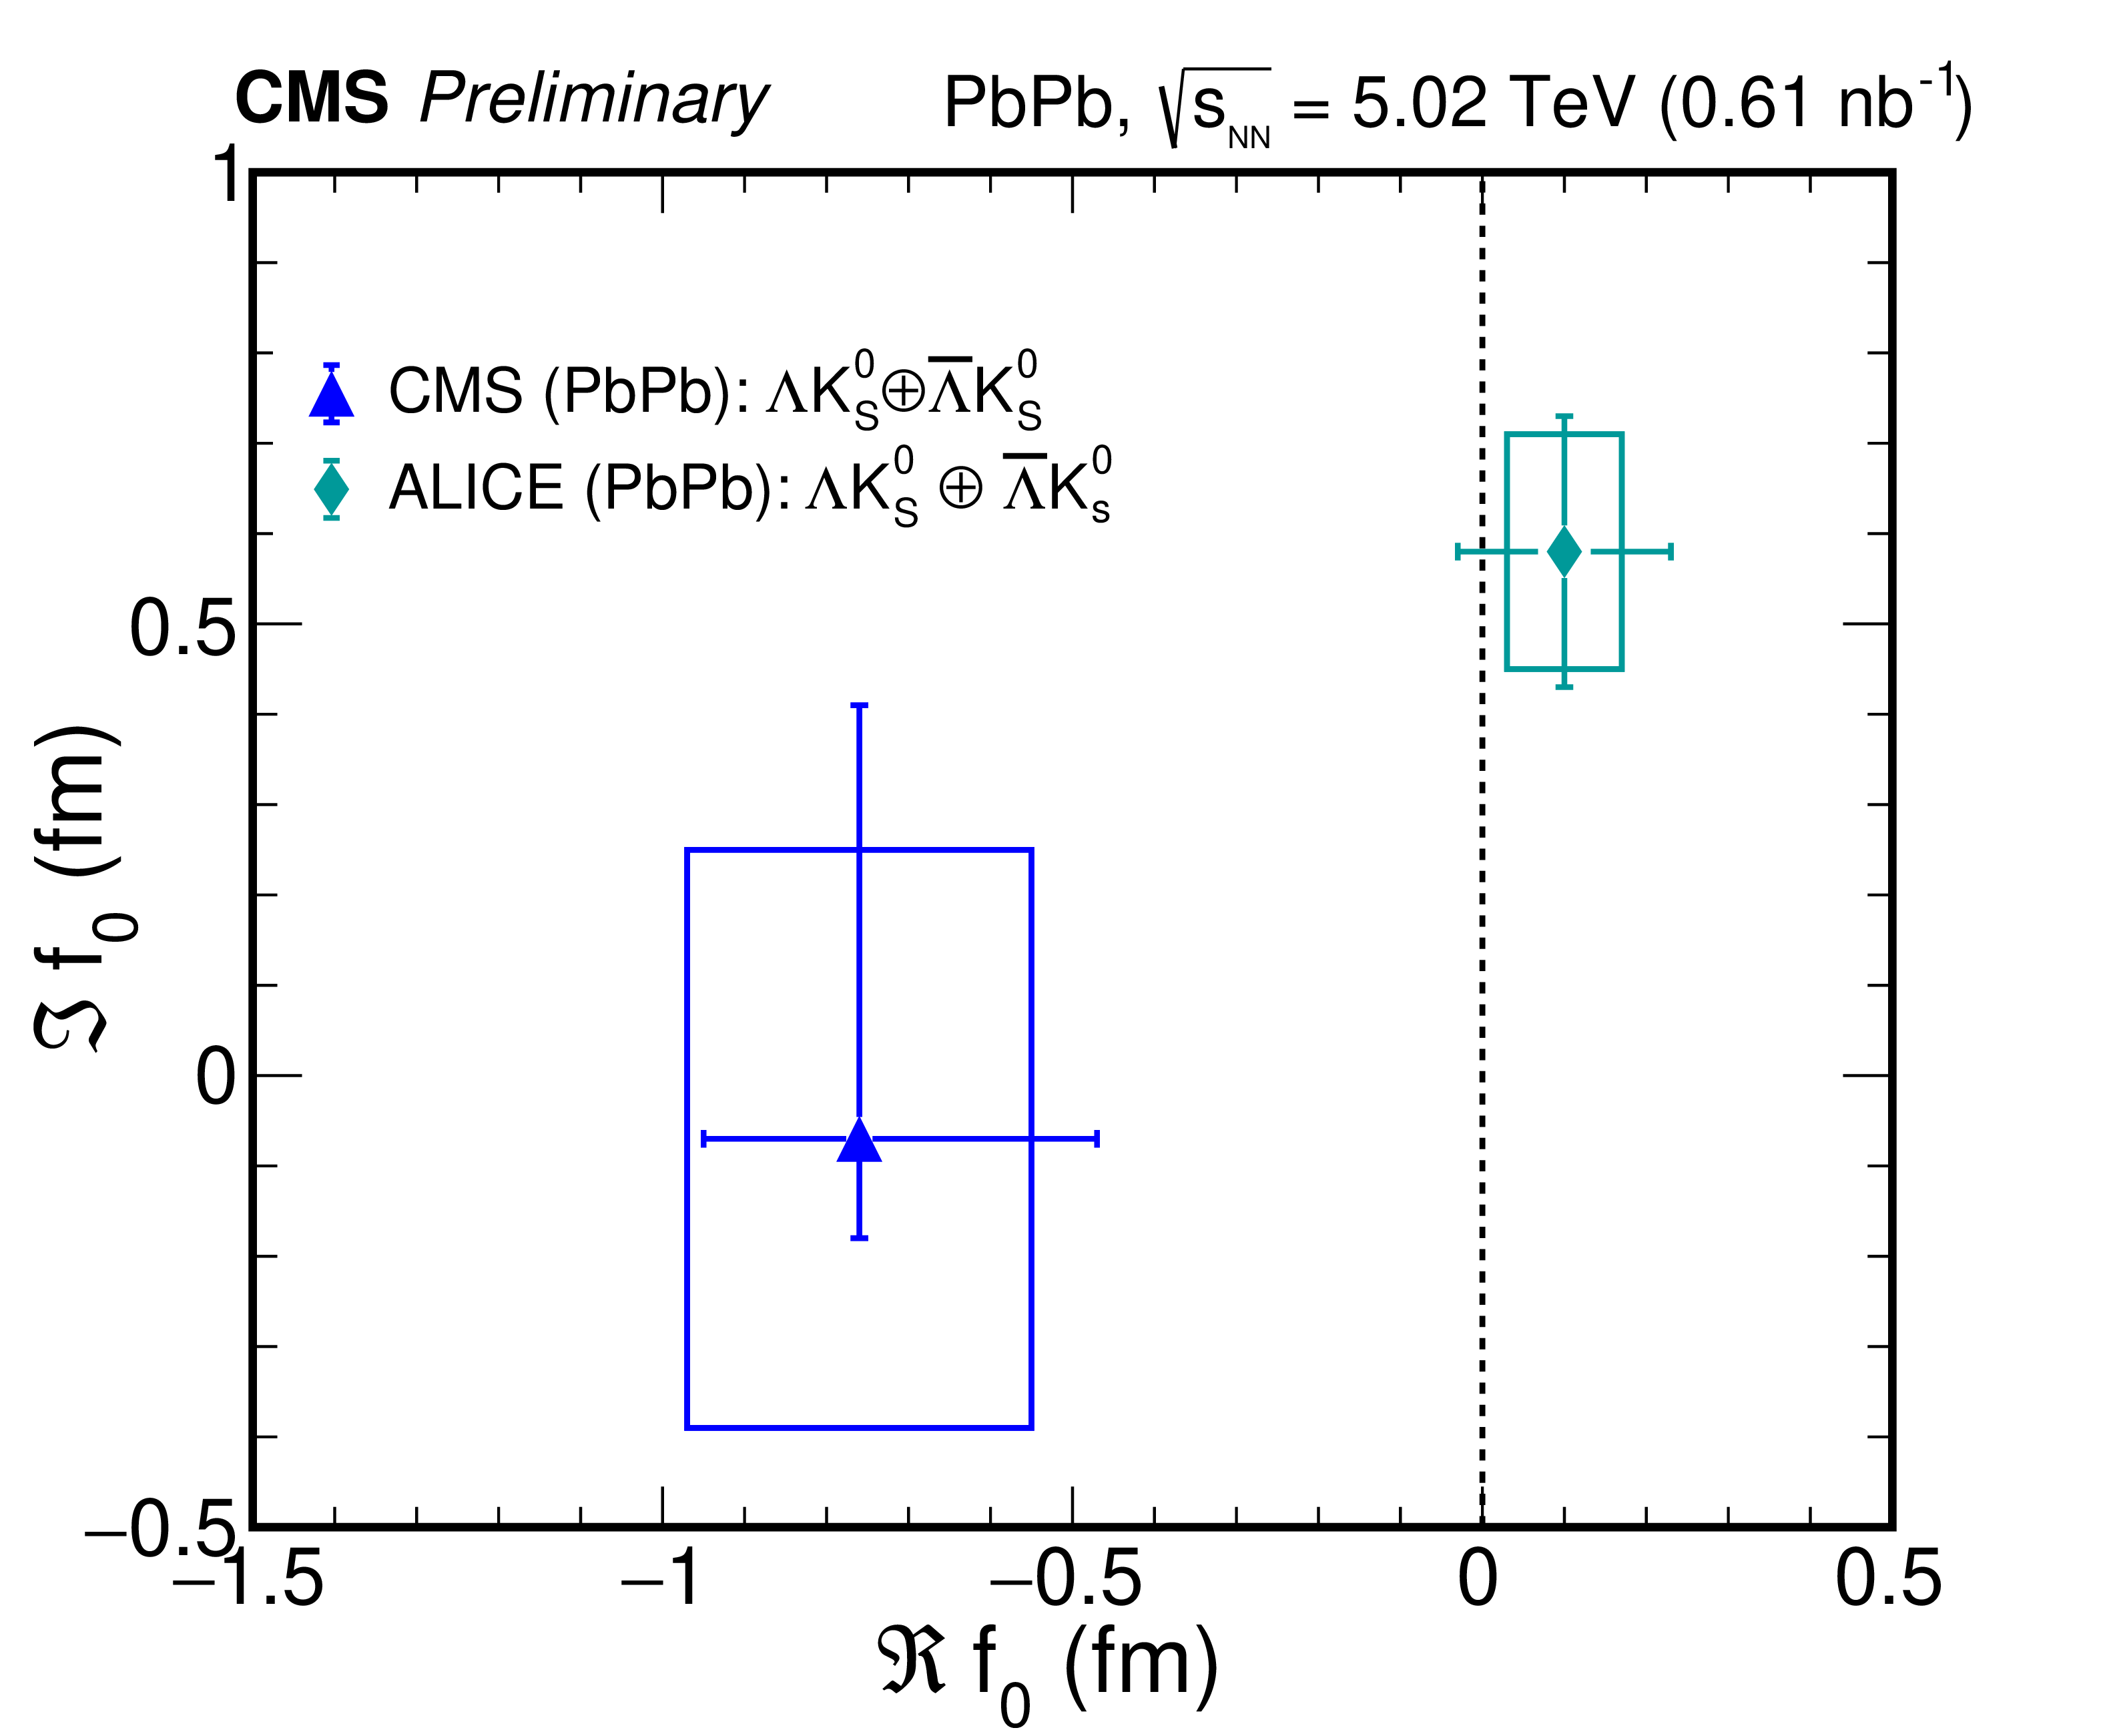
The values of $d_{0}$ and $\Re f_{0}$ (left) and the values of $\Im f_{0}$ and $\Re f_{0}$ (right). In the left plot, the blue triangles and square markers are for ${\Lambda \mathrm {K^0_S}\oplus \overline {\Lambda}\mathrm {K^0_S}}$ and ${\Lambda \Lambda \oplus \overline {\Lambda}\overline {\Lambda}}$ correlations, respectively, and are compared with the ${\Lambda \Lambda \oplus \overline {\Lambda}\overline {\Lambda}}$ result from the STAR experiment [28] and ${\Lambda \mathrm {K^0_S}\oplus \overline {\Lambda}\mathrm {K^0_S}}$ results from ALICE experiment [27]. A reanalysis of STAR data for ${\Lambda \Lambda \oplus \overline {\Lambda}\overline {\Lambda}}$ correlations is shown in the shaded area [32]. Theory calculations of the ${\Lambda \Lambda}$ interaction parameters are shown as black triangles [33,34]. The blue dotted lines correspond to the relation $d_{0} = {|\Re {f_{0}}|}/{2}$. In the right plot, the triangle is for ${\Lambda \mathrm {K^0_S}\oplus \overline {\Lambda}\mathrm {K^0_S}}$ correlations, and is compared with the ALICE ${\Lambda \mathrm {K^0_S}\oplus \overline {\Lambda}\mathrm {K^0_S}}$ result [27]. For each data point, the two lines and the box indicate the (one-dimensional) statistical and systematic uncertainties, respectively. |
png pdf |
Figure 5-a:
The values of $d_{0}$ and $\Re f_{0}$ (left) and the values of $\Im f_{0}$ and $\Re f_{0}$ (right). In the left plot, the blue triangles and square markers are for ${\Lambda \mathrm {K^0_S}\oplus \overline {\Lambda}\mathrm {K^0_S}}$ and ${\Lambda \Lambda \oplus \overline {\Lambda}\overline {\Lambda}}$ correlations, respectively, and are compared with the ${\Lambda \Lambda \oplus \overline {\Lambda}\overline {\Lambda}}$ result from the STAR experiment [28] and ${\Lambda \mathrm {K^0_S}\oplus \overline {\Lambda}\mathrm {K^0_S}}$ results from ALICE experiment [27]. A reanalysis of STAR data for ${\Lambda \Lambda \oplus \overline {\Lambda}\overline {\Lambda}}$ correlations is shown in the shaded area [32]. Theory calculations of the ${\Lambda \Lambda}$ interaction parameters are shown as black triangles [33,34]. The blue dotted lines correspond to the relation $d_{0} = {|\Re {f_{0}}|}/{2}$. In the right plot, the triangle is for ${\Lambda \mathrm {K^0_S}\oplus \overline {\Lambda}\mathrm {K^0_S}}$ correlations, and is compared with the ALICE ${\Lambda \mathrm {K^0_S}\oplus \overline {\Lambda}\mathrm {K^0_S}}$ result [27]. For each data point, the two lines and the box indicate the (one-dimensional) statistical and systematic uncertainties, respectively. |
png pdf |
Figure 5-b:
The values of $d_{0}$ and $\Re f_{0}$ (left) and the values of $\Im f_{0}$ and $\Re f_{0}$ (right). In the left plot, the blue triangles and square markers are for ${\Lambda \mathrm {K^0_S}\oplus \overline {\Lambda}\mathrm {K^0_S}}$ and ${\Lambda \Lambda \oplus \overline {\Lambda}\overline {\Lambda}}$ correlations, respectively, and are compared with the ${\Lambda \Lambda \oplus \overline {\Lambda}\overline {\Lambda}}$ result from the STAR experiment [28] and ${\Lambda \mathrm {K^0_S}\oplus \overline {\Lambda}\mathrm {K^0_S}}$ results from ALICE experiment [27]. A reanalysis of STAR data for ${\Lambda \Lambda \oplus \overline {\Lambda}\overline {\Lambda}}$ correlations is shown in the shaded area [32]. Theory calculations of the ${\Lambda \Lambda}$ interaction parameters are shown as black triangles [33,34]. The blue dotted lines correspond to the relation $d_{0} = {|\Re {f_{0}}|}/{2}$. In the right plot, the triangle is for ${\Lambda \mathrm {K^0_S}\oplus \overline {\Lambda}\mathrm {K^0_S}}$ correlations, and is compared with the ALICE ${\Lambda \mathrm {K^0_S}\oplus \overline {\Lambda}\mathrm {K^0_S}}$ result [27]. For each data point, the two lines and the box indicate the (one-dimensional) statistical and systematic uncertainties, respectively. |
| Tables | |
png pdf |
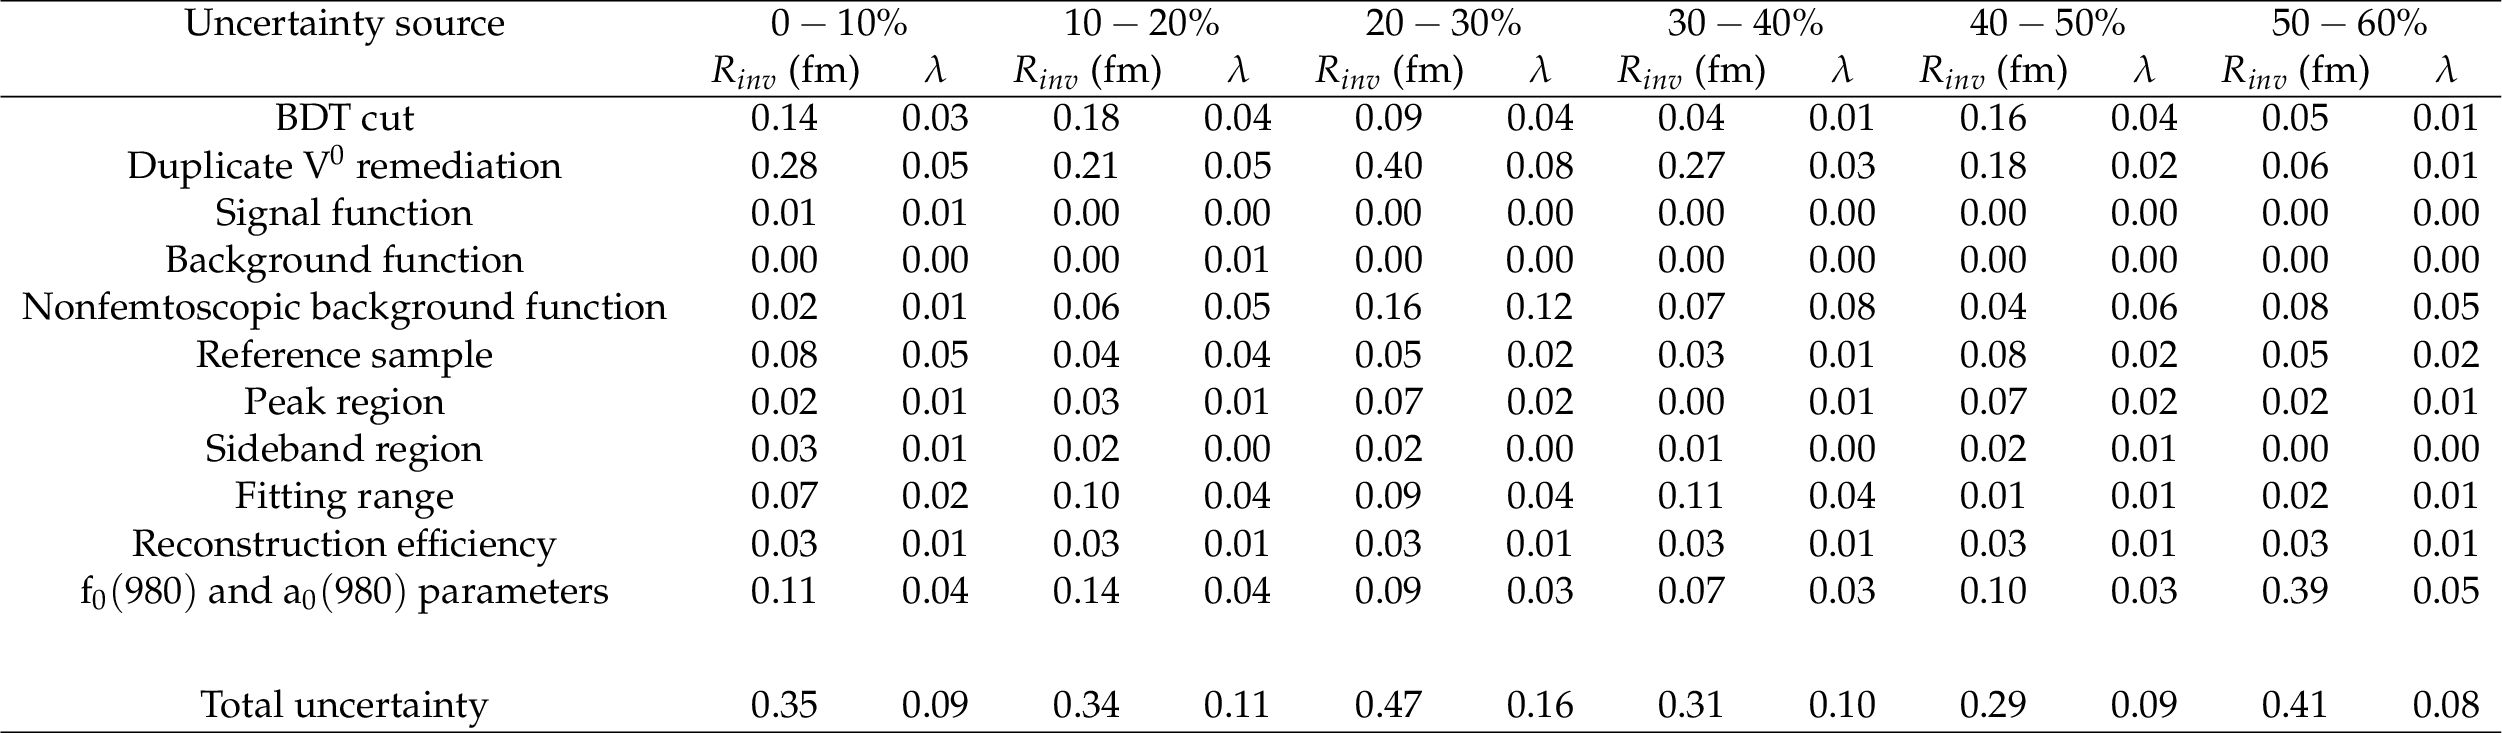
Table 1:
Summary of systematic uncertainties in ${\mathrm {K^{0}_{S}K^{0}_{S}}}$ correlations in different centrality bins |
png pdf |
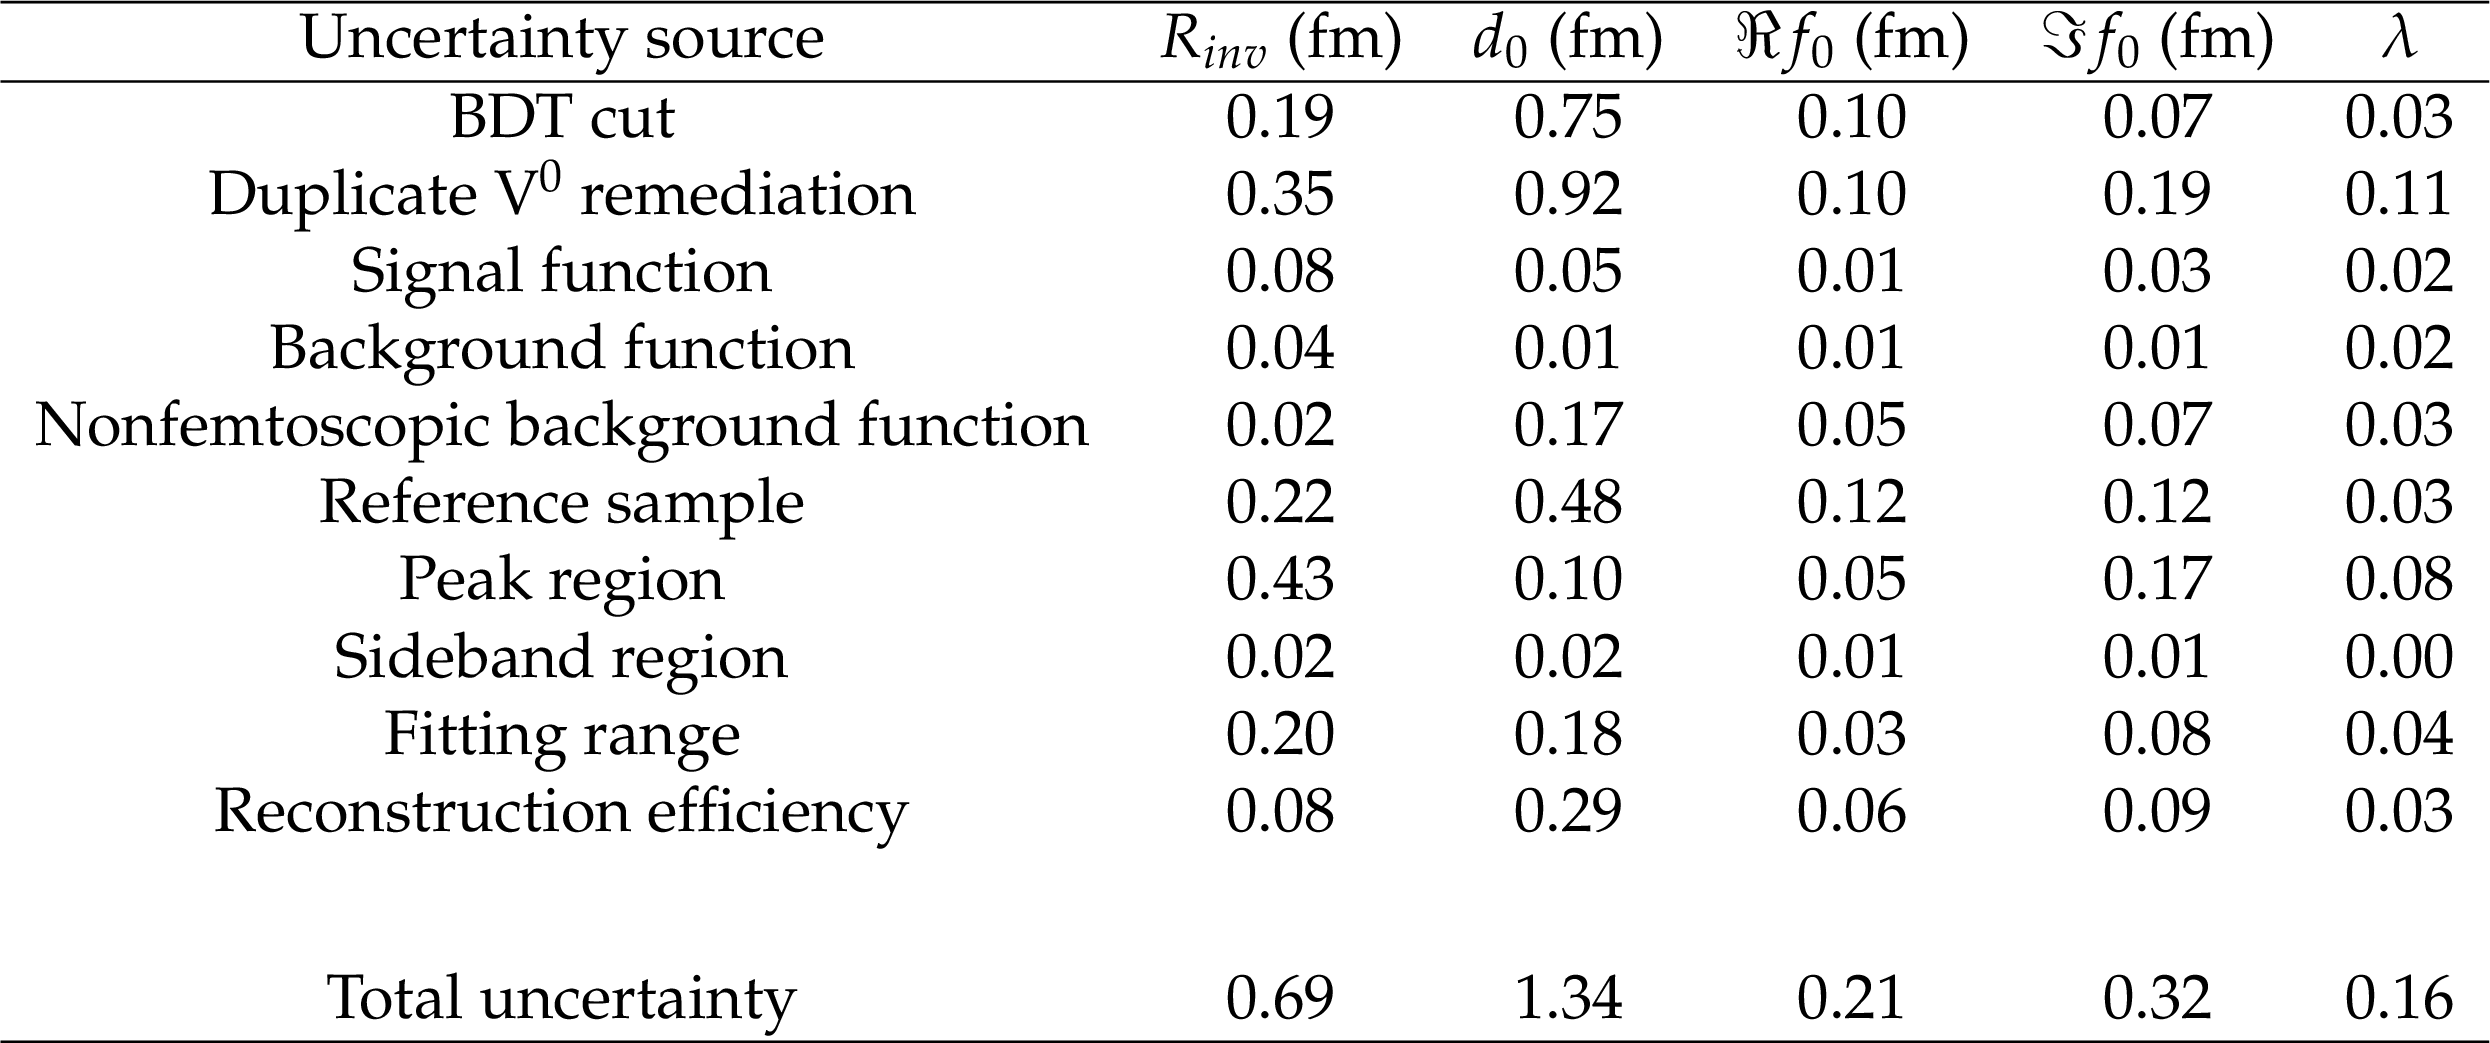
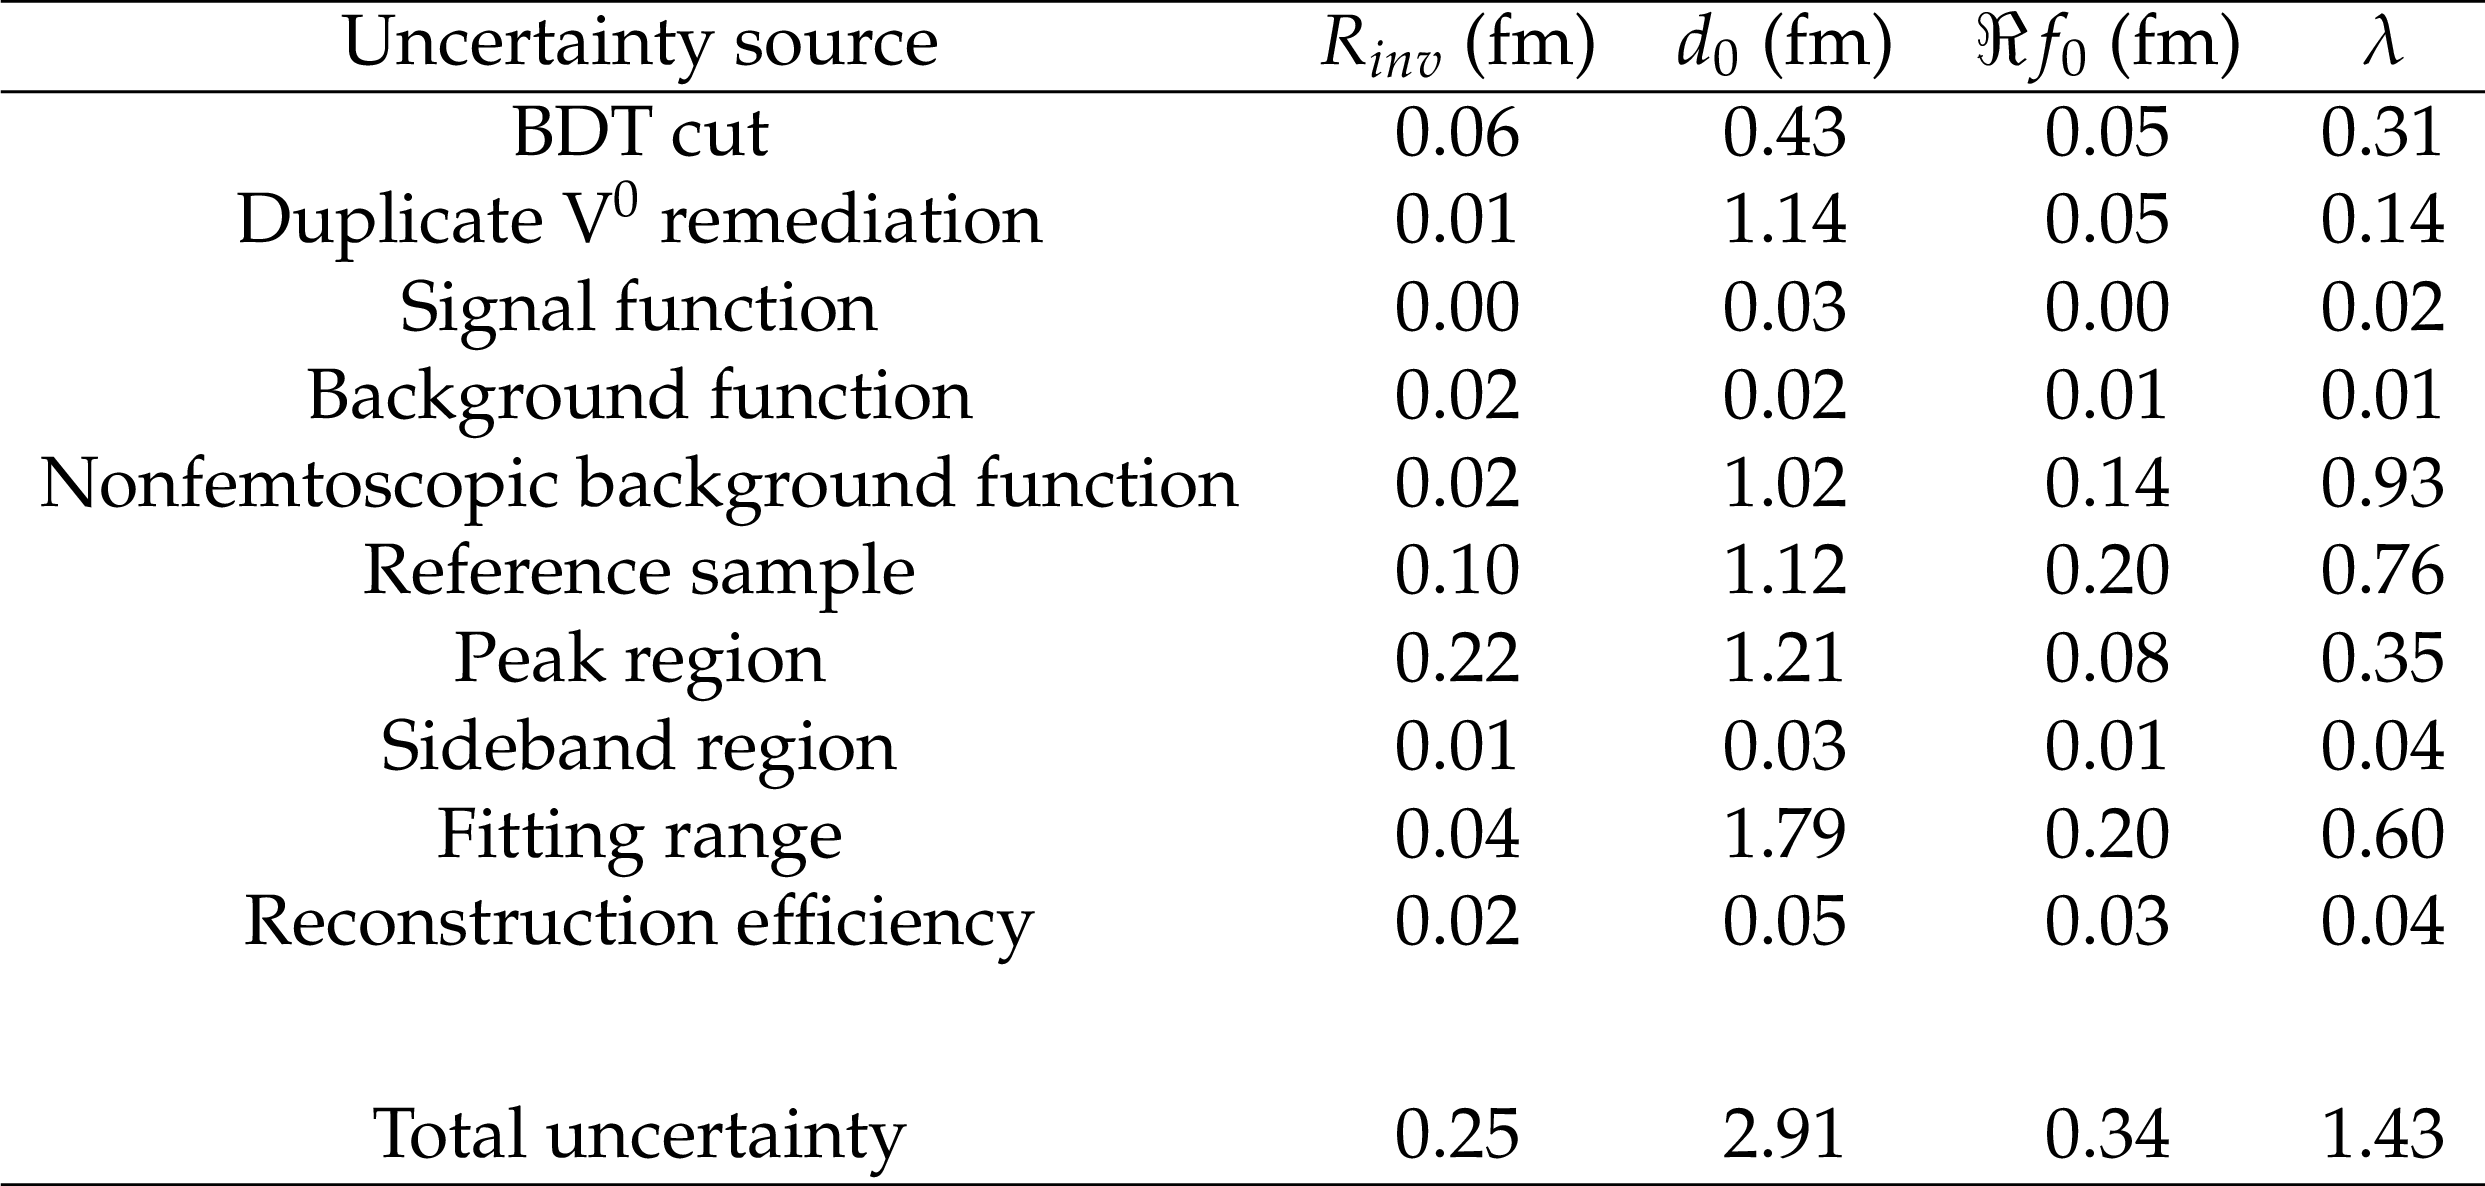
Table 2:
Summary of systematic uncertainties in ${\Lambda \mathrm {K^0_S}\oplus \overline {\Lambda}\mathrm {K^0_S}}$ correlations in 0-80% centrality |
png pdf |
Table 3:
Summary of systematic uncertainties in ${\Lambda \Lambda \oplus \overline {\Lambda}\overline {\Lambda}}$ correlations in 0-80% centrality |
png pdf |
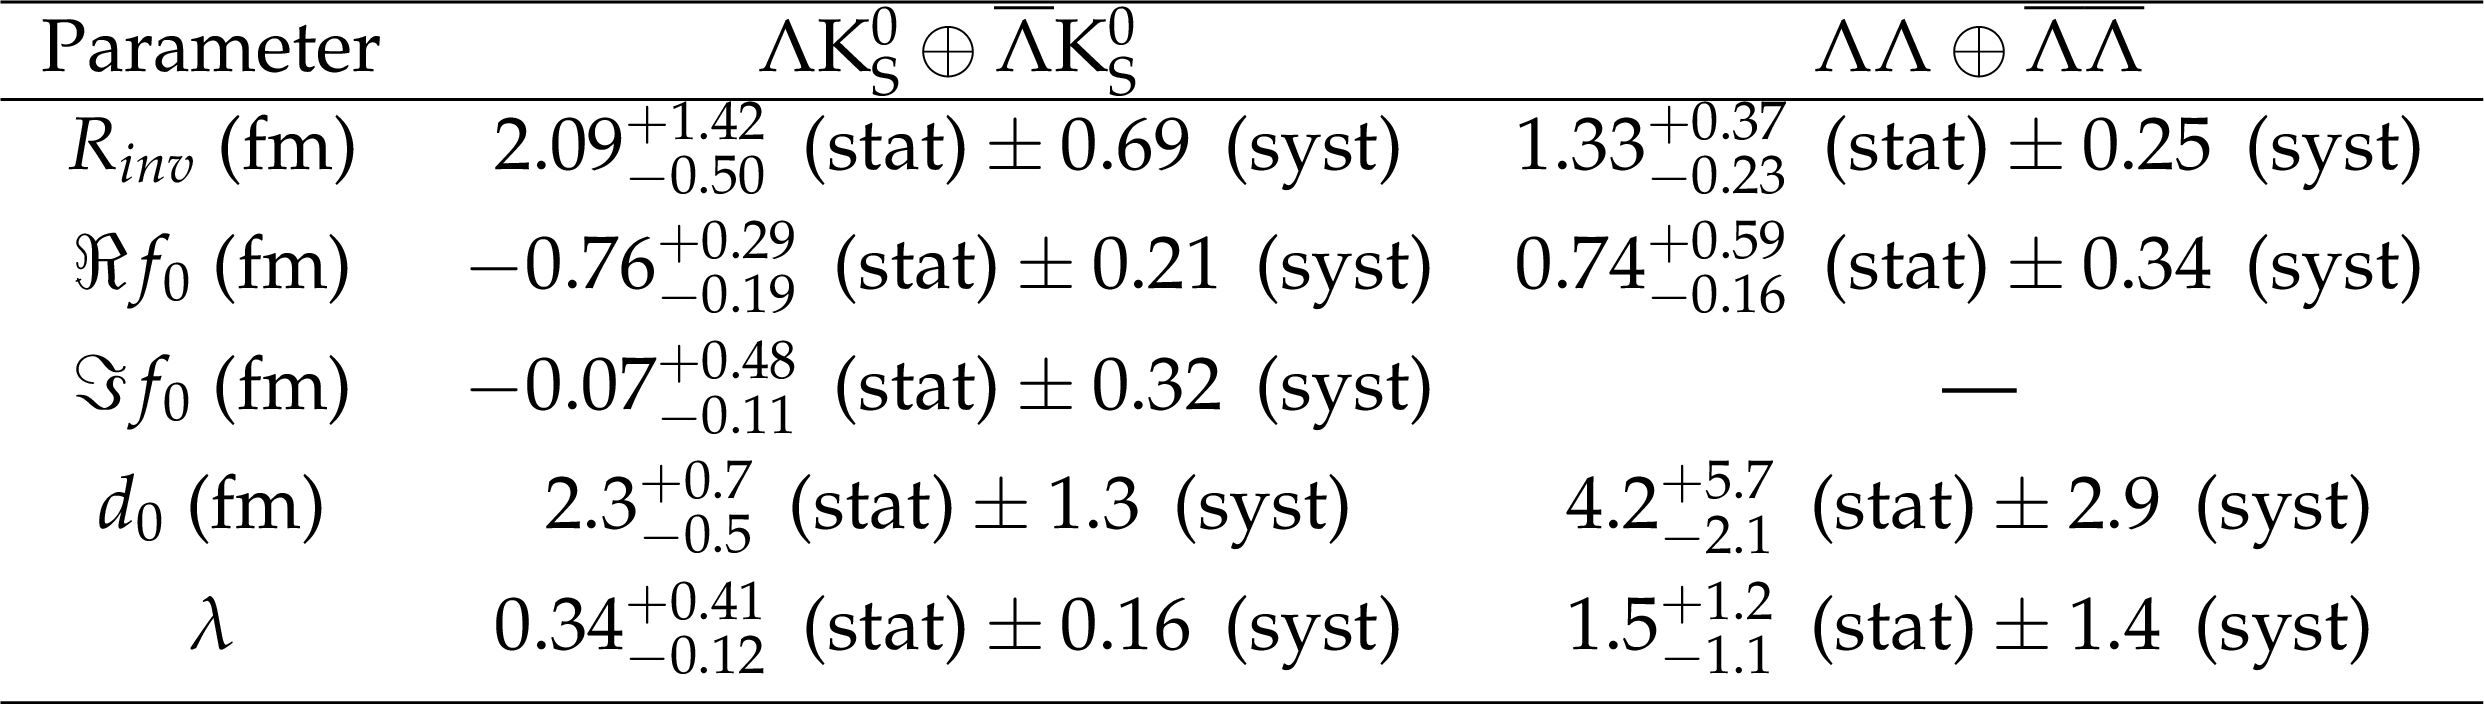
Table 4:
Extracted values of the $R_{inv}$, $\Re f_{0}$, $\Im f_{0}$, $d_{0}$, and $\lambda $ from ${\Lambda \mathrm {K^0_S}\oplus \overline {\Lambda}\mathrm {K^0_S}}$ and ${\Lambda \Lambda \oplus \overline {\Lambda}\overline {\Lambda}}$ correlations in the 0-80% centrality. |
| Summary |
| The ${\mathrm{K^{0}_{S}K^{0}_{S}}}$, ${\Lambda\mathrm{K^0_S}\oplus\overline{\Lambda}\mathrm{K^0_S}}$, and ${\Lambda\mathrm{K^0_S}\oplus\overline{\Lambda}\mathrm{K^0_S}}$ femtoscopic correlations are extracted from data collected in PbPb collisions at a center-of-mass energy per nucleon pair of ${\sqrt {\smash [b]{s_{_{\mathrm {NN}}}}}} = $ 5.02 TeV. This is the first report of ${\Lambda\mathrm{K^0_S}\oplus\overline{\Lambda}\mathrm{K^0_S}}$ correlations in PbPb collisions. The source size $R_{\text{inv}}$ is extracted for ${\mathrm{K^{0}_{S}K^{0}_{S}}}$ correlations in six equal width centrality bins covering the 0-60% centrality range and is found to decrease going towards more peripheral collisions. The extraction of $R_{\text{inv}}$ as a function of $m_{\mathrm{T}}$ is also presented for ${\mathrm{K^{0}_{S}K^{0}_{S}}}$ correlations and is compared with ALICE results at ${\sqrt {\smash [b]{s_{_{\mathrm {NN}}}}}} = $ 2.76 TeV. Measured values for $R_{\text{inv}}$, based on ${\Lambda\mathrm{K^0_S}\oplus\overline{\Lambda}\mathrm{K^0_S}}$, and ${\Lambda\mathrm{K^0_S}\oplus\overline{\Lambda}\mathrm{K^0_S}}$ correlations, are also presented for the 0-80% centrality range. The Lednicky-Lyuboshits model fits to the correlation data indicate that the ${\Lambda\mathrm{K^0_S}\oplus\overline{\Lambda}\mathrm{K^0_S}}$ interaction is repulsive and ${\Lambda\mathrm{K^0_S}\oplus\overline{\Lambda}\mathrm{K^0_S}}$ interaction is attractive with no evidence for a bound H-dibaryon. |
| References | ||||
| 1 | M. A. Lisa, S. Pratt, R. Soltz, and U. Wiedemann | Femtoscopy in relativistic heavy ion collisions | Ann. Rev. Nucl. Part. Sci. 55 (2005) 357 | nucl-ex/0505014 |
| 2 | R. Lednicky and V. L. Lyuboshits | Final State Interaction Effect on Pairing Correlations Between Particles with Small Relative Momenta | Sov. J. NP 35 (1982) 770 | |
| 3 | Tracker Group of the CMS Collaboration | The CMS phase-1 pixel detector upgrade | JINST 16 (2021) P02027 | 2012.14304 |
| 4 | CMS Collaboration | Track impact parameter resolution for the full pseudo rapidity coverage in the 2017 dataset with the CMS phase-1 pixel detector | CDS | |
| 5 | CMS Collaboration | The CMS experiment at the CERN LHC | JINST 3 (2008) S08004 | CMS-00-001 |
| 6 | CMS Collaboration | The CMS trigger system | JINST 12 (2017) 01020 | CMS-TRG-12-001 1609.02366 |
| 7 | CMS Collaboration | Charged-particle nuclear modification factors in PbPb and pPb collisions at $ {\sqrt {\smash [b]{s_{_{\mathrm {NN}}}}}} = $ 5.02 TeV | JHEP 04 (2017) 039 | CMS-HIN-15-015 1611.01664 |
| 8 | CMS Collaboration | Description and performance of track and primary-vertex reconstruction with the CMS tracker | JINST 9 (2014) P10009 | CMS-TRK-11-001 1405.6569 |
| 9 | CMS Collaboration | Observation and studies of jet quenching in PbPb collisions at nucleon-nucleon center-of-mass energy = 2.76 TeV | PRC 84 (2011) | CMS-HIN-10-004 1102.1957 |
| 10 | C. Gale, S. Jeon, and B. Schenke | Hydrodynamic modeling of heavy ion collisions | Int. J. Mod. Phys. A 28 (2013) 1340011 | 1301.5893 |
| 11 | GEANT4 Collaboration | GEANT4--a simulation toolkit | NIMA 506 (2003) 250 | |
| 12 | CMS Collaboration | Strange particle collectivity in pPb and PbPb | CMS-PAS-HIN-19-004 | CMS-PAS-HIN-19-004 |
| 13 | CMS Collaboration | Strange Particle Production in pp Collisions at $ \sqrt{s} = $ 0.9 and 7 TeV | JHEP 05 (2011) 064 | CMS-QCD-10-007 1102.4282 |
| 14 | CMS Collaboration | Long-range two-particle correlations of strange hadrons with charged particles in pPb and PbPb collisions at LHC energies | PLB 742 (2015) 200 | CMS-HIN-14-002 1409.3392 |
| 15 | Particle Data Group Collaboration | Review of Particle Physics | PTEP 2020 (2020) 083C01 | |
| 16 | H. Voss, A. Hocker, J. Stelzer, and F. Tegenfeldt | TMVA, the toolkit for multivariate data analysis with ROOT | in XIth International Workshop on Advanced Computing and Analysis Techniques in Physics Research (ACAT), 2007 | physics/0703039 |
| 17 | G. I. Kopylov | Like particle correlations as a tool to study the multiple production mechanism | Physics Letters B 50 (1974) 472 | |
| 18 | A. Kisiel | Non-identical Particle Correlation Analysis in the Presence of Non-femtoscopic Correlations | Acta Phys. Polon. B 48 (2017) 717 | |
| 19 | CMS Collaboration | Bose-Einstein correlations in pp, pPb, and PbPb collisions at $ {\sqrt {\smash [b]{s_{_{\mathrm {NN}}}}}} = $ 0.9 - 7 TeV | PRC 97 (2018) 064912 | CMS-FSQ-14-002 1712.07198 |
| 20 | ALICE Collaboration | p-p, p-${\Lambda} $, and $ {\Lambda} $-$ {\Lambda} $ correlations studied via femtoscopy in pp reactions at $ \sqrt{s}=$ 7 TeV | PRC 99 (2019) 024001 | 1805.12455 |
| 21 | CMS Collaboration | Measurement of two-particle Bose-Einstein momentum correlations and their Levy parameters at $ {\sqrt {\smash [b]{s_{_{\mathrm {NN}}}}}}= $ 5.02 TeV PbPb collisions | CMS-PAS-HIN-21-011 | CMS-PAS-HIN-21-011 |
| 22 | STAR Collaboration | Neutral kaon interferometry in Au-Au collisions at $ {\sqrt {\smash [b]{s_{_{\mathrm {NN}}}}}} = $ 200 GeV | PRC 74 (2006) 054902 | nucl-ex/0608012 |
| 23 | A. D. Martin and E. N. Ozmutlu | Analyses of KK production and scalar mesons | NPB 158 (1979) 520 | |
| 24 | A. Antonelli | Radiative $ \phi $ decays | eConfC 020620 (2002) THAT06 | hep-ex/0209069 |
| 25 | N. N. Achasov and V. V. Gubin | Analysis of the nature of the $ \phi \rightarrow \gamma \pi \eta $ and $ \phi \rightarrow \gamma \pi^{0} \pi^{0} $ decays | Phys. Atom. Nucl. 65 (2002) 1528 | hep-ph/0101024 |
| 26 | N. N. Achasov and A. V. Kiselev | New analysis of the KLOE data on the $ {\varphi \rightarrow} {\eta} {{\pi}}^{0} {\gamma} $ decay | PRD 68 (2003) 014006 | hep-ph/0212153 |
| 27 | ALICE Collaboration | $ \Lambda $K femtoscopy in Pb-Pb collisions at $ {\sqrt {\smash [b]{s_{_{\mathrm {NN}}}}}} = $ 2.76 TeV | PRC 103 (2021) 055201 | 2005.11124 |
| 28 | STAR Collaboration | $ {\Lambda} {\Lambda} $ Correlation Function in Au+Au collisions at $ {\sqrt {\smash [b]{s_{_{\mathrm {NN}}}}}} = $ 200 GeV | PRL 114 (2015) 022301 | 1408.4360 |
| 29 | ALICE Collaboration | Measurement of strange baryon-antibaryon interactions with femtoscopic correlations | Physics Letters B 802 (2020) 135223 | 1903.06149 |
| 30 | STAR Collaboration | Proton-$ \Lambda $ correlations in central Au+Au collisions at $ {\sqrt {\smash [b]{s_{_{\mathrm {NN}}}}}} = $ 200 GeV | PRC 74 (2006) 064906 | nucl-ex/0511003 |
| 31 | F. James and M. Roos | Minuit: A System for Function Minimization and Analysis of the Parameter Errors and Correlations | CPC 10 (1975) 343 | |
| 32 | K. Morita, T. Furumoto, and A. Ohnishi | $ {\Lambda} {\Lambda} $ interaction from relativistic heavy ion collisions | PRC 91 (2015) 024916 | 1408.6682 |
| 33 | E. Hiyama et al. | Four-body cluster structure of $ \mathrm{A} = $ 7-10 double-$ {\Lambda} $ hypernuclei | PRC 66 (2002) 024007 | nucl-th/0204059 |
| 34 | I. N. Filikhin and A. Gal | Faddeev-Yakubovsky calculations for light $ {\Lambda} {\Lambda} $ hypernuclei | NP A 707 (2002) 491 | nucl-th/0203036 |
| 35 | H. Takahashi et al. | Observation of a $ {{\Lambda} {\Lambda}}^{6} \text{He}$ Double Hypernucleus | PRL 87 (2001) 212502 | |
|
|
Compact Muon Solenoid LHC, CERN |
|

|

|

|

|

|