

Compact Muon Solenoid
LHC, CERN
| CMS-PAS-HIN-19-006 | ||
| Studies of parton-medium interactions using Z-tagged charged particles in PbPb collisions at ${\sqrt {\smash [b]{s_{_{\mathrm {NN}}}}}}= $ 5.02 TeV | ||
| CMS Collaboration | ||
| May 2020 | ||
| Abstract: The first measurements of Z boson-tagged charged hadron spectra are reported in PbPb collisions at ${\sqrt {\smash [b]{s_{_{\mathrm {NN}}}}}}= $ 5 TeV, using the PbPb collision data recorded by the CMS experiment at the LHC in 2018, corresponding to an integrated luminosity of 1.7 nb$^{-1}$. Hadronic collision data with at least one Z boson with transverse momentum $p_{\,\mathrm{T}} > $ 30 GeV/$c$ are analyzed. The azimuthal angle distributions with respect to the Z bosons, which are sensitive to medium recoils and modification of in-medium parton shower, are measured in PbPb collisions. The results indicate a modification of the angular correlation functions with respect to the reference measured in pp interactions at the same collision energy. The first measurements of Z-tagged fragmentation functions and charged particle $p_{\,\mathrm{T}}$ spectra are also reported. These measurements are sensitive to the modification of the longitudinal structure of the parton shower inside the medium. Significant modifications of the fragmentation functions and charged particle $p_{\,\mathrm{T}}$ spectra are observed. | ||
|
Links:
CDS record (PDF) ;
CADI line (restricted) ;
These preliminary results are superseded in this paper, Submitted to PRL. The superseded preliminary plots can be found here. |
||
| Figures | Summary | Additional Figures | References | CMS Publications |
|---|
| Figures | |

png pdf |
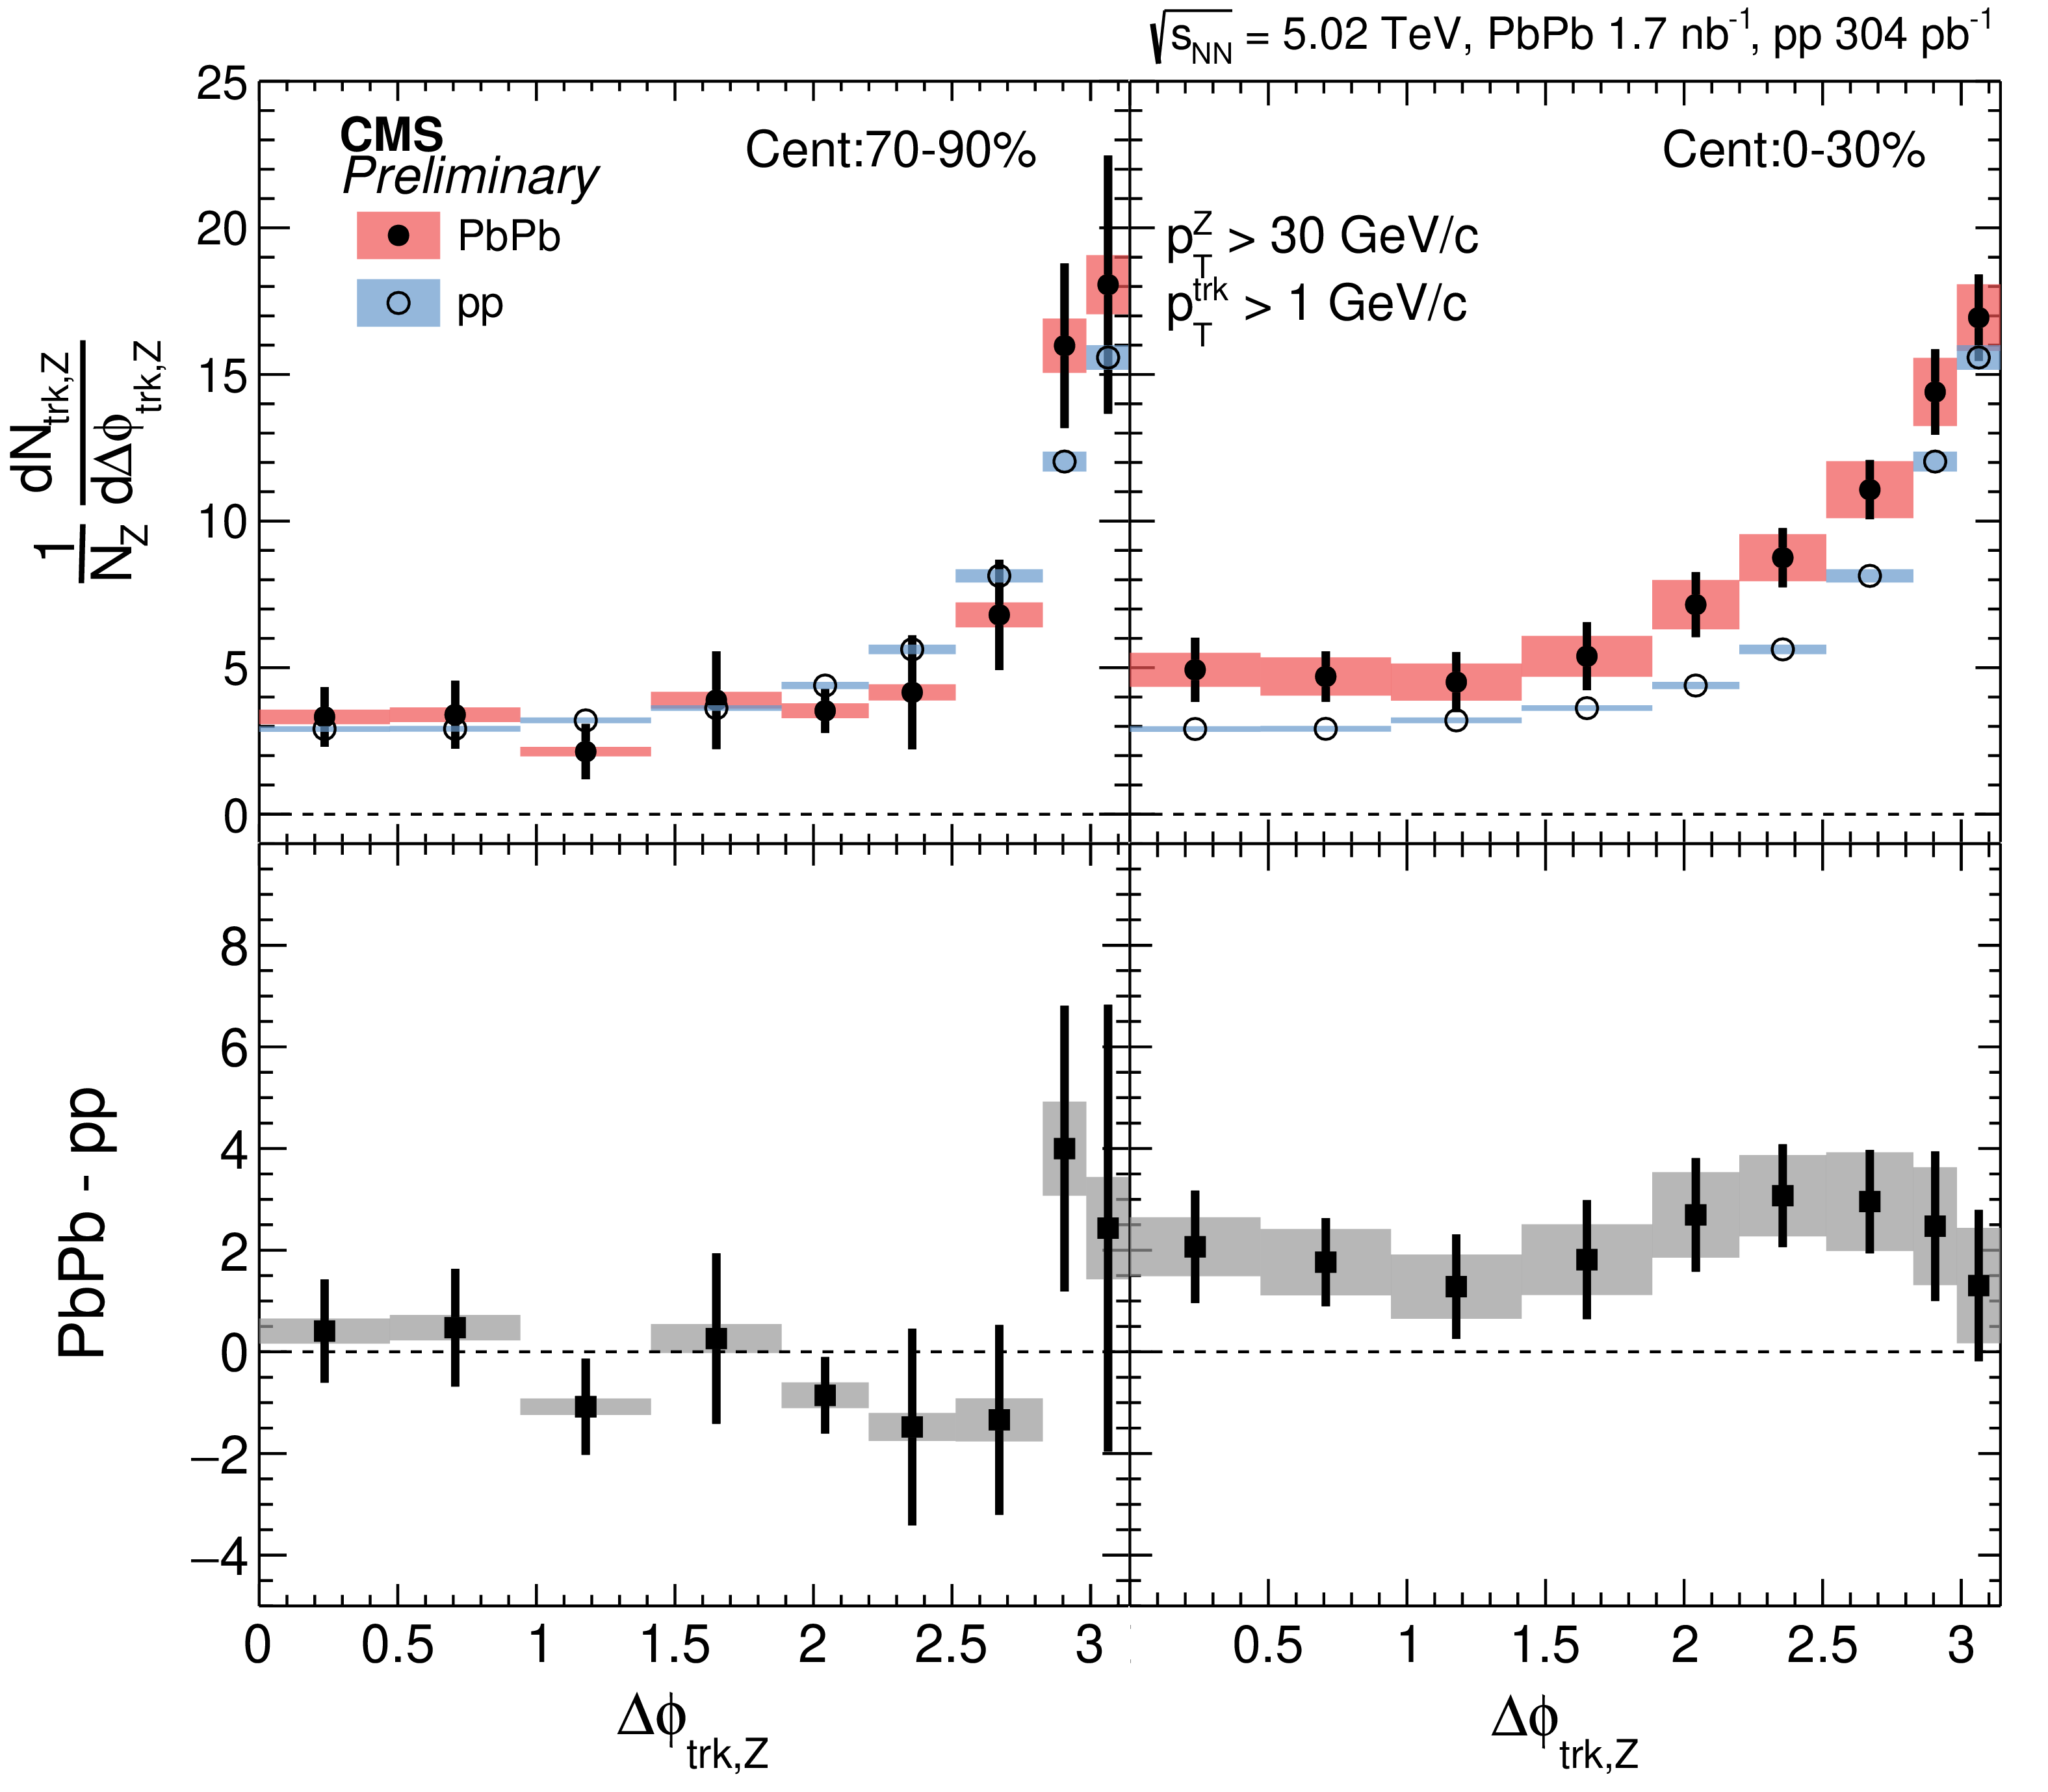
Figure 1:
Top : Distributions of ${\Delta \phi _{{\,\mathrm {trk,Z}}}}$ in pp collisions compared to PbPb collisions in 70-90% (left) 50-70%, 30-50%, and 0-30% (right) centrality intervals. Bottom : Difference between the PbPb and pp distributions. The vertical bars through the points represent statistical uncertainties, while the shaded boxes indicate systematic uncertainties. |

png pdf |
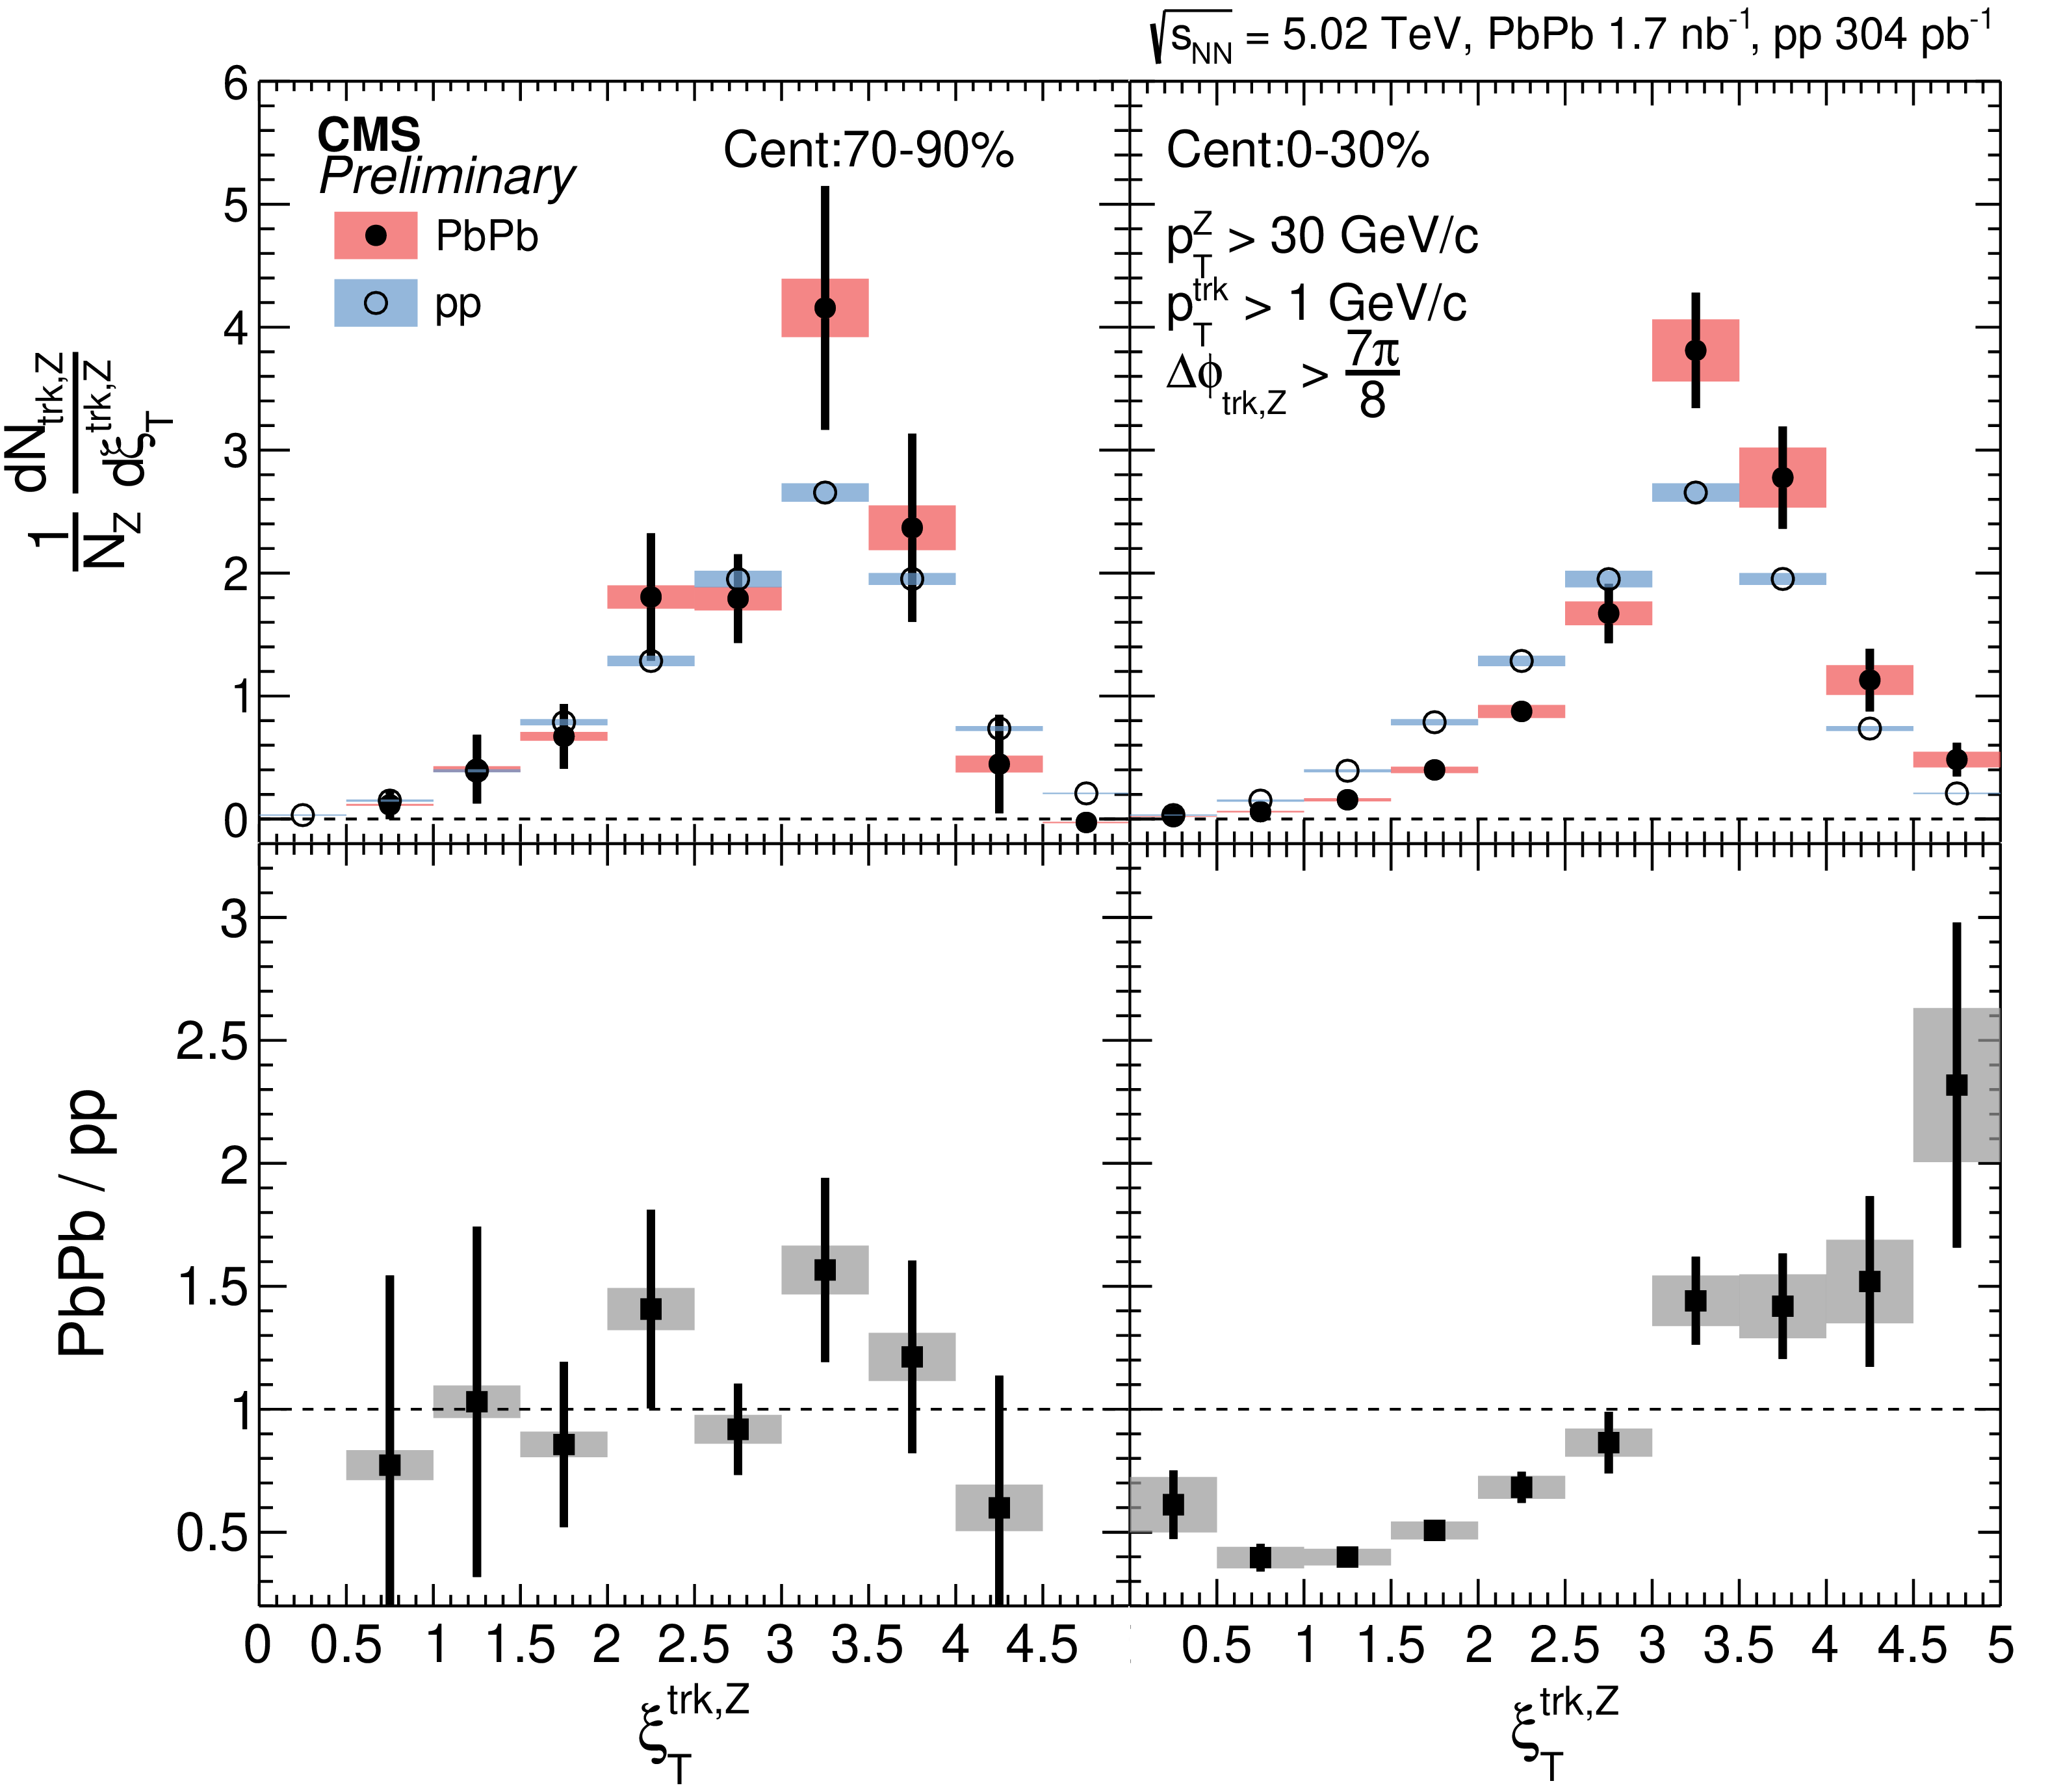
Figure 2:
Top : Distributions of ${\xi ^{\,\mathrm {Z,trk}_{{\,\mathrm {T}}}}}$ in pp collisions compared to PbPb collisions in 70-90% (left), 50-70%, 30-50%, and 0-30% (right) centrality intervals. Bottom : ratio of the PbPb and pp distributions. The vertical bars through the points represent statistical uncertainties, while the shaded boxes indicate systematic uncertainties. |

png pdf |
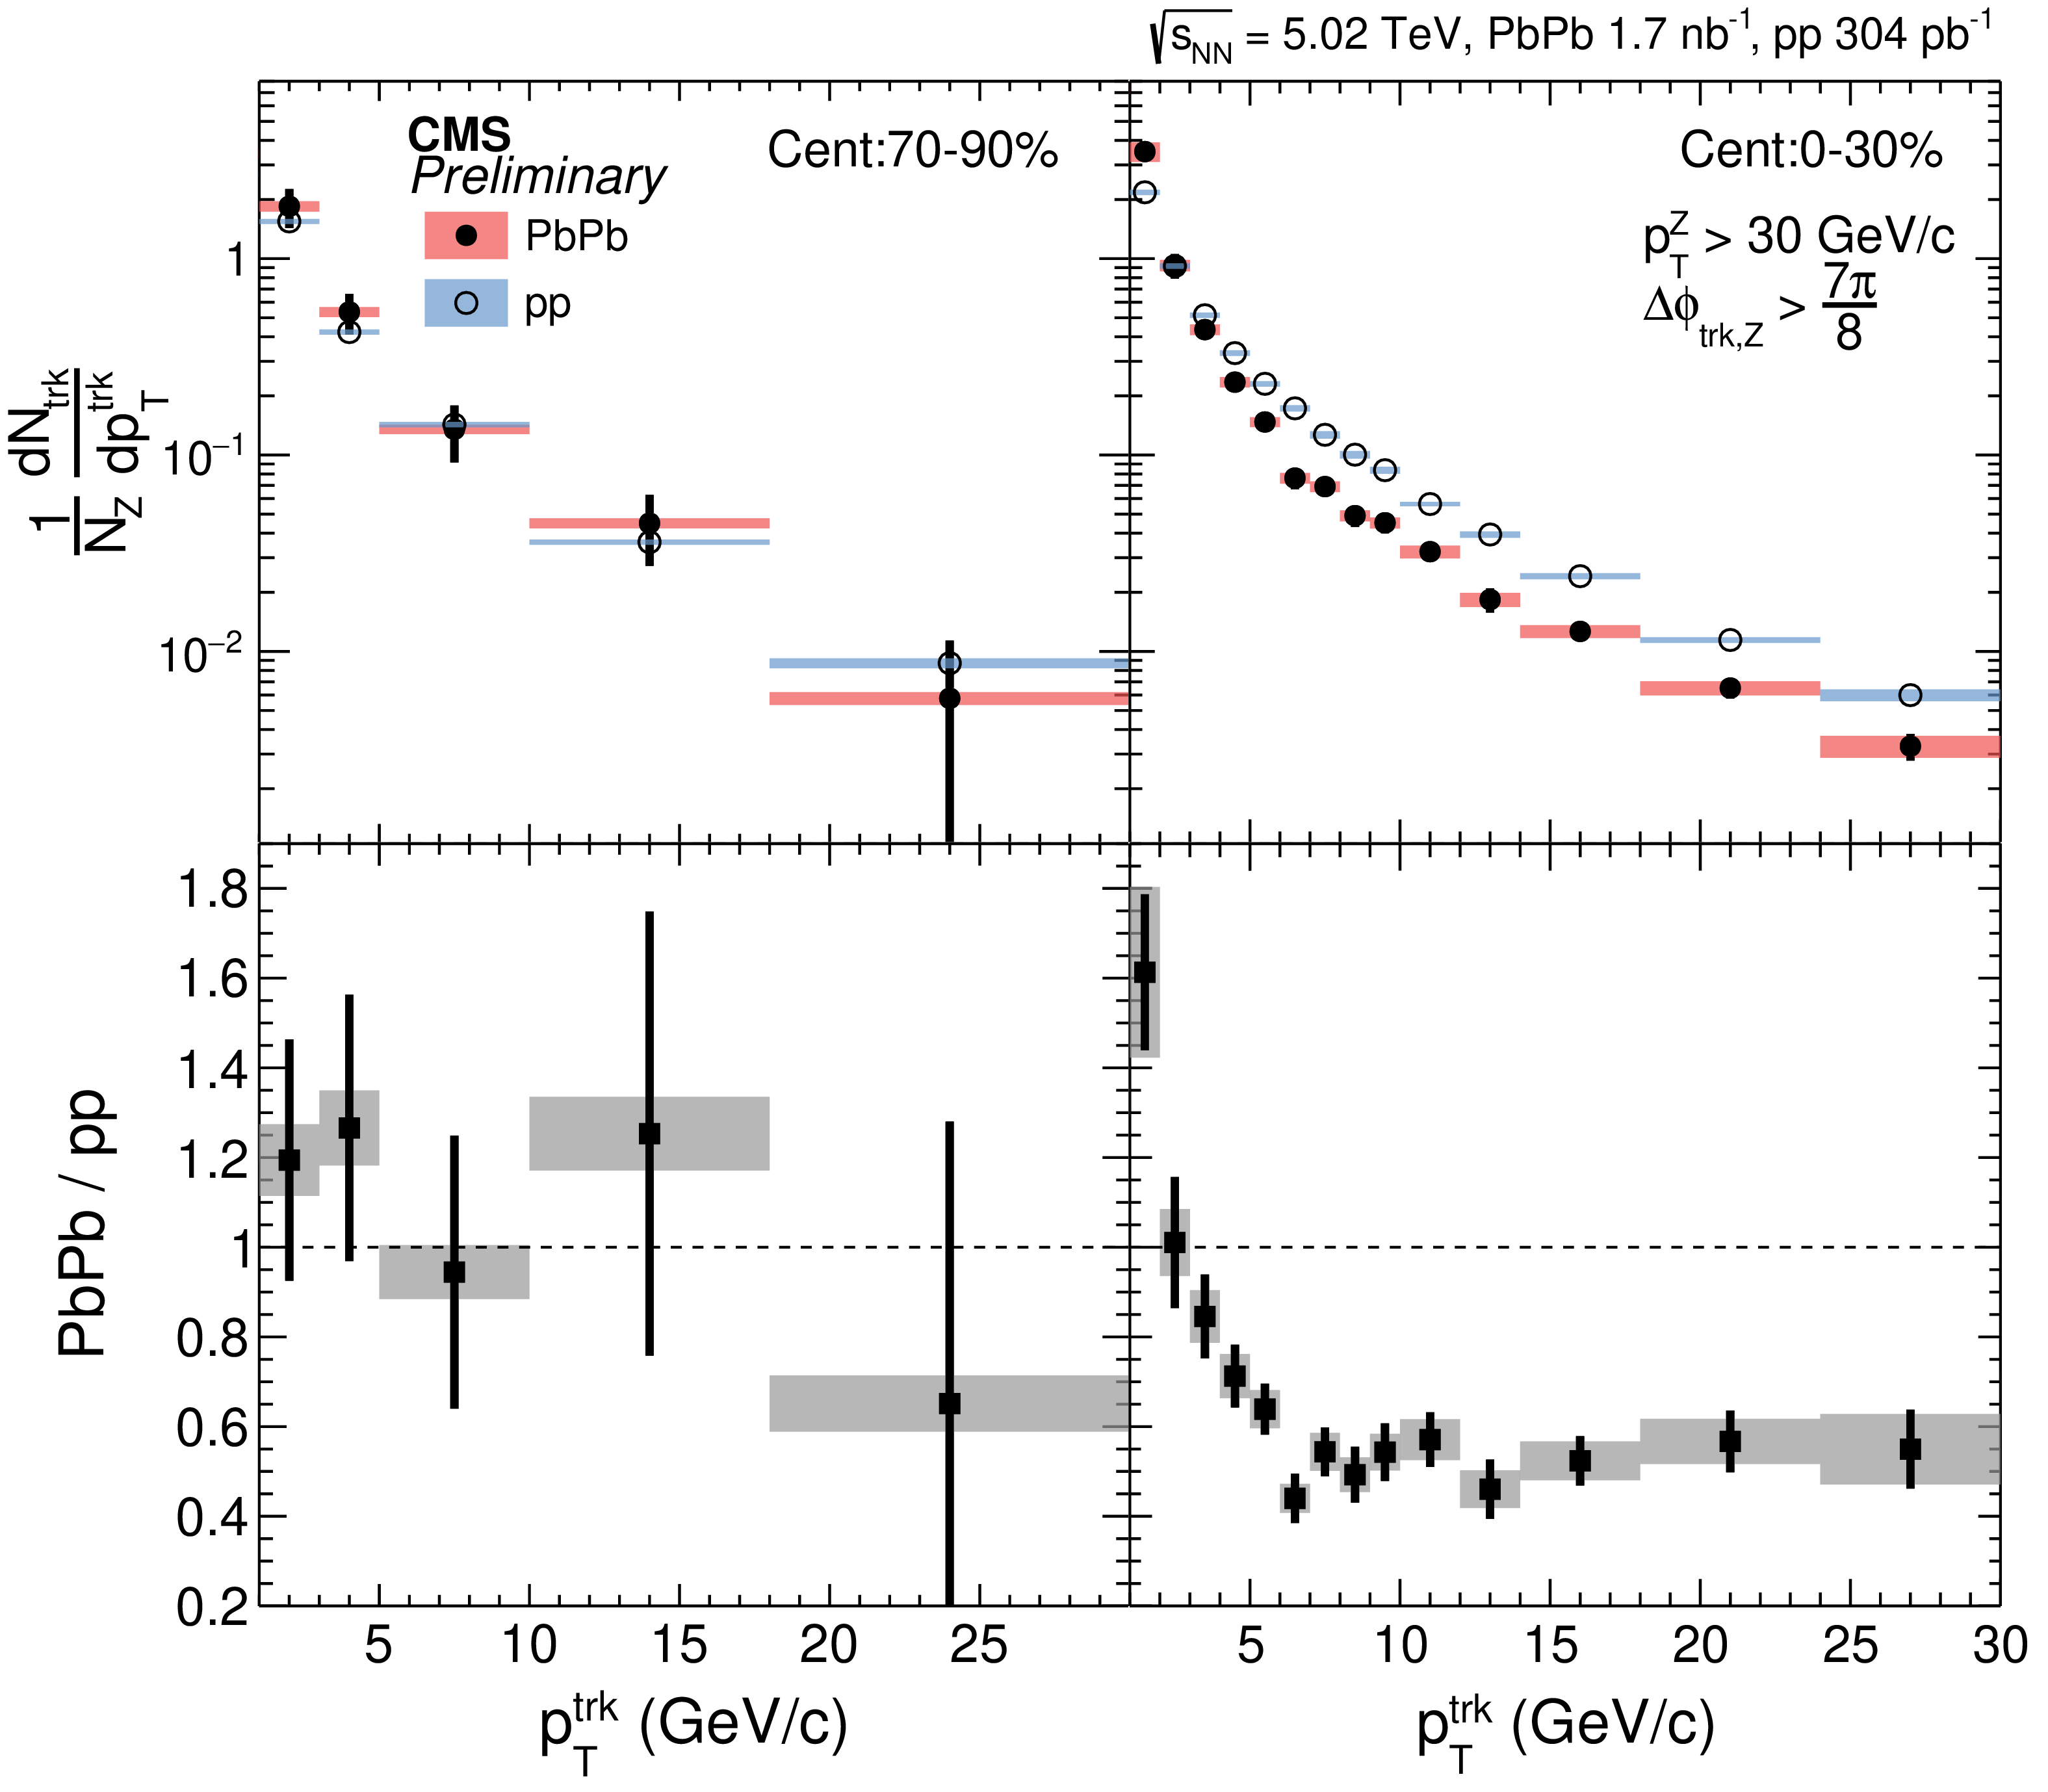
Figure 3:
Top : Distributions of ${{p_{{\,\mathrm {T}}} ^\text {trk}}}$ in pp collisions compared to PbPb collisions in 70-90% (left) 50-70%, 30-50%, and 0-30% (right) centrality intervals. Bottom : ratio of the PbPb and pp distributions. The vertical bars through the points represent statistical uncertainties, while the shaded boxes indicate systematic uncertainties. |
| Summary |
| In summary, the first measurements of Z-tagged charged hadron spectra are reported in PbPb collisions at ${\sqrt {\smash [b]{s_{_{\mathrm {NN}}}}}} = $ 5.02 TeV, using the data collected in 2018. The corresponding integrated luminosity of the PbPb data is 1.7 nb$^{-1}$, which made the analysis possible for the first time. Collision data with at least one Z boson with $p_{{\,\mathrm{T}}}^{\mathrm{Z}} > $ 30 GeV/$c$ are analyzed. The azimuthal angle distributions with respect to the Z bosons, which are sensitive to the modification of in-medium parton shower and medium recoils, are measured in PbPb collisions. Comparison of the PbPb results to the reference pp results indicates a modification of the angular correlation functions. This modification extends to azimuthal angles close to the Z boson in most central PbPb events. The first measurement of Z-tagged fragmentation functions and $p_{{\,\mathrm{T}}}^{\text{trk}}$ spectra, which are sensitive to the modification of the longitudinal structure of the parton shower inside the medium, are also reported. Significant modifications of the fragmentation functions and $p_{{\,\mathrm{T}}}^{\text{trk}}$ spectra coming from the recoiled partons are observed. These results are complementary to the measurements using inclusive jets, dijet and photon-tagged jet events. |
| Additional Figures | |

png pdf |
Additional Figure 1:
Top: Distributions of ${\Delta \phi _{\mathrm {trk,Z}}}$ in pp collisions compared to PbPb collisions in 70-90% (left), 50-70%, 30-50%, and 0-30% (right) centrality intervals. Bottom: Ratio of the PbPb and pp distributions. The vertical bars through the points represent statistical uncertainties, while the shaded boxes indicate systematic uncertainties. |
png pdf |
Additional Figure 2:
Top: Distributions of ${\Delta \phi _{\mathrm {trk,Z}}}$ in pp collisions compared to PbPb collisions in 70-90% (left) and 0-30% (right) centrality intervals. Bottom: Difference between the PbPb and pp distributions. The vertical bars through the points represent statistical uncertainties, while the shaded boxes indicate systematic uncertainties. |
png pdf |
Additional Figure 3:
Top: Distributions of ${\xi ^\mathrm {Z,trk}_{\mathrm {T}}}$ in pp collisions compared to PbPb collisions in 70-90% (left) and 0-30% (right) centrality intervals. Bottom: Ratio of the PbPb and pp distributions. The vertical bars through the points represent statistical uncertainties, while the shaded boxes indicate systematic uncertainties. |
png pdf |
Additional Figure 4:
Top: Distributions of ${{p_{\mathrm {T}}} ^\text {trk}}$ in pp collisions compared to PbPb collisions in 70-90% (left) and 0-30% (right) centrality intervals. Bottom: Ratio of the PbPb and pp distributions. The vertical bars through the points represent statistical uncertainties, while the shaded boxes indicate systematic uncertainties. |

png pdf |
Additional Figure 5:
Top: Distributions of ${\Delta \phi _{\mathrm {trk,Z}}}$ in pp collisions compared to PbPb collisions in 70-90% (left) and 0-30% (right) centrality intervals. Bottom: Ratio of the PbPb and pp distributions. The vertical bars through the points represent statistical uncertainties, while the shaded boxes indicate systematic uncertainties. |

png pdf |
Additional Figure 6:
Top: Distributions of ${\xi ^\mathrm {Z,trk}_{\mathrm {T}}}$ in pp collisions compared to PbPb collisions in 30-50% (left) and 0-30% (right) centrality intervals. Bottom: Ratio of the PbPb and pp distributions compared to calculations from the ${{\mathrm {{{SCET}}_G}}}$ [1,2] and Hybrid [3] theoretical models. The ${{\mathrm {{{SCET}}_G}}}$ curves represent different values of $g$, the coupling between the jet and QCD medium. The vertical bars through the data points represent statistical uncertainties, while the shaded boxes indicate systematic uncertainties. |

png pdf |
Additional Figure 7:
Top: Distributions of ${{p_{\mathrm {T}}} ^\text {trk}}$ in pp collisions compared to PbPb collisions in 30-50% (left) and 0-30% (right) centrality intervals. Bottom: Ratio of the PbPb and pp distributions compared to calculations from the ${{\mathrm {{{SCET}}_G}}} $ [1,2] and Hybrid [3] theoretical models. The ${{\mathrm {{{SCET}}_G}}} $ curves represent different values of $g$, the coupling between the jet and QCD medium. The vertical bars through the data points represent statistical uncertainties, while the shaded boxes indicate systematic uncertainties. |

png pdf |
Additional Figure 8:
Top: Distributions of ${\Delta \phi _{\mathrm {trk,Z}}}$ in pp collisions compared to PbPb collisions in 30-50% (left) and 0-30% (right) centrality intervals. Bottom: Difference between the PbPb and pp distributions compared to calculations from the Hybrid [3] theoretical model. The vertical bars through the data points represent statistical uncertainties, while the shaded boxes indicate systematic uncertainties. |

png pdf |
Additional Figure 9:
Top: Distributions of ${\Delta \phi _{\mathrm {trk,Z}}}$ in pp collisions compared to PbPb collisions in 30-50% (left) and 0-30% (right) centrality intervals. Bottom: Ratio of the PbPb and pp distributions compared to calculations from the Hybrid [3] theoretical model. The vertical bars through the data points represent statistical uncertainties, while the shaded boxes indicate systematic uncertainties. |
png pdf |
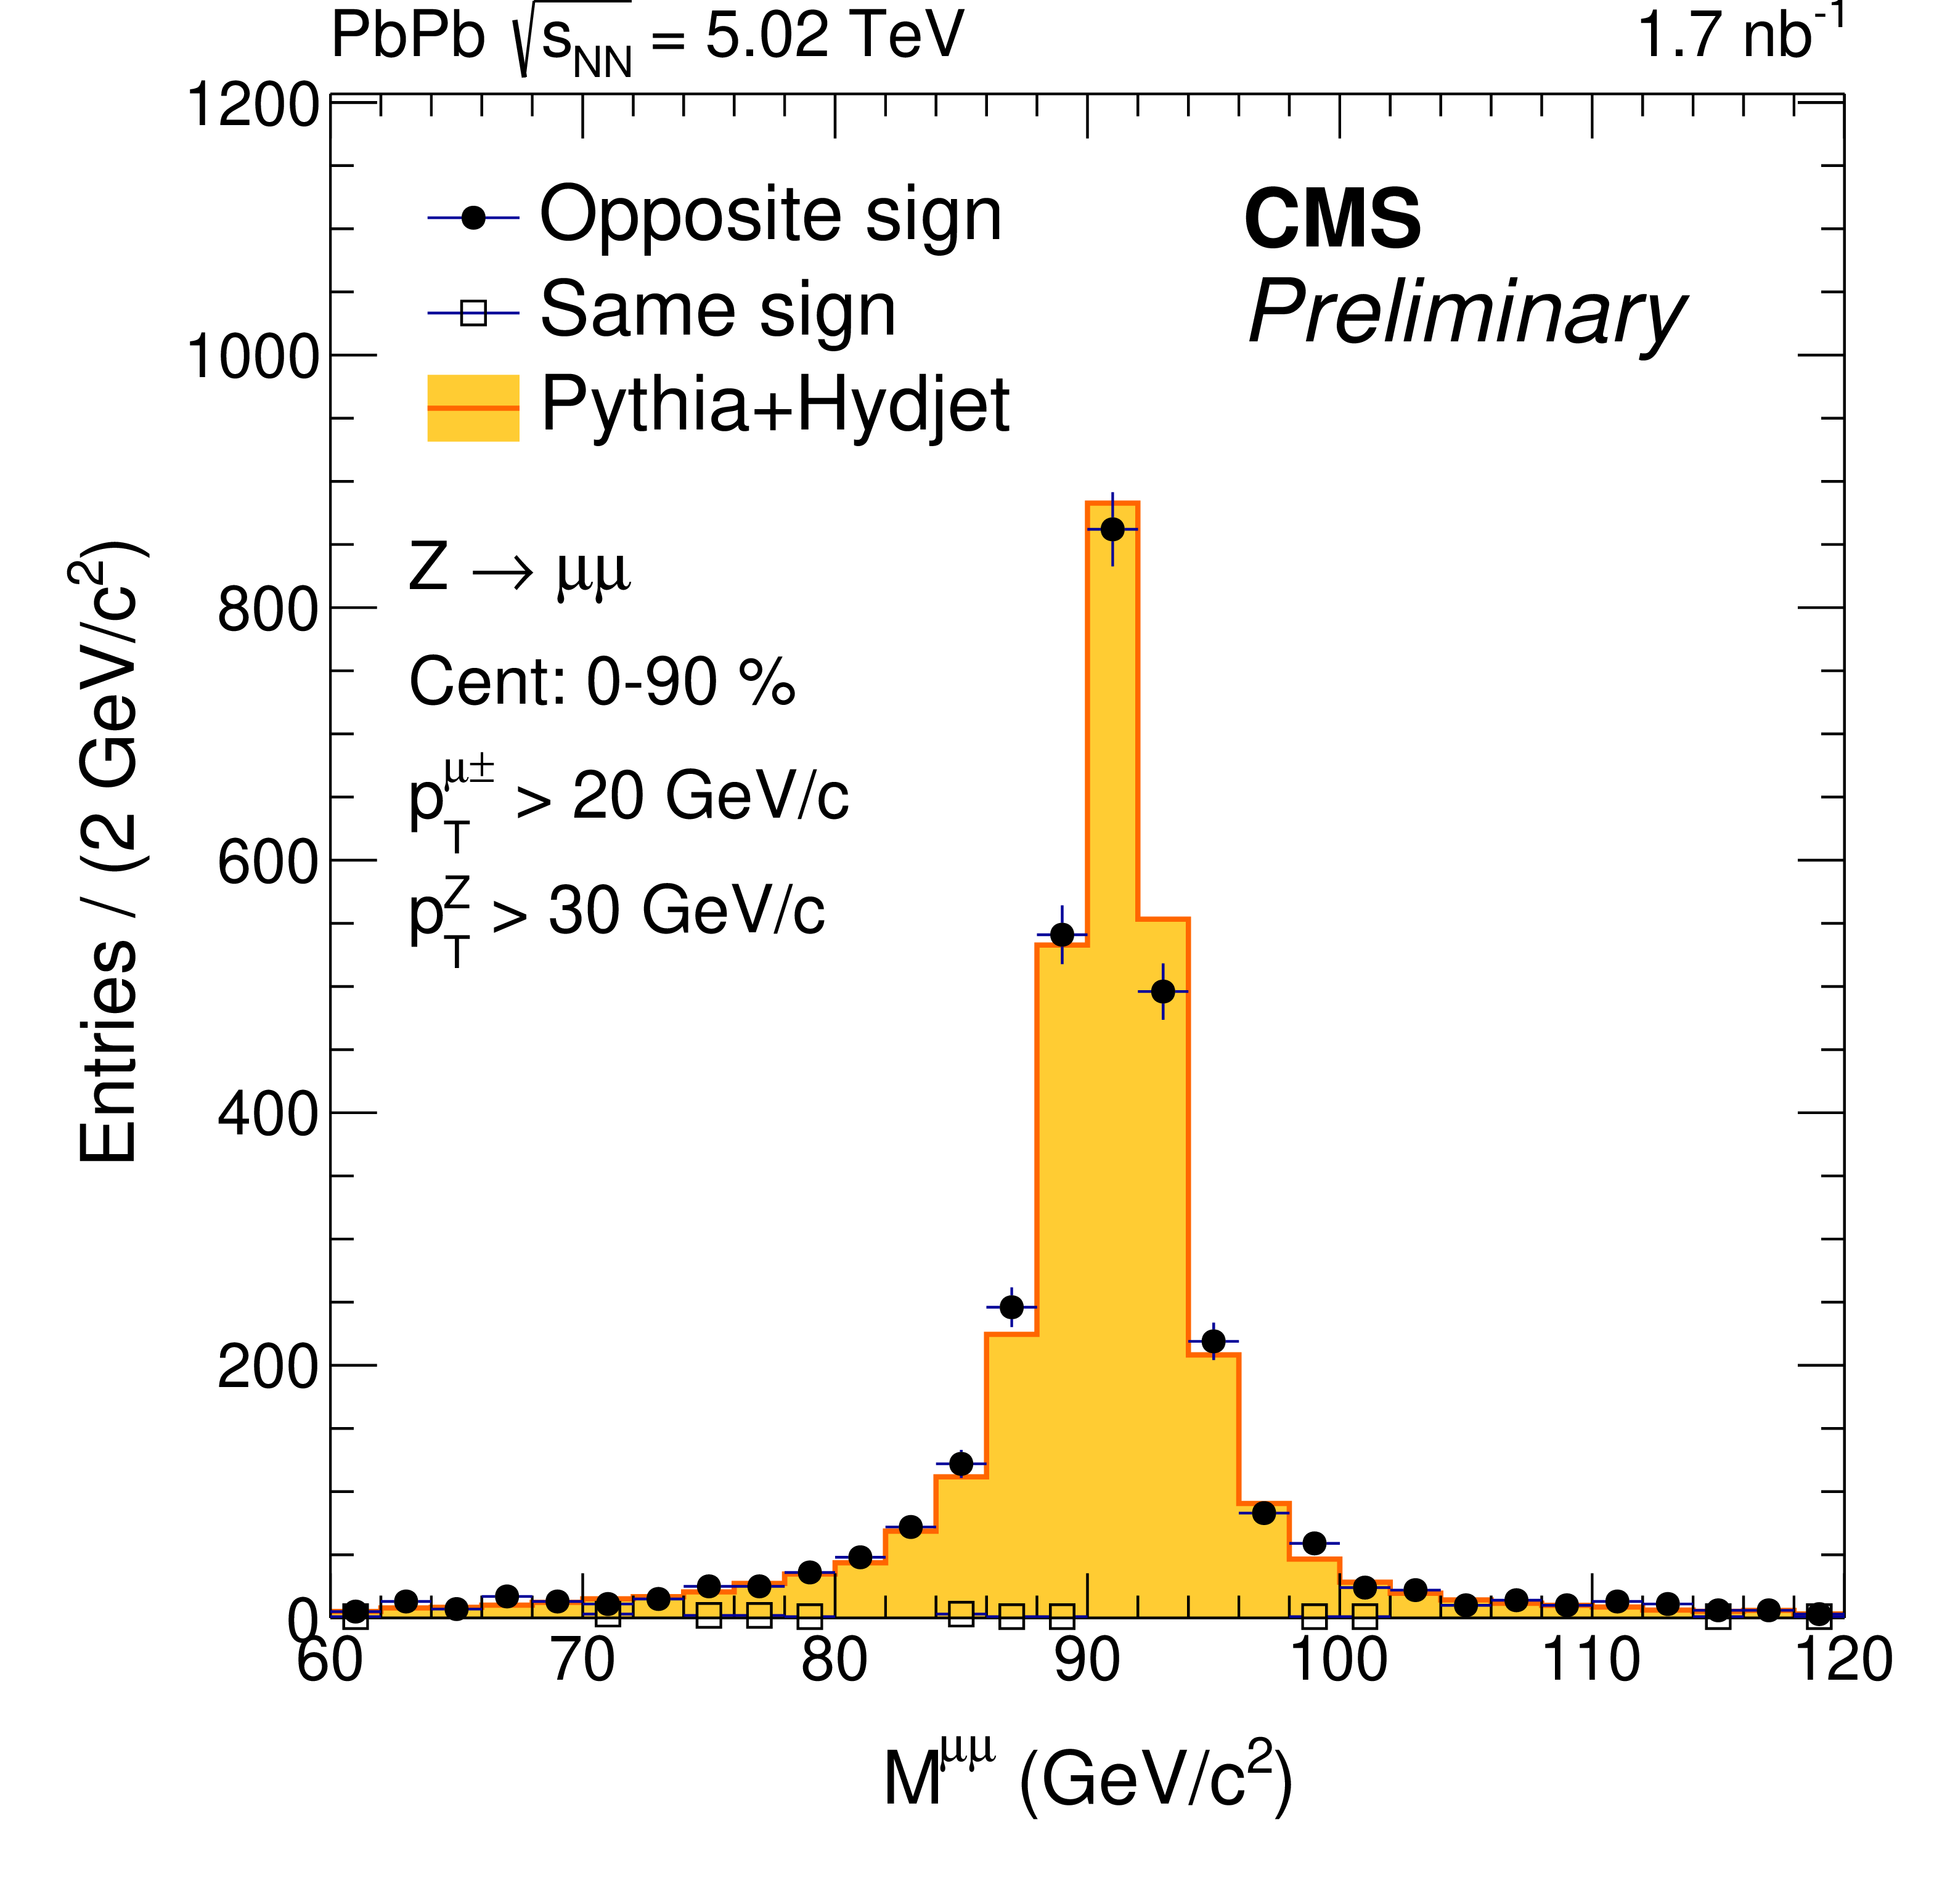
Additional Figure 10:
Invariant mass distributions of the selected muon pairs in PbPb data (markers) compared to the Z boson events simulated using {pythia} + {hydjet} [4,5] (histogram). The simulation result is normalized to the number of opposite sign pairs in data. |

png pdf |
Additional Figure 11:
Invariant mass distributions of the selected electron pairs in PbPb data (markers) compared to the Z boson events simulated using {pythia} + {hydjet} [4,5] (histogram). The simulation result is normalized to the number of opposite sign pairs in data. |

png pdf |
Additional Figure 12:
Invariant mass distributions of the selected muon pairs in pp data (markers) compared to the Z boson events simulated using {pythia} [4] (histogram). The simulation result is normalized to the number of opposite sign pairs in data. |
png pdf |
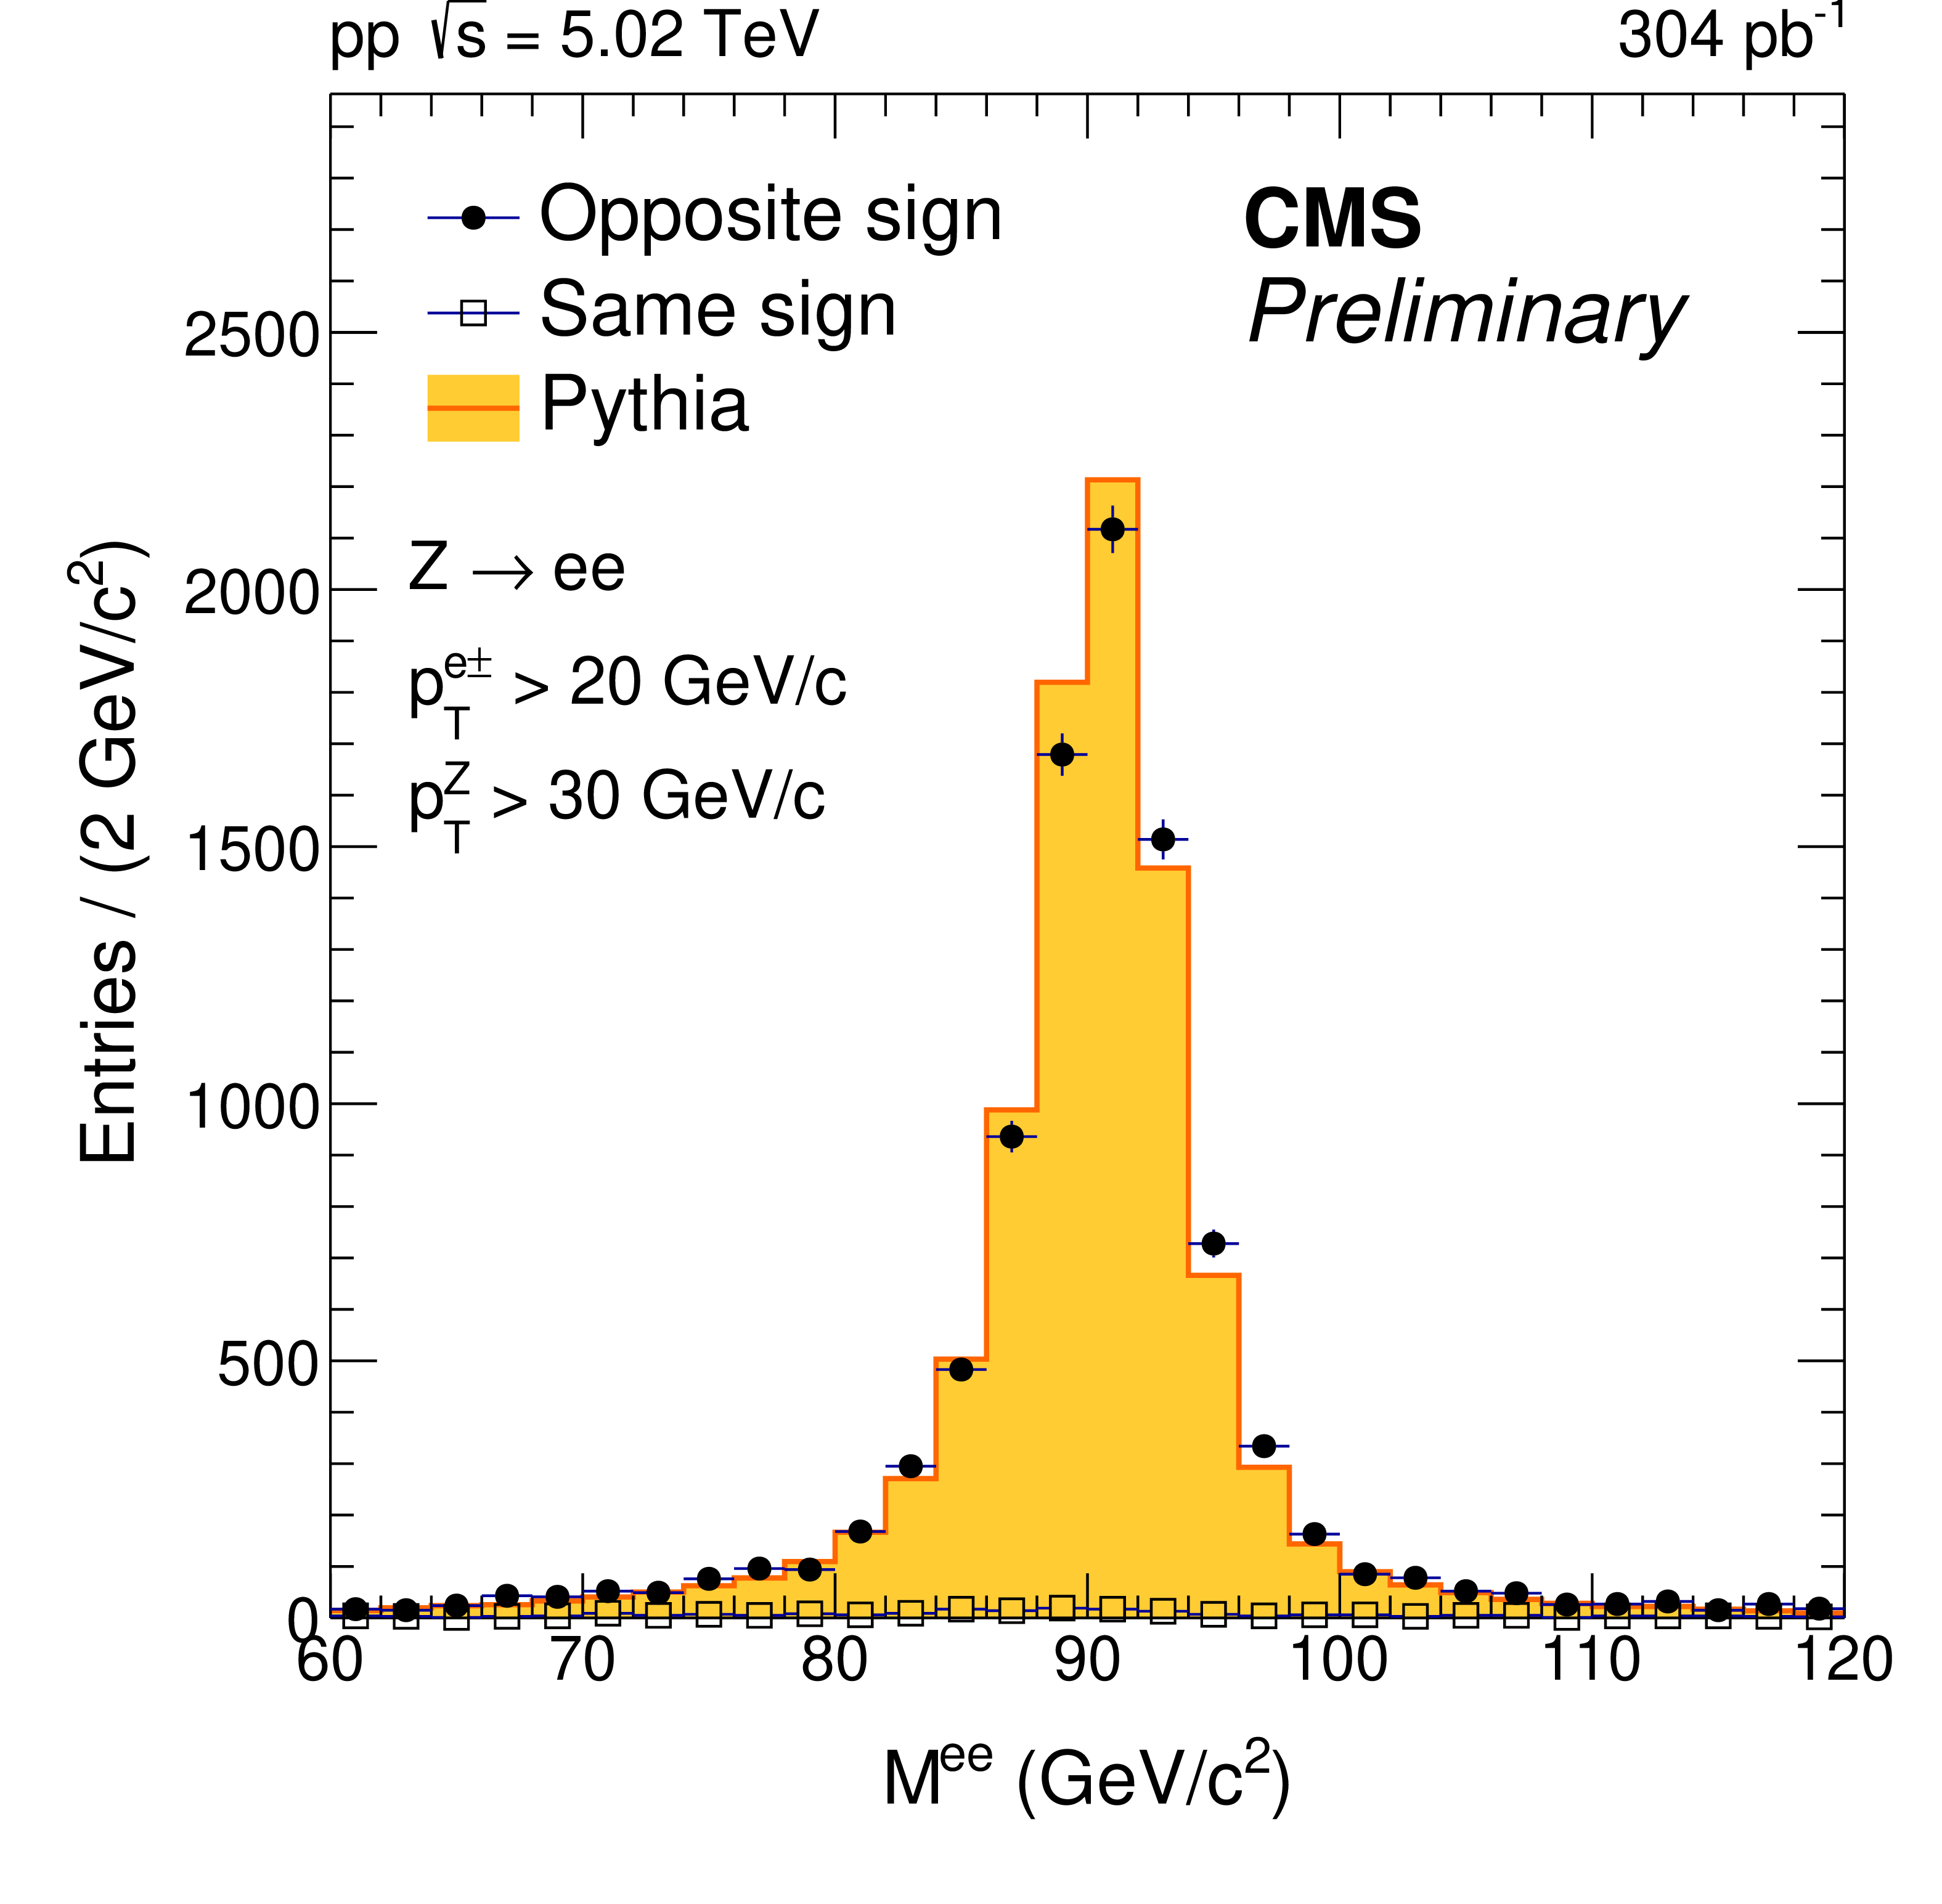
Additional Figure 13:
Invariant mass distributions of the selected electron pairs in pp data (markers) compared to the Z boson events simulated using {pythia} [4] (histogram). The simulation result is normalized to the number of opposite sign pairs in data. |
png pdf |
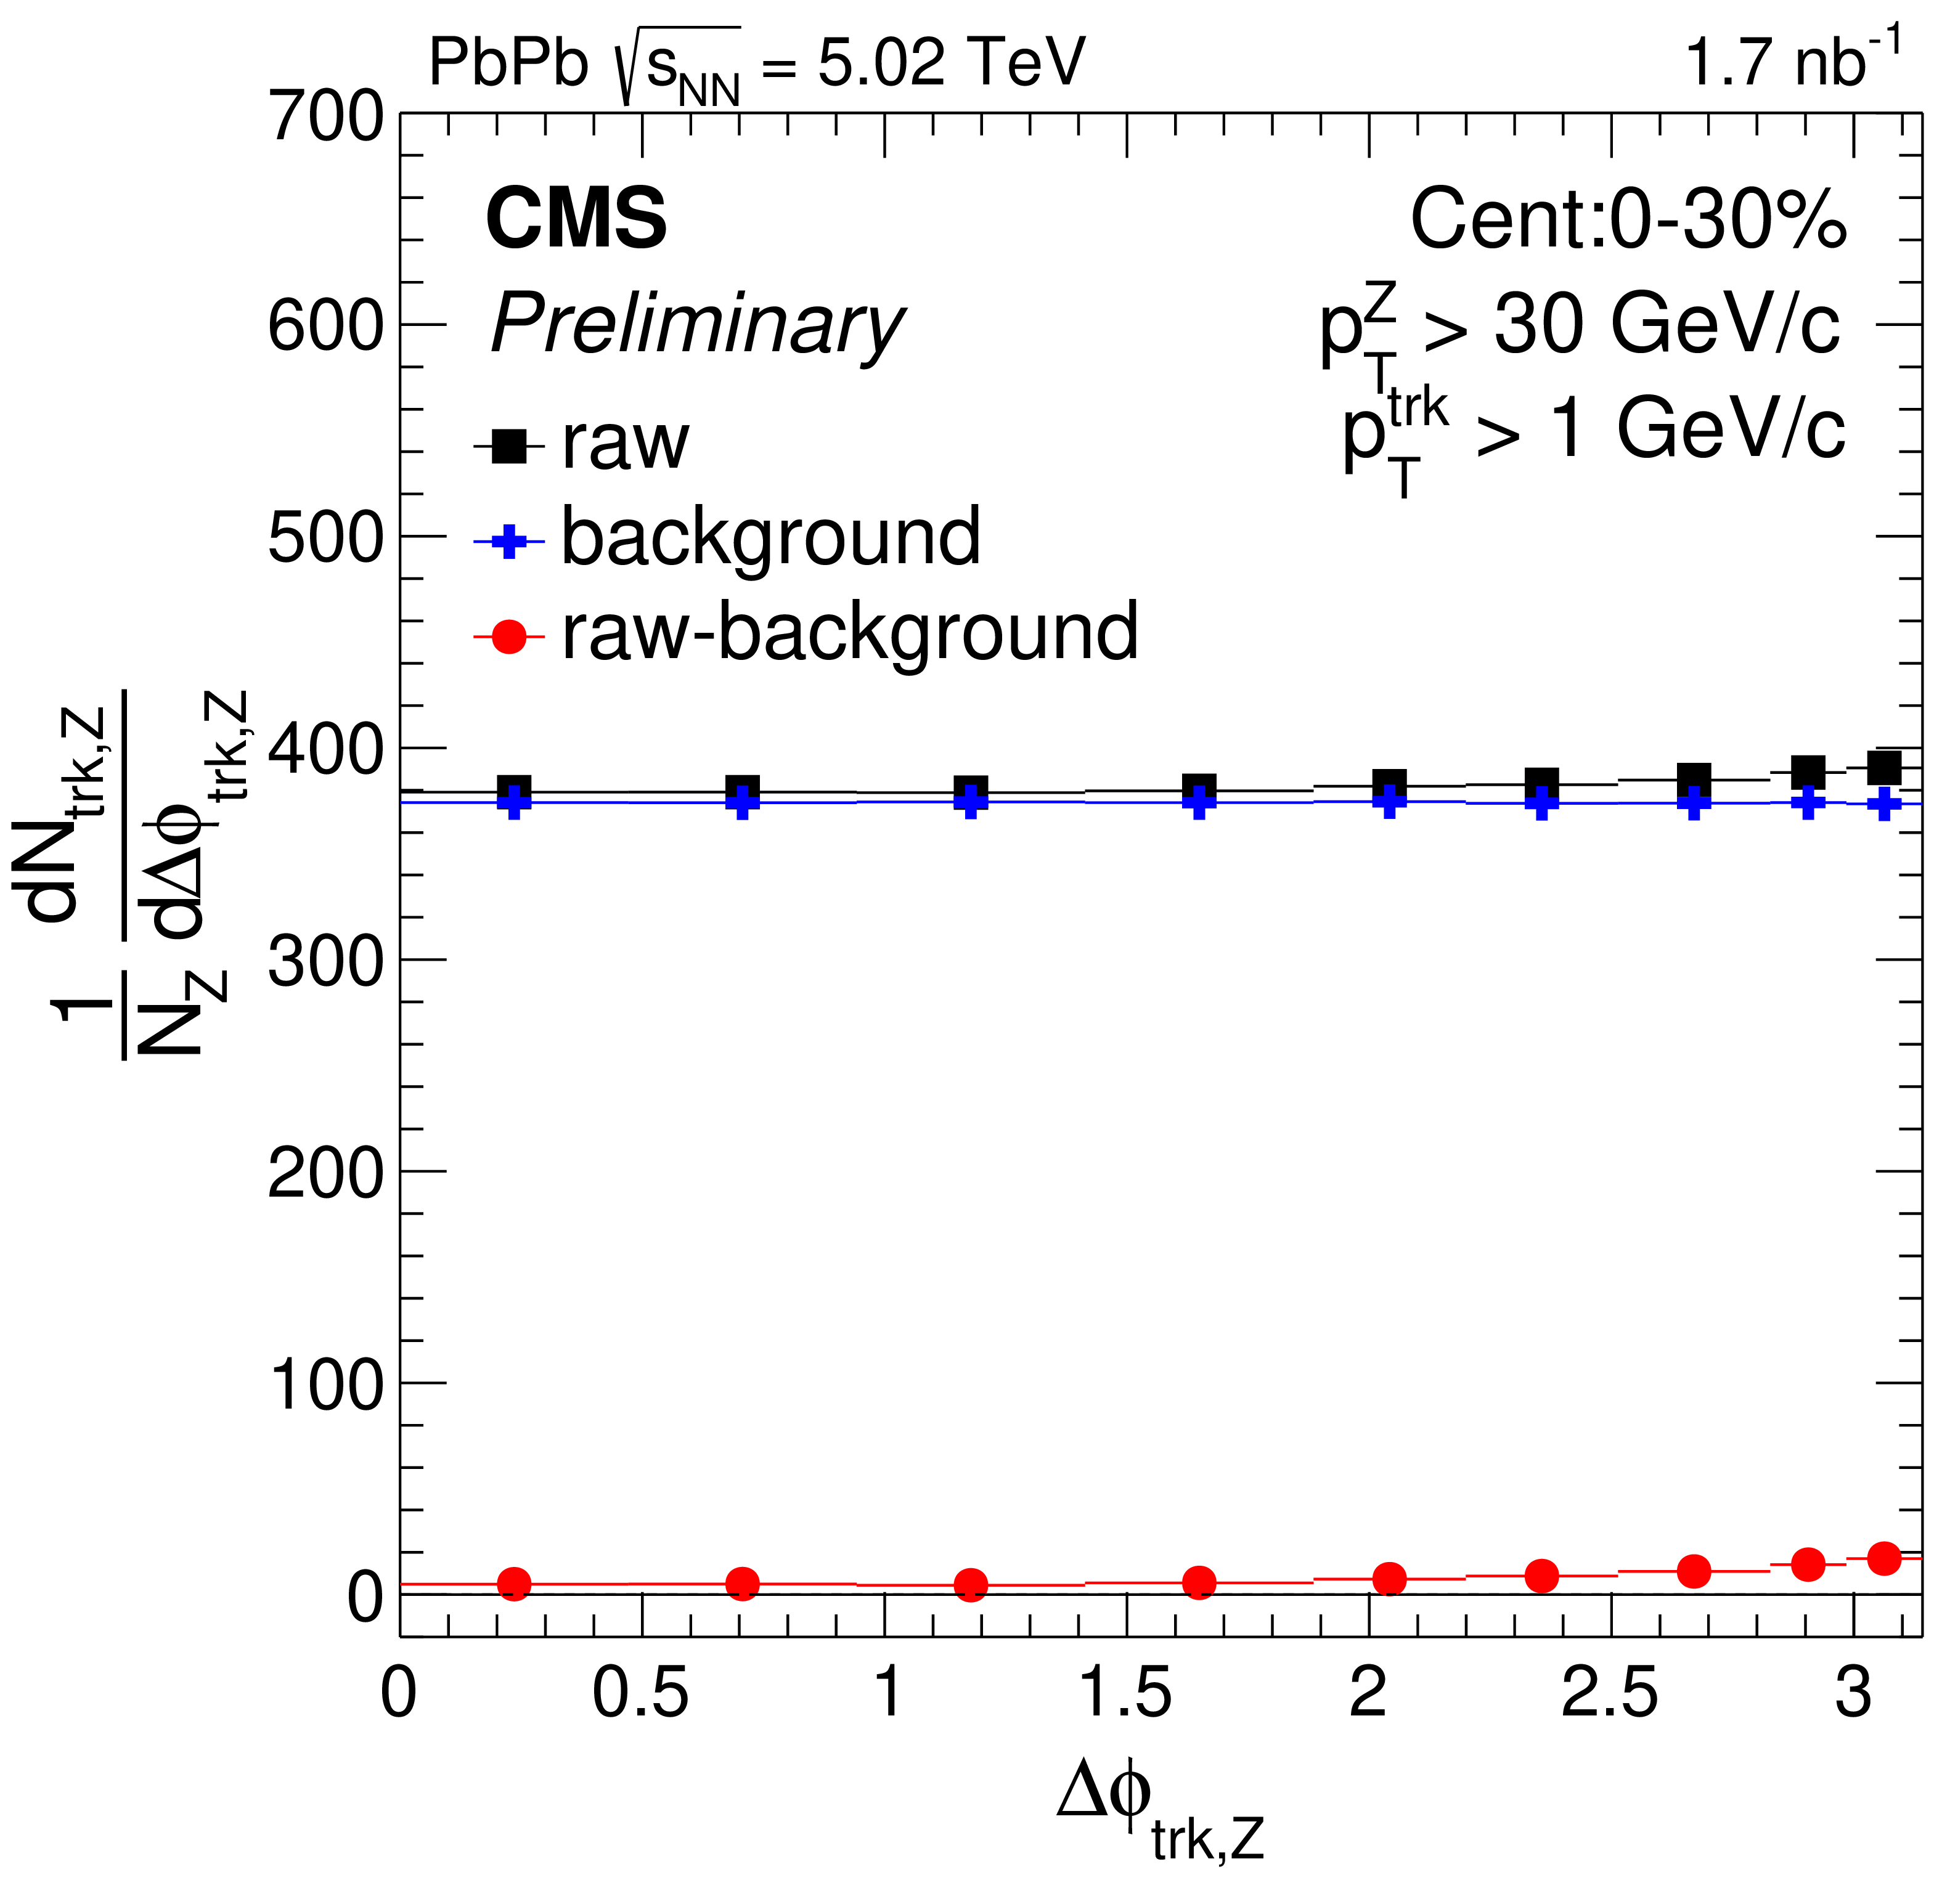
Additional Figure 14:
Estimated contribution from background tracks (blue crosses) are subtracted from the ${\Delta \phi _{\mathrm {trk,Z}}}$ distribution (black squares) to obtain the distribution subtracted for background tracks (red circles) in 0-30% centrality PbPb collisions. |

png pdf |
Additional Figure 15:
Estimated contribution from background tracks (blue crosses) are subtracted from the ${\xi ^\mathrm {Z,trk}_{\mathrm {T}}}$ distribution (black squares) to obtain the distribution subtracted for background tracks (red circles) in 0-30% centrality PbPb collisions. |
png pdf |
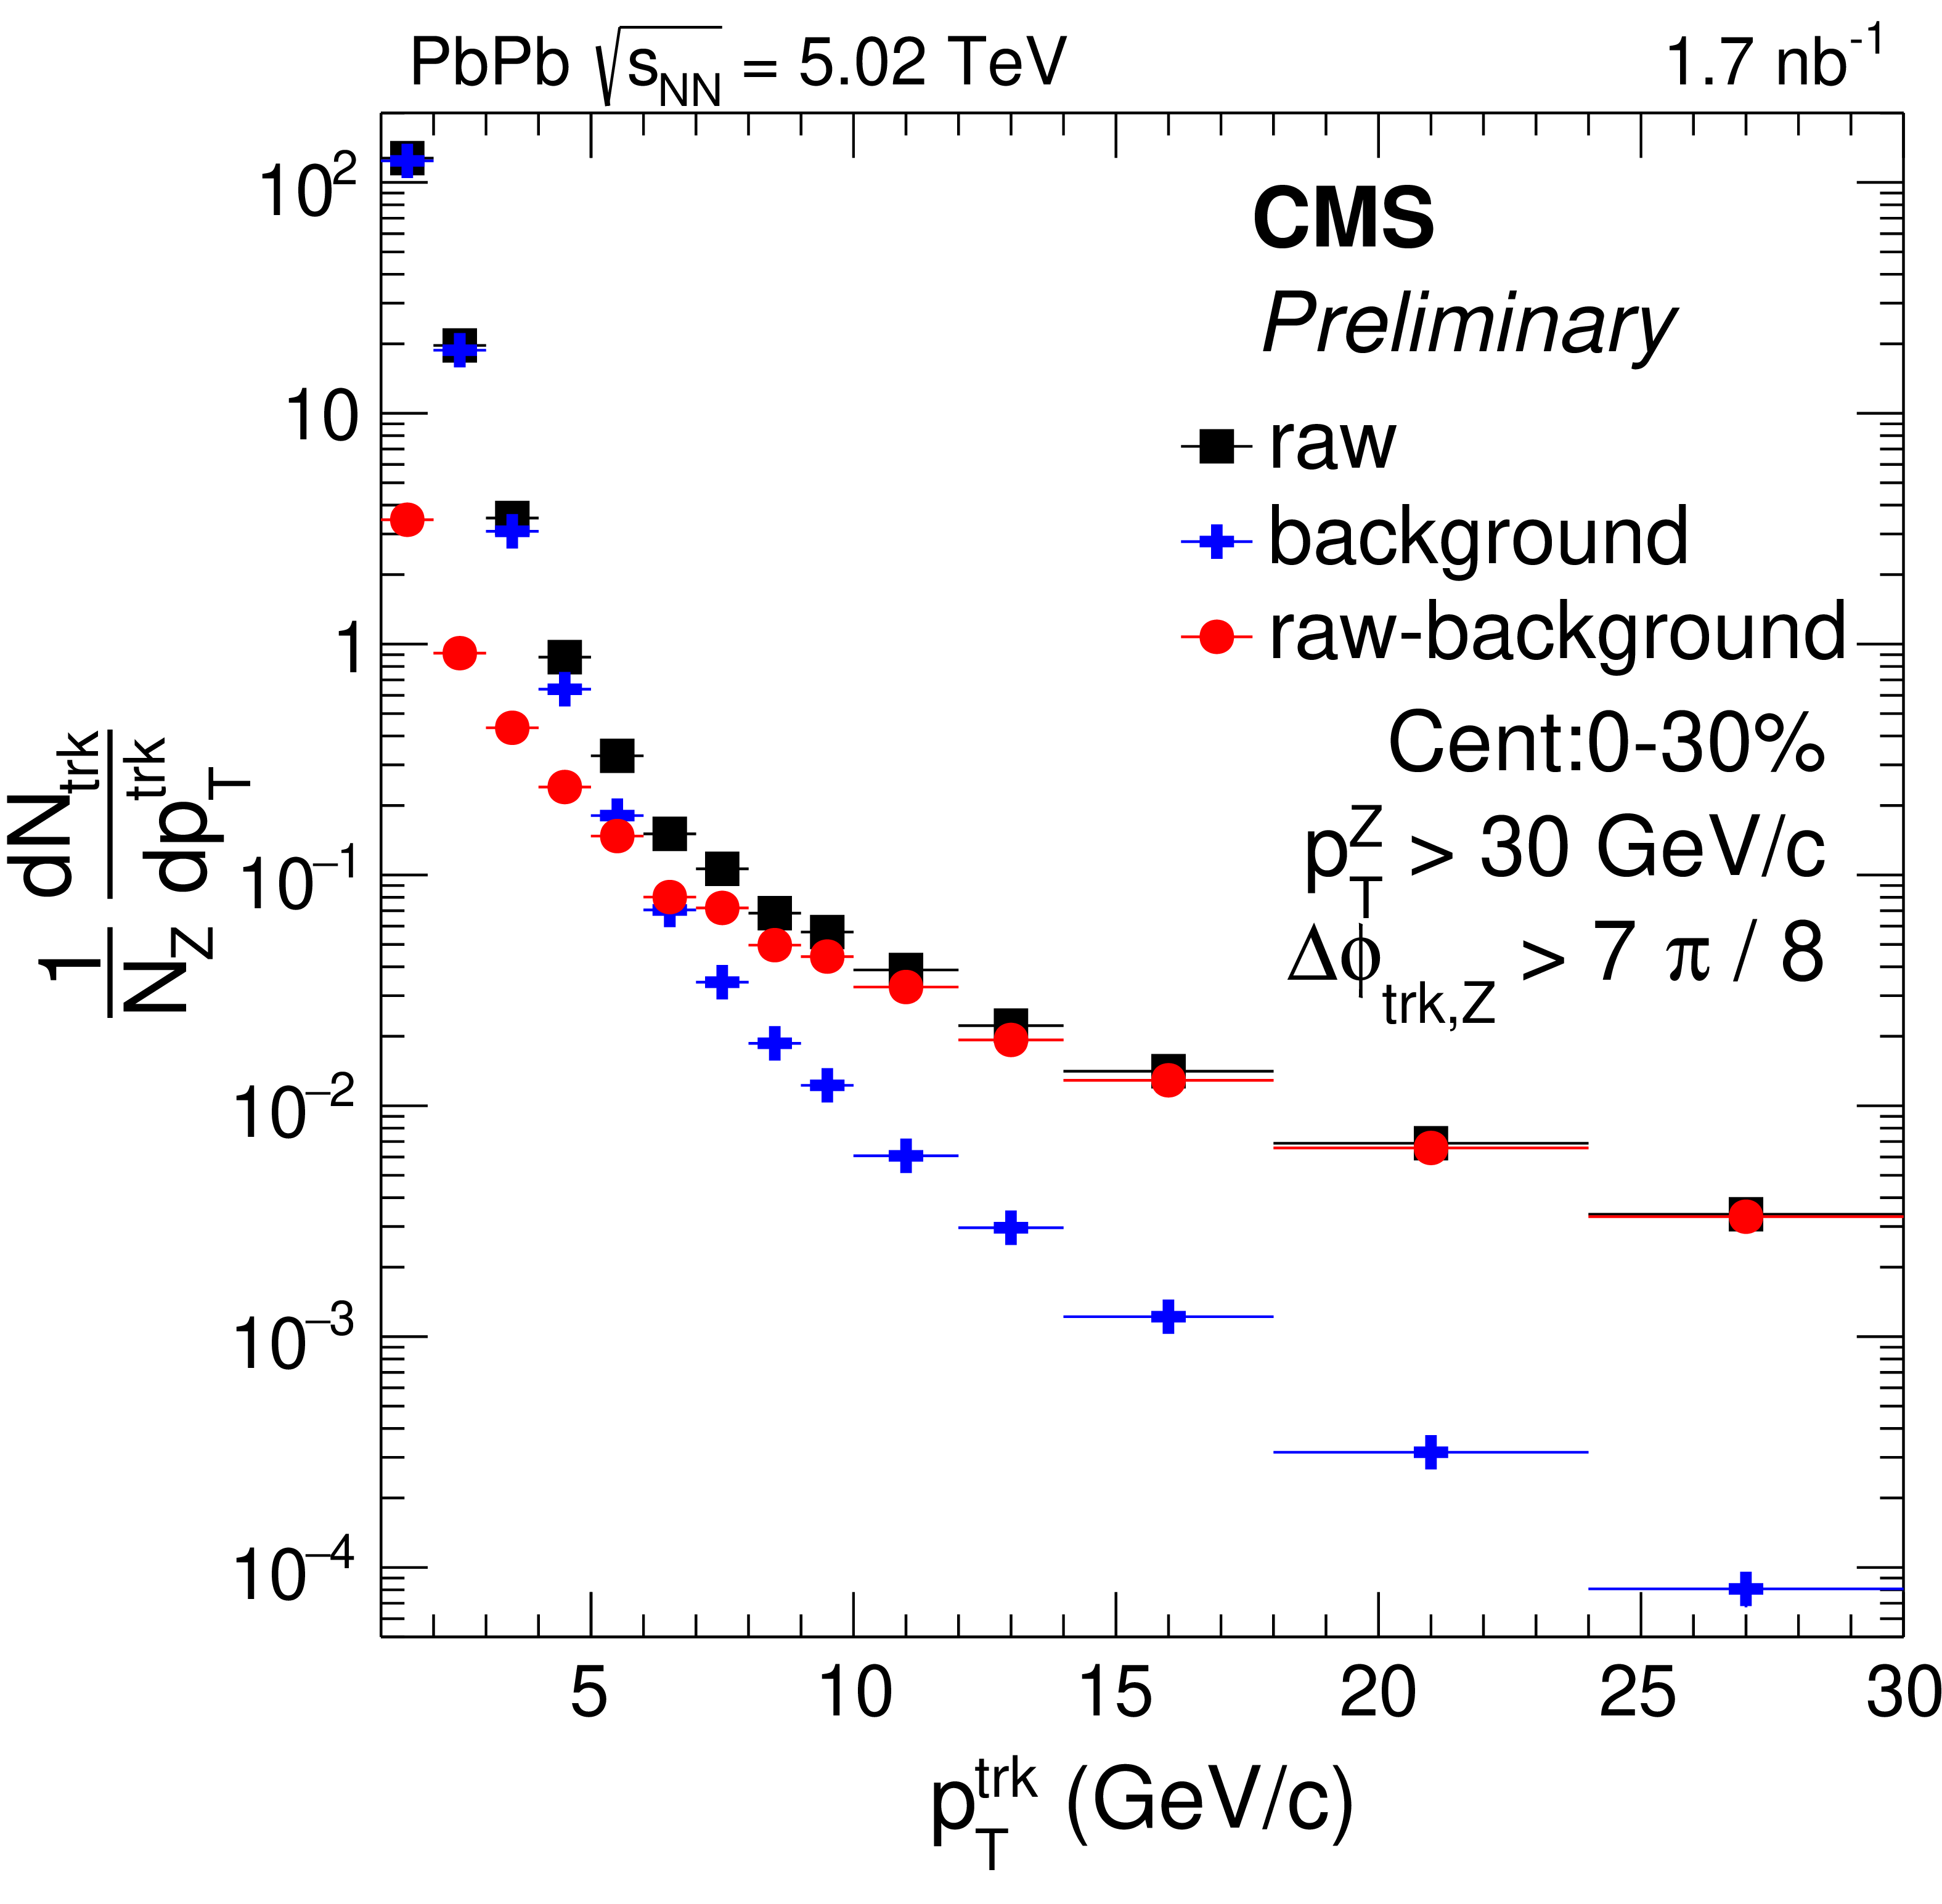
Additional Figure 16:
Estimated contribution from background tracks (blue crosses) are subtracted from the ${{p_{\mathrm {T}}} ^\text {trk}}$ distribution (black squares) to obtain the distribution subtracted for background tracks (red circles) in 0-30% centrality PbPb collisions. |
png pdf |
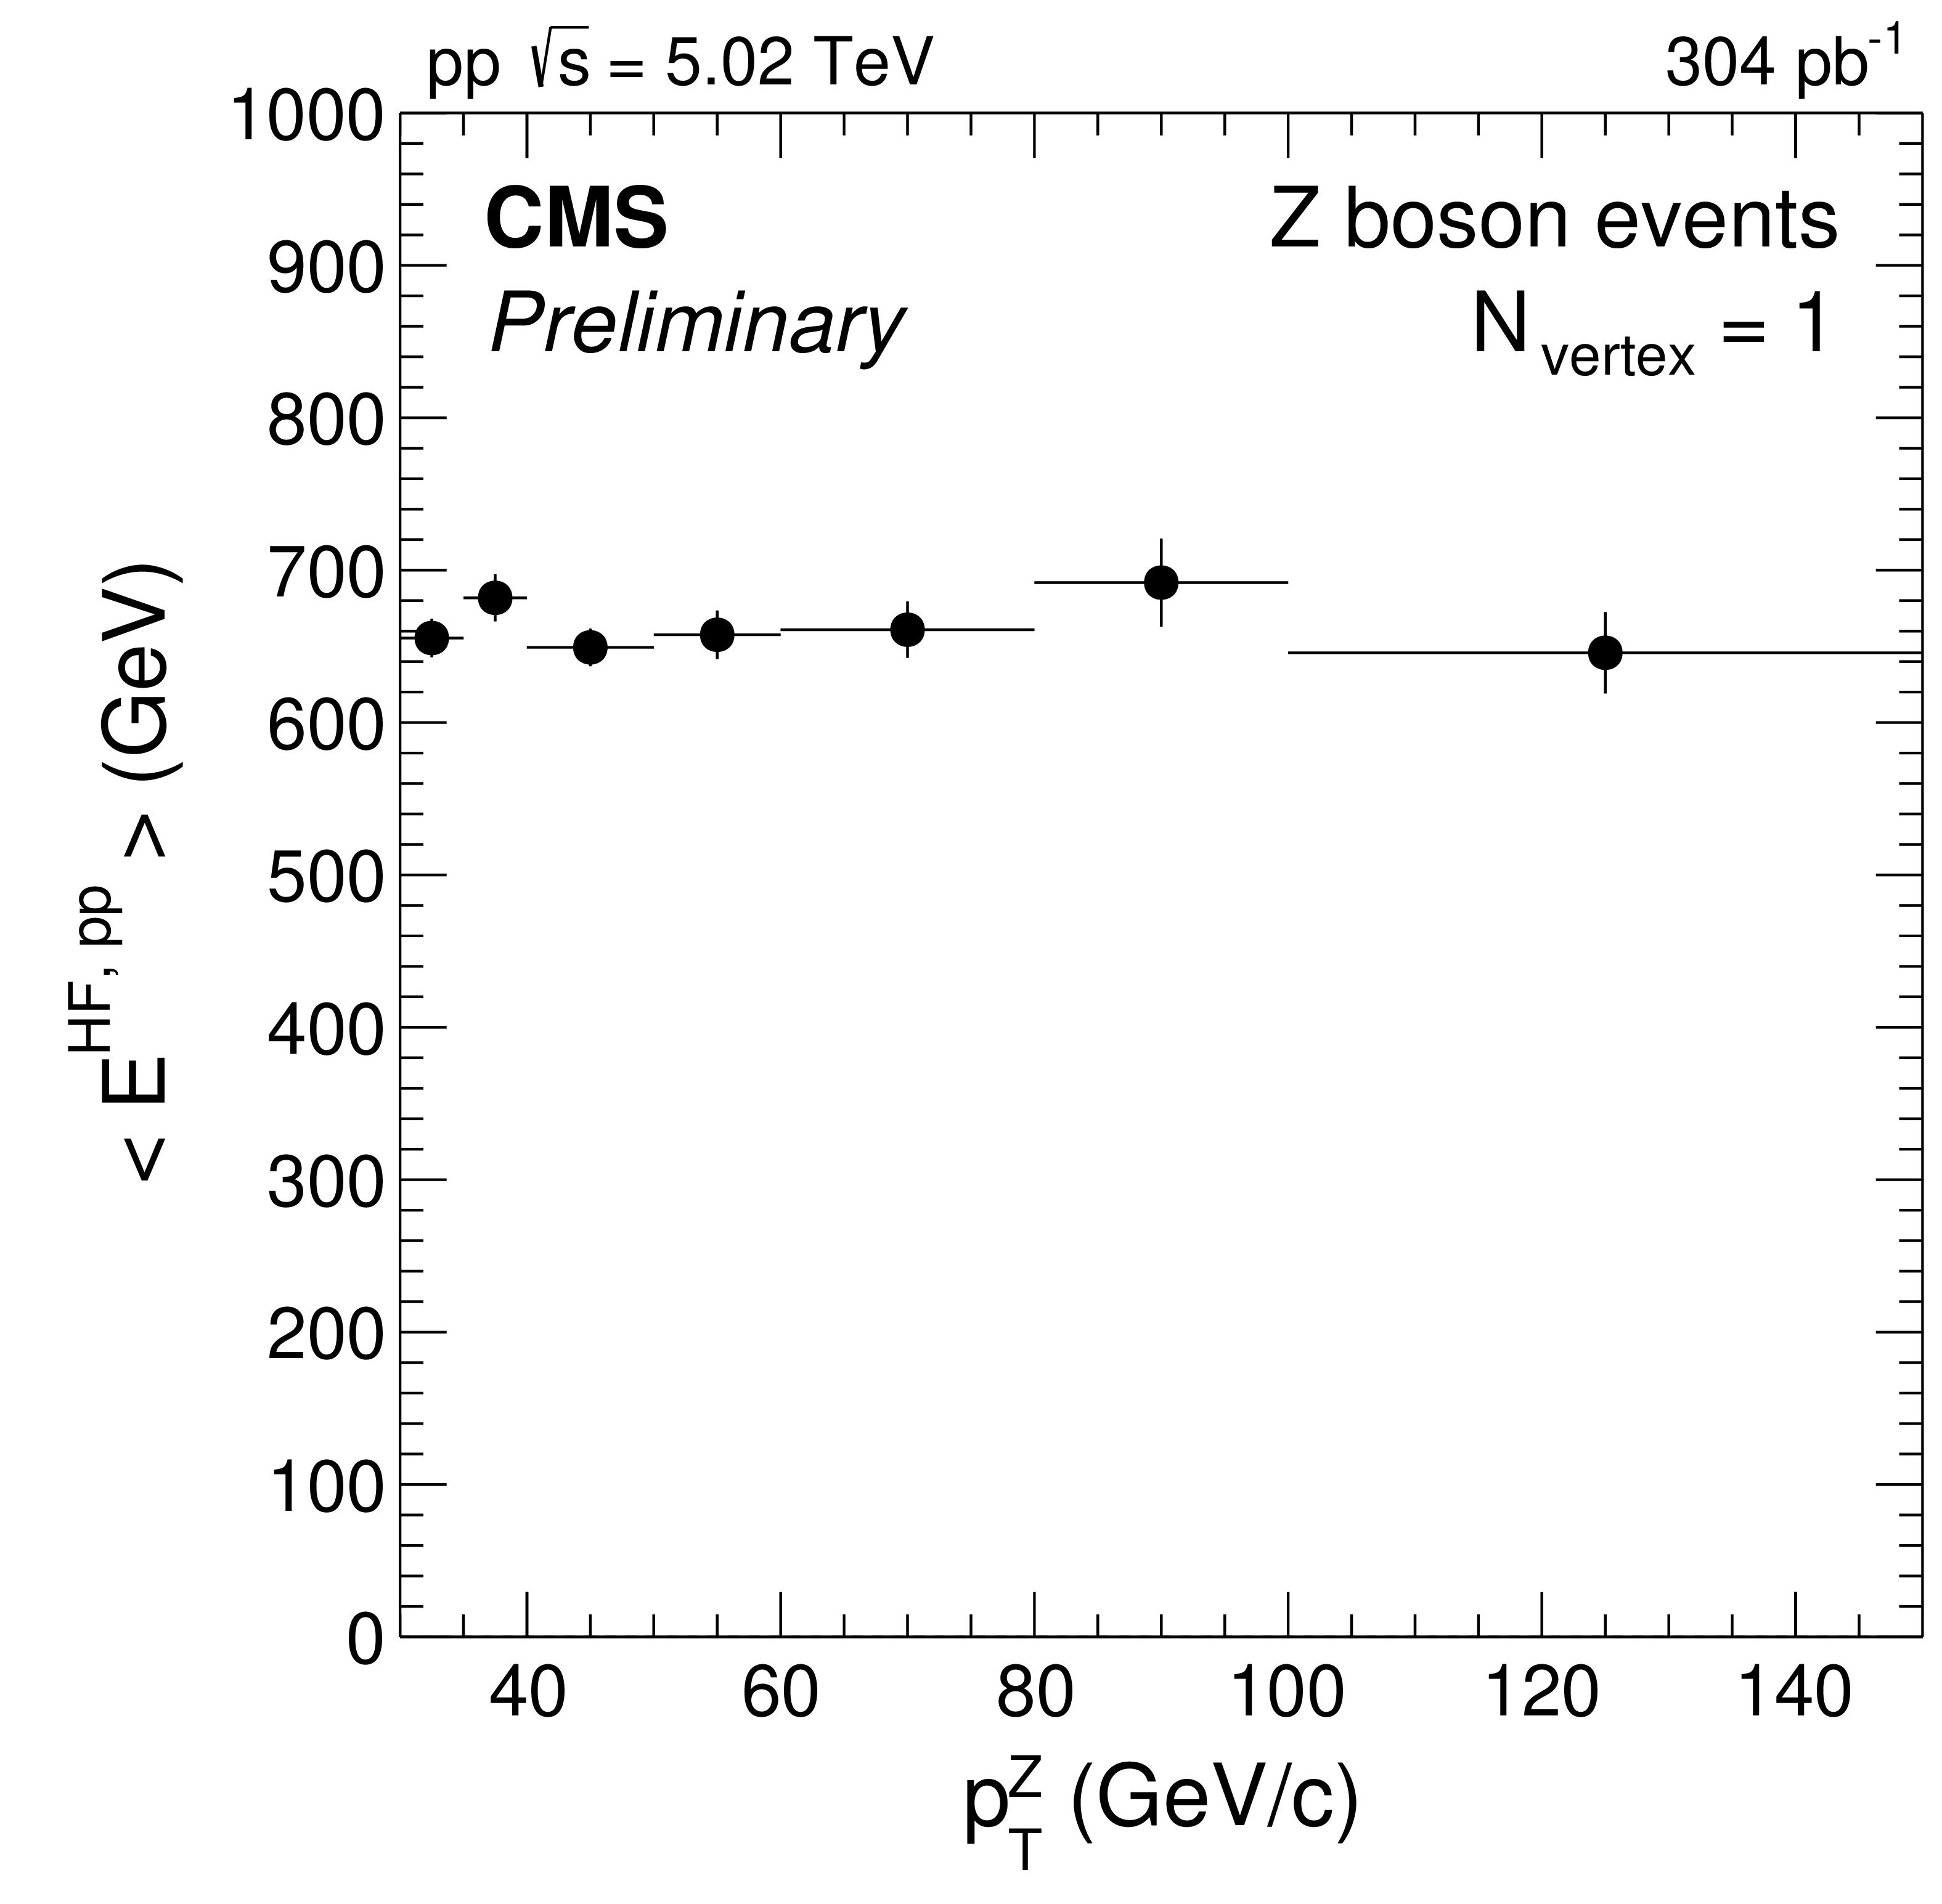
Additional Figure 17:
The total energy in the forward rapidity region of 3 $ < {| \eta |} < $ 5 is calculated in each pp event where a Z boson is identified and there is no extraneous collision. The per event average of the energy is calculated as function of the Z boson ${p_{\mathrm {T}}}$. |
| References | ||||
| 1 | J. C. Collins and M. J. Perry | Superdense matter: Neutrons or asymptotically free quarks? | PRL 34 (1975) 1353 | |
| 2 | F. Karsch | The phase transition to the quark gluon plasma: recent results from lattice calculations | NP A 590 (1995) 367 | hep-lat/9503010 |
| 3 | D. A. Appel | Jets as a probe of quark-gluon plasmas | PRD 33 (1986) 717 | |
| 4 | J. P. Blaizot and L. D. McLerran | Jets in expanding quark-gluon plasmas | PRD 34 (1986) 2739 | |
| 5 | M. Gyulassy and M. Plumer | Jet quenching in dense matter | PLB 243 (1990) 432 | |
| 6 | STAR Collaboration | Transverse-momentum and collision-energy dependence of high-$ p_{\mathrm{t}} $ hadron suppression in Au+Au collisions at ultrarelativistic energies | PRL 91 (2003) 172302 | nucl-ex/0305015 |
| 7 | PHENIX Collaboration | Suppression pattern of neutral pions at high transverse momentum in Au+Au collisions at $ \sqrt{s_{\rm{NN}}} = $ 200 GeV and constraints on medium transport coefficients | PRL 101 (2008) 232301 | 0801.4020 |
| 8 | ALICE Collaboration | Centrality dependence of charged particle production at large transverse momentum in Pb--Pb collisions at $ \sqrt{s_{\rm{NN}}} = $ 2.76 TeV | PLB 720 (2013) 52 | 1208.2711 |
| 9 | ATLAS Collaboration | Measurement of charged-particle spectra in Pb+Pb collisions at $ \sqrt{s_{_{\mathrm{NN}}}} = $ 2.76 TeV with the ATLAS detector at the LHC | JHEP 09 (2015) 050 | 1504.04337 |
| 10 | CMS Collaboration | Charged-particle nuclear modification factors in PbPb and pPb collisions at $ \sqrt{s_{\mathrm{NN}}} = $ 5.02 TeV | JHEP 04 (2017) 039 | CMS-HIN-15-015 1611.01664 |
| 11 | CMS Collaboration | Measurement of inclusive jet cross sections in pp and PbPb collisions at $ \sqrt{s_{\mathrm{NN}}} = $ 2.76 TeV | PRC 96 (2017) 015202 | CMS-HIN-13-005 1609.05383 |
| 12 | ATLAS Collaboration | Centrality and rapidity dependence of inclusive jet production in $ \sqrt{s_\mathrm{NN}} = $ 5.02 TeV proton--lead collisions with the ATLAS detector | PLB 748 (2015) 392 | 1412.4092 |
| 13 | ALICE Collaboration | Measurement of jet quenching with semi-inclusive hadron-jet distributions in central Pb-Pb collisions at $ \sqrt{s_{\mathrm{NN}}} = $ 2.76 TeV | JHEP 09 (2015) 170 | 1506.03984 |
| 14 | STAR Collaboration | Dijet imbalance measurements in Au+Au and pp collisions at $ \sqrt{s_{_{\mathrm{NN}}}} = $ 200 GeV at STAR | PRL 119 (2017) 062301 | 1609.03878 |
| 15 | ATLAS Collaboration | Centrality, rapidity and transverse momentum dependence of isolated prompt photon production in lead-lead collisions at $ \sqrt{s_{\mathrm{NN}}} = $ 2.76 TeV measured with the ATLAS detector | PRC 93 (2016) 034914 | 1506.08552 |
| 16 | CMS Collaboration | Measurement of isolated photon production in pp and PbPb collisions at $ \sqrt{s_{\mathrm{NN}}} = $ 2.76 TeV | PLB 710 (2012) 256 | CMS-HIN-11-002 1201.3093 |
| 17 | CMS Collaboration | Study of W boson production in PbPb and pp collisions at $ \sqrt{s_\mathrm{NN}}= $ 2.76 TeV | PLB 715 (2012) 66 | CMS-HIN-11-008 1205.6334 |
| 18 | CMS Collaboration | Study of Z production in PbPb and pp collisions at $ \sqrt{s_{\mathrm{NN}}}= $ 2.76 TeV in the dimuon and dielectron decay channels | JHEP 03 (2015) 022 | CMS-HIN-13-004 1410.4825 |
| 19 | V. Kartvelishvili, R. Kvatadze, and R. Shanidze | On Z and Z+jet production in heavy ion collisions | PLB 356 (1995) 589 | hep-ph/9505418 |
| 20 | X.-N. Wang, Z. Huang, and I. Sarcevic | Jet quenching in the opposite direction of a tagged photon in high-energy heavy ion collisions | PRL 77 (1996) 231 | hep-ph/9605213 |
| 21 | Z.-B. Kang, I. Vitev, and H. Xing | Vector-boson-tagged jet production in heavy ion collisions at energies available at the CERN large hadron collider | PRC 96 (2017) 014912 | 1702.07276 |
| 22 | CMS Collaboration | Observation and studies of jet quenching in PbPb collisions at $ \sqrt{s_{\mathrm{NN}}} = $ 2.76 TeV | PRC 84 (2011) 024906 | CMS-HIN-10-004 1102.1957 |
| 23 | CMS Collaboration | The CMS experiment at the CERN LHC | JINST 3 (2008) S08004 | CMS-00-001 |
| 24 | CMS Collaboration | The CMS trigger system | JINST 12 (2017) P01020 | CMS-TRG-12-001 1609.02366 |
| 25 | T. Sjostrand, S. Mrenna, and P. Z. Skands | A brief introduction to PYTHIA 8.1 | CPC 178 (2008) 852 | 0710.3820 |
| 26 | CMS Collaboration | Extraction and validation of a new set of CMS PYTHIA8 tunes from underlying-event measurements | EPJC 80 (2020) | CMS-GEN-17-001 1903.12179 |
| 27 | J. Alwall et al. | The automated computation of tree-level and next-to-leading order differential cross sections, and their matching to parton shower simulations | JHEP 07 (2014) 079 | 1405.0301 |
| 28 | I. P. Lokhtin and A. M. Snigirev | A model of jet quenching in ultrarelativistic heavy ion collisions and high-$ p_{\mathrm{T}} $ hadron spectra at RHIC | EPJC 45 (2006) 211 | hep-ph/0506189 |
| 29 | GEANT4 Collaboration | GEANT4--a simulation toolkit | NIMA 506 (2003) 250 | |
| 30 | CMS Collaboration | Performance of Electron Reconstruction and Selection with the CMS Detector in Proton-Proton Collisions at $ \sqrt{s} = $ 8 TeV | JINST 10 (2015), no. 06, P06005 | CMS-EGM-13-001 1502.02701 |
| 31 | CMS Collaboration | Performance of CMS Muon Reconstruction in $ pp $ Collision Events at $ \sqrt{s} = $ 7 TeV | JINST 7 (2012) P10002 | CMS-MUO-10-004 1206.4071 |
| 32 | CMS Collaboration | Description and performance of track and primary-vertex reconstruction with the CMS tracker | JINST 9 (2014) P10009 | CMS-TRK-11-001 1405.6569 |
| 33 | CMS Collaboration | Observation of Medium-Induced Modifications of Jet Fragmentation in Pb-Pb Collisions at $ \sqrt{s_{\mathrm{NN}}} = $ 5.02 TeV Using Isolated Photon-Tagged Jets | PRL 121 (2018), no. 24, 242301 | CMS-HIN-16-014 1801.04895 |
| 34 | CMS Collaboration | Jet Shapes of Isolated Photon-Tagged Jets in Pb-Pb and pp Collisions at $ \sqrt{s_{\mathrm{NN}}} = $ 5.02 TeV | PRL 122 (2019), no. 15, 152001 | CMS-HIN-18-006 1809.08602 |
| 35 | B. Efron | Bootstrap methods: Another look at the jackknife | Ann. Statist. 7 (1979), no. 1 | |
| 36 | W. Chen et al. | Effects of jet-induced medium excitation in $ \gamma $-hadron correlation in A+A collisions | PLB 777 (2018) 86 | 1704.03648 |
| 37 | R. Kunnawalkam Elayavalli and K. C. Zapp | Medium response in JEWEL and its impact on jet shape observables in heavy ion collisions | JHEP 07 (2017) 141 | 1707.01539 |
|
|
Compact Muon Solenoid LHC, CERN |
|

|

|

|

|

|