

Compact Muon Solenoid
LHC, CERN
| CMS-PAS-HIN-17-006 | ||
| Pseudorapidity distributions of charged hadrons in XeXe collisions at $\sqrt{\smash[b]{s_{_{\mathrm{NN}}}}} = $ 5.44 TeV | ||
| CMS Collaboration | ||
| May 2018 | ||
| Abstract: Measurements of the pseudorapidity distributions of charged hadrons produced in xenon-xenon collisions at $\sqrt{\smash[b]{s_{_{\mathrm{NN}}}}} = $ 5.44 TeV are presented. The measurements are based on data collected by the CMS experiment at the CERN LHC. The yield of primary charged hadrons produced in non-single-diffractive xenon-xenon collisions in the pseudorapidity range $|\eta | < $ 3.2 is determined using the silicon pixel detector in the CMS tracking system. For events with the largest overlap between the colliding nuclei, the charged-hadron pseudorapidity density at midrapidity is found to be 1187 $\pm$ 36 (syst.). The rapidity distribution of charged hadrons is also presented and is found to be independent of rapidity around midrapidity, a feature that is not predicted by Monte Carlo event generators. Comparisons of per-participant charged-particle multiplicities between xenon-xenon and lead-lead collisions at similar energies show that particle production is driven by the collision geometry instead of the system size. | ||
|
Links:
CDS record (PDF) ;
CADI line (restricted) ;
These preliminary results are superseded in this paper, PLB 799 (2019) 135049. The superseded preliminary plots can be found here. |
||
| Figures & Tables | Summary | Additional Figures | References | CMS Publications |
|---|
| Figures | |

png pdf |
Figure 1:
$ {\Delta r} $ distributions for tracklets reconstructed from the two layers of the BPIX closest to the beam pipe. The distributions are normalised by the number of tracklets. The spectrum in collision data (black squares) is compared to the spectra obtained from fully simulated events generated by the EPOS [7] (LHC tune [8]), HYDJET 1.9 [9], and AMPT 1.26t5 [10] event generators. The statistical uncertainties are smaller than the marker sizes for all distributions shown. |

png pdf |
Figure 2:
(Left) Averaged and symmetrised $ {\mathrm {d}N_{\mathrm {ch}}/\mathrm {d}\eta} $ results (grey squares) in XeXe collisions at $ {\sqrt {s_{_{\mathrm {NN}}}}} = $ 5.44 TeV, for events in the 0-80% centrality interval. Predictions from the EPOS [7] (LHC tune [8]), HYDJET 1.9 [9], and AMPT 1.26t5 [10] event generators are also shown in comparison. (Right) $ {\mathrm {d}N_{\mathrm {ch}}/\mathrm {d}\eta} $ in XeXe collisions for events with 0-5% (red squares) and 50-55% (blue squares) centrality, shown in comparison to predictions from the EPOS, HYDJET, and AMPT event generators. The ratios of the $ {\mathrm {d}N_{\mathrm {ch}}/\mathrm {d}\eta} $ distributions for events in the 0-5% centrality interval to those in the 50-55% centrality interval, normalised to unity at midrapidity, are shown in the bottom panel. The bands around the data points denote the total systematic uncertainties, while the statistical uncertainties are negligible. |

png pdf |
Figure 2-a:
Averaged and symmetrised $ {\mathrm {d}N_{\mathrm {ch}}/\mathrm {d}\eta} $ results (grey squares) in XeXe collisions at $ {\sqrt {s_{_{\mathrm {NN}}}}} = $ 5.44 TeV, for events in the 0-80% centrality interval. Predictions from the EPOS [7] (LHC tune [8]), HYDJET 1.9 [9], and AMPT 1.26t5 [10] event generators are also shown in comparison. The bands around the data points denote the total systematic uncertainties, while the statistical uncertainties are negligible. |

png pdf |
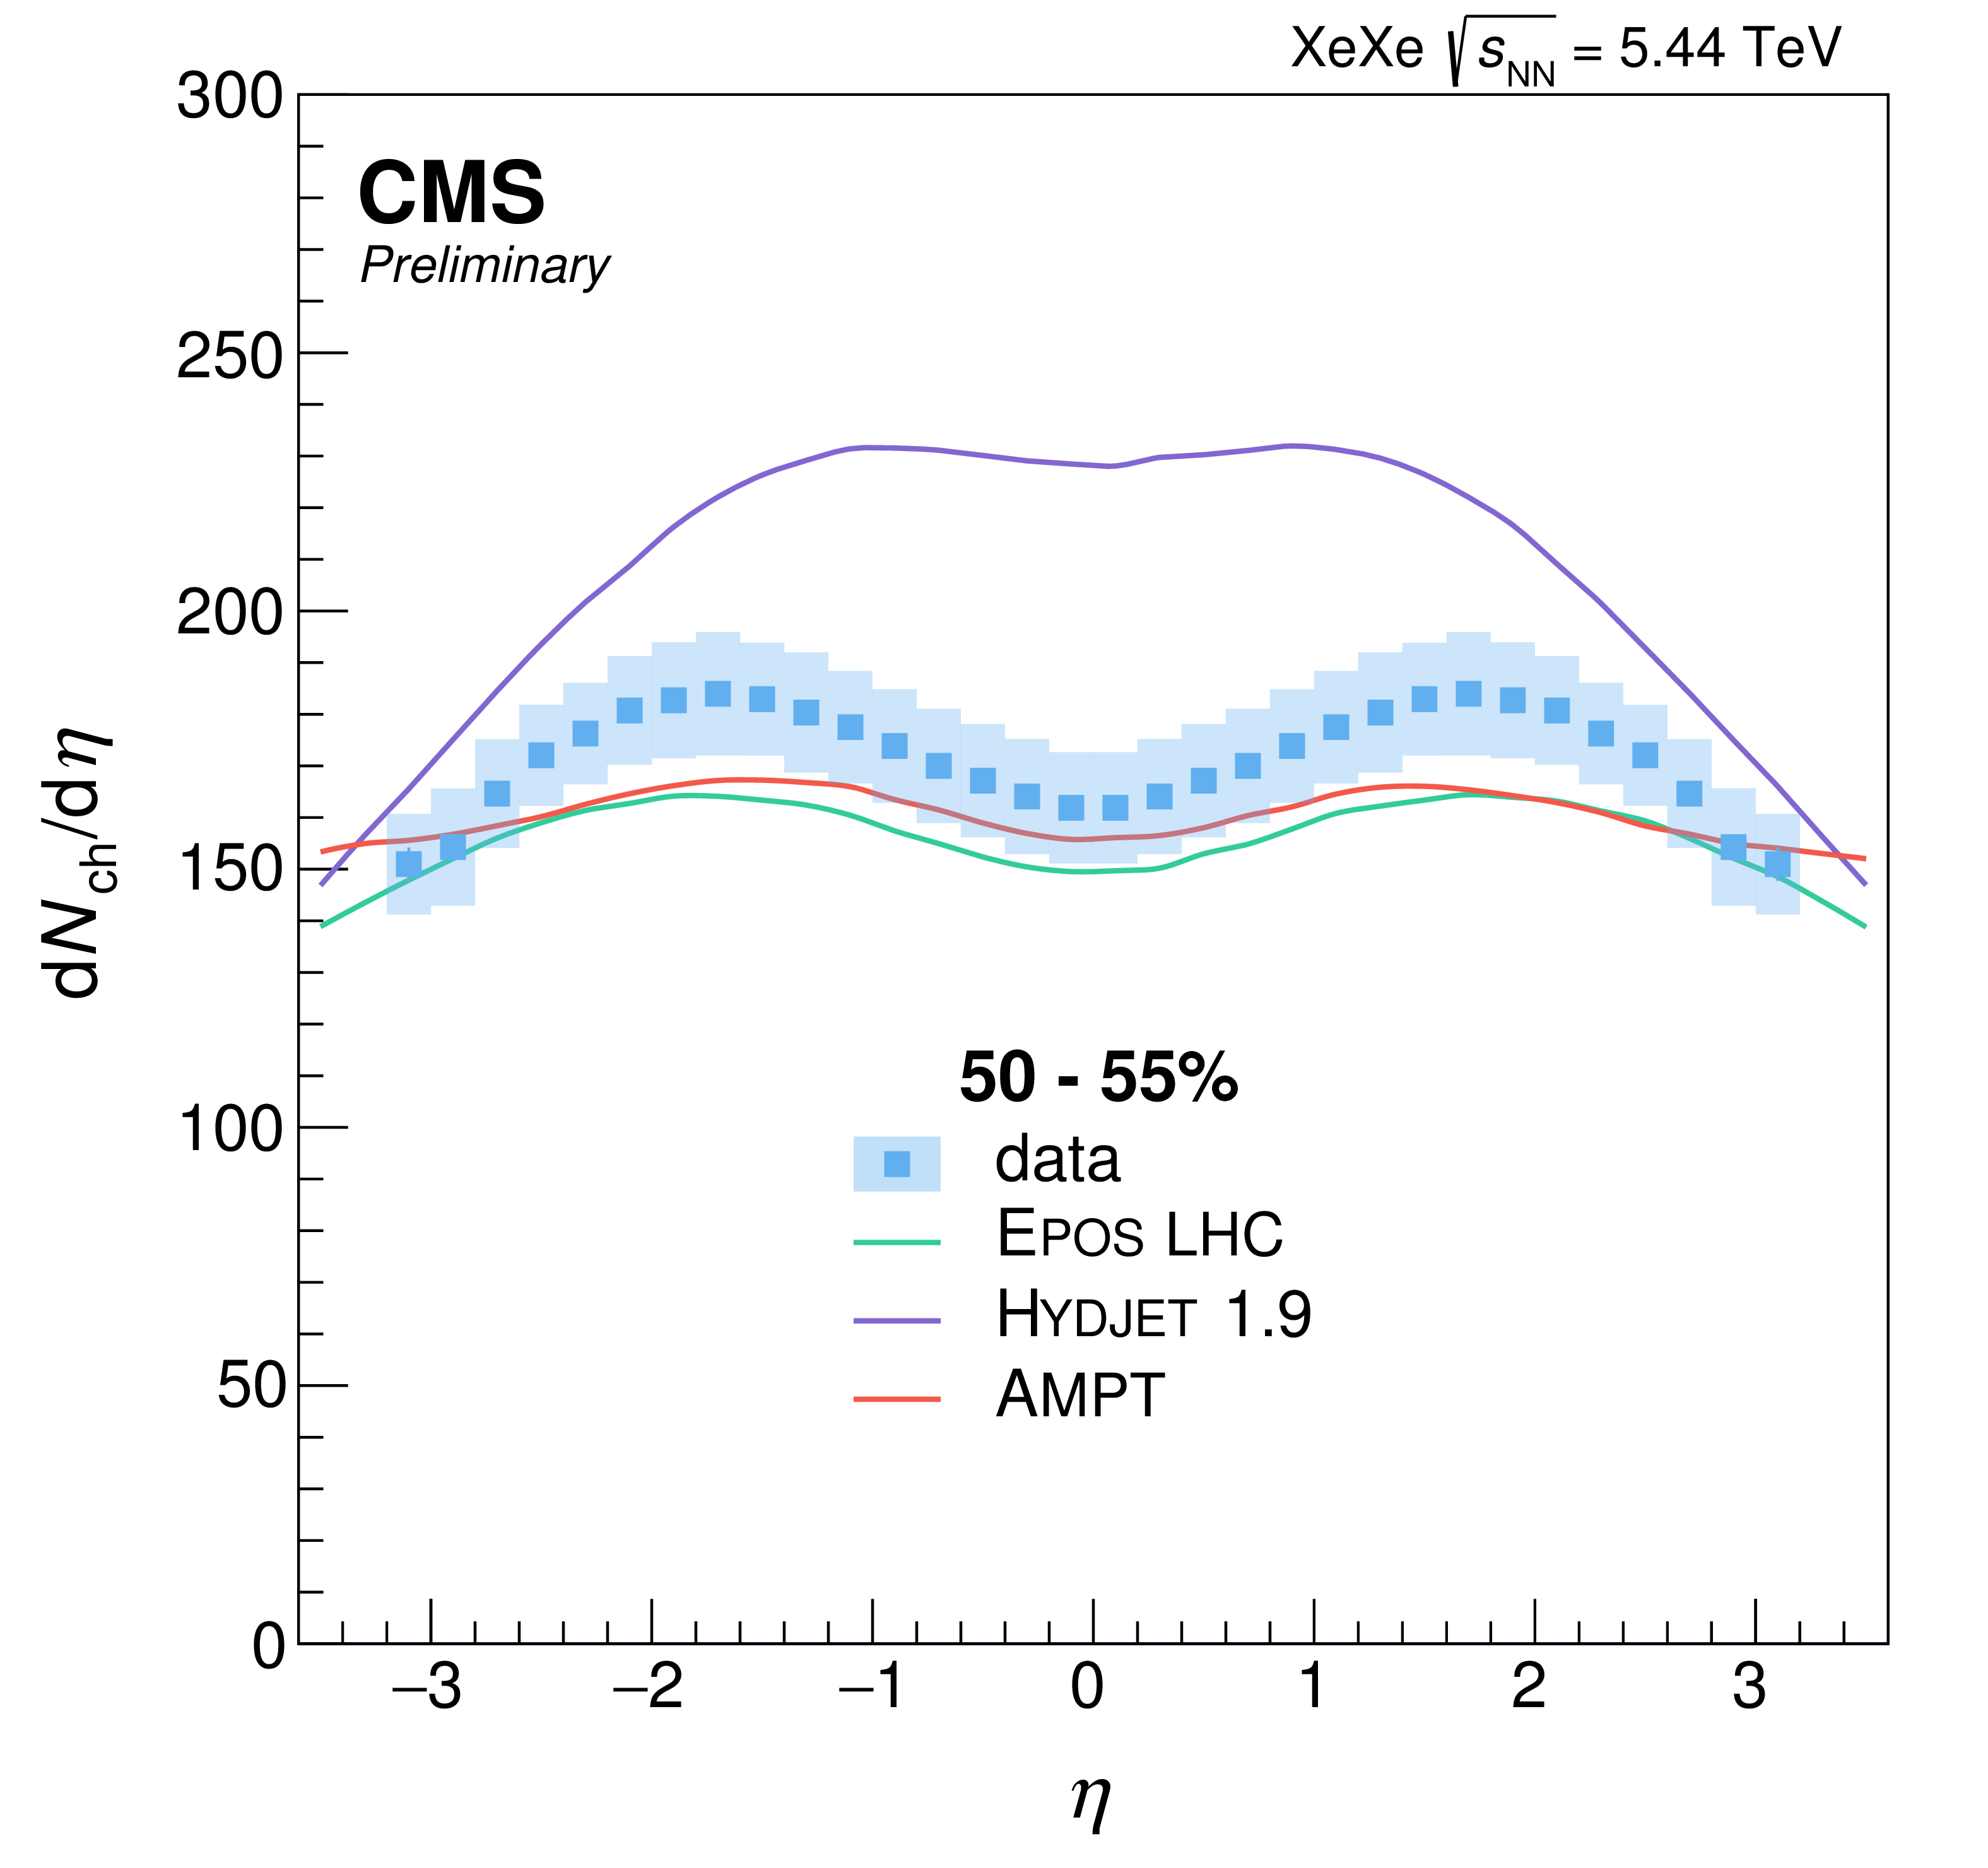
Figure 2-b:
$ {\mathrm {d}N_{\mathrm {ch}}/\mathrm {d}\eta} $ in XeXe collisions for events with 0-5% (red squares) and 50-55% (blue squares) centrality, shown in comparison to predictions from the EPOS, HYDJET, and AMPT event generators. The ratios of the $ {\mathrm {d}N_{\mathrm {ch}}/\mathrm {d}\eta} $ distributions for events in the 0-5% centrality interval to those in the 50-55% centrality interval, normalised to unity at midrapidity, are shown in the bottom panel. The bands around the data points denote the total systematic uncertainties, while the statistical uncertainties are negligible. |
png pdf |
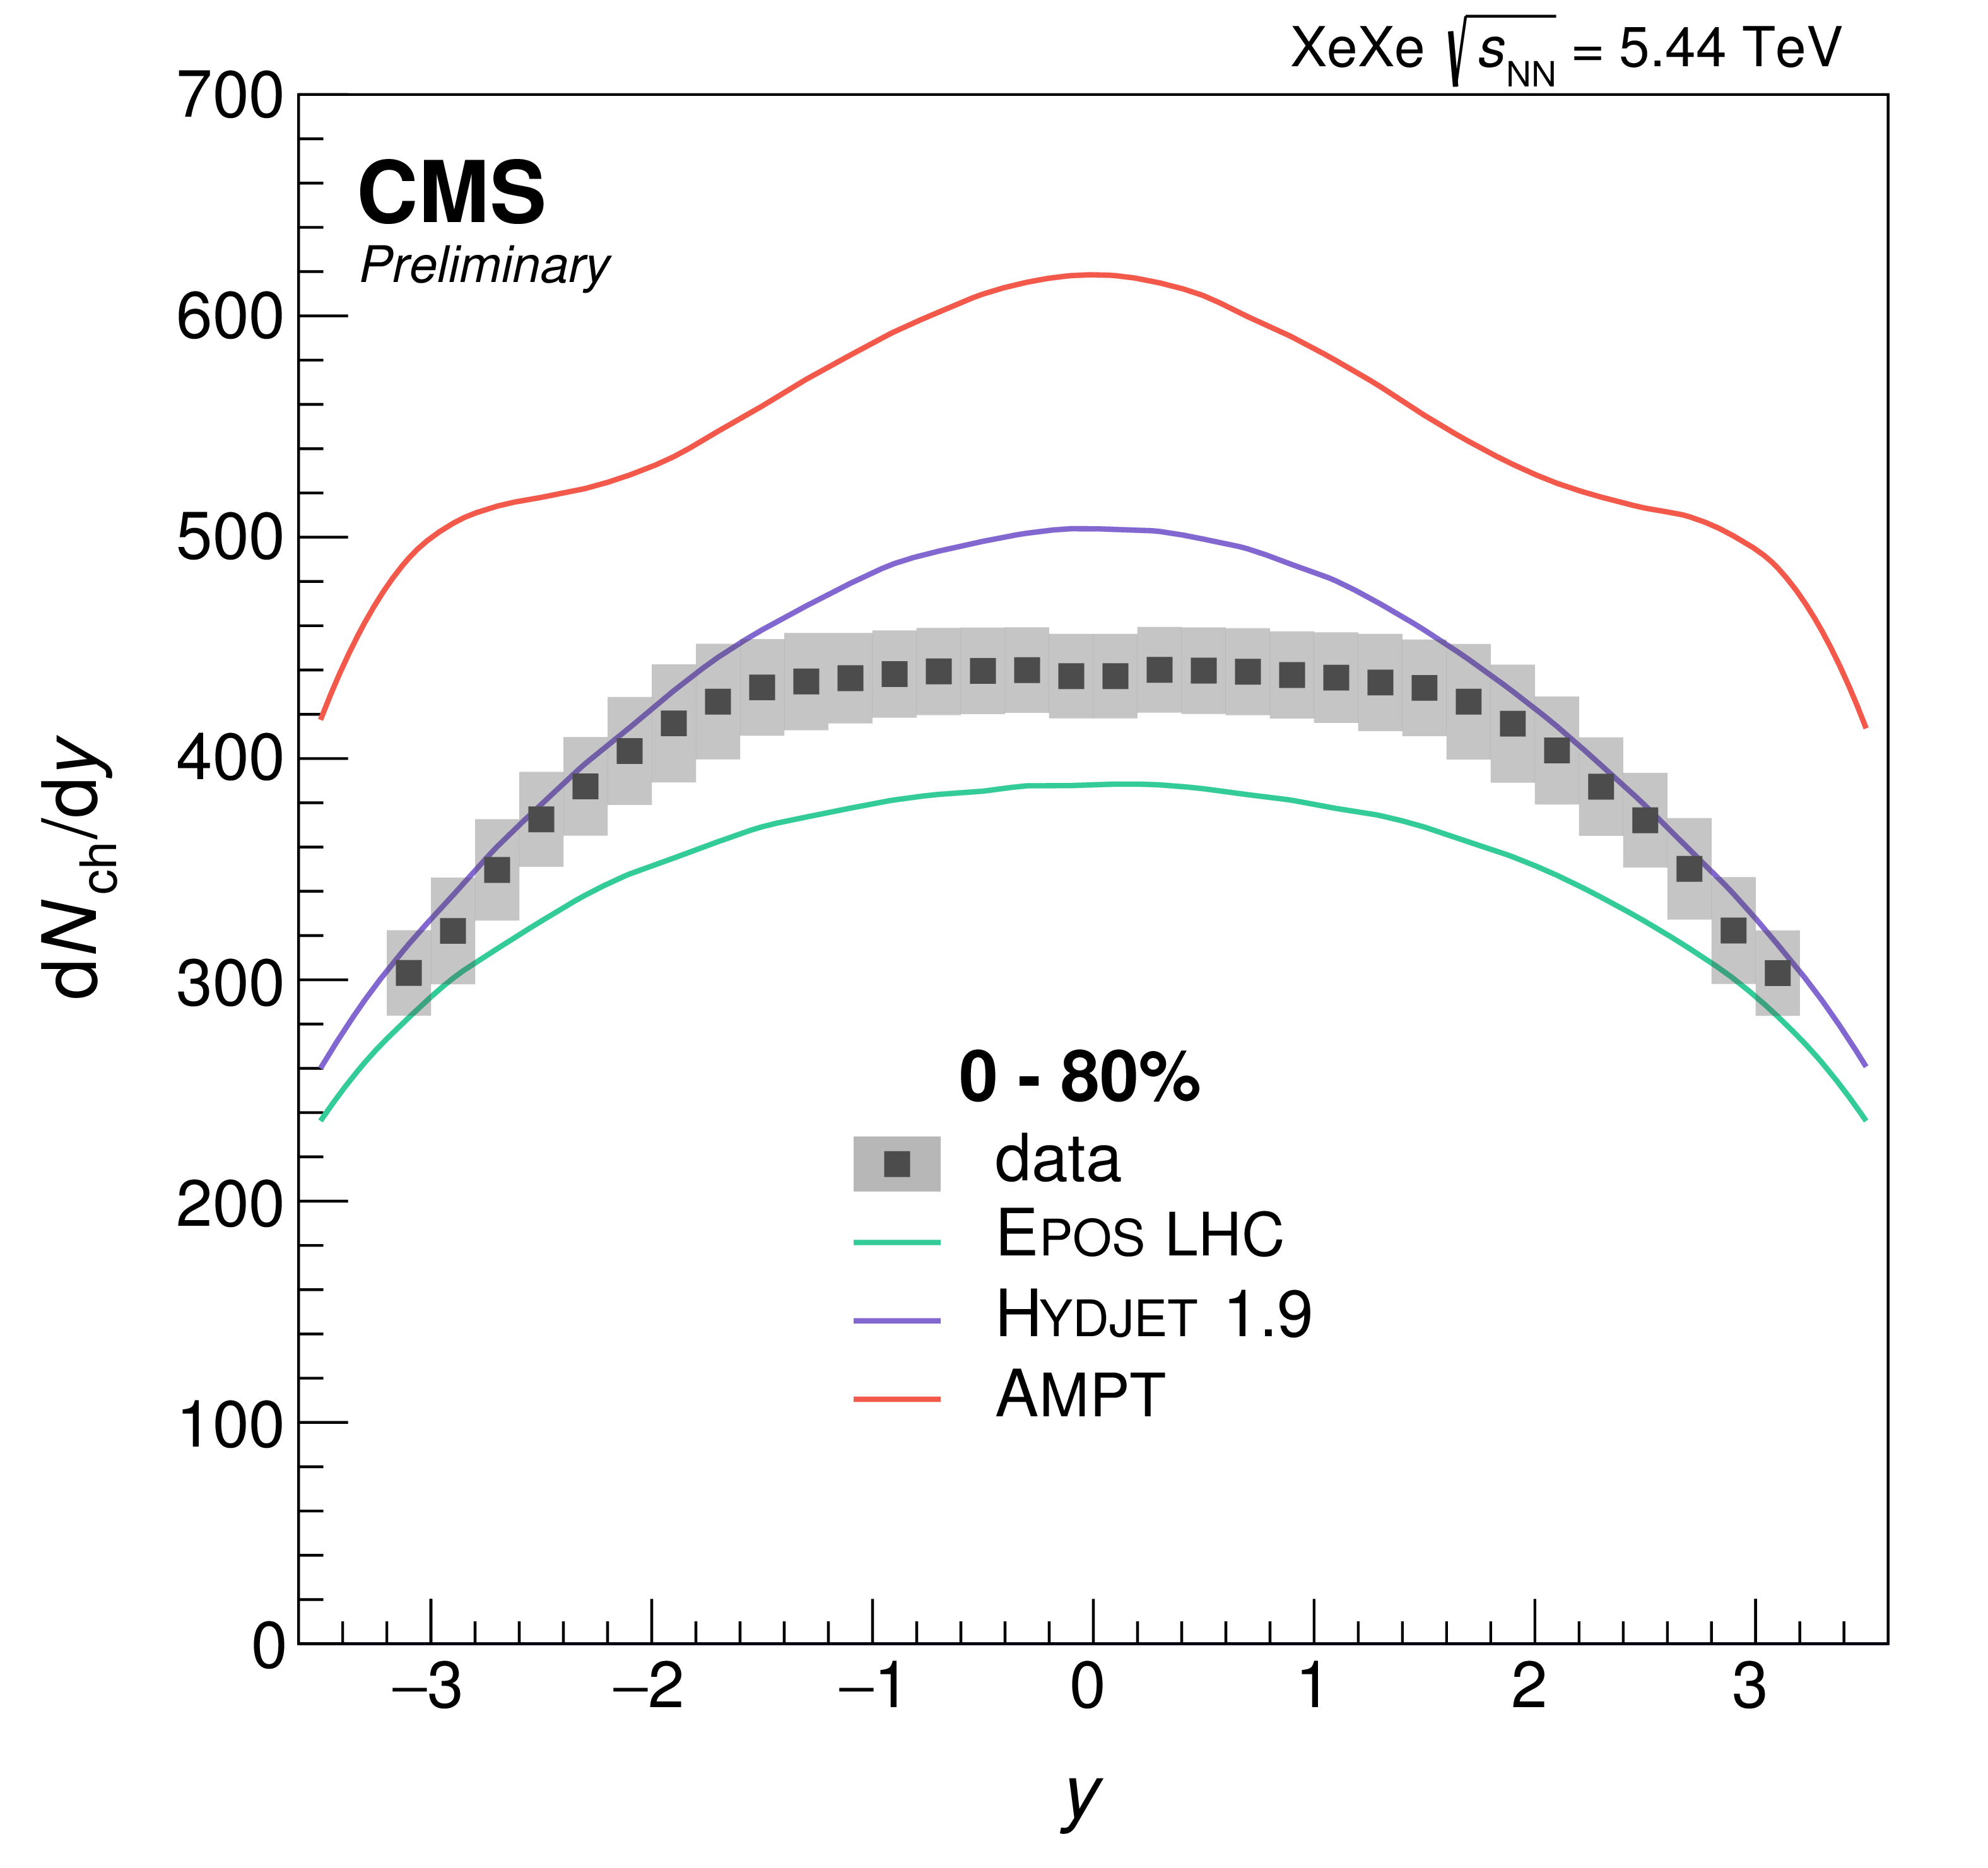
Figure 3:
Charged-hadron $ {\mathrm {d}N/\mathrm {d}y} $ in XeXe collisions at $ {\sqrt {s_{_{\mathrm {NN}}}}} = $ 5.44 TeV for events with 0-80% centrality (grey squares). The band around the data points denotes the total systematic uncertainties, while the statistical uncertainties are negligible. Predictions from the EPOS [7] (LHC tune [8]), HYDJET 1.9 [9], and AMPT 1.26t5 [10] event generators are also shown in comparison. |

png pdf |
Figure 4:
Charged hadron $ {\mathrm {d}N/\mathrm {d}\eta} $ in XeXe collisions at $ {\sqrt {s_{_{\mathrm {NN}}}}} = $ 5.44 TeV at midrapidity as a function of event centrality, shown in intervals of 5%. The results are compared to previous measurements in PbPb collisions at $ {\sqrt {s_{_{\mathrm {NN}}}}} = $ 2.76 and 5.02 TeV by the CMS [23] and ALICE [32,33] collaborations. The bands around the data points denote the total systematic uncertainties, while the statistical uncertainties are negligible. |

png pdf |
Figure 5:
Average $ {\mathrm {d}N_{\mathrm {ch}}/\mathrm {d}\eta} $ at midrapidity normalised by $ < N_{\mathrm {part}} > $, shown as a function of $ < N_{\mathrm {part}} > $ (left) and $ < N_{\mathrm {part}} > /2A$ (right), where $A$ is the atomic number of the nuclei. The results are compared to previous measurements in PbPb collisions by the CMS [23] and ALICE [32,33] collaborations. The bands around the data points denote the systematic uncertainties, while the statistical uncertainties are negligible. |

png pdf |
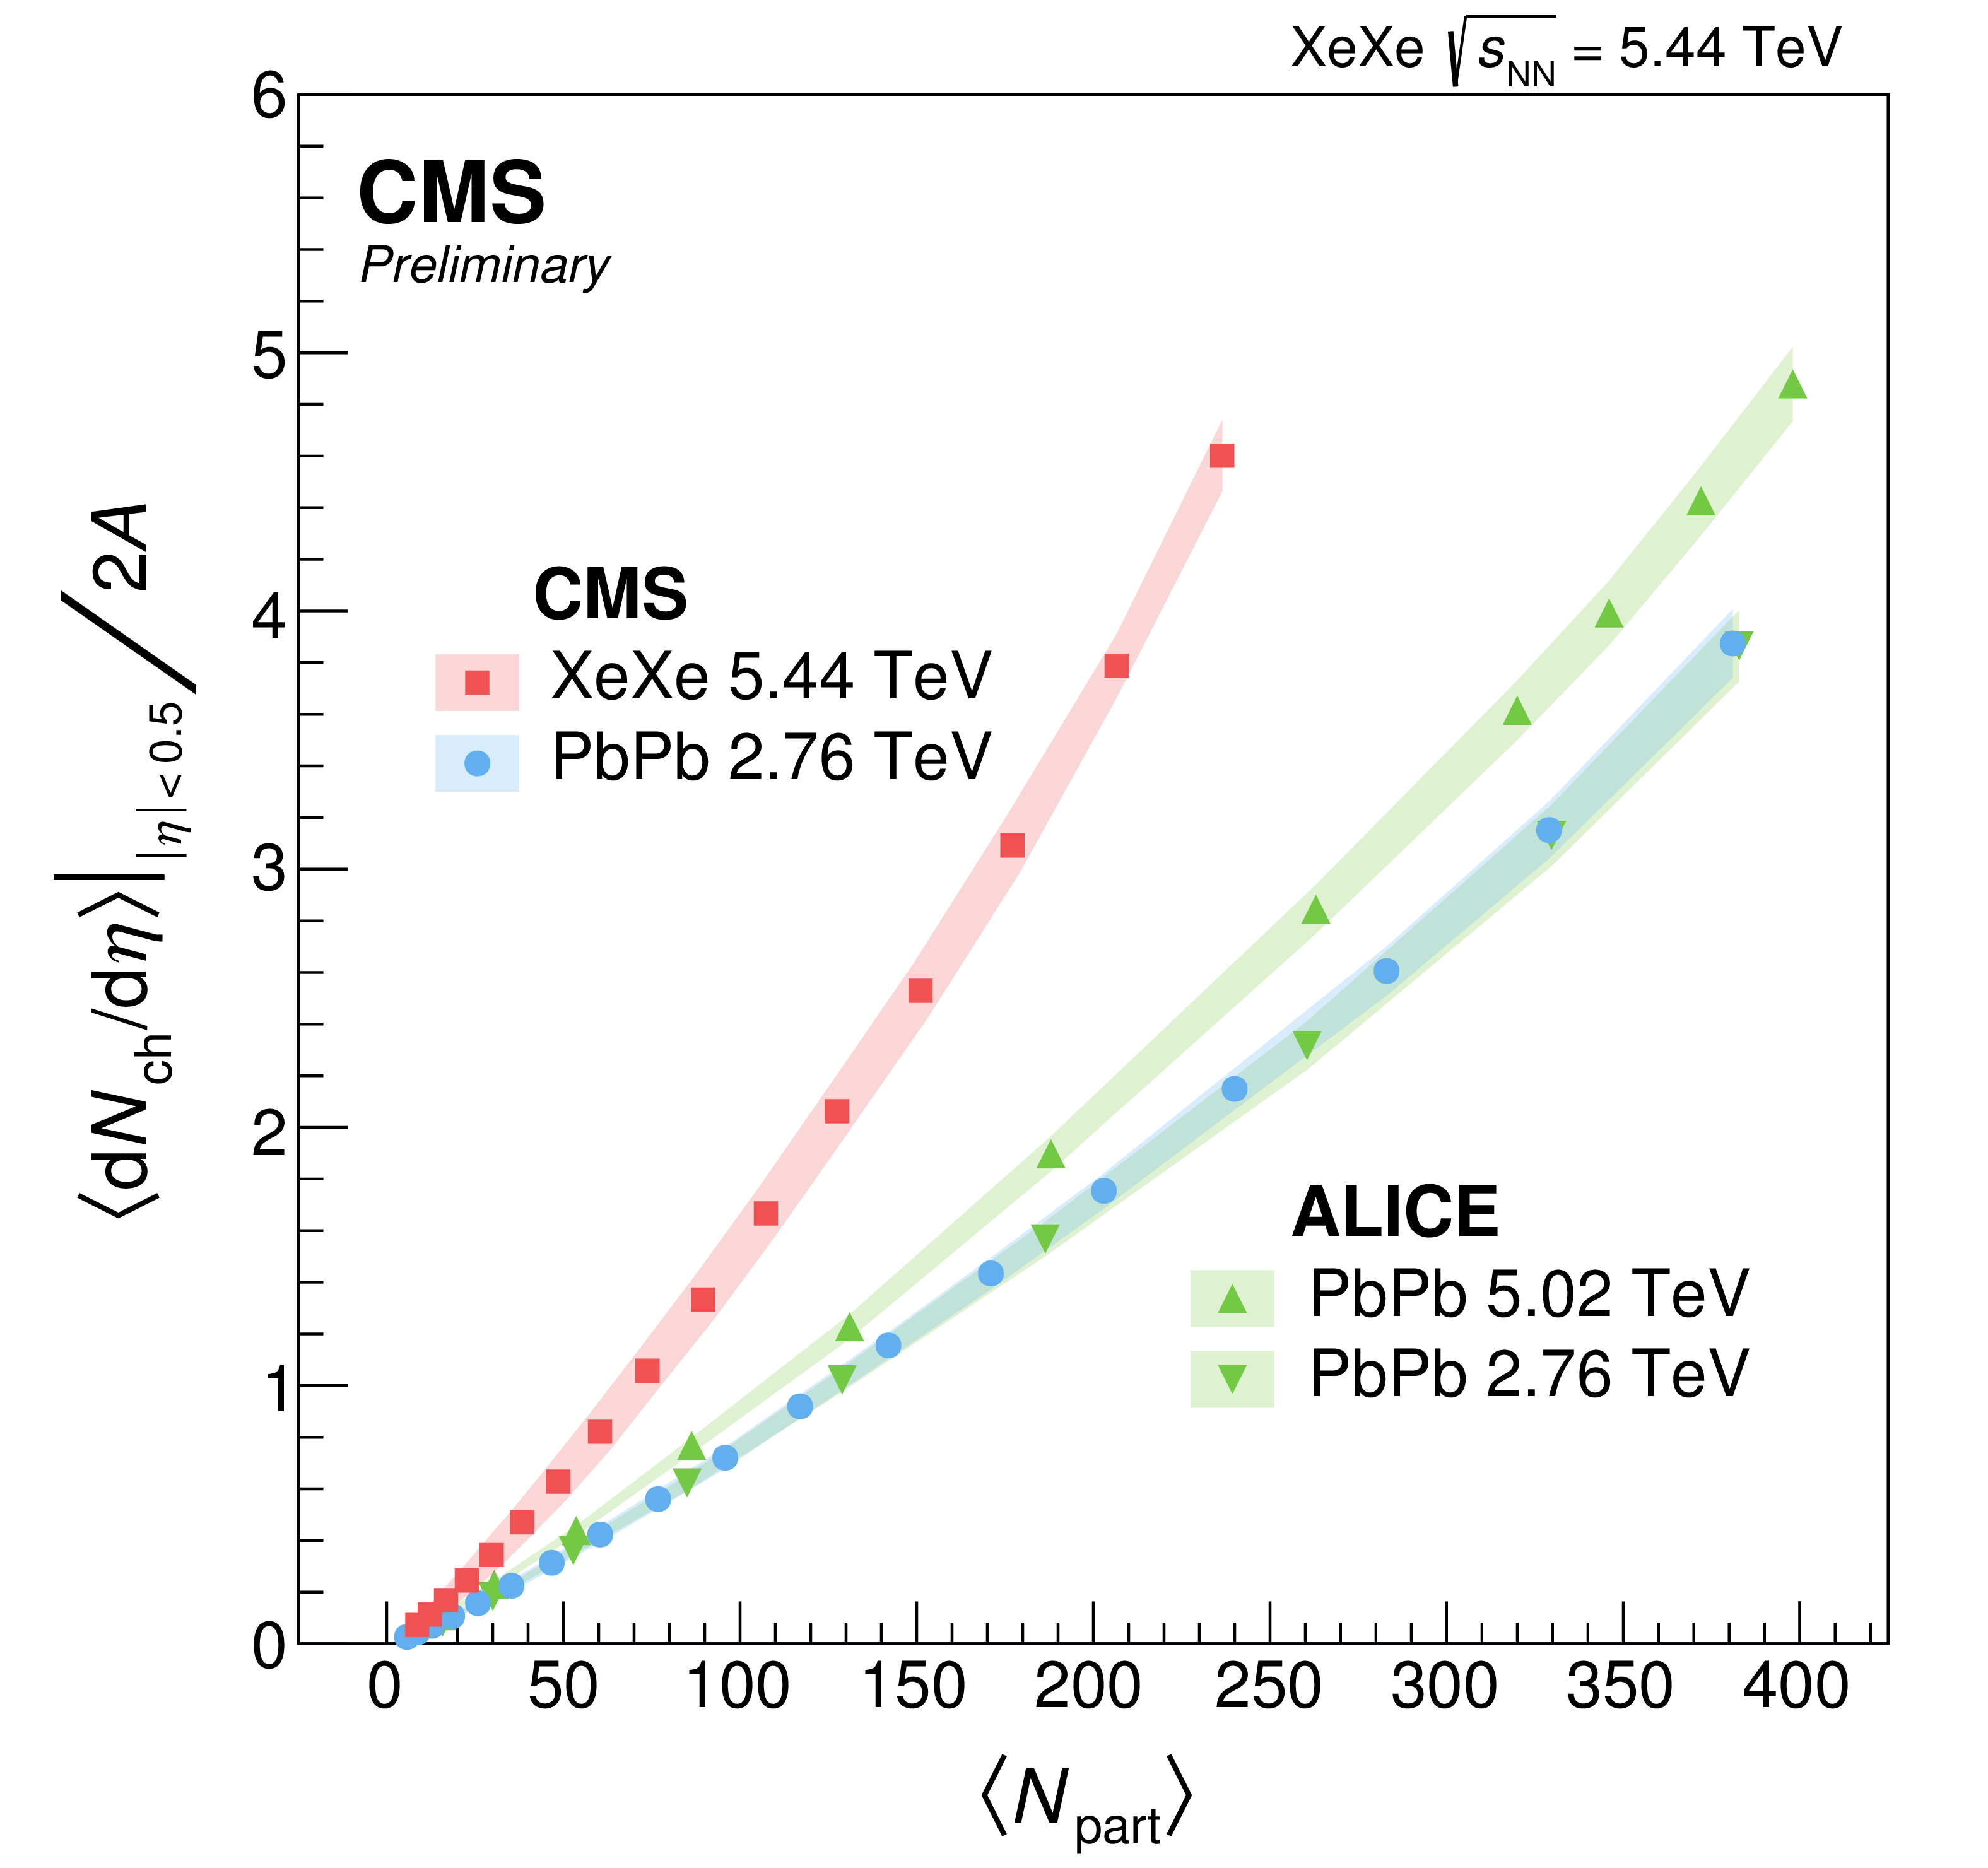
Figure 5-a:
Average $ {\mathrm {d}N_{\mathrm {ch}}/\mathrm {d}\eta} $ at midrapidity normalised by $ < N_{\mathrm {part}} > $, shown as a function of $ < N_{\mathrm {part}} > $, where $A$ is the atomic number of the nuclei. The results are compared to previous measurements in PbPb collisions by the CMS [23] and ALICE [32,33] collaborations. The bands around the data points denote the systematic uncertainties, while the statistical uncertainties are negligible. |

png pdf |
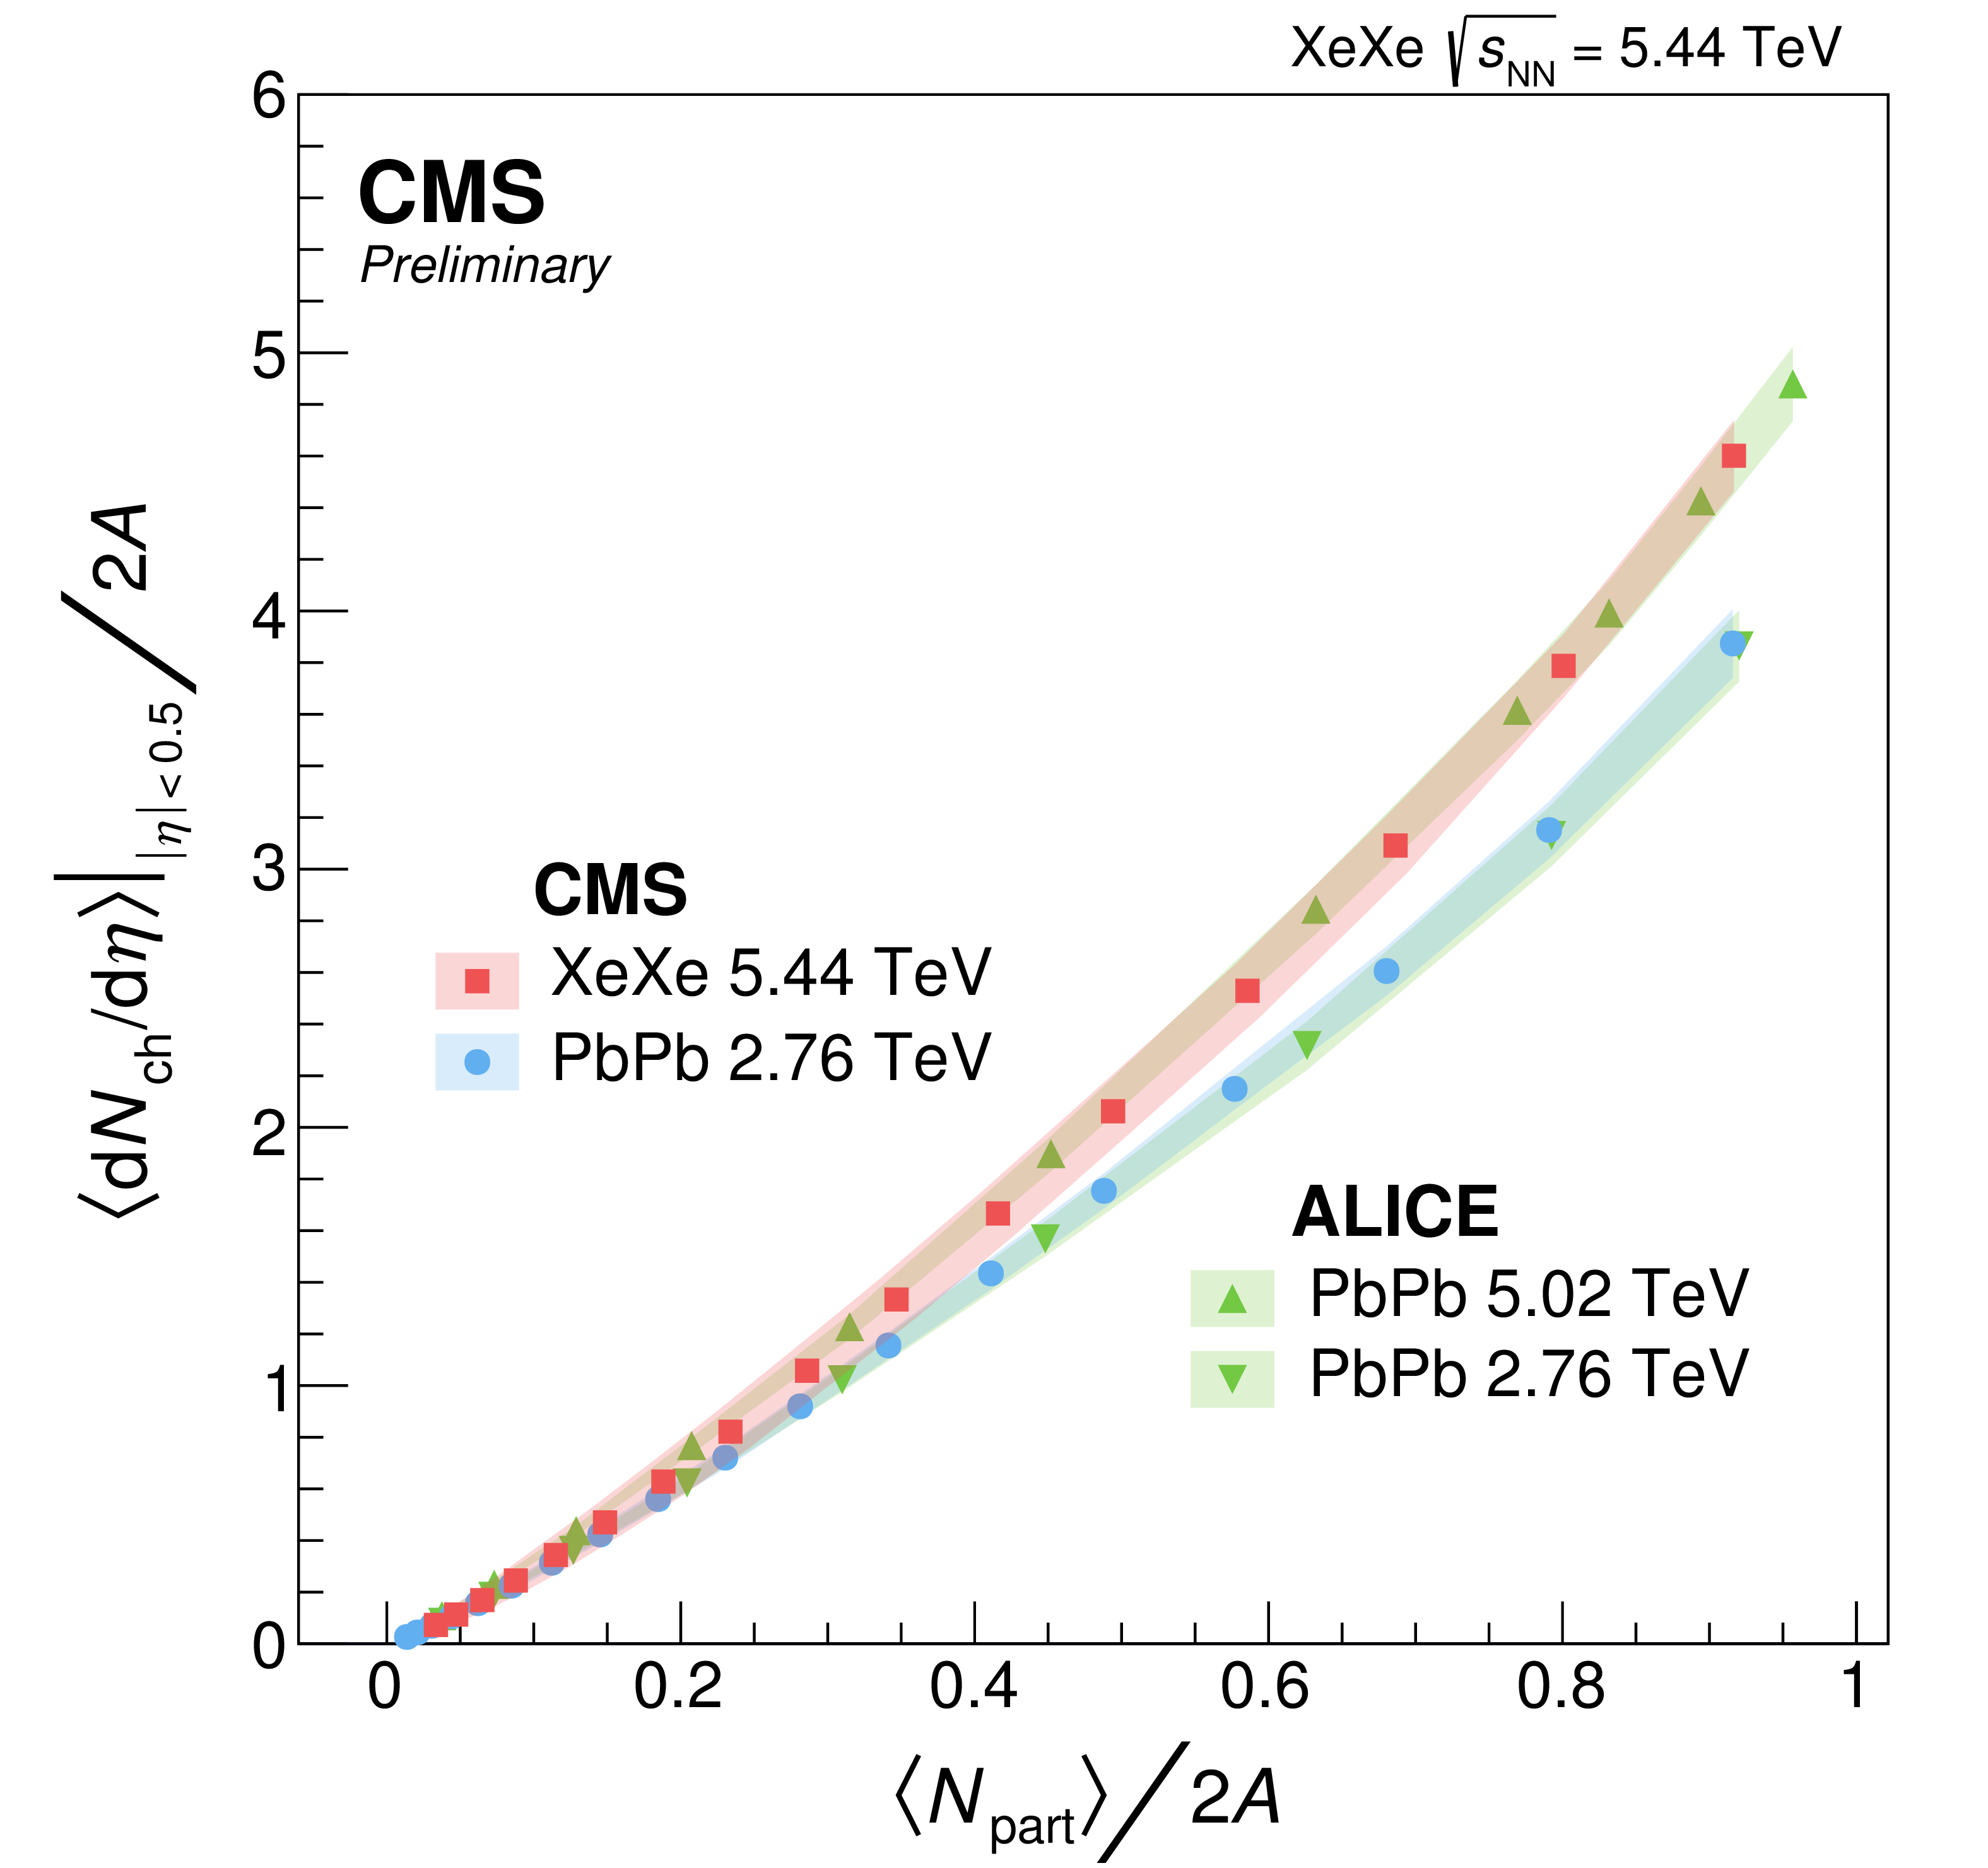
Figure 5-b:
Average $ {\mathrm {d}N_{\mathrm {ch}}/\mathrm {d}\eta} $ at midrapidity normalised by $ < N_{\mathrm {part}} > $, shown as a function of $ < N_{\mathrm {part}} > /2A$, where $A$ is the atomic number of the nuclei. The results are compared to previous measurements in PbPb collisions by the CMS [23] and ALICE [32,33] collaborations. The bands around the data points denote the systematic uncertainties, while the statistical uncertainties are negligible. |

png pdf |
Figure 6:
$ {\mathrm {d}N_{\mathrm {ch}}/\mathrm {d}y} $ distributions for PbPb collisions at 2.76 TeV in the 0-5% centrality interval, obtained by applying a Jacobian transformation to the existing measurement of $ {\mathrm {d}N_{\mathrm {ch}}/\mathrm {d}\eta} $ by the CMS Collaboration [23]. The band around the data points denote the systematic uncertainty, while the statistical uncertainties are negligible. The $ {\mathrm {d}N_{\mathrm {ch}}/\mathrm {d}y} $ distribution is compared to that measured by the ALICE Collaboration [29]. |
| Tables | |

png pdf |
Table 1:
Summary of systematic uncertainties |
| Summary |
| The pseudorapidity distributions of charged hadrons in xenon-xenon collisions at a centre-of-mass energy of 5.44 TeV per nucleon pair are reported. The charged-hadron pseudorapidity density, $ {\mathrm {d}N_{\mathrm {ch}}/\mathrm {d}\eta} $ , at midrapidity in the 0-5% centrality interval is measured to be 1187 $\pm$ 36 (syst.). The charged-hadron rapidity density is also presented, and is found to be consistent with a flat rapidity plateau in a region around midrapidity, $| y | < $ 1. The results are compared to predictions from the EPOS (LHC tune), HYDJET 1.9, and AMPT 1.26t5 event generators. None of the event generators are able to fully describe the data in terms of the magnitude, pseudorapidity dependence, and centrality dependence of the $ {\mathrm {d}N_{\mathrm {ch}}/\mathrm {d}\eta} $ distributions, although EPOS describes well the pseudorapidity dependence and its centrality dependence. The per-participant $ {\mathrm {d}N_{\mathrm {ch}}/\mathrm {d}\eta} $ at midrapidity is observed to be larger in xenon-xenon than in lead-lead collisions at a similar energy for events with a similar number of participating nucleons, but is found to be consistent when events with similar fractional overlap are compared instead. This result demonstrates that final-state charged-hadron multiplicities are determined by the collision geometry and not the system size. These results provide important constraints on particle production mechanisms and the initial conditions in heavy ion collisions at LHC energies for models and event generators to describe the production and evolution of the strongly interacting medium in such collisions. |
| Additional Figures | |

png pdf |
Additional Figure 1:
Charged-hadron ${\mathrm {d}N/\mathrm {d}\eta} $ in XeXe collisions at $ {\sqrt {\smash [b]{s_{_{\mathrm {NN}}}}}} = $ 5.44 TeV for events with 0-5% centrality (red squares). The band around the data points denotes the total systematic uncertainties, while the statistical uncertainties are negligible. Predictions from the Epos [1] (LHC tune [2]), Hydjet 1.9 [3], and Ampt 1.26t5 [4] event generators are also shown in comparison. |
png pdf |
Additional Figure 2:
Charged-hadron $ {\mathrm {d}N/\mathrm {d}\eta} $ in XeXe collisions at $ {\sqrt {\smash [b]{s_{_{\mathrm {NN}}}}}} = $ 5.44 TeV for events with 50-55% centrality (blue squares). The band around the data points denotes the total systematic uncertainties, while the statistical uncertainties are negligible. Predictions from the Epos [1] (LHC tune [2]), Hydjet 1.9 [3], and Ampt 1.26t5 [4] event generators are also shown in comparison. |

png pdf |
Additional Figure 3:
Charged-hadron $ {\mathrm {d}N/\mathrm {d}y} $ in XeXe collisions at $ {\sqrt {\smash [b]{s_{_{\mathrm {NN}}}}}} = $ 5.44 TeV for events with 0-5% centrality (red squares). The band around the data points denotes the total systematic uncertainties, while the statistical uncertainties are negligible. Predictions from the Epos [1] (LHC tune [2]), Hydjet 1.9 [3], and Ampt 1.26t5 [4] event generators are also shown in comparison. |

png pdf |
Additional Figure 4:
Charged-hadron $ {\mathrm {d}N/\mathrm {d}y} $ in XeXe collisions at $ {\sqrt {\smash [b]{s_{_{\mathrm {NN}}}}}} = $ 5.44 TeV for events with 50-55% centrality (blue squares). The band around the data points denotes the total systematic uncertainties, while the statistical uncertainties are negligible. Predictions from the Epos [1] (LHC tune [2]), Hydjet 1.9 [3], and Ampt 1.26t5 [4] event generators are also shown in comparison. |

png pdf |
Additional Figure 5:
Charged-hadron $ {\mathrm {d}N/\mathrm {d}y} $ in XeXe collisions at $ {\sqrt {\smash [b]{s_{_{\mathrm {NN}}}}}} = $ 5.44 TeV for events with 0-5% centrality (red squares). The band around the data points denotes the total systematic uncertainties, while the statistical uncertainties are negligible. The data are compared to measurements of $ {\mathrm {d}N_{\mathrm {ch}}/\mathrm {d}y} $ in PbPb collisions at $ {\sqrt {\smash [b]{s_{_{\mathrm {NN}}}}}} = $ 2.76 and 5.02 TeV by the ALICE Collaboration [5,6], as well as in AuAu collisions at $ {\sqrt {\smash [b]{s_{_{\mathrm {NN}}}}}} = $ 200 GeV by the BRAHMS Collaboration [7]. |

png pdf |
Additional Figure 6:
Average $ {\mathrm {d}N_{\mathrm {ch}}/\mathrm {d}\eta} $ at midrapidity normalised by $ < N_{\mathrm {part}} > $, shown as a function of $ < N_{\mathrm {part}} > $. The results are compared to previous measurements in PbPb collisions by the CMS [8] and ALICE [9,10] collaborations, as well as measurements in CuCu and AuAu collisions by the PHOBOS [11] and BRAHMS [12] collaborations at RHIC. The bands around the data points denote the systematic uncertainties, while the statistical uncertainties are negligible. |
png pdf |
Additional Figure 7:
Average $ {\mathrm {d}N_{\mathrm {ch}}/\mathrm {d}\eta} $ at midrapidity normalised by $2A$, where $A$ is the total number of nucleons in one of the colliding nuclei, shown as a function of $ < N_{\mathrm {part}} > $. The results are compared to previous measurements in PbPb collisions by the CMS [8] and ALICE [9,10] collaborations. The bands around the data points denote the systematic uncertainties, while the statistical uncertainties are negligible. |
png pdf |
Additional Figure 8:
Average $ {\mathrm {d}N_{\mathrm {ch}}/\mathrm {d}\eta} $ at midrapidity normalised by $2A$, where $A$ is the total number of nucleons in one of the colliding nuclei, shown as a function of $ < N_{\mathrm {part}} > /2A$. The results are compared to previous measurements in PbPb collisions by the CMS [8] and ALICE [9,10] collaborations. The bands around the data points denote the systematic uncertainties, while the statistical uncertainties are negligible. |
png pdf |
Additional Figure 9:
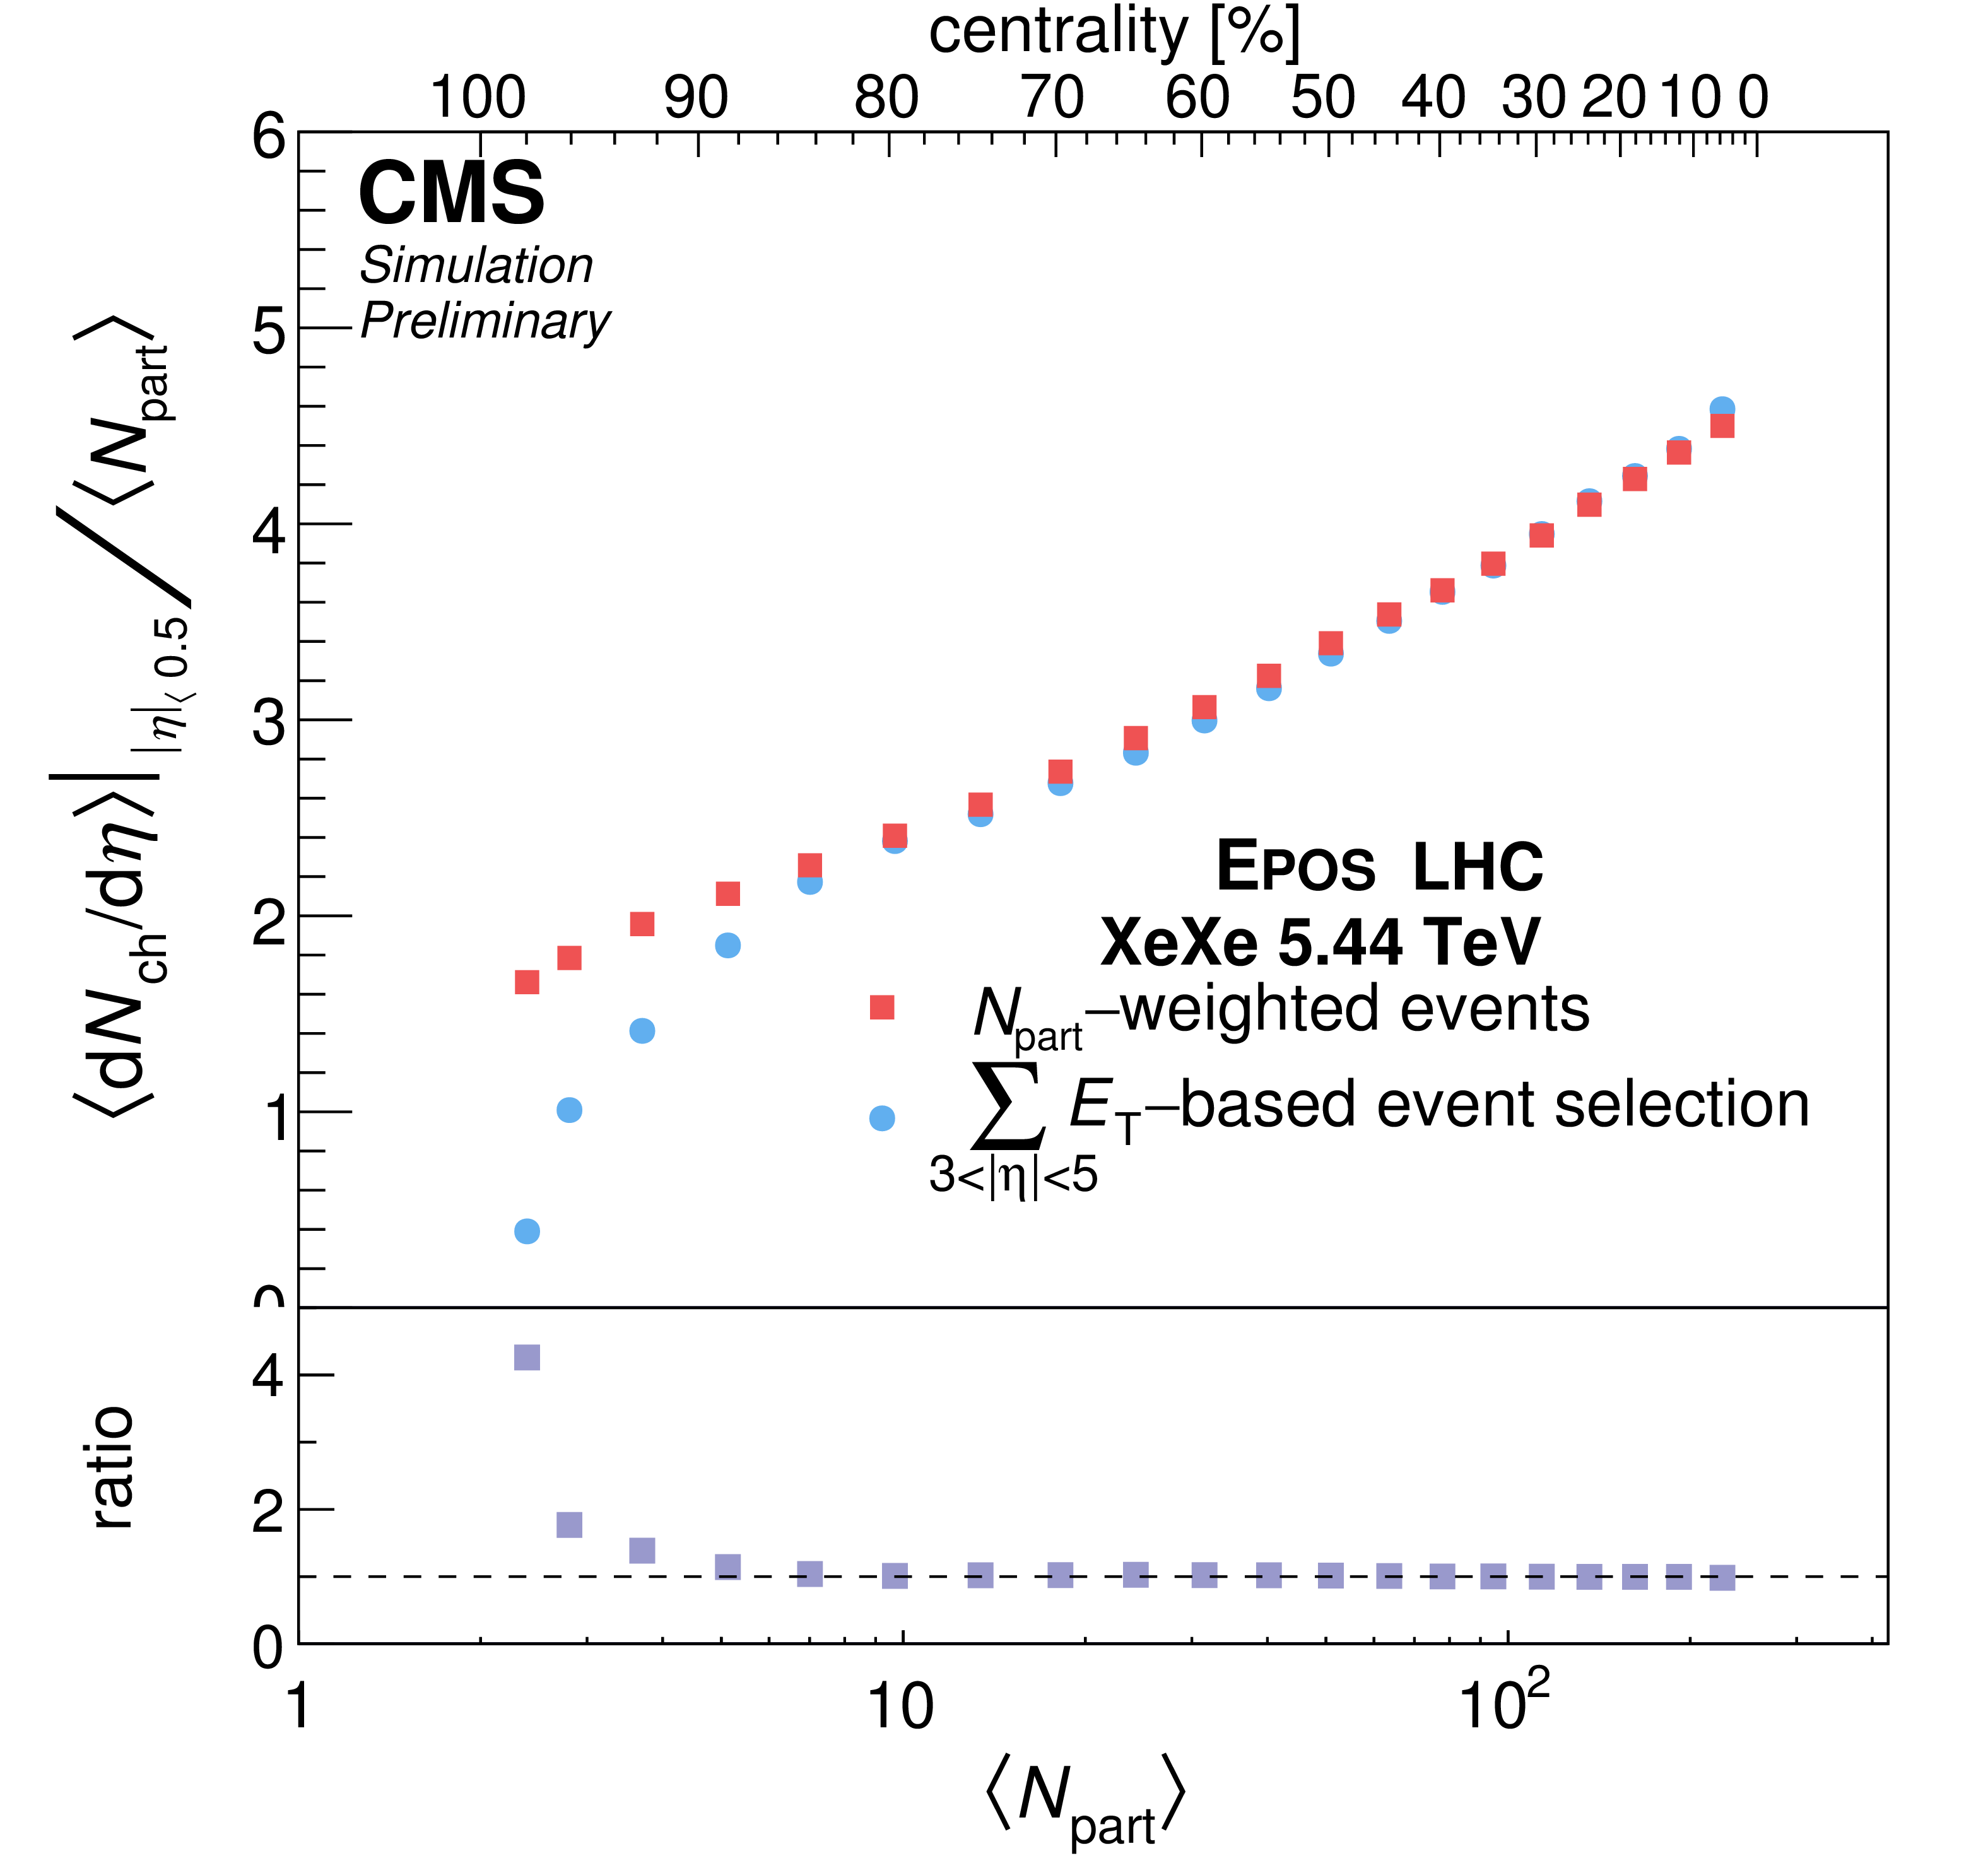
Average $ {\mathrm {d}N_{\mathrm {ch}}/\mathrm {d}\eta} $ at midrapidity normalised by $ < N_{\mathrm {part}} > $, shown as a function of $ < N_{\mathrm {part}} > $. The normalised $ {\mathrm {d}N_{\mathrm {ch}}/\mathrm {d}\eta} $ values are obtained from simulations generated with the Epos [1] (LHC tune [2]) event generator and are shown for two event selections. The blue circles correspond to events selected using the experimental definition of centrality, i.e., selected based on the sum of transverse energy in the HF calorimeters. The red squares correspond to events weighted such that the ${N_{\mathrm {part}}}$ distribution is identical to those selected by the former method, at each point. The ratio of the two values, which corresponds to the bias introduced when selecting events based on the sum of transverse energy in the forward region, is shown in the bottom panel. |
| References | ||||
| 1 | J. C. Collins and M. J. Perry | Superdense Matter: Neutrons Or Asymptotically Free Quarks? | PRL 34 (1975) 1353 | |
| 2 | N. Cabibbo and G. Parisi | Exponential hadronic spectrum and quark liberation | PLB 59 (1975) 67 | |
| 3 | D. Kharzeev and M. Nardi | Hadron production in nuclear collisions at RHIC and high density QCD | PLB 507 (2001) 121 | nucl-th/0012025 |
| 4 | N. Armesto | Predictions for the heavy-ion programme at the Large Hadron Collider | in Quark-gluon plasma 4, R. C. Hwa and X.-N. Wang, eds., p. 375 World Scientific Publishing Company | 0903.1330 |
| 5 | D. d'Enterria et al. | Constraints from the first LHC data on hadronic event generators for ultra-high energy cosmic-ray physics | Astropart. Phys. 35 (2011) 98 | 1101.5596 |
| 6 | PHOBOS Collaboration | System size, energy and centrality dependence of pseudorapidity distributions of charged particles in relativistic heavy ion collisions | PRL 102 (2009) 142301 | 0709.4008 |
| 7 | K. Werner, F.-M. Liu, and T. Pierog | Parton ladder splitting and the rapidity dependence of transverse momentum spectra in deuteron-gold collisions at RHIC | PRC 74 (2006) 044902 | hep-ph/0506232 |
| 8 | T. Pierog et al. | EPOS LHC: Test of collective hadronization with data measured at the CERN Large Hadron Collider | PRC 92 (2015) 034906 | 1306.0121 |
| 9 | I. P. Lokhtin and A. M. Snigirev | A model of jet quenching in ultrarelativistic heavy ion collisions and high-$ {p_{\mathrm{T}}} $ hadron spectra at RHIC | EPJC 45 (2006) 211 | hep-ph/0506189 |
| 10 | Z.-W. Lin et al. | A multi-phase transport model for relativistic heavy ion collisions | PRC 72 (2005) 064901 | nucl-th/0411110 |
| 11 | V. N. Gribov | A Reggeon diagram technique | Sov. Phys. JETP 26 (1968) 414.[Zh. Eksp. Teor. Fiz.53,654(1967)] | |
| 12 | H. J. Drescher et al. | Parton based Gribov-Regge theory | PR 350 (2001) 93 | hep-ph/0007198 |
| 13 | X.-N. Wang and M. Gyulassy | HIJING: A Monte Carlo model for multiple jet production in pp, pA and AA collisions | PRD 44 (1991) 3501 | |
| 14 | B. Zhang | ZPC 1.0.1: A parton cascade for ultrarelativistic heavy ion collisions | CPC 109 (1998) 193 | nucl-th/9709009 |
| 15 | B.-A. Li and C. M. Ko | Formation of superdense hadronic matter in high-energy heavy ion collisions | PRC 52 (1995) 2037 | nucl-th/9505016 |
| 16 | W.-T. Deng, X.-N. Wang, and R. Xu | Gluon shadowing and hadron production in heavy-ion collisions at LHC | PLB 701 (2011) 133 | 1011.5907 |
| 17 | CMS Collaboration | Transverse momentum and pseudorapidity distributions of charged hadrons in pp collisions at $ \sqrt{s} = $ 0.9 and 2.36 TeV | JHEP 02 (2010) 041 | CMS-QCD-09-010 1002.0621 |
| 18 | CMS Collaboration | Transverse-momentum and pseudorapidity distributions of charged hadrons in pp collisions at $ \sqrt{s} = $ 7 TeV | PRL 105 (2010) 022002 | CMS-QCD-10-006 1005.3299 |
| 19 | CMS Collaboration | Charged particle multiplicities in pp interactions at $ \sqrt{s}= $ 0.9 , 2.36, and 7 TeV | JHEP 01 (2011) 079 | CMS-QCD-10-004 1011.5531 |
| 20 | CMS, TOTEM Collaboration | Measurement of pseudorapidity distributions of charged particles in proton-proton collisions at $ \sqrt{s} = $ 8 TeV by the CMS and TOTEM experiments | EPJC 74 (2014) 3053 | 1405.0722 |
| 21 | CMS Collaboration | Pseudorapidity distribution of charged hadrons in proton-proton collisions at $ \sqrt{s} = $ 13 TeV | PLB 751 (2015) 143 | CMS-FSQ-15-001 1507.05915 |
| 22 | CMS Collaboration | Pseudorapidity distributions of charged hadrons in proton-lead collisions at $ \sqrt{s_{_\mathrm{NN}}}= $ 5.02 and 8.16 TeV | JHEP 01 (2018) 045 | CMS-HIN-16-021 1710.09355 |
| 23 | CMS Collaboration | Dependence on pseudorapidity and centrality of charged hadron production in PbPb collisions at a nucleon-nucleon centre-of-mass energy of 2.76 TeV | JHEP 08 (2011) 141 | CMS-HIN-10-001 1107.4800 |
| 24 | CMS Collaboration | The CMS experiment at the CERN LHC | JINST 3 (2008) S08004 | CMS-00-001 |
| 25 | CMS Collaboration | Observation and studies of jet quenching in PbPb collisions at nucleon-nucleon center-of-mass energy = 2.76 TeV | PRC 84 (2011) 024906 | CMS-HIN-10-004 1102.1957 |
| 26 | S. R. Klein et al. | STARlight: A Monte Carlo simulation program for ultra-peripheral collisions of relativistic ions | CPC 212 (2017) 258 | 1607.03838 |
| 27 | S. Roesler, R. Engel, and J. Ranft | The Monte Carlo event generator DPMJET-III | in Advanced Monte Carlo for radiation physics, particle transport simulation and applications. Proceedings, Conference, MC2000, Lisbon, Portugal, October 23-26, 2000, p. 1033 2000 | hep-ph/0012252 |
| 28 | GEANT4 Collaboration | GEANT4 --- a simulation toolkit | NIMA 506 (2003) 250 | |
| 29 | ALICE Collaboration | Centrality dependence of the pseudorapidity density distribution for charged particles in Pb-Pb collisions at $ {\sqrt {\smash [b]{s_{_{\mathrm {NN}}}}}} = $ 2.76 TeV | PLB 726 (2013) 610 | 1304.0347 |
| 30 | ALICE Collaboration | Centrality dependence of the pseudorapidity density distribution for charged particles in Pb-Pb collisions at $ {\sqrt {\smash [b]{s_{_{\mathrm {NN}}}}}} = $ 5.02 TeV | PLB 772 (2017) 567 | 1612.08966 |
| 31 | C. Loizides and A. Morsch | Absence of jet quenching in peripheral nucleus-nucleus collisions | PLB 773 (2017) 408 | 1705.08856 |
| 32 | ALICE Collaboration | Centrality dependence of the charged-particle multiplicity density at mid-rapidity in Pb-Pb collisions at $ {\sqrt {\smash [b]{s_{_{\mathrm {NN}}}}}} = $ 2.76 TeV | PRL 106 (2011) 032301 | 1012.1657 |
| 33 | ALICE Collaboration | Centrality dependence of the charged-particle multiplicity density at midrapidity in Pb-Pb collisions at $ {\sqrt {\smash [b]{s_{_{\mathrm {NN}}}}}} = $ 5.02 TeV | PRL 116 (2016) 222302 | 1512.06104 |
| 34 | M. L. Miller, K. Reygers, S. J. Sanders, and P. Steinberg | Glauber modeling in high energy nuclear collisions | Ann. Rev. Nucl. Part. Sci. 57 (2007) 205 | nucl-ex/0701025 |
| 35 | C. Loizides, J. Kamin, and D. d'Enterria | Precision Monte Carlo Glauber predictions at present and future nuclear colliders | 1710.07098 | |
|
|
Compact Muon Solenoid LHC, CERN |
|

|

|

|

|

|