

Compact Muon Solenoid
LHC, CERN
| CMS-PAS-HIN-15-006 | ||
| Multiplicity and rapidity dependence of strange hadron spectra in pp, pPb, and PbPb collisions at LHC energies | ||
| CMS Collaboration | ||
| October 2015 | ||
| Abstract: Measurements of strange hadron ($\mathrm{K}^{0}_{s}$, $\Lambda^{+}+\Lambda^{-}$ and $\Xi^{+}+\Xi^{-}$) transverse momentum ($p_{\mathrm{T}}$) spectra in pp, pPb and PbPb collisions are presented over a wide range in charge-particle multiplicity and particle rapidity. The data were taken with the CMS detector at the LHC for pp collisions at $\sqrt{s} =$ 7 TeV, pPb collisions at $\sqrt{s_{NN}} =$ 5.02 TeV and PbPb collisions at $\sqrt{s_{NN}} =$ 2.76 TeV. The average transverse kinetic energy ($KE^{}_{\mathrm{T}}$) is found to increase with event multiplicity, with a faster rate for heavier particle species. At similar multiplicities, the separation in the $KE^{}_{\mathrm{T}}$ between different particle species is observed to be larger for pp and pPb systems than PbPb system. In pPb collisions, the average $KE^{}_{\mathrm{T}}$ is found to be larger in the Pb-going direction than in the p-going direction. This trend of asymmetry becomes more evident for heavier particle species as event multiplicity increases. The data are compared to models motivated by hydrodynamics. | ||
|
Links:
CDS record (PDF) ;
Public twiki page ;
CADI line (restricted) ; Figures are also available from the CDS record. These preliminary results are superseded in this paper, PLB 768 (2017) 103. The superseded preliminary plots can be found here. |
||
| Figures | |
png ; pdf |
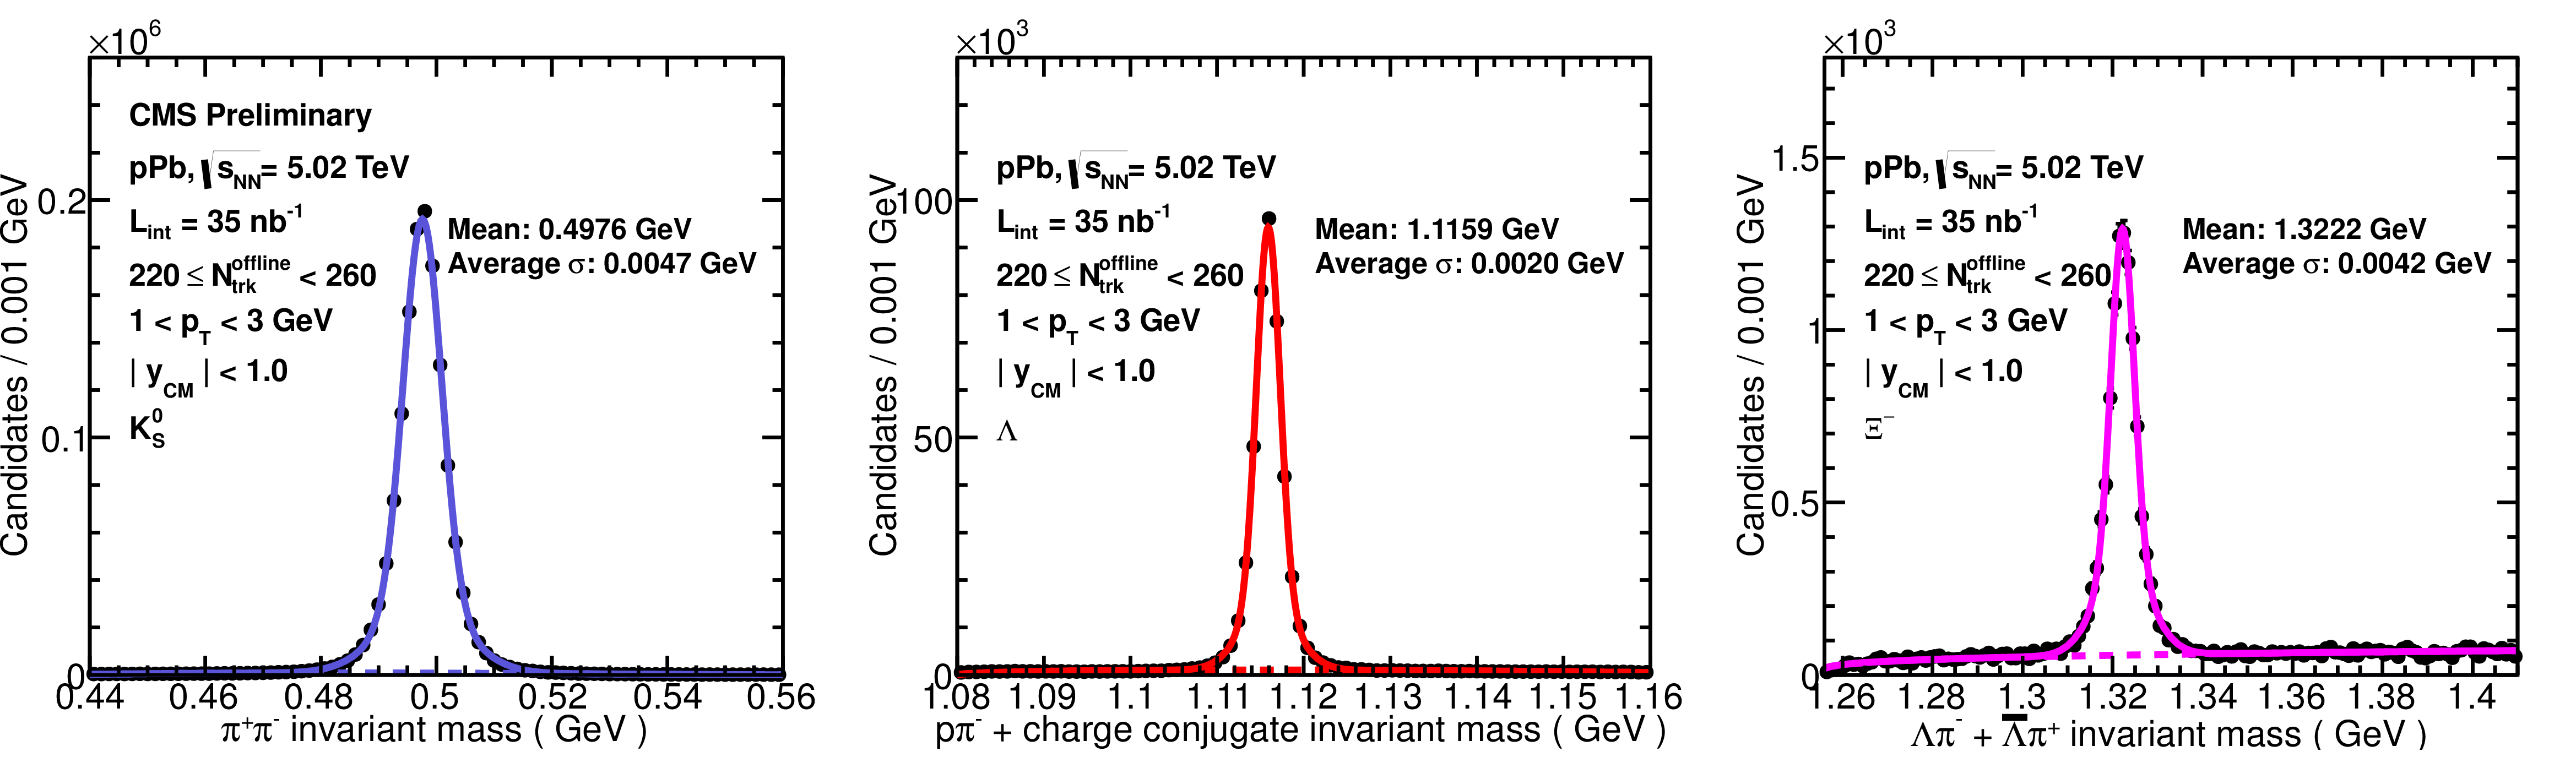
Figure 1:
Invariant mass distribution of $ {\mathrm {K^0_S}}$ (left), $ {\Lambda }$ (middle) and $ {\Xi ^\mathrm {-}}$ (right) candidates in the $ {p_{\mathrm {T}}} $ range of 1-3 GeV for $220 \leq {N_\mathrm {trk}^\mathrm {offline}} < 260$ in pPb collisions at $ {\sqrt {s_{_{NN}}}} =$ 5.02 TeV. The solid line shows the fit function of a double Gaussian plus a background fitting function(dashed line). For $ {\mathrm {K^0_S}}$, the background function form is quadratic. For $ {\Lambda }$ a background function form as $Aq^{0.5}+Bq^{1.5}$ is used, where $q = m - (m_{p} + m_{\pi })$. For $ {\Xi ^\mathrm {-}}$, the background is described by a function form as $Aq^{B}$, where $q = m - (m_{ {\Lambda }} + m_{\pi })$. |
png ; pdf |
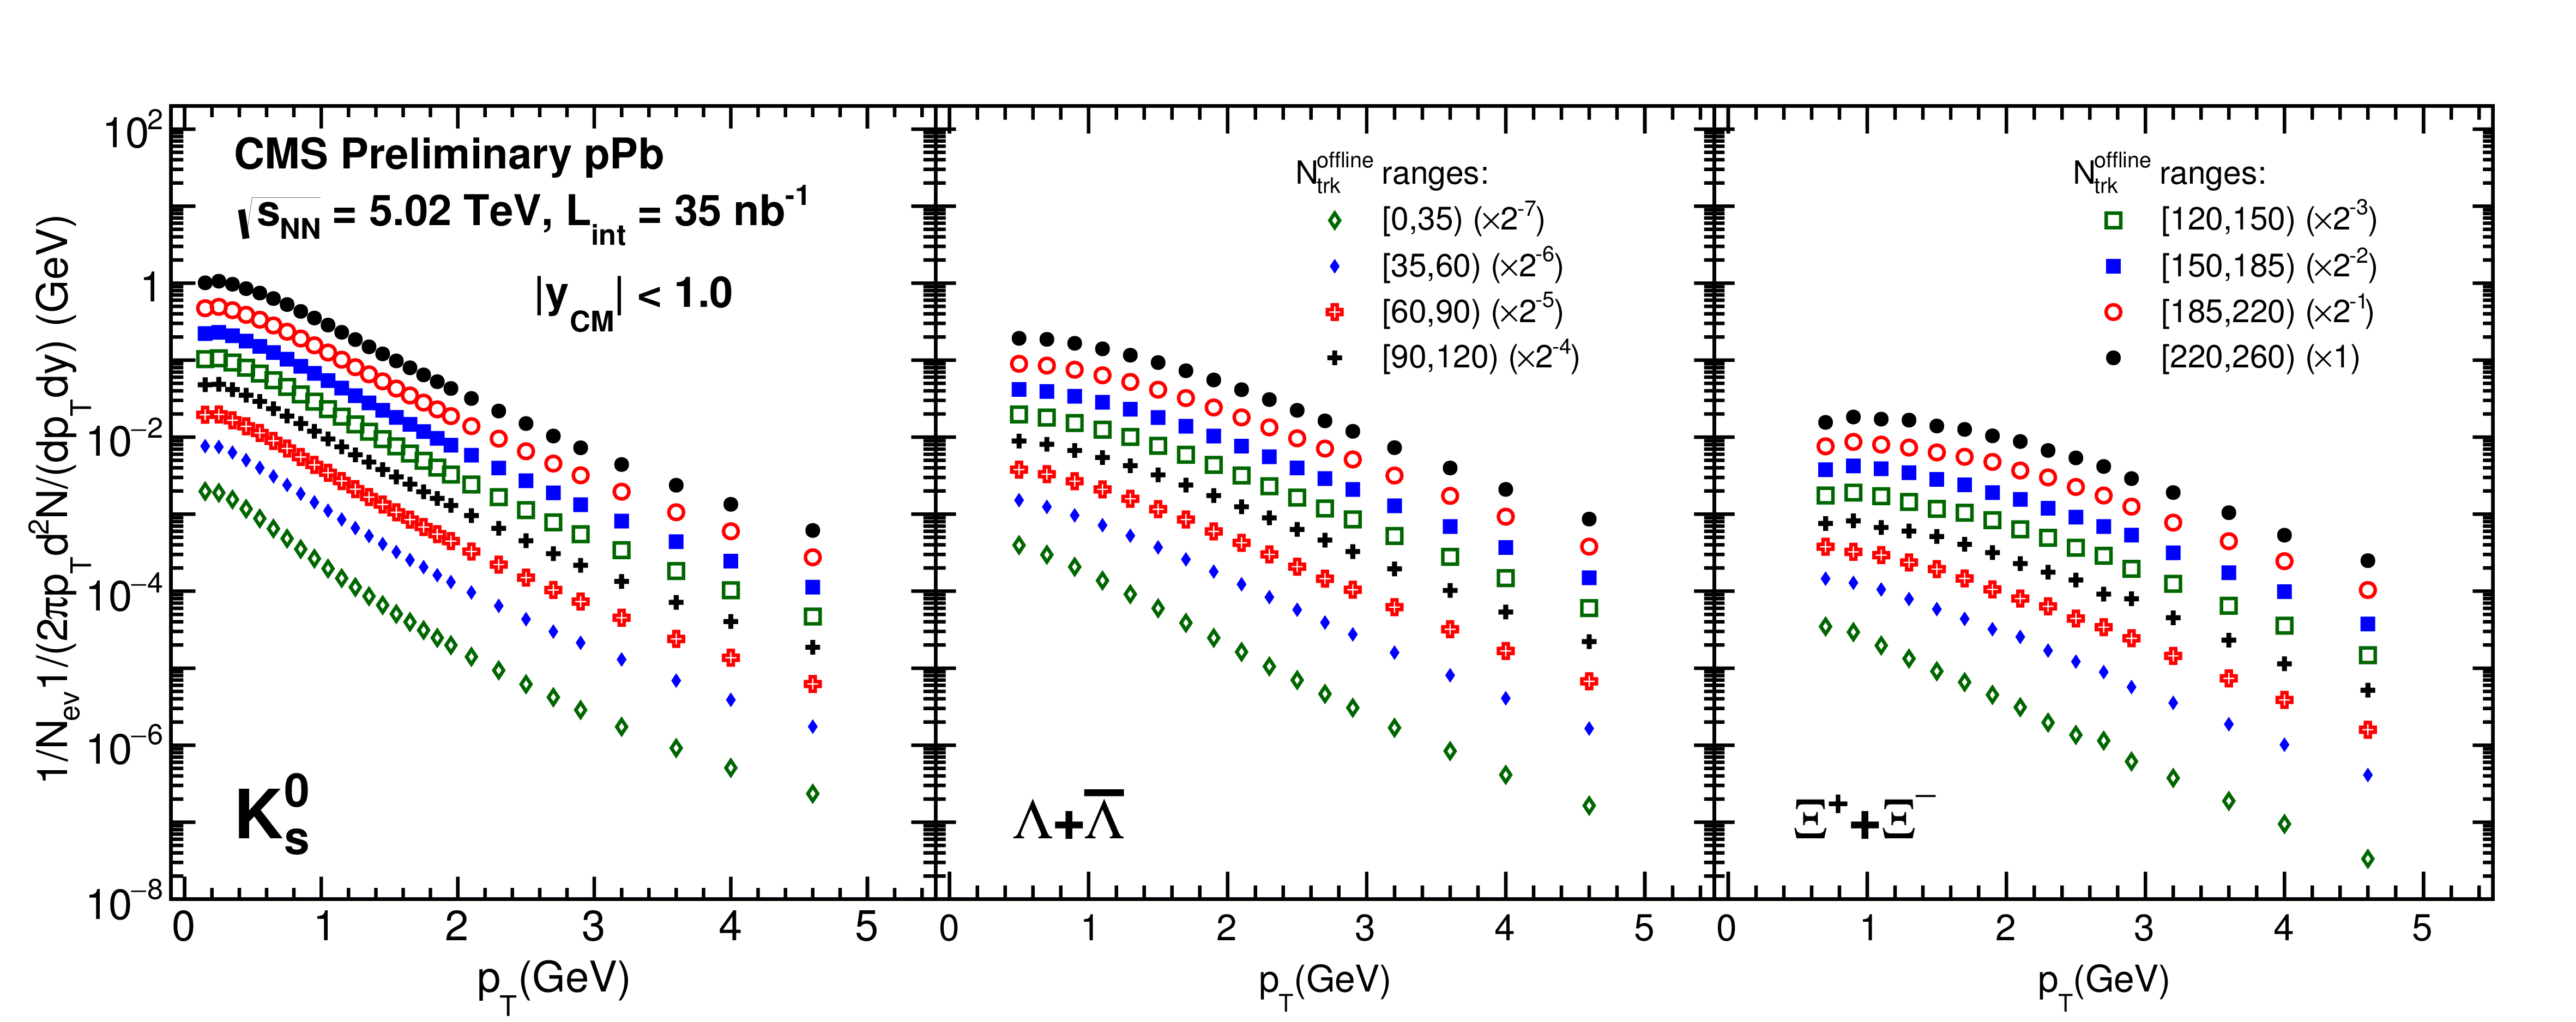
Figure 2-a:
Invariant $ {p_{\mathrm {T}}} $ spectra of $ {\mathrm {K^0_S}}$, $ {\Lambda }$, and $ {\Xi ^\mathrm {-}}$ in the center-of-mass rapidity range $|y_{\rm cm}| < 1$ in pPb collisions at $ {\sqrt {s_{_{NN}}}} =$ 5.02 TeV (a), PbPb collisions at $ {\sqrt {s_{_{NN}}}} =$ 2.76 TeV (b), and pp collisions at $ {\sqrt {s}} =$ 7 TeV (c) for different event multiplicity classes. In each panel from high to low multiplicity classes, data are scaled by $2^n$ factors for better visibility. |
png ; pdf |
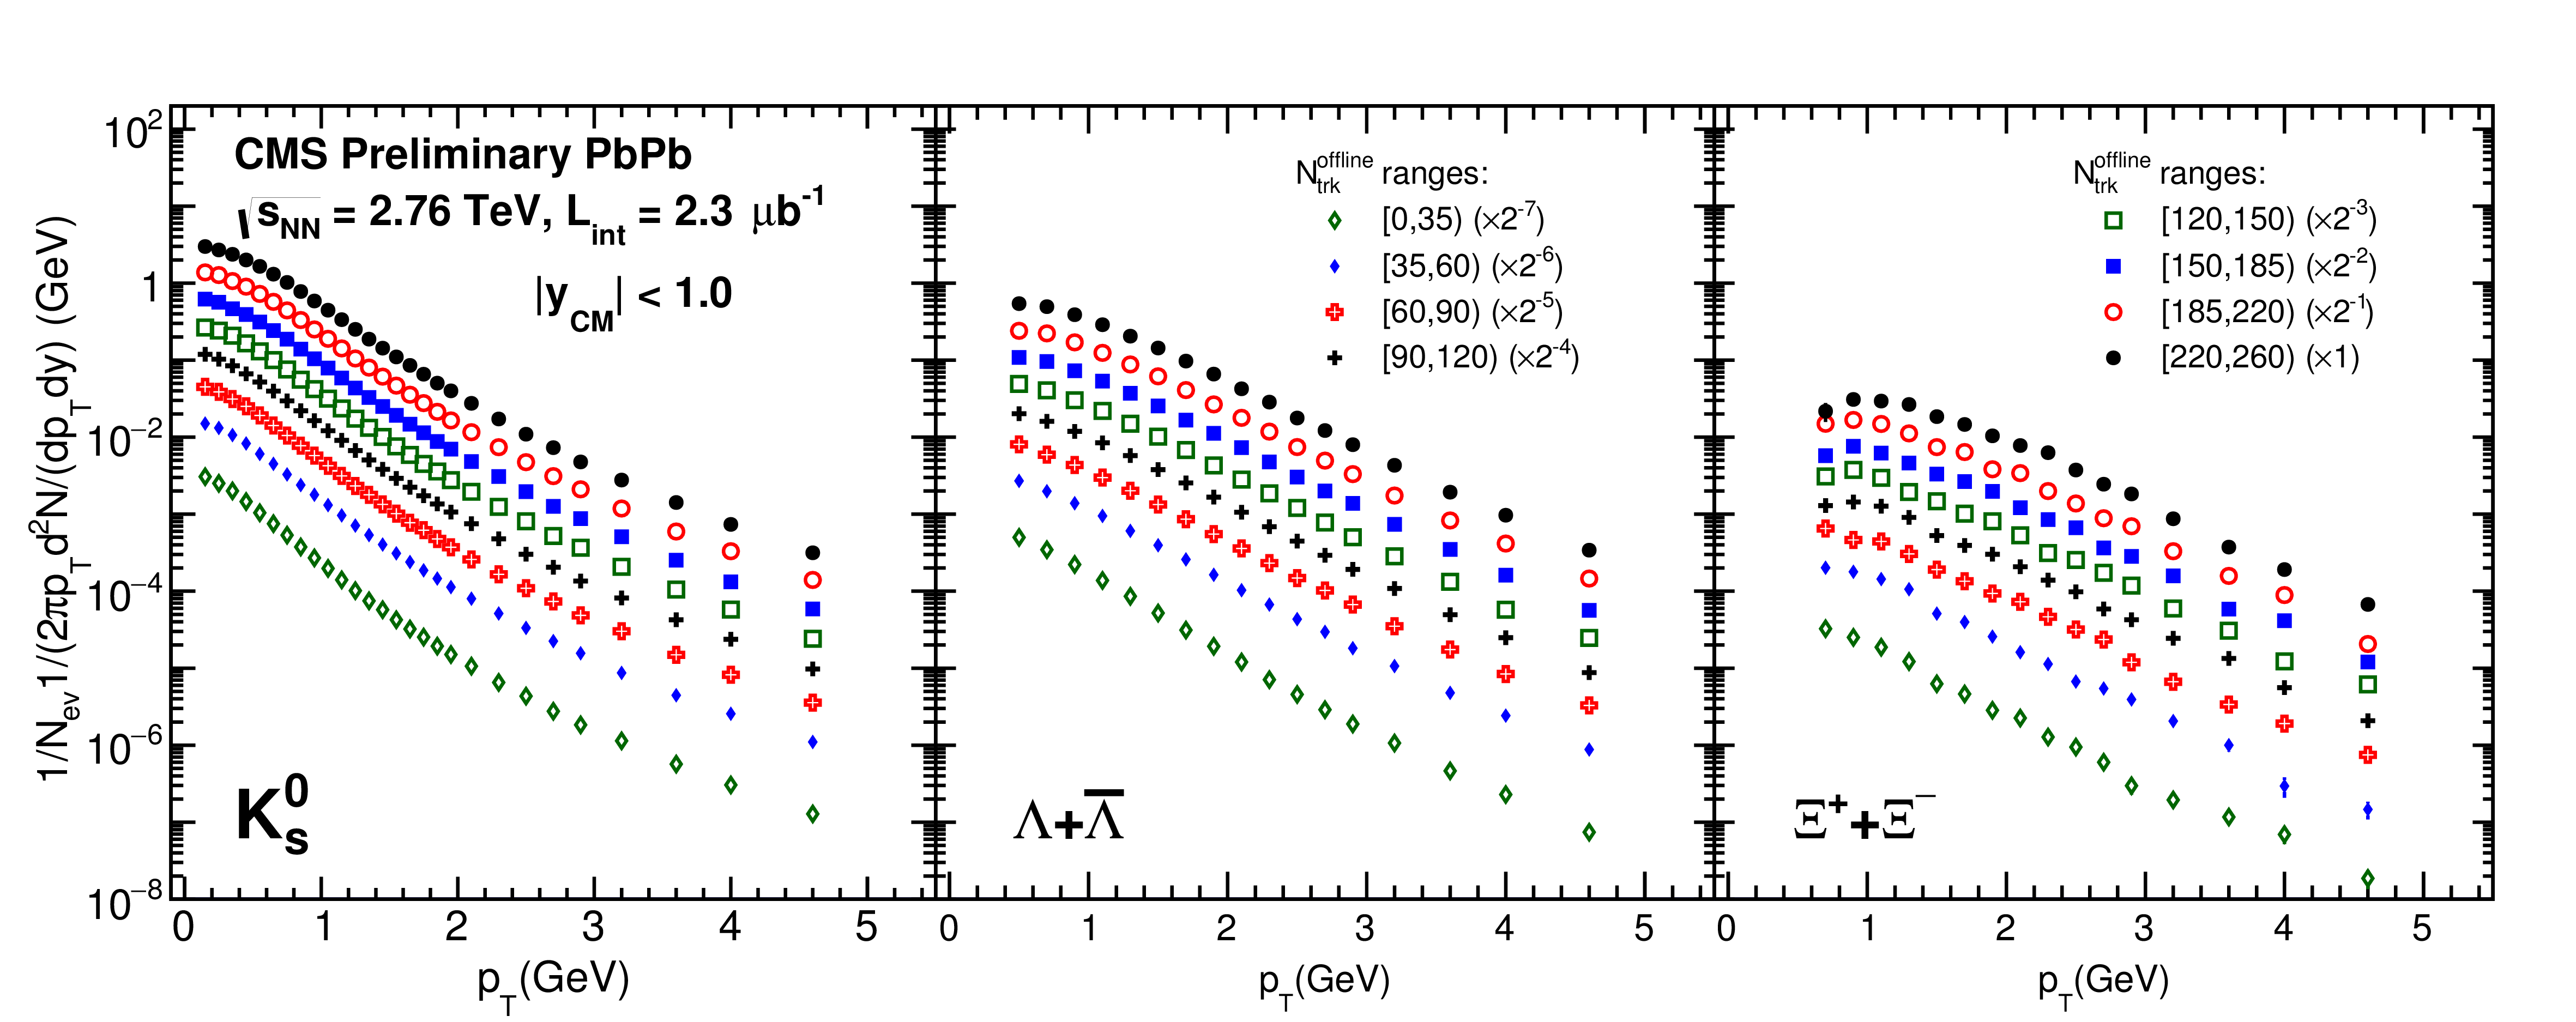
Figure 2-b:
Invariant $ {p_{\mathrm {T}}} $ spectra of $ {\mathrm {K^0_S}}$, $ {\Lambda }$, and $ {\Xi ^\mathrm {-}}$ in the center-of-mass rapidity range $|y_{\rm cm}| < 1$ in pPb collisions at $ {\sqrt {s_{_{NN}}}} =$ 5.02 TeV (a), PbPb collisions at $ {\sqrt {s_{_{NN}}}} =$ 2.76 TeV (b), and pp collisions at $ {\sqrt {s}} =$ 7 TeV (c) for different event multiplicity classes. In each panel from high to low multiplicity classes, data are scaled by $2^n$ factors for better visibility. |
png ; pdf |
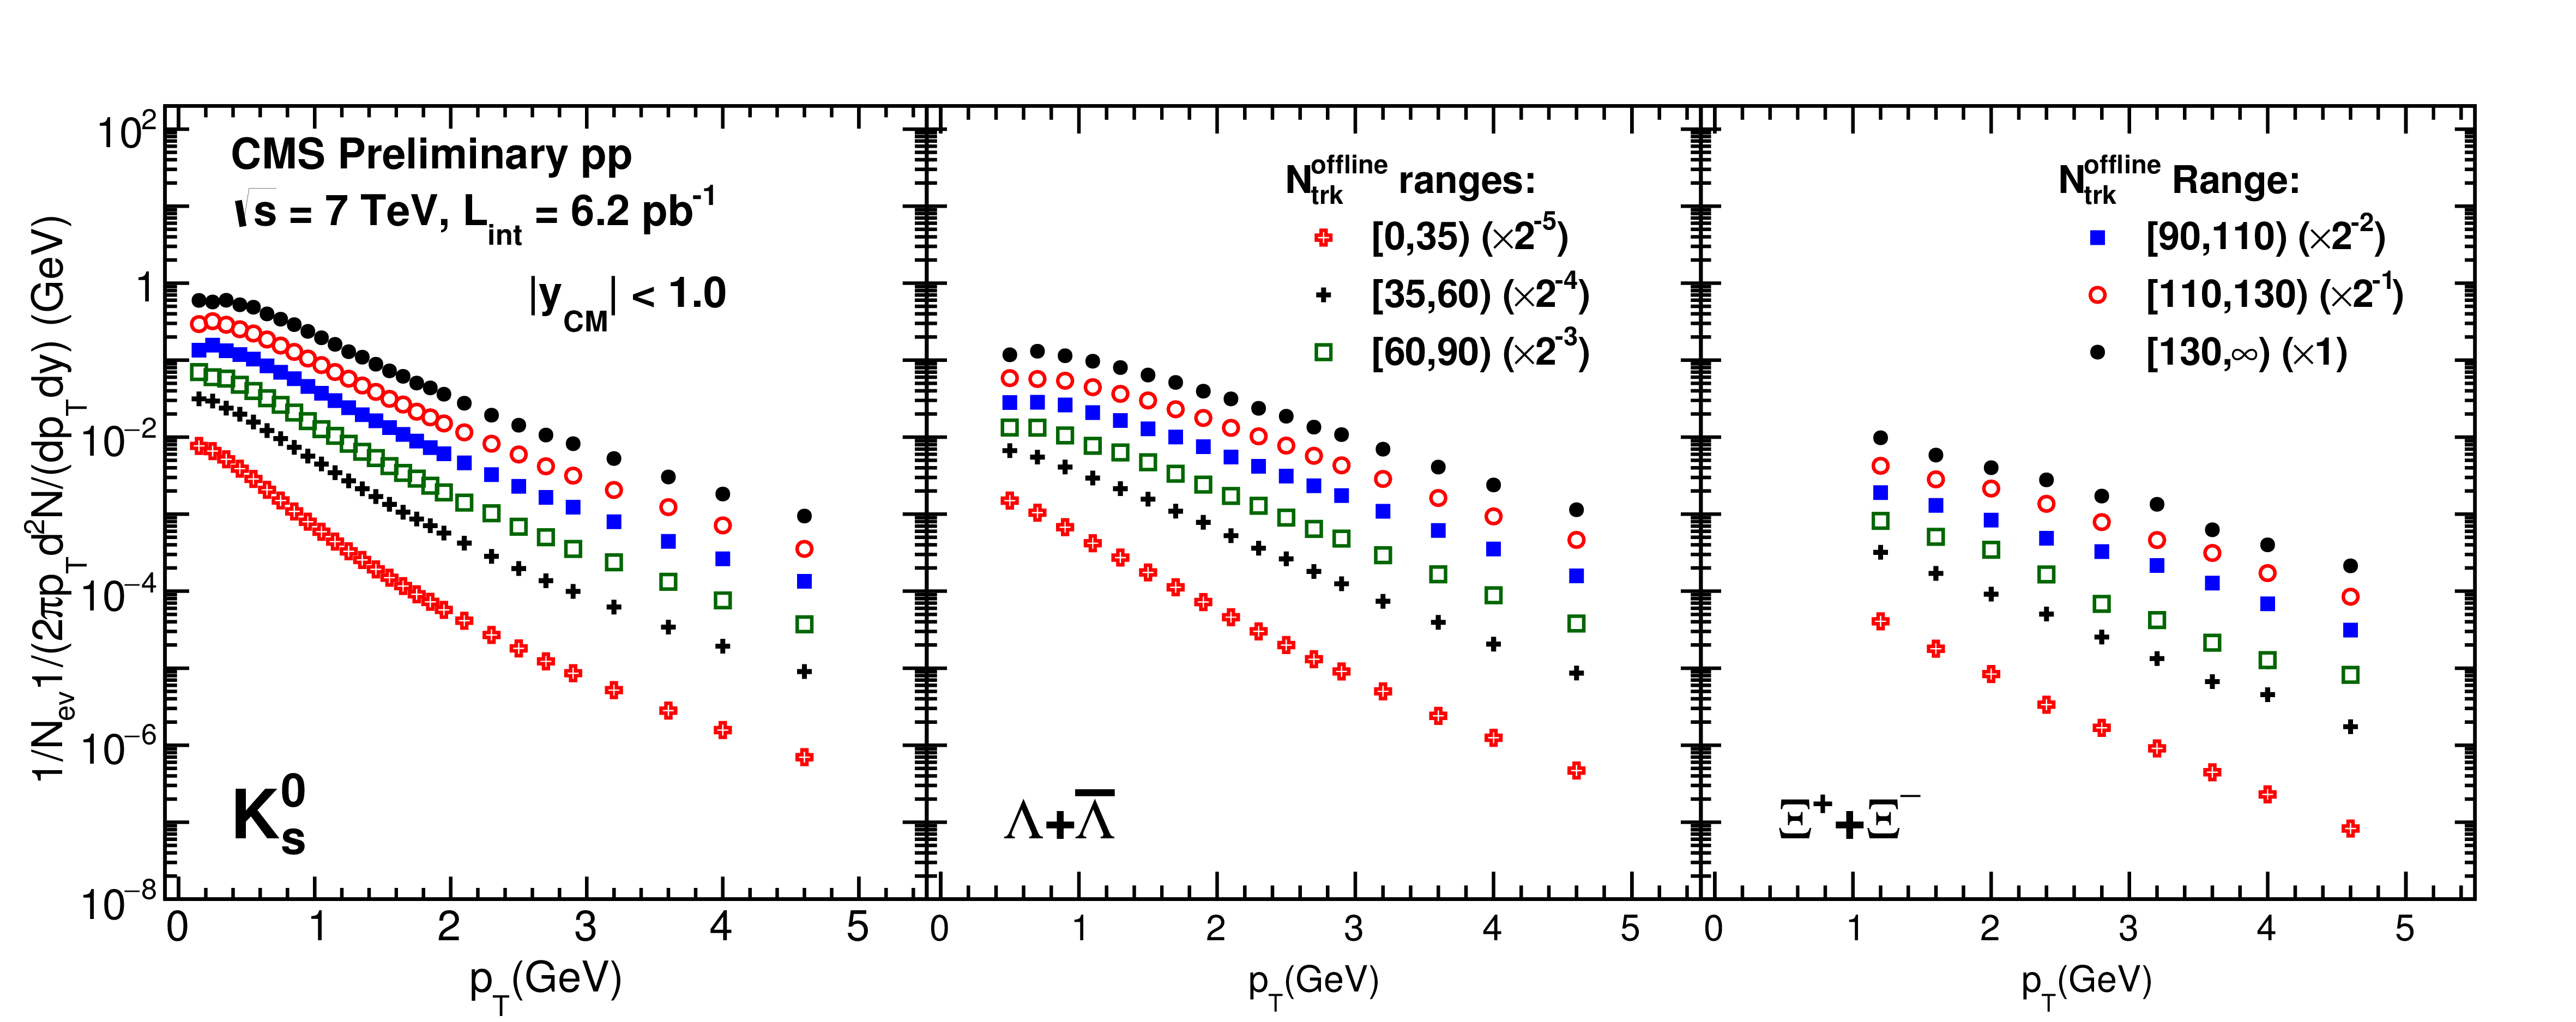
Figure 2-c:
Invariant $ {p_{\mathrm {T}}} $ spectra of $ {\mathrm {K^0_S}}$, $ {\Lambda }$, and $ {\Xi ^\mathrm {-}}$ in the center-of-mass rapidity range $|y_{\rm cm}| < 1$ in pPb collisions at $ {\sqrt {s_{_{NN}}}} =$ 5.02 TeV (a), PbPb collisions at $ {\sqrt {s_{_{NN}}}} =$ 2.76 TeV (b), and pp collisions at $ {\sqrt {s}} =$ 7 TeV (c) for different event multiplicity classes. In each panel from high to low multiplicity classes, data are scaled by $2^n$ factors for better visibility. |
png ; pdf |
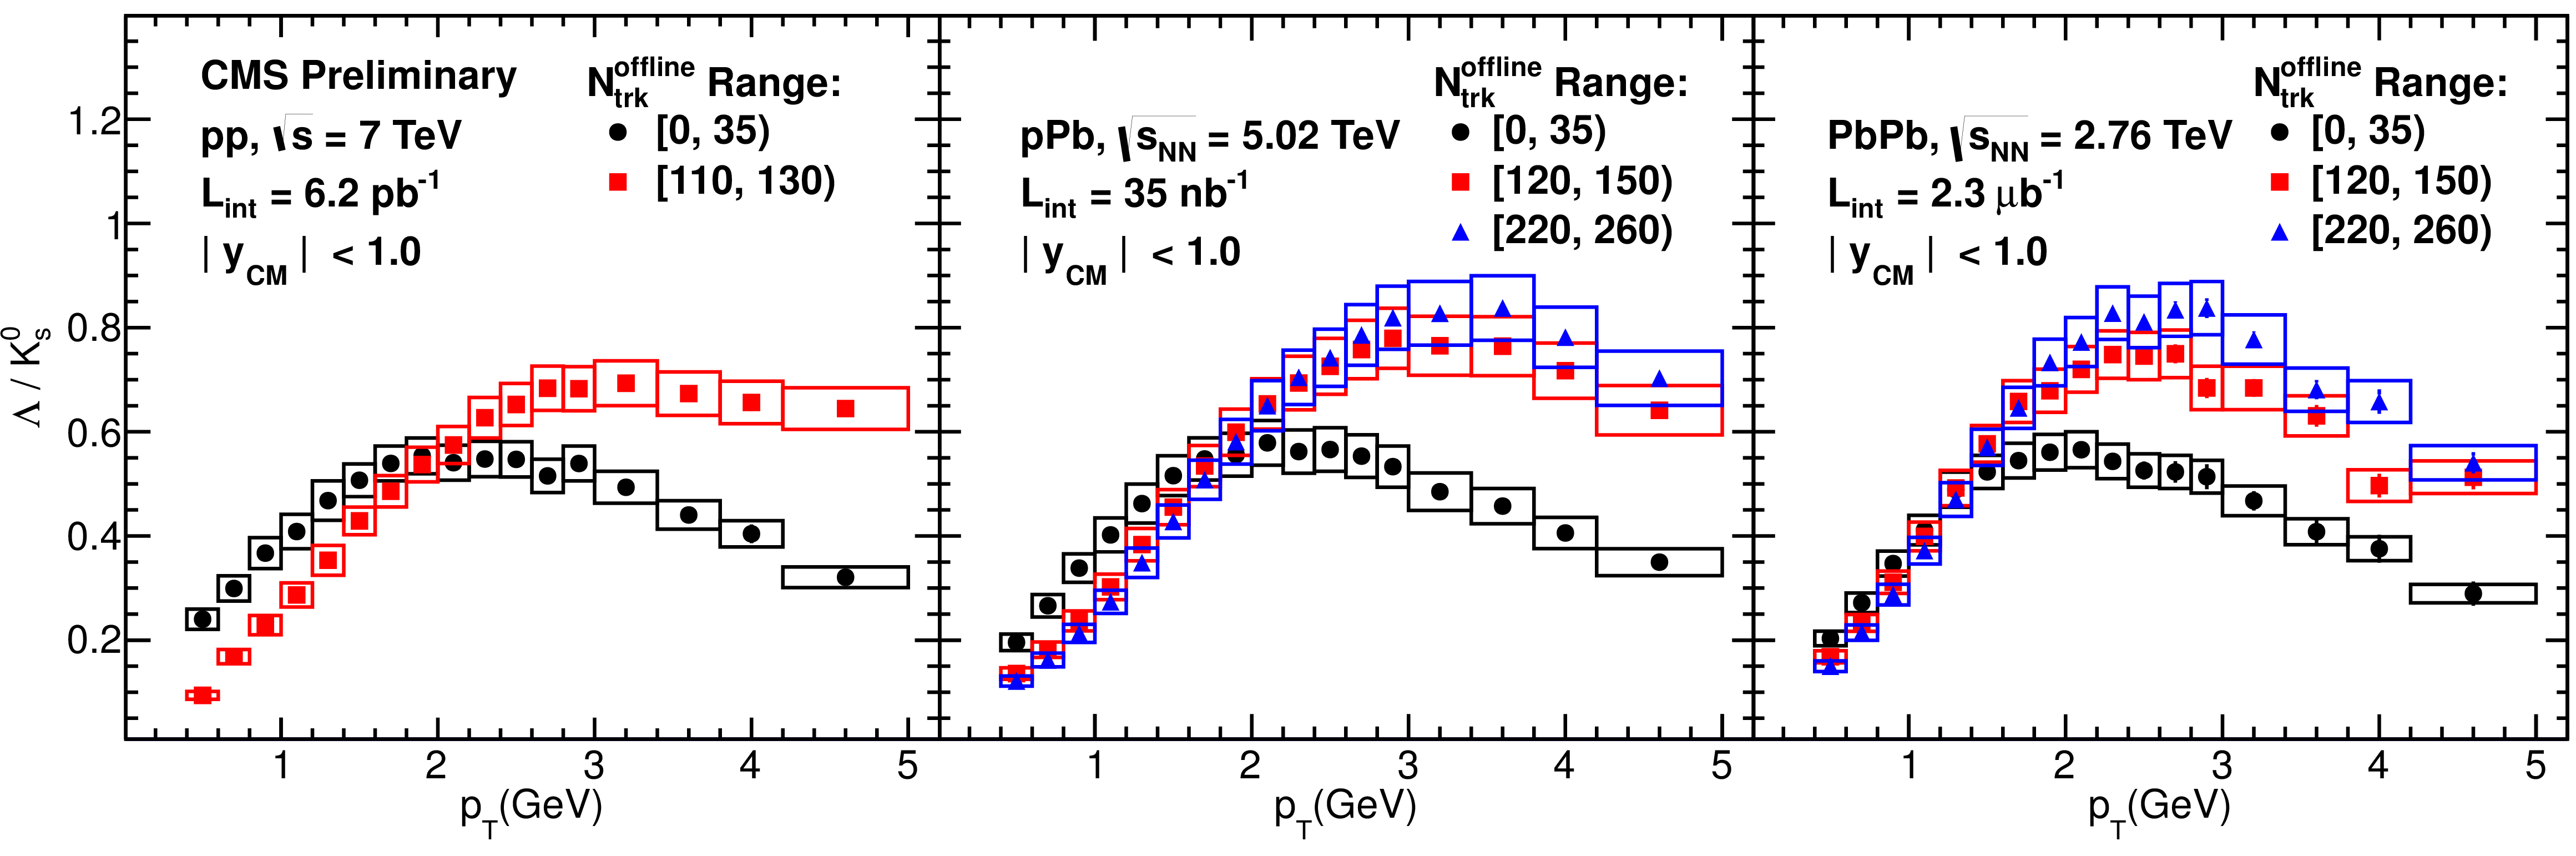
Figure 3-a:
Ratios of invariant $ {p_{\mathrm {T}}} $ spectra for $ {\Lambda } / {\mathrm {K^0_S}}$ (a) and $ {\Xi ^\mathrm {-}}/ {\Lambda }$ (b) in the center-of-mass rapidity range $|y_{\rm cm}| < 1.0$ in pp collisions at $ {\sqrt {s_{_{NN}}}} =$ 7 TeV (left), pPb collisions at $ {\sqrt {s_{_{NN}}}} =$ 5.02 TeV (middle), and PbPb collisions at $ {\sqrt {s}} =$ 2.76 TeV \ (right). Two (for pp) or three (for pPb and PbPb) representative multiplicity classes (highest and lowest) are presented. The error bars represent the statistical uncertainties, while the boxes denote the systematic uncertainties. |
png ; pdf |
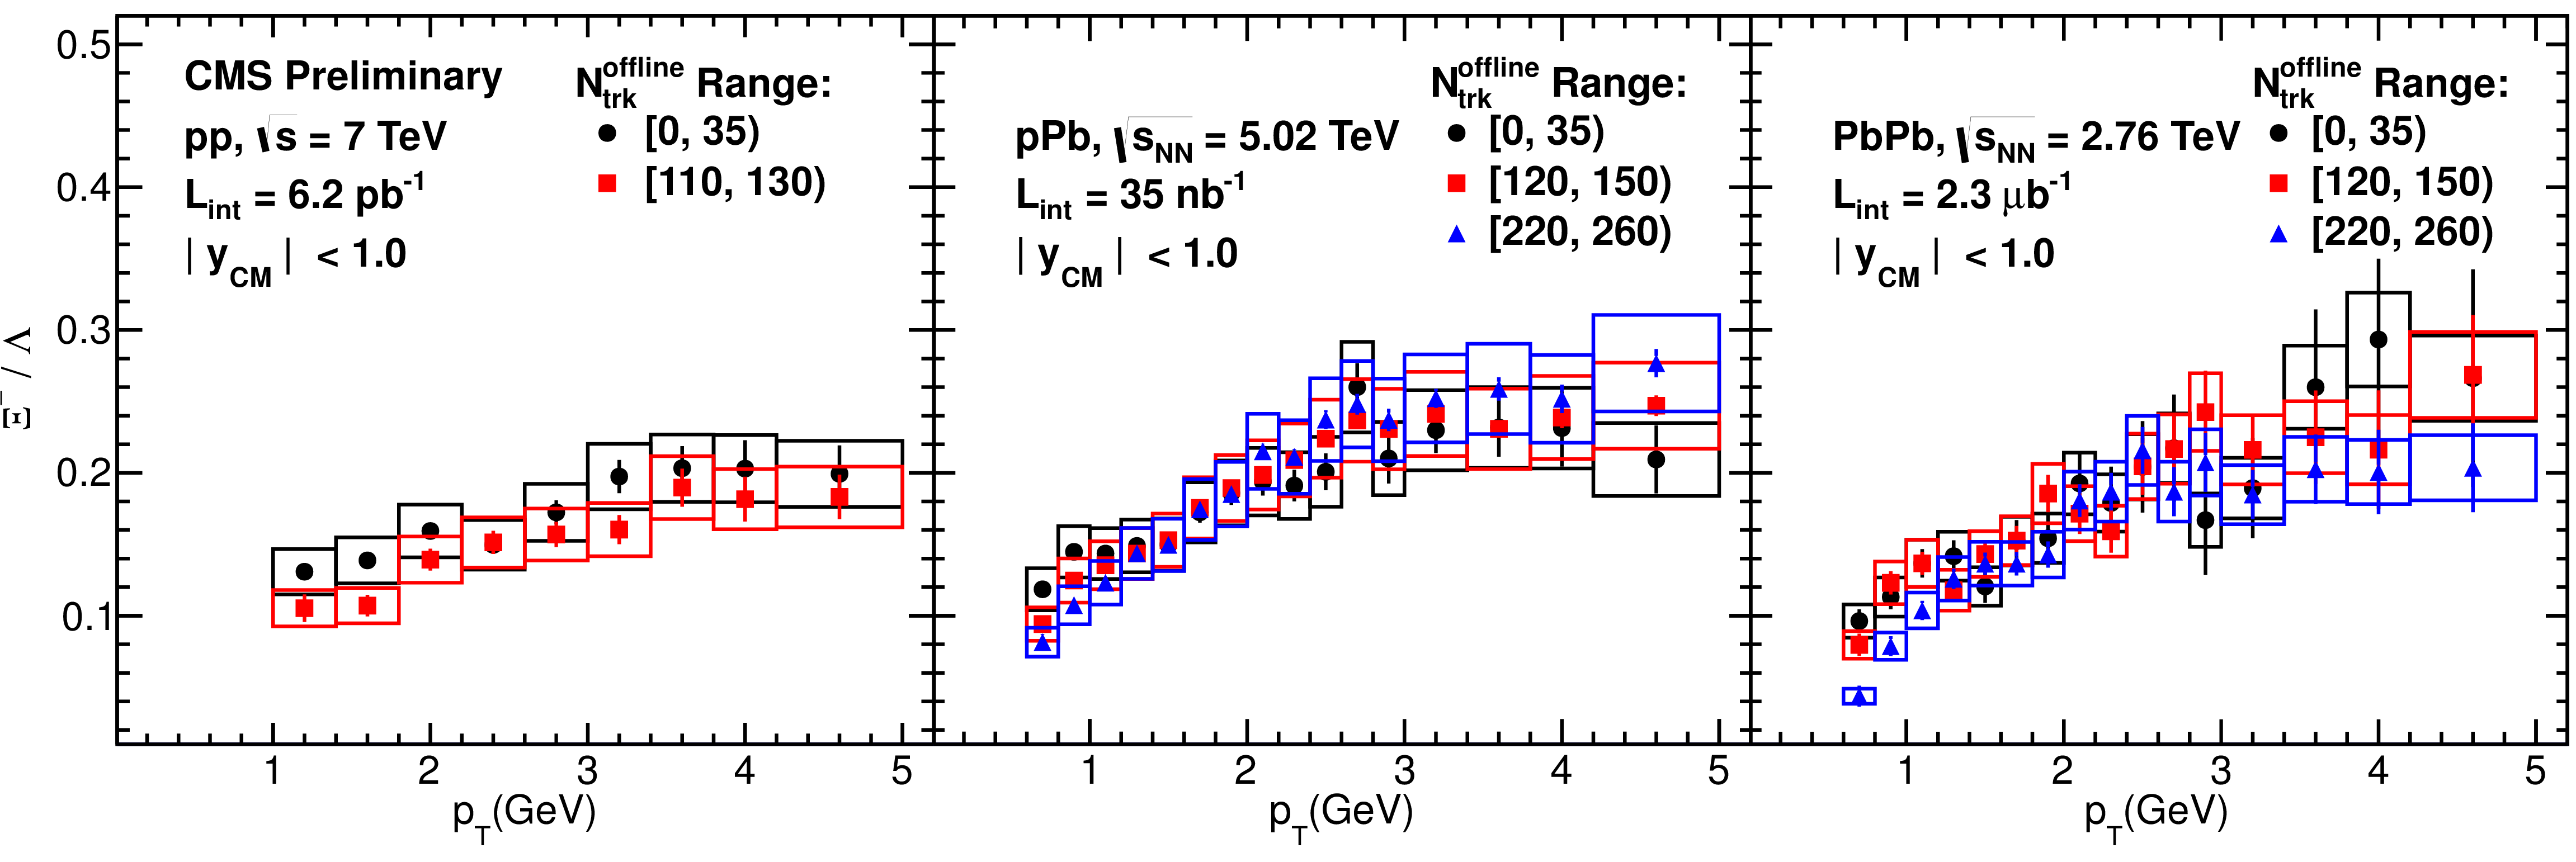
Figure 3-b:
Ratios of invariant $ {p_{\mathrm {T}}} $ spectra for $ {\Lambda } / {\mathrm {K^0_S}}$ (a) and $ {\Xi ^\mathrm {-}}/ {\Lambda }$ (b) in the center-of-mass rapidity range $|y_{\rm cm}| < 1.0$ in pp collisions at $ {\sqrt {s_{_{NN}}}} =$ 7 TeV (left), pPb collisions at $ {\sqrt {s_{_{NN}}}} =$ 5.02 TeV (middle), and PbPb collisions at $ {\sqrt {s}} =$ 2.76 TeV \ (right). Two (for pp) or three (for pPb and PbPb) representative multiplicity classes (highest and lowest) are presented. The error bars represent the statistical uncertainties, while the boxes denote the systematic uncertainties. |
png ; pdf |
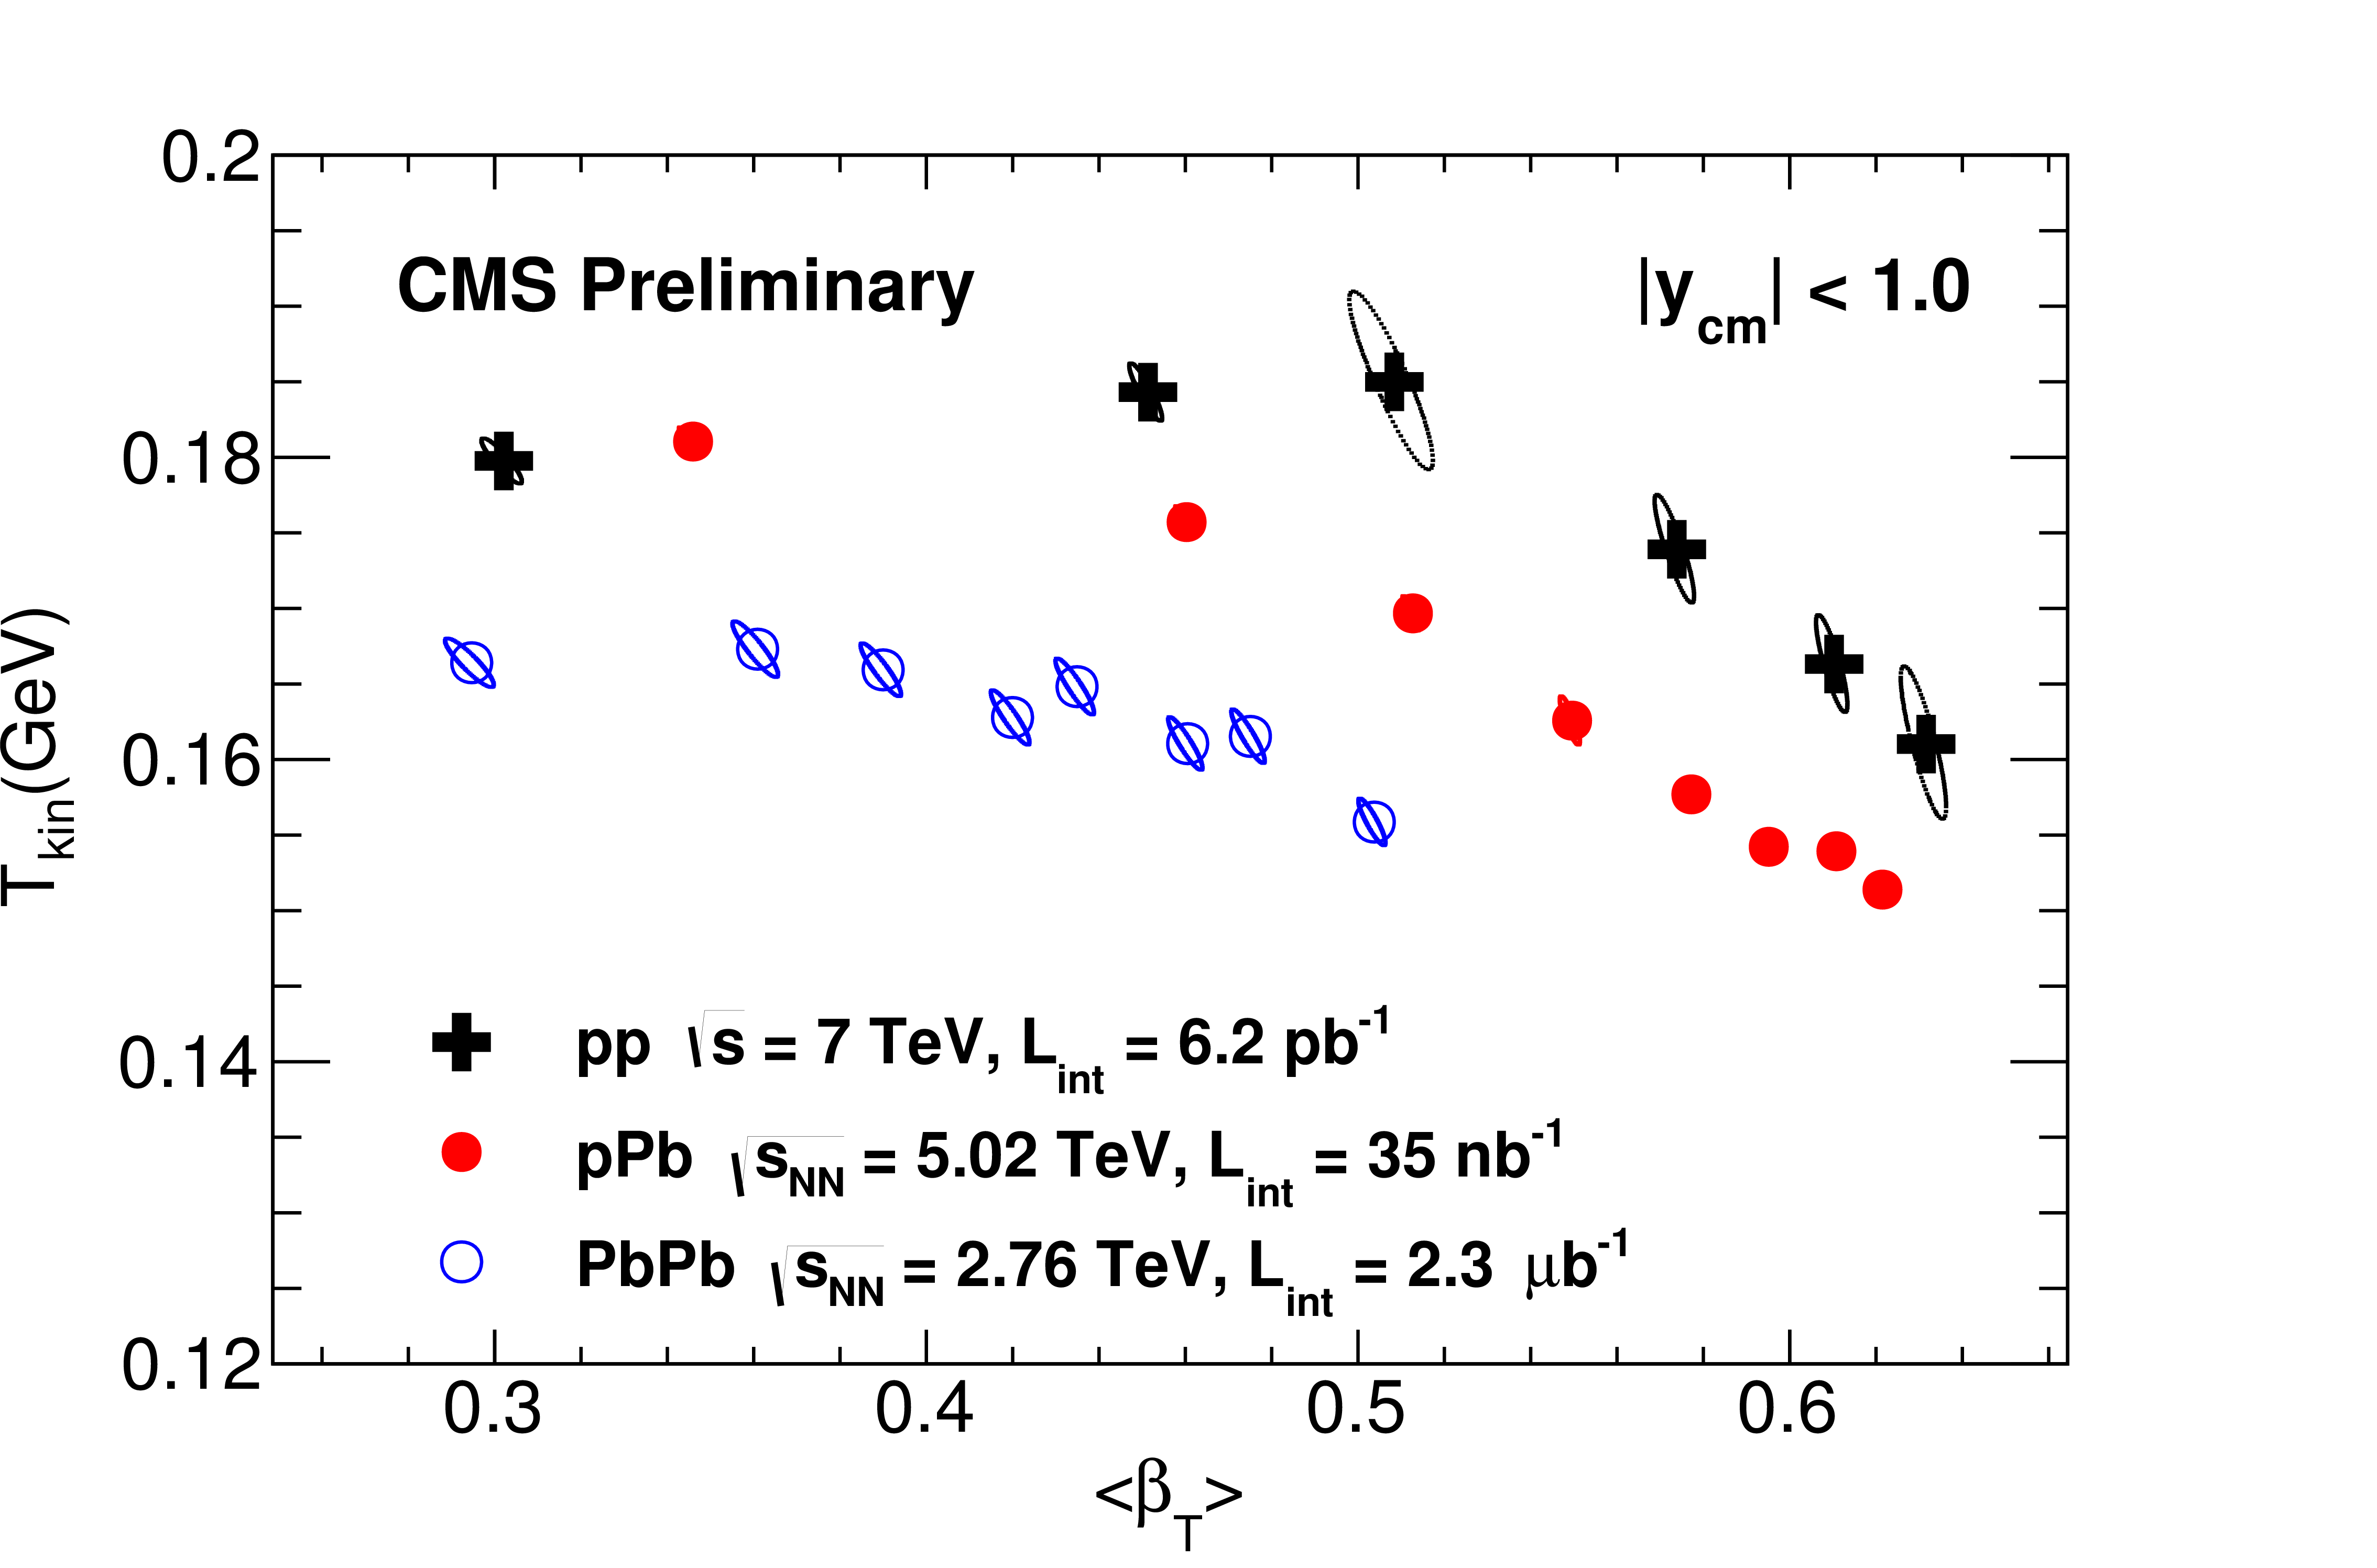
Figure 4:
The extracted kinetic freeze-out temperature, $T_{\rm kin}$, and average radial flow velocity, $< \beta _{\rm T} > $, from simultaneous blast wave fits to $ {\mathrm {K^0_S}}$, $ {\Lambda } $ $ {p_{\mathrm {T}}} $ spectra at $|y_{\rm cm}| < 1$ for different multiplicity classes in pp, pPb and PbPb collisions. The correlation ellipses represent statistical uncertainties, while the systematic uncertainties are not shown on the figure. |
png ; pdf |
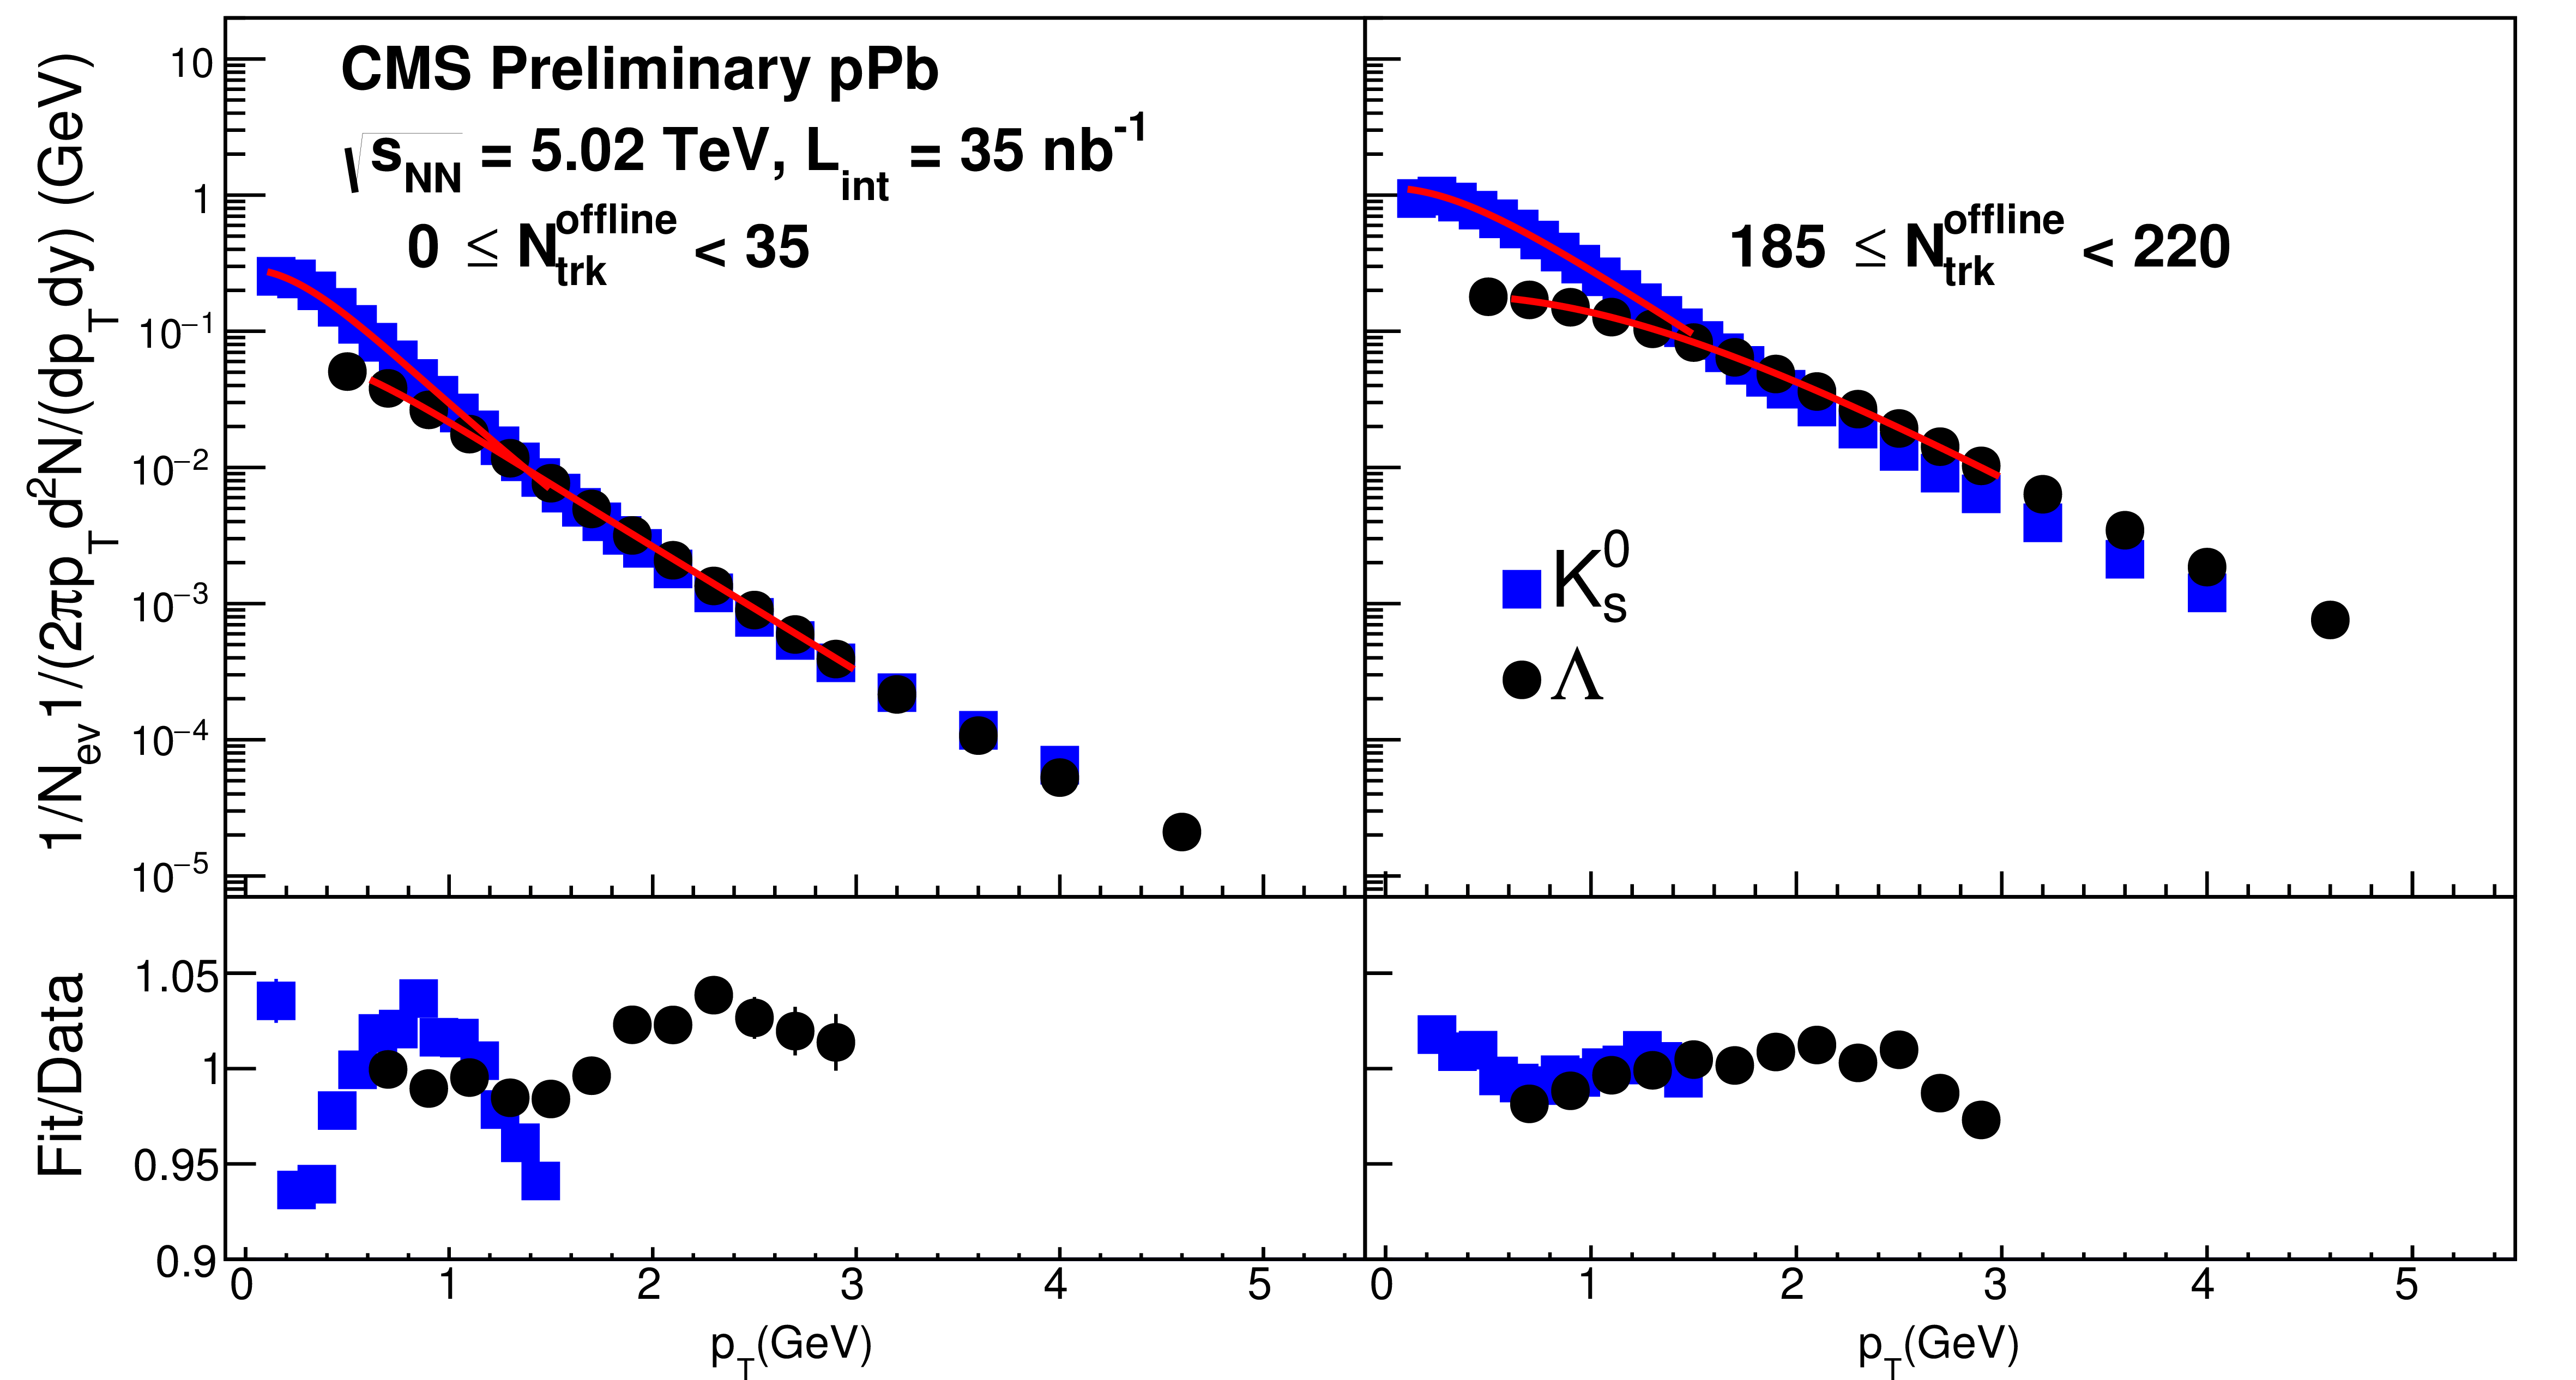
Figure 5:
Examples of simultaneous blast-wave fits of $ {\mathrm {K^0_S}}$ and $ {\Lambda }$ in low- and high-multiplicity pPb events. The ratios of fits to data as function of $ {p_{\mathrm {T}}} $ are shown in the bottom panels. Statistical uncertainties for most of points are too small to be visible. |
png ; pdf |
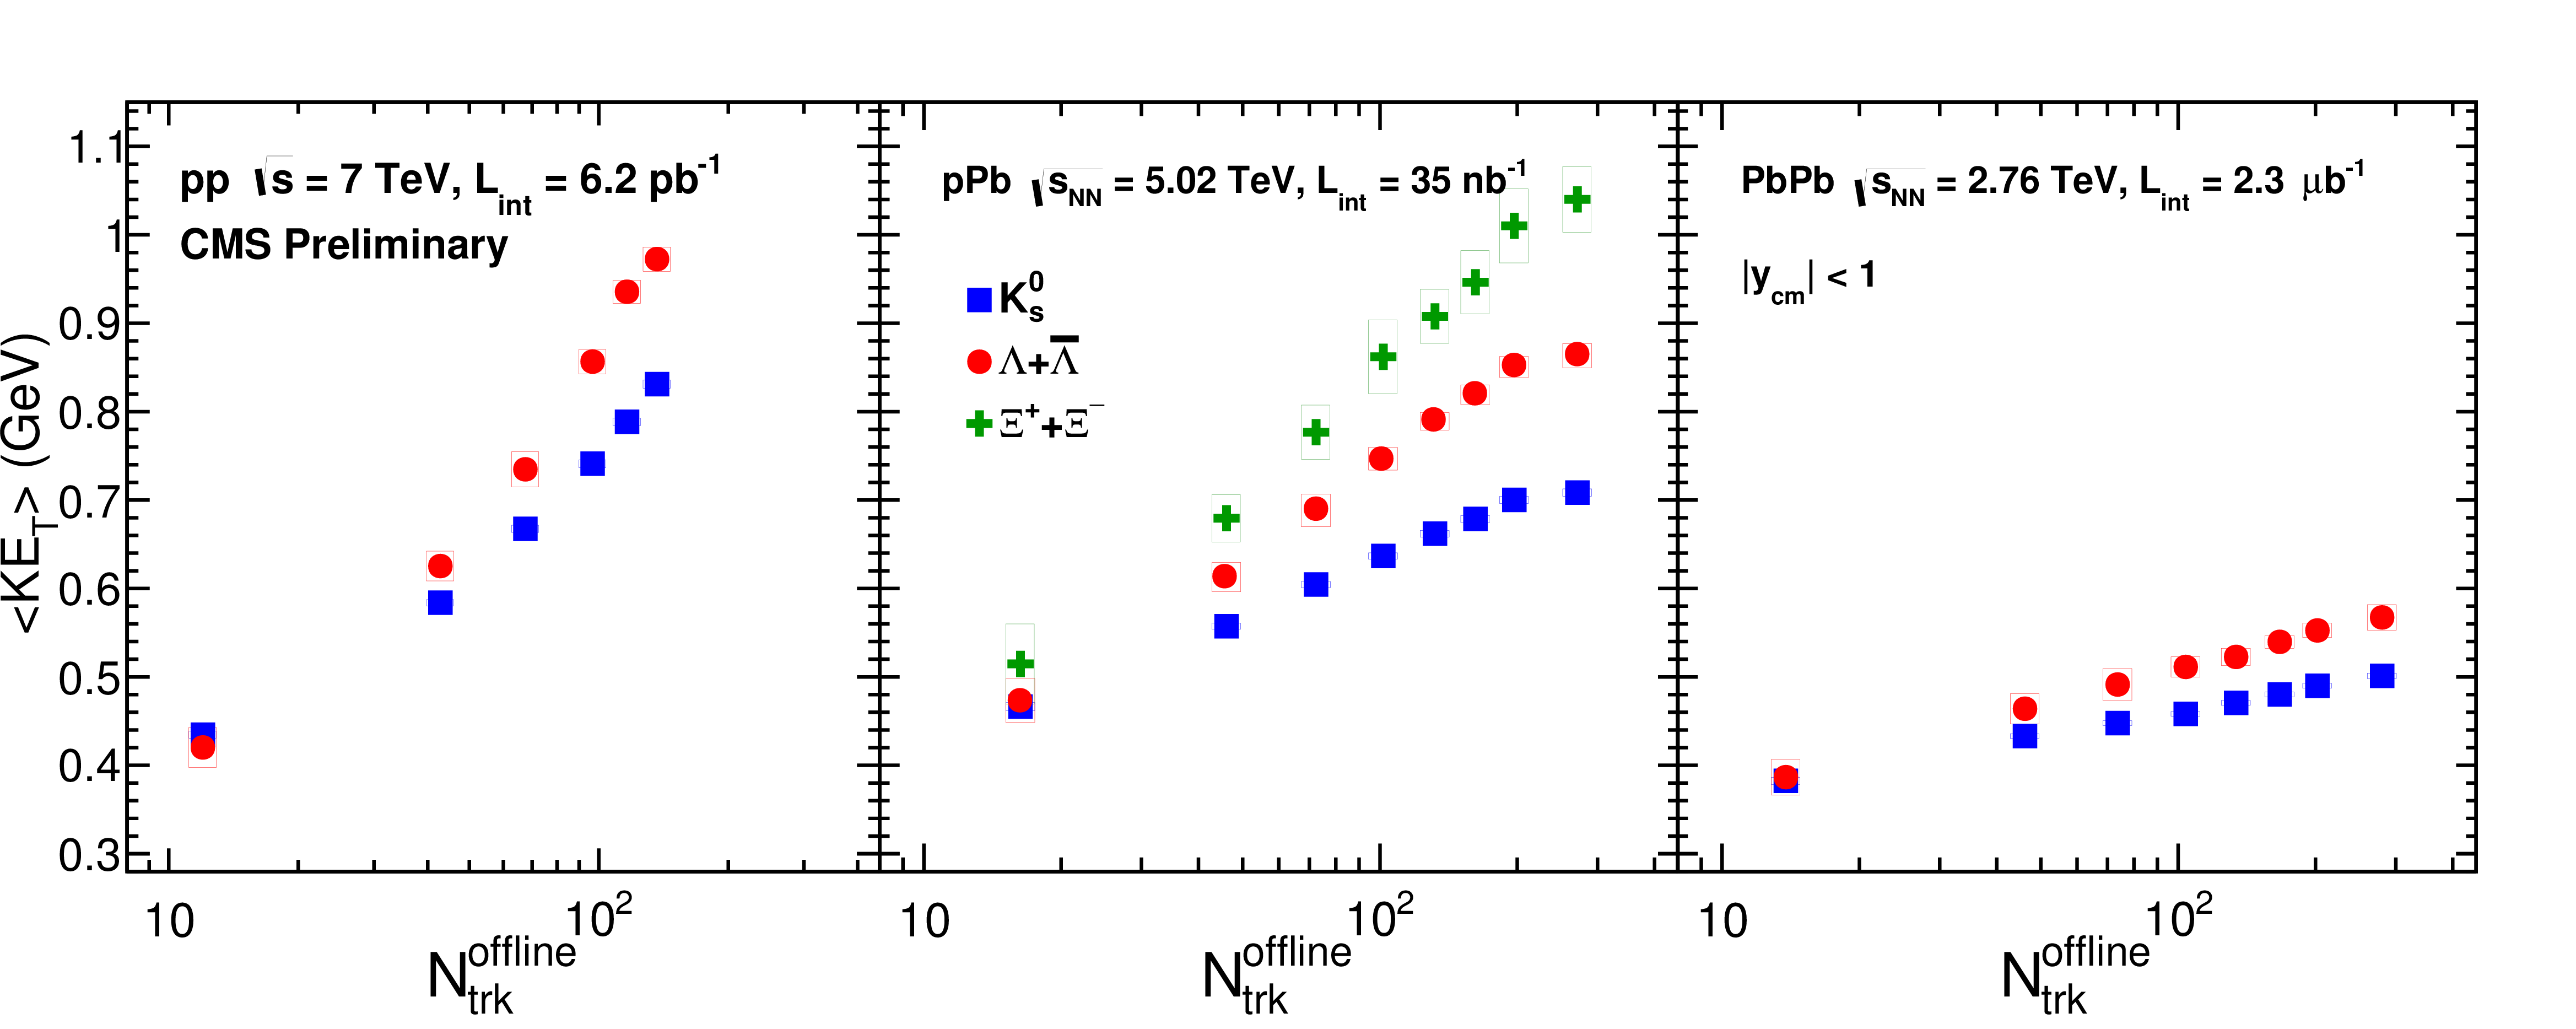
Figure 6:
The average transverse kinetic energy, $< KE^{}_{\mathrm{T}} > $, at $|y_{\rm cm}|<1$ for $ {\mathrm {K^0_S}}$, $ {\Lambda }$ and $ {\Xi ^\mathrm {-}}$ (only pPb) as a function of event multiplicity in pp, pPb and PbPb collisions. The error bars represent the statistical uncertainties, while the boxes denote the systematic uncertainties. |
png ; pdf |
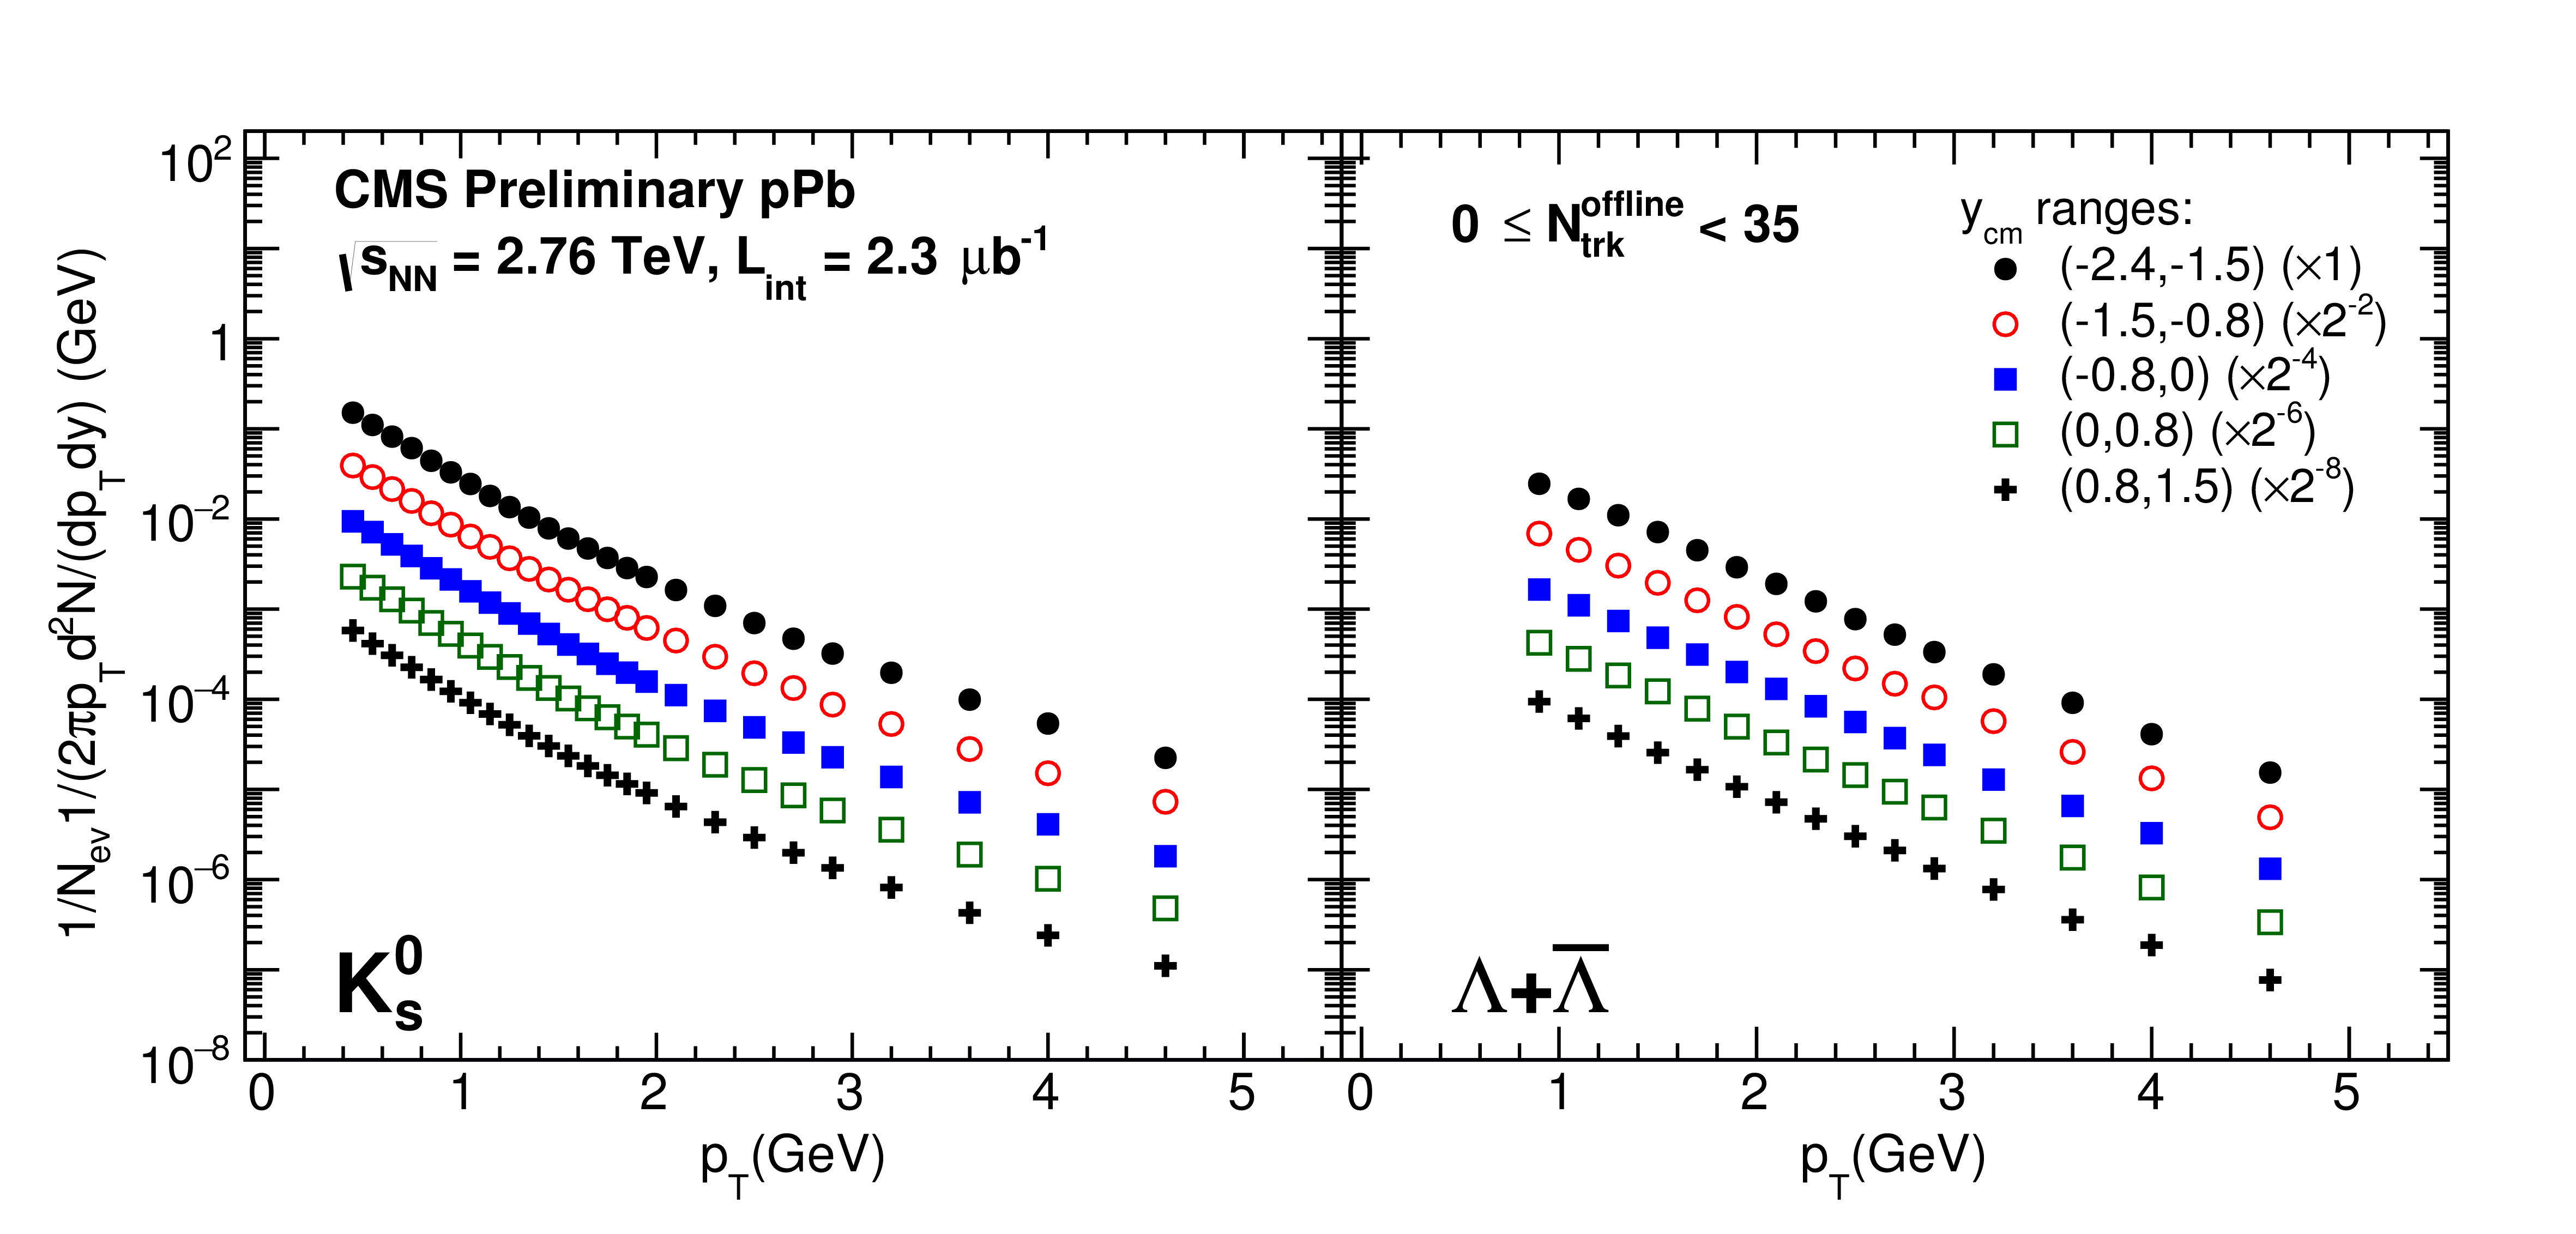
Figure 7-a:
Invariant $ {p_{\mathrm {T}}} $ spectra of $ {\mathrm {K^0_S}}$ and $ {\Lambda }+ {{\overline {\Lambda }}}$ in different $y_{\rm cm}$ ranges for pPb collisions at $ {\sqrt {s_{_{NN}}}} =$ 5.02 TeV. Results are shown for three multiplicity classes: $0 \leq {N_\mathrm {trk}^\mathrm {offline}} <35$ (a), $120 \leq {N_\mathrm {trk}^\mathrm {offline}} <150$ (b), and $220 \leq {N_\mathrm {trk}^\mathrm {offline}} <260$ (c). In each panel, from top to bottom, the rapidity range moves from Pb-going to p-going direction. |

png ; pdf |
Figure 7-b:
Invariant $ {p_{\mathrm {T}}} $ spectra of $ {\mathrm {K^0_S}}$ and $ {\Lambda }+ {{\overline {\Lambda }}}$ in different $y_{\rm cm}$ ranges for pPb collisions at $ {\sqrt {s_{_{NN}}}} =$ 5.02 TeV. Results are shown for three multiplicity classes: $0 \leq {N_\mathrm {trk}^\mathrm {offline}} <35$ (a), $120 \leq {N_\mathrm {trk}^\mathrm {offline}} <150$ (b), and $220 \leq {N_\mathrm {trk}^\mathrm {offline}} <260$ (c). In each panel, from top to bottom, the rapidity range moves from Pb-going to p-going direction. |
png ; pdf |
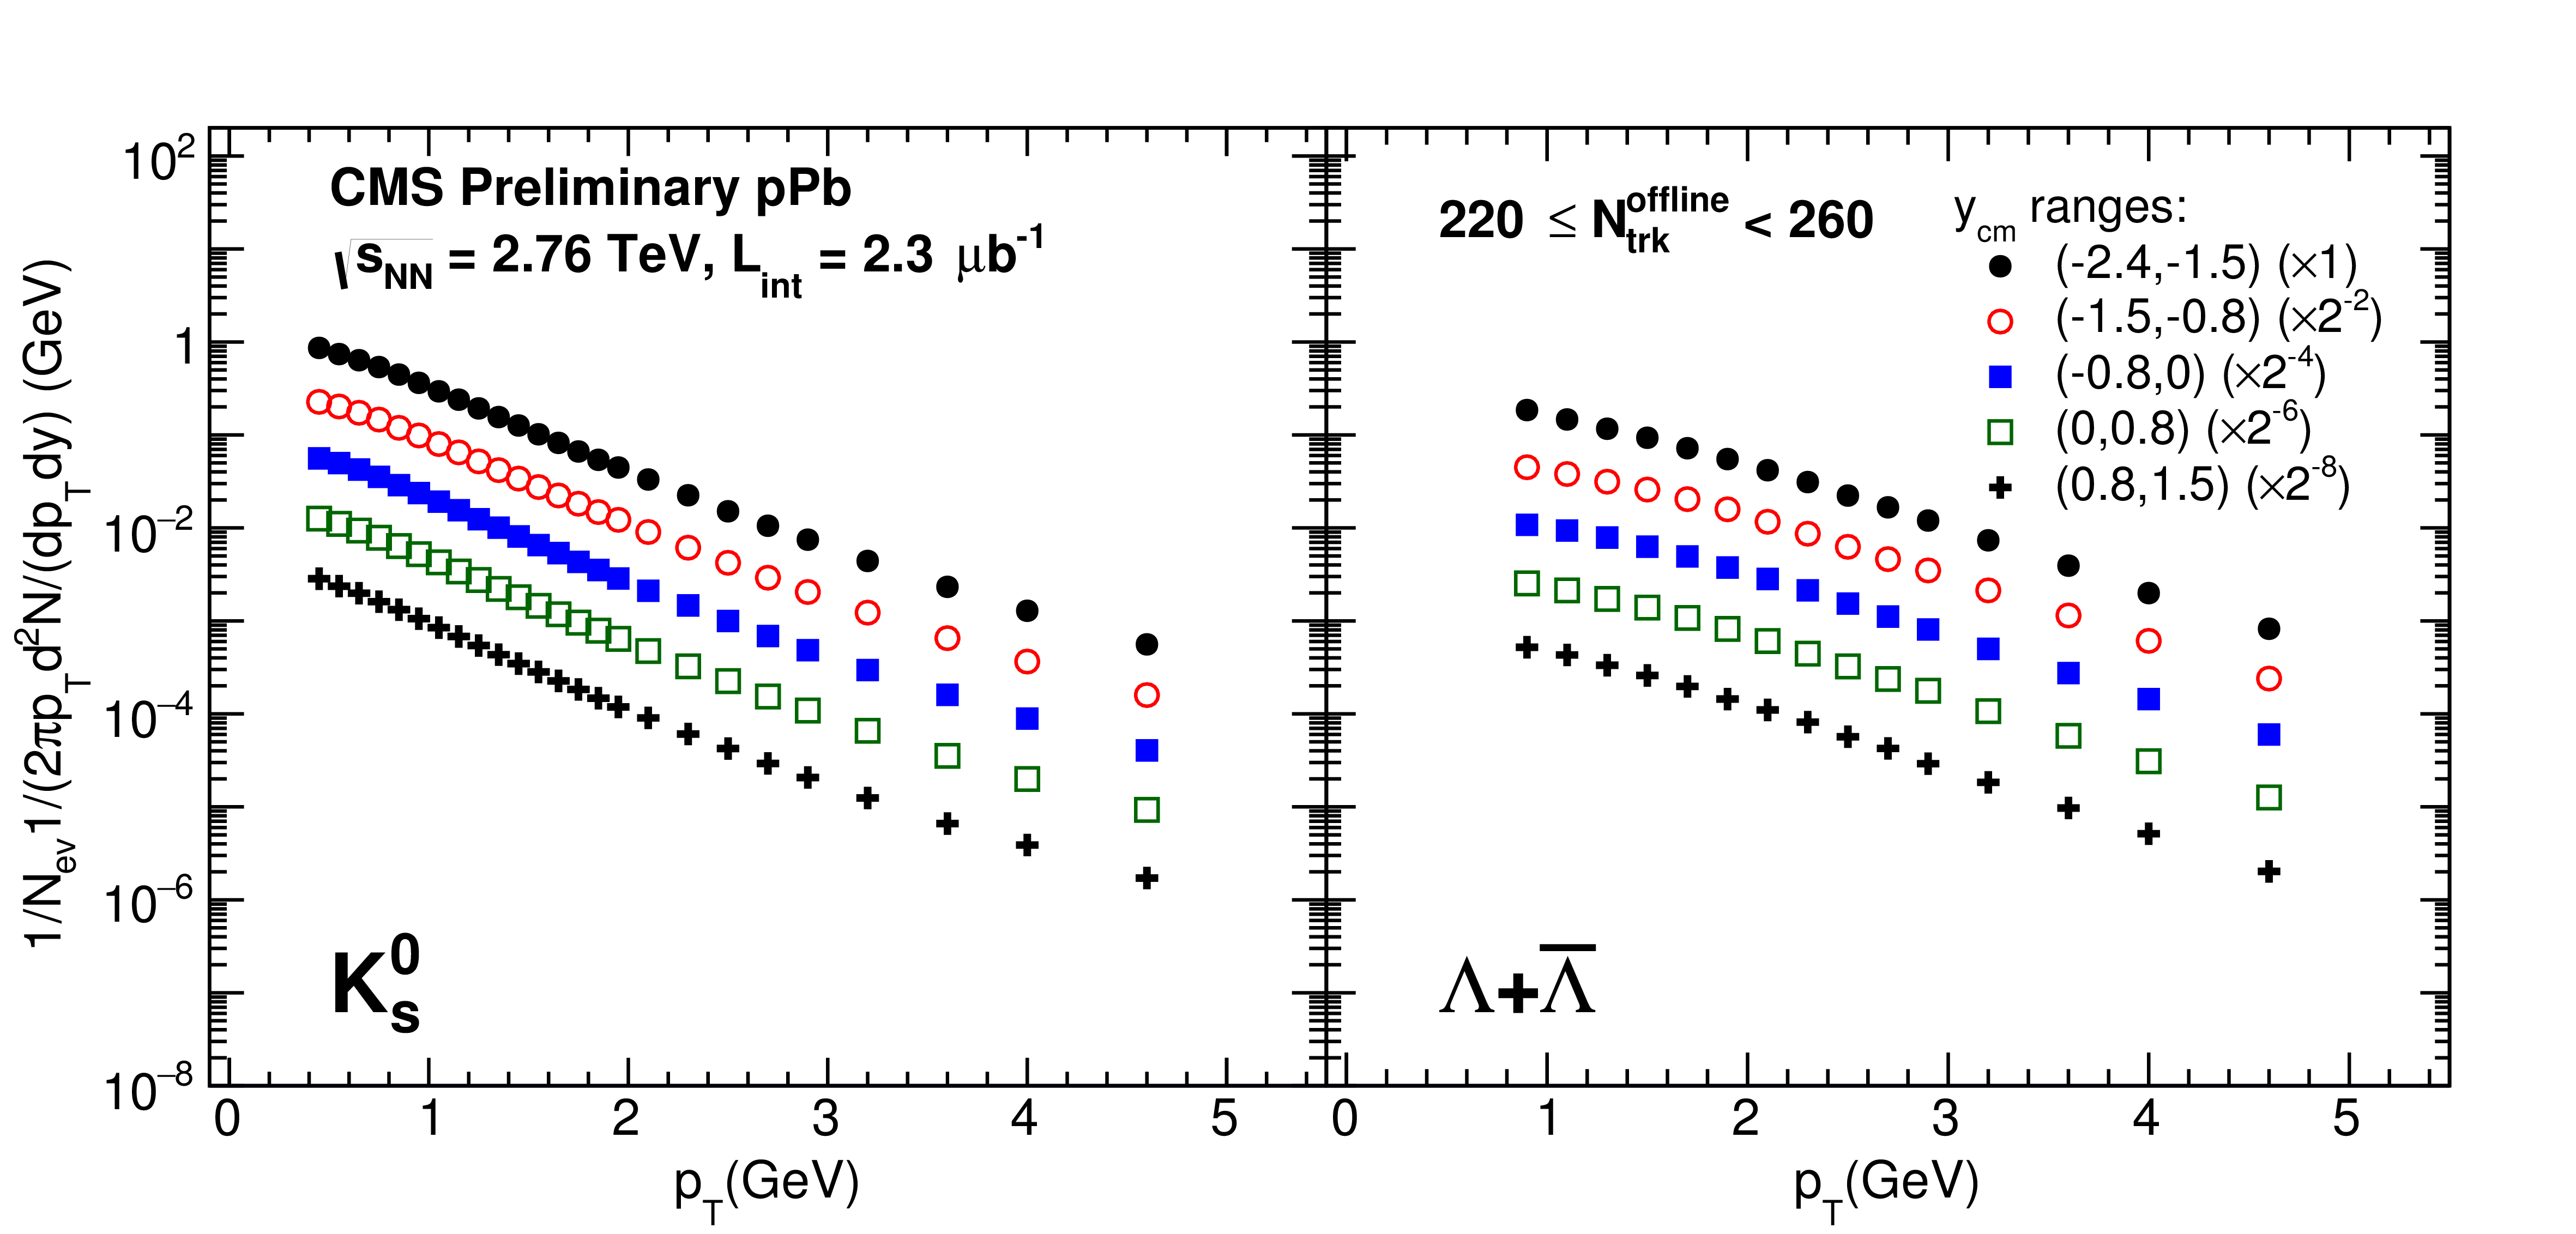
Figure 7-c:
Invariant $ {p_{\mathrm {T}}} $ spectra of $ {\mathrm {K^0_S}}$ and $ {\Lambda }+ {{\overline {\Lambda }}}$ in different $y_{\rm cm}$ ranges for pPb collisions at $ {\sqrt {s_{_{NN}}}} =$ 5.02 TeV. Results are shown for three multiplicity classes: $0 \leq {N_\mathrm {trk}^\mathrm {offline}} <35$ (a), $120 \leq {N_\mathrm {trk}^\mathrm {offline}} <150$ (b), and $220 \leq {N_\mathrm {trk}^\mathrm {offline}} <260$ (c). In each panel, from top to bottom, the rapidity range moves from Pb-going to p-going direction. |
png ; pdf |
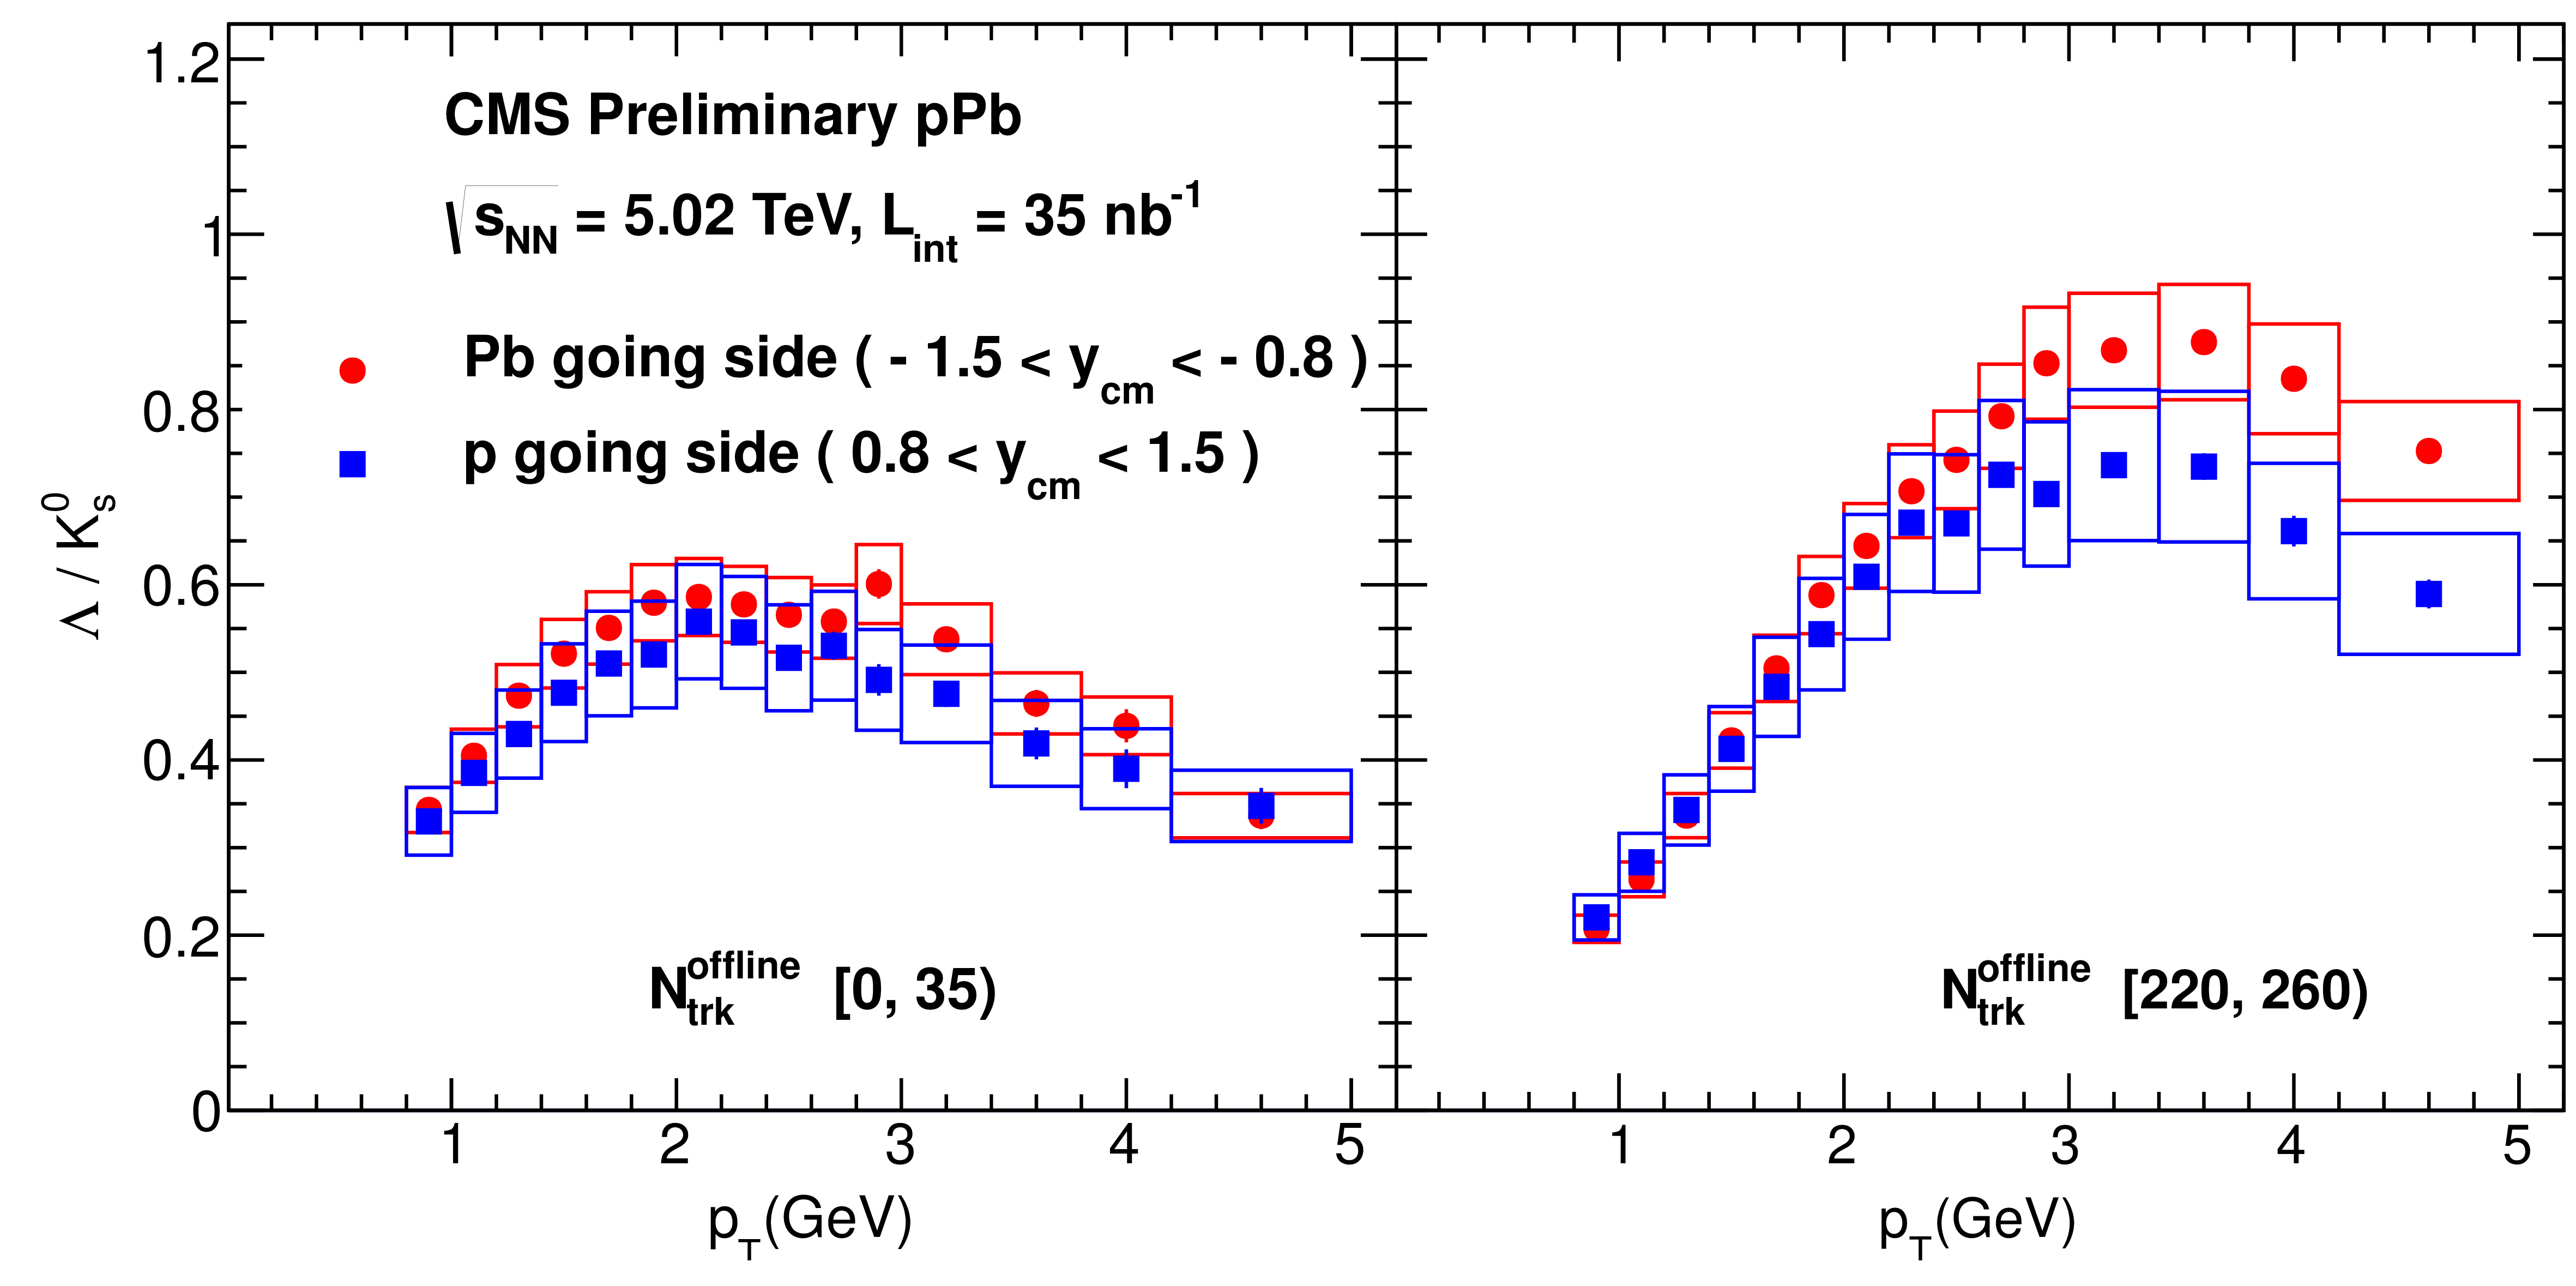
Figure 8:
Ratios of invariant $ {p_{\mathrm {T}}} $ spectra, $ {\Lambda }/ {\mathrm {K^0_S}}$, from $-1.5 < y_{\rm cm} < -0.8$ (Pb-going side) and $0.8 < y_{\rm cm} < 1.5$ (p-going) in pPb collisions at $ {\sqrt {s_{_{NN}}}} =$ 5.02 TeV. Results are presented for two multiplicity classes $ {N_\mathrm {trk}^\mathrm {offline}} <35$ (left) and $ {N_\mathrm {trk}^\mathrm {offline}} >220$ (right). The error bars represent the statistical uncertainties, while the boxes denote the systematic uncertainties. |
png ; pdf |
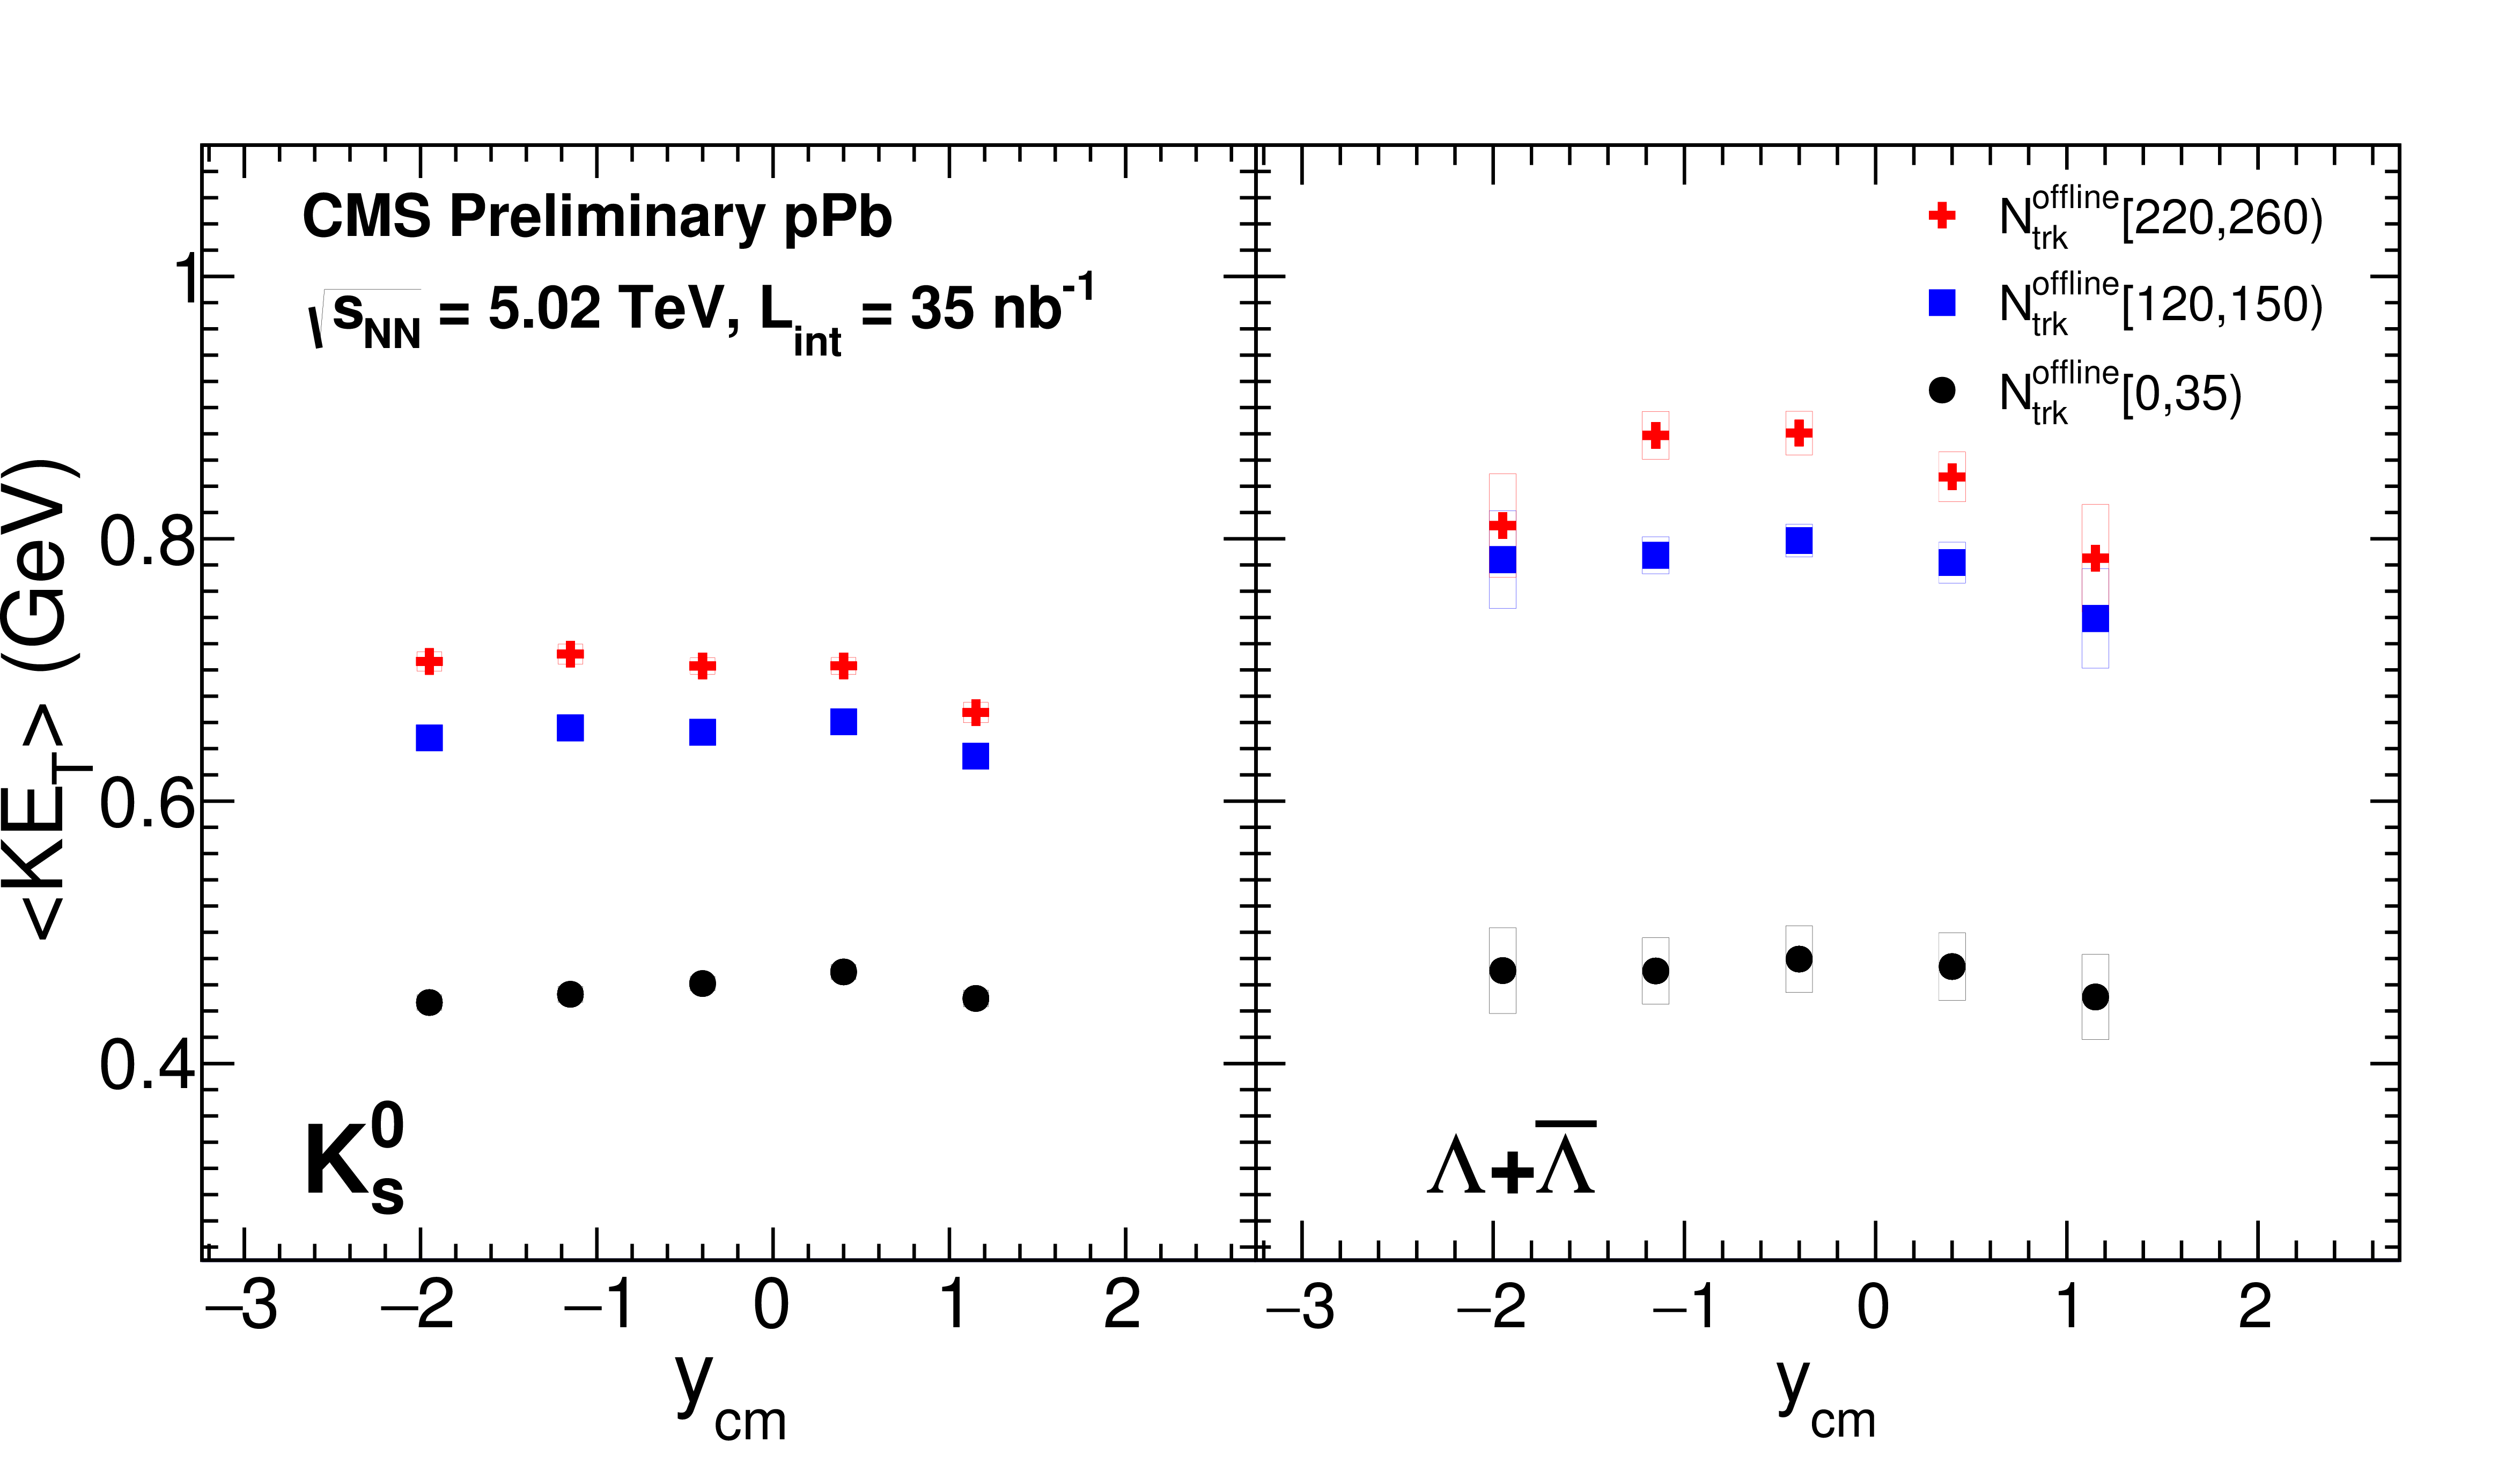
Figure 9:
The average transverse kinetic energy, $< KE^{}_{\mathrm{T}} > $, as a function of $y_{\rm cm}$ for $ {\mathrm {K^0_S}}$ and $ {\Lambda }+ {{\overline {\Lambda }}}$ for three different multiplicity classes in pPb collisions at $ {\sqrt {s_{_{NN}}}} =$ 5.02 TeV . The error bars represent the statistical uncertainties, while the boxes denote the systematic uncertainties. |
|
|
Compact Muon Solenoid LHC, CERN |
|

|

|

|

|

|