

Compact Muon Solenoid
LHC, CERN
| CMS-PAS-HIG-15-013 | ||
| Model independent search for Higgs boson pair production in the $\mathrm{b\overline{b}}\tau^+\tau^-$ final state | ||
| CMS Collaboration | ||
| March 2016 | ||
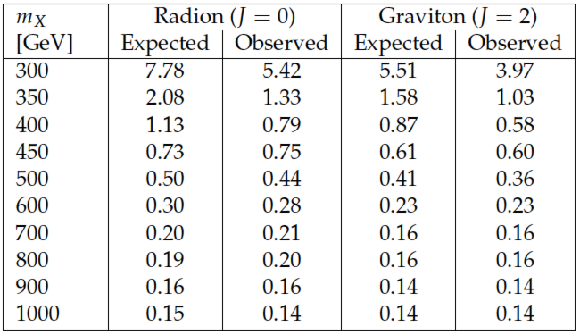
| Abstract: Results of a search for the production of Higgs boson pairs are presented. In this search one Higgs boson decays to a pair of b-quarks, and the other Higgs boson decays to a tau lepton pair where the tau leptons decay hadronically. The search is based on proton-proton collision data recorded by the CMS experiment at $\sqrt{s} =$ 8 TeV in 2012, corresponding to an integrated luminosity of 18.3 fb$^{-1}$. The resonant and the non-resonant productions of Higgs boson pairs are studied. No significant excess with respect to the background-only hypothesis is observed in the data and therefore corresponding upper limits on cross section times branching ratio are set. In the case of resonant $\mathrm{HH}$ boson production, the limit on $\sigma(\mathrm{pp} \to X) \times \mathrm{BR}(X \to \mathrm{HH})$ for a resonance of spin 0 (spin 2) and mass $m_{X}$, ranges from 5.42 pb (3.97 pb) at $m_{X}=$ 300 GeV to 0.14 pb (0.14 pb) at $m_{X}=$ 1000 GeV. The limit on non-resonant production amounts to approximately 50 times the rate predicted by the SM. | ||
|
Links:
CDS record (PDF) ;
CADI line (restricted) ;
These preliminary results are superseded in this paper, PRD 96 (2017) 072004. The superseded preliminary plots can be found here. |
||
| Figures | |
png pdf |
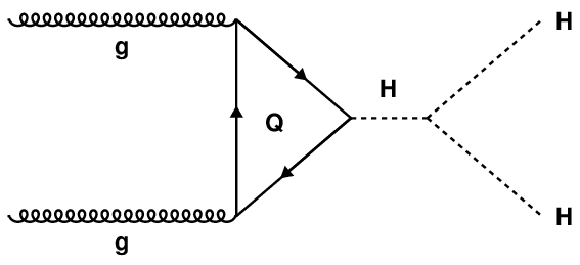
Figure 1-a:
Leading-order diagrams for the production of a Higgs boson pair within the SM. The diagram on the left is sensitive to the trilinear Higgs boson self-coupling. The box diagram on the right interferes destructively with it, thus reducing the sensitivity. |
png pdf |
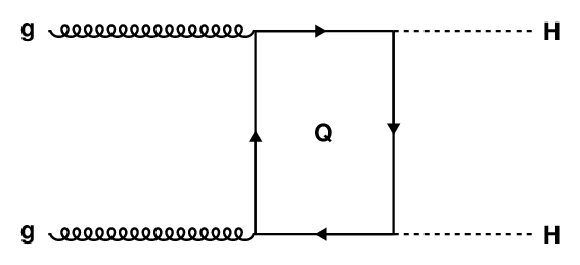
Figure 1-b:
Leading-order diagrams for the production of a Higgs boson pair within the SM. The diagram on the left is sensitive to the trilinear Higgs boson self-coupling. The box diagram on the right interferes destructively with it, thus reducing the sensitivity. |
png pdf |
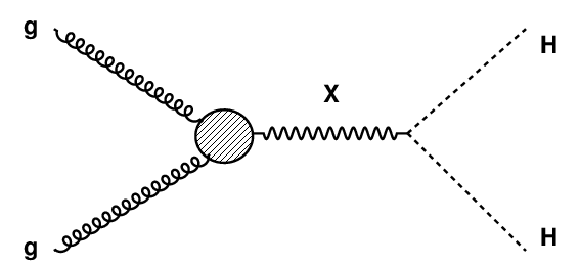
Figure 2:
Leading-order diagram for the production of a pair of SM-like Higgs bosons of mass $m_{ { {\mathrm {H}} }} =$ 125 GeV, resulting from the decay of a new heavy resonance $X$. |
png pdf |
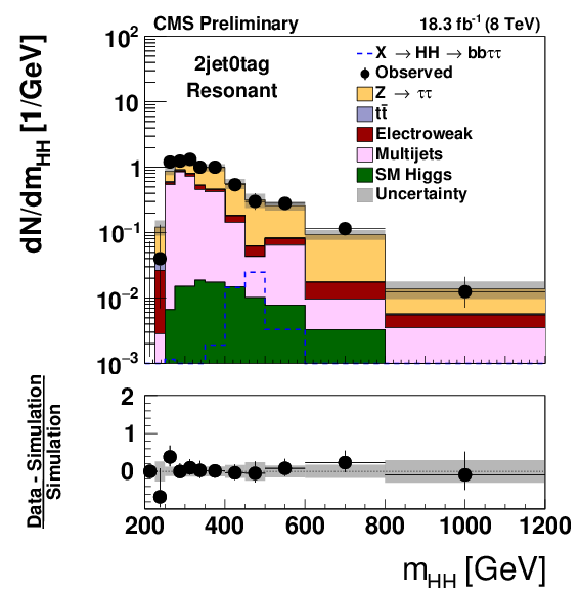
Figure 3-a:
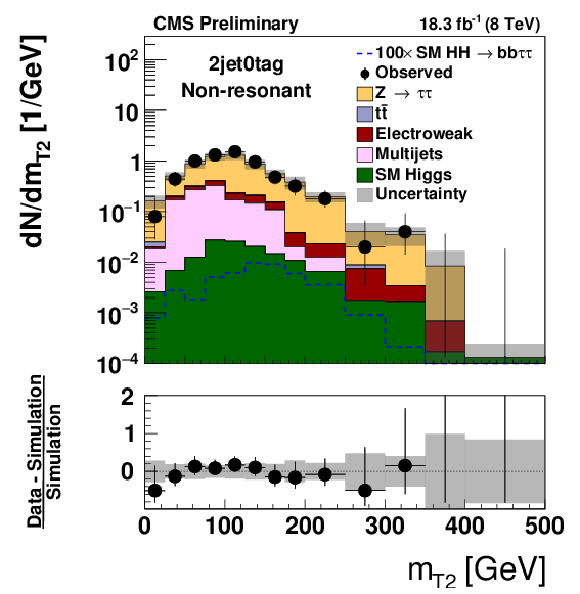
Distribution of $m_{ { {\mathrm {H}} } { {\mathrm {H}} }}$ (a,c) and of $m_{T2}$ (b,d) observed in the 2jet0tag (a,b) and 2jet1tag (c,d) event category, compared to the expectation for background processes. Hypothetical signals have been overlayed for comparison. The signal shown in case of the $m_{ { {\mathrm {H}} } { {\mathrm {H}} }}$ distribution corresponds to the decays of a spin $2$ resonance $X$ of mass $m_{X} =$ 500 GeV that is produced with a cross section times branching fraction of $\sigma (\mathrm{p} \mathrm{p} \to X) \times \textrm {BR}(X \to { {\mathrm {H}} } { {\mathrm {H}} }) =$ 1pb. In case of the $m_{T2}$ distribution, a non-resonant $ { {\mathrm {H}} } { {\mathrm {H}} }$ signal with a cross section $\sigma (\mathrm{p} \mathrm{p} \to { {\mathrm {H}} } { {\mathrm {H}} })$ of 1.118 pb, corresponding to 100 times the SM cross section, is shown. The expectation for signal and background processes is shown for the "postfit" values of nuisance parameters. |
png pdf |
Figure 3-b:
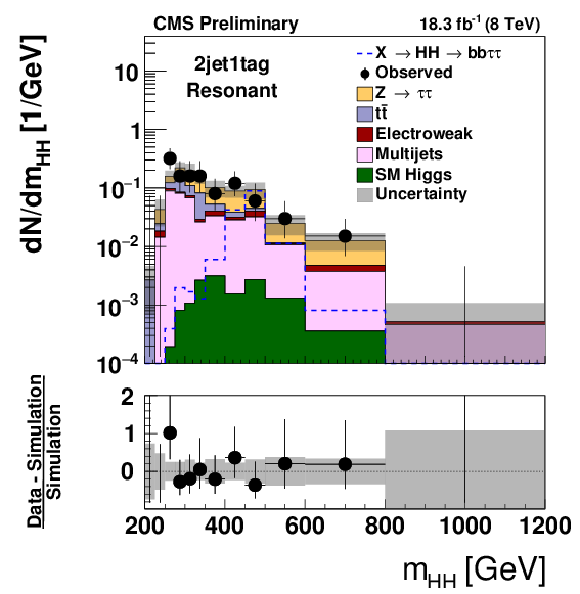
Distribution of $m_{ { {\mathrm {H}} } { {\mathrm {H}} }}$ (a,c) and of $m_{T2}$ (b,d) observed in the 2jet0tag (a,b) and 2jet1tag (c,d) event category, compared to the expectation for background processes. Hypothetical signals have been overlayed for comparison. The signal shown in case of the $m_{ { {\mathrm {H}} } { {\mathrm {H}} }}$ distribution corresponds to the decays of a spin $2$ resonance $X$ of mass $m_{X} =$ 500 GeV that is produced with a cross section times branching fraction of $\sigma (\mathrm{p} \mathrm{p} \to X) \times \textrm {BR}(X \to { {\mathrm {H}} } { {\mathrm {H}} }) =$ 1pb. In case of the $m_{T2}$ distribution, a non-resonant $ { {\mathrm {H}} } { {\mathrm {H}} }$ signal with a cross section $\sigma (\mathrm{p} \mathrm{p} \to { {\mathrm {H}} } { {\mathrm {H}} })$ of 1.118 pb, corresponding to 100 times the SM cross section, is shown. The expectation for signal and background processes is shown for the "postfit" values of nuisance parameters. |
png pdf |
Figure 3-c:
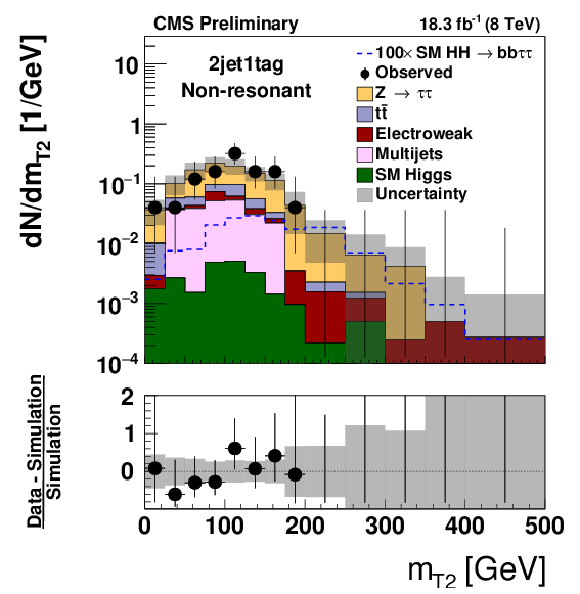
Distribution of $m_{ { {\mathrm {H}} } { {\mathrm {H}} }}$ (a,c) and of $m_{T2}$ (b,d) observed in the 2jet0tag (a,b) and 2jet1tag (c,d) event category, compared to the expectation for background processes. Hypothetical signals have been overlayed for comparison. The signal shown in case of the $m_{ { {\mathrm {H}} } { {\mathrm {H}} }}$ distribution corresponds to the decays of a spin $2$ resonance $X$ of mass $m_{X} =$ 500 GeV that is produced with a cross section times branching fraction of $\sigma (\mathrm{p} \mathrm{p} \to X) \times \textrm {BR}(X \to { {\mathrm {H}} } { {\mathrm {H}} }) =$ 1pb. In case of the $m_{T2}$ distribution, a non-resonant $ { {\mathrm {H}} } { {\mathrm {H}} }$ signal with a cross section $\sigma (\mathrm{p} \mathrm{p} \to { {\mathrm {H}} } { {\mathrm {H}} })$ of 1.118 pb, corresponding to 100 times the SM cross section, is shown. The expectation for signal and background processes is shown for the "postfit" values of nuisance parameters. |
png pdf |
Figure 3-d:
Distribution of $m_{ { {\mathrm {H}} } { {\mathrm {H}} }}$ (a,c) and of $m_{T2}$ (b,d) observed in the 2jet0tag (a,b) and 2jet1tag (c,d) event category, compared to the expectation for background processes. Hypothetical signals have been overlayed for comparison. The signal shown in case of the $m_{ { {\mathrm {H}} } { {\mathrm {H}} }}$ distribution corresponds to the decays of a spin $2$ resonance $X$ of mass $m_{X} =$ 500 GeV that is produced with a cross section times branching fraction of $\sigma (\mathrm{p} \mathrm{p} \to X) \times \textrm {BR}(X \to { {\mathrm {H}} } { {\mathrm {H}} }) =$ 1pb. In case of the $m_{T2}$ distribution, a non-resonant $ { {\mathrm {H}} } { {\mathrm {H}} }$ signal with a cross section $\sigma (\mathrm{p} \mathrm{p} \to { {\mathrm {H}} } { {\mathrm {H}} })$ of 1.118 pb, corresponding to 100 times the SM cross section, is shown. The expectation for signal and background processes is shown for the "postfit" values of nuisance parameters. |
png pdf |
Figure 4-a:
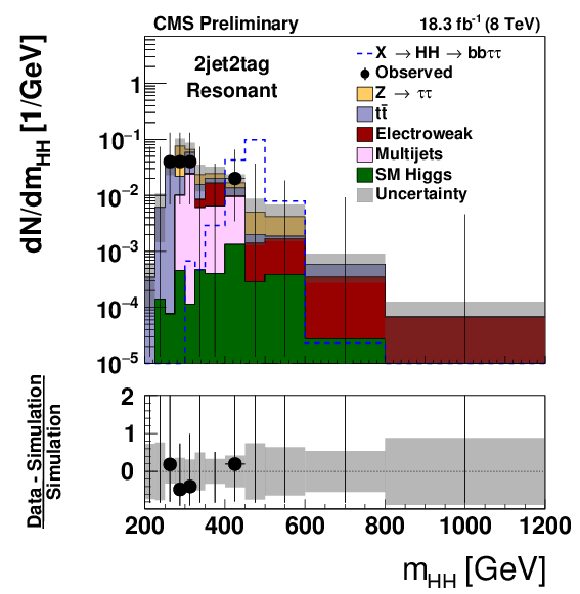
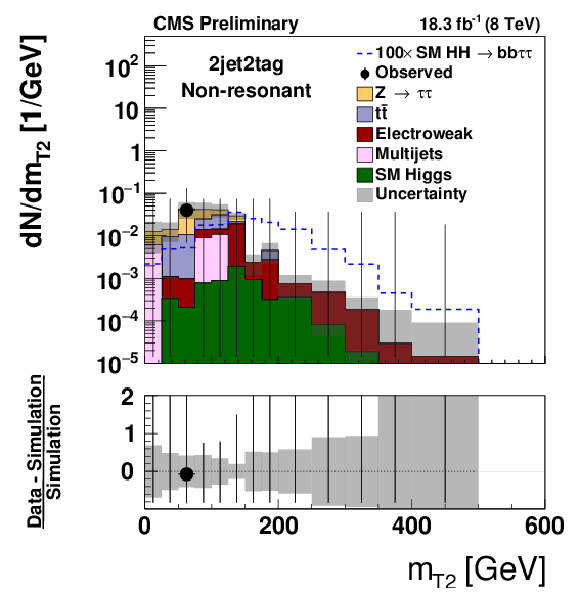
Distribution of $m_{ { {\mathrm {H}} } { {\mathrm {H}} }}$ (a) and of $m_{T2}$ (b) observed in the 2jet2tag event category, compared to the expectation for background processes. Hypothetical signals have been overlayed for comparison. The signal shown in case of the $m_{ { {\mathrm {H}} } { {\mathrm {H}} }}$ distribution corresponds to the decays of a spin $2$ resonance $X$ of mass $m_{X} =$ 500 GeV that is produced with a cross section times branching fraction of $\sigma (\mathrm{p} \mathrm{p} \to X) \times \textrm {BR}(X \to { {\mathrm {H}} } { {\mathrm {H}} }) =$ 1 pb. In case of the $m_{T2}$ distribution, a non-resonant $ { {\mathrm {H}} } { {\mathrm {H}} }$ signal with a cross section $\sigma (\mathrm{p} \mathrm{p} \to { {\mathrm {H}} } { {\mathrm {H}} })$ of 1.118 pb, corresponding to 100 times the SM cross section, is shown. The expectation for signal and background processes is shown for the "postfit" values of nuisance parameters. |
png pdf |
Figure 4-b:
Distribution of $m_{ { {\mathrm {H}} } { {\mathrm {H}} }}$ (a) and of $m_{T2}$ (b) observed in the 2jet2tag event category, compared to the expectation for background processes. Hypothetical signals have been overlayed for comparison. The signal shown in case of the $m_{ { {\mathrm {H}} } { {\mathrm {H}} }}$ distribution corresponds to the decays of a spin $2$ resonance $X$ of mass $m_{X} =$ 500 GeV that is produced with a cross section times branching fraction of $\sigma (\mathrm{p} \mathrm{p} \to X) \times \textrm {BR}(X \to { {\mathrm {H}} } { {\mathrm {H}} }) =$ 1 pb. In case of the $m_{T2}$ distribution, a non-resonant $ { {\mathrm {H}} } { {\mathrm {H}} }$ signal with a cross section $\sigma (\mathrm{p} \mathrm{p} \to { {\mathrm {H}} } { {\mathrm {H}} })$ of 1.118 pb, corresponding to 100 times the SM cross section, is shown. The expectation for signal and background processes is shown for the "postfit" values of nuisance parameters. |
png pdf |
Figure 5-a:
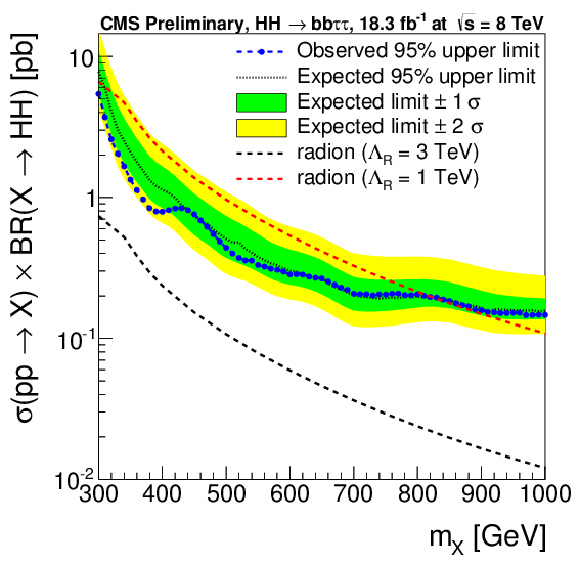
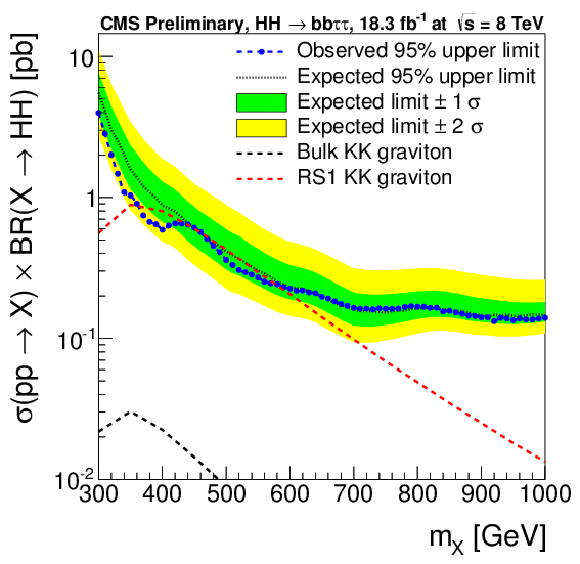
95% CL upper limits on resonant $ { {\mathrm {H}} } { {\mathrm {H}} }$ production. The limits for resonant di-Higgs boson production have been computed for a spin $0$ (a) and for a spin $2$ (b) resonance $X$ and are shown as function of the resonance mass $m_{X}$. The theory curves for the graviton case were based on KK graviton production in the bulk and RS1 models respectively. To obtain the radion theory curves, cross section for radion production via gluon fusion were computed (to NLO electroweak and NNLO QCD accuracy) for different values of fundamental theory parameter $\Lambda _{R}$ which were then multplied by a K-factor calculated for SM-like Higgs boson production through gluon-gluon fusion. |
png pdf |
Figure 5-b:
95% CL upper limits on resonant $ { {\mathrm {H}} } { {\mathrm {H}} }$ production. The limits for resonant di-Higgs boson production have been computed for a spin $0$ (a) and for a spin $2$ (b) resonance $X$ and are shown as function of the resonance mass $m_{X}$. The theory curves for the graviton case were based on KK graviton production in the bulk and RS1 models respectively. To obtain the radion theory curves, cross section for radion production via gluon fusion were computed (to NLO electroweak and NNLO QCD accuracy) for different values of fundamental theory parameter $\Lambda _{R}$ which were then multplied by a K-factor calculated for SM-like Higgs boson production through gluon-gluon fusion. |
| Tables | |
png pdf |
Table 1:
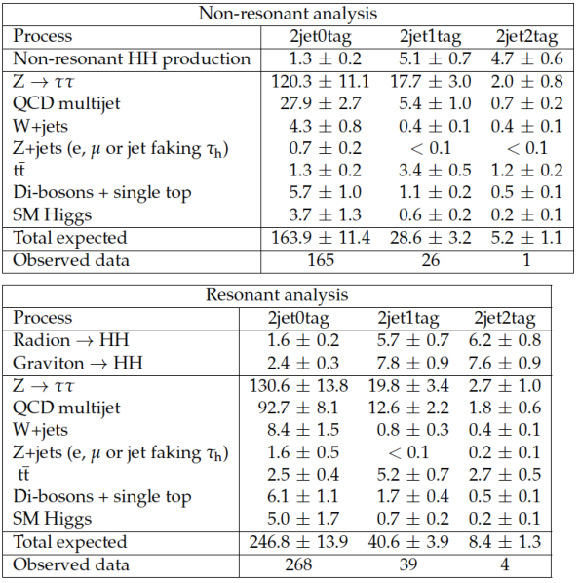
Observed and expected event yields in different event categories, for the analysis of non-resonant (top) and resonant (bottom) HH production. Expected event yields are computed using values of nuisance parameters obtained by the maximum likelihood fit to the data as described in Sec. 8. Quoted uncertainties represent the combination of statistical plus systematic uncertainties. In case of resonant di-Higgs boson production, the signal yield has been computed for a resonance with of mass $m_{X} =$ 500 GeV and a radion or graviton production cross section times branching fraction of $\sigma (\mathrm{pp} \to X) \times \textrm {BR}(X \to { {\mathrm {H}} } { {\mathrm {H}} }) =$ 1 pb. The signal rate expected for non-resonant $ { {\mathrm {H}} } { {\mathrm {H}} }$ production has been computed for a cross section $\sigma (\mathrm{pp} \to { {\mathrm {H}} } { {\mathrm {H}} })$ of 1.118 pb, corresponding to 100 times the SM cross section, and SM event kinematics. |
png pdf |
Table 2:
95% CL upper limits on resonant HH production in units of pb for spin $J=0$ (radion) and spin $J=2$ (graviton) resonances $X$, at different masses $m_{X}$. |

|
Compact Muon Solenoid LHC, CERN |

|

|

|

|

|

|