

Compact Muon Solenoid
LHC, CERN
| CMS-PAS-EXO-21-007 | ||
| Search for high-mass exclusive diphoton production with tagged protons | ||
| CMS Collaboration | ||
| June 2022 | ||
| Abstract: A search for high-mass exclusive diphoton production via photon-photon fusion with tagged protons is presented. The analysis utilizes 102.7 fb$^{-1}$ of data collected by the CMS and TOTEM Precision Proton Spectrometer in the 2016, 2017, and 2018 LHC runs. Events are selected that have two photons with high transverse momenta that are back-to-back in azimuth and with a large diphoton invariant mass. To remove the dominant backgrounds, tagged final state protons from the event are required to match the kinematics of the final state photons. Only events having opposite-side protons within an asymmetric fractional momentum loss between 0.035 and 0.15 (0.18) for the detectors on the negative (positive) side of CMS are considered. One exclusive diphoton candidate is observed for an expected background of 1.1 events. Limits at 95% confidence level are derived on the four-photon anomalous coupling parameters for $|\zeta_1|$ < 7.3 $\times$ 10$^{-14}$ GeV$^{-4}$, $|\zeta_2|$ < 1.5 $\times$ 10$^{-13}$ GeV$^{-4}$ using an effective field theory. Additionally, axion-like particles are excluded in the mass range of 500 to 2000 GeV. | ||
|
Links:
CDS record (PDF) ;
CADI line (restricted) ;
These preliminary results are superseded in this paper, Submitted to PRD. The superseded preliminary plots can be found here. |
||
| Figures | |
png pdf |
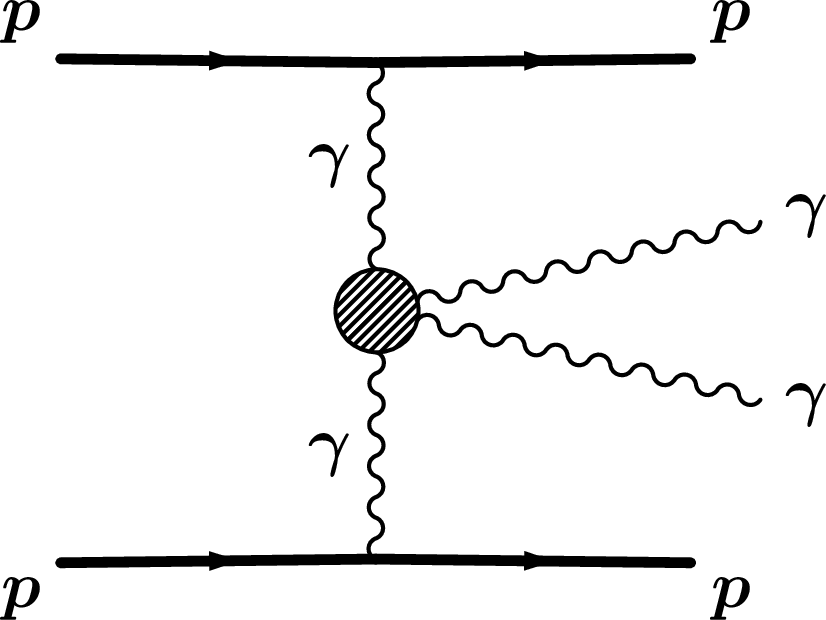
Figure 1:
The process for diphoton production via photon exchange with intact protons in the final state. Several couplings may enter the four-photon shaded area such as a loop (box) of charged fermions or bosons. The model can be extended with intermediate interactions of new physics objects, such as a loop of a heavy charged particle or an $s$-channel process producing a scalar axion-like resonance that decays into two photons. |
png pdf |
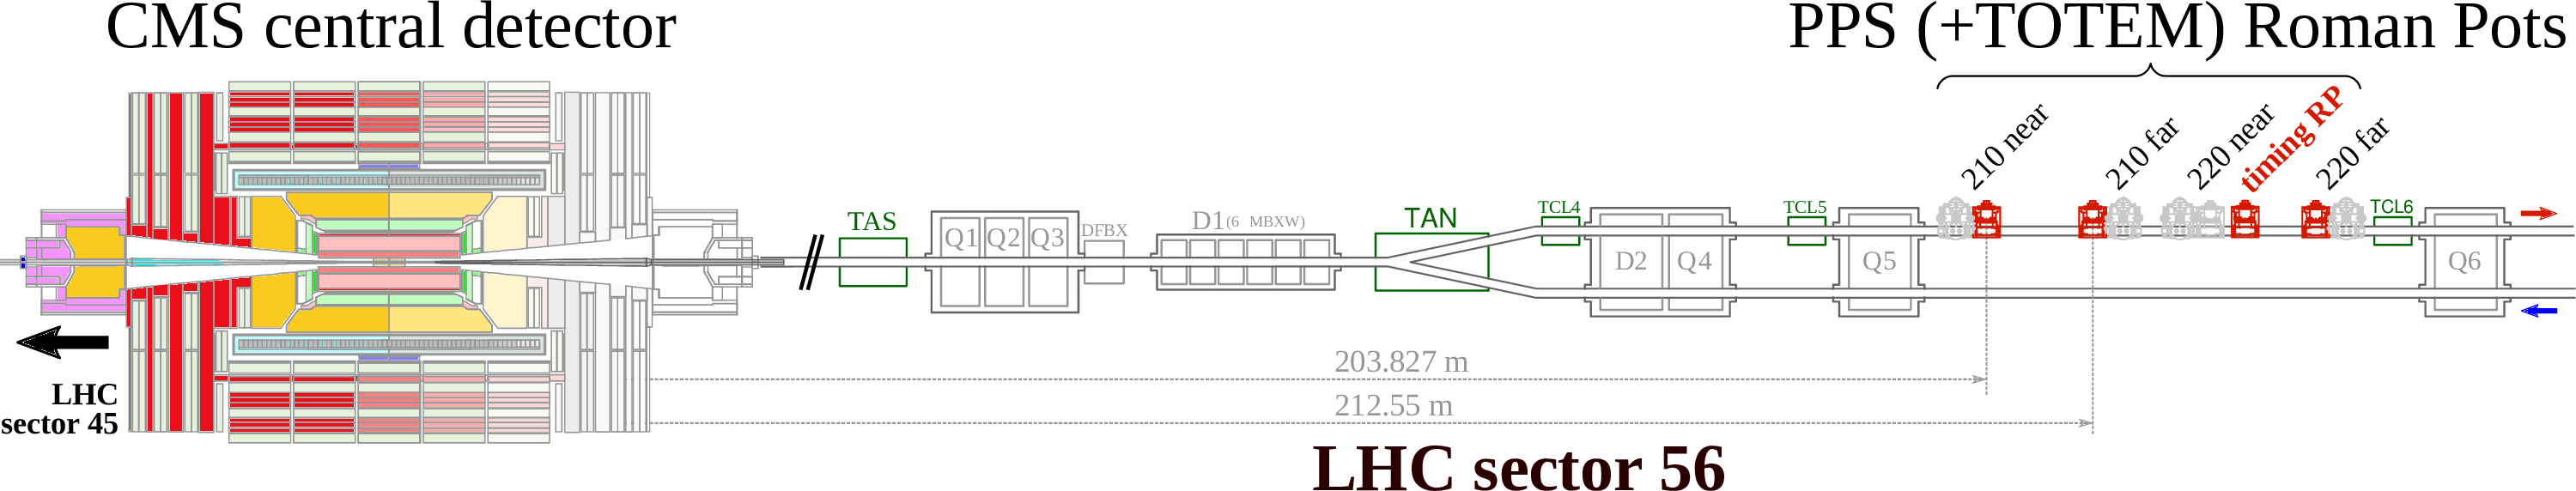
Figure 2:
A schematic of one side of the PPS detector with respect to the central CMS detector. The 210 and 220 m stations are identified that house the Roman Pot detectors. Timing detector stations are also noted, but they are not used in this analysis. A symmetric set of detectors exists on the other side of CMS as well. |
png pdf |
Figure 3:
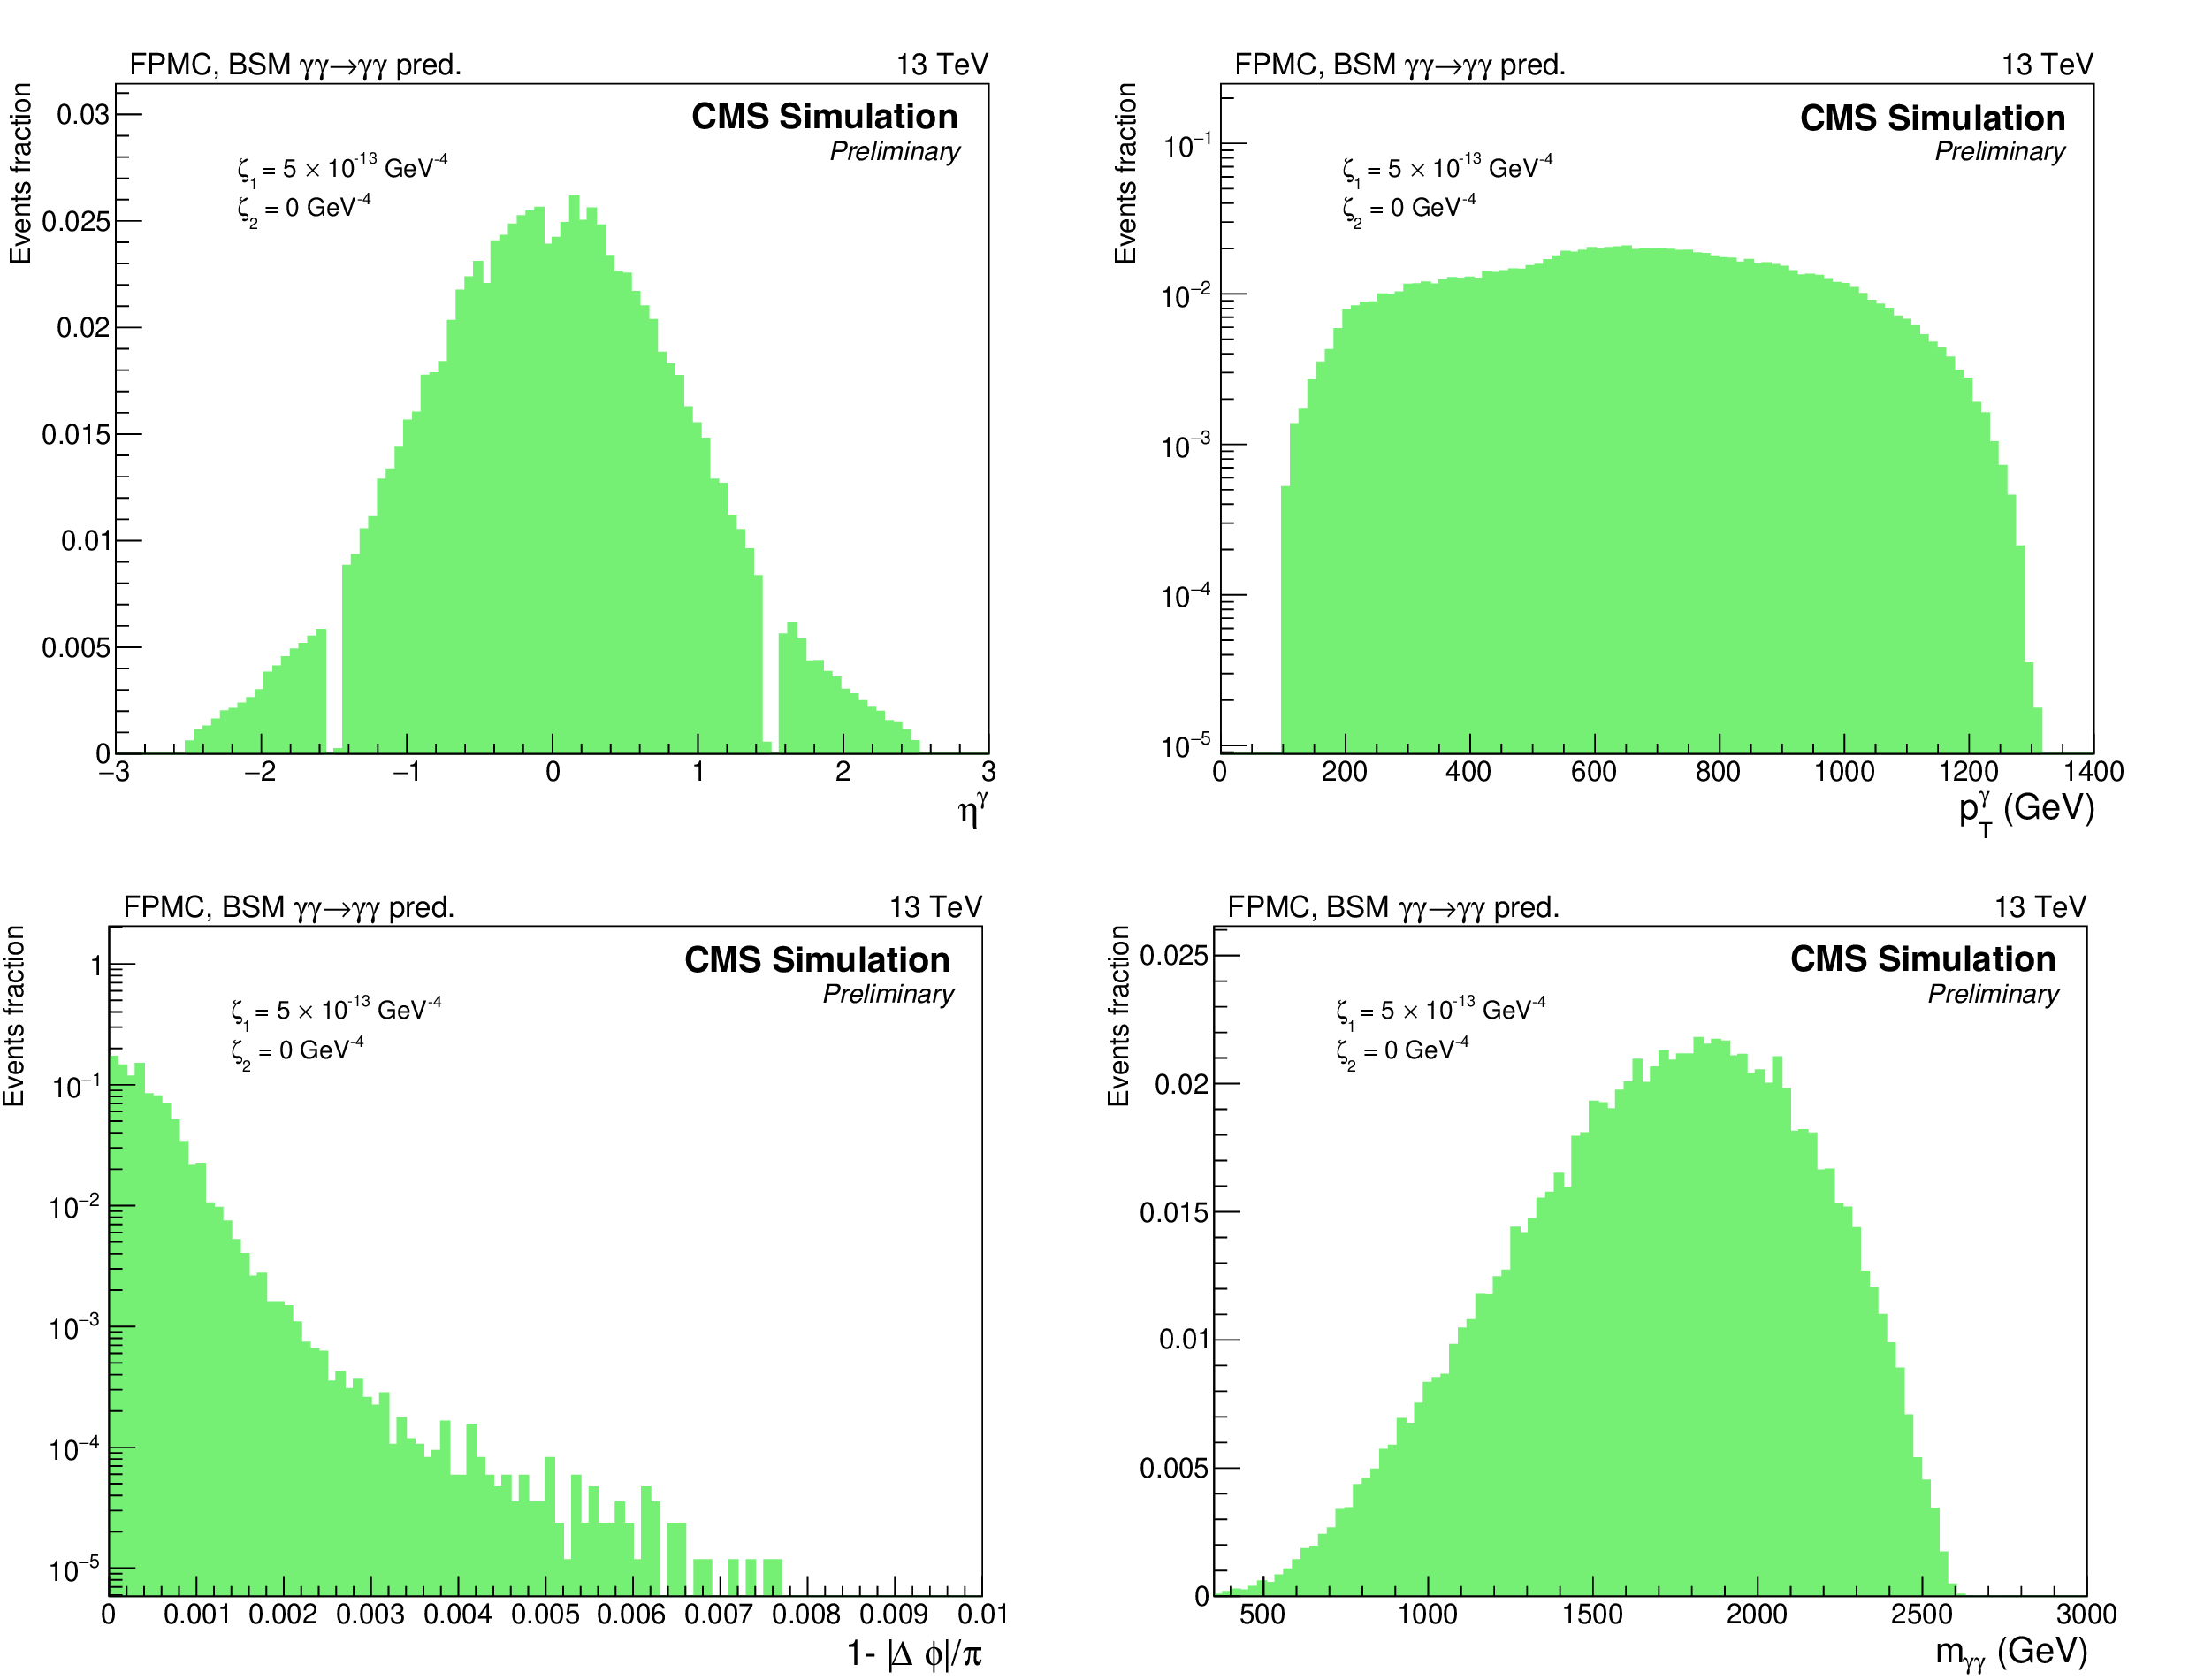
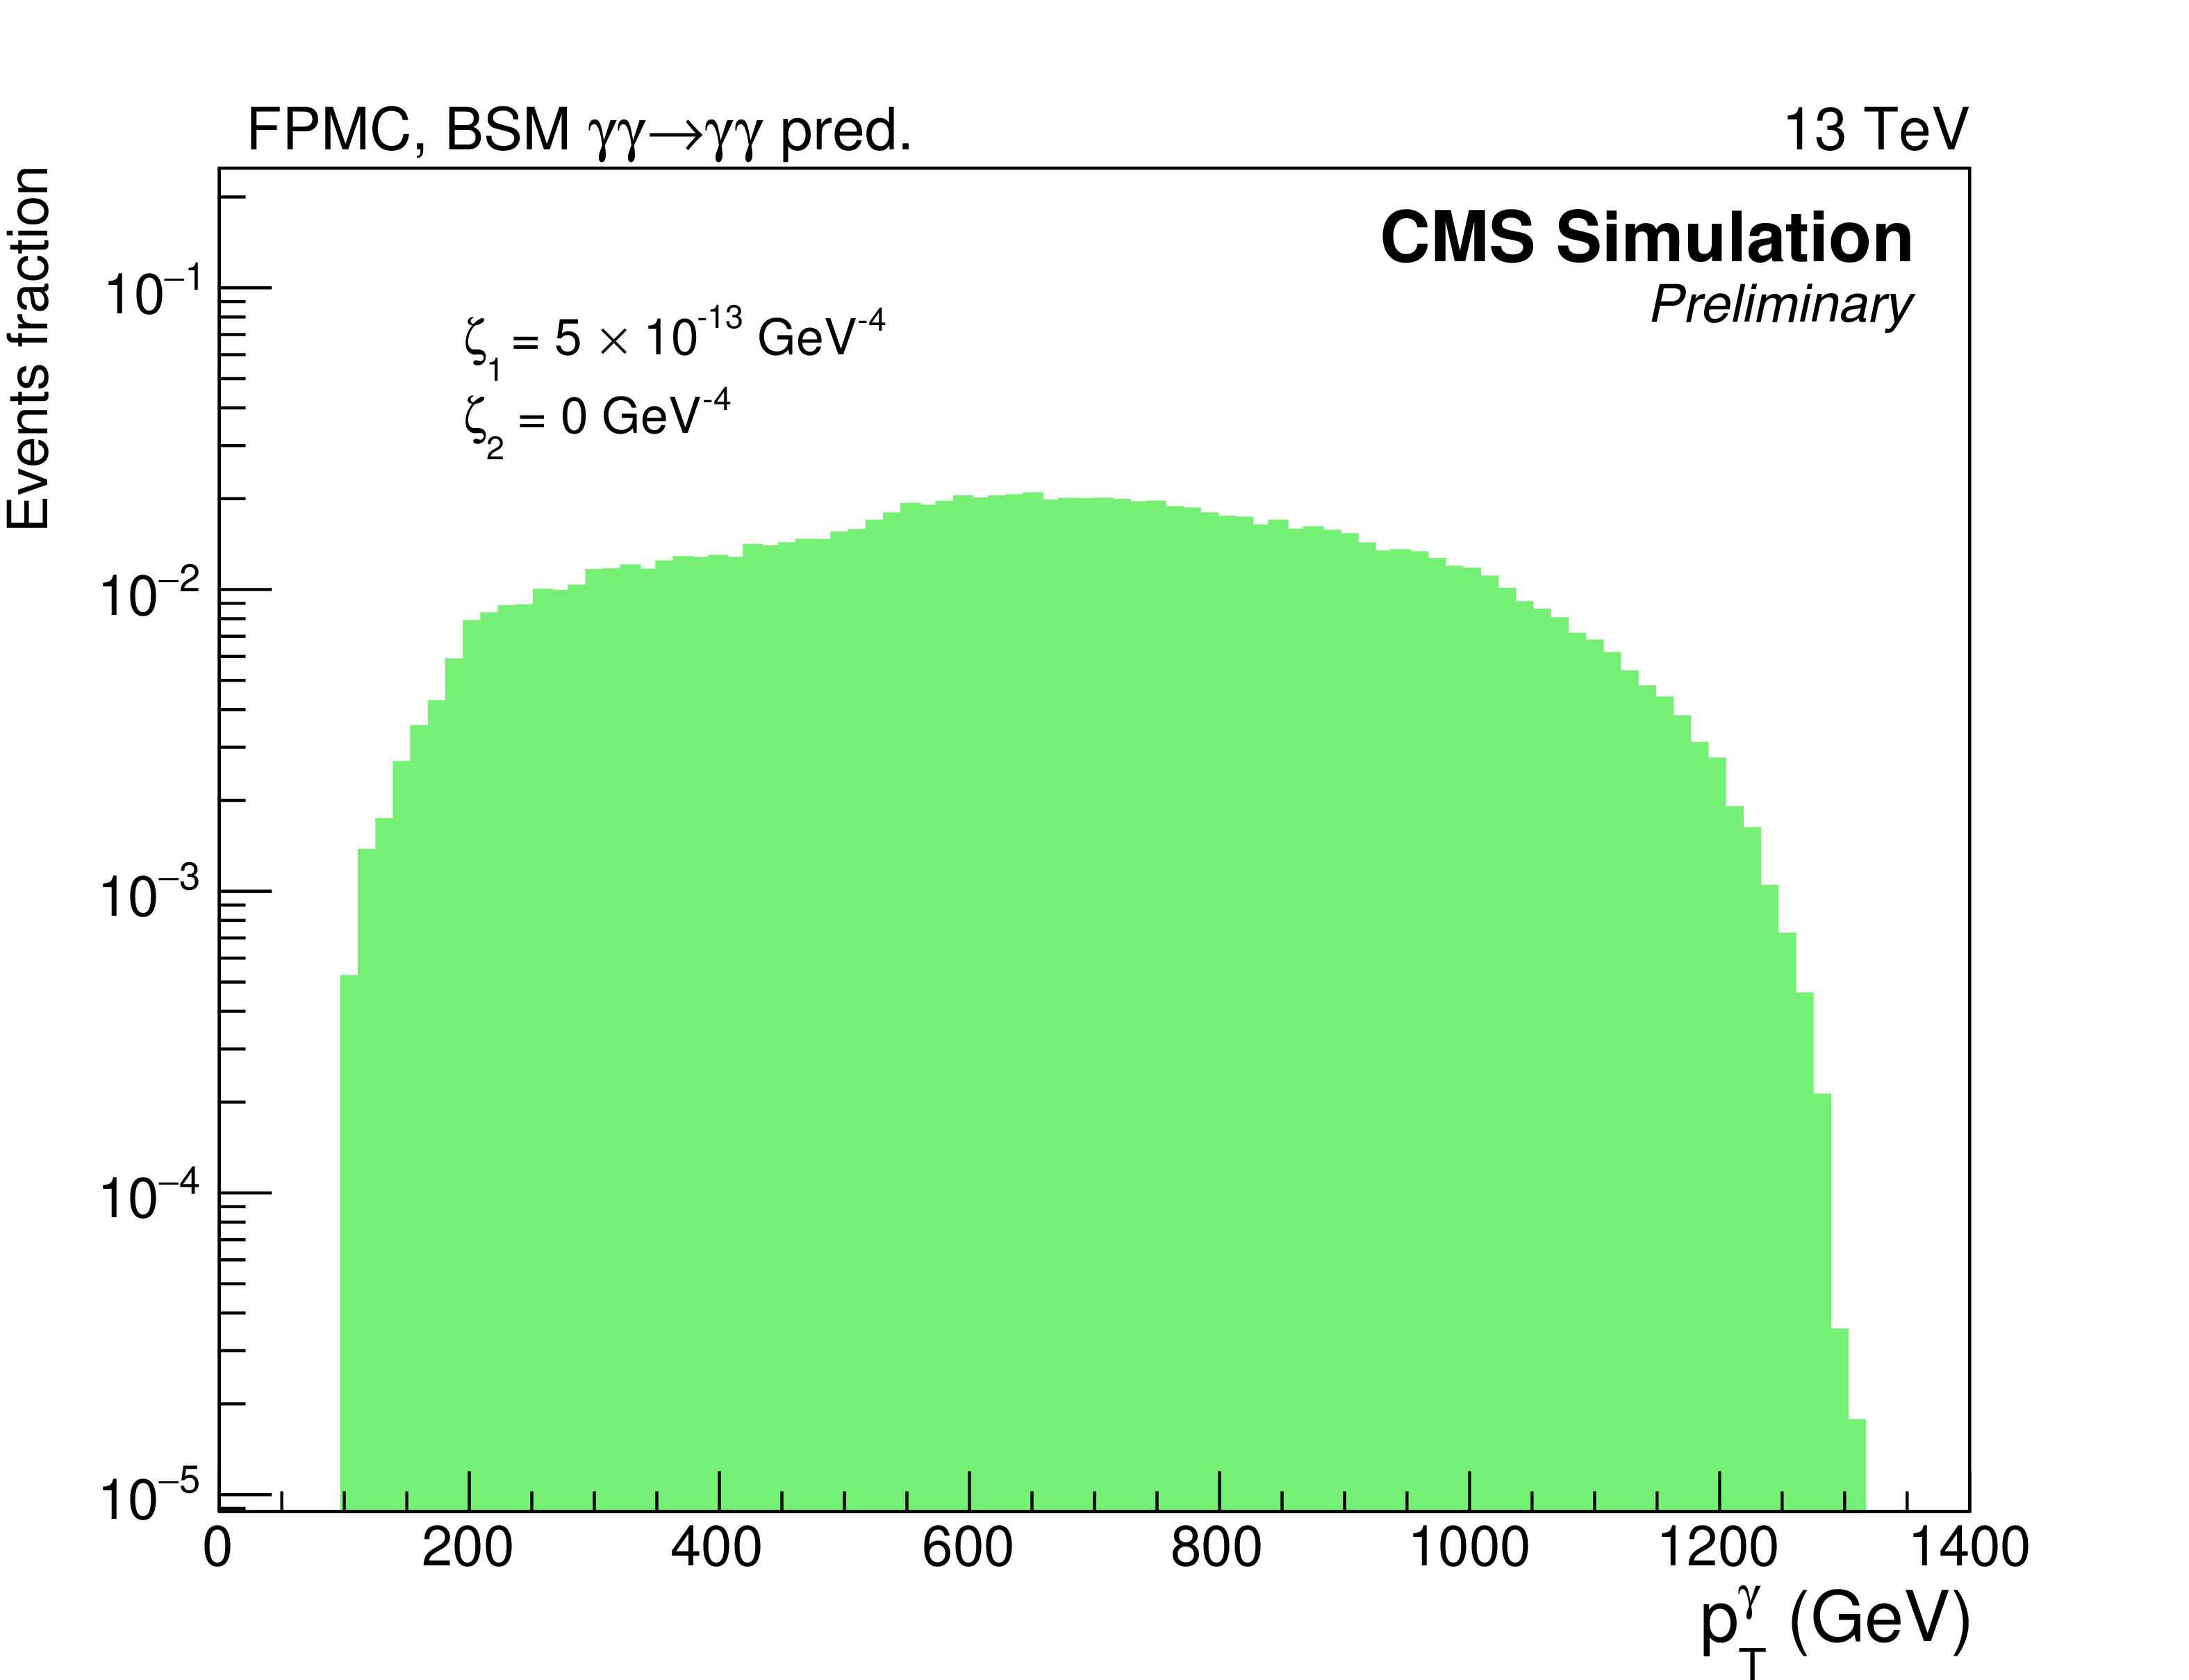
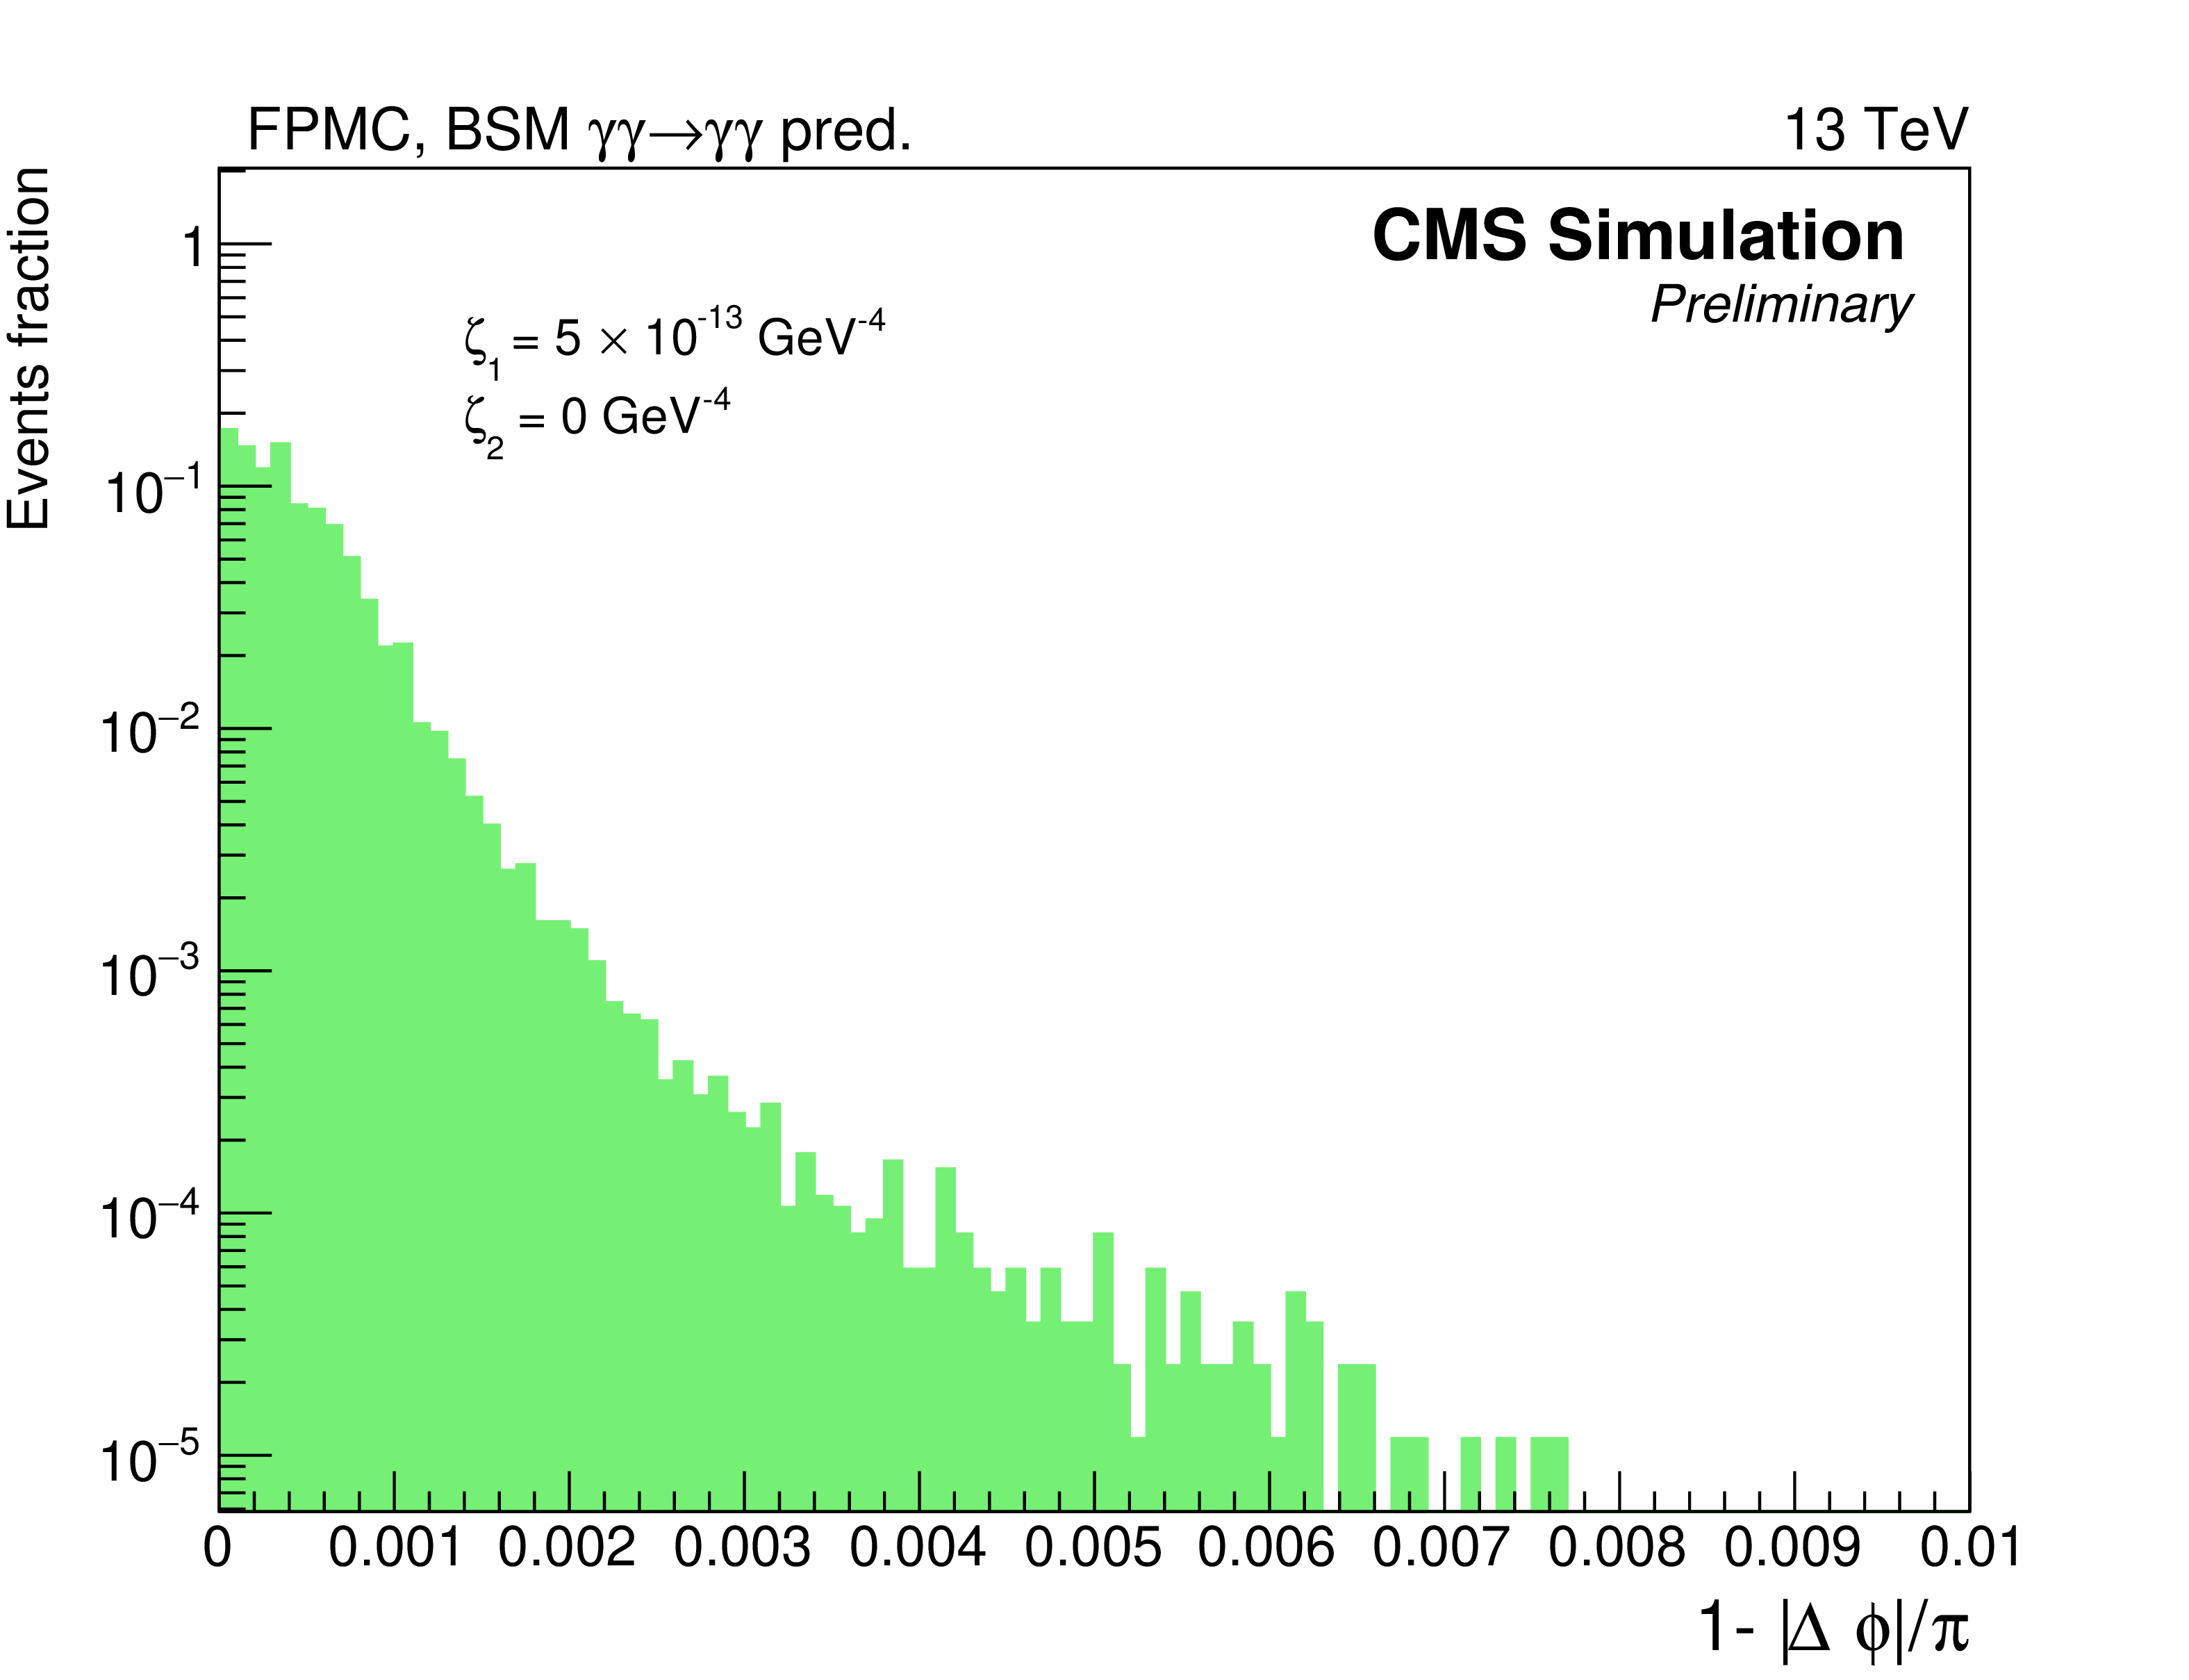
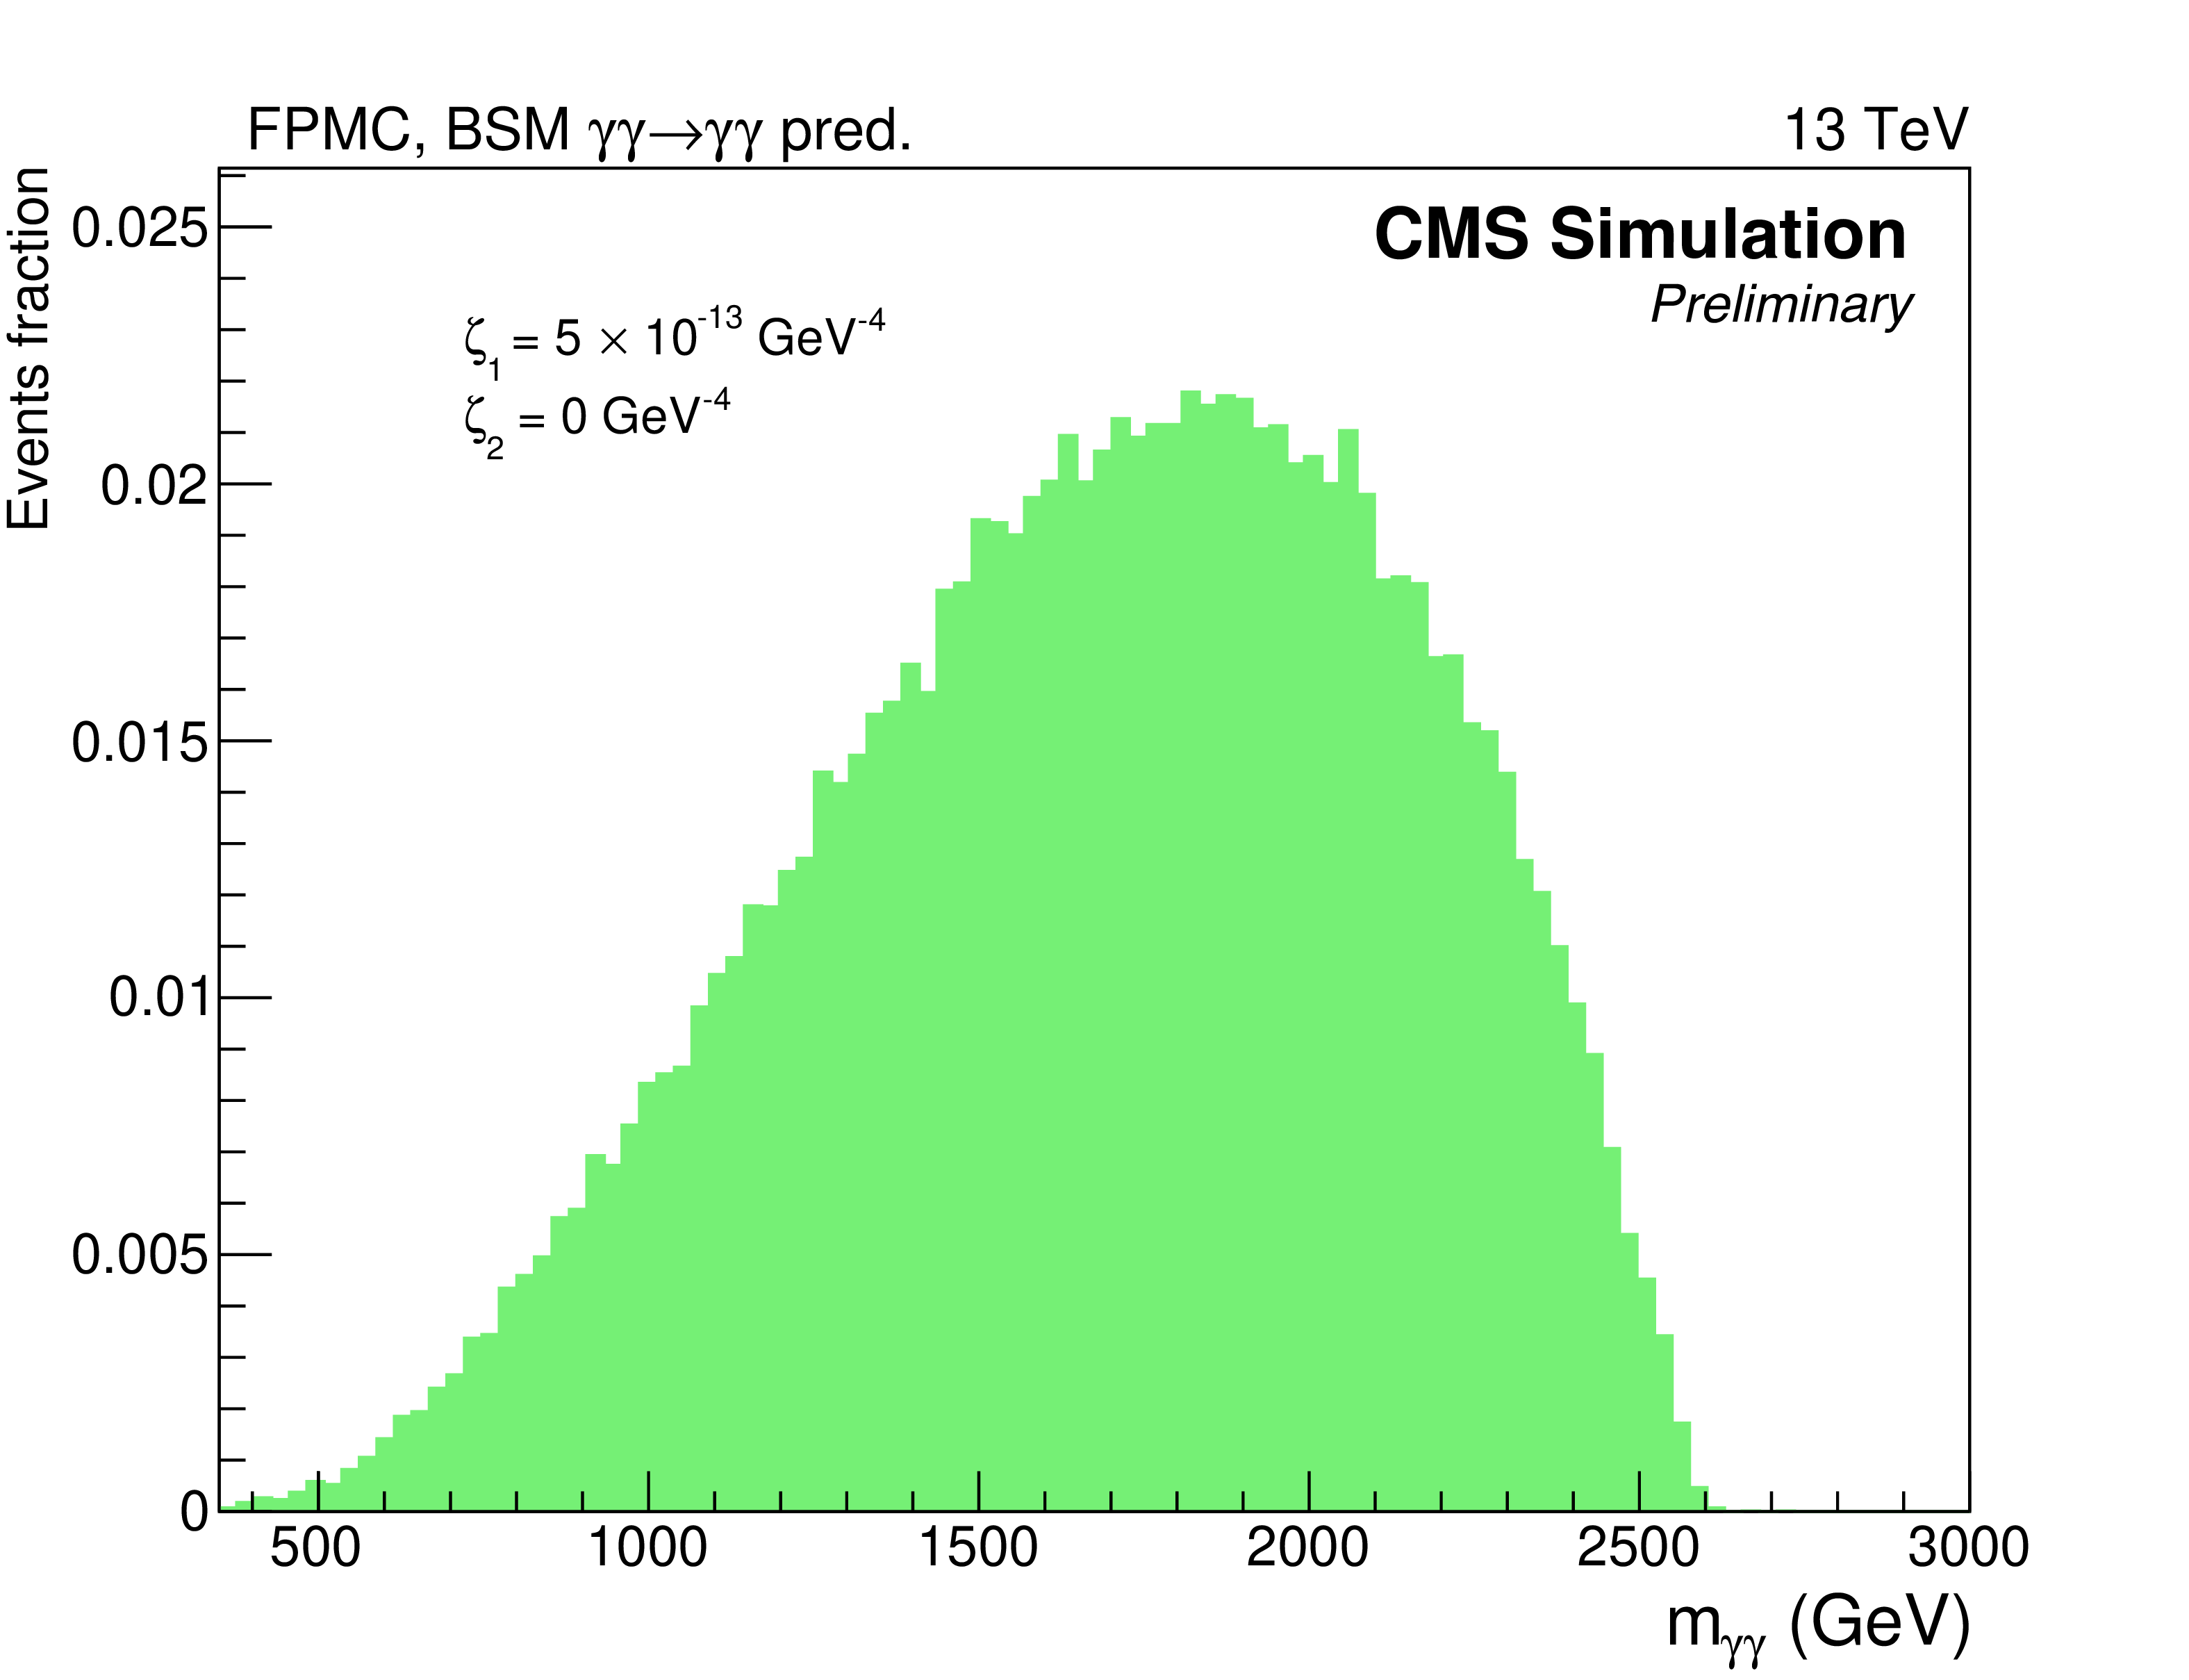
Anomalous Quartic Gauge Coupling (AQGC) signal kinematics for the single photon $\eta $ (top left), single photon ${p_{\mathrm {T}}}$ (top right), diphoton acoplanarity (bottom left), diphoton mass (bottom right). The signal simulation shown here is generated with FPMC for an AQGC signal using $\zeta _1 = $ 5 $\times$ 10$^{-13}$ GeV$^{-4}$, $\zeta _2 = $ 0 GeV$^{-4}$. The distributions represent the signal sample after undergoing the full CMS detector response. A preselection is applied to these events as described in Section 5. |
png pdf |
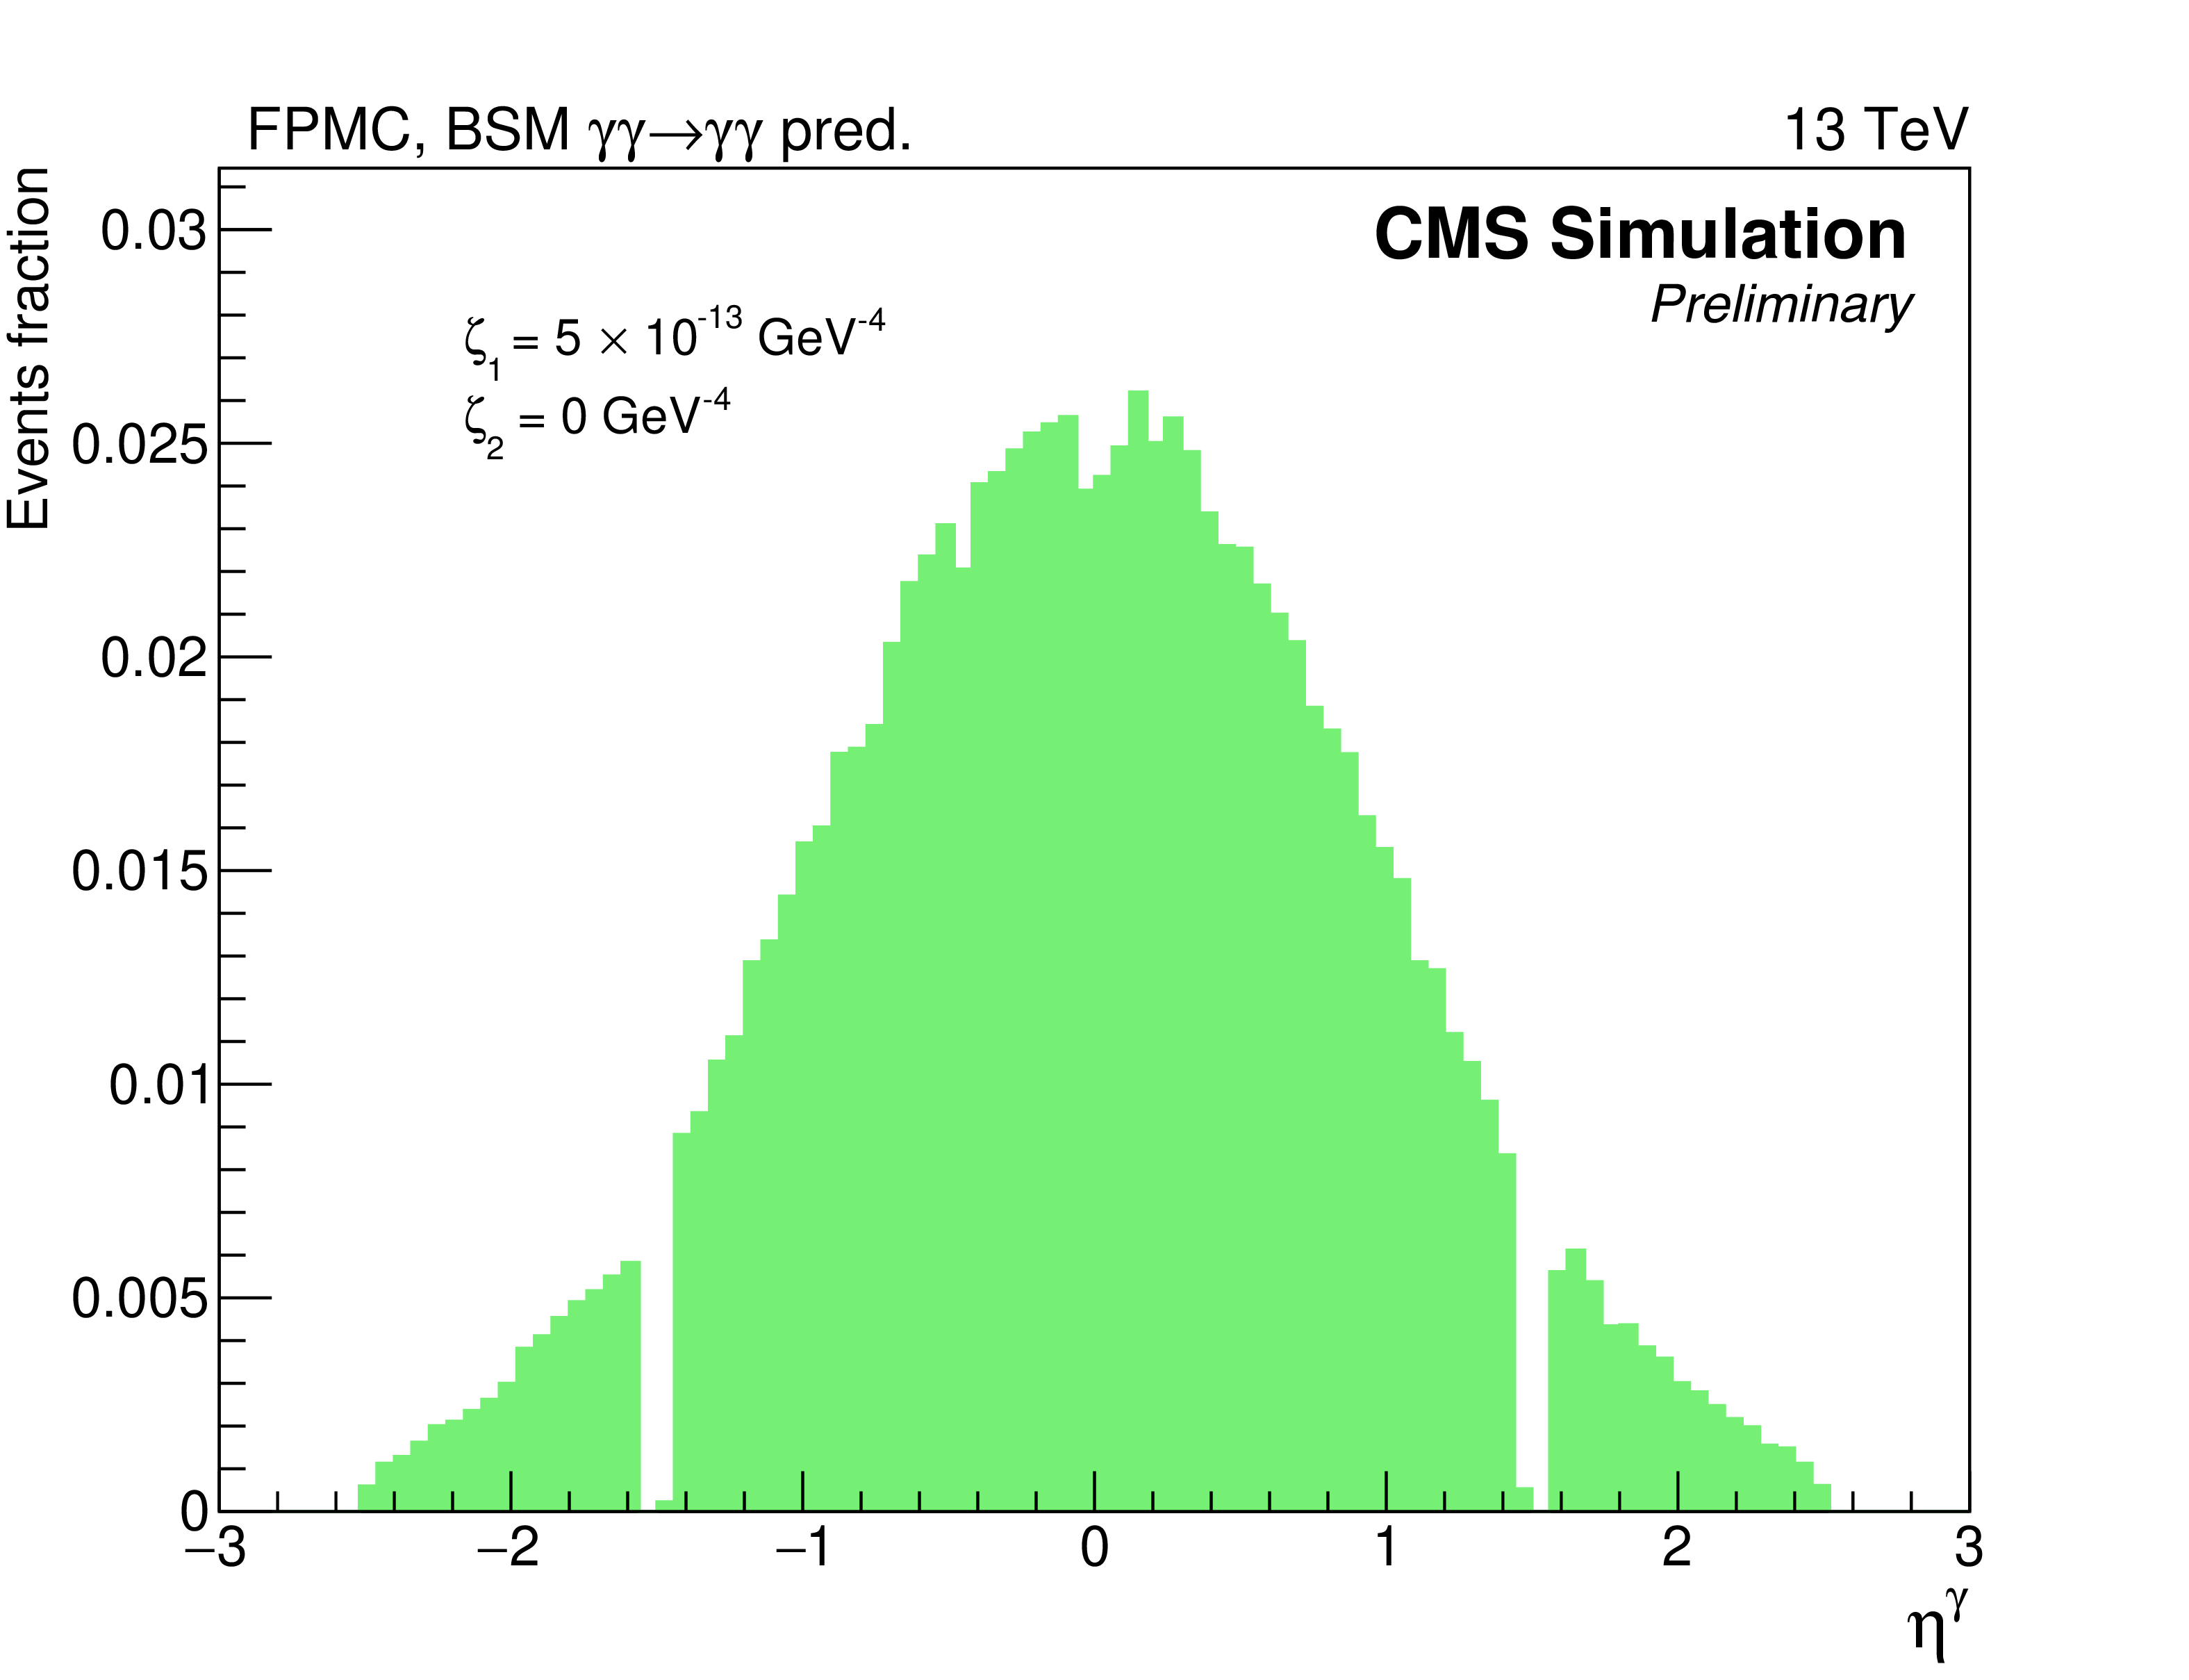
Figure 3-a:
Anomalous Quartic Gauge Coupling (AQGC) signal kinematics for the single photon $\eta $ (top left), single photon ${p_{\mathrm {T}}}$ (top right), diphoton acoplanarity (bottom left), diphoton mass (bottom right). The signal simulation shown here is generated with FPMC for an AQGC signal using $\zeta _1 = $ 5 $\times$ 10$^{-13}$ GeV$^{-4}$, $\zeta _2 = $ 0 GeV$^{-4}$. The distributions represent the signal sample after undergoing the full CMS detector response. A preselection is applied to these events as described in Section 5. |
png pdf |
Figure 3-b:
Anomalous Quartic Gauge Coupling (AQGC) signal kinematics for the single photon $\eta $ (top left), single photon ${p_{\mathrm {T}}}$ (top right), diphoton acoplanarity (bottom left), diphoton mass (bottom right). The signal simulation shown here is generated with FPMC for an AQGC signal using $\zeta _1 = $ 5 $\times$ 10$^{-13}$ GeV$^{-4}$, $\zeta _2 = $ 0 GeV$^{-4}$. The distributions represent the signal sample after undergoing the full CMS detector response. A preselection is applied to these events as described in Section 5. |
png pdf |
Figure 3-c:
Anomalous Quartic Gauge Coupling (AQGC) signal kinematics for the single photon $\eta $ (top left), single photon ${p_{\mathrm {T}}}$ (top right), diphoton acoplanarity (bottom left), diphoton mass (bottom right). The signal simulation shown here is generated with FPMC for an AQGC signal using $\zeta _1 = $ 5 $\times$ 10$^{-13}$ GeV$^{-4}$, $\zeta _2 = $ 0 GeV$^{-4}$. The distributions represent the signal sample after undergoing the full CMS detector response. A preselection is applied to these events as described in Section 5. |
png pdf |
Figure 3-d:
Anomalous Quartic Gauge Coupling (AQGC) signal kinematics for the single photon $\eta $ (top left), single photon ${p_{\mathrm {T}}}$ (top right), diphoton acoplanarity (bottom left), diphoton mass (bottom right). The signal simulation shown here is generated with FPMC for an AQGC signal using $\zeta _1 = $ 5 $\times$ 10$^{-13}$ GeV$^{-4}$, $\zeta _2 = $ 0 GeV$^{-4}$. The distributions represent the signal sample after undergoing the full CMS detector response. A preselection is applied to these events as described in Section 5. |
png pdf |
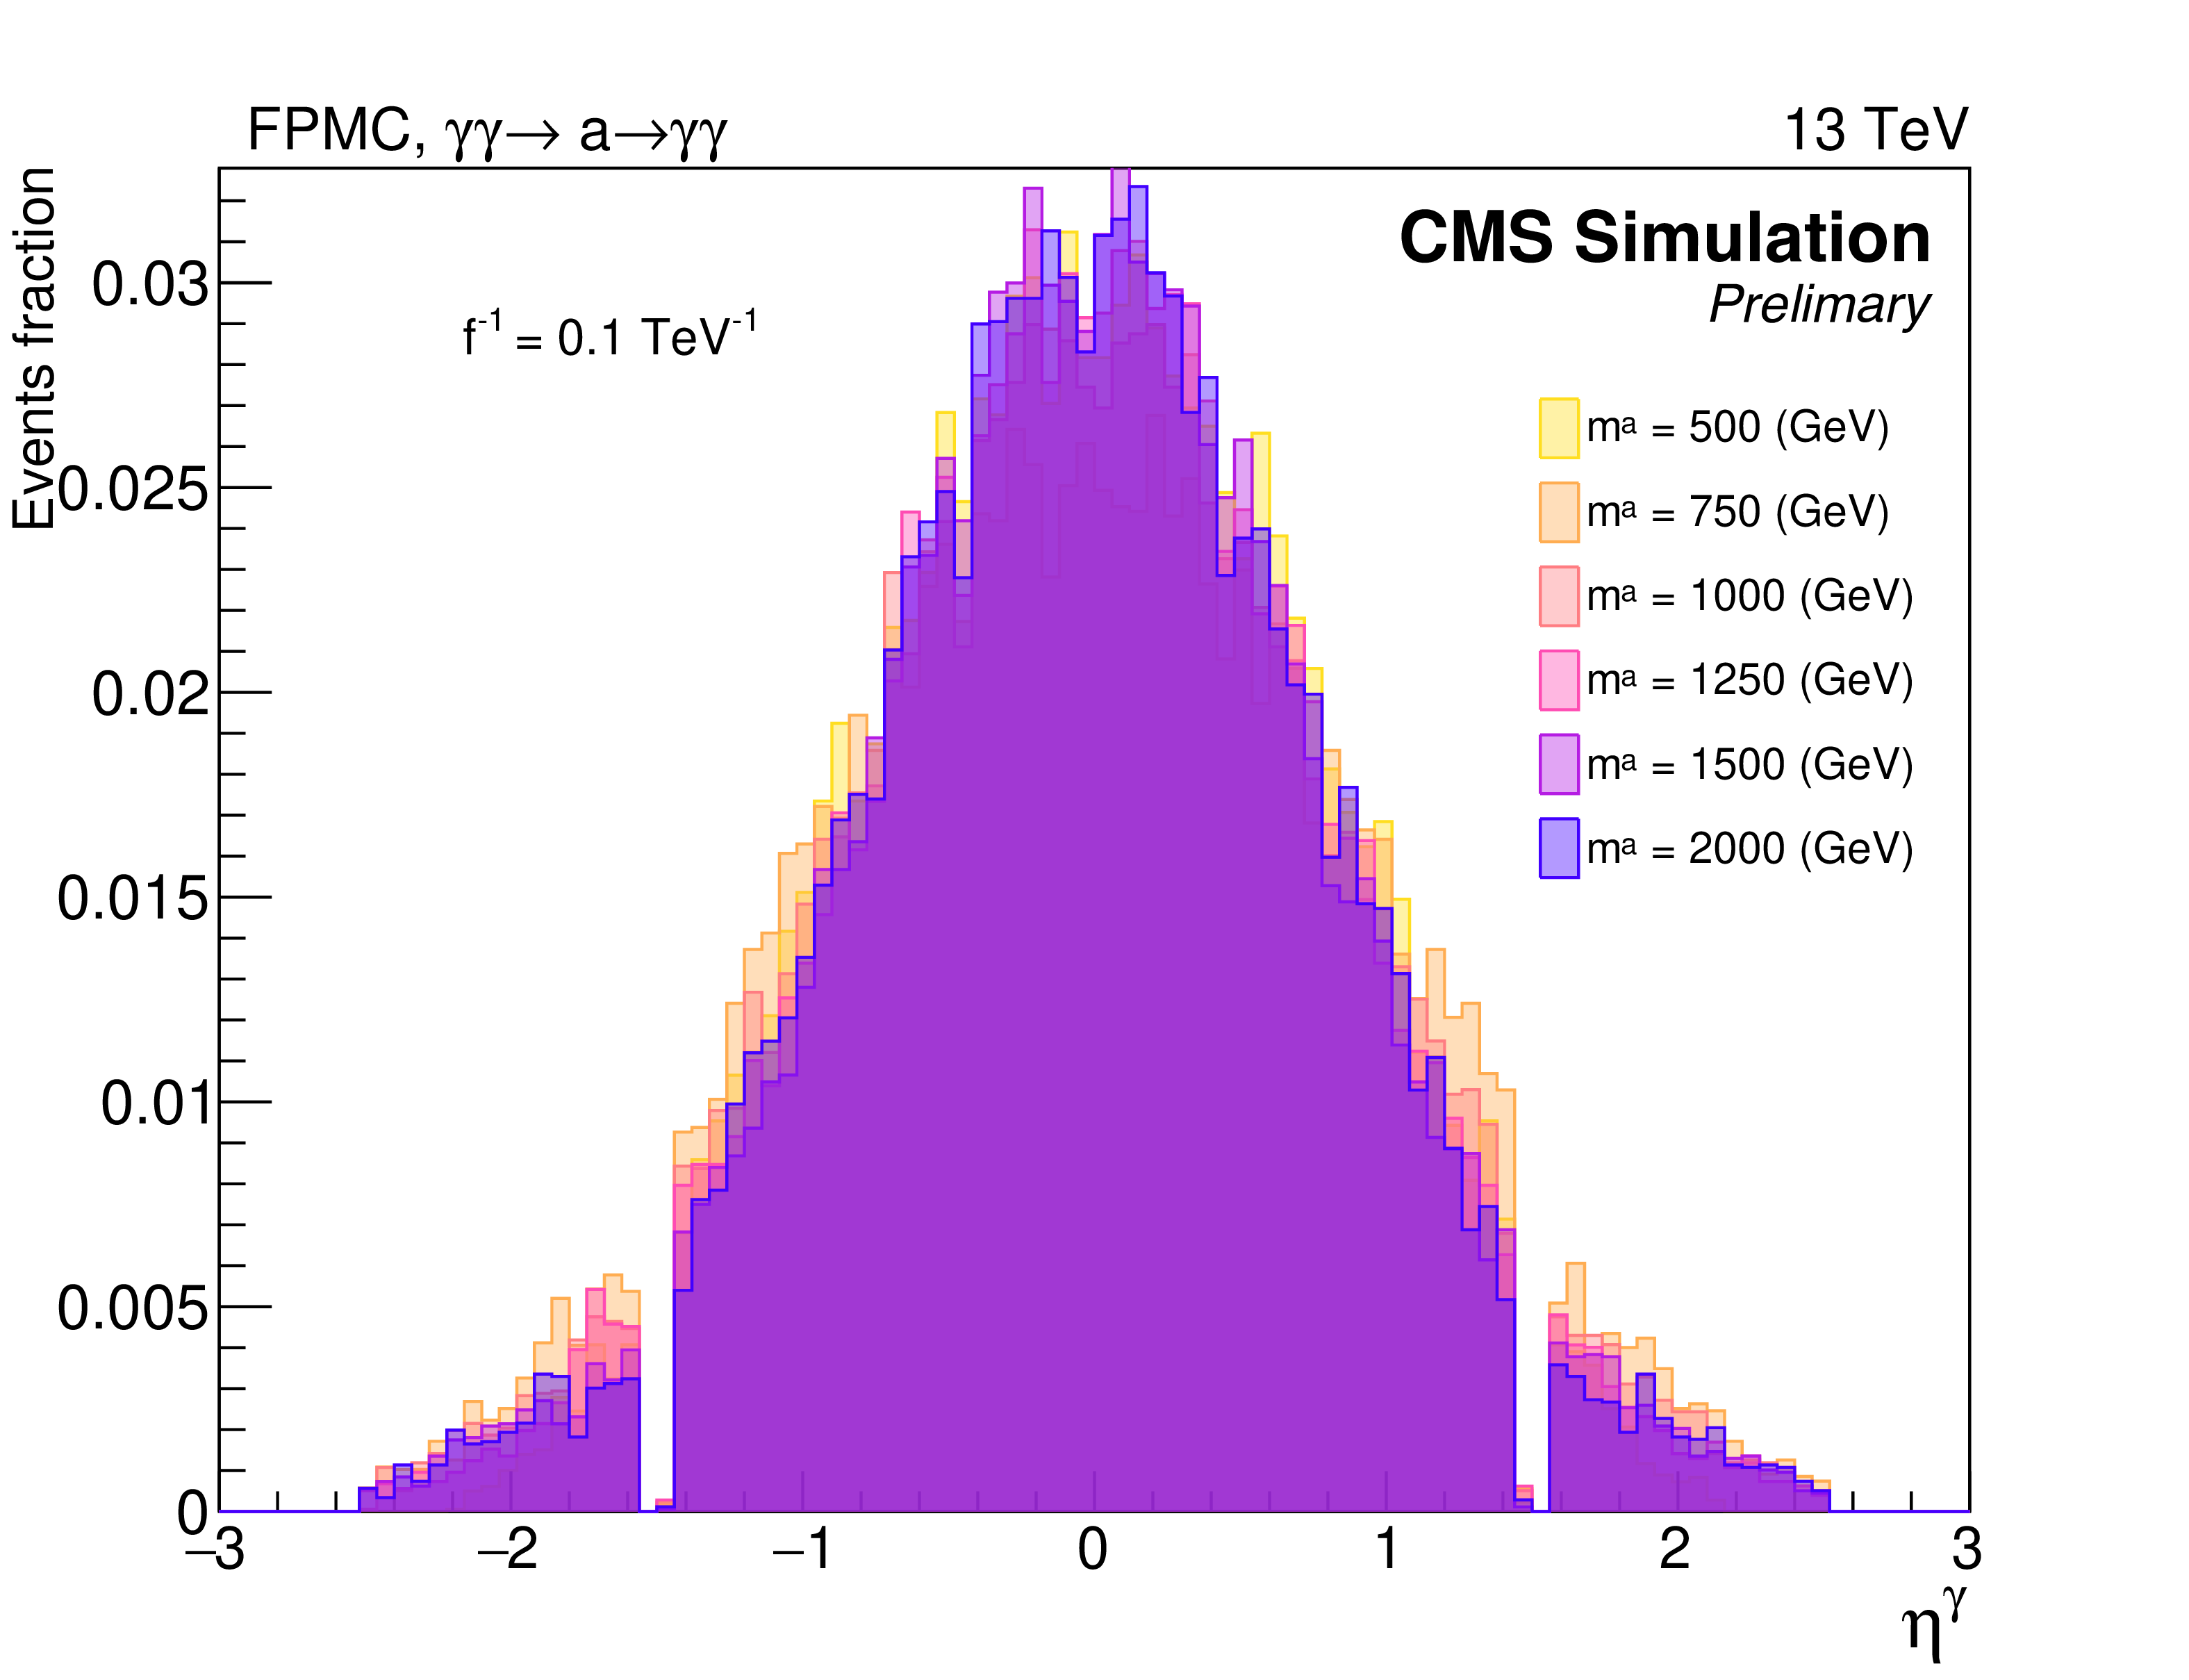
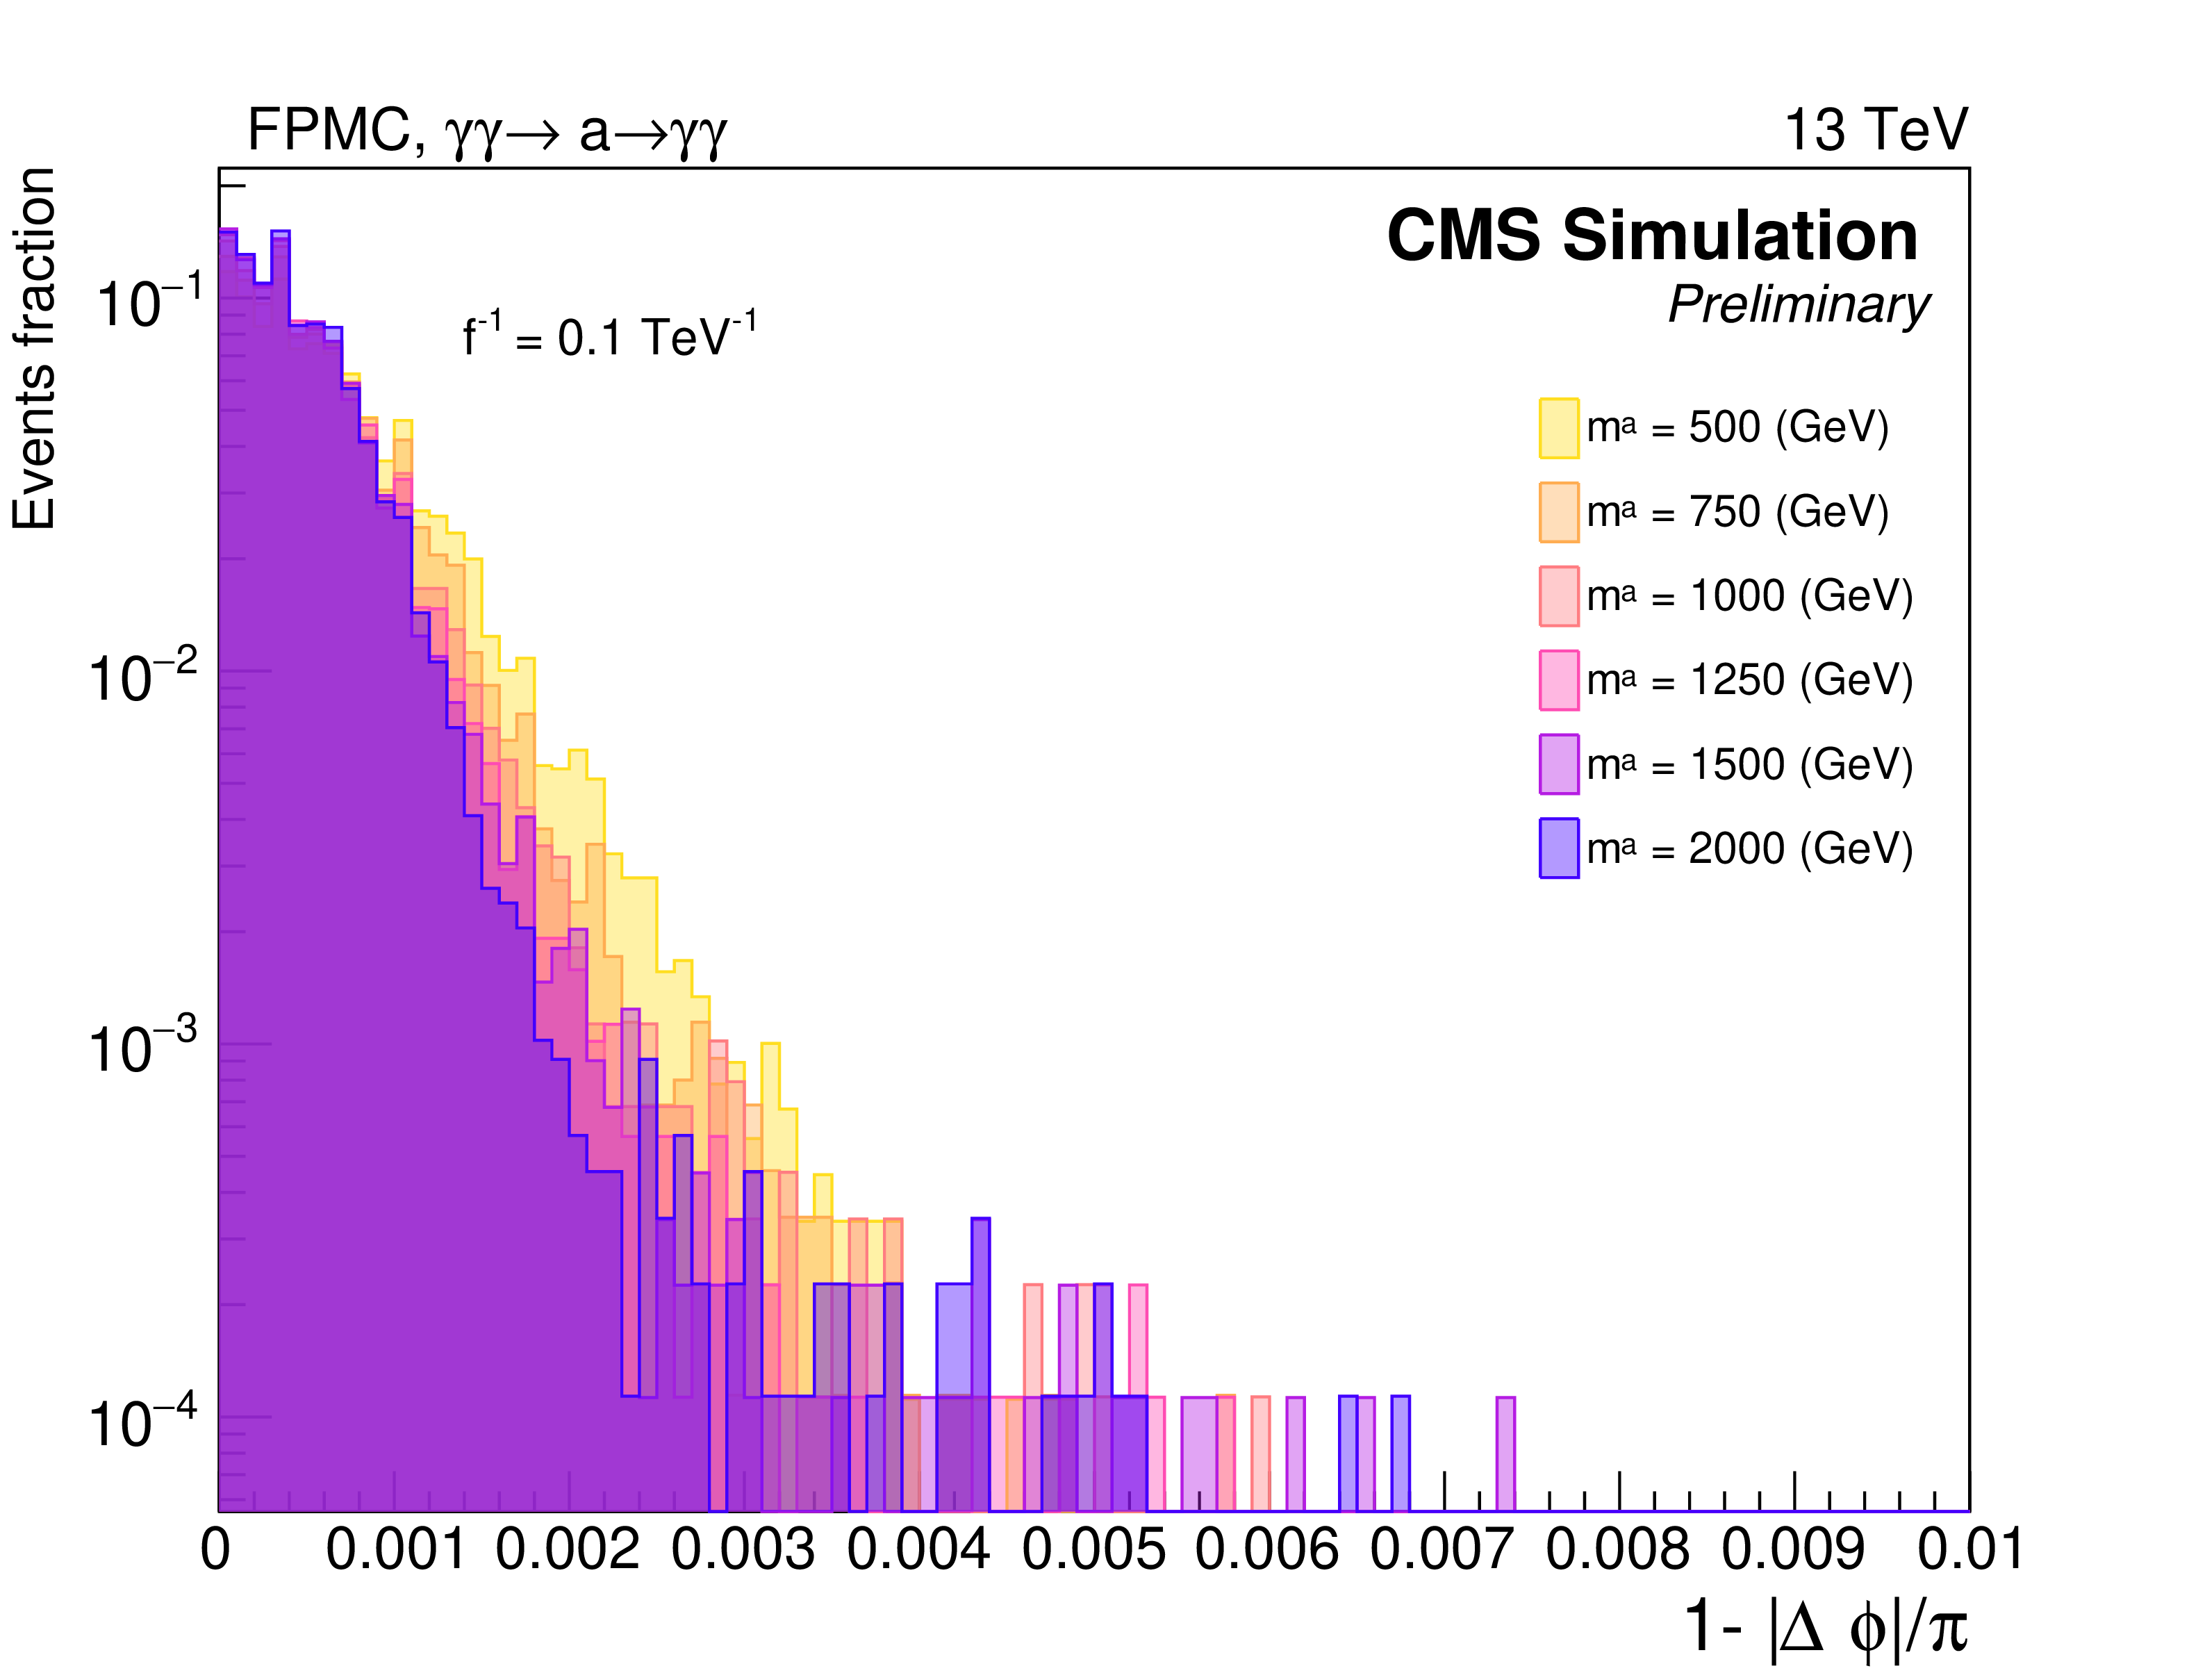
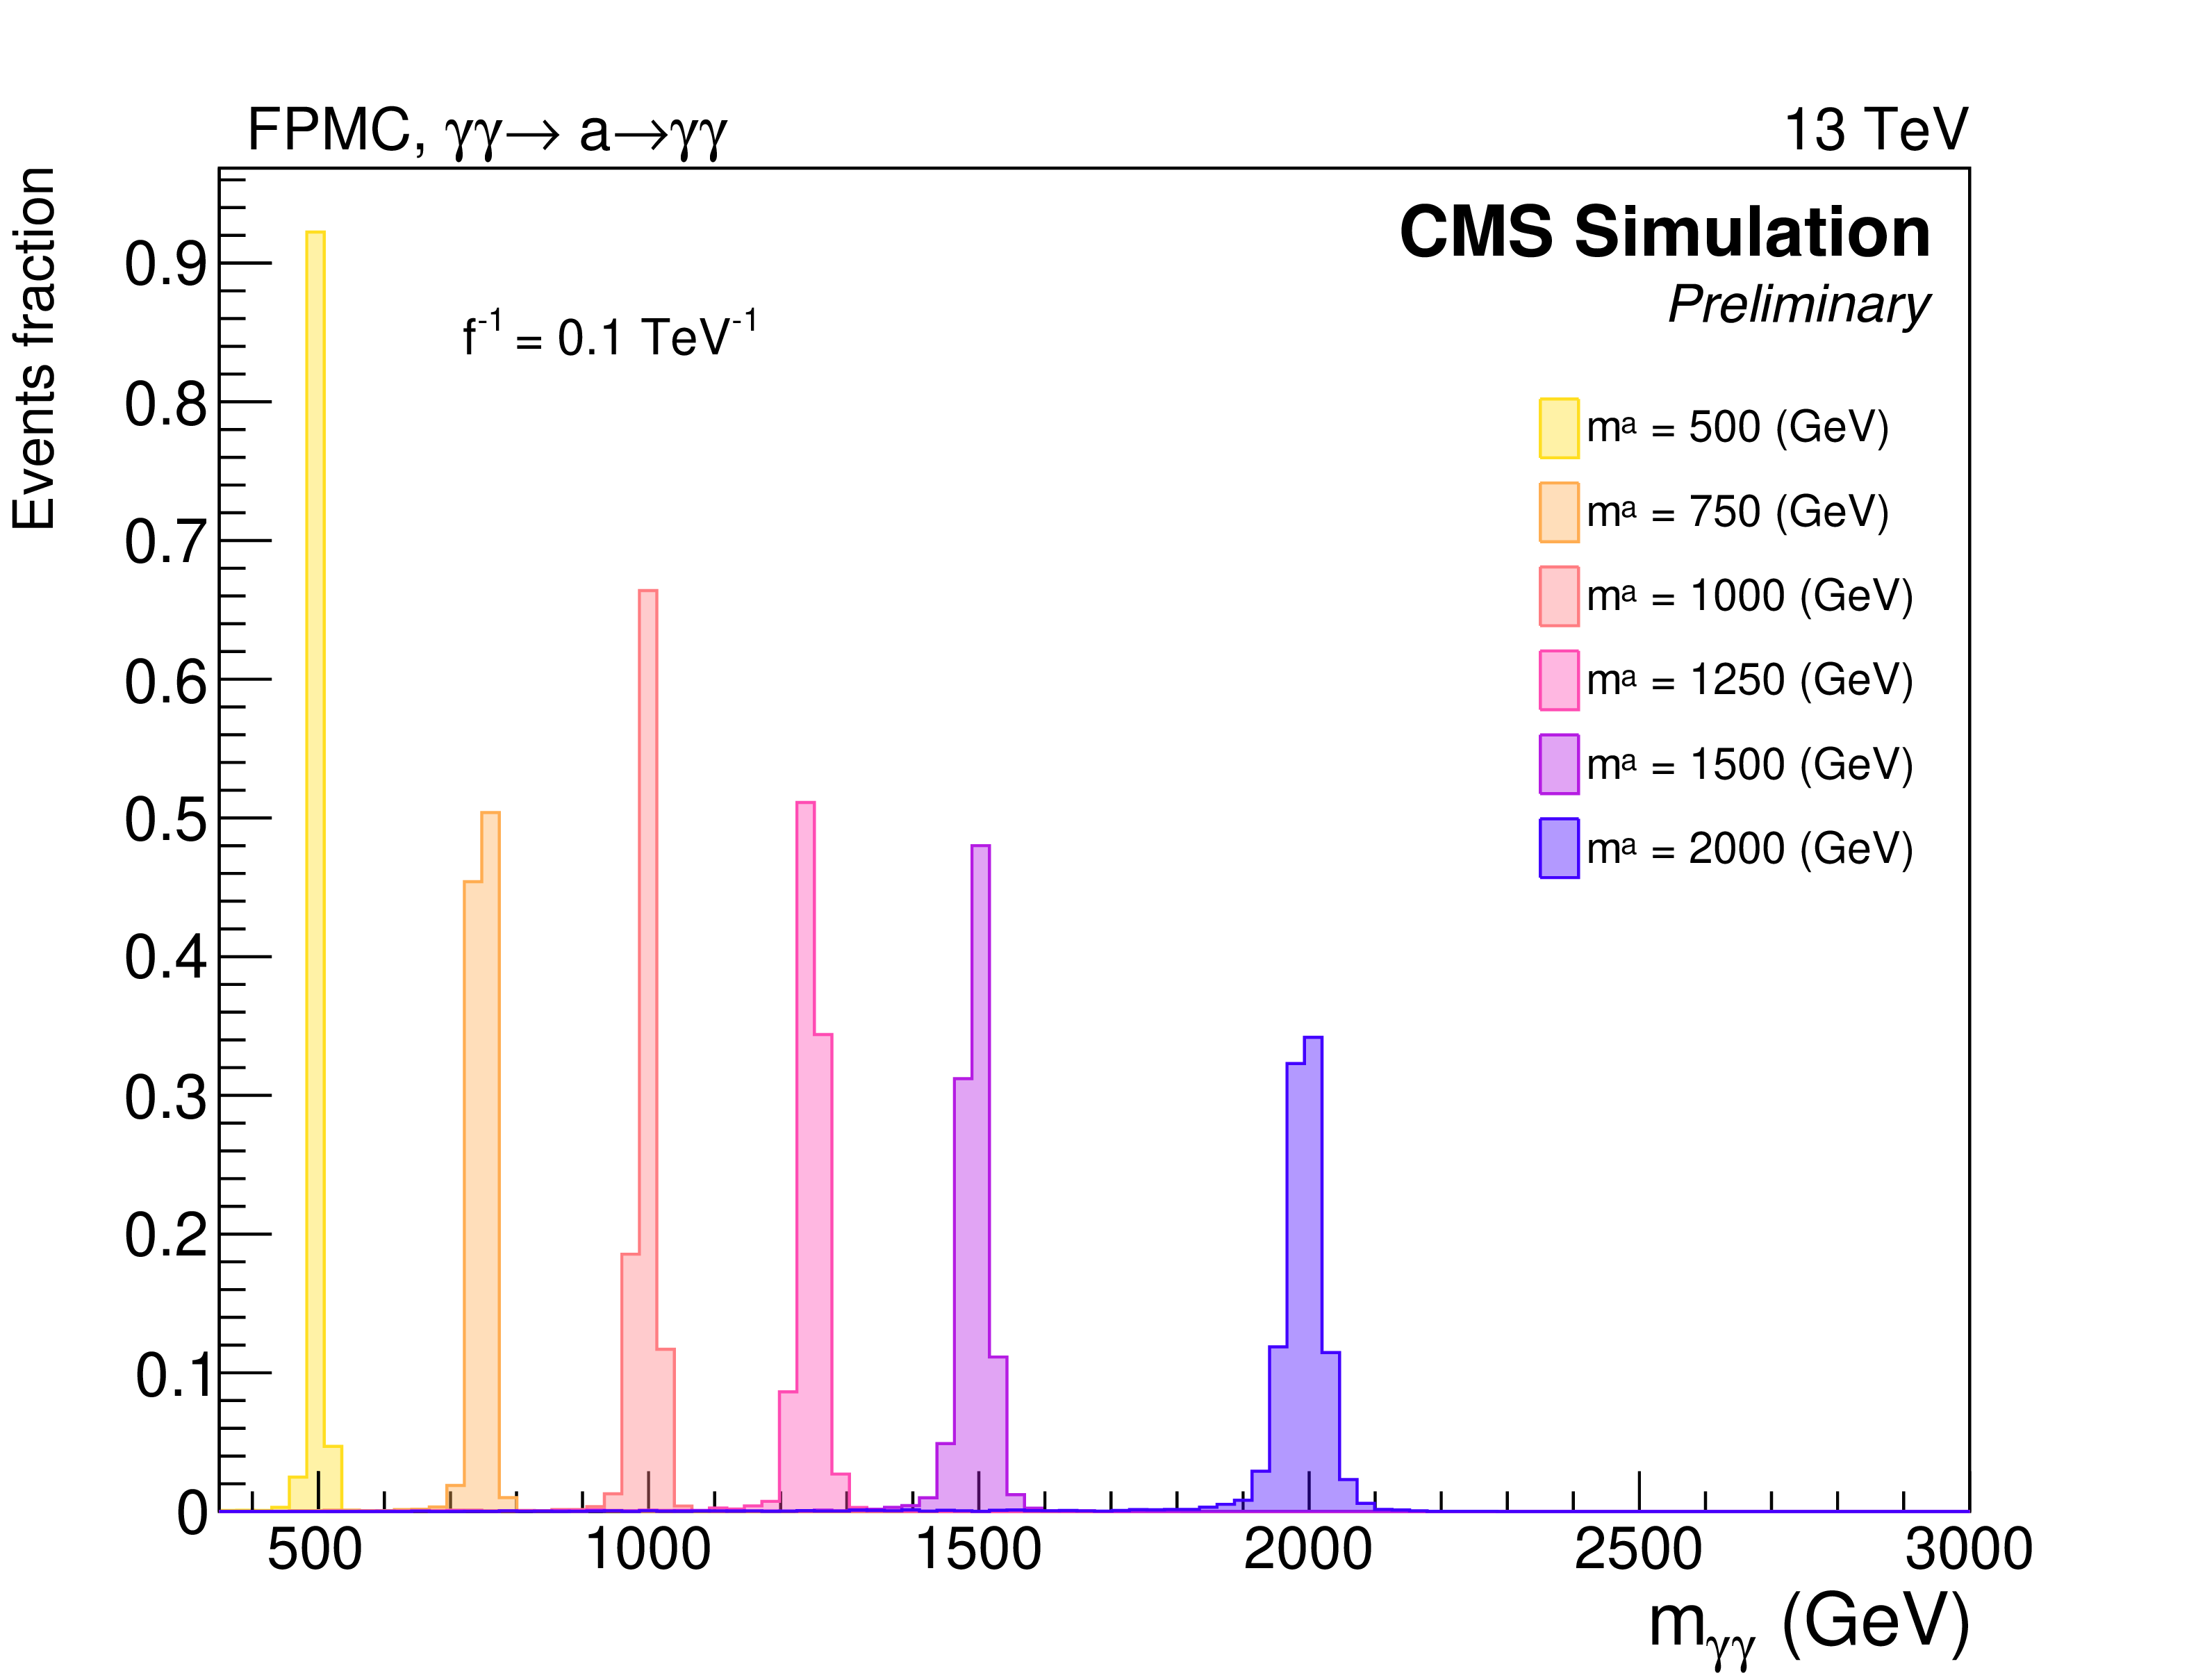
Figure 4:
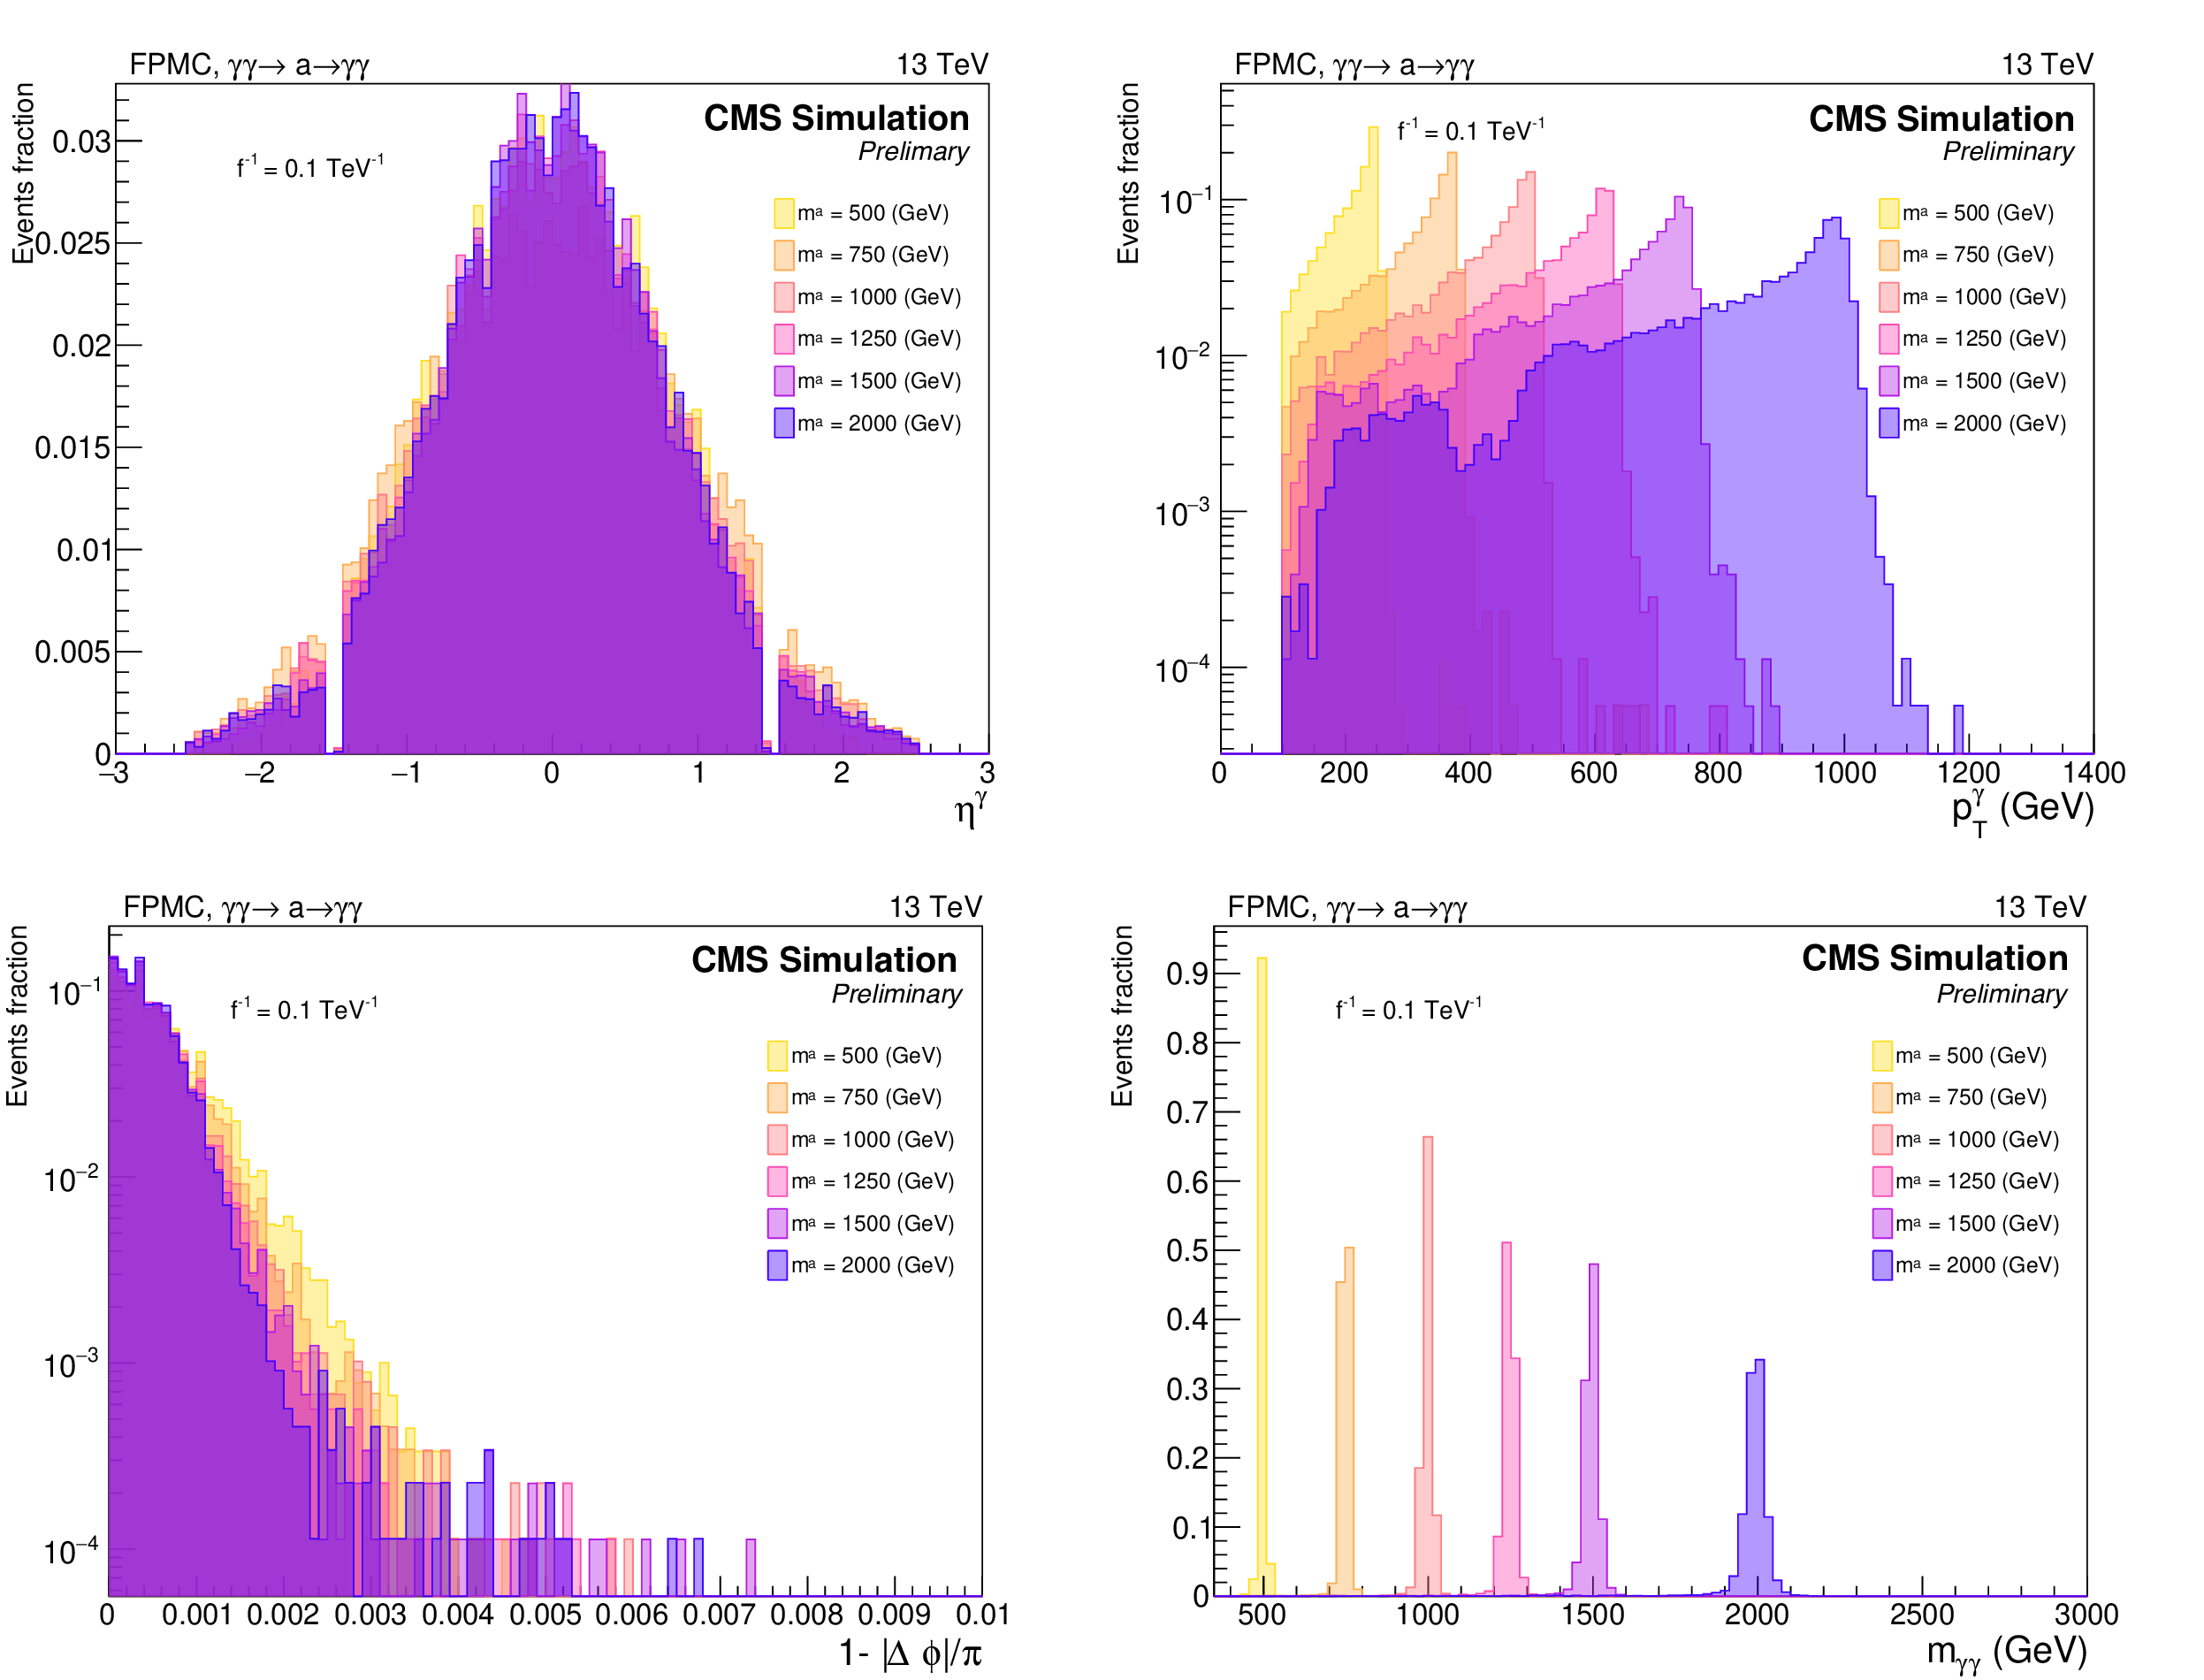
Axion-like particle (ALP) signal kinematics for the single photon $\eta $ (top left), single photon ${p_{\mathrm {T}}}$ (top right), diphoton acoplanarity (bottom left), diphoton mass (bottom right). The signal simulation shown here is generated with FPMC for ALP signals using $f^{-1} = $ 10$^{-1}$ TeV$ ^{-1}$. The distributions represent the signal sample after undergoing the full CMS detector response. A preselection is applied to these events as described in Section 5. |
png pdf |
Figure 4-a:
Axion-like particle (ALP) signal kinematics for the single photon $\eta $ (top left), single photon ${p_{\mathrm {T}}}$ (top right), diphoton acoplanarity (bottom left), diphoton mass (bottom right). The signal simulation shown here is generated with FPMC for ALP signals using $f^{-1} = $ 10$^{-1}$ TeV$ ^{-1}$. The distributions represent the signal sample after undergoing the full CMS detector response. A preselection is applied to these events as described in Section 5. |

png pdf |
Figure 4-b:
Axion-like particle (ALP) signal kinematics for the single photon $\eta $ (top left), single photon ${p_{\mathrm {T}}}$ (top right), diphoton acoplanarity (bottom left), diphoton mass (bottom right). The signal simulation shown here is generated with FPMC for ALP signals using $f^{-1} = $ 10$^{-1}$ TeV$ ^{-1}$. The distributions represent the signal sample after undergoing the full CMS detector response. A preselection is applied to these events as described in Section 5. |
png pdf |
Figure 4-c:
Axion-like particle (ALP) signal kinematics for the single photon $\eta $ (top left), single photon ${p_{\mathrm {T}}}$ (top right), diphoton acoplanarity (bottom left), diphoton mass (bottom right). The signal simulation shown here is generated with FPMC for ALP signals using $f^{-1} = $ 10$^{-1}$ TeV$ ^{-1}$. The distributions represent the signal sample after undergoing the full CMS detector response. A preselection is applied to these events as described in Section 5. |
png pdf |
Figure 4-d:
Axion-like particle (ALP) signal kinematics for the single photon $\eta $ (top left), single photon ${p_{\mathrm {T}}}$ (top right), diphoton acoplanarity (bottom left), diphoton mass (bottom right). The signal simulation shown here is generated with FPMC for ALP signals using $f^{-1} = $ 10$^{-1}$ TeV$ ^{-1}$. The distributions represent the signal sample after undergoing the full CMS detector response. A preselection is applied to these events as described in Section 5. |
png pdf |
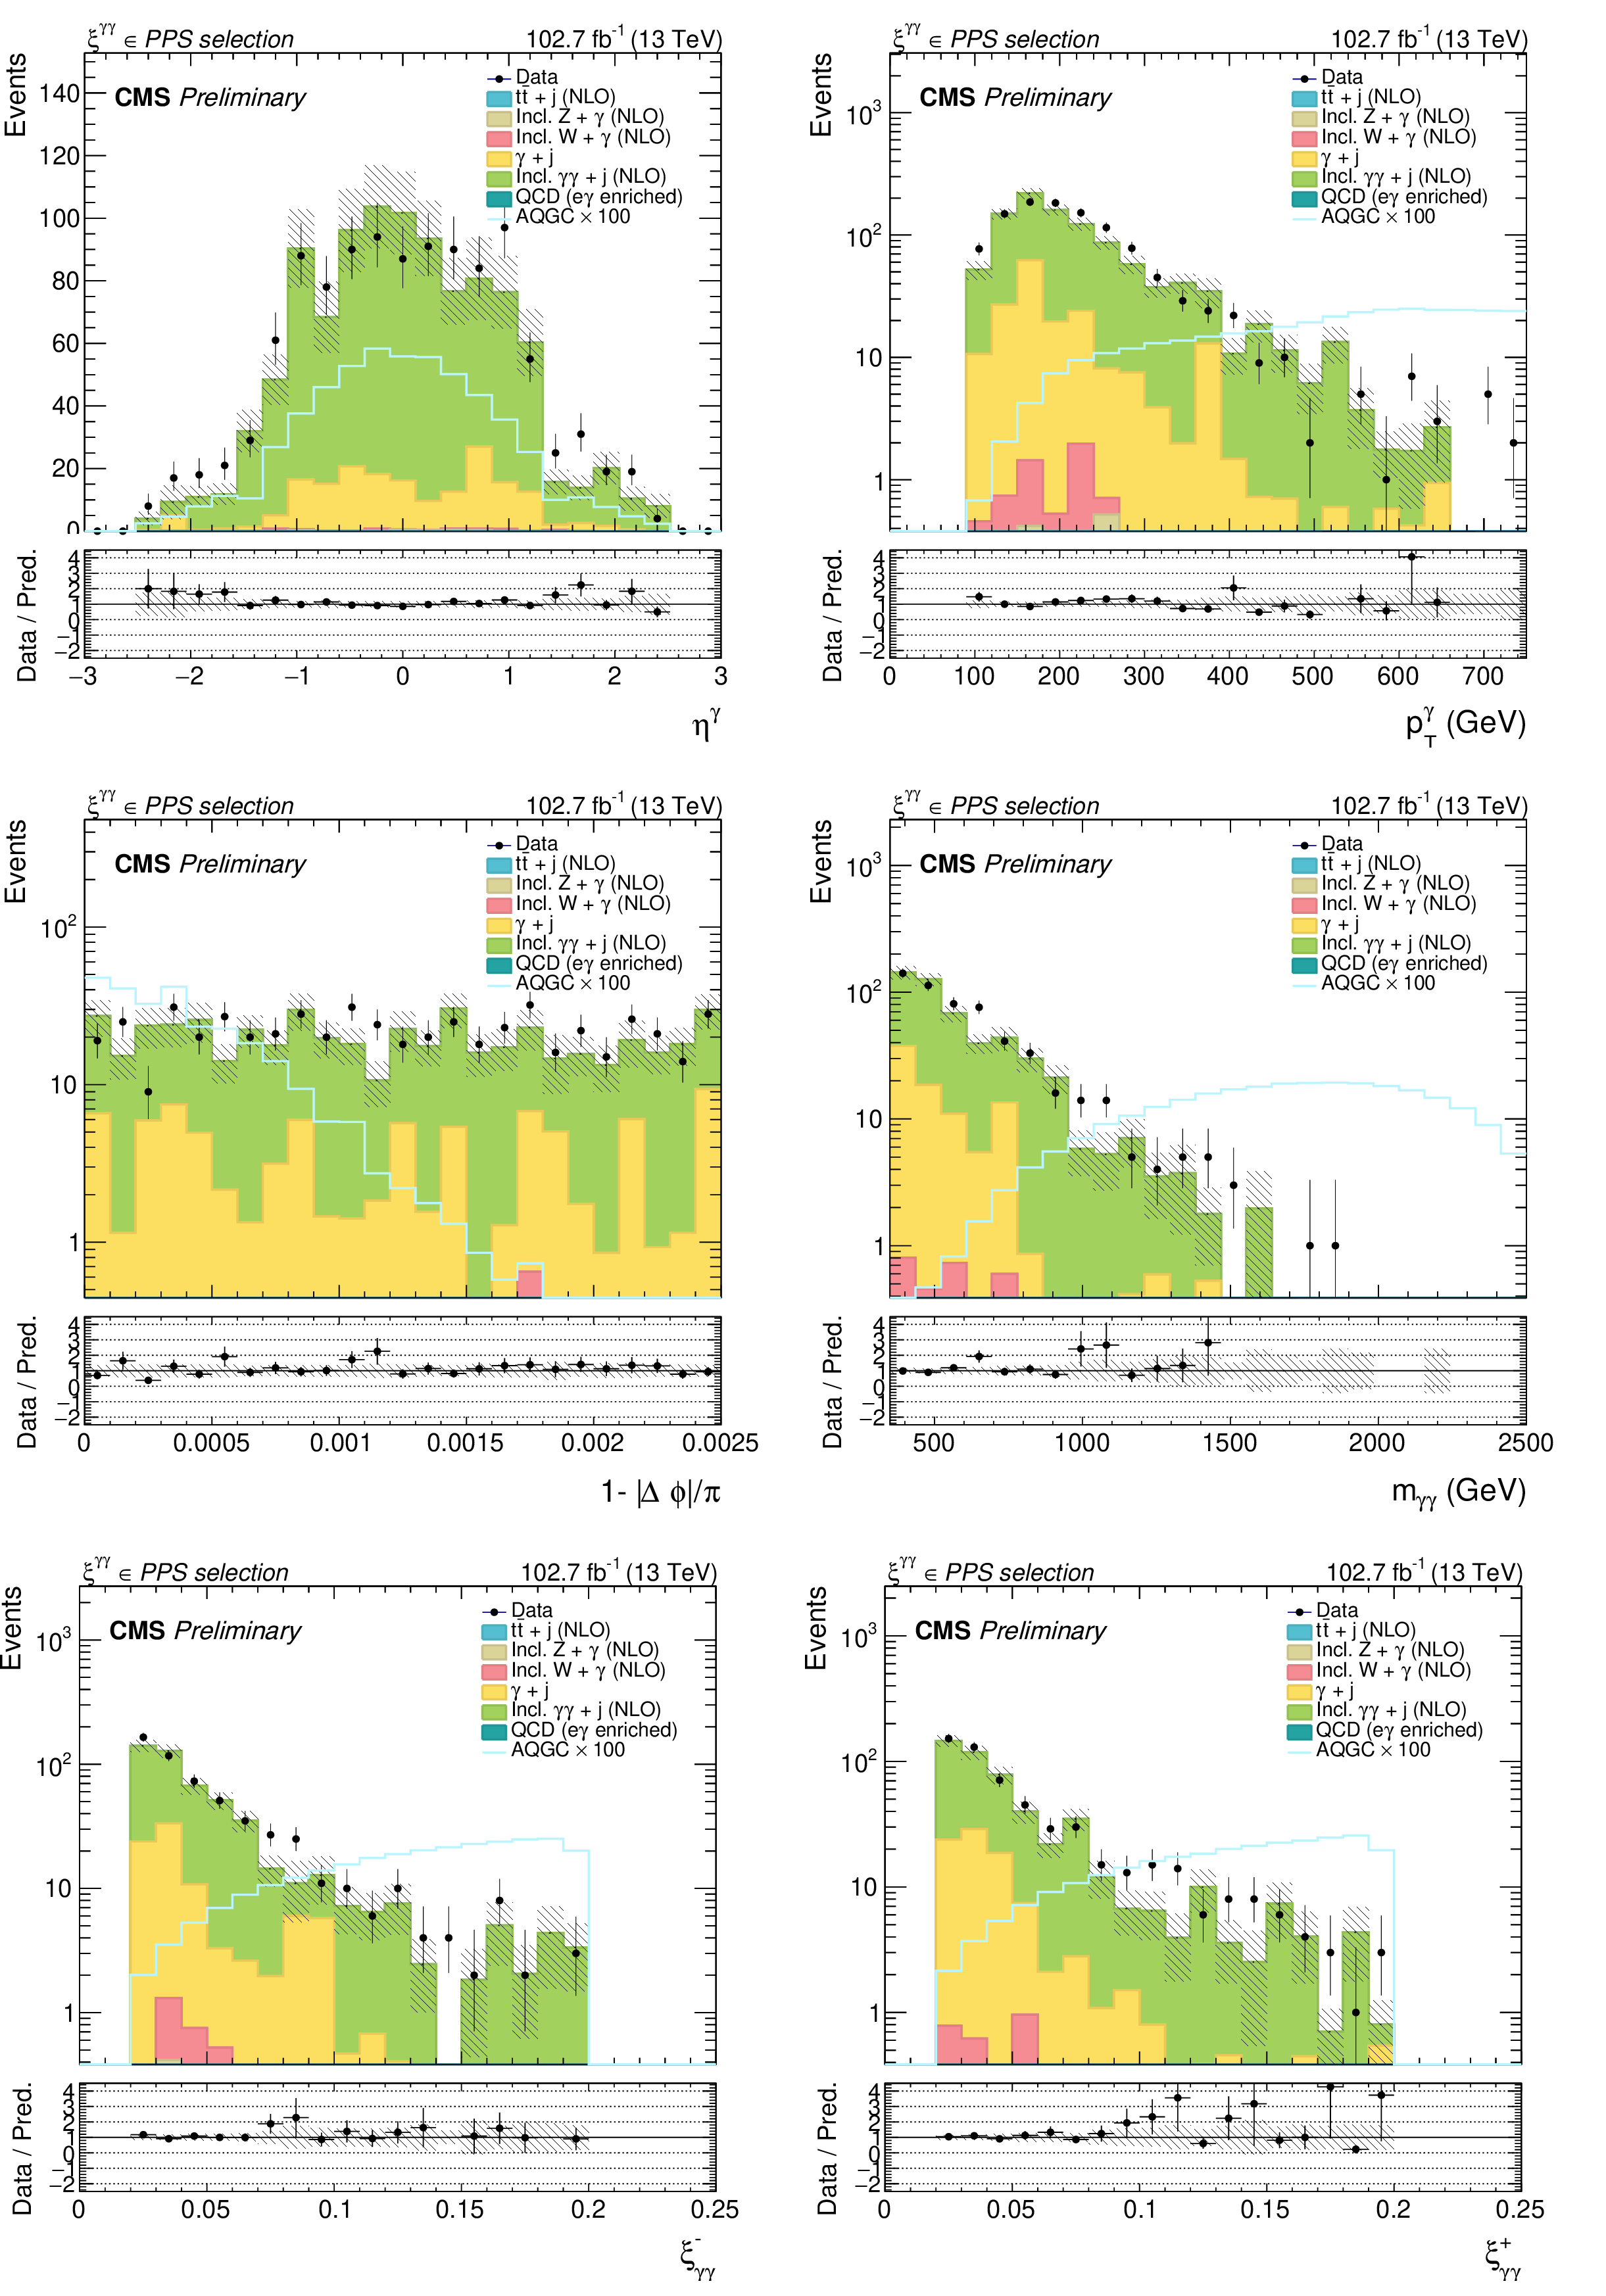
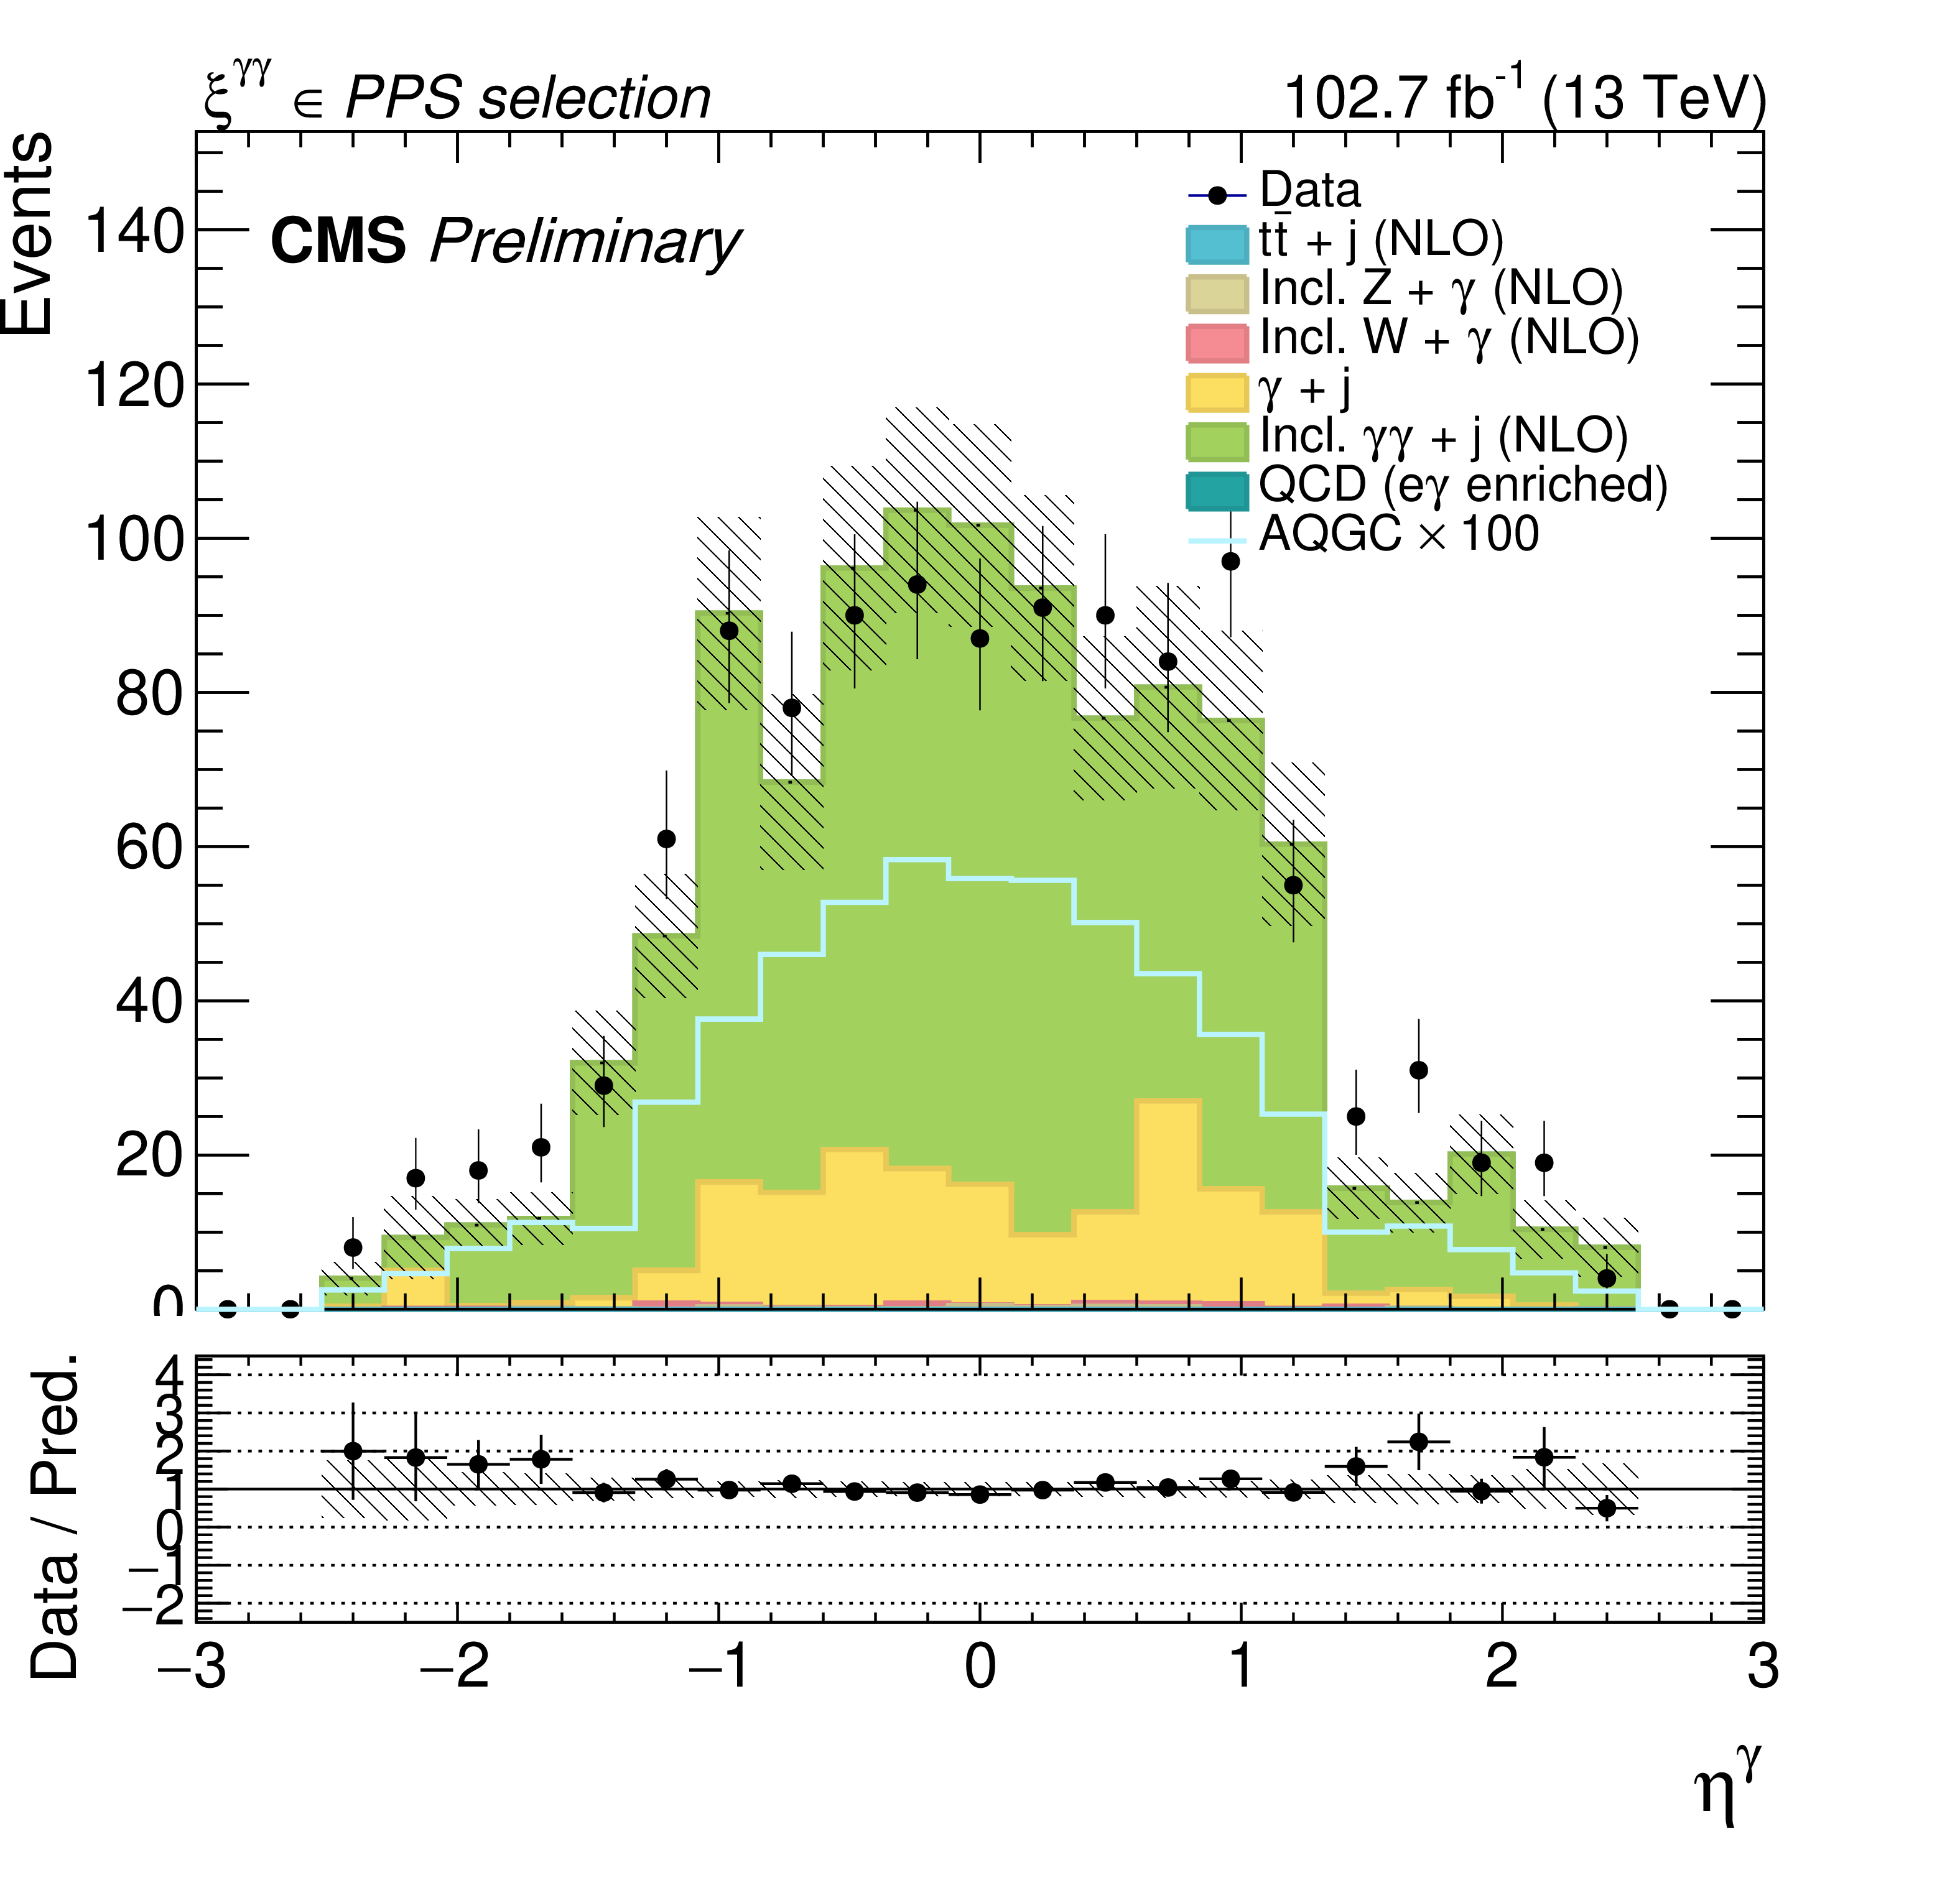
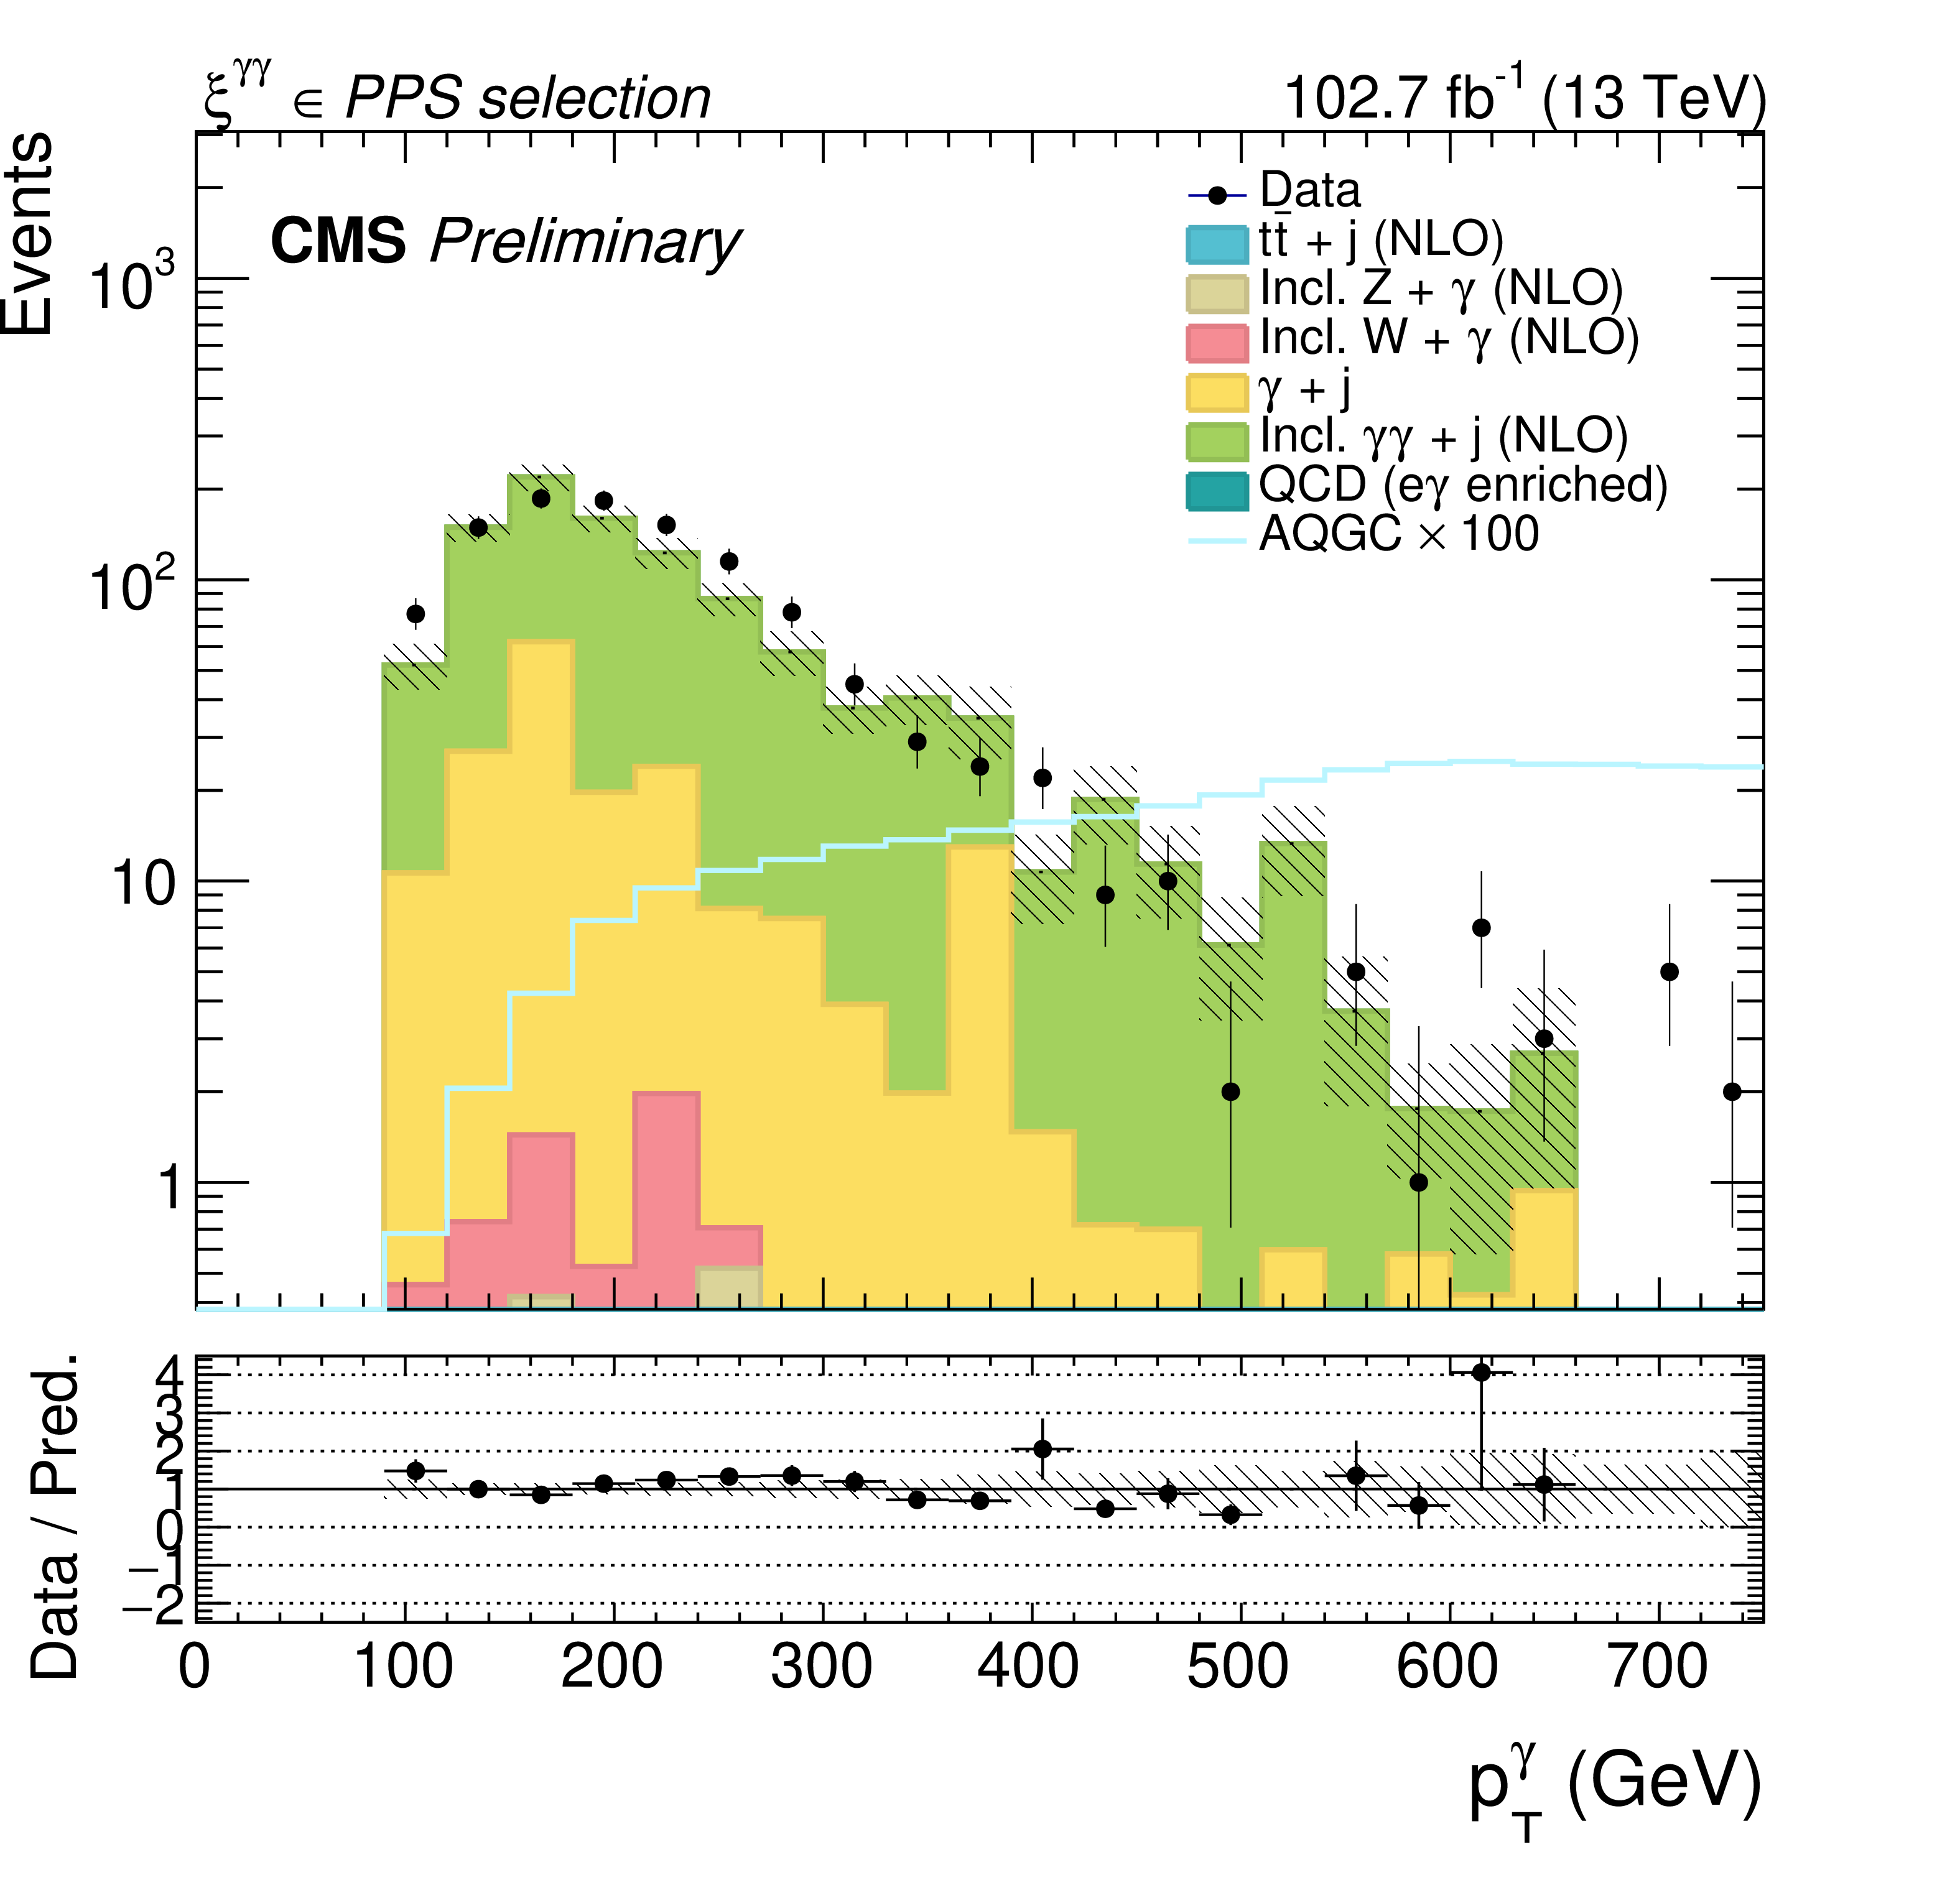
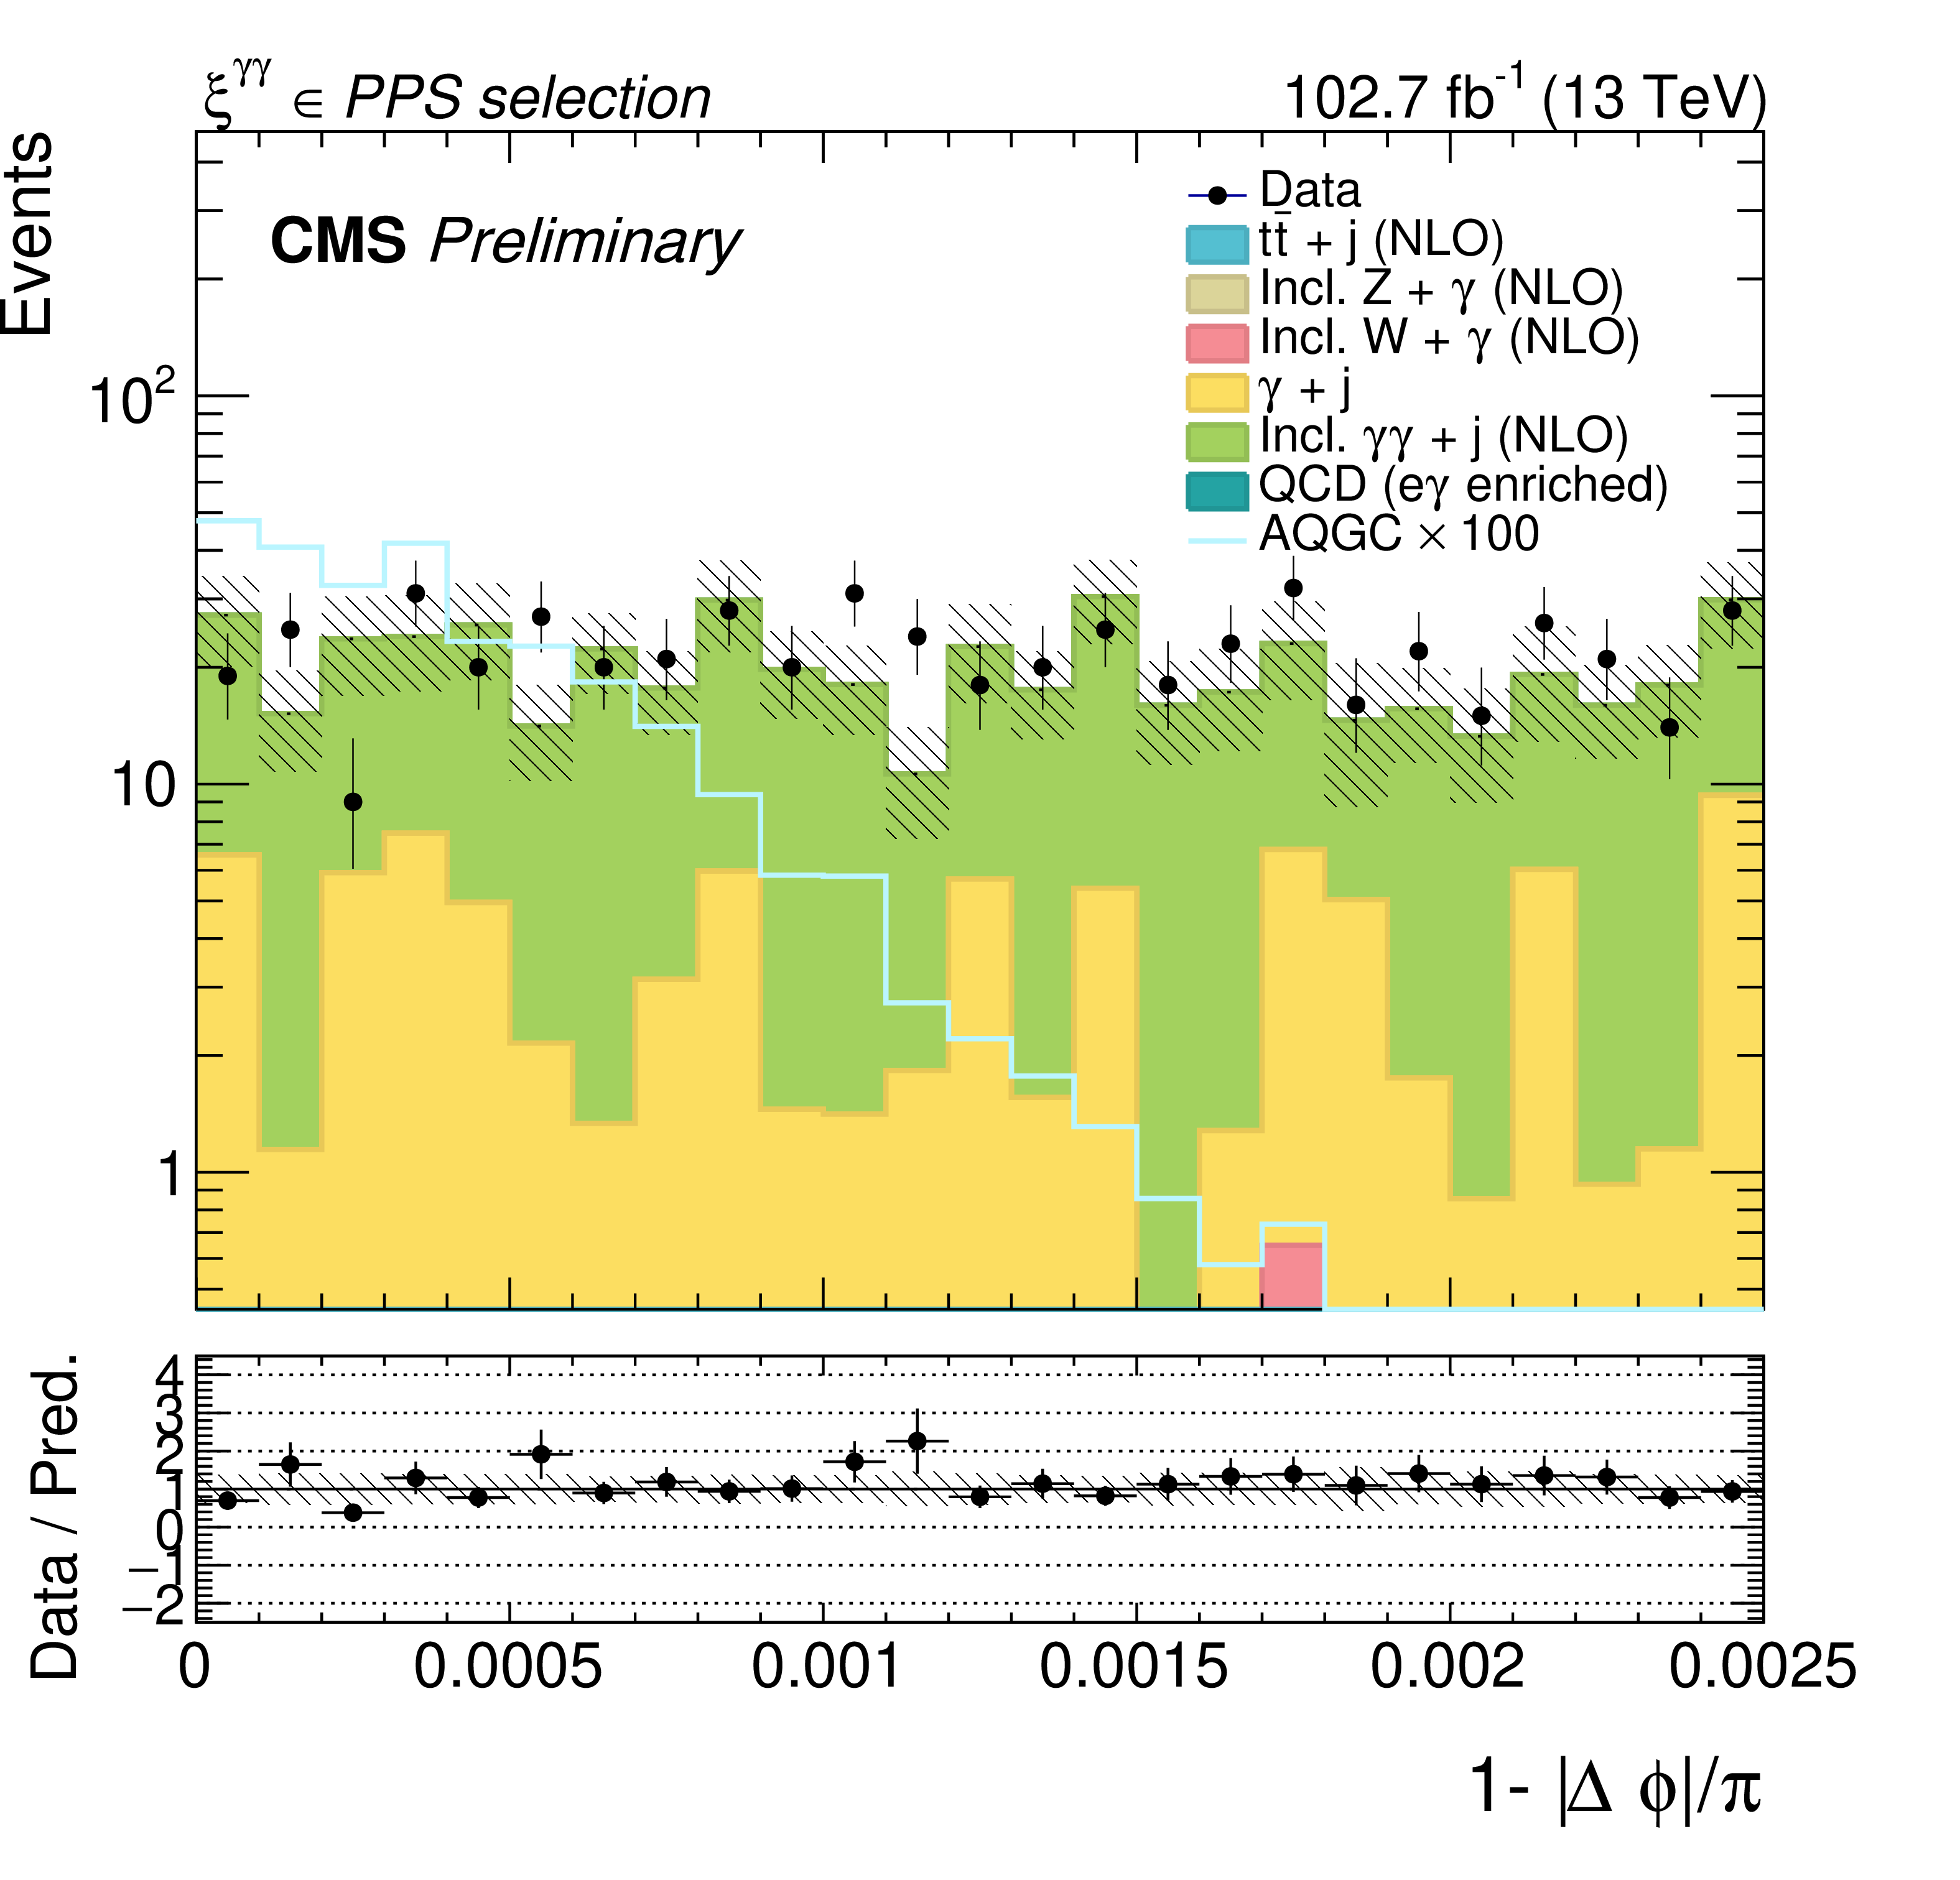
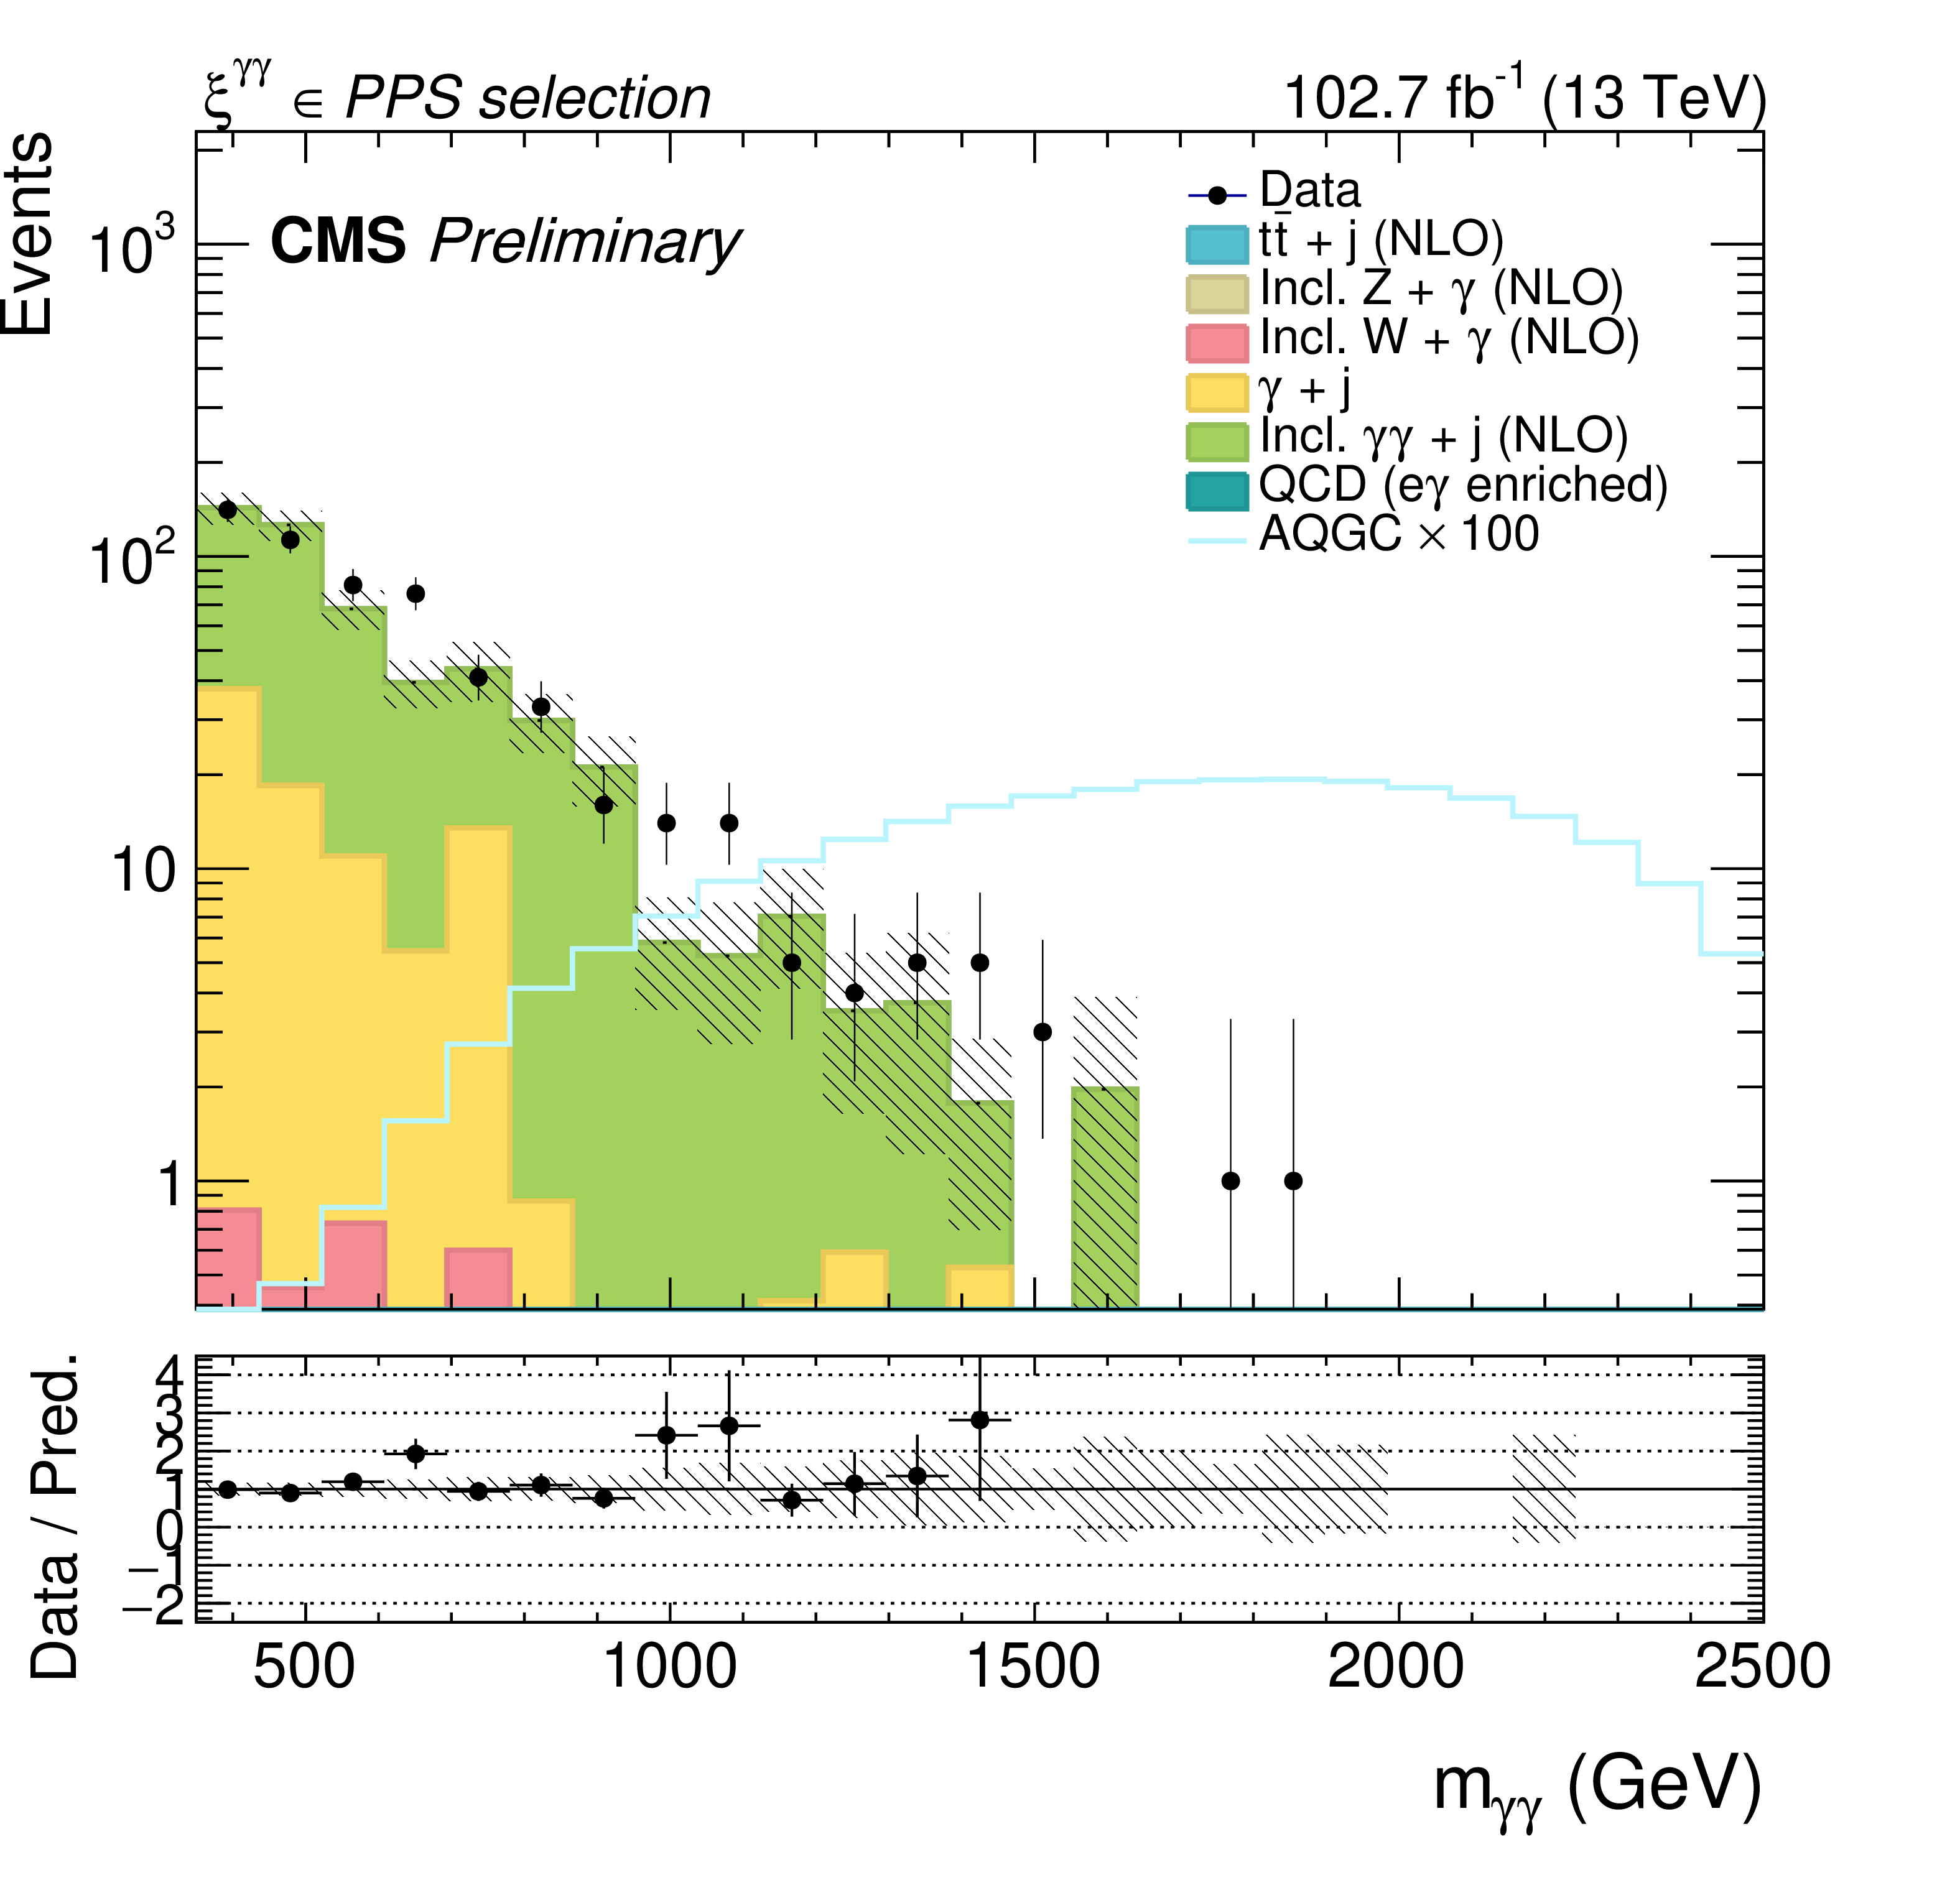
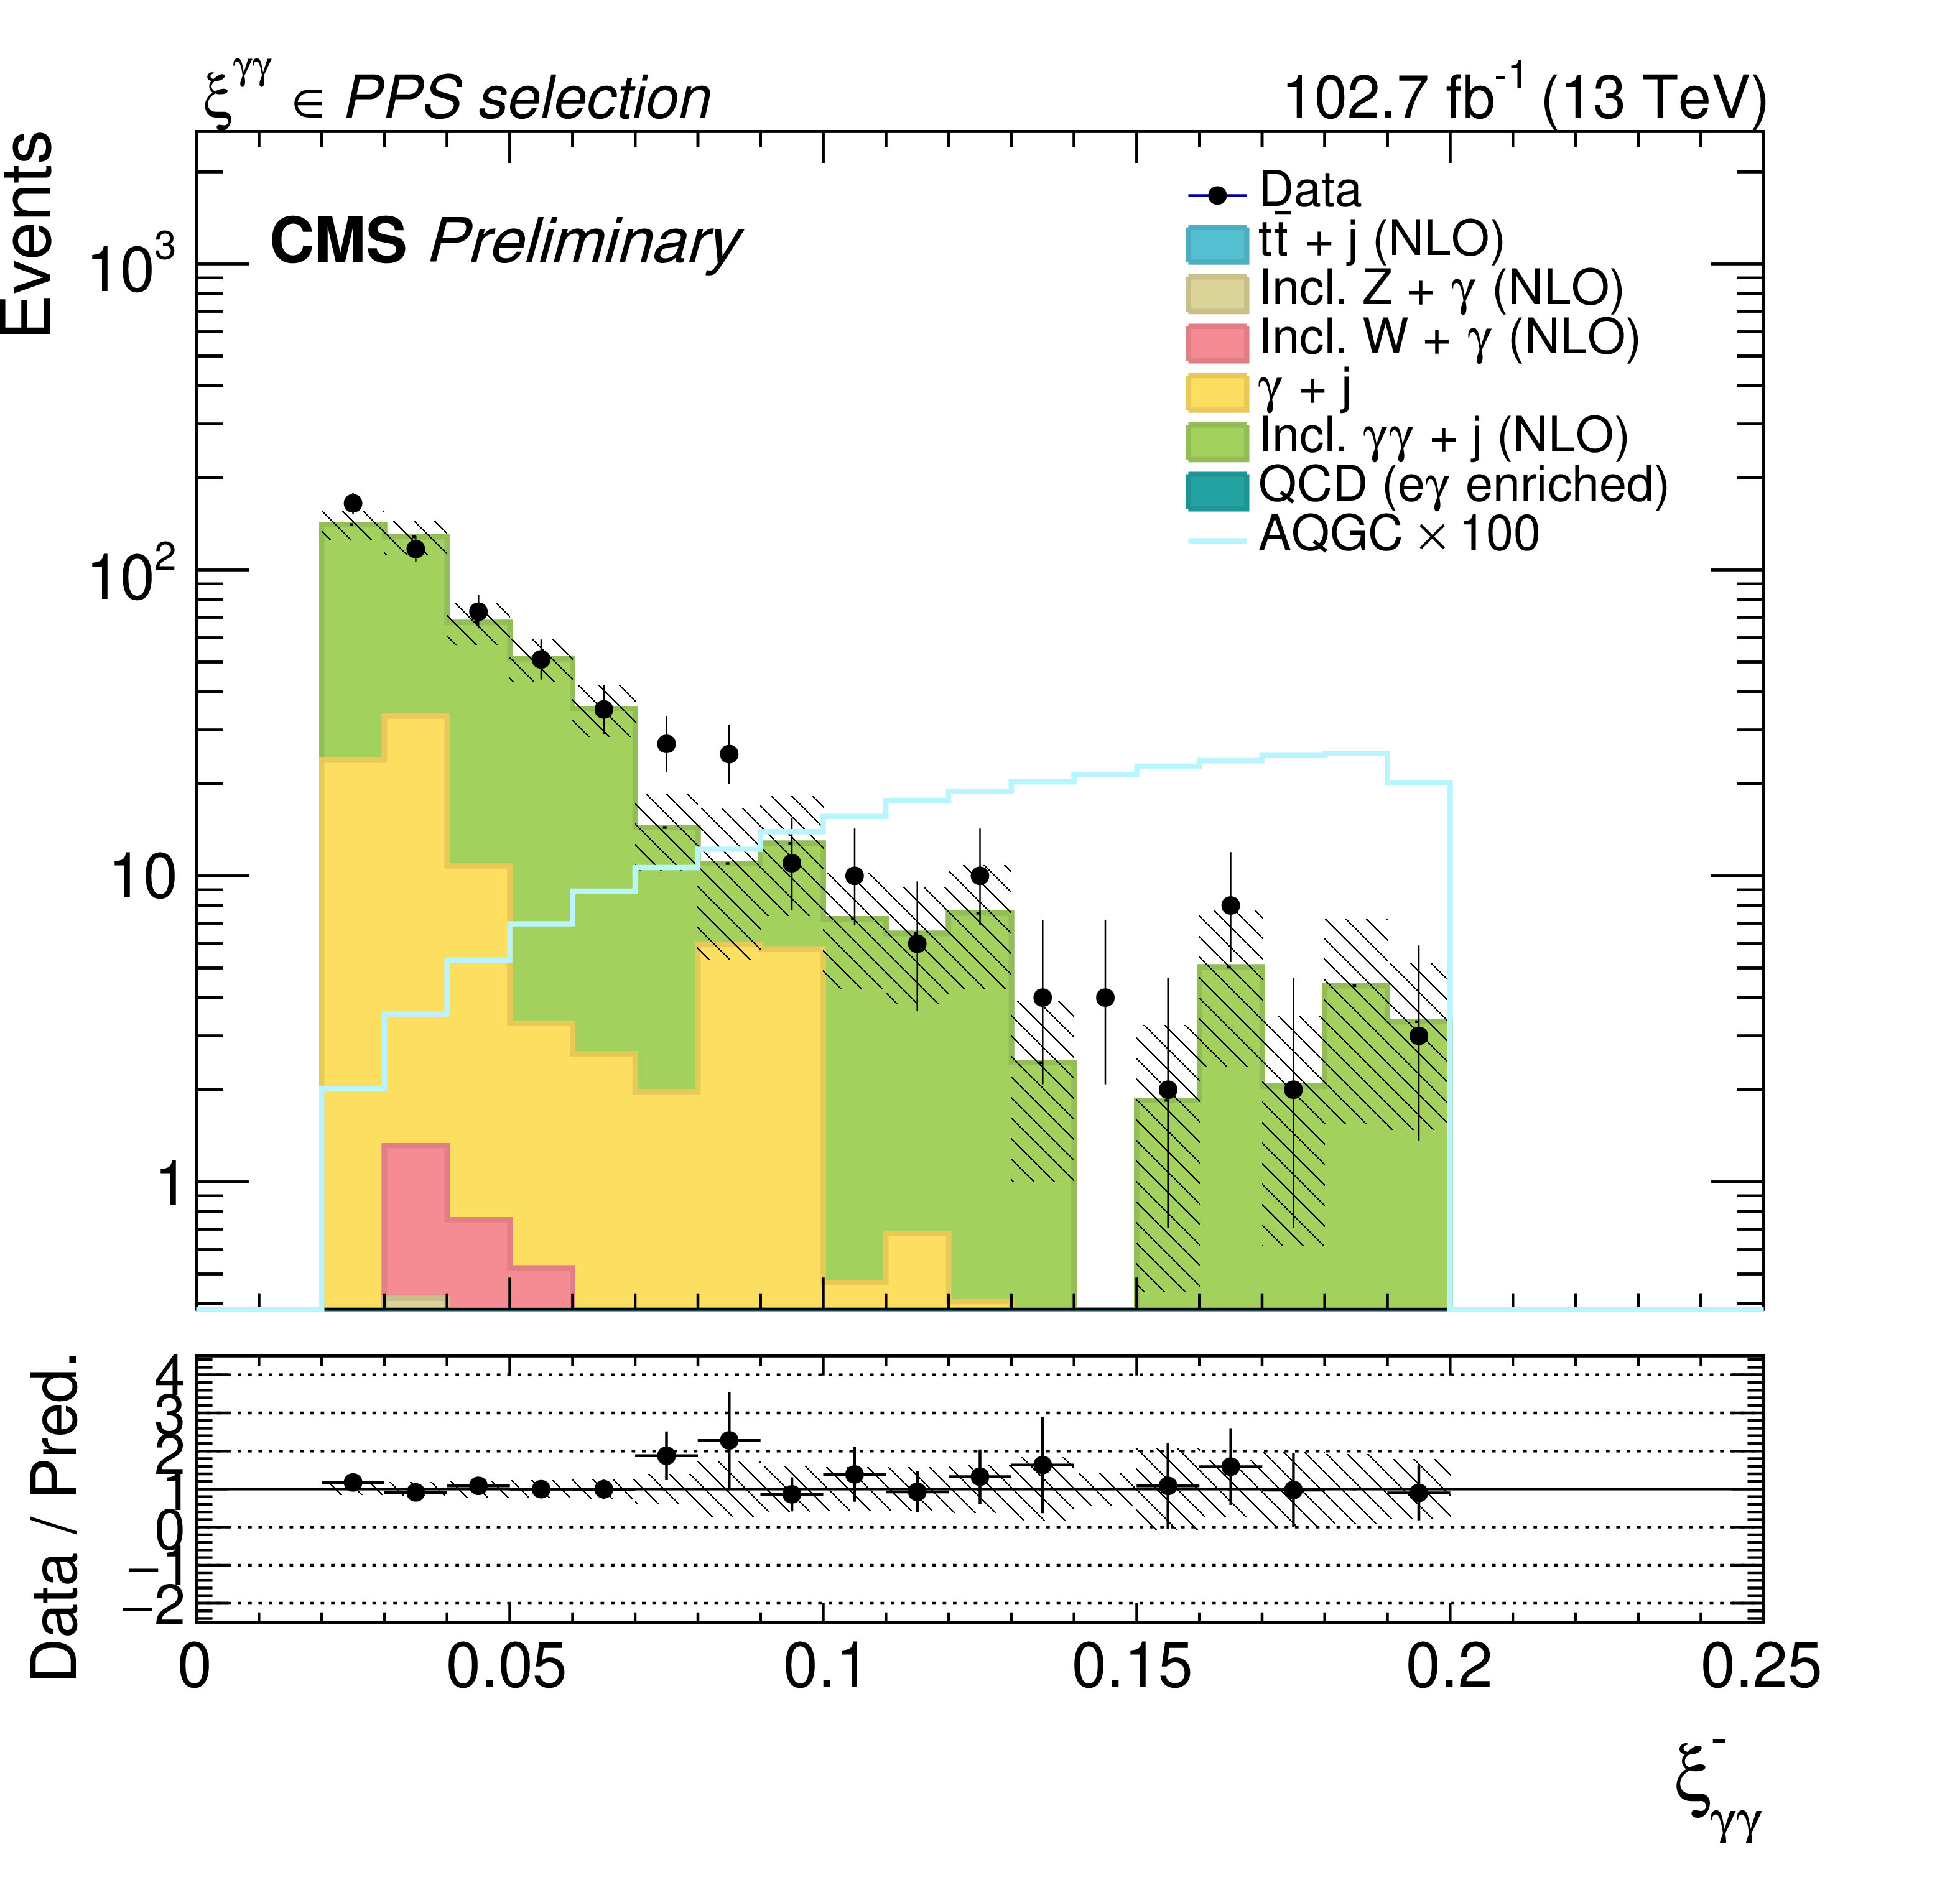
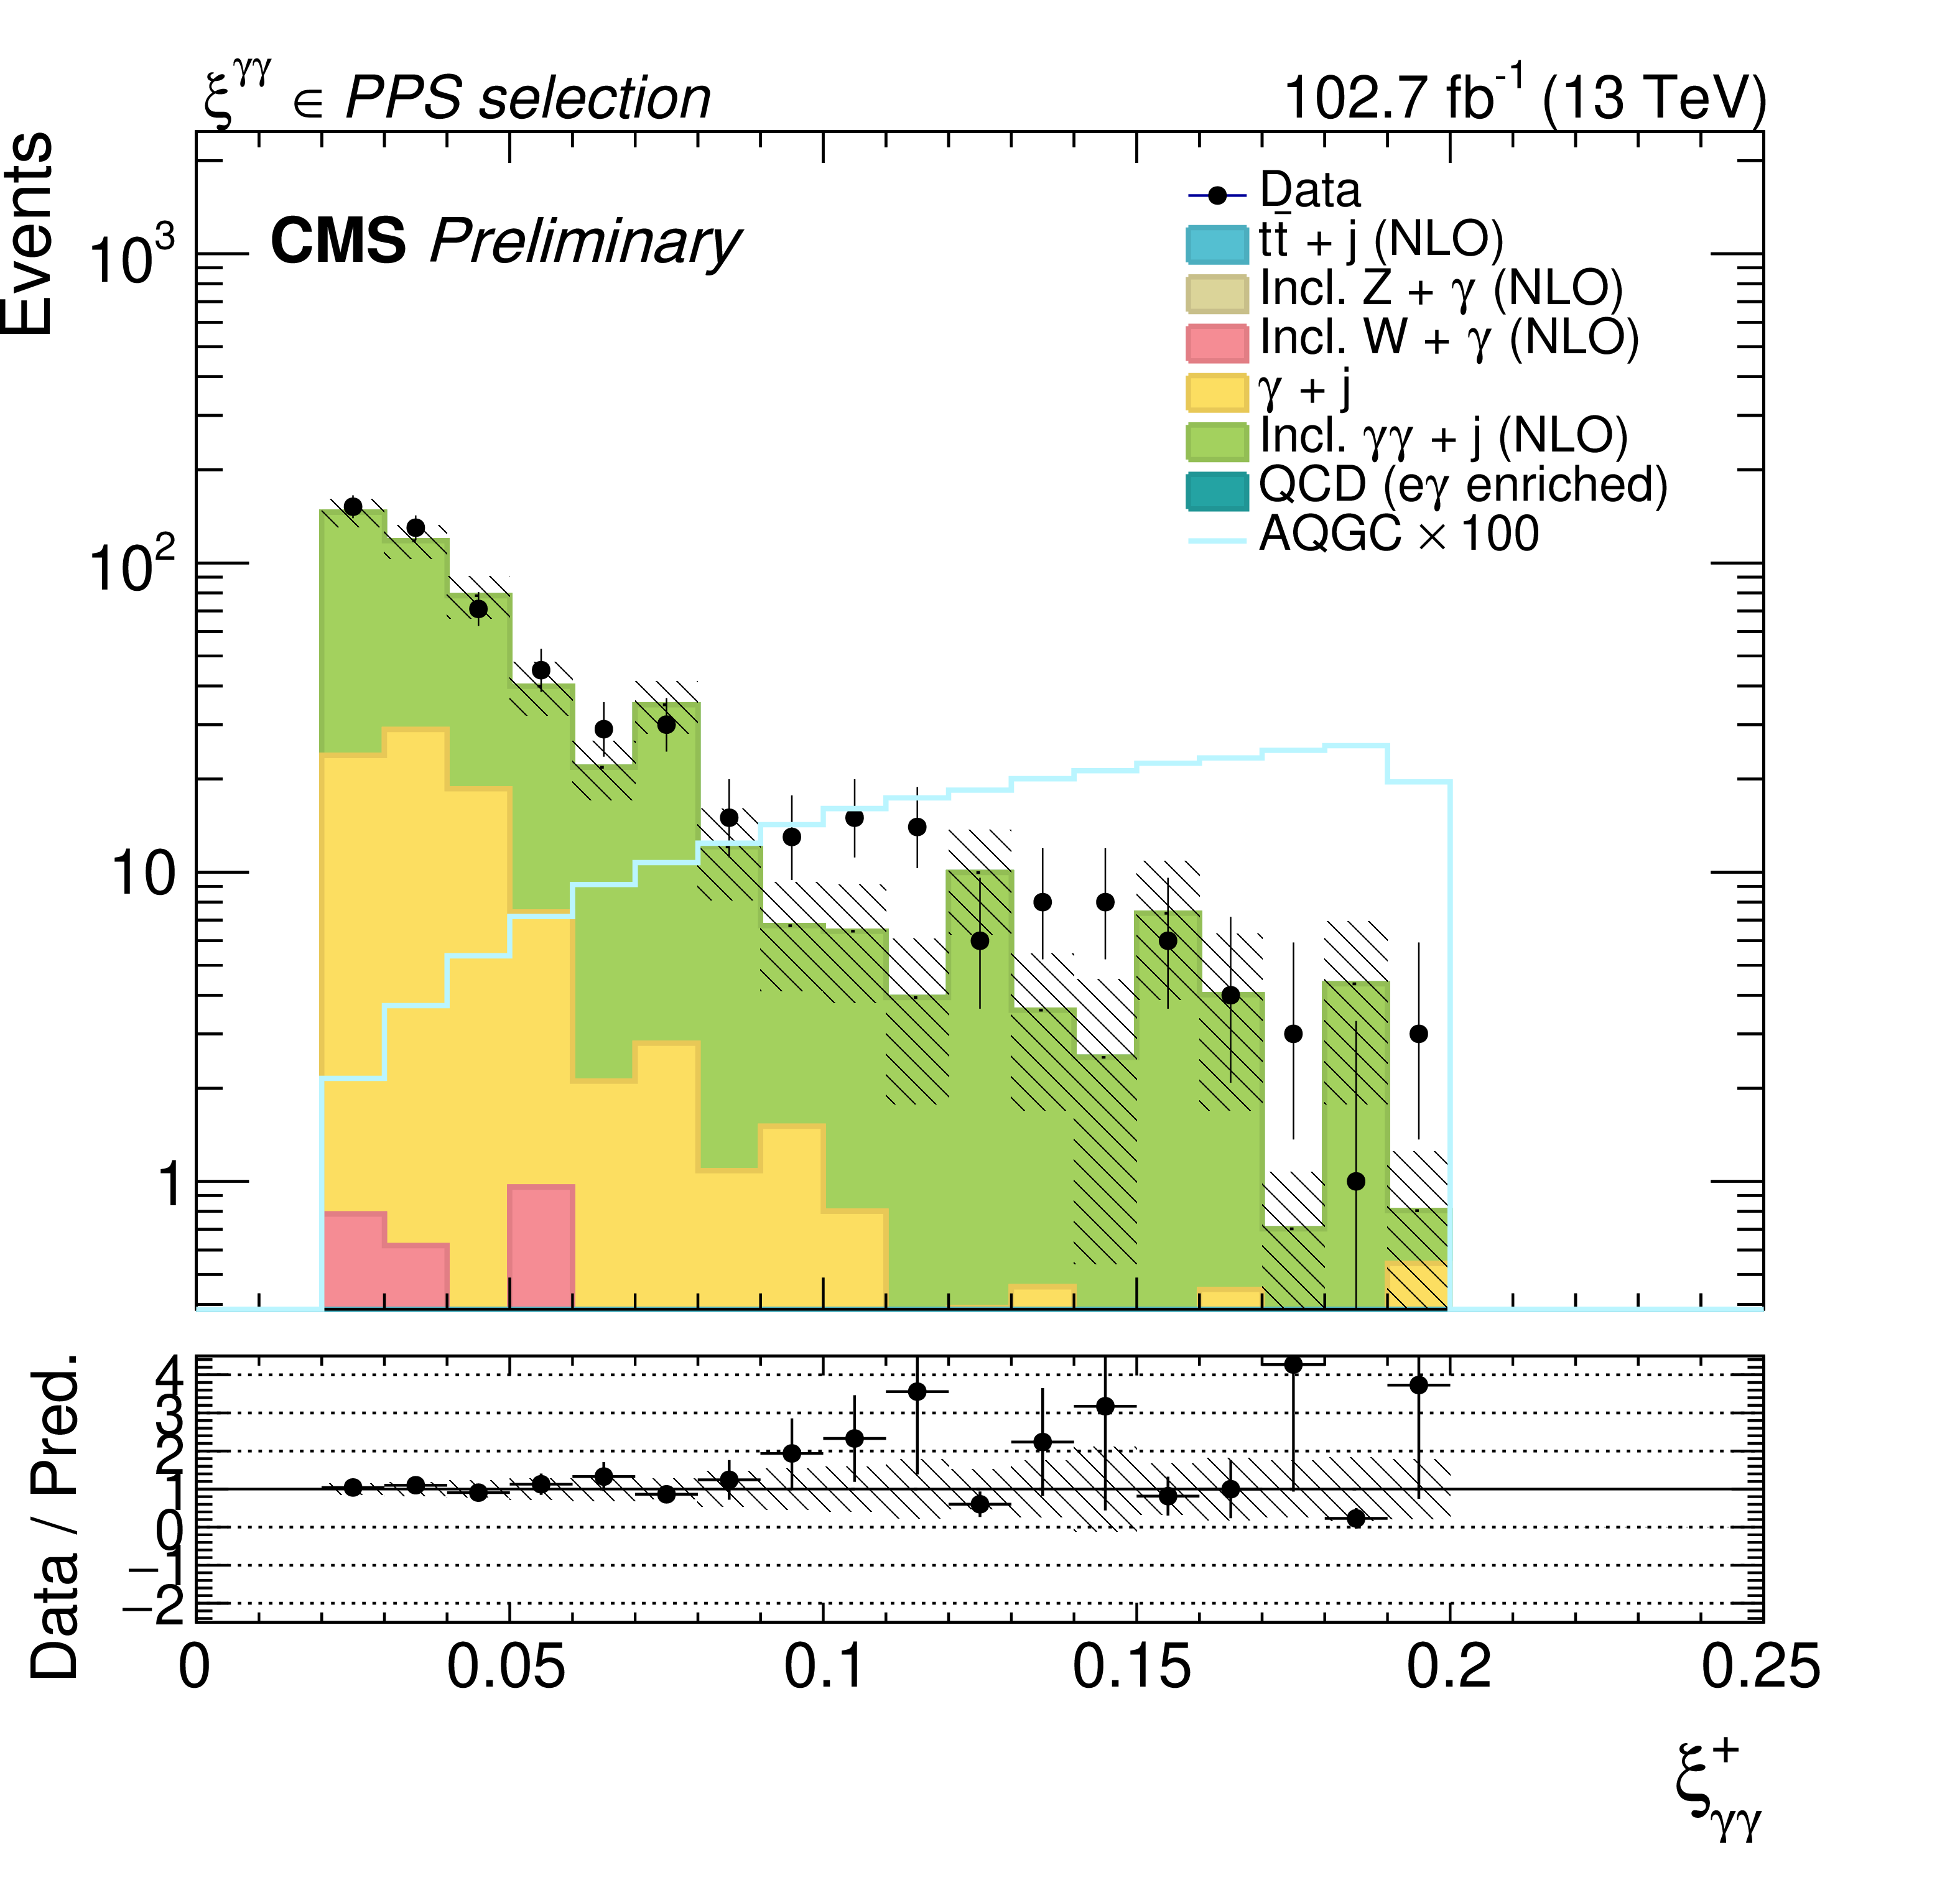
Figure 5:
Kinematic distributions for events passing the $\xi ^{\gamma \gamma} \in $ PPS signal selection. From top to bottom and left to right shows the single photon $\eta $, single photon ${p_{\mathrm {T}}}$, diphoton acoplanarity, diphoton mass, diphoton $\xi ^-$, and diphoton $\xi ^+$. The black dots represent the data, filled histograms represent the SM backgrounds, and the lined histogram represents an AQGC signal having $\zeta _1 = $ 5 $\times$ 10$^{-13}$ GeV$^{-4}$ and $\zeta _2 = $ 0 $\times$ 10$^{-13}$ GeV$^{-4}$ multiplied by a factor of 100 for reference. The bottom of each plot shows the ratio of the number of data events to SM background events. |
png pdf |
Figure 5-a:
Kinematic distributions for events passing the $\xi ^{\gamma \gamma} \in $ PPS signal selection. From top to bottom and left to right shows the single photon $\eta $, single photon ${p_{\mathrm {T}}}$, diphoton acoplanarity, diphoton mass, diphoton $\xi ^-$, and diphoton $\xi ^+$. The black dots represent the data, filled histograms represent the SM backgrounds, and the lined histogram represents an AQGC signal having $\zeta _1 = $ 5 $\times$ 10$^{-13}$ GeV$^{-4}$ and $\zeta _2 = $ 0 $\times$ 10$^{-13}$ GeV$^{-4}$ multiplied by a factor of 100 for reference. The bottom of each plot shows the ratio of the number of data events to SM background events. |
png pdf |
Figure 5-b:
Kinematic distributions for events passing the $\xi ^{\gamma \gamma} \in $ PPS signal selection. From top to bottom and left to right shows the single photon $\eta $, single photon ${p_{\mathrm {T}}}$, diphoton acoplanarity, diphoton mass, diphoton $\xi ^-$, and diphoton $\xi ^+$. The black dots represent the data, filled histograms represent the SM backgrounds, and the lined histogram represents an AQGC signal having $\zeta _1 = $ 5 $\times$ 10$^{-13}$ GeV$^{-4}$ and $\zeta _2 = $ 0 $\times$ 10$^{-13}$ GeV$^{-4}$ multiplied by a factor of 100 for reference. The bottom of each plot shows the ratio of the number of data events to SM background events. |
png pdf |
Figure 5-c:
Kinematic distributions for events passing the $\xi ^{\gamma \gamma} \in $ PPS signal selection. From top to bottom and left to right shows the single photon $\eta $, single photon ${p_{\mathrm {T}}}$, diphoton acoplanarity, diphoton mass, diphoton $\xi ^-$, and diphoton $\xi ^+$. The black dots represent the data, filled histograms represent the SM backgrounds, and the lined histogram represents an AQGC signal having $\zeta _1 = $ 5 $\times$ 10$^{-13}$ GeV$^{-4}$ and $\zeta _2 = $ 0 $\times$ 10$^{-13}$ GeV$^{-4}$ multiplied by a factor of 100 for reference. The bottom of each plot shows the ratio of the number of data events to SM background events. |
png pdf |
Figure 5-d:
Kinematic distributions for events passing the $\xi ^{\gamma \gamma} \in $ PPS signal selection. From top to bottom and left to right shows the single photon $\eta $, single photon ${p_{\mathrm {T}}}$, diphoton acoplanarity, diphoton mass, diphoton $\xi ^-$, and diphoton $\xi ^+$. The black dots represent the data, filled histograms represent the SM backgrounds, and the lined histogram represents an AQGC signal having $\zeta _1 = $ 5 $\times$ 10$^{-13}$ GeV$^{-4}$ and $\zeta _2 = $ 0 $\times$ 10$^{-13}$ GeV$^{-4}$ multiplied by a factor of 100 for reference. The bottom of each plot shows the ratio of the number of data events to SM background events. |
png pdf |
Figure 5-e:
Kinematic distributions for events passing the $\xi ^{\gamma \gamma} \in $ PPS signal selection. From top to bottom and left to right shows the single photon $\eta $, single photon ${p_{\mathrm {T}}}$, diphoton acoplanarity, diphoton mass, diphoton $\xi ^-$, and diphoton $\xi ^+$. The black dots represent the data, filled histograms represent the SM backgrounds, and the lined histogram represents an AQGC signal having $\zeta _1 = $ 5 $\times$ 10$^{-13}$ GeV$^{-4}$ and $\zeta _2 = $ 0 $\times$ 10$^{-13}$ GeV$^{-4}$ multiplied by a factor of 100 for reference. The bottom of each plot shows the ratio of the number of data events to SM background events. |
png pdf |
Figure 5-f:
Kinematic distributions for events passing the $\xi ^{\gamma \gamma} \in $ PPS signal selection. From top to bottom and left to right shows the single photon $\eta $, single photon ${p_{\mathrm {T}}}$, diphoton acoplanarity, diphoton mass, diphoton $\xi ^-$, and diphoton $\xi ^+$. The black dots represent the data, filled histograms represent the SM backgrounds, and the lined histogram represents an AQGC signal having $\zeta _1 = $ 5 $\times$ 10$^{-13}$ GeV$^{-4}$ and $\zeta _2 = $ 0 $\times$ 10$^{-13}$ GeV$^{-4}$ multiplied by a factor of 100 for reference. The bottom of each plot shows the ratio of the number of data events to SM background events. |
png pdf |
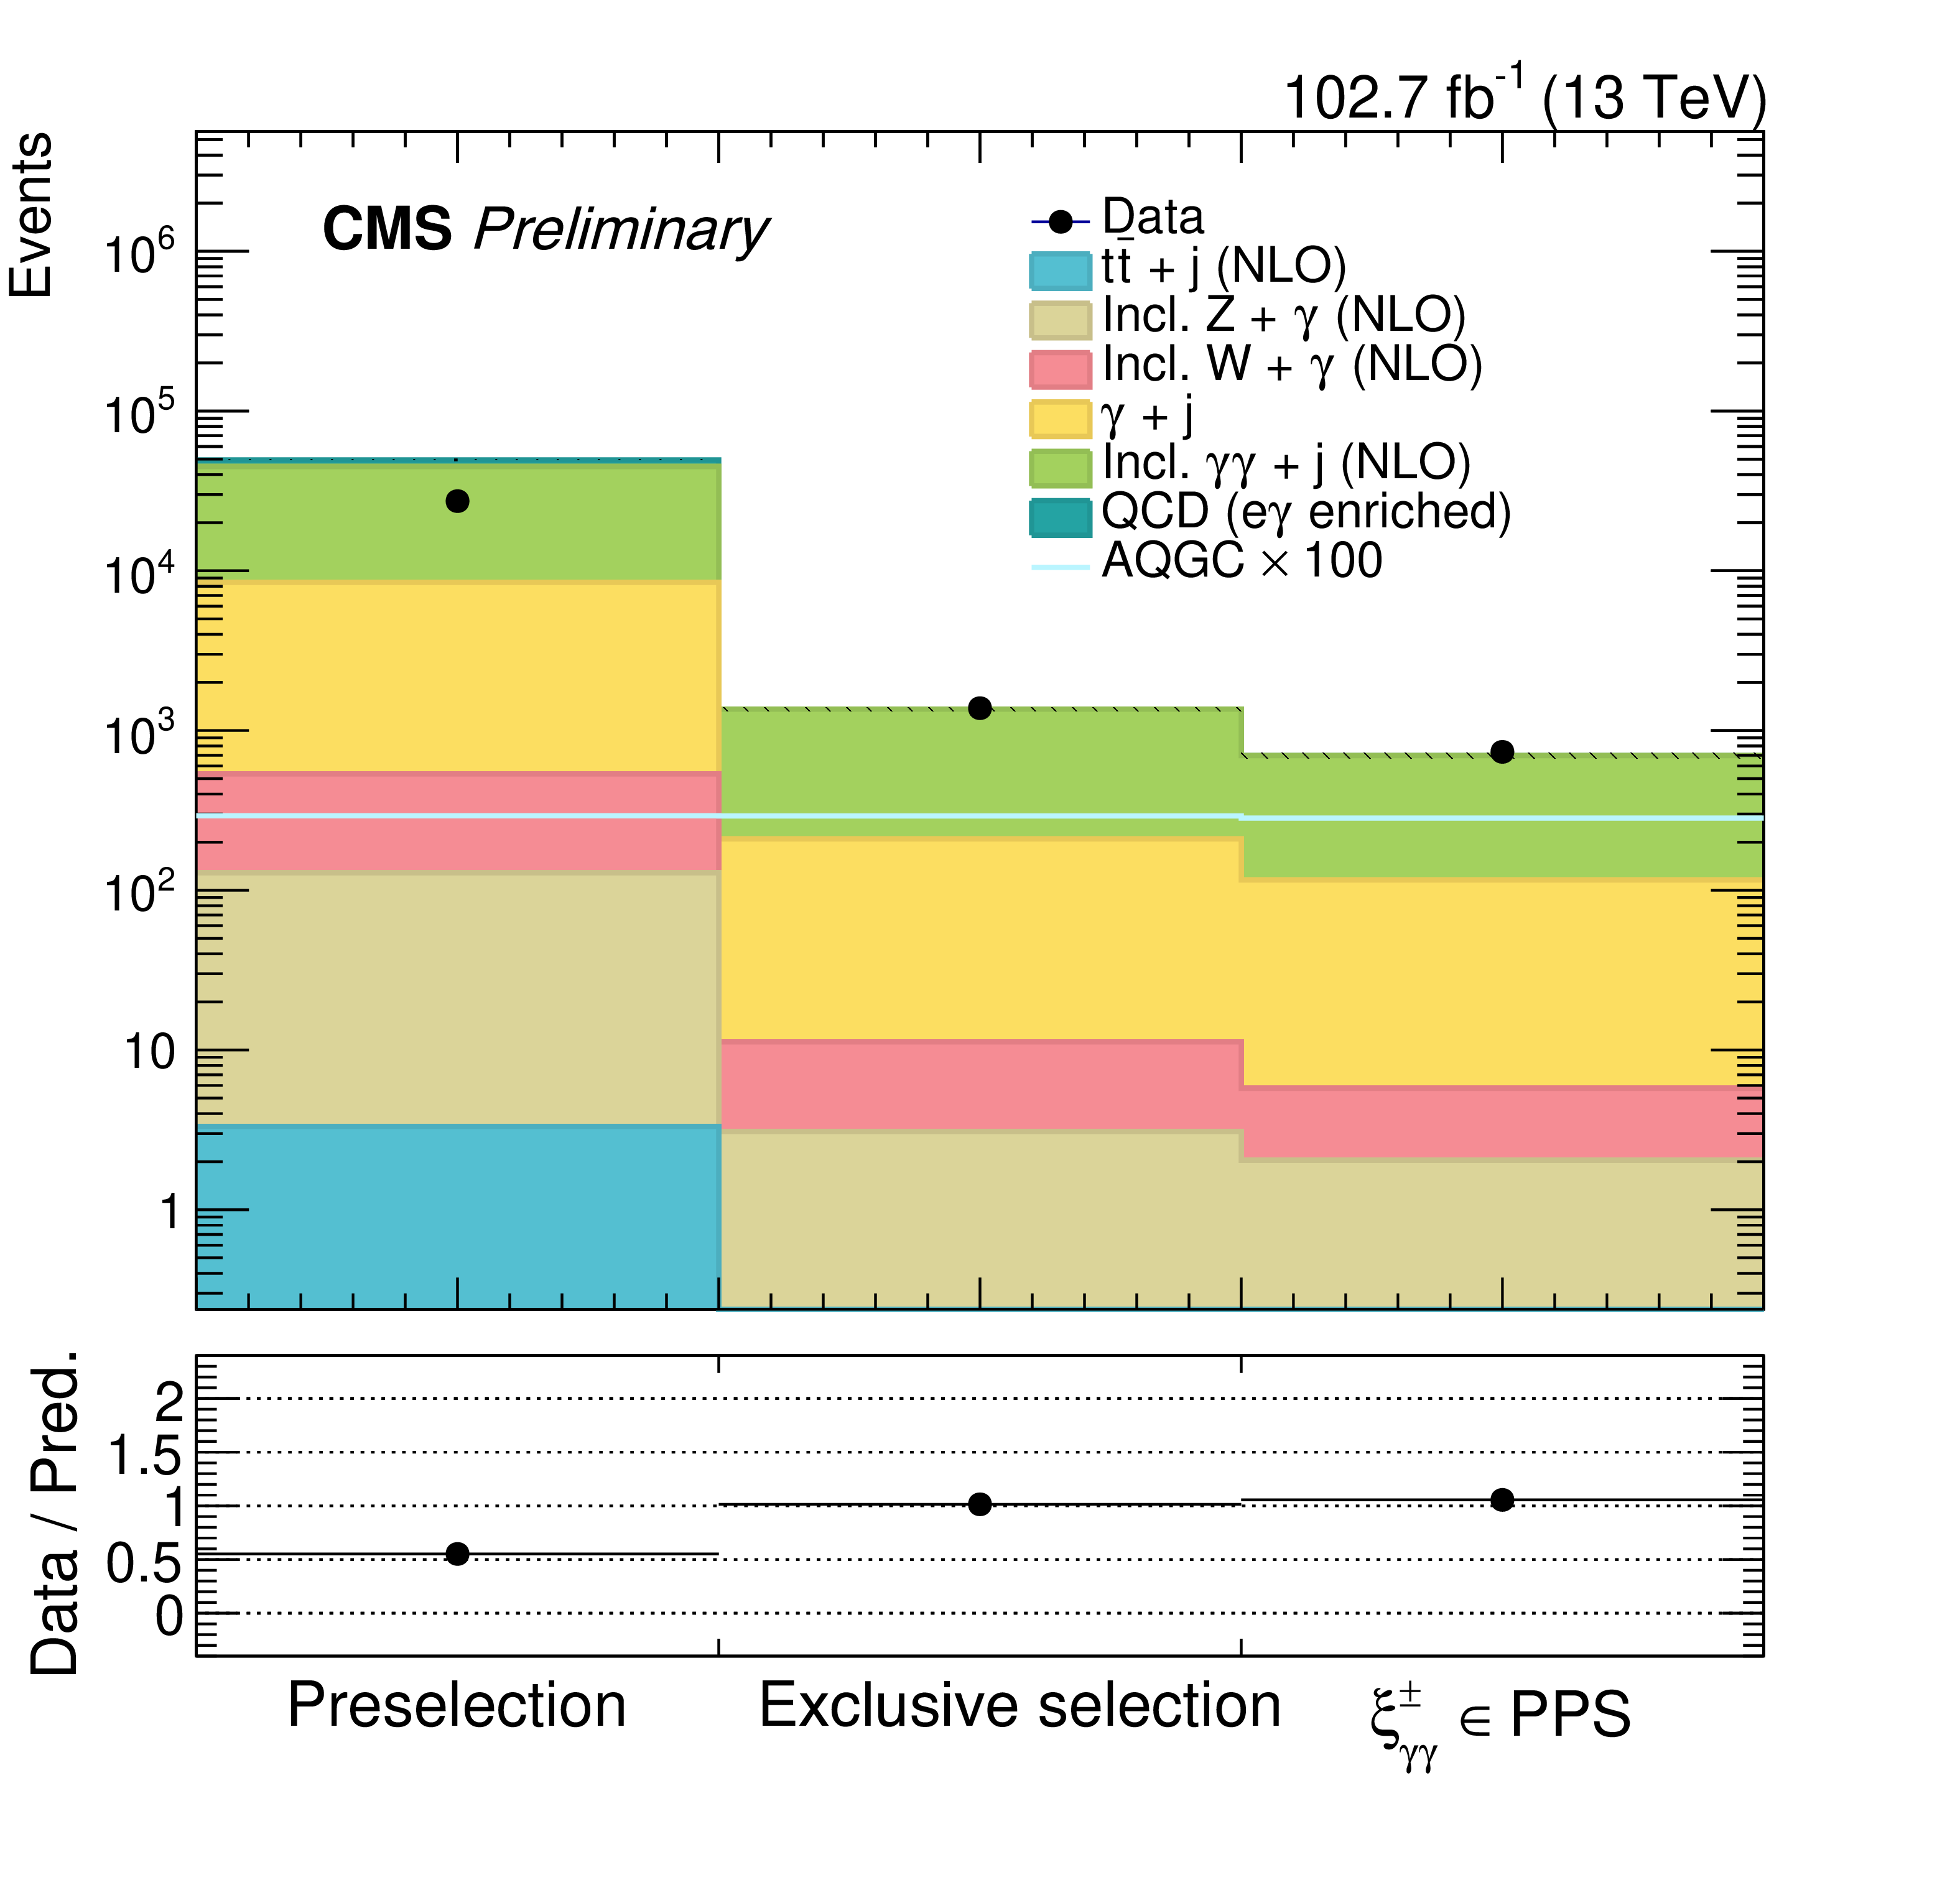
Figure 6:
The number of data and simulated background events are shown for three sequential selection regions. The first bin is the preselection region, the second bin uses the acoplanarity selection defined in the text, and the third bin uses the diphoton $\xi $ selection defined in the text. |
png pdf |
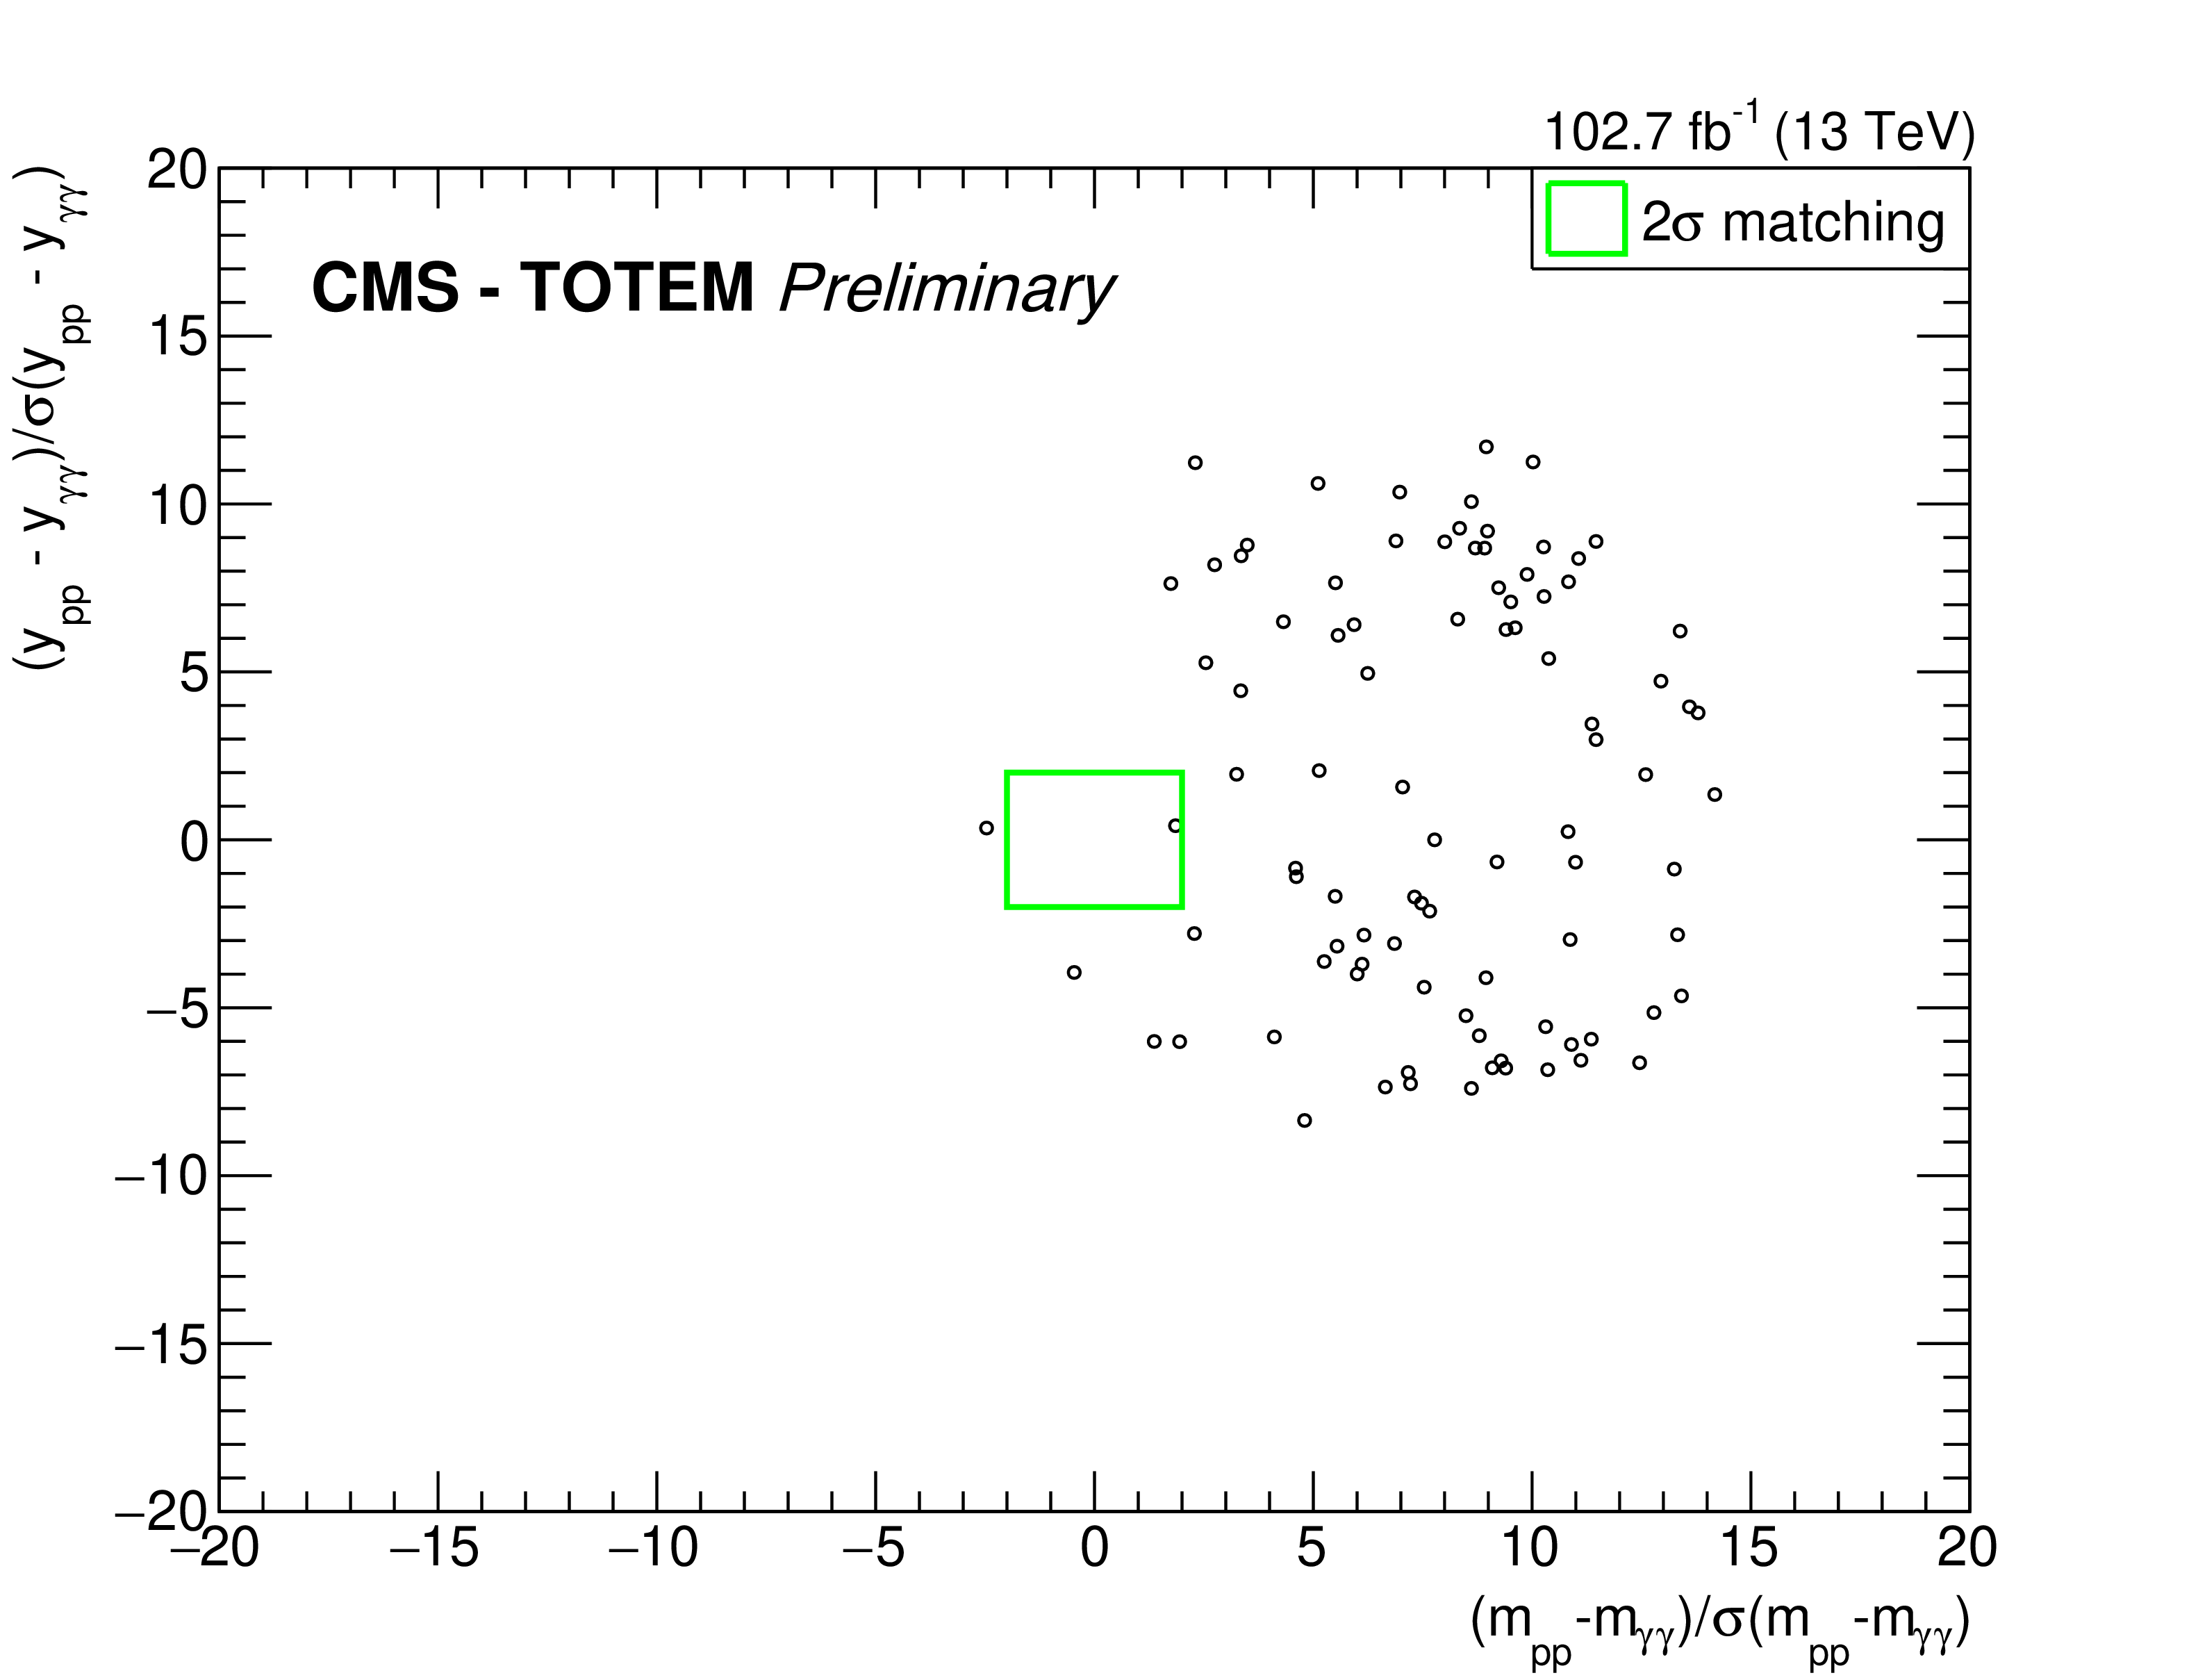
Figure 7:
Mass and rapidity matching for events passing the CMS diphoton selection and two reconstructed protons passing the asymmetric proton $\xi $ selection. Events matching at 2$\sigma $ are enclosed within a green rectangle. |
png pdf |
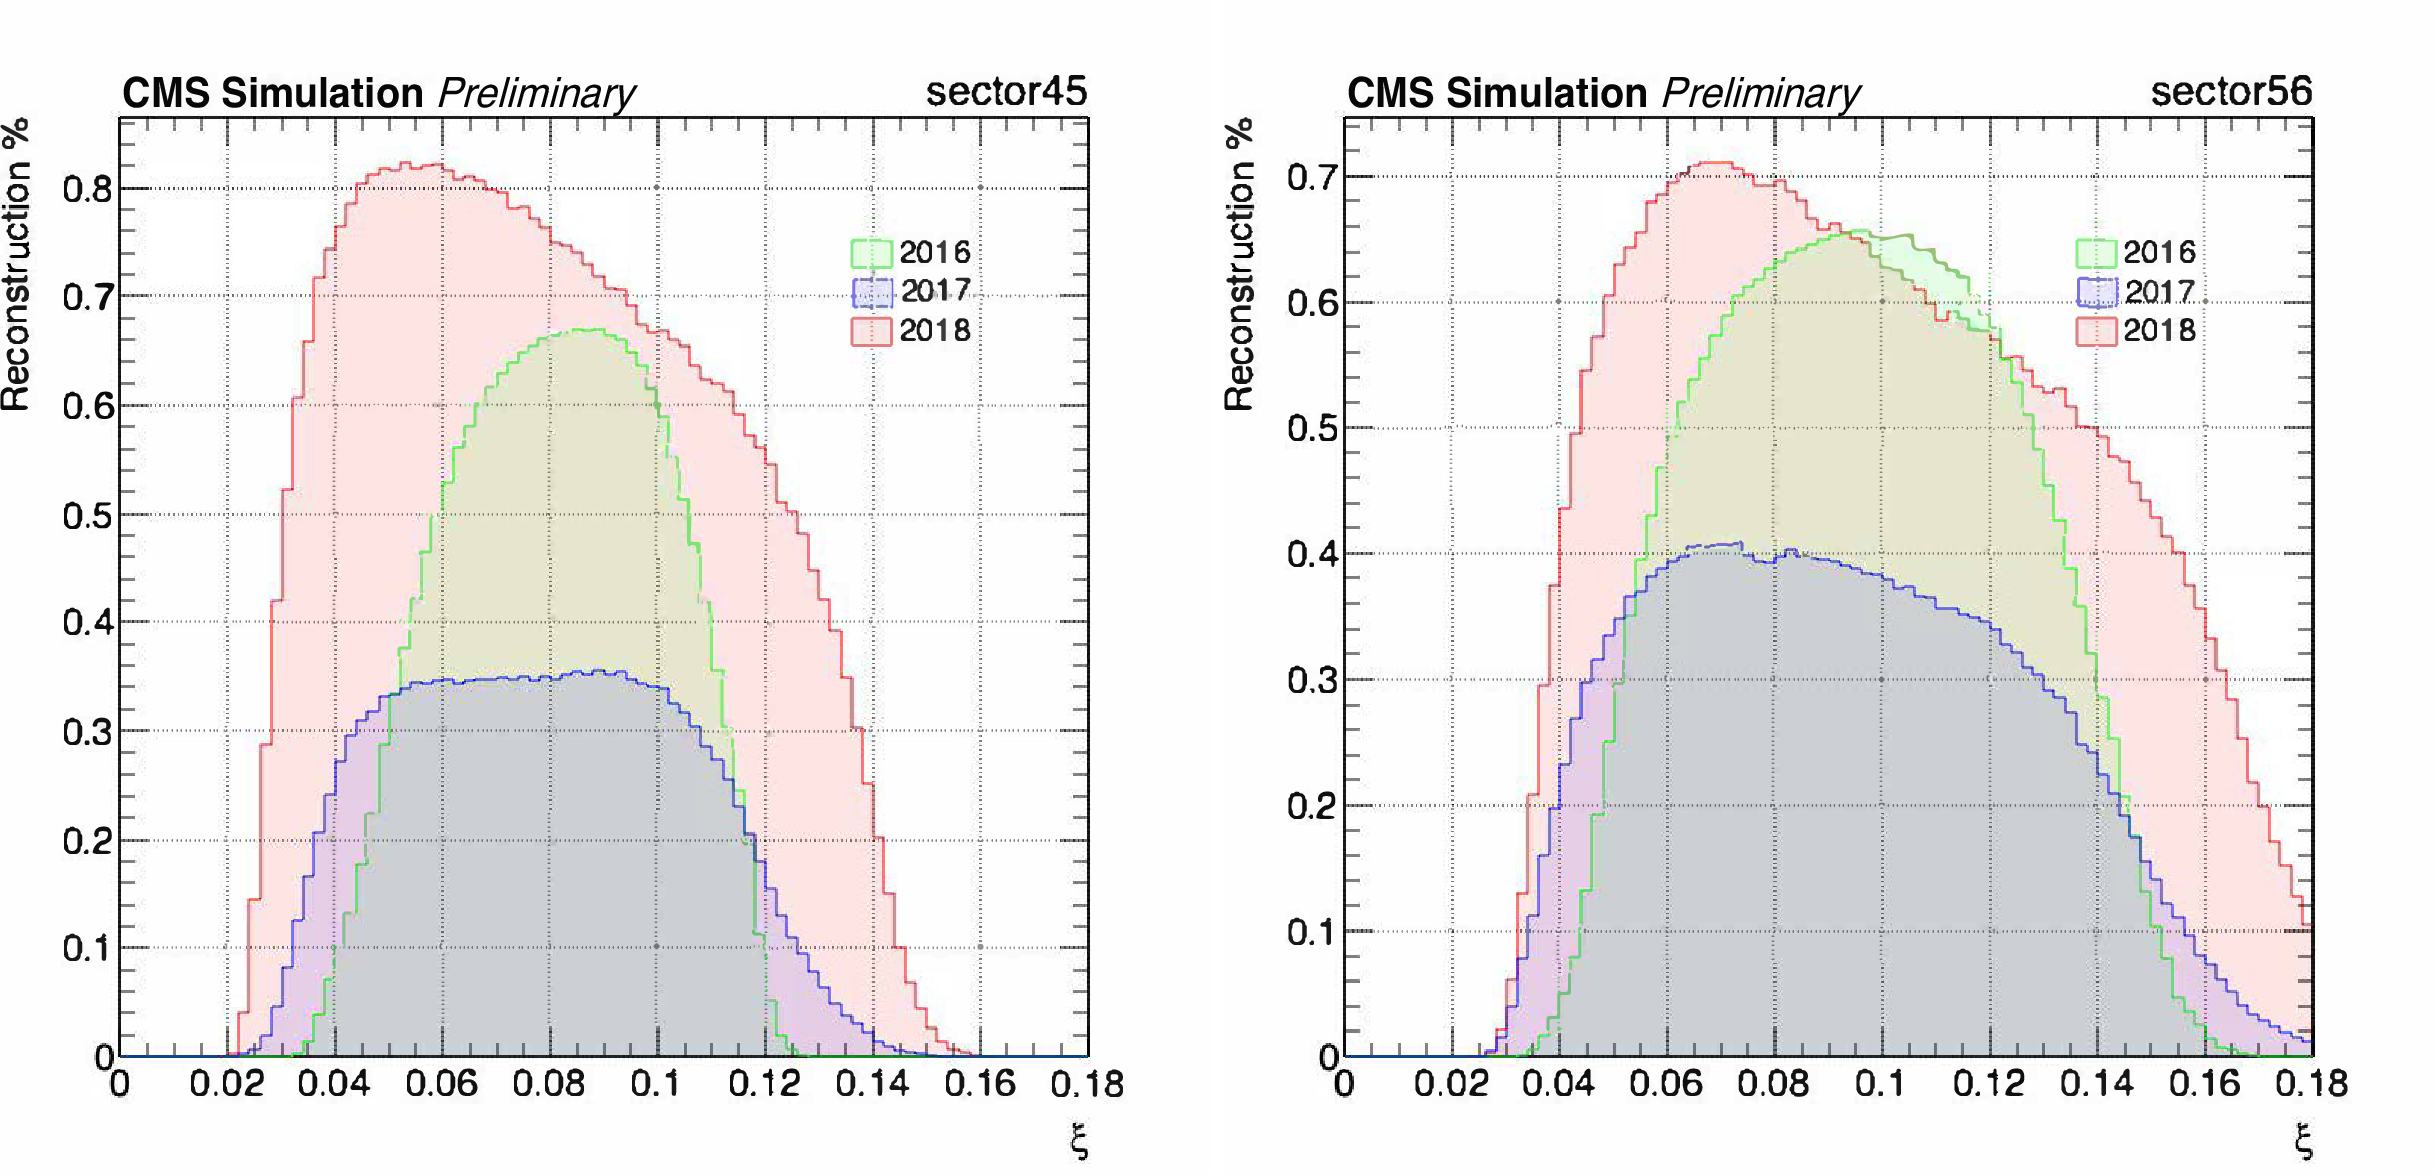
Figure 8:
Both efficiency and acceptance effects parameterized as function of the proton $\xi $ for all years. Differences in the reconstruction percentage can be attributed to differences in detector location, configuration, and design. |
png pdf |
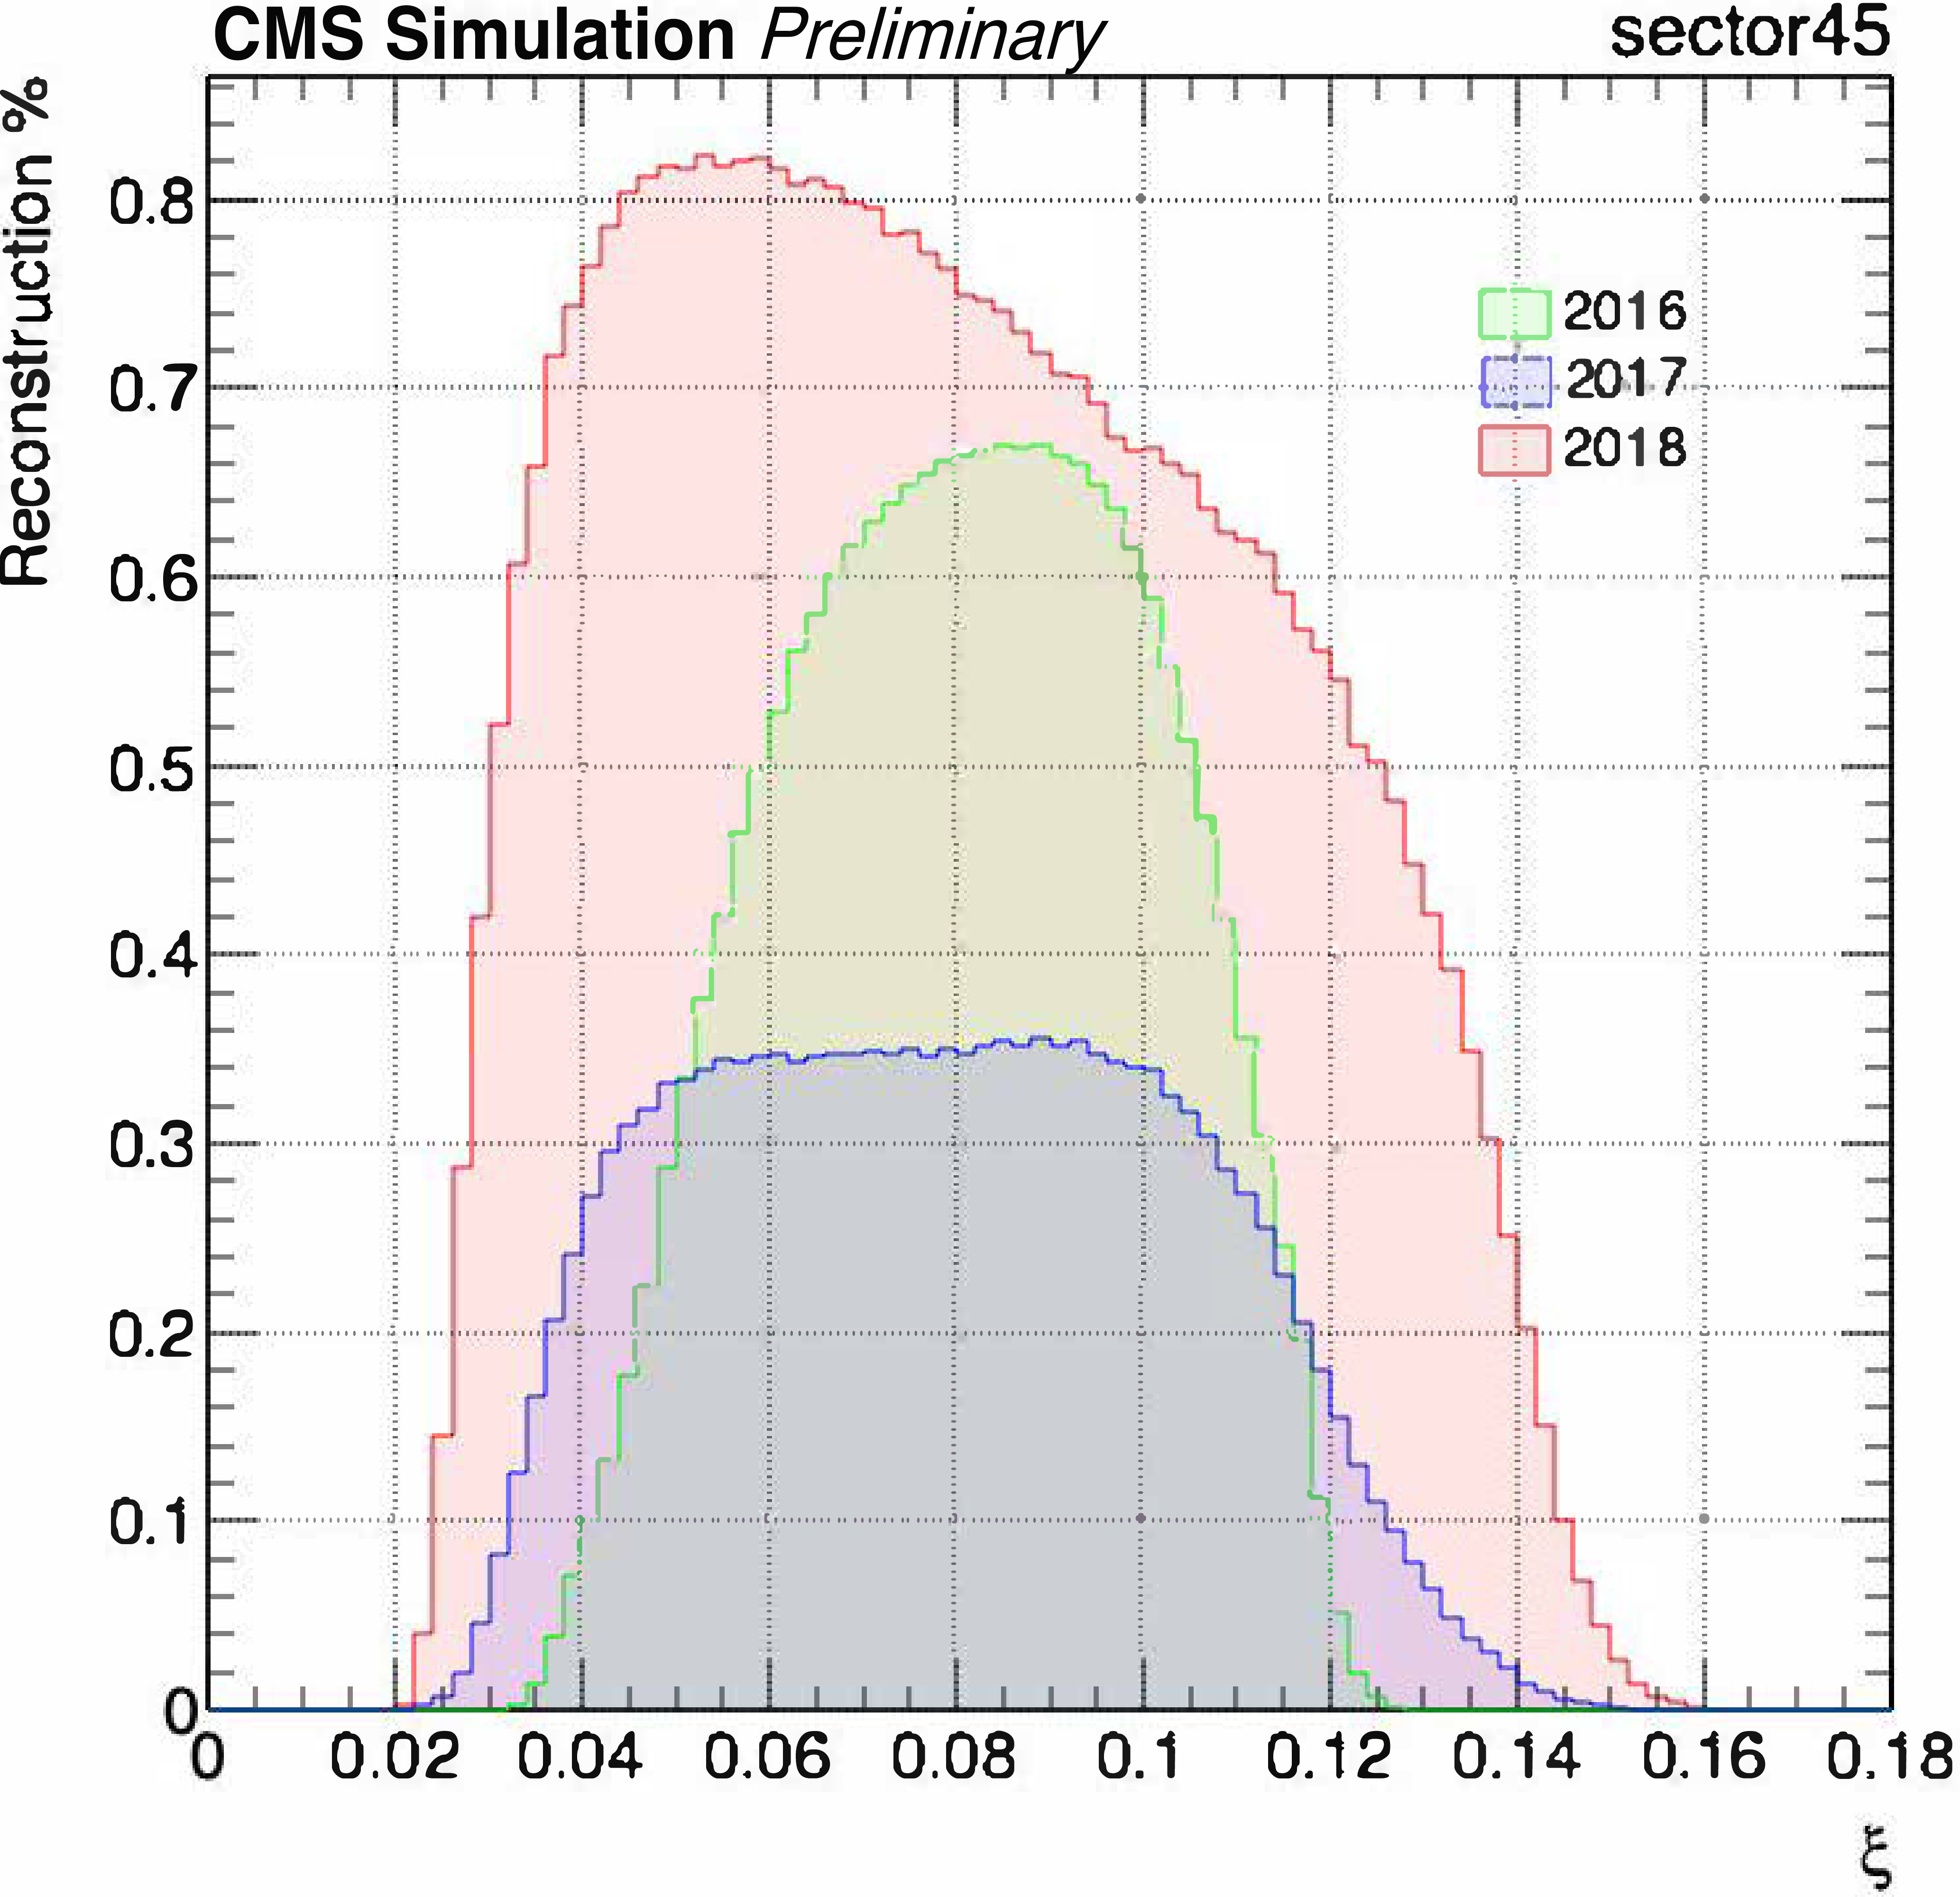
Figure 8-a:
Both efficiency and acceptance effects parameterized as function of the proton $\xi $ for all years. Differences in the reconstruction percentage can be attributed to differences in detector location, configuration, and design. |
png pdf |
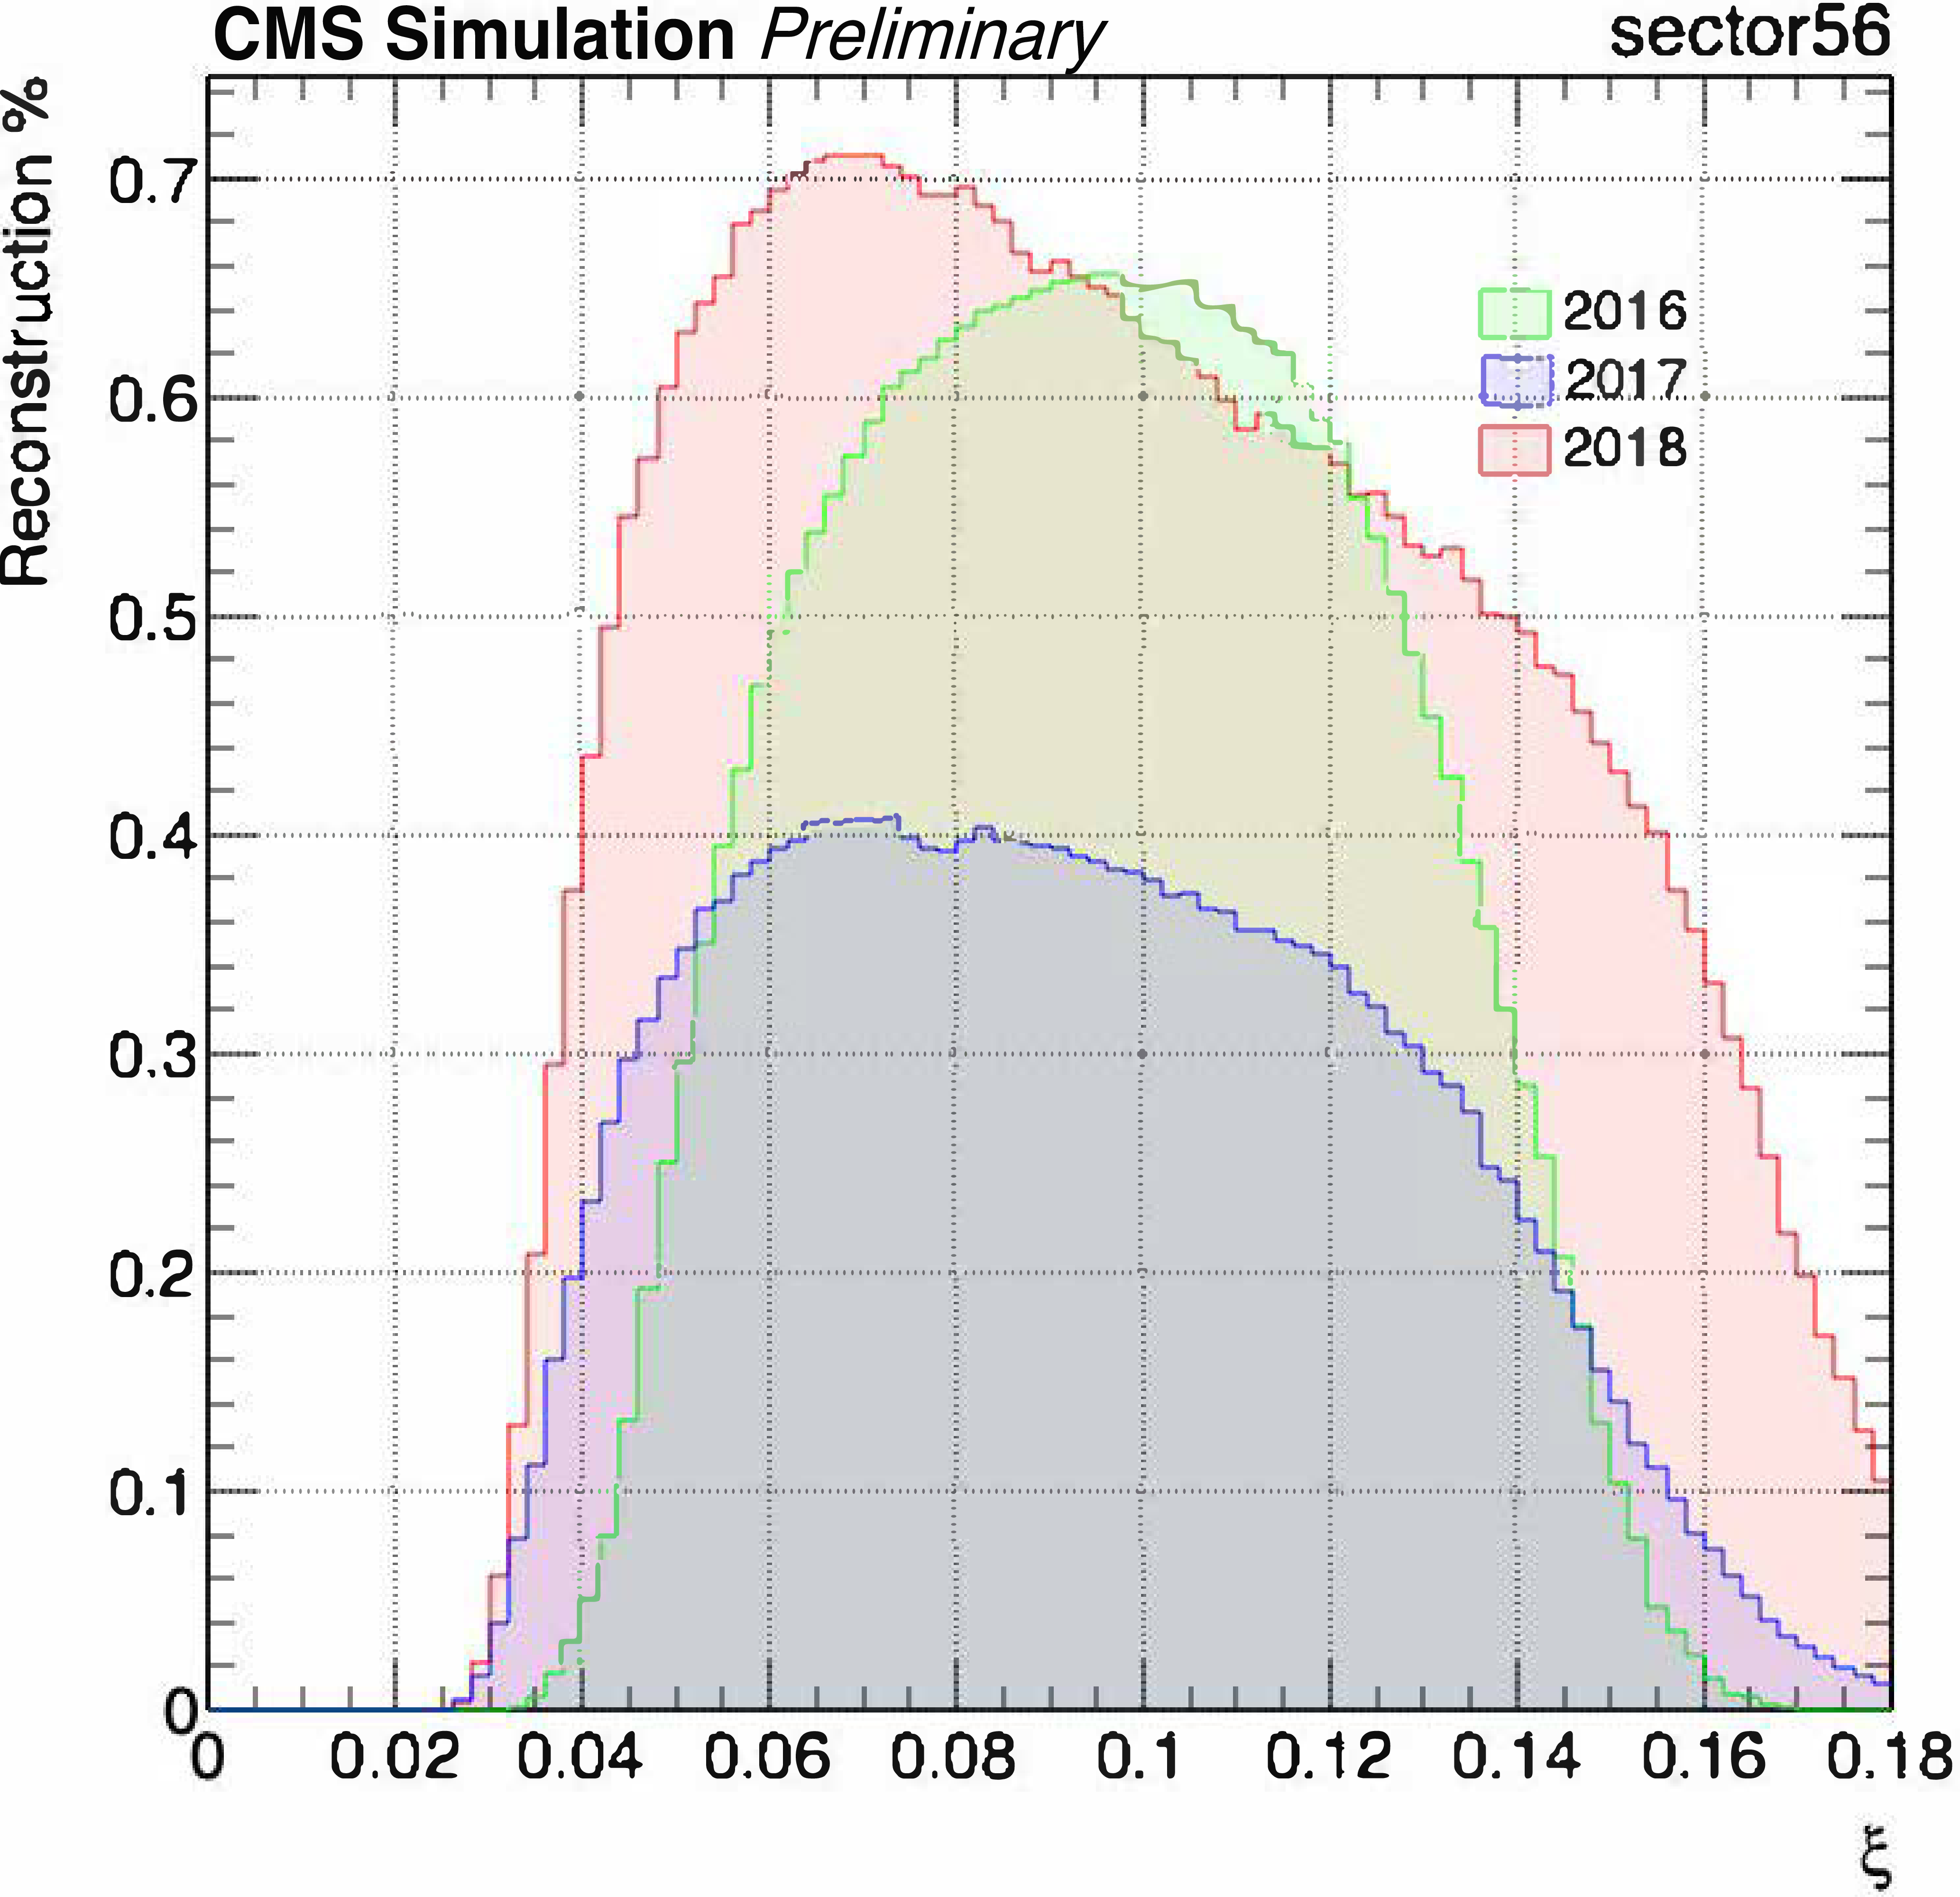
Figure 8-b:
Both efficiency and acceptance effects parameterized as function of the proton $\xi $ for all years. Differences in the reconstruction percentage can be attributed to differences in detector location, configuration, and design. |

png pdf |
Figure 9:
The observed and expected exclusion limits on the anomalous coupling parameters $\zeta _1$ and $\zeta _2$. |
png pdf |
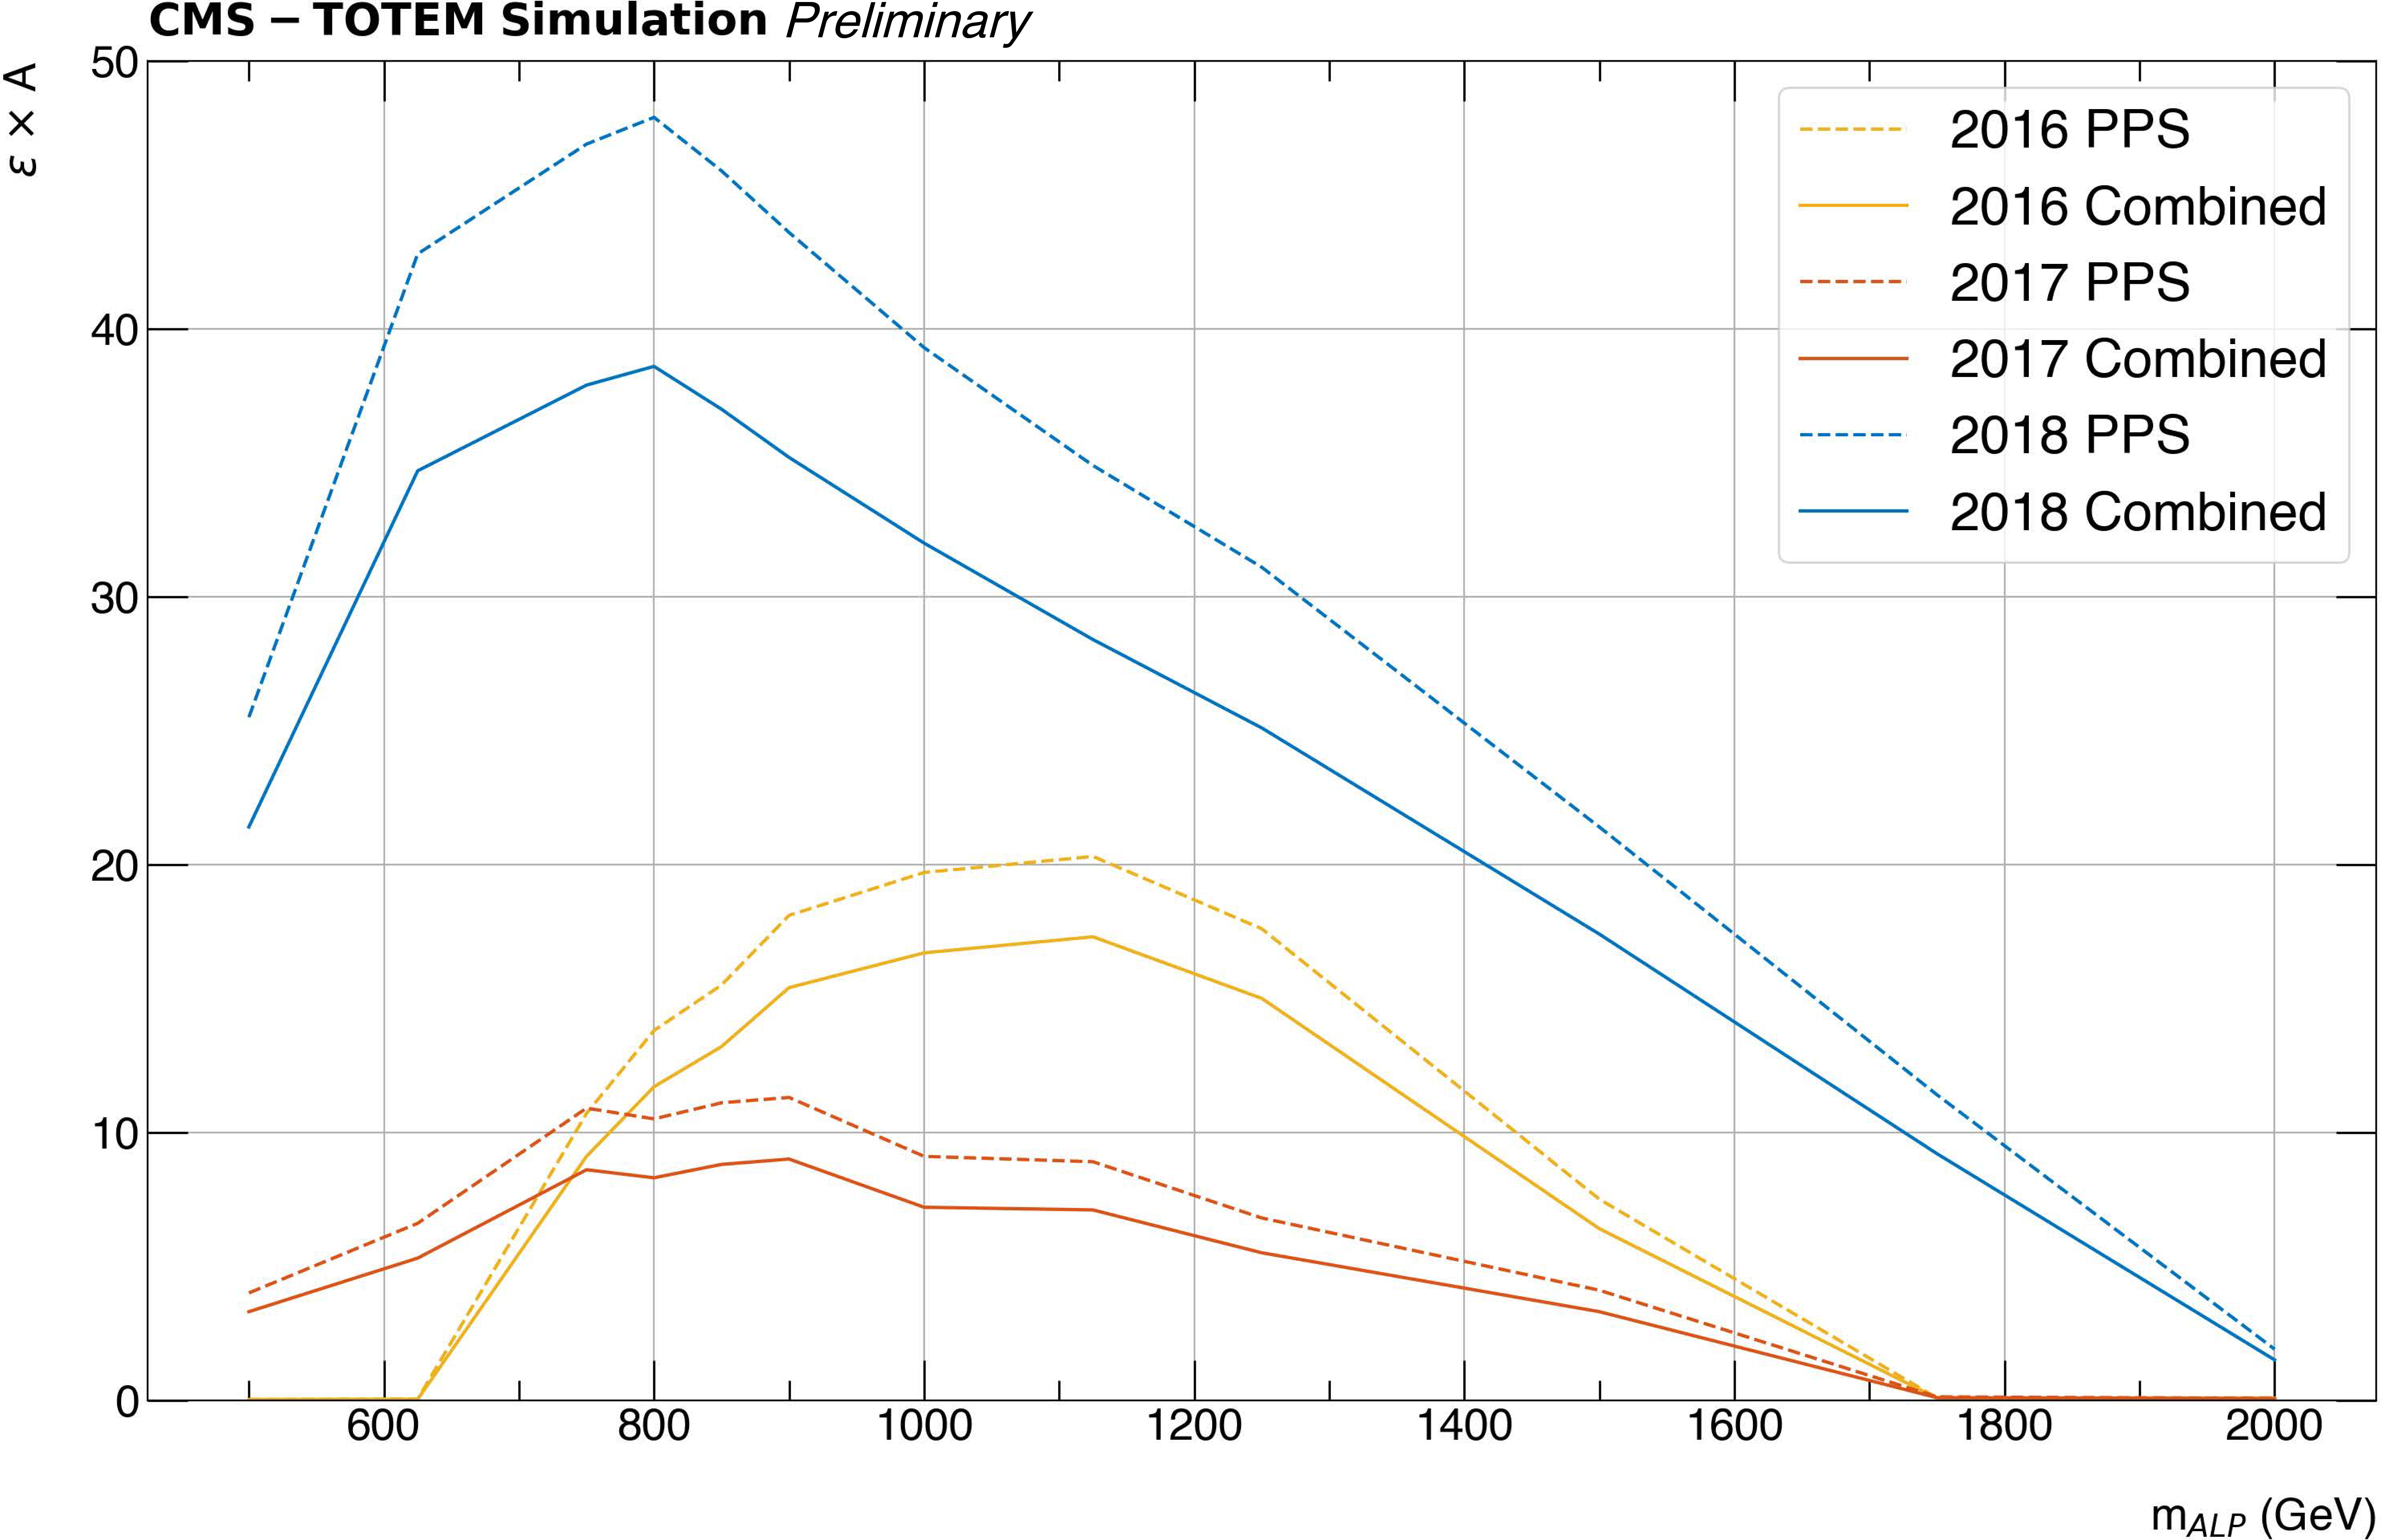
Figure 10:
ALP signal efficiency times acceptance ($\epsilon \times A$) for samples generated with $f^{-1}= $ 10$^{-1}$ TeV$^{-1}$ within the fiducial volume of this search. Values are shown for the PPS $\epsilon \times A$ and the same value convolved with the CMS $\epsilon \times A$. The CMS $\epsilon \times A$ remains mostly constant as a function of ALP mass and the nominal values are 85%, 80% and 81% for 2016, 2017, and 2018, respectively. |
png pdf |
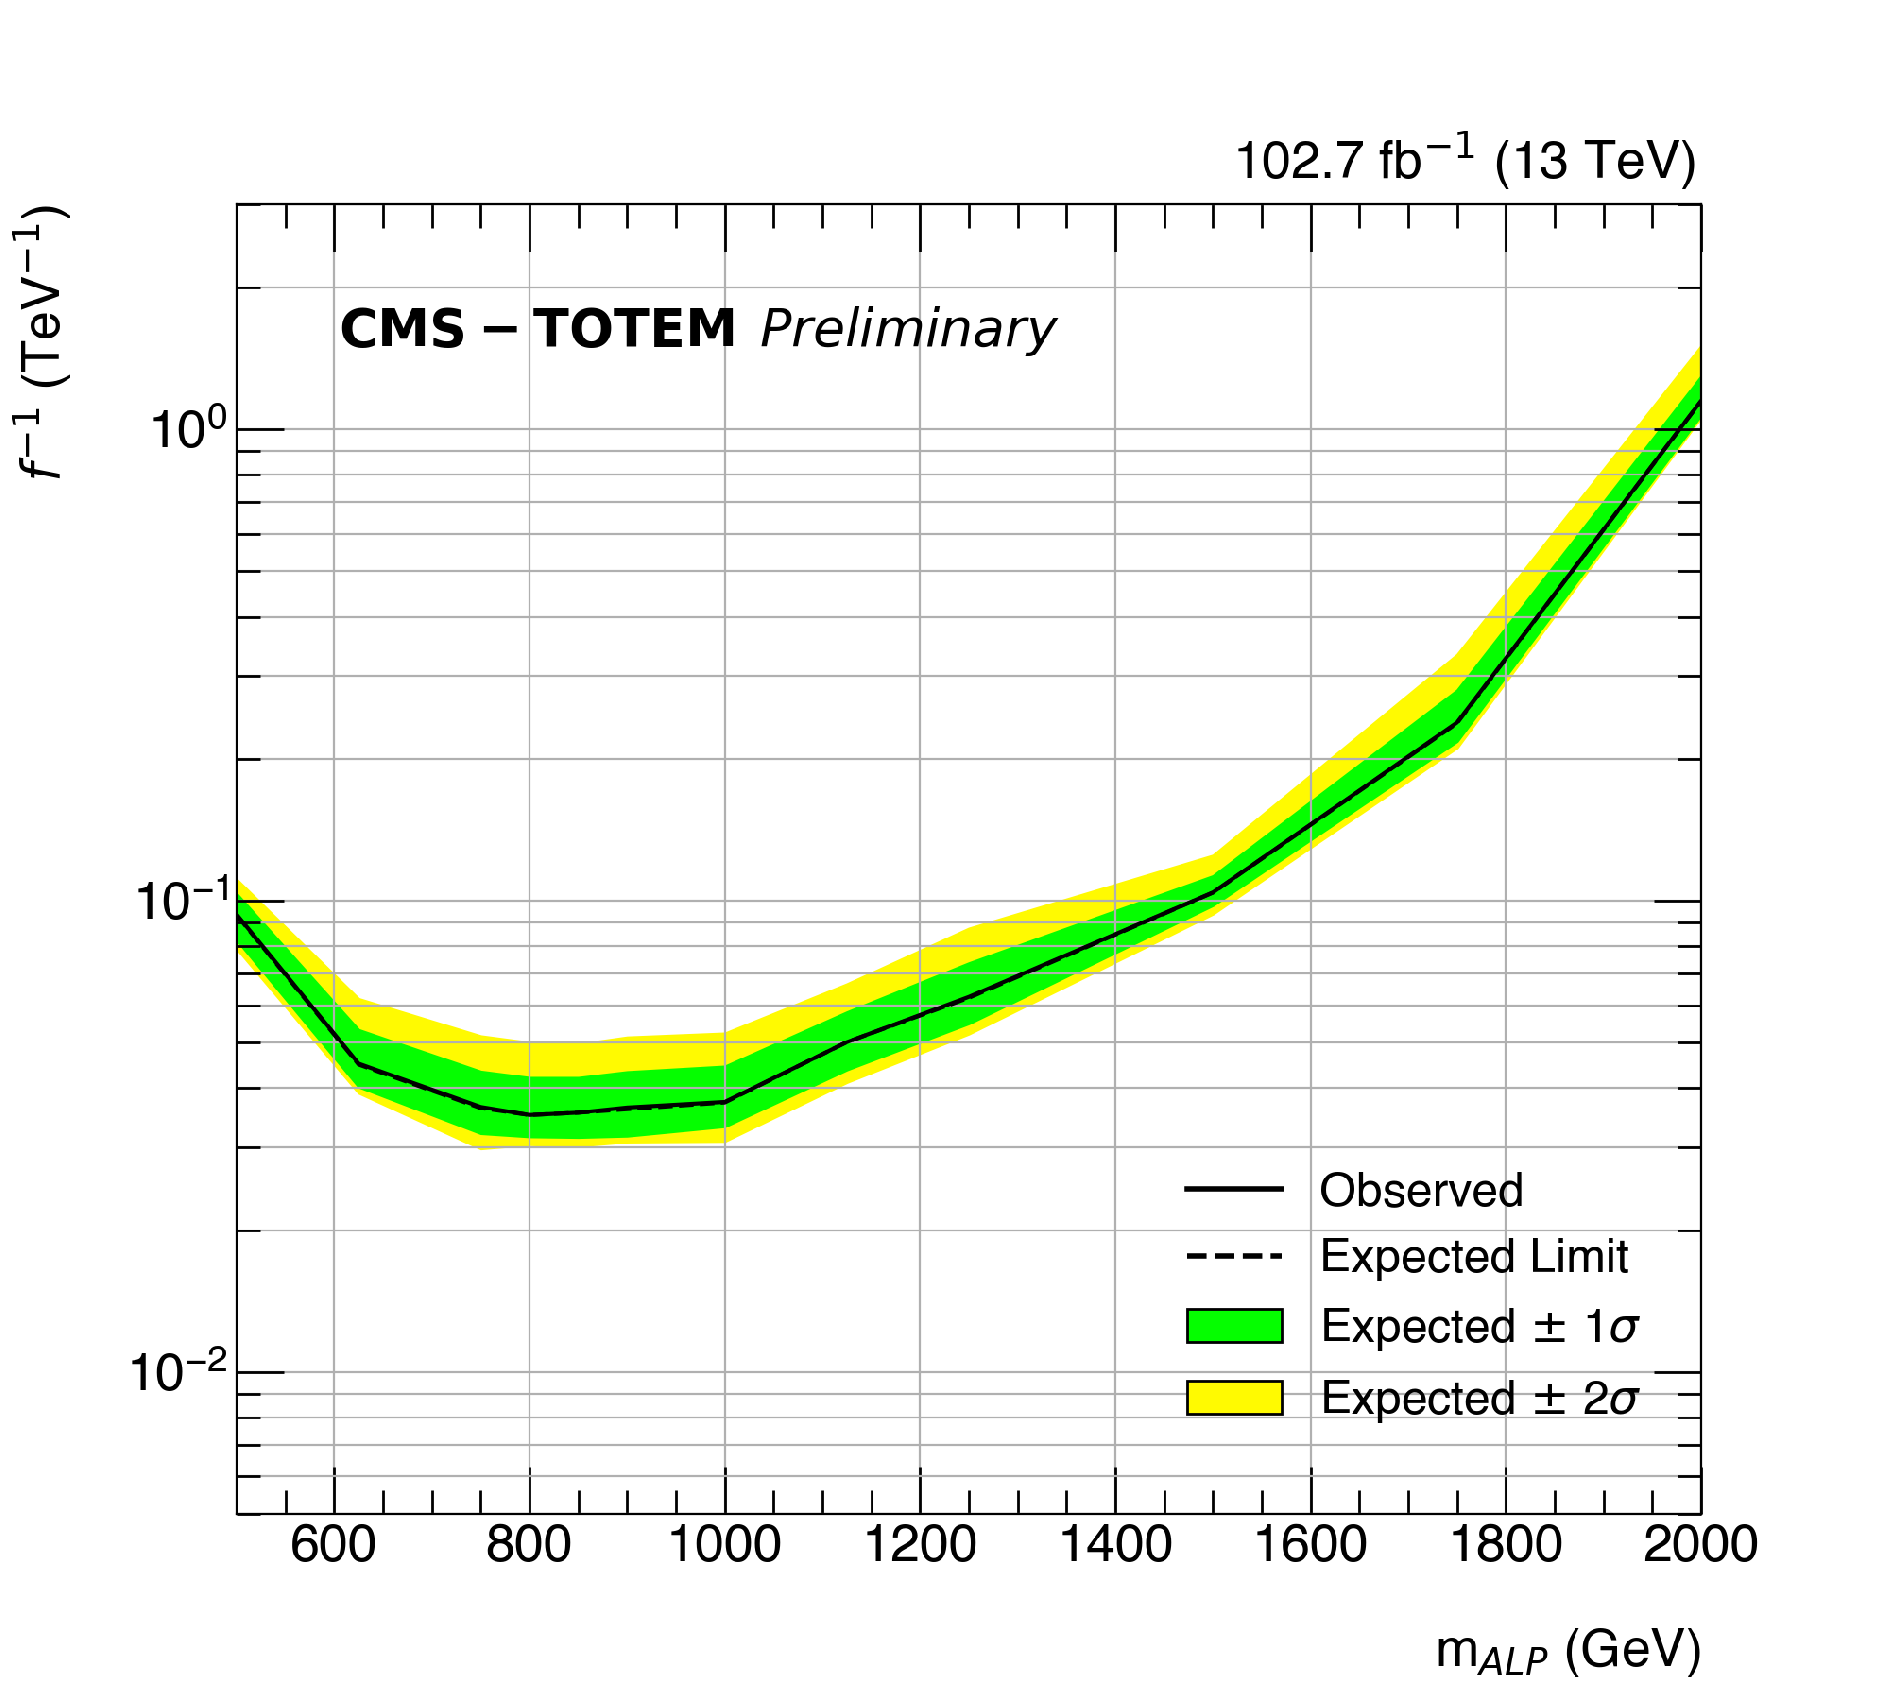
Figure 11:
Limits on axion-like particle (ALP) production in the plane of the ALP mass and the coupling strength. The shape of the limit curve follows the PPS acceptance times efficiency curve. |
| Tables | |
png pdf |
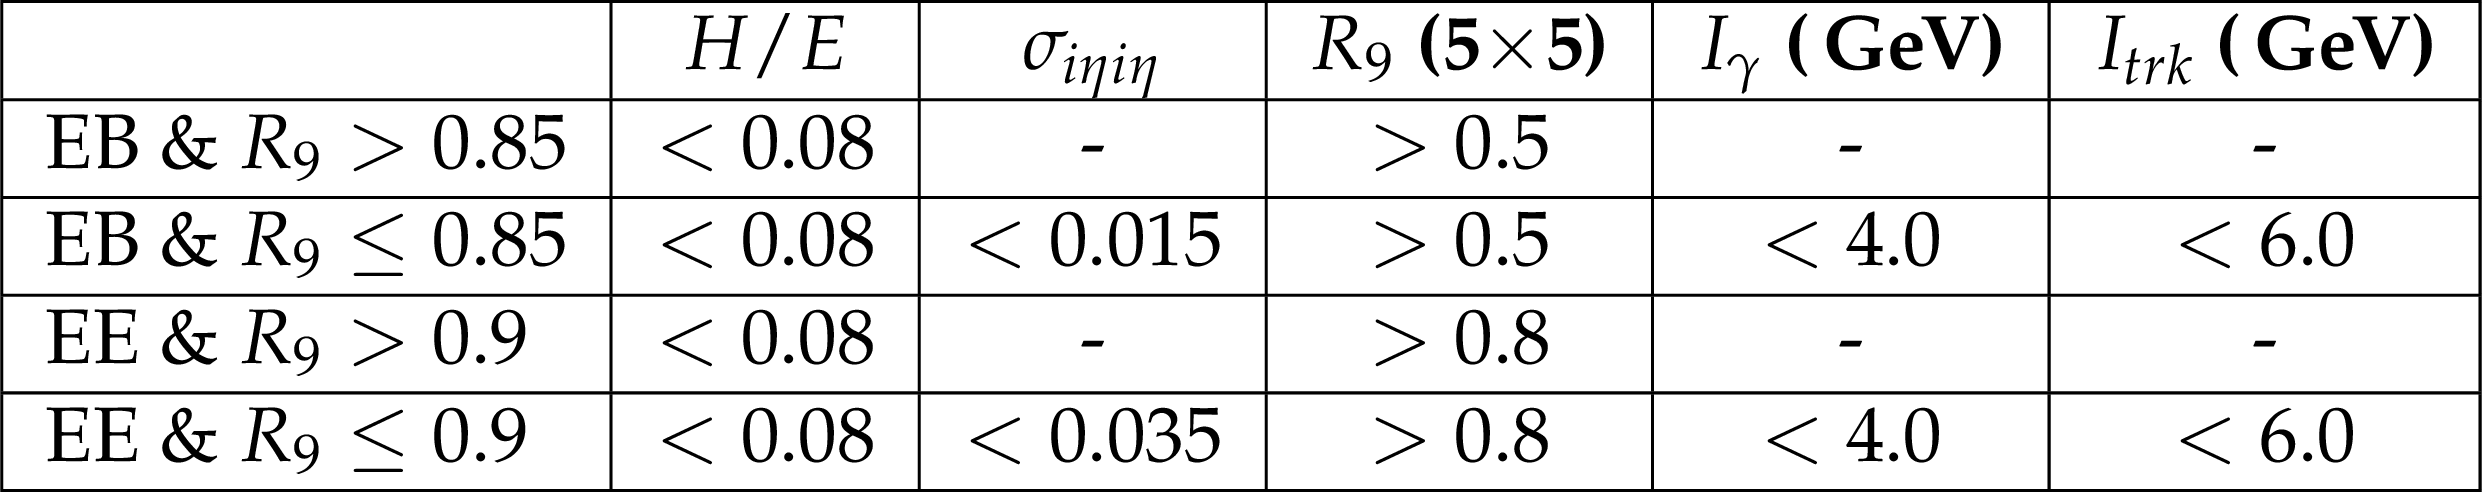
Table 1:
Selection criteria for various training samples used to train the BDT to identify photons. $H/E$ is defined as the ratio between the energy deposits in the hadronic and electromagnetic calorimeters. |

png pdf |
Table 2:
Summary of the predicted number of events for each Standard Model background contributing to the $\xi \in $ PPS selection region. The uncertainties quoted are statistical only. |
png pdf |
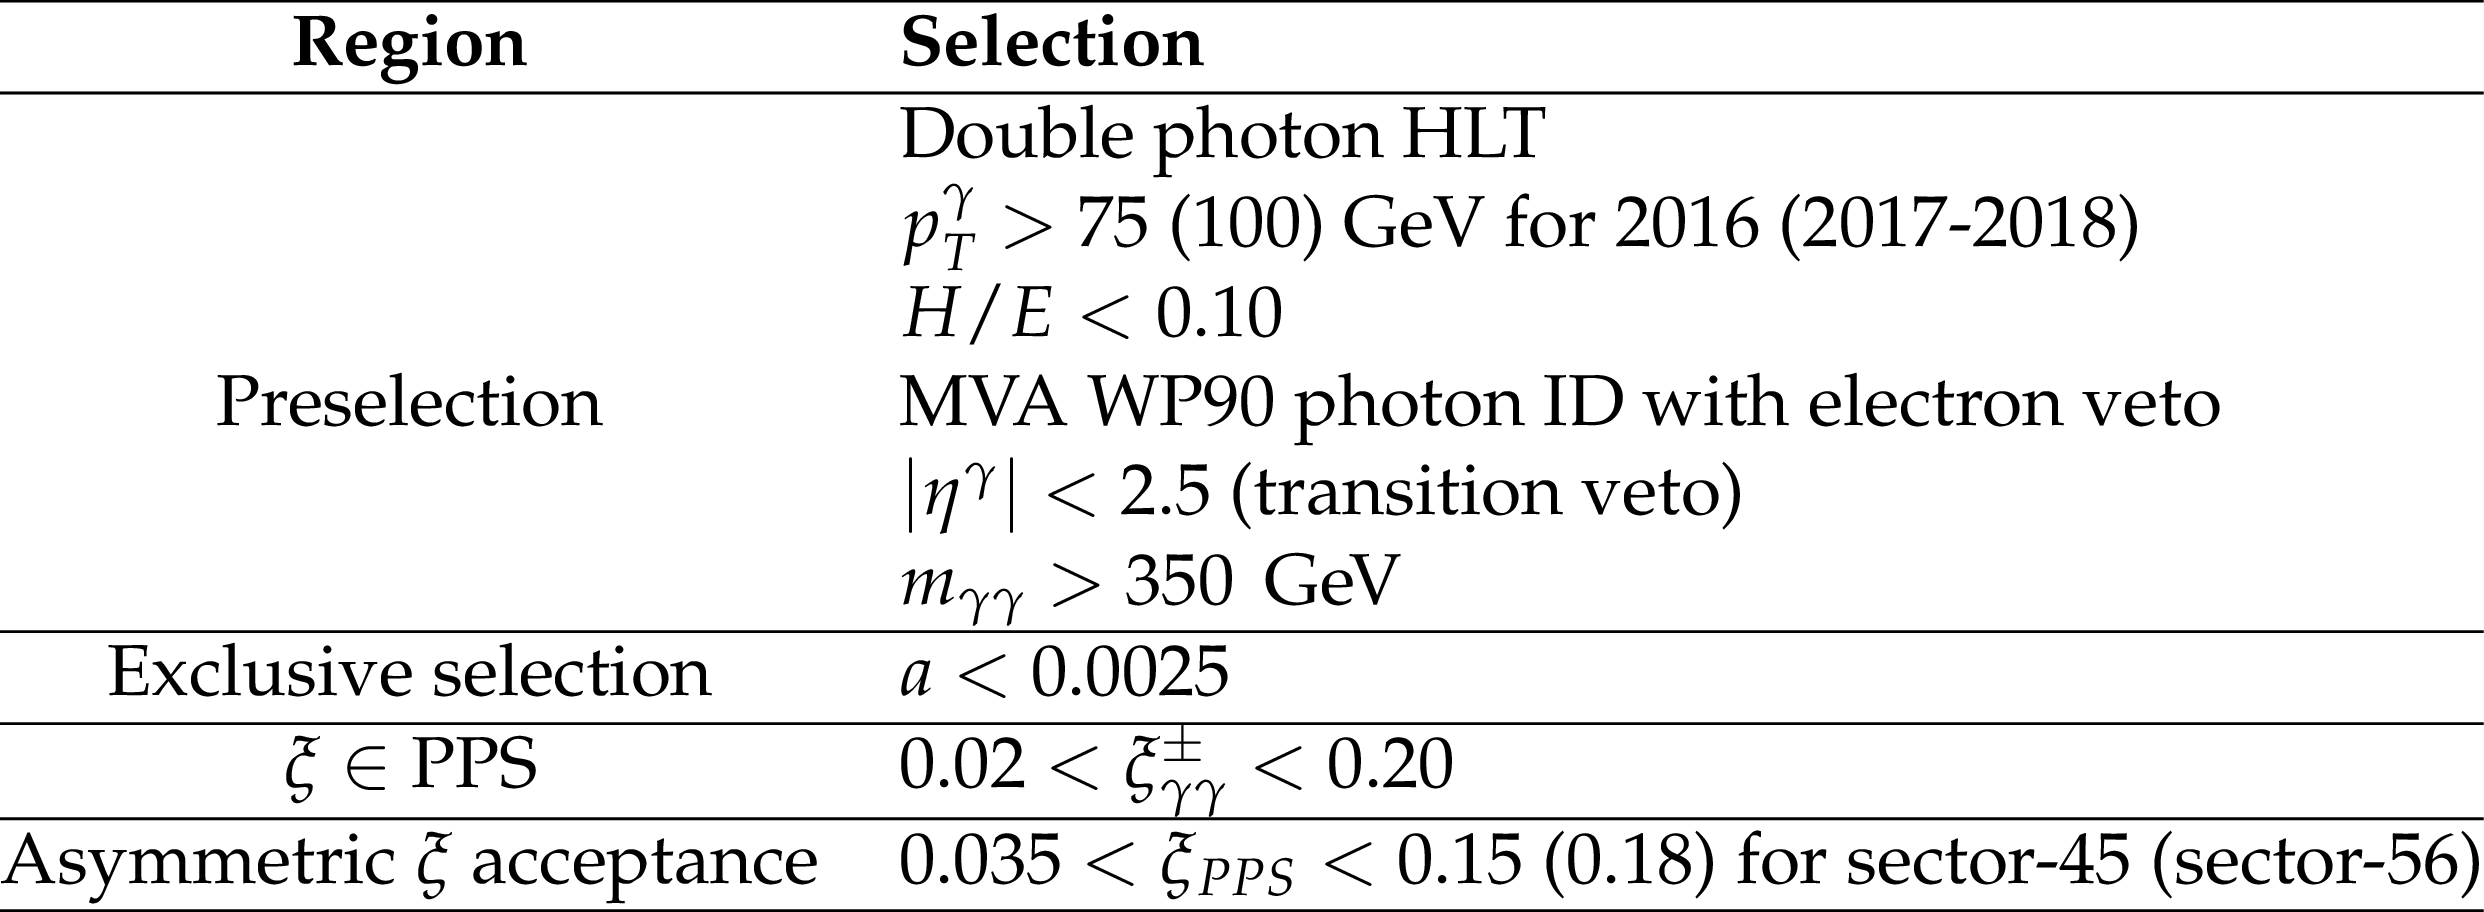
Table 3:
A summary of the selection regions defined in the text. |
png pdf |
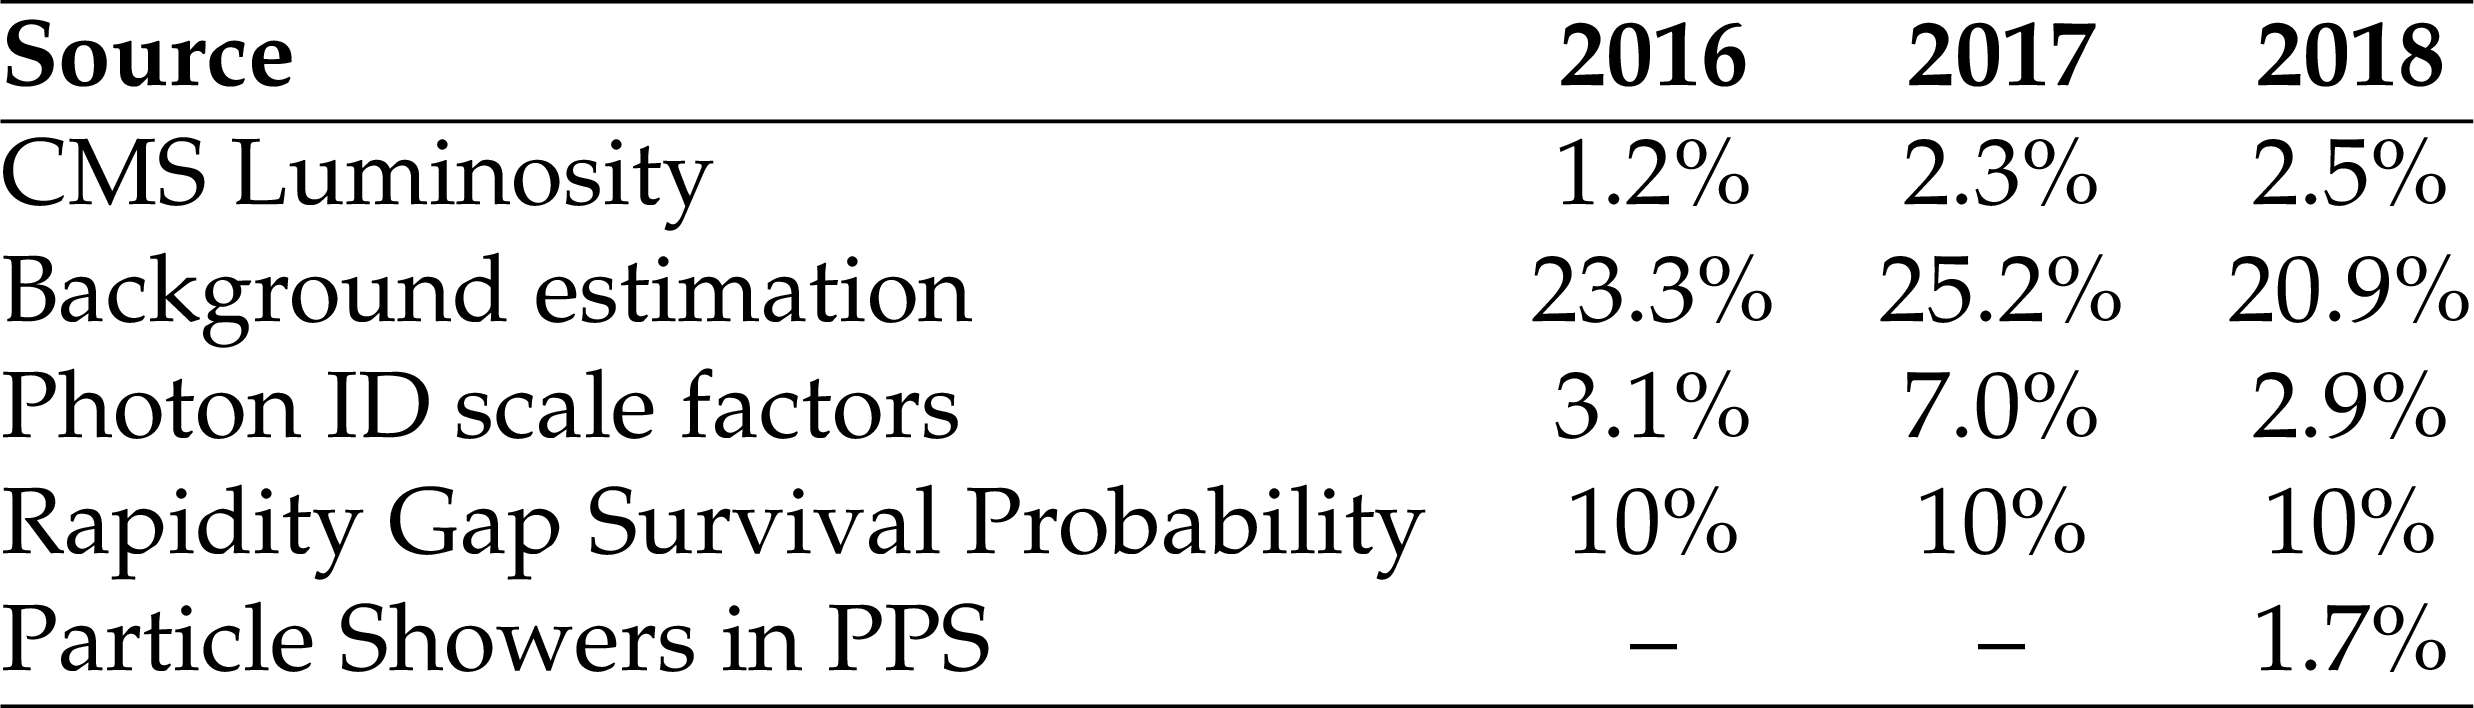
Table 4:
Systematic uncertainties corresponding to each year of data used in the analysis. |
png pdf |
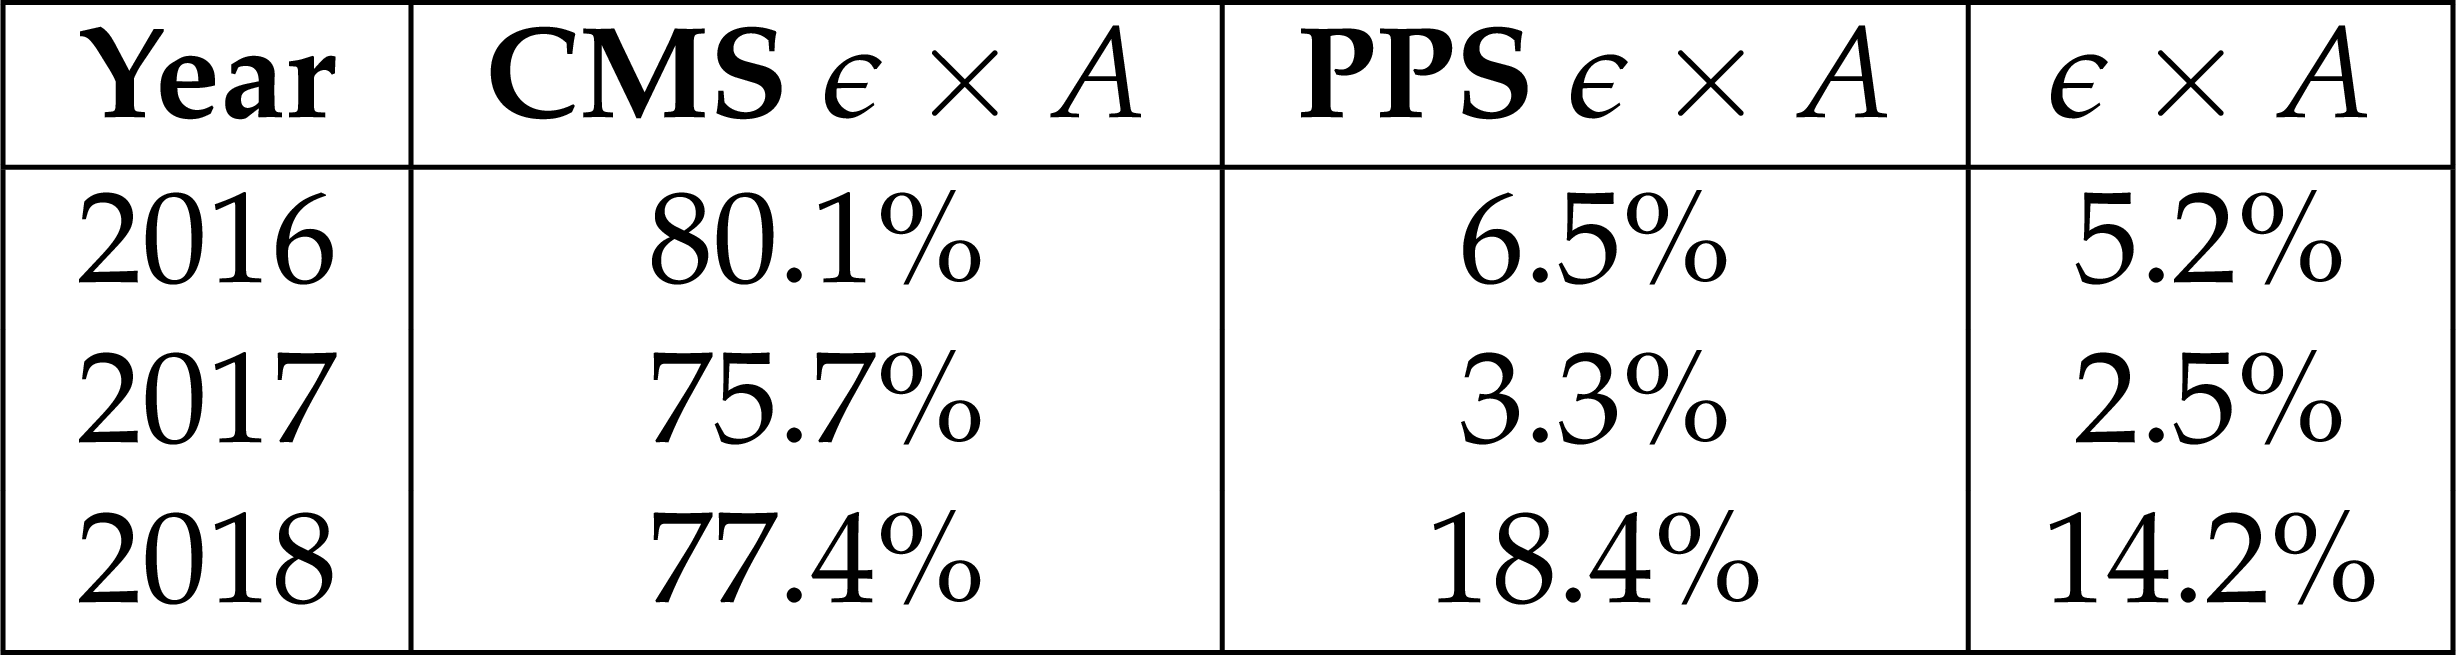
Table 5:
Anomalous coupling signal efficiency for each year of the Run II period. The left column is the CMS only efficiency, the middle column is the PPS efficiency, and the right column is the multiplicative combination of the previous columns. |
| Summary |
|
A search has been performed for physics beyond the standard model in high-mass exclusive diphoton events with two intact protons. The data used correspond to 102.7 fb$^{-1}$ in pp collisions collected by the CMS and PPS detectors in 2016, 2017, and 2018. Signal diphoton events are selected using a criteria developed for exclusive two-photon production and the final signal region is defined by having two opposite-side protons with corresponding kinematics to the diphoton system. The data are found to be in agreement with the predicted background with 1 event observed and 1.103 $\pm$ 0.003 (statistical) $\pm$ 0.238 (systematic) events expected. The best current limits are placed on 4$\gamma$ anomalous couplings within the fiducial range of the analysis defined as ${p_{\mathrm{T}}}^{\gamma} > $ 100 GeV and 0.035 $ < \xi < $ 0.15 (0.18) for the positive-z (negative-z) arm of PPS. Additionally, the strongest limits to data are placed on ALP production between the mass ranges of 500 - 2000 GeV within the fiducial volume of the analysis. |
| References | ||||
| 1 | K. Agashe, R. Contino, and A. Pomarol | The Minimal composite Higgs model | NPB 719 (2005) 165--187 | hep-ph/0412089 |
| 2 | K. Agashe, A. Delgado, M. J. May, and R. Sundrum | RS1, custodial isospin and precision tests | JHEP 08 (2003) 050 | hep-ph/0308036 |
| 3 | L. Randall and R. Sundrum | A Large mass hierarchy from a small extra dimension | PRL 83 (1999) 3370--3373 | hep-ph/9905221 |
| 4 | ATLAS Collaboration | Evidence for light-by-light scattering in heavy-ion collisions with the ATLAS detector at the LHC | NP 13 (2017), no. 9, 852--858 | 1702.01625 |
| 5 | CMS Collaboration | Evidence for light-by-light scattering and searches for axion-like particles in ultraperipheral PbPb collisions at $ {\sqrt {\smash [b]{s_{_{\mathrm {NN}}}}}} = $ 5.02 TeV | PLB 797 (2019) 134826 | CMS-FSQ-16-012 1810.04602 |
| 6 | ATLAS Collaboration | Observation of light-by-light scattering in ultraperipheral Pb+Pb collisions with the ATLAS detector | PRL 123 (2019), no. 5, 052001 | 1904.03536 |
| 7 | S. Fichet et al. | Light-by-light scattering with intact protons at the LHC: from Standard Model to New Physics | JHEP 02 (2015) 165 | 1411.6629 |
| 8 | C. Baldenegro, S. Fichet, G. Von Gersdorff, and C. Royon | Searching for axion-like particles with proton tagging at the LHC | JHEP 06 (2018) 131 | 1803.10835 |
| 9 | M. Bauer, M. Neubert, and A. Thamm | Collider Probes of Axion-Like Particles | JHEP 12 (2017) 044 | 1708.00443 |
| 10 | CMS and TOTEM Collaborations | First search for exclusive diphoton production at high mass with intact protons in proton-proton collisions at $ \sqrt{s} = $ 13 TeV at the LHC | CMS-PAS-EXO-18-014, CERN, Geneva | |
| 11 | CMS Collaboration | Performance of photon reconstruction and identification with the CMS detector in proton-proton collisions at $ \sqrt{s} = $ 8 TeV | JINST 10 (2015) P08010 | CMS-EGM-14-001 1502.02702 |
| 12 | CMS Collaboration | The CMS experiment at the CERN LHC | JINST 3 (2008) S08004 | CMS-00-001 |
| 13 | CMS Collaboration | Performance of the CMS Level-1 trigger in proton-proton collisions at $ \sqrt{s} = $ 13 TeV | JINST 15 (2020) P10017 | CMS-TRG-17-001 2006.10165 |
| 14 | CMS Collaboration | The CMS trigger system | JINST 12 (2017) P01020 | CMS-TRG-12-001 1609.02366 |
| 15 | CMS Collaboration | Particle-flow reconstruction and global event description with the CMS detector | JINST 12 (2017) P10003 | CMS-PRF-14-001 1706.04965 |
| 16 | M. Cacciari, G. P. Salam, and G. Soyez | The anti-$ k_t $ jet clustering algorithm | JHEP 04 (2008) 063 | 0802.1189 |
| 17 | M. Cacciari, G. P. Salam, and G. Soyez | FastJet user manual | EPJC 72 (2012) 1896 | 1111.6097 |
| 18 | CMS Collaboration | Jet energy scale and resolution in the CMS experiment in pp collisions at 8 TeV | JINST 12 (2017) P02014 | CMS-JME-13-004 1607.03663 |
| 19 | CMS Collaboration, TOTEM Collaboration Collaboration | Proton reconstruction with the CMS Precision Proton Spectrometer in Run 2 | technical report, CERN, Geneva | |
| 20 | CMS and TOTEM Collaborations | Proton reconstruction with the Precision Proton Spectrometer in Run 2 | PRO-21-001, CERN, Geneva | |
| 21 | CMS and TOTEM Collaborations | Observation of proton-tagged, central (semi)exclusive production of high-mass lepton pairs in pp collisions at 13 TeV with the CMS-TOTEM precision proton spectrometer | JHEP 07 (2018) 153 | 1803.04496 |
| 22 | CMS Collaboration | CMS Luminosity Measurements for the 2016 Data Taking Period | CMS-PAS-LUM-17-001 | CMS-PAS-LUM-17-001 |
| 23 | CMS Collaboration Collaboration | CMS luminosity measurement for the 2017 data-taking period at $ \sqrt{s} = $ 13 TeV | CMS-PAS-LUM-17-004, CERN, Geneva | |
| 24 | CMS Collaboration Collaboration | CMS luminosity measurement for the 2018 data-taking period at $ \sqrt{s} = $ 13 TeV | CMS-PAS-LUM-18-002, CERN, Geneva | |
| 25 | J. Alwall et al. | The automated computation of tree-level and next-to-leading order differential cross sections, and their matching to parton shower simulations | JHEP 07 (2014) 079 | 1405.0301 |
| 26 | NNPDF Collaboration | Parton distributions for the LHC Run II | JHEP 04 (2015) 040 | 1410.8849 |
| 27 | T. Sjostrand et al. | An introduction to PYTHIA 8.2 | CPC 191 (2015) 159--177 | 1410.3012 |
| 28 | CMS Collaboration | Extraction and validation of a new set of CMS PYTHIA-8 tunes from underlying-event measurements | EPJC 80 (2020), no. 1, 4 | CMS-GEN-17-001 1903.12179 |
| 29 | M. Boonekamp et al. | FPMC: A Generator for forward physics | 1102.2531 | |
| 30 | V. M. Budnev, I. F. Ginzburg, G. V. Meledin, and V. G. Serbo | The Two photon particle production mechanism. Physical problems. Applications. Equivalent photon approximation | PR 15 (1975) 181--281 | |
| 31 | GEANT4 Collaboration | GEANT4--a simulation toolkit | NIMA 506 (2003) 250--303 | |
| 32 | CMS Collaboration | Electron and photon reconstruction and identification with the CMS experiment at the CERN LHC | JINST 16 (2021), no. 05, P05014 | CMS-EGM-17-001 2012.06888 |
| 33 | S. Fichet, G. von Gersdorff, and C. Royon | Scattering light by light at 750 GeV at the LHC | PRD93 (2016), no. 7, 075031 | 1512.05751 |
| 34 | L. A. Harland-Lang, V. A. Khoze, and M. G. Ryskin | Exclusive physics at the LHC with SuperChic 2 | EPJC 76 (2016), no. 1, 9 | 1508.02718 |
| 35 | T. Junk | Confidence level computation for combining searches with small statistics | NIMA 434 (1999) 435--443 | hep-ex/9902006 |
| 36 | A. L. Read | Modified frequentist analysis of search results (The CL(s) method) | in Workshop on Confidence Limits, pp. 81--101 8 | |
| 37 | The ATLAS and CMS Collaborations and The LHC Higgs Combination Group | Procedure for the LHC Higgs boson search combination in Summer 2011 | CMS-NOTE-2011-005 | |
|
|
Compact Muon Solenoid LHC, CERN |
|

|

|

|

|

|