

Compact Muon Solenoid
LHC, CERN
| CMS-PAS-BPH-20-001 | ||
| Measurement of the CP violating phase $\phi_{\text{s}}$ in the $\mathrm{B}_s \to \mathrm{J}/\psi\,\phi(1020) \to \mu^+\mu^-\,\mathrm{K}^+\mathrm{K}^-$ channel in proton-proton collisions at $\sqrt{s} = $ 13 TeV | ||
| CMS Collaboration | ||
| March 2020 | ||
| Abstract: The CP violating weak phase $\phi_{\text{s}}$, and the decay width difference $\Delta\Gamma_{\text{s}}$ between the light and heavy $\mathrm{B_s}$ mass eigenstates are measured with the CMS detector at the LHC in a sample of reconstructed $\mathrm{B}_s \to \mathrm{J}/\psi\,\phi(1020) \to \mu^+\mu^-\,\mathrm{K}^+\mathrm{K}^-$ decays. The measurement is based on a data set corresponding to an integrated luminosity of 96.4 fb$^{-1}$, collected in proton-proton collisions at a center-of-mass energy of 13 TeV in 2017-2018. To extract the values of $\phi_{\text{s}}$ and $\Delta\Gamma_{\text{s}}$, a time-dependent and flavor-tagged angular analysis of the $\mu^+\mu^-\,\mathrm{K}^+\mathrm{K}^-$ final state is performed. The analysis employs a novel opposite-side muon flavor tagger based on machine learning techniques, which, in conjunction with a dedicated tagging trigger, allowed to reach an unprecedented tagging power. The measurement yields $\phi_{\text{s}} = $ -0.011 $\pm$ 0.050 (stat) $\pm$ 0.010 (syst) rad, and $\Delta\Gamma_{\text{s}} =$ 0.114 $\pm$ 0.014 (stat) $\pm$ 0.007 (syst) ps$^{-1}$, in agreement with the standard model predictions. When combined with our previous measurement at a center-of-mass energy of 8 TeV, the following values are obtained: $\phi_{\text{s}} = $ -0.021 $\pm$ 0.045 rad, $\Delta\Gamma_{\text{s}} = $ 0.1074 $\pm$ 0.0097 ps$^{-1}$, a significant improvement over the 8 TeV result. | ||
|
Links:
CDS record (PDF) ;
CADI line (restricted) ;
These preliminary results are superseded in this paper, PLB 816 (2021) 136188. The superseded preliminary plots can be found here. |
||
| Figures | |
png pdf |
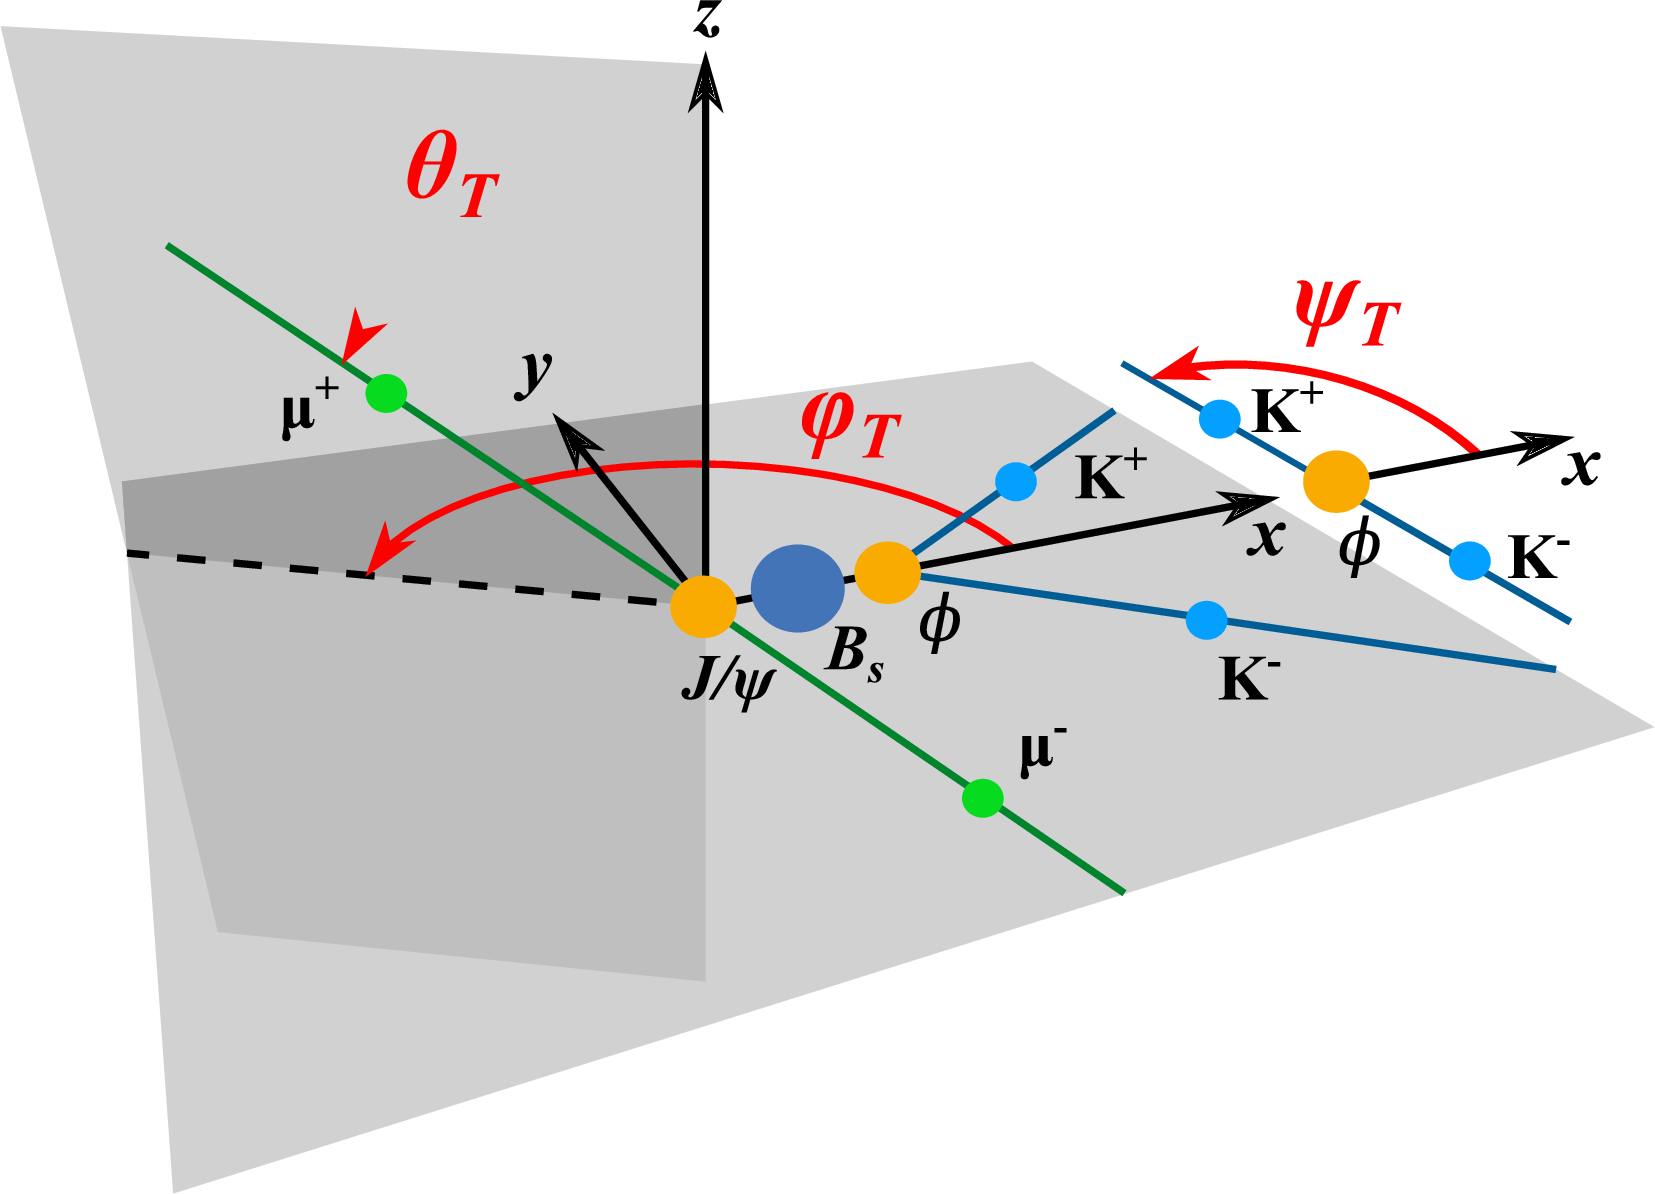
Figure 1:
Definition of the three angles ${\theta _\text {T}}$, ${\psi _\text {T}}$, and ${\varphi _\text {T}}$ describing the topology of the ${\mathrm{B_s} \to \mathrm{J}/\psi \,\phi(1020)\to {\mu^{+} \mu^{-}} {\mathrm{K^{+}} \mathrm{K^{-}}}}$ decay. |
png pdf |
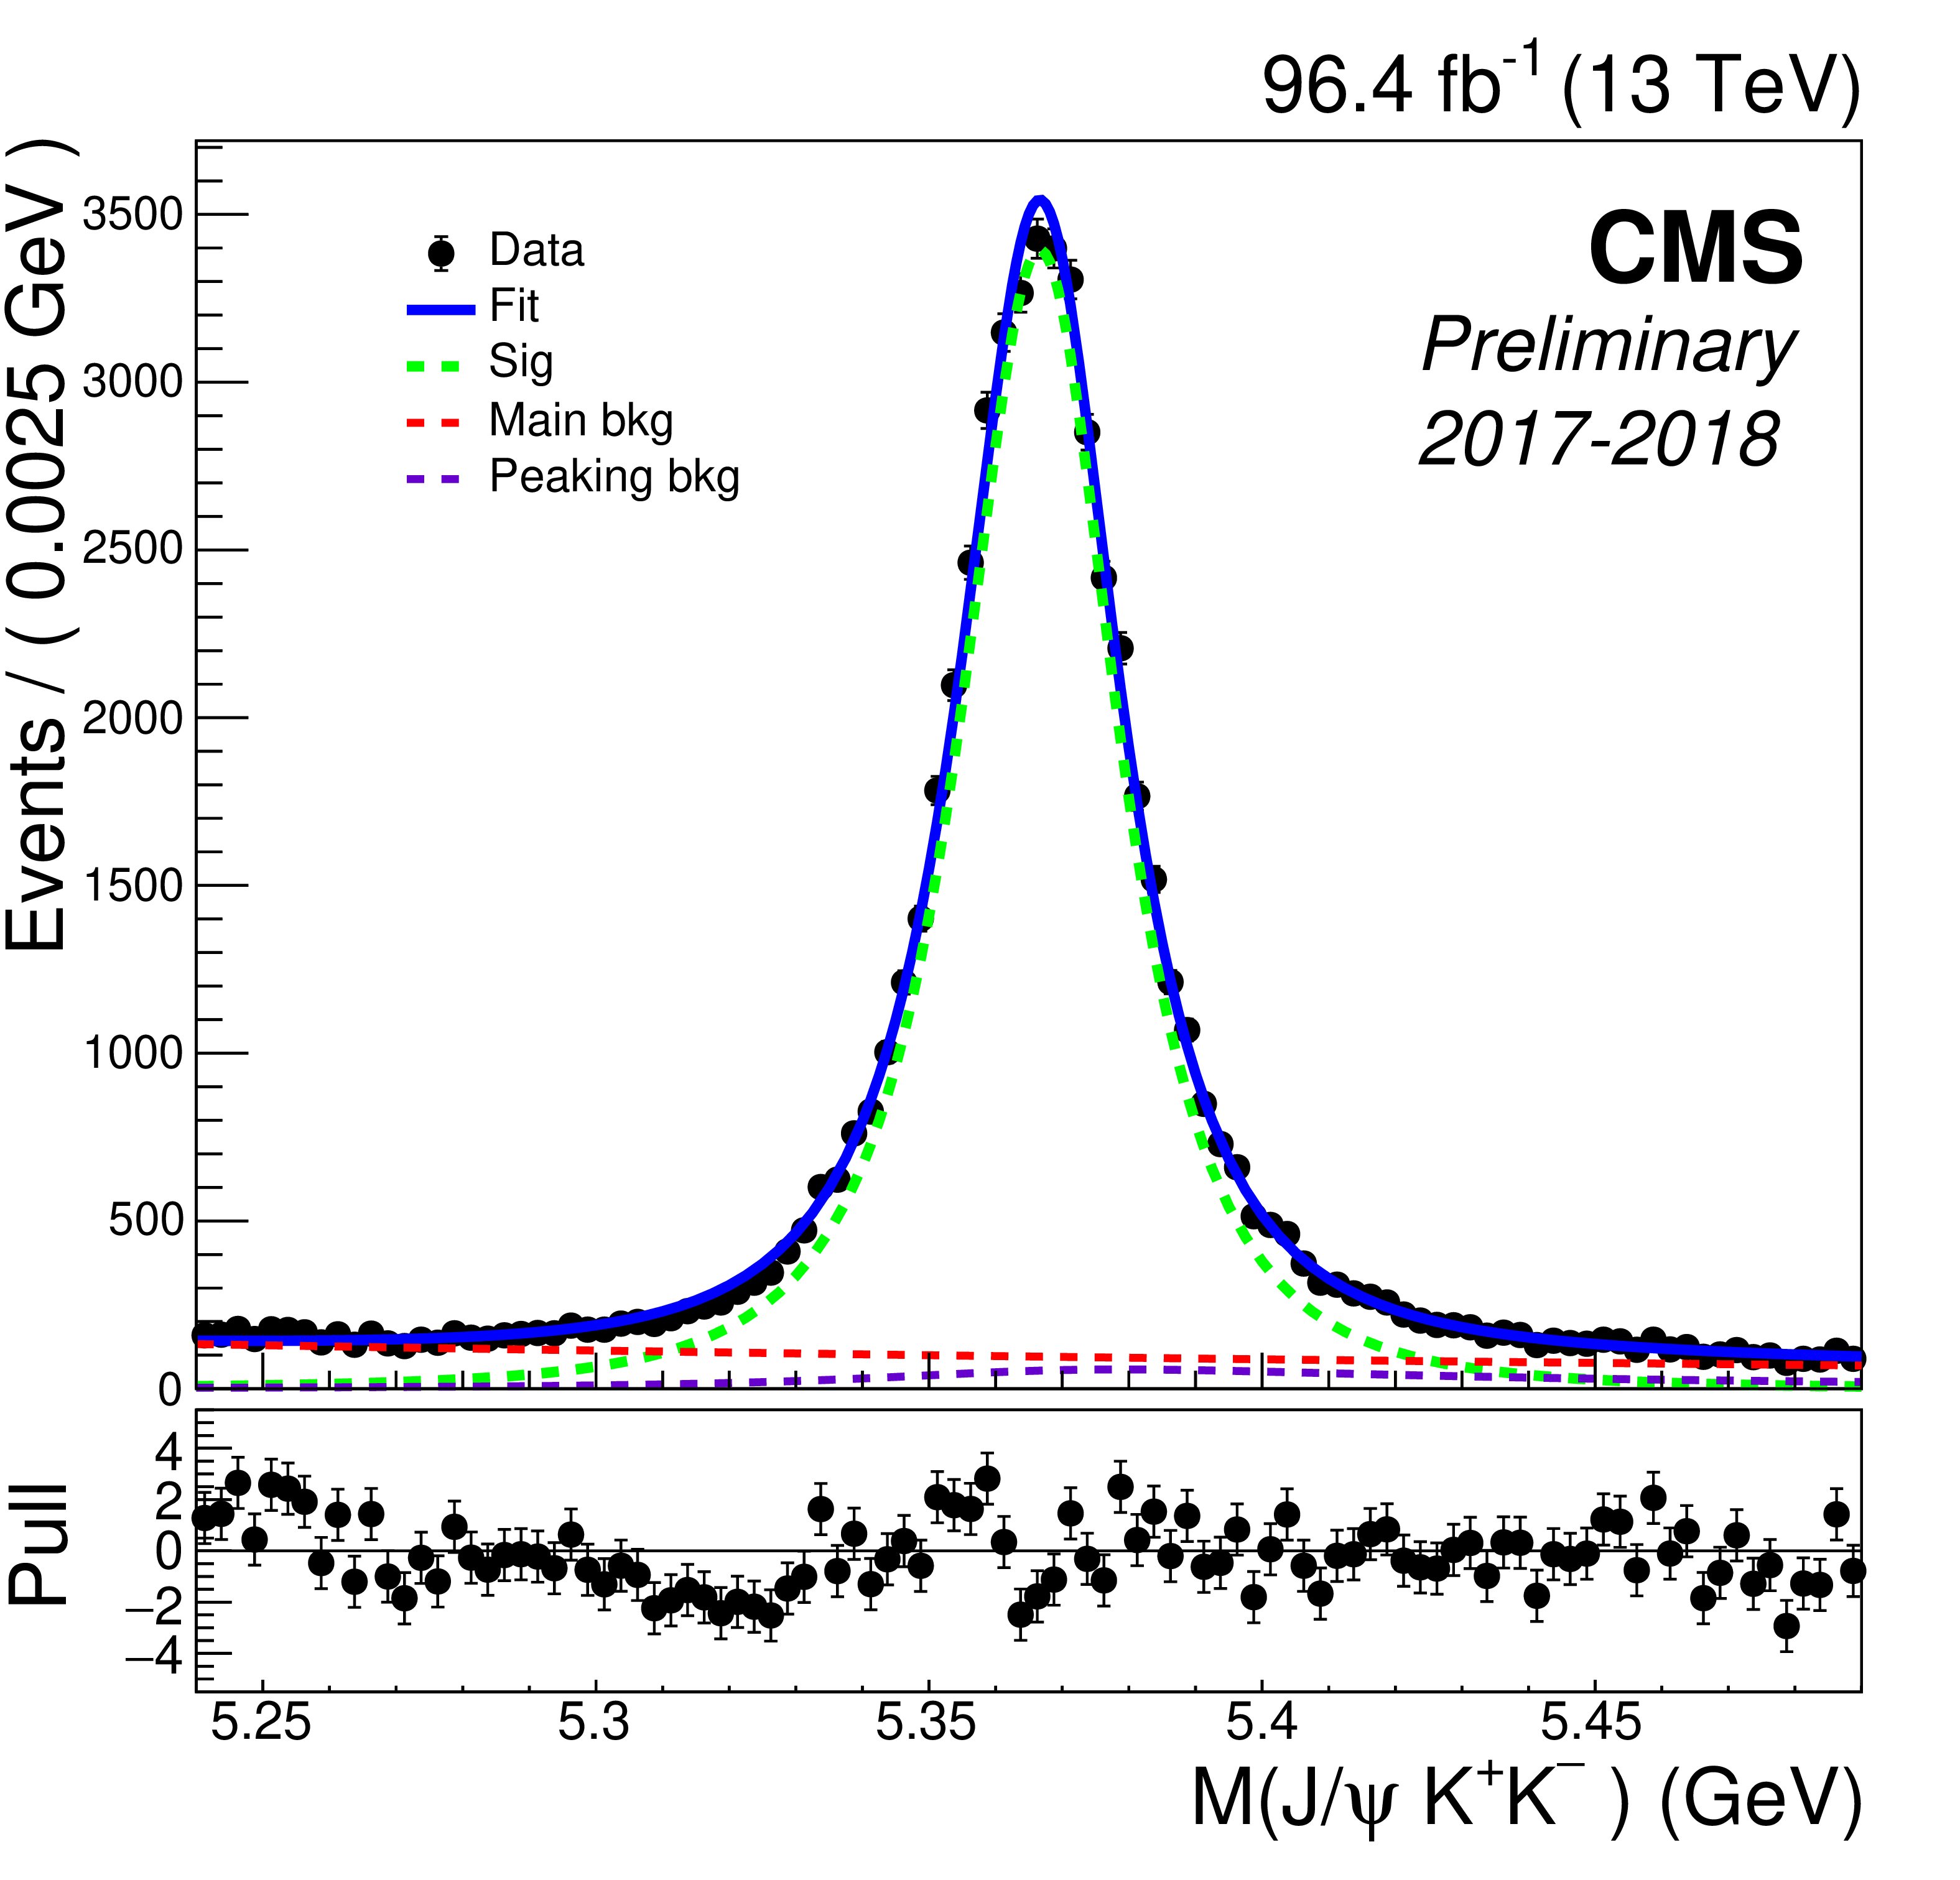
Figure 2:
The invariant mass distribution of the ${\mathrm{B_s} \to \mathrm{J}/\psi \,\phi(1020)\to {\mu^{+} \mu^{-}} {\mathrm{K^{+}} \mathrm{K^{-}}}}$ candidates in data. The solid line represents a fit to data (solid markers), the dashed green line corresponds to the signal, while the dashed red (magenta) line corresponds to the combinatorial (peaking) background, as obtained by the fit. The distribution of the pulls between the data and the fit for each bin is displayed in the bottom panel. |
png pdf |
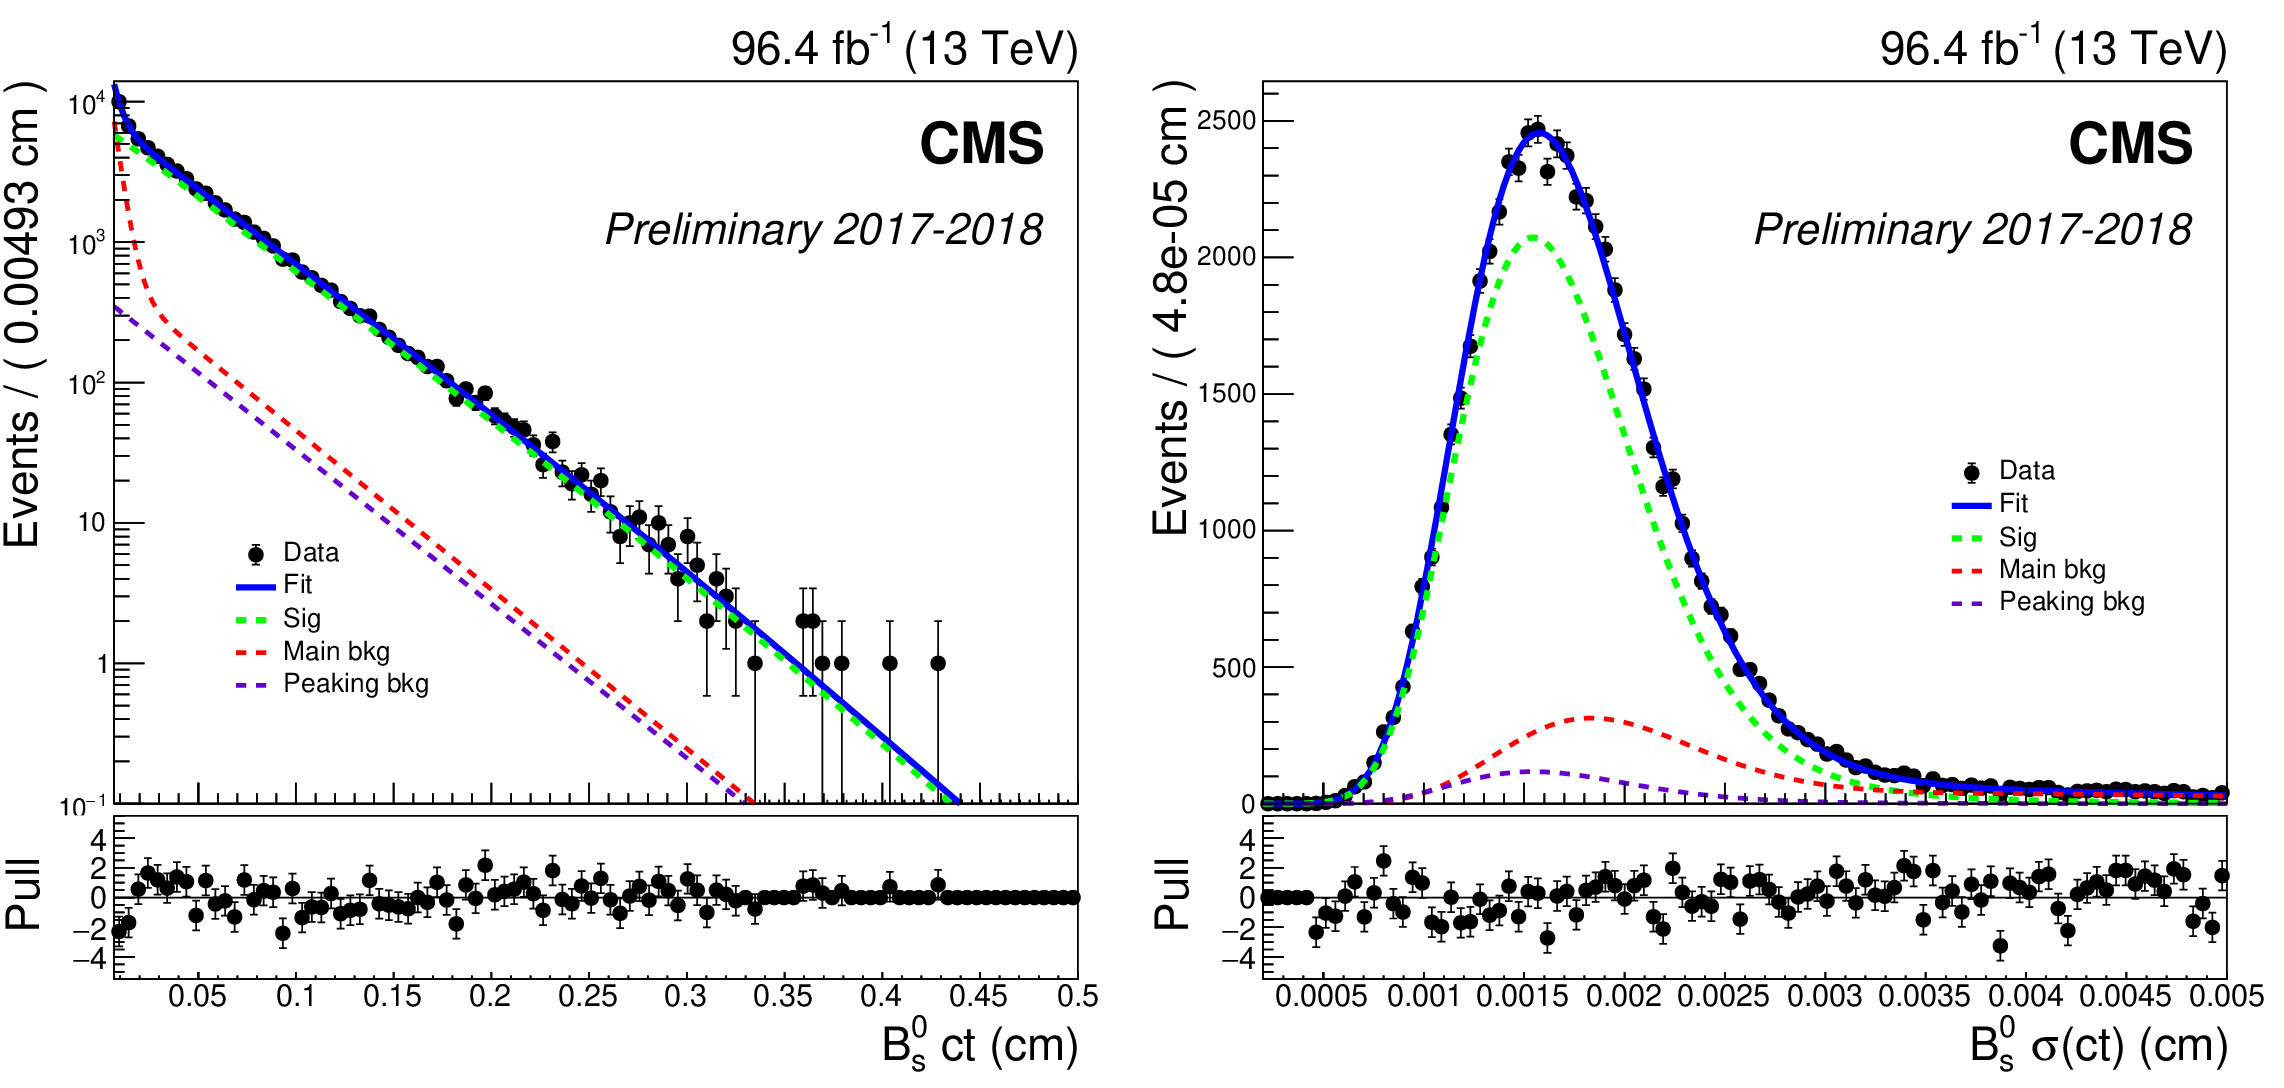
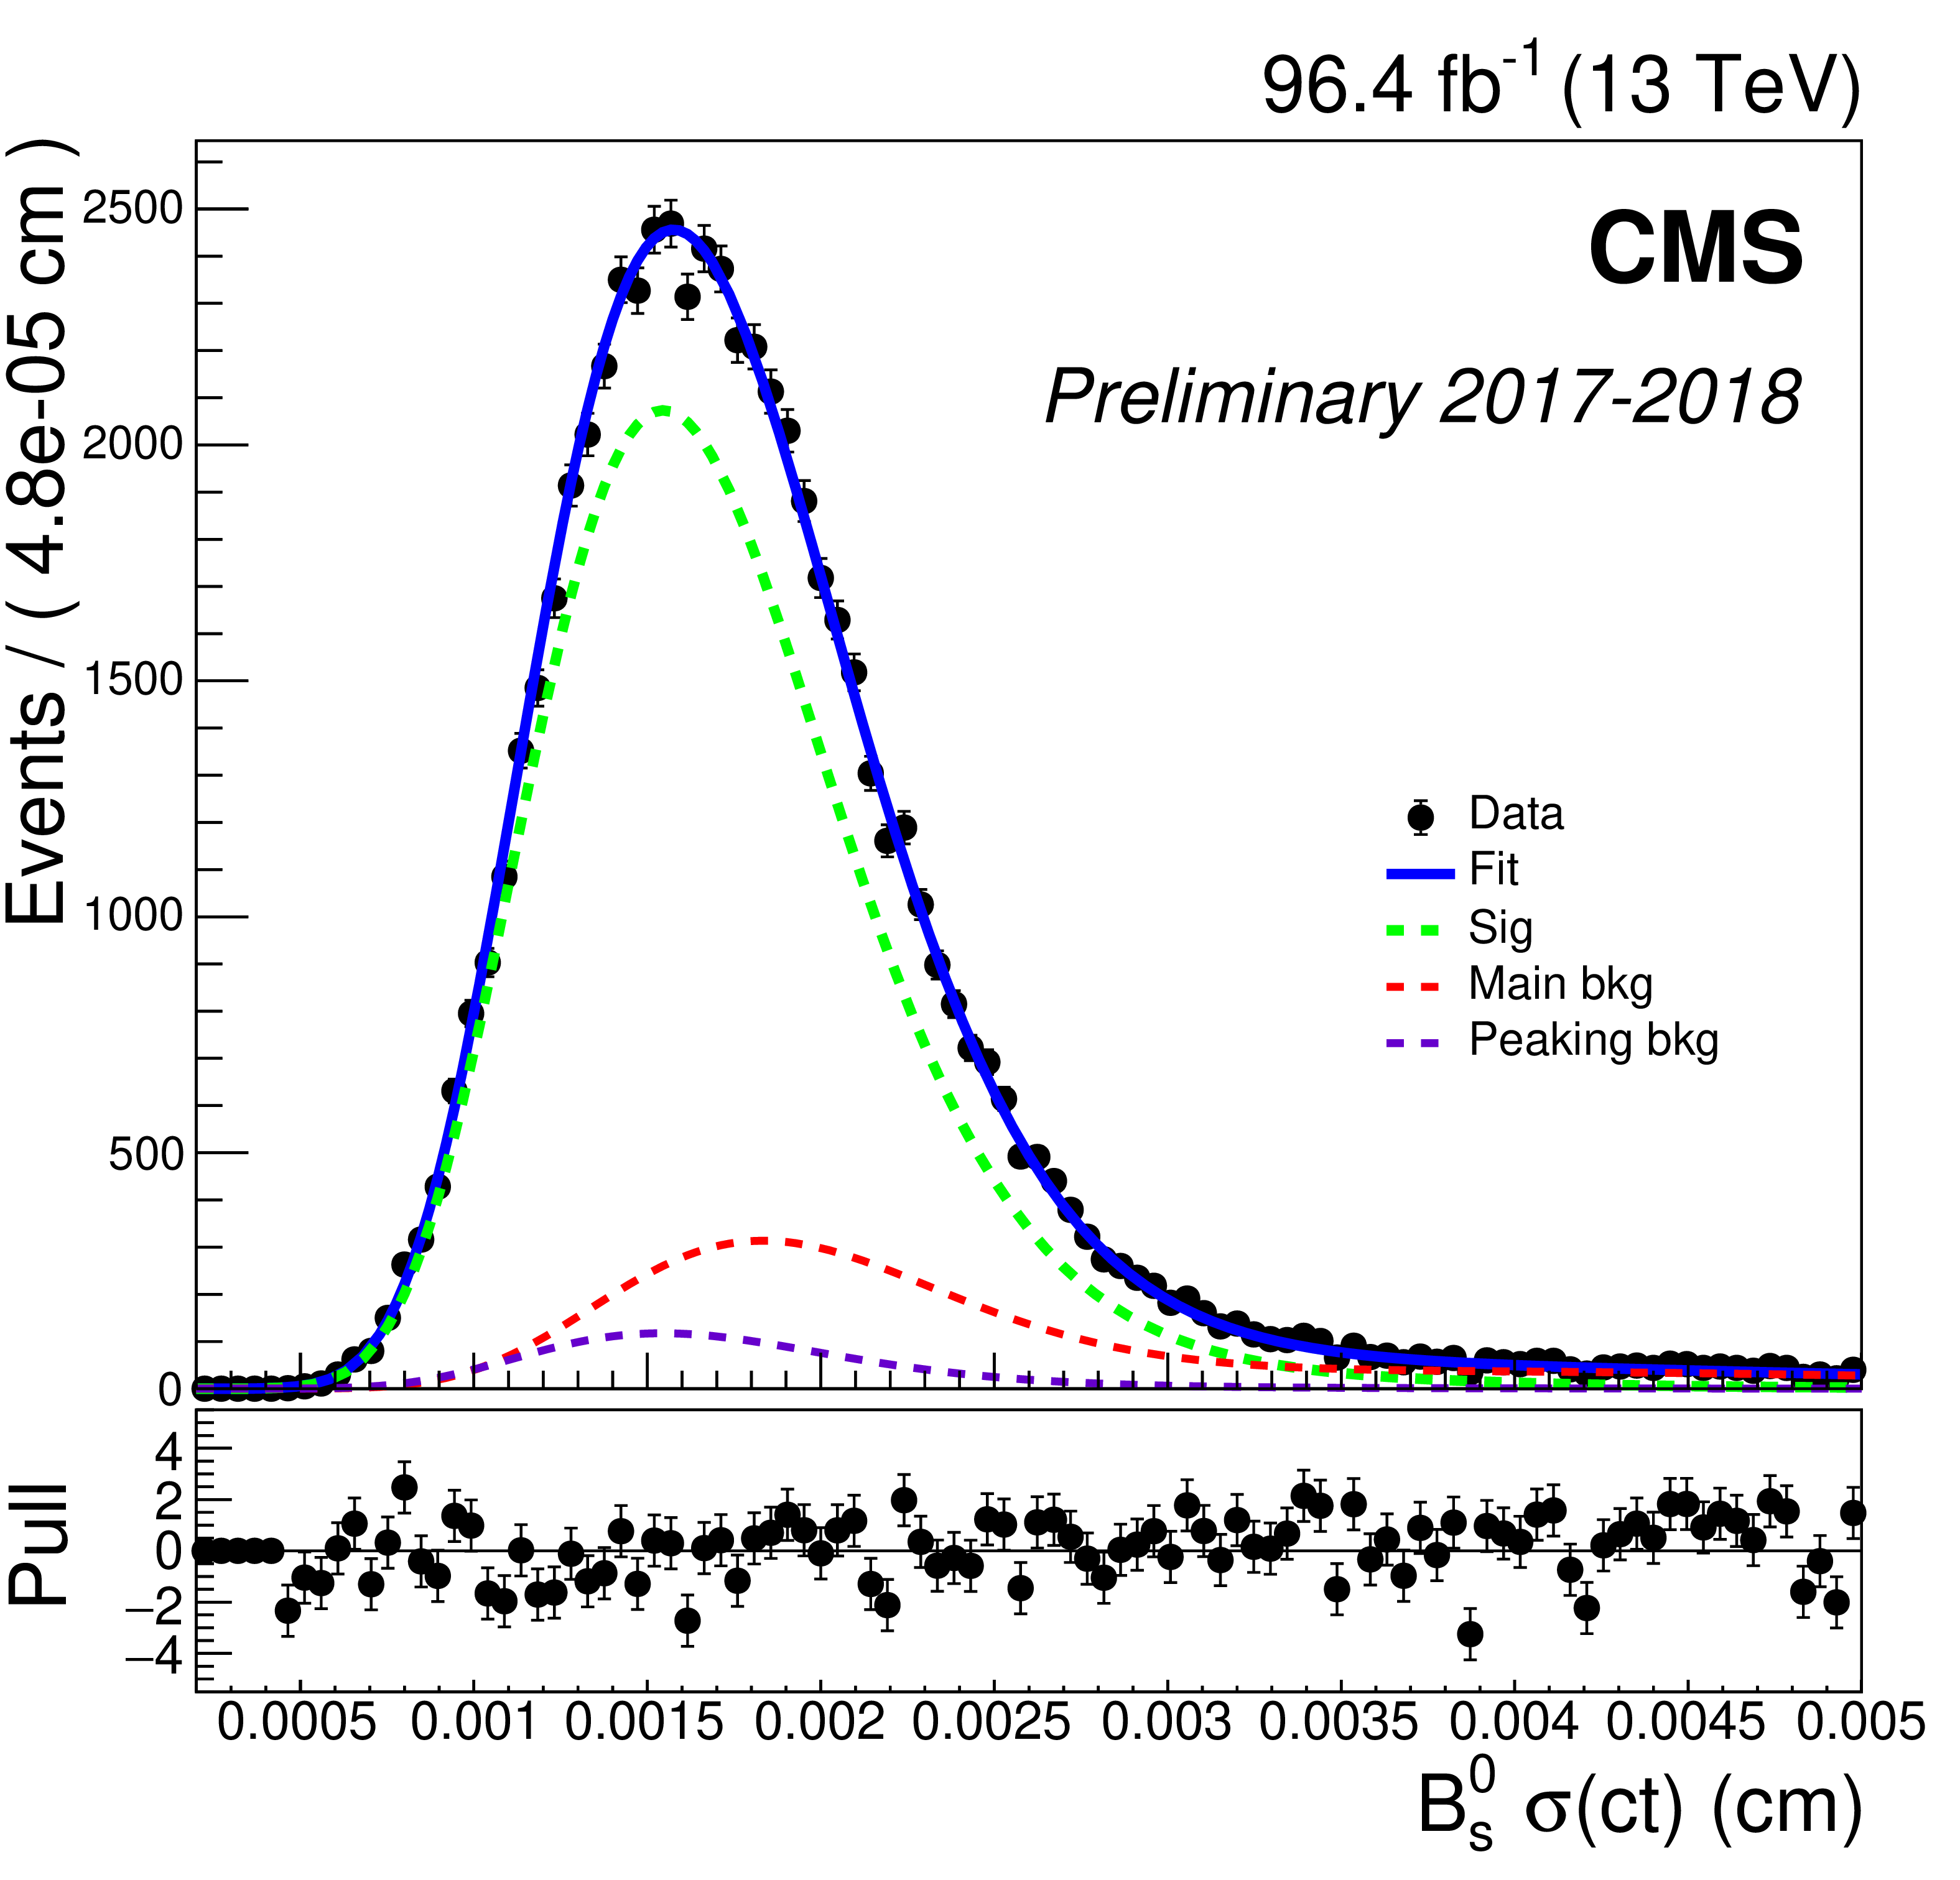
Figure 3:
The ${ct}$ distribution (left) and its uncertainty (right) of the ${\mathrm{B_s} \to \mathrm{J}/\psi \,\phi(1020)\to {\mu^{+} \mu^{-}} {\mathrm{K^{+}} \mathrm{K^{-}}}}$ candidates in data. The solid line represents a fit to data (solid markers), the dashed green line corresponds to the signal, while the dashed red (magenta) line corresponds to the combinatorial (peaking) background, as obtained by the fit. The distribution of the pulls between the data and the fit for each bin is displayed in the bottom panel. |
png pdf |
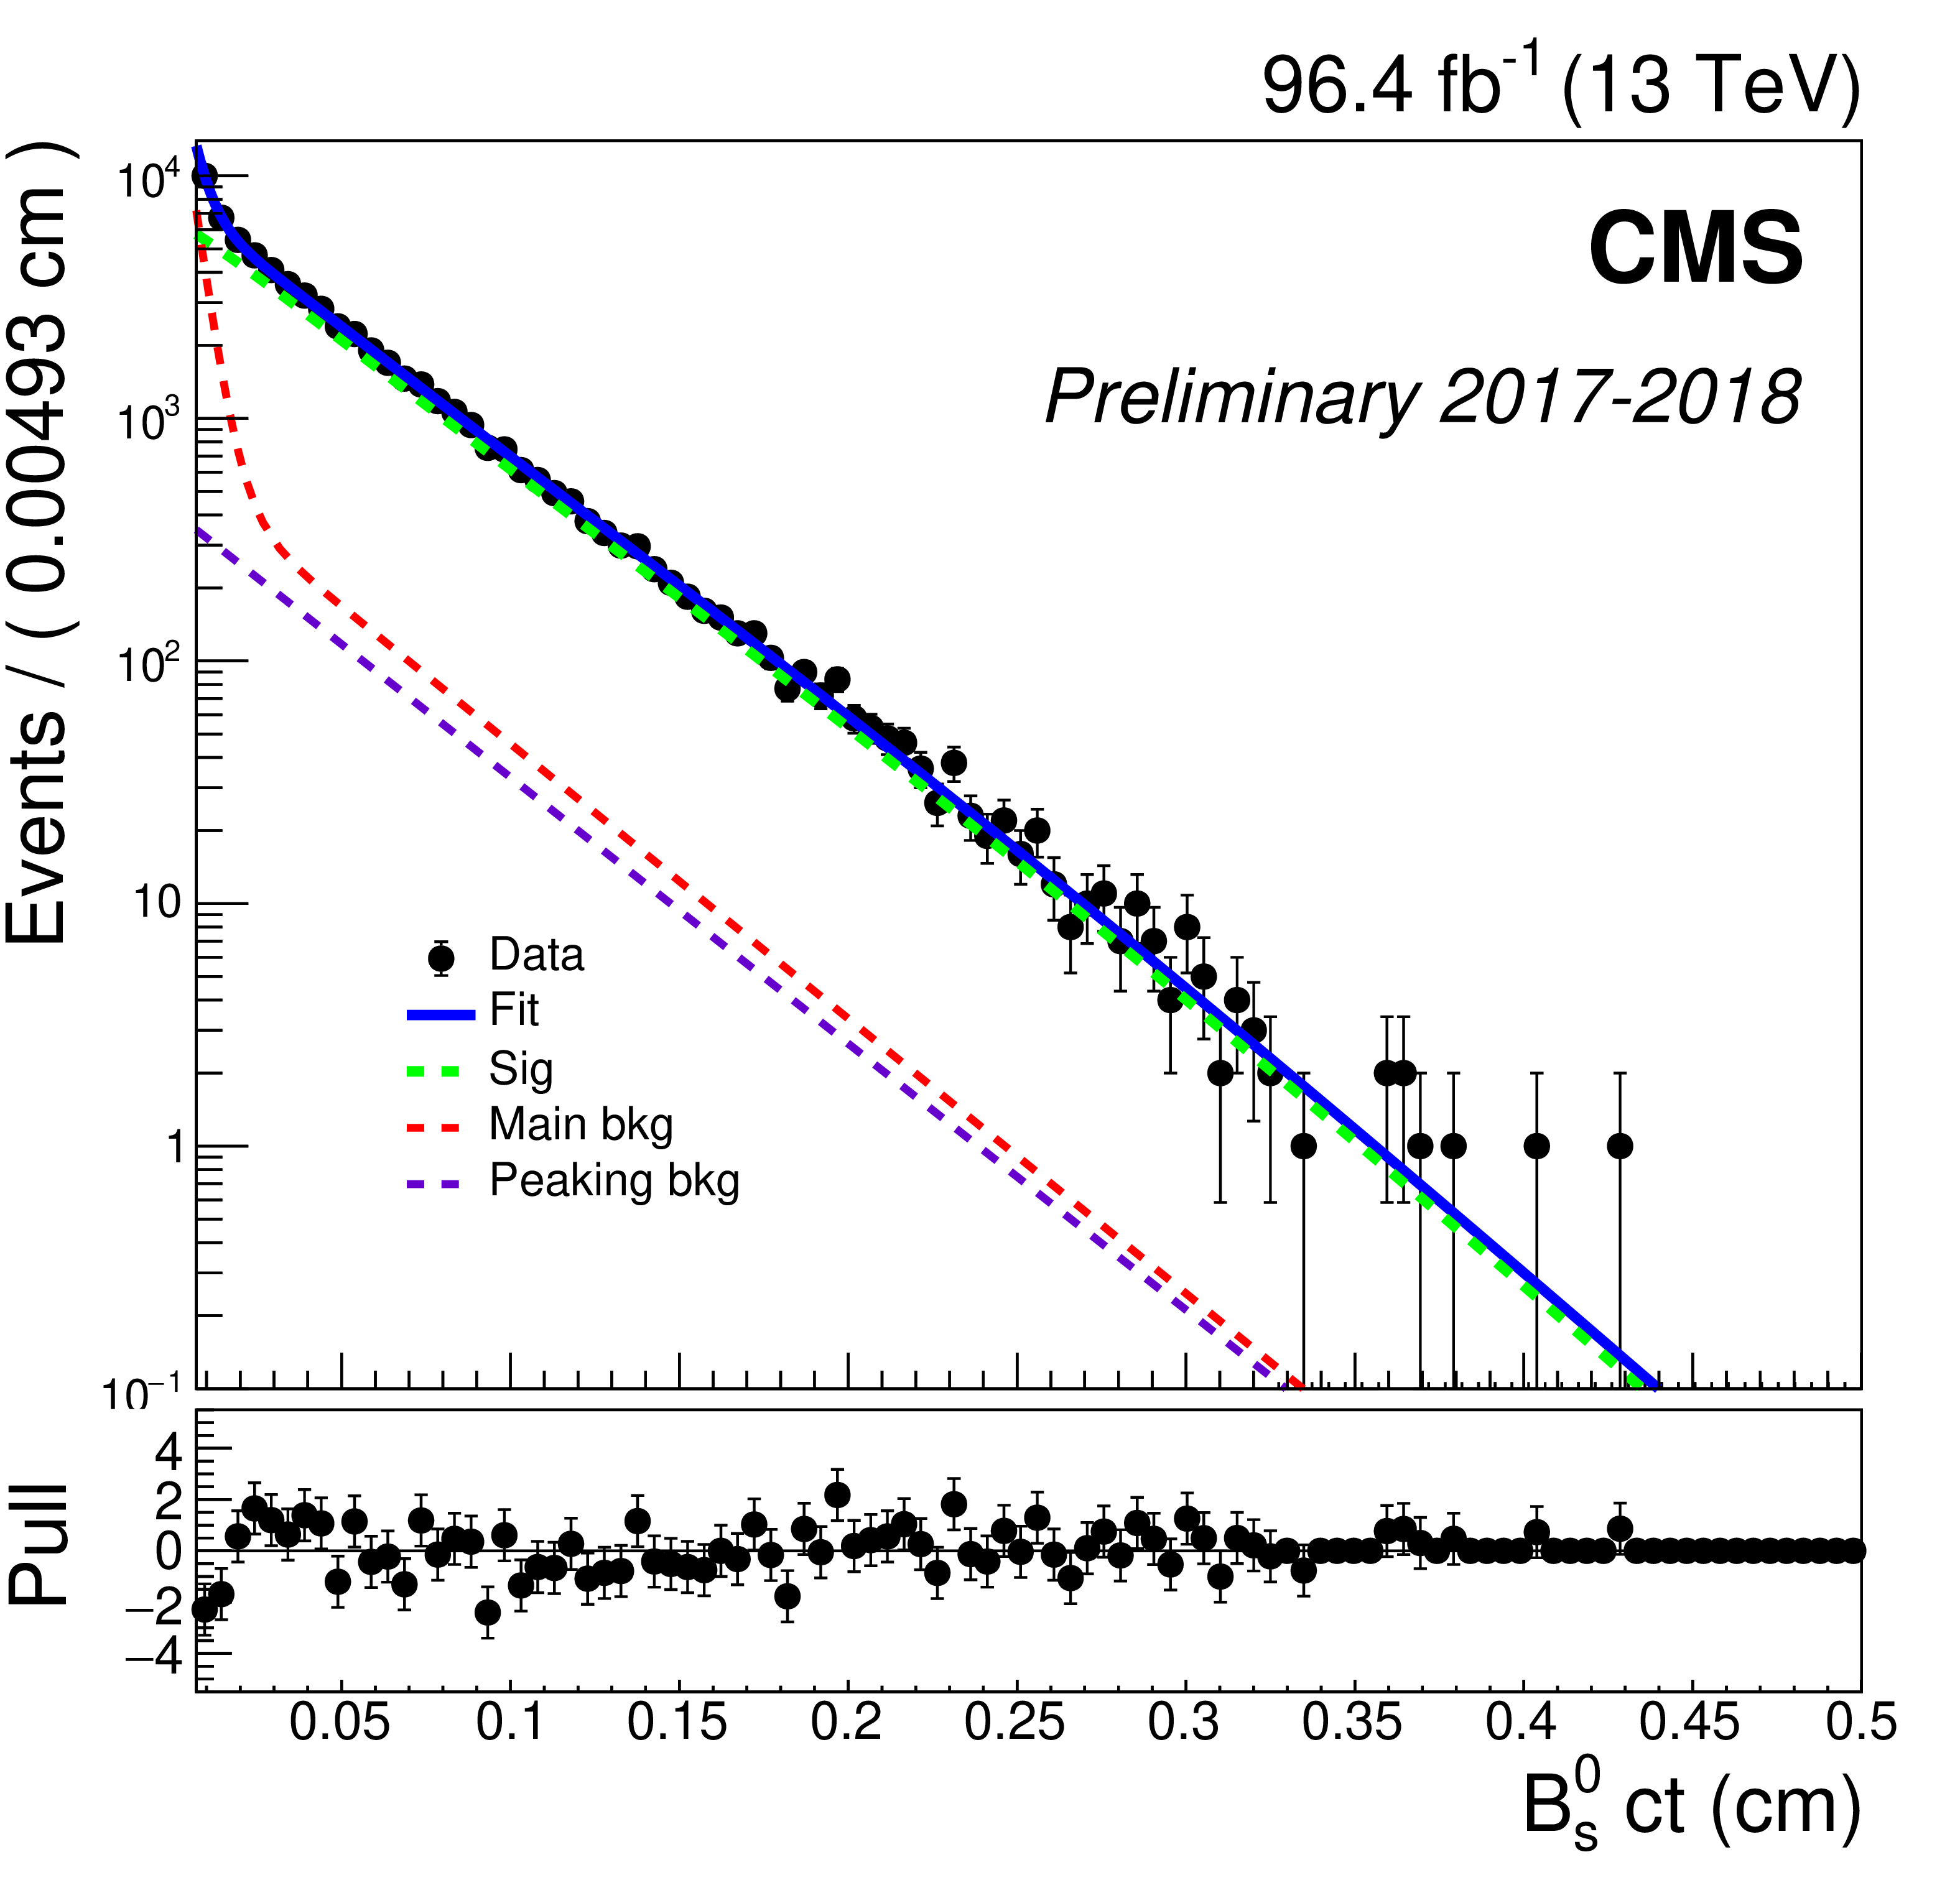
Figure 3-a:
The ${ct}$ distribution (left) and its uncertainty (right) of the ${\mathrm{B_s} \to \mathrm{J}/\psi \,\phi(1020)\to {\mu^{+} \mu^{-}} {\mathrm{K^{+}} \mathrm{K^{-}}}}$ candidates in data. The solid line represents a fit to data (solid markers), the dashed green line corresponds to the signal, while the dashed red (magenta) line corresponds to the combinatorial (peaking) background, as obtained by the fit. The distribution of the pulls between the data and the fit for each bin is displayed in the bottom panel. |
png pdf |
Figure 3-b:
The ${ct}$ distribution (left) and its uncertainty (right) of the ${\mathrm{B_s} \to \mathrm{J}/\psi \,\phi(1020)\to {\mu^{+} \mu^{-}} {\mathrm{K^{+}} \mathrm{K^{-}}}}$ candidates in data. The solid line represents a fit to data (solid markers), the dashed green line corresponds to the signal, while the dashed red (magenta) line corresponds to the combinatorial (peaking) background, as obtained by the fit. The distribution of the pulls between the data and the fit for each bin is displayed in the bottom panel. |
png pdf |
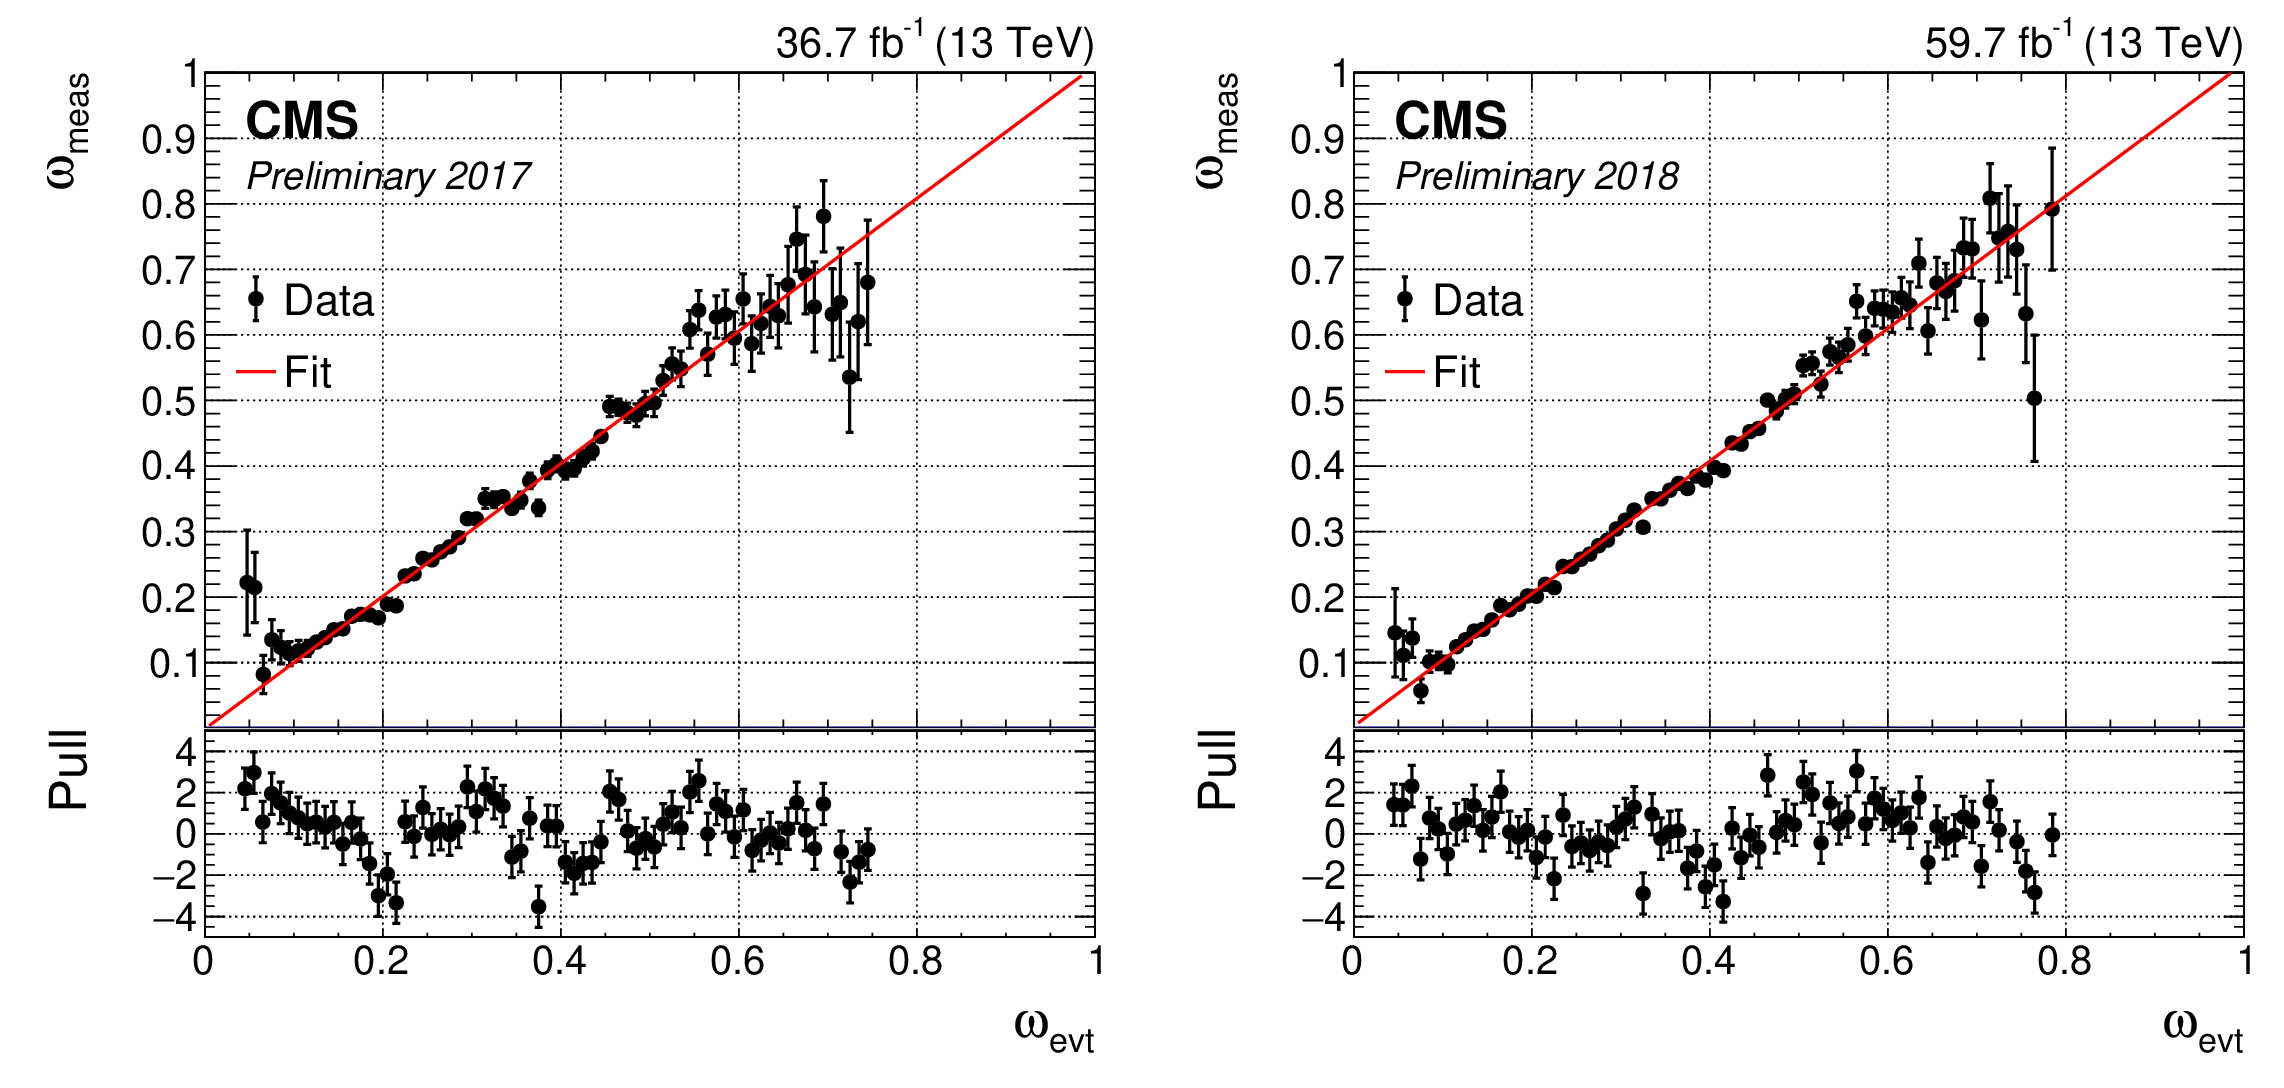
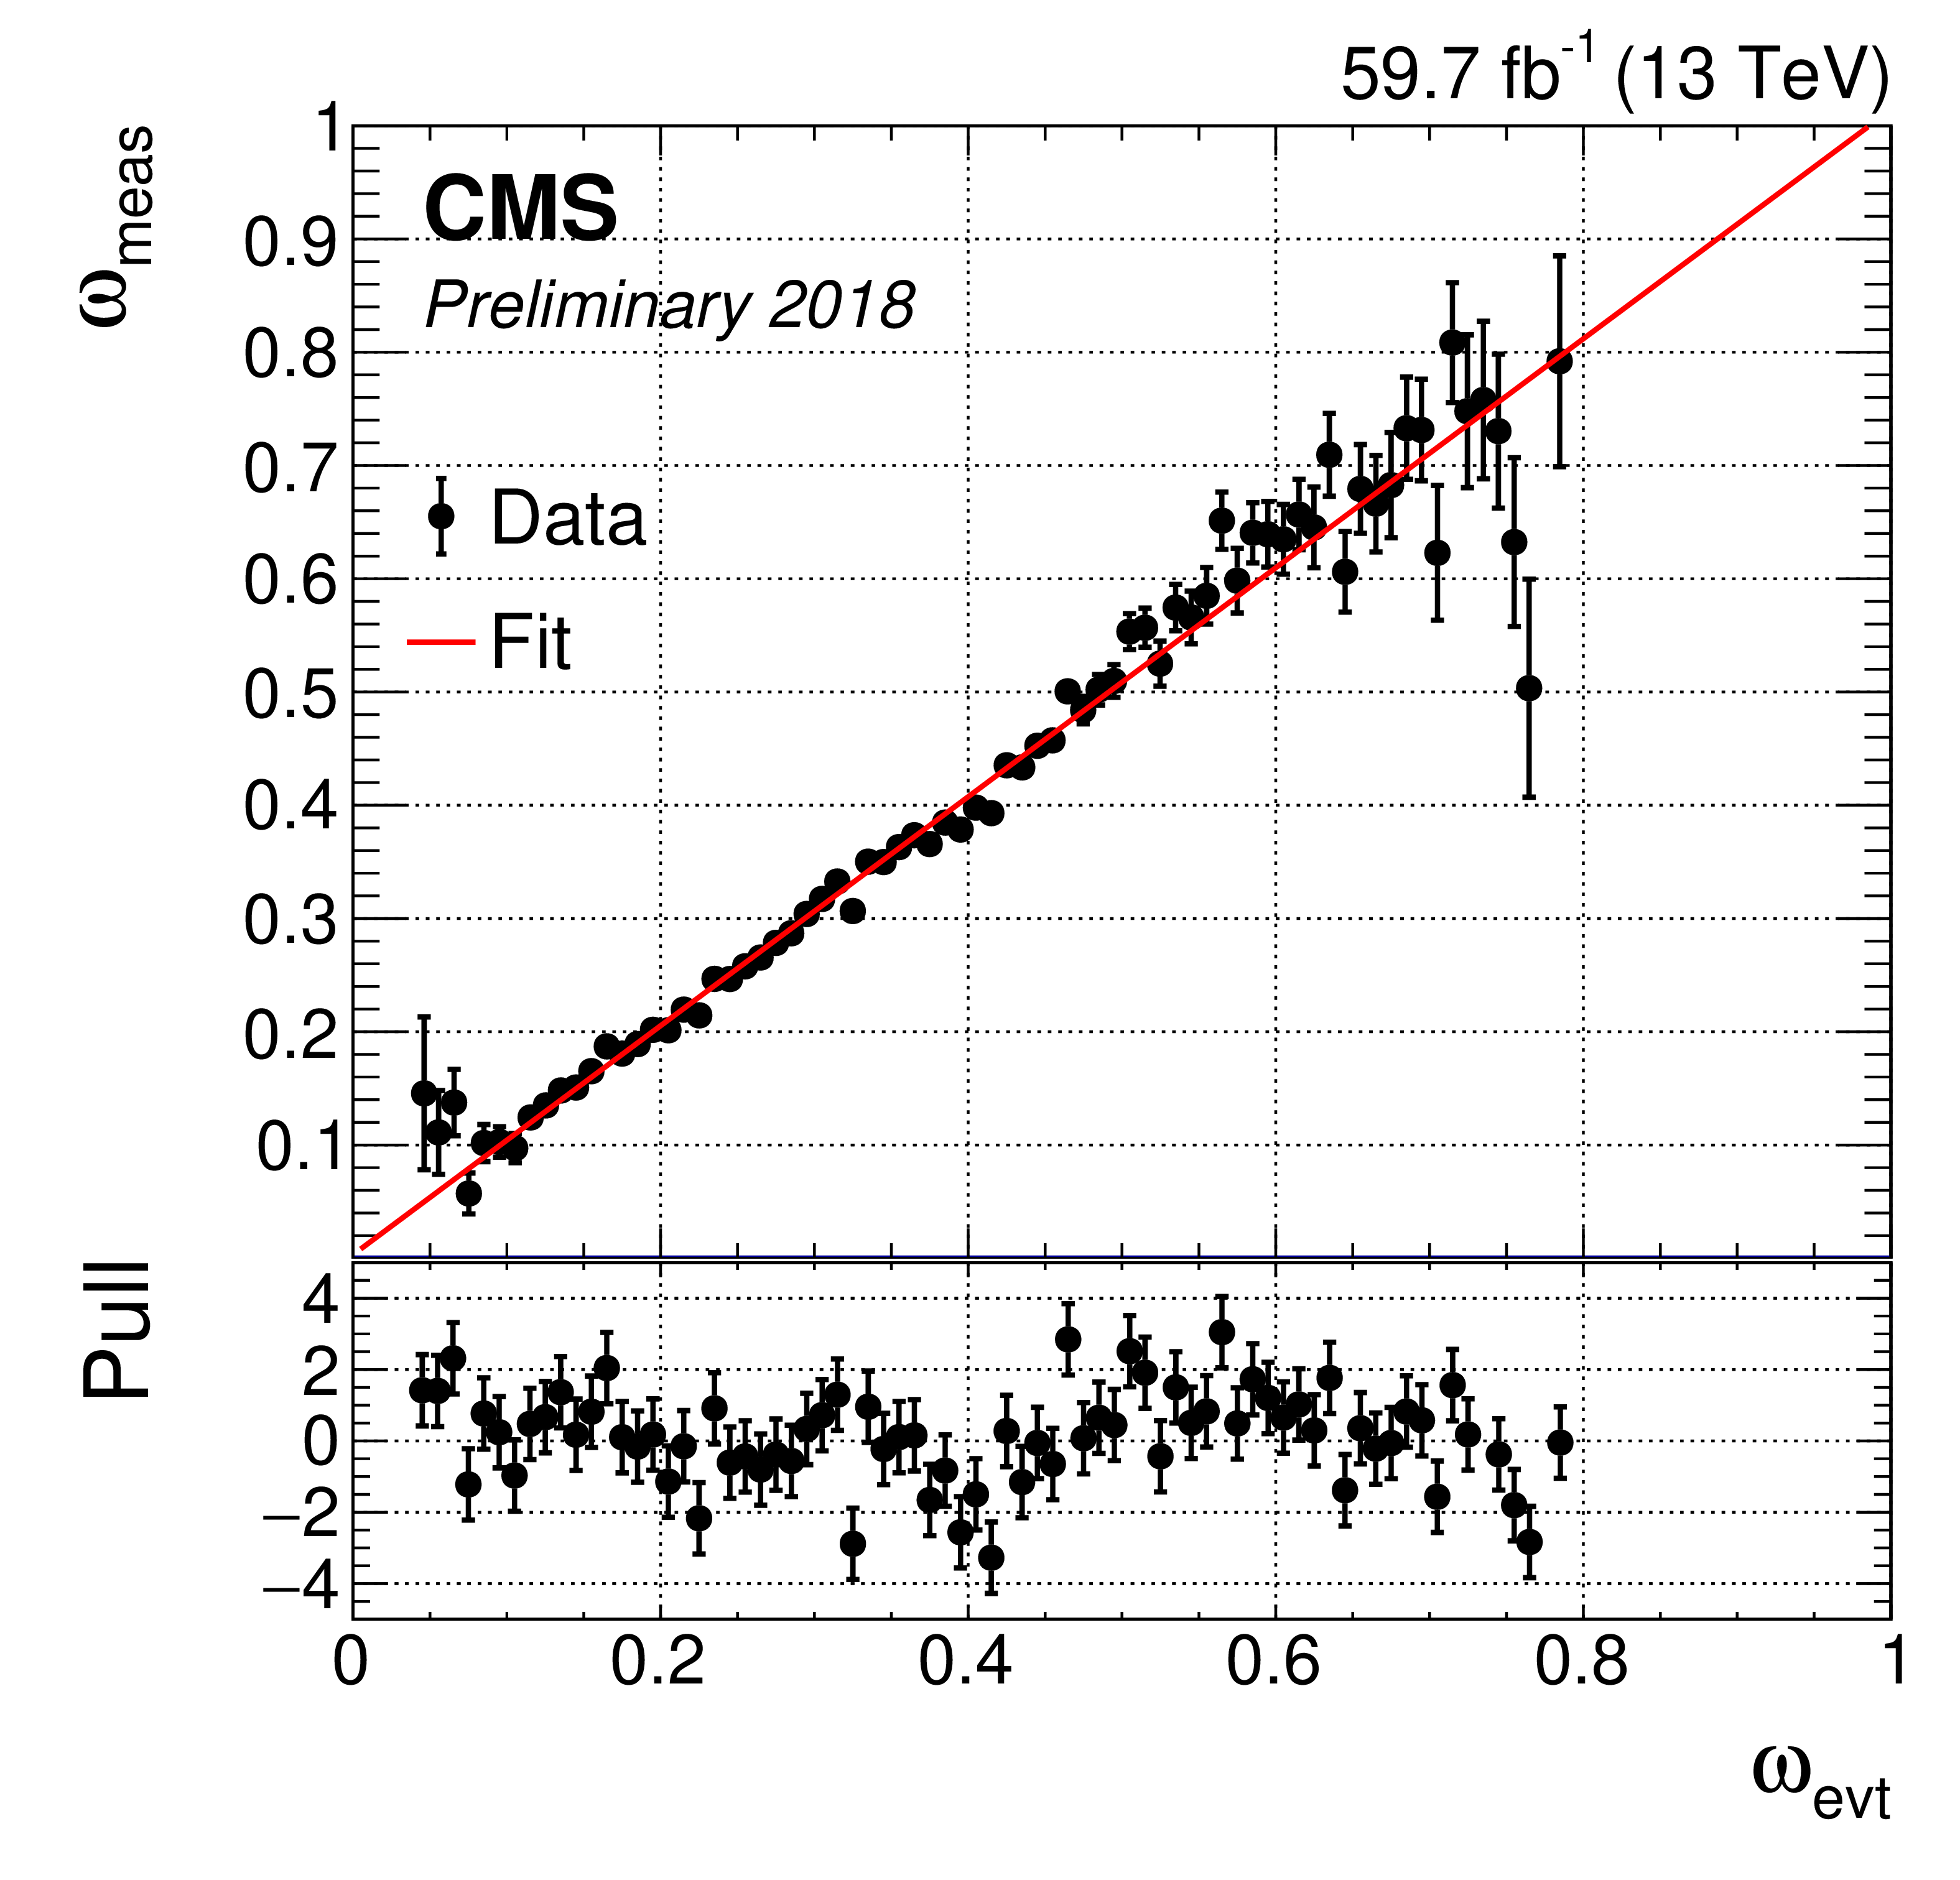
Figure 4:
Results of the calibration of the per-event mistag rate ${\omega _{\text {evt}}}$ performed using ${\mathrm{B^{\pm}} \to \mathrm{J}/\psi \,\mathrm{K^{\pm}}}$ decays in data collected in 2017 (left) and in 2018 (right). The solid line shows a linear fit to data (solid markers). The distributions of the pulls between the data and the fitted function in each bin are displayed in the lower panels. |

png pdf |
Figure 4-a:
Results of the calibration of the per-event mistag rate ${\omega _{\text {evt}}}$ performed using ${\mathrm{B^{\pm}} \to \mathrm{J}/\psi \,\mathrm{K^{\pm}}}$ decays in data collected in 2017 (left) and in 2018 (right). The solid line shows a linear fit to data (solid markers). The distributions of the pulls between the data and the fitted function in each bin are displayed in the lower panels. |
png pdf |
Figure 4-b:
Results of the calibration of the per-event mistag rate ${\omega _{\text {evt}}}$ performed using ${\mathrm{B^{\pm}} \to \mathrm{J}/\psi \,\mathrm{K^{\pm}}}$ decays in data collected in 2017 (left) and in 2018 (right). The solid line shows a linear fit to data (solid markers). The distributions of the pulls between the data and the fitted function in each bin are displayed in the lower panels. |

png pdf |
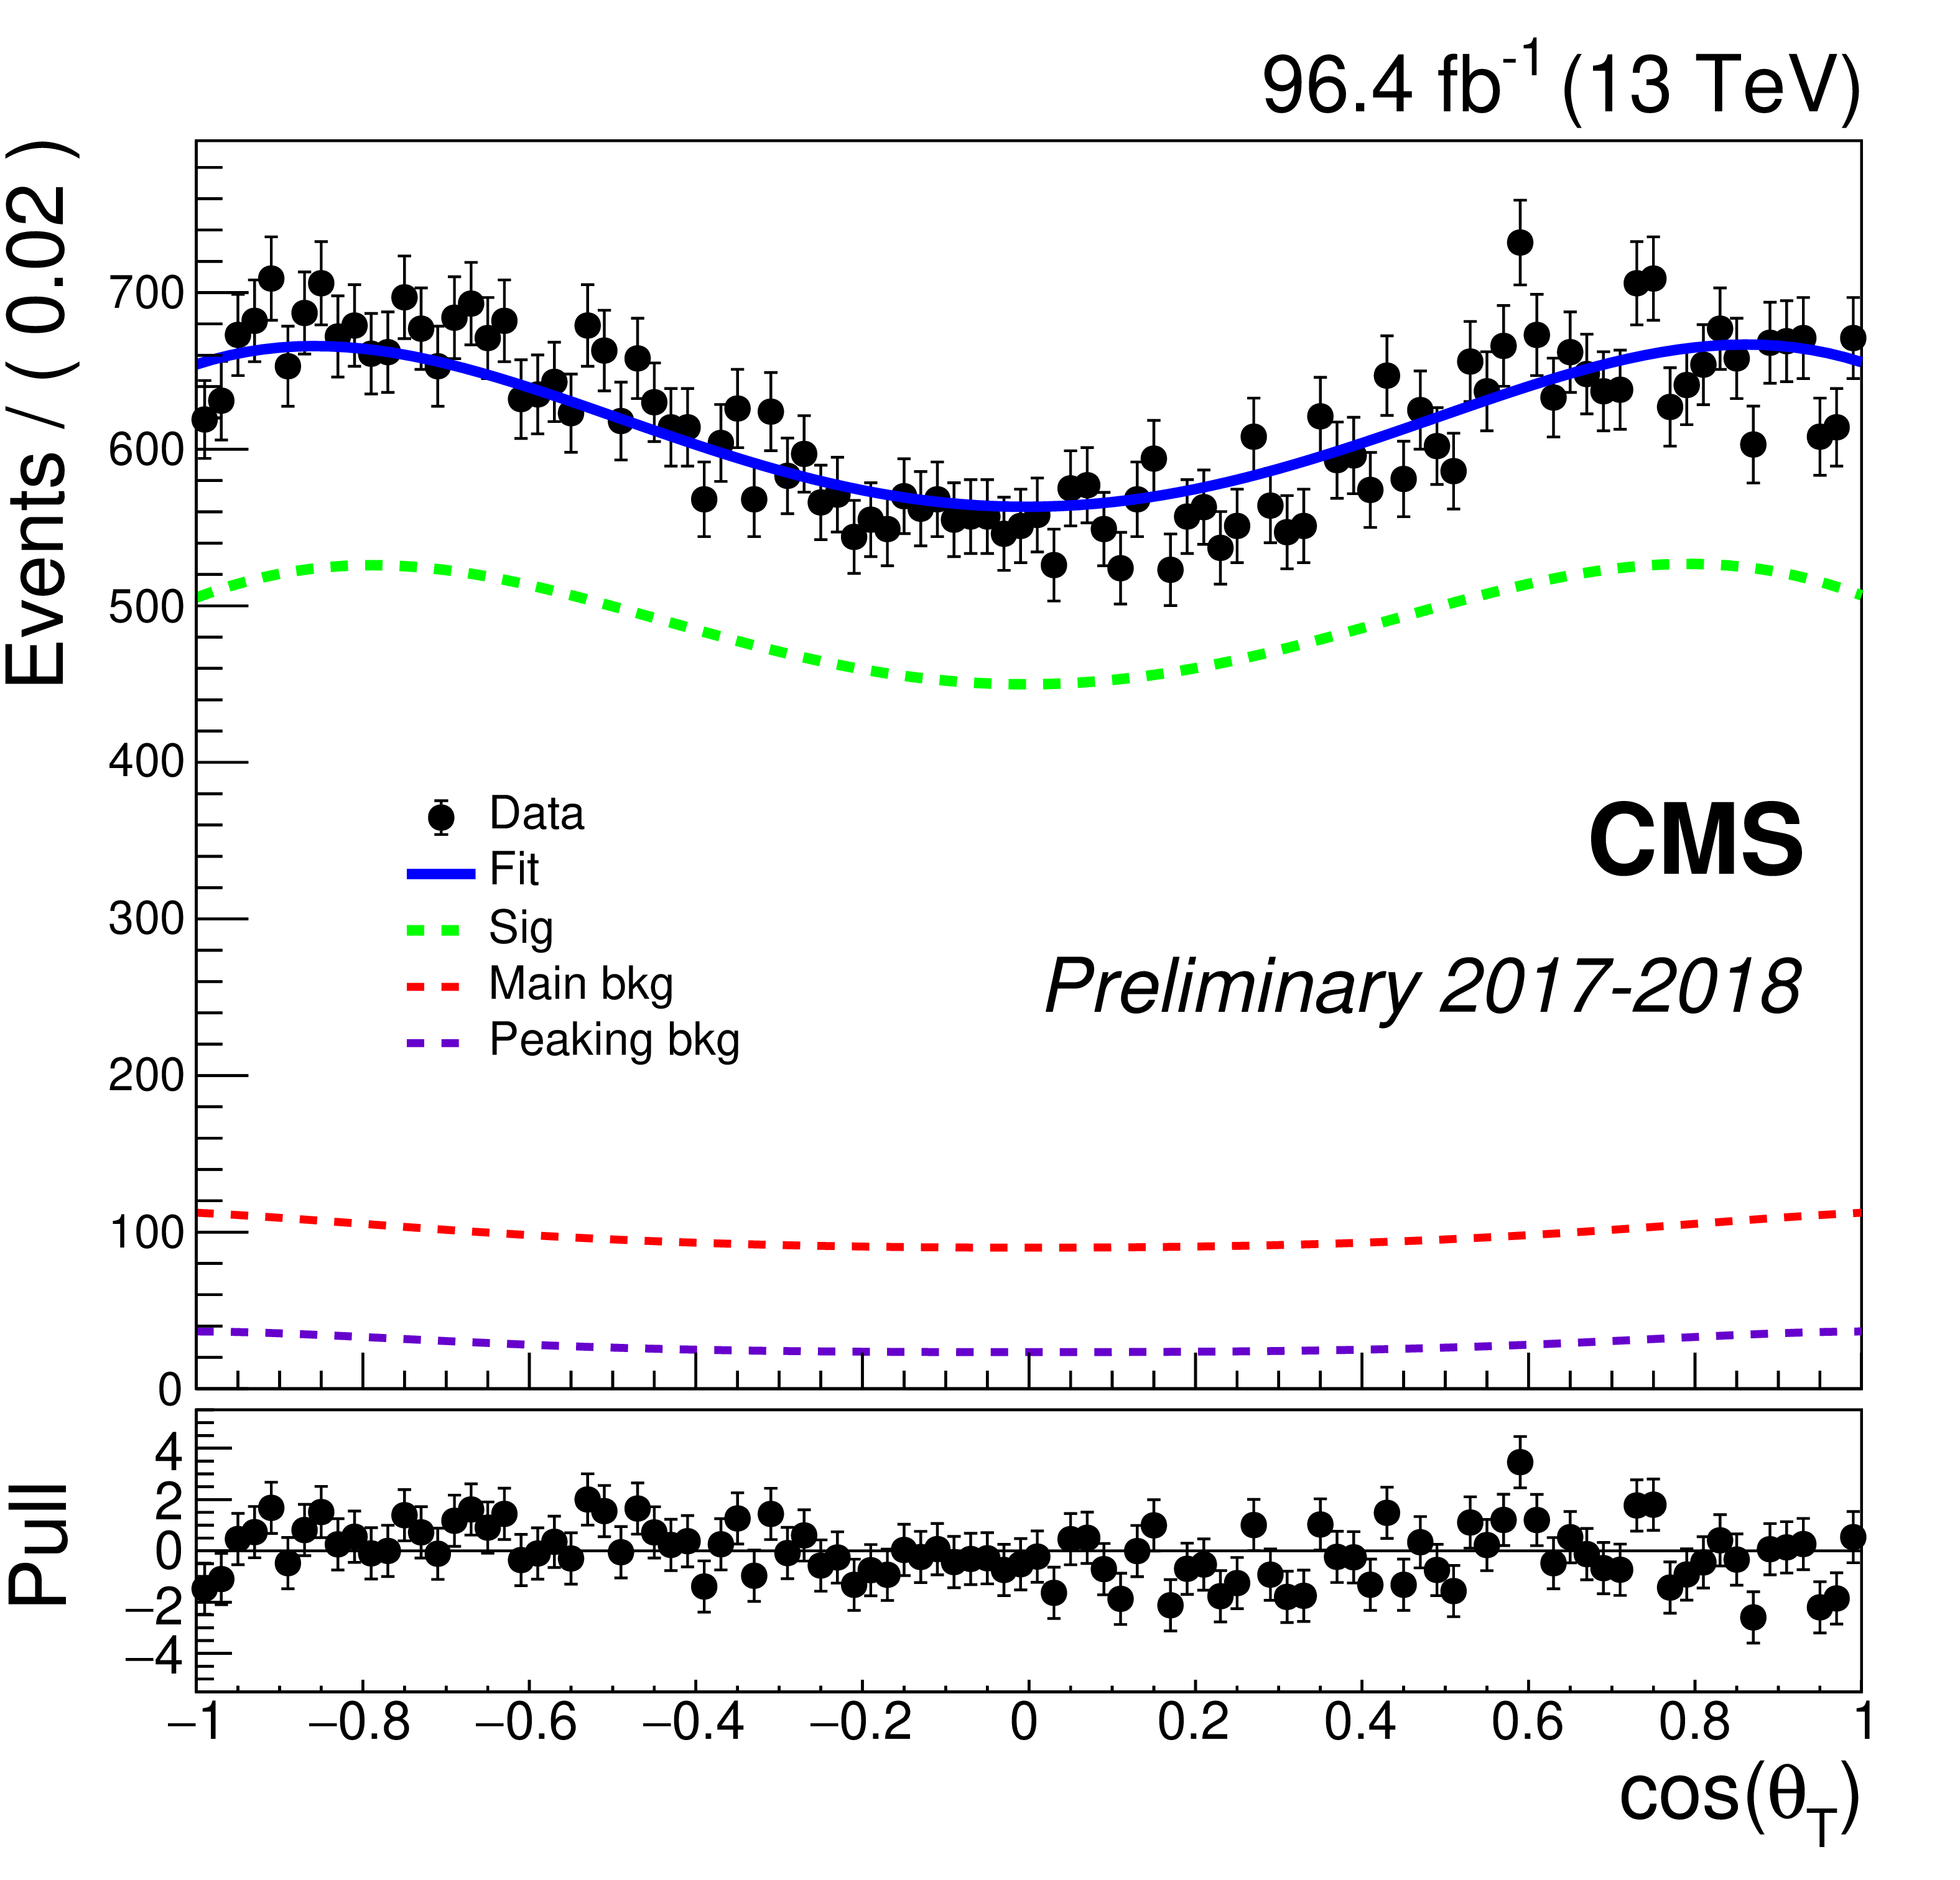
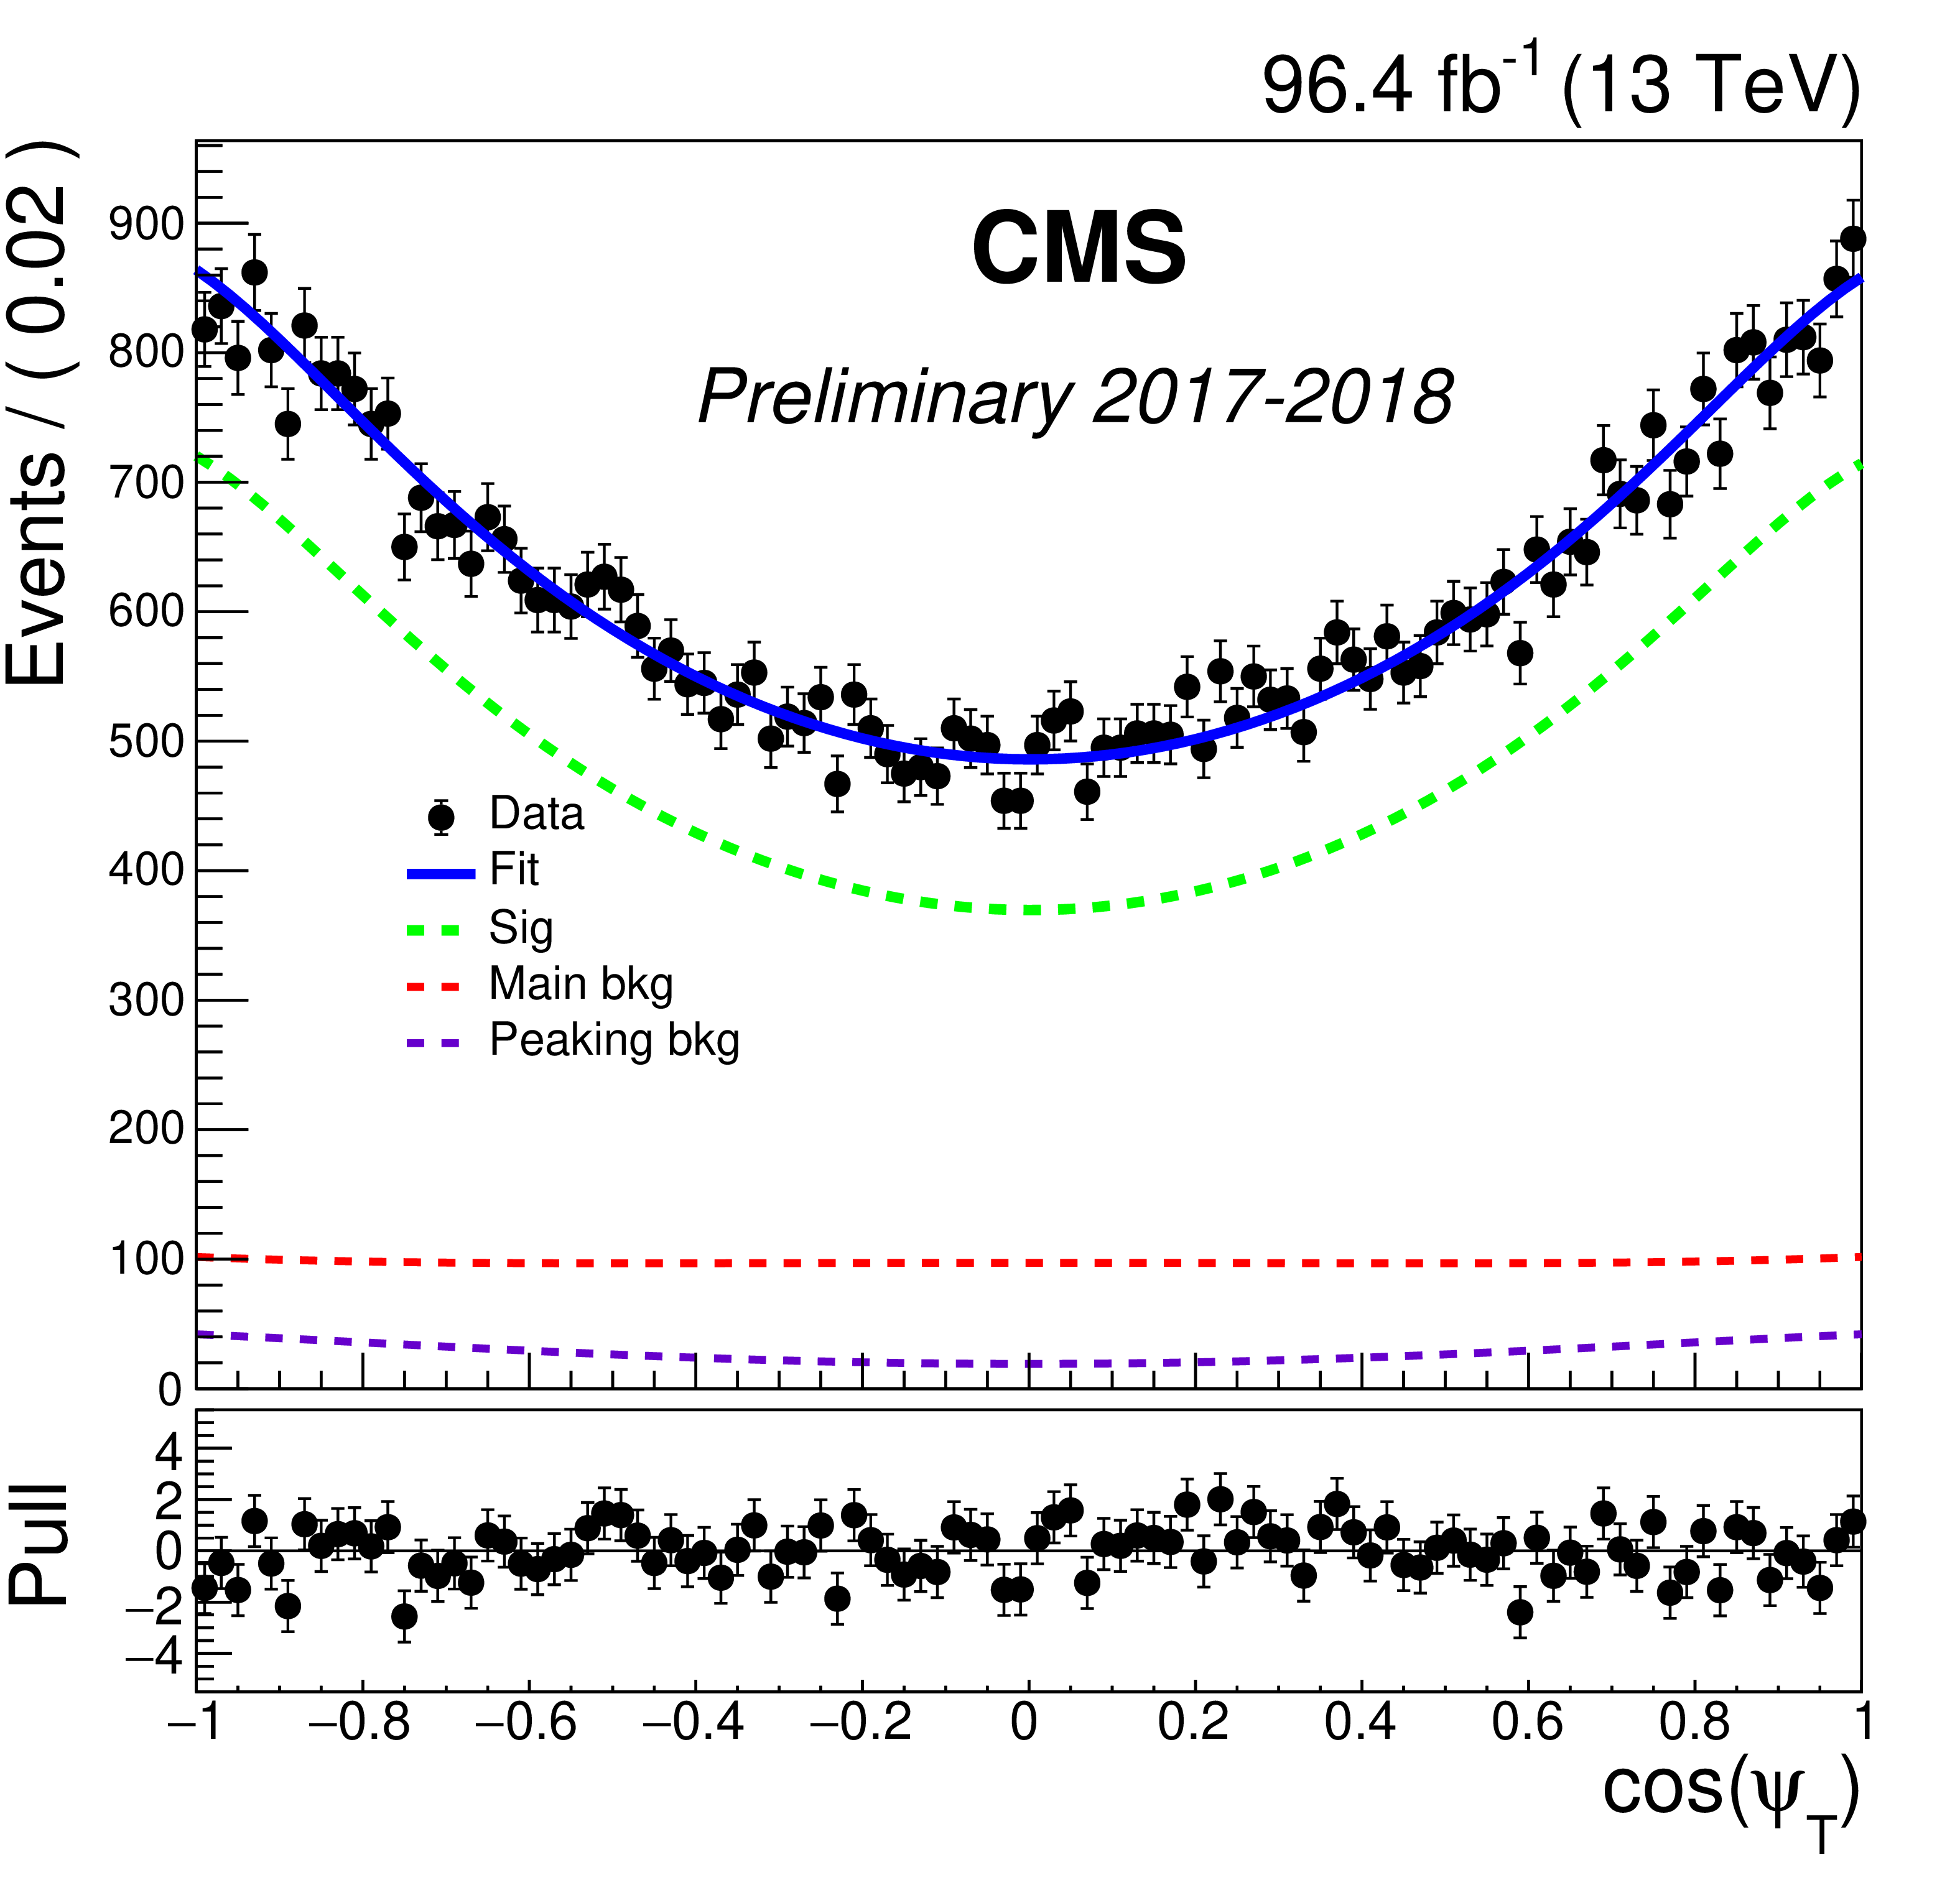
Figure 5:
The angular distributions $\cos {\theta _\text {T}}$ (left), $\cos {\psi _\text {T}} $ (middle), and $ {\varphi _\text {T}} $ (right) of the $\mathrm{B_s}$ candidates. The solid line represents the fit to data (solid markers), the dashed green line corresponds to signal, while the dashed red (magenta) line shows the combinatorial (peaking) background. The pull distributions between the data and the fit function in each bin are shown in the lower panels. |
png pdf |
Figure 5-a:
The angular distributions $\cos {\theta _\text {T}}$ (left), $\cos {\psi _\text {T}} $ (middle), and $ {\varphi _\text {T}} $ (right) of the $\mathrm{B_s}$ candidates. The solid line represents the fit to data (solid markers), the dashed green line corresponds to signal, while the dashed red (magenta) line shows the combinatorial (peaking) background. The pull distributions between the data and the fit function in each bin are shown in the lower panels. |
png pdf |
Figure 5-b:
The angular distributions $\cos {\theta _\text {T}}$ (left), $\cos {\psi _\text {T}} $ (middle), and $ {\varphi _\text {T}} $ (right) of the $\mathrm{B_s}$ candidates. The solid line represents the fit to data (solid markers), the dashed green line corresponds to signal, while the dashed red (magenta) line shows the combinatorial (peaking) background. The pull distributions between the data and the fit function in each bin are shown in the lower panels. |

png pdf |
Figure 5-c:
The angular distributions $\cos {\theta _\text {T}}$ (left), $\cos {\psi _\text {T}} $ (middle), and $ {\varphi _\text {T}} $ (right) of the $\mathrm{B_s}$ candidates. The solid line represents the fit to data (solid markers), the dashed green line corresponds to signal, while the dashed red (magenta) line shows the combinatorial (peaking) background. The pull distributions between the data and the fit function in each bin are shown in the lower panels. |

png pdf |
Figure 6:
The two-dimensional likelihood contours at 68% CL in the $ {\phi _{\text {s}}} $-$ {\Delta \Gamma _{\text {s}}} $ plane, for the CMS 8 TeV (dashed green line), 13 TeV (dashed blue line), and the combined (solid red line) results. The SM prediction is shown as the black rectangle. |
| Tables | |
png pdf |
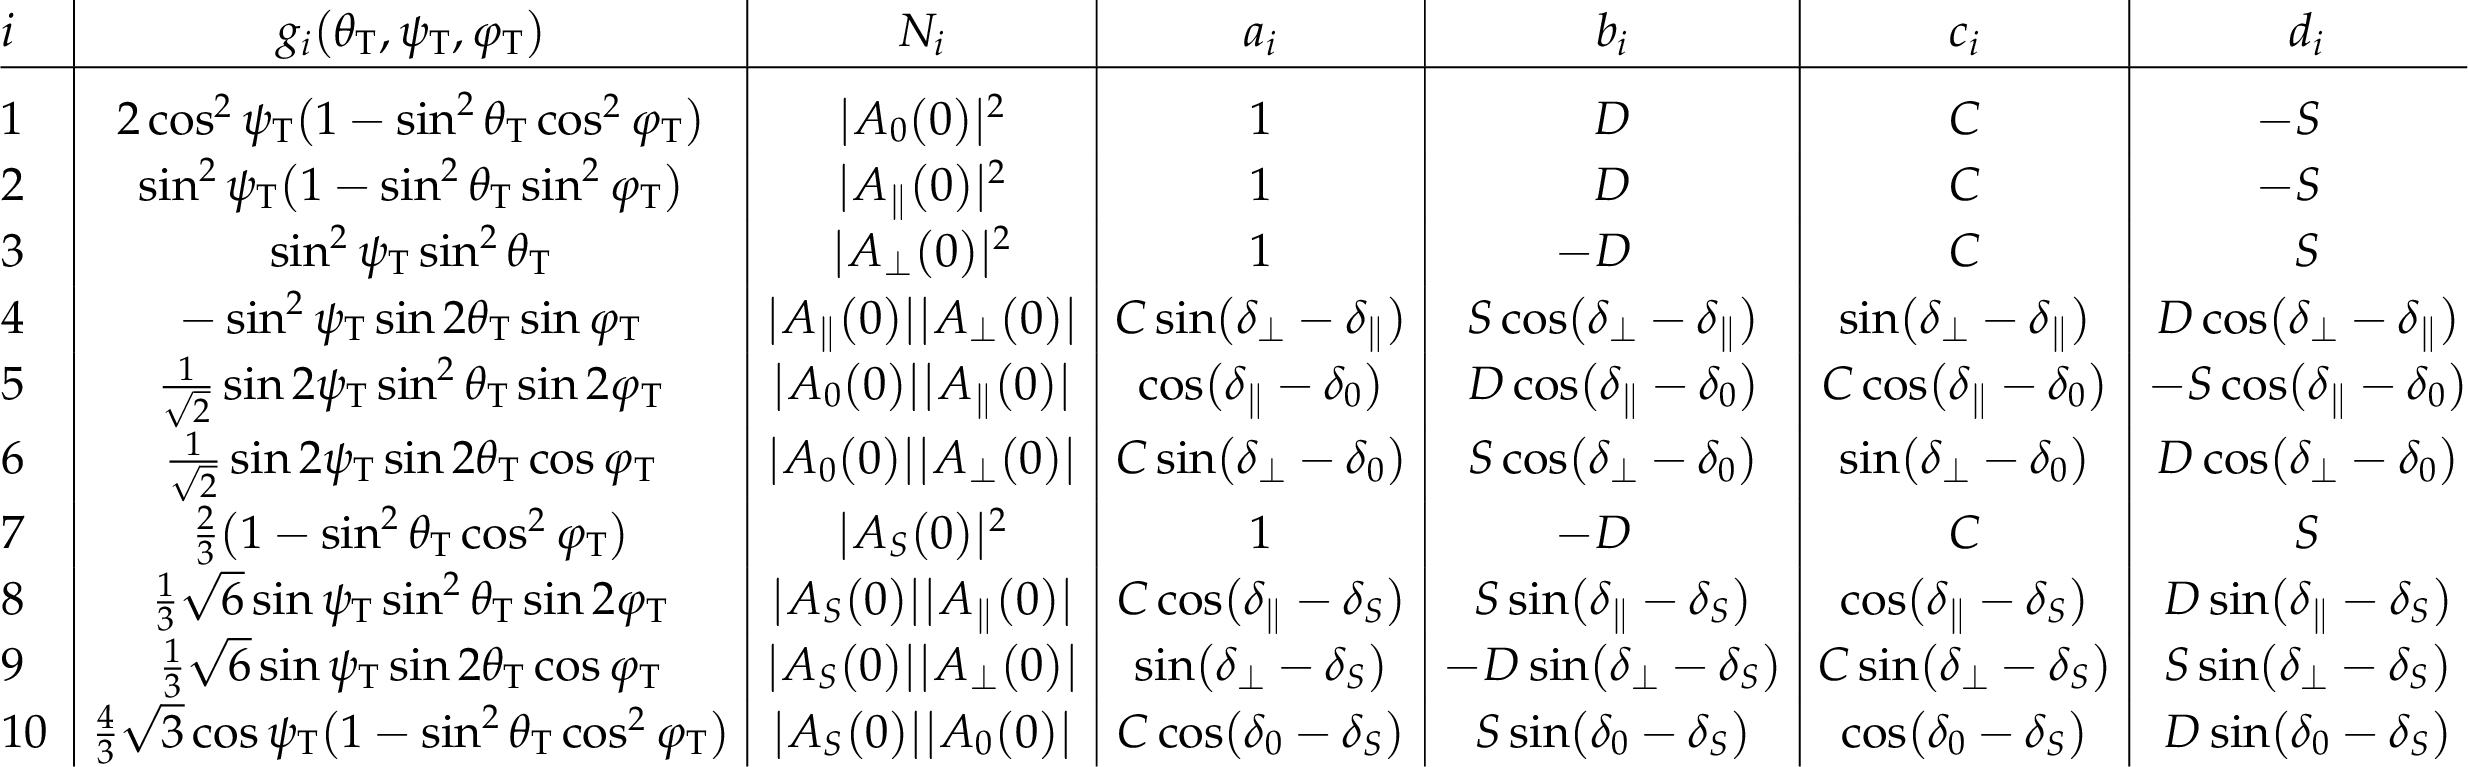
Table 1:
Angular and time-dependent terms of the signal model. |
png pdf |
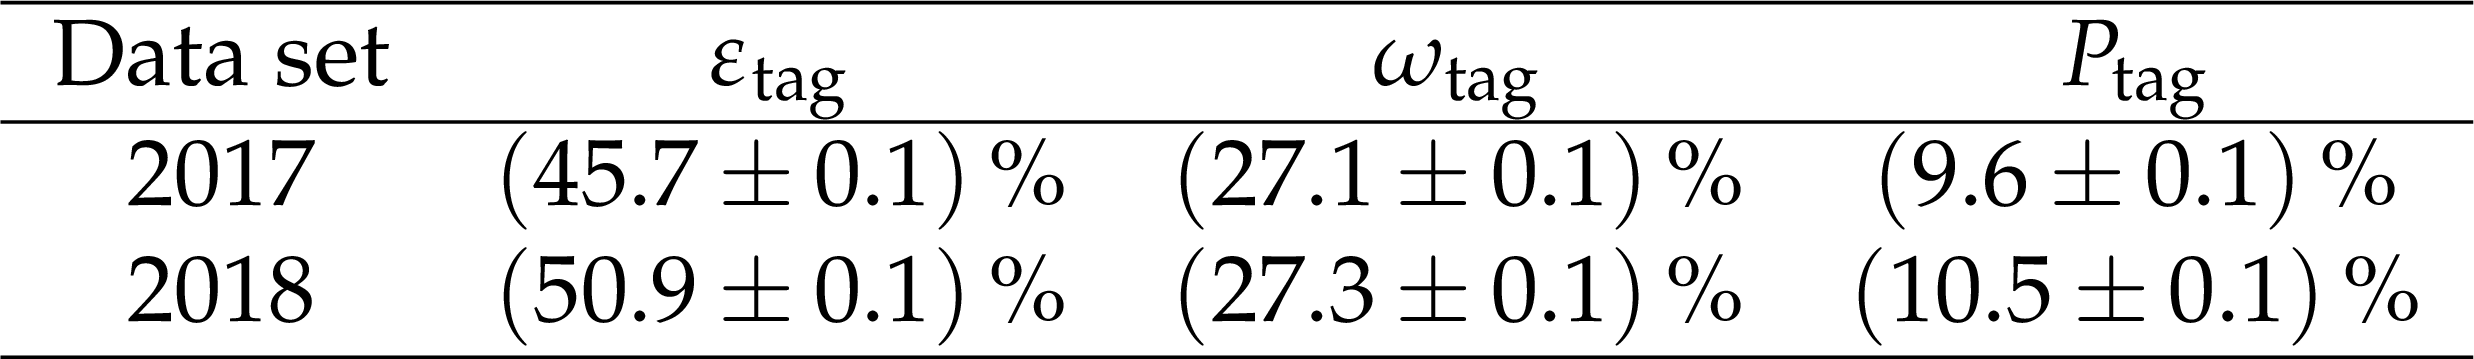
Table 2:
Calibrated OS muon tagger performance evaluated using ${\mathrm{B^{\pm}} \to \mathrm{J}/\psi \,\mathrm{K^{\pm}}}$ events in 2017 and 2018 data sets. |

png pdf |
Table 3:
Results of the fit to data with the statistical uncertainties coming from the fit. The description of the systematic uncertainties is detailed below and summarized in Table 4. |
| Summary |
|
The weak phase ${\phi_{\text{s}}} $ and the decay width difference $\Delta\Gamma_{\text{s}}$ between the light and heavy $\mathrm{B_s}$ meson mass eigenstates are measured using a total of 48 500 $ {\mathrm{B_s} \to\mathrm{J}/\psi\,\phi{1020} \to \mu\mu{\mathrm{K^{+}}\mathrm{K^{-}}} } $ candidates, collected by the CMS experiment at the LHC in proton-proton collisions at a center-of-mass energy of $\sqrt{s} = $ 13 TeV, corresponding to an integrated luminosity of {96.4 fb$^{-1}$} . Events are selected using a trigger that requires an additional muon, which is exploited to infer the flavor of the $\mathrm{B_s}$ meson at production time. A novel opposite-side muon tagger based on deep neural networks has been developed to maximize the sensitivity of the present analysis, and allowed to achieve an unprecedented tagging power of $\approx$10%, aided by the requirement of the additional muon in the signal sample. The weak phase is measured to be ${\phi_{\text{s}}} = $ $-$0.011 $\pm$ 0.050 (stat) $\pm$ 0.010 (syst) rad, consistent both with the SM prediction, and with the absence of CP violation in the mixing-decay interference. The decay width difference between the $\mathrm{B_s}$ mass eigenstates is measured to be $\Delta\Gamma_{\text{s}}= $ 0.114 $\pm$ 0.014 (stat) $\pm$ 0.007 (syst) ps$^{-1}$, consistent with the theoretical predictions. In addition, the CP violating parameter $|{\lambda}|$, and the average lifetime of the heavy and light $\mathrm{B_s}$ mass eigenstates, as well as their mass difference have been measured. All measurements are dominated by the statistical uncertainties. The results presented in this note are further combined with those obtained by CMS at $\sqrt{s} = $ 8 TeV [19], yielding ${\phi_{\text{s}}} = $ $-$0.021 $\pm$ 0.045 rad and $\Delta\Gamma_{\text{s}}= $ 0.1074 $\pm$ 0.0097 ps$^{-1}$. These results are significantly more precise than those from the previous CMS measurement, and allow to further constrain possible contributions from new physics in the $\mathrm{B_s}$ meson decay and mixing. |
| References | ||||
| 1 | J. Charles et al. | Predictions of selected flavour observables within the Standard Model | PRD 84 (2011) 033005 | 1106.4041 |
| 2 | C.-W. Chiang et al. | New physics in $ B_s^0 \to J/\psi \phi $: a general analysis | JHEP 04 (2010) 031 | |
| 3 | A. Lenz and U. Nierste | Numerical Updates of Lifetimes and Mixing Parameters of B Mesons | 1102.4274 | |
| 4 | D0 Collaboration | Measurement of $ \mathrm{B^0_{s}} $ Mixing Parameters from the Flavor-Tagged Decay $ \mathrm{B^0_{s}} \to \mathrm{J}/\psi \phi $ | PRL 101 (2008) 241801 | 0802.2255 |
| 5 | D0 Collaboration | Measurement of the CP-violating phase $ \phi_{\mathrm{s}}^{\mathrm{J}/\psi \phi} $ using the flavor-tagged decay $ \mathrm{B_s^0} \rightarrow \mathrm{J}/\psi \phi $ in 8$ fb$^{-1} of p$ \overline{\textrm{p}} $ collisions | PRD 85 (2012) 032006 | 1109.3166 |
| 6 | CDF Collaboration | First Flavor-Tagged Determination of Bounds on Mixing-Induced CP Violation in $ \mathrm{B^0_{s}} \to \mathrm{J}/\psi \phi $ Decays | PRL 100 (2008) 161802 | 0712.2397 |
| 7 | CDF Collaboration | Measurement of the CP-violating phase $ \beta_{\mathrm{s}}^{\mathrm{J}/\psi\phi} $ in $ \mathrm{B^0_s} \to \mathrm{J}/\psi \phi $ decays with the CDF II detector | PRD 85 (2012) 072002 | 1112.1726 |
| 8 | CDF Collaboration | Measurement of the Bottom-Strange Meson Mixing Phase in the Full CDF Data Set | PRL 109 (2012) 171802 | 1208.2967 |
| 9 | LHCb Collaboration | Measurement of the CP-violating phase $ \phi_{s} $ in $ \mathrm{\overline{B}^0_s} \to \mathrm{J}/\psi\pi^+\pi^- $ decays | PLB 713 (2012) 378 | 1204.5675 |
| 10 | LHCb Collaboration | Measurement of CP violation and the $ \mathrm{B_s^0} $ meson decay width difference with $ \mathrm{B_s^0} \to \mathrm{J}/\psi \mathrm{K}^+\mathrm{K}^- $ and $ \mathrm{B_s^0}\to \mathrm{J}/\psi\pi^+\pi^- $ decays | PRD 87 (2013) 112010 | 1304.2600 |
| 11 | LHCb Collaboration | Measurement of the CP-violating phase $ \phi_{s} $ in $ \mathrm{\overline{B}_s^0}\to \mathrm{J}/\psi\pi^+\pi^- $ decays | PLB 736 (2014) 186 | 1405.4140 |
| 12 | LHCb Collaboration | Precision measurement of CP violation in $ \mathrm{B^0_s} \to \mathrm{J}/\psi\mathrm{K}^+\mathrm{K}^- $ decays | PRL 114 (2015) 041801 | 1411.3104 |
| 13 | ATLAS Collaboration | Time-dependent angular analysis of the decay $ \mathrm{B_{s}^{0}} \to \mathrm{J}/{\psi\phi} $ and extraction of $ \Delta \Gamma_{\mathrm{s}} $ and the CP-violating weak phase $ \phi_{s} $ by ATLAS | JHEP 12 (2012) 072 | 1208.0572 |
| 14 | ATLAS Collaboration | Flavor tagged time-dependent angular analysis of the $ \mathrm{B_s^0} \rightarrow \mathrm{J}/\psi \phi $ decay and extraction of $ \Delta \Gamma_{\mathrm{s}} $ and the weak phase $ \phi_{s} $ in ATLAS | PRD 90 (2014) 052007 | 1407.1796 |
| 15 | ATLAS Collaboration | Measurement of the CP-violating phase $ \phi_{s} $ and the $ \mathrm{B_s} $ meson decay width difference with $ \mathrm{B_s^0} \rightarrow \mathrm{J}/\psi \phi $ decays in ATLAS | JHEP 12 (2016) 072 | 1601.03297 |
| 16 | ATLAS Collaboration | Measurement of the $ CP $-violating phase $ \phi_s $ in $ B^0_s \to J/\psi\phi $ decays in ATLAS at 13 TeV | 2001.07115 | |
| 17 | LHCb Collaboration | First study of the CP-violating phase and decay-width difference in $ \mathrm{B^0_s} \to\psi\text{(2S)} \phi $ | PLB 762 (2016) 253 | 1608.04855 |
| 18 | LHCb Collaboration | Measurement of the CP-violating phase $ \phi_{s} $ in $ \mathrm{\overline{B}_s^0}\to \mathrm{J}/\psi{\mathrm{D^+}}s\mathrm{D^{-}}s $ decays | PRL 113 (2014) 211801 | 1409.4619 |
| 19 | CMS Collaboration | Measurement of the CP-violating weak phase $ \phi_{s}\ $ and the decay width difference $ \Delta \Gamma_{\mathrm{s}}\ $ using the $ \mathrm{\overline{B}_s^0}\to \mathrm{J}/\psi \, \phi $ decay channel in pp collisions at $ \sqrt{s} = $ 8 TeV | PLB 757 (2016) 97 | CMS-BPH-13-012 1507.07527 |
| 20 | A. Dighe et al. | Extracting CKM phases and $ \mathrm{B^0_s} - \mathrm{\bar{B}_s} $ mixing parameters from angular distributions of non-leptonic B decays | EPJC 6 (1999) 647 | hep-ph/9804253 |
| 21 | A. Dighe et al. | Angular distributions and lifetime differences in $ \mathrm{B^0_s} \to \mathrm{J}/\psi \phi $ decays | PLB 369 (1996) 144 | hep-ph/9511363 |
| 22 | G. C. Branco, L. Lavoura, and J. P. Silva | CP Violation | Int. Ser. Monogr. Phys. 103 (1999)1 | |
| 23 | CMS Collaboration | Performance of CMS muon detector and muon reconstruction with proton-proton collisions at $ \sqrt{s} = $ 13 TeV | JINST 13 (2018) P06015 | CMS-MUO-16-001 1804.04528 |
| 24 | CMS Collaboration | The CMS trigger system | JINST 12 (2017) P01020 | CMS-TRG-12-001 1609.02366 |
| 25 | CMS Collaboration | The CMS Experiment at the CERN LHC | JINST 3 (2008) S08004 | CMS-00-001 |
| 26 | I. Antcheva et al. | ROOT -- A C++ framework for petabyte data storage, statistical analysis and visualization | CPC 180 (2009) 2499 | |
| 27 | A. Hoecker et al. | TMVA: Toolkit for Multivariate Data Analysis | PoS ACAT (2007) 040 | physics/0703039 |
| 28 | R. Fruhwirth | Application of Kalman filtering to track and vertex fitting | NIMA 262 (1987) 444 | |
| 29 | Particle Data Group Collaboration | Review of Particle Physics | PRD 98 (2018) 030001 | |
| 30 | T. Sjostrand et al. | An Introduction to PYTHIA 8.2 | CPC 191 (2015) 159 | 1410.3012 |
| 31 | D. Lange | The EvtGen particle decay simulation package | NIMA 462 (2001) 152 | |
| 32 | E. Barberio et al. | PHOTOS -- a universal Monte Carlo for QED radiative corrections in decays | CPC 66 (1991) 115 | |
| 33 | E. Barberio and Z. W\cas | PHOTOS -- a universal Monte Carlo for QED radiative corrections: version 2.0 | CPC 79 (1994) 291 | |
| 34 | GEANT4 Collaboration | GEANT4--A simulation toolkit | NIMA 506 (2003) 250 | |
| 35 | M. Pivk and F. R. Le Diberder | SPlot: A Statistical tool to unfold data distributions | NIMA 555 (2005) 356 | physics/0402083 |
| 36 | F. Chollet et al. | Keras | link | |
| 37 | CMS Collaboration | Particle-flow reconstruction and global event description with the CMS detector | JINST 12 (2017) P10003 | CMS-PRF-14-001 1706.04965 |
| 38 | D. P. Kingma and J. Ba | Adam: A method for stochastic optimization | 1412.6980 | |
| 39 | W. Verkerke and D. P. Kirkby | The RooFit toolkit for data modeling | in Statistical Problems in Particle Physics, Astrophysics and Cosmology (PHYSTAT 05): Proceedings, Oxford, 2005 | physics/0306116 |
| 40 | N. L. Johnson | Systems of frequency curves generated by methods of translation | Biometrika 36 (1949) 149 | |
| 41 | P. Ongmongkolkul et al. | iminuit---a Python interface to C++ MINUIT2 | 2012 \url https://github.com/iminuit/iminuit | |
| 42 | F. James and M. Roos | Minuit---a system for function minimization and analysis of the parameter errors and correlations | CPC 10 (1975) 343 | |
|
|
Compact Muon Solenoid LHC, CERN |
|

|

|

|

|

|