

Compact Muon Solenoid
LHC, CERN
| CMS-PAS-BPH-18-003 | ||
| Measurement of prompt open-charm production cross sections in proton-proton collisions at $\sqrt{s}=$ 13 TeV | ||
| CMS Collaboration | ||
| June 2020 | ||
| Abstract: The production cross section for prompt open-charm mesons is measured in proton-proton collisions at the LHC center-of-mass energy of 13 TeV. The data sample corresponds to an integrated luminosity of 29 nb$^{-1}$ collected by the CMS experiment in 2016. The differential cross sections of the $\mathrm{D}^{*\pm}$, $\mathrm{D}^{\pm}$, and $\mathrm{D}^0$($\mathrm{\bar D^0}$) mesons are presented in bins of transverse momentum and pseudorapidity in the range 4 $ < p_{\rm T} < $ 100 GeV and $|\eta| < $ 2.1, respectively. The results are also compared to several theoretical calculations and to previous measurements. | ||
|
Links:
CDS record (PDF) ;
inSPIRE record ;
CADI line (restricted) ;
These preliminary results are superseded in this paper, Submitted to JHEP. The superseded preliminary plots can be found here. |
||
| Figures | |
png pdf |
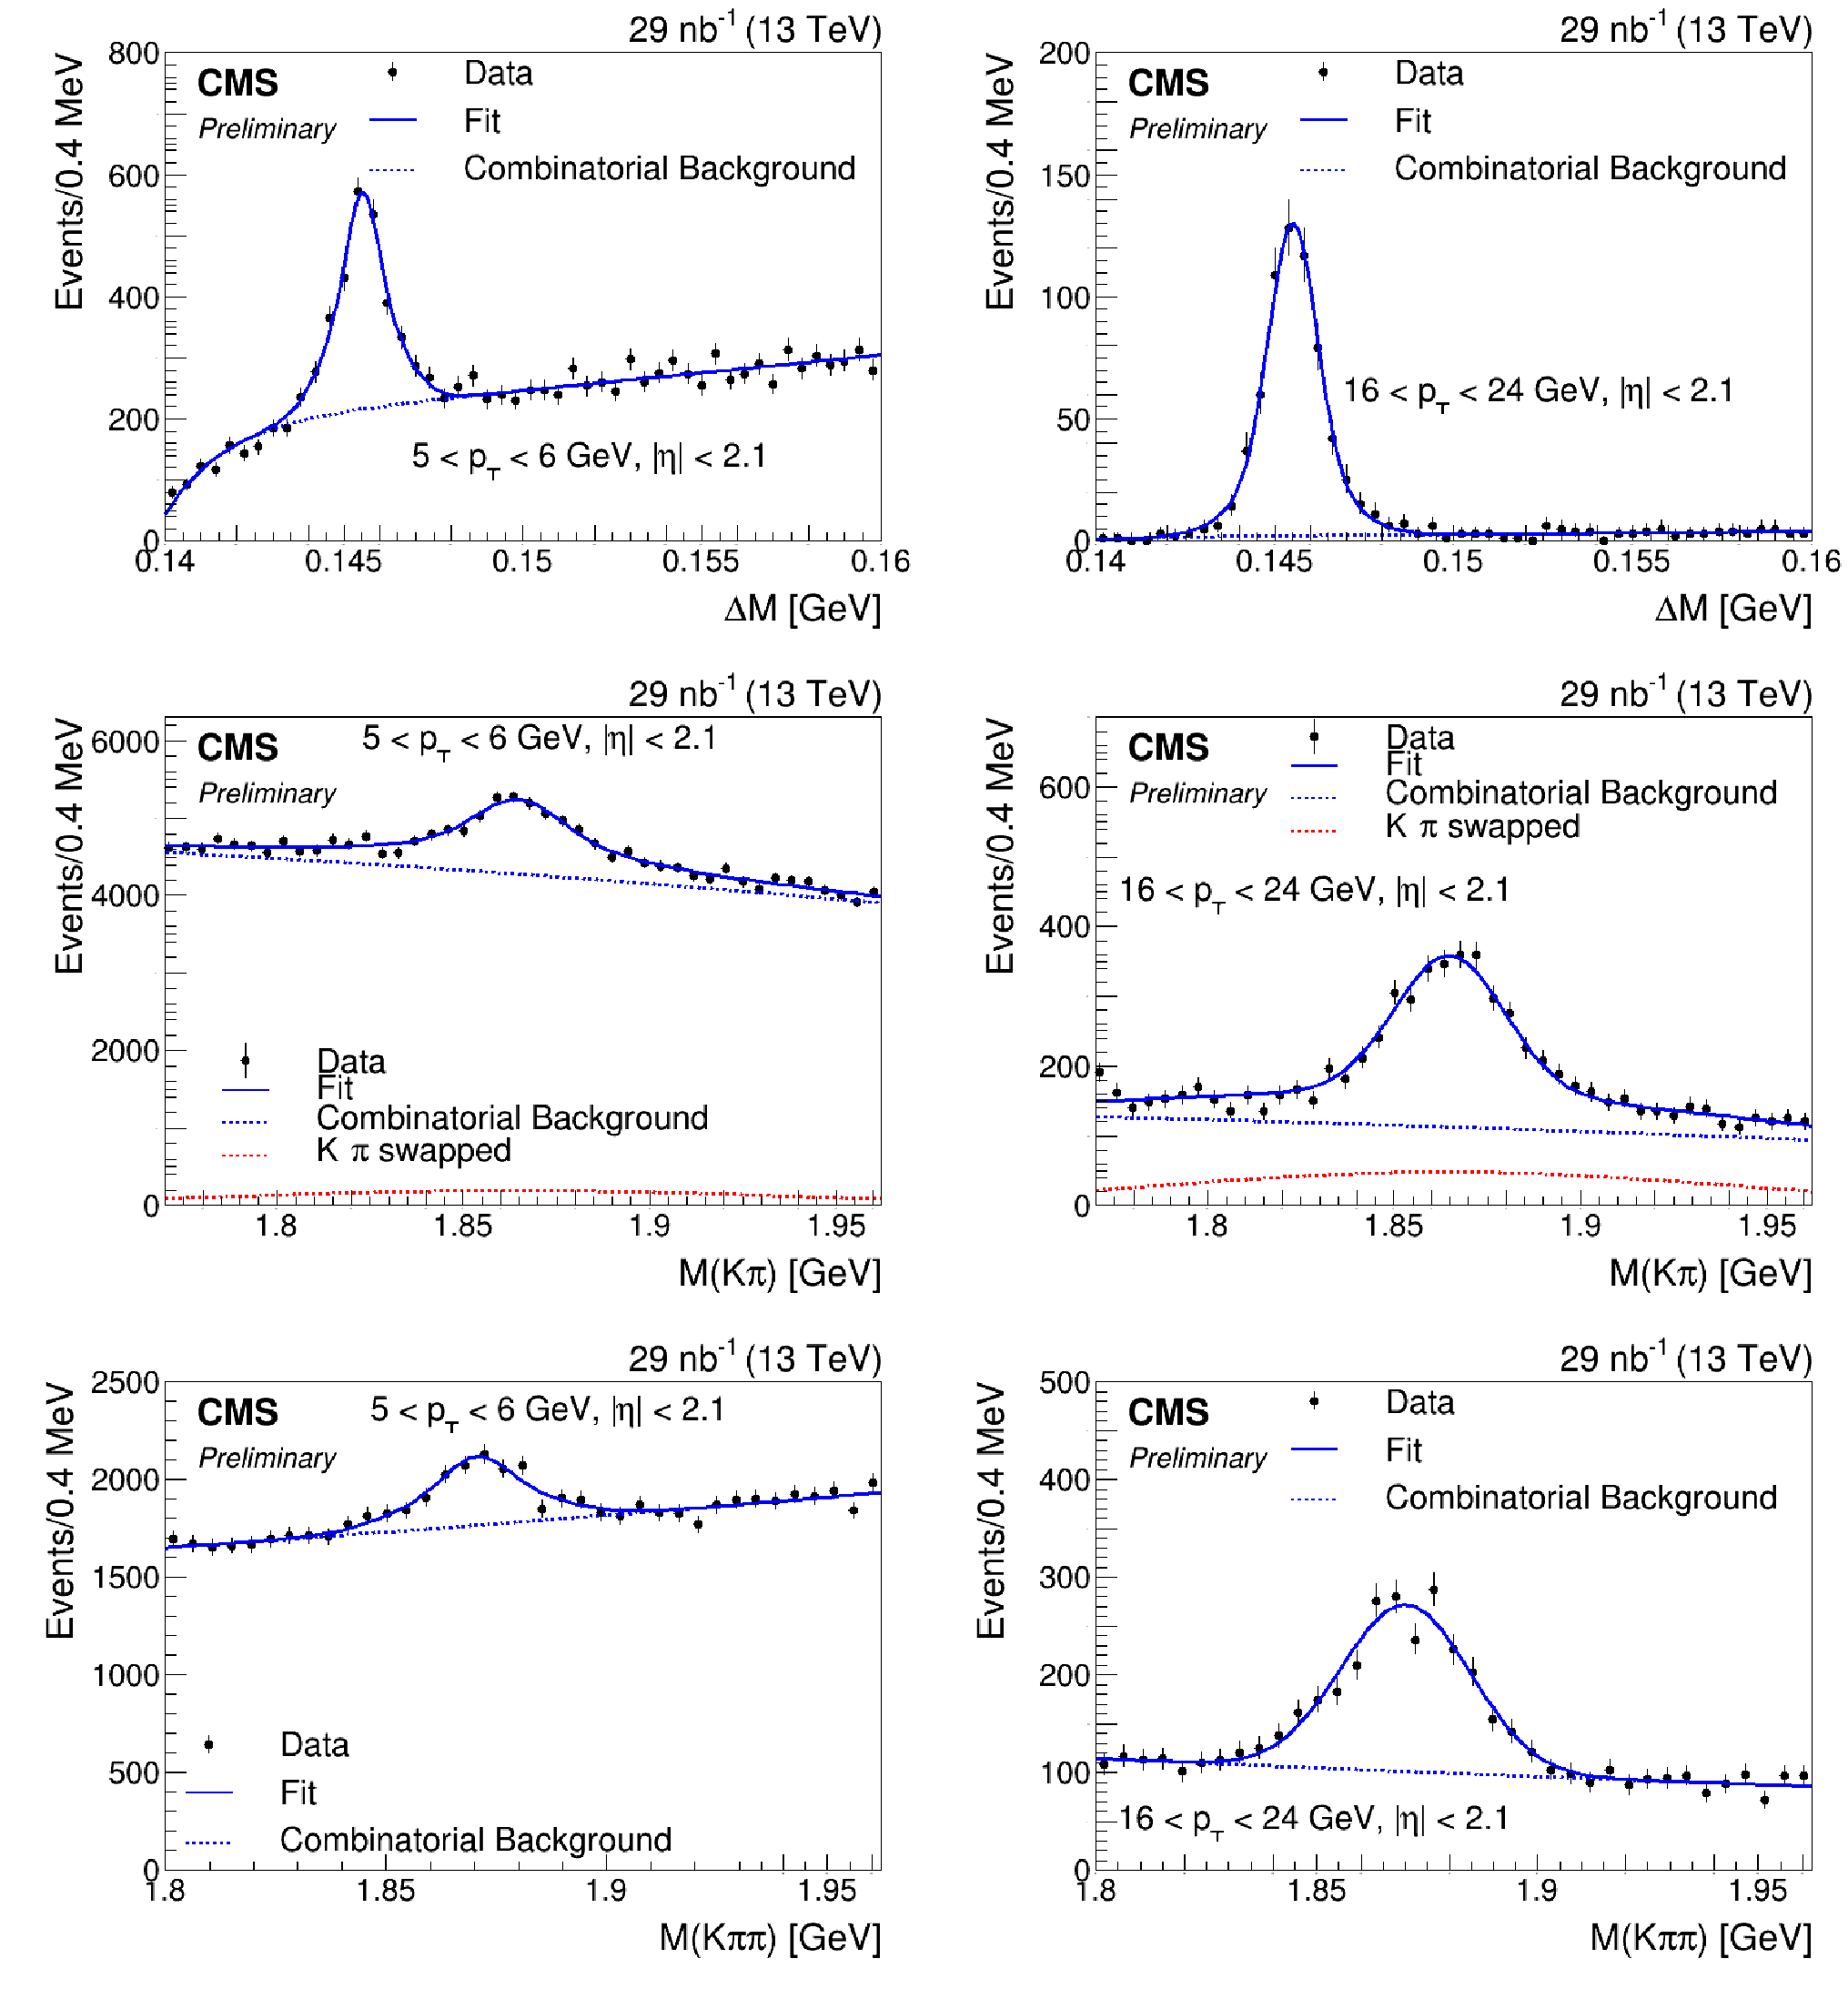
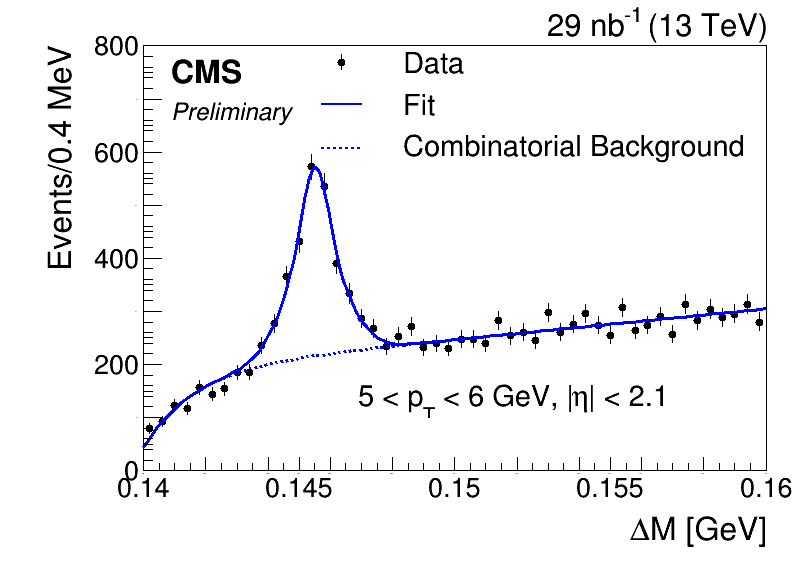
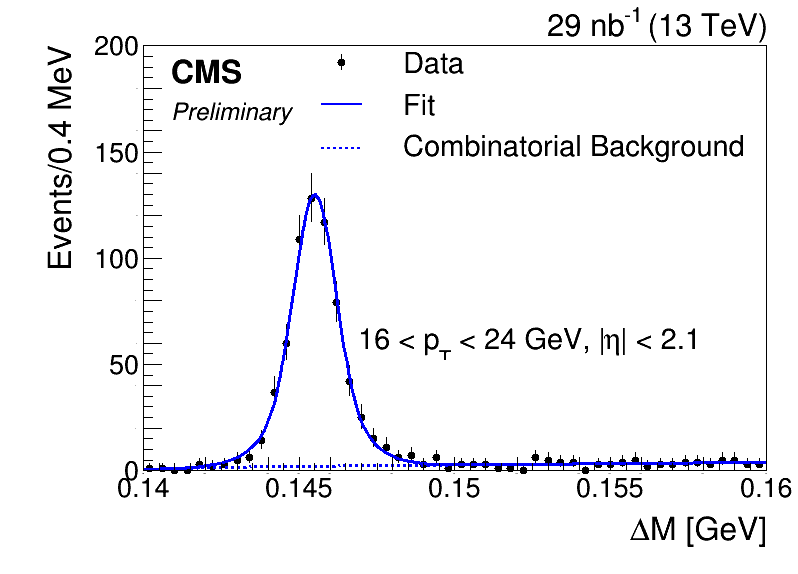
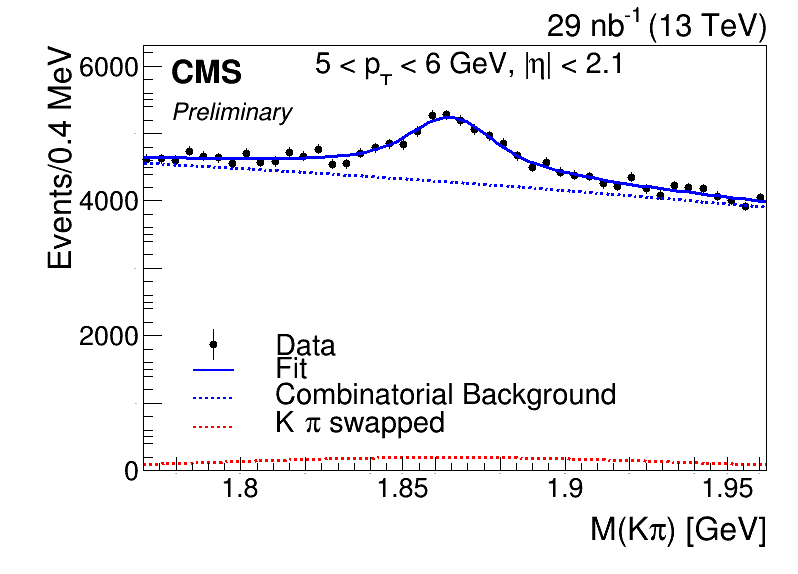
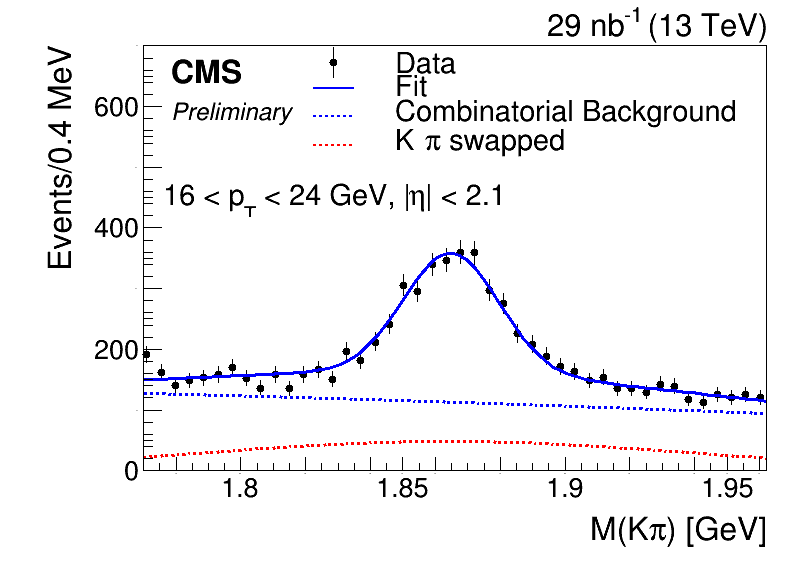
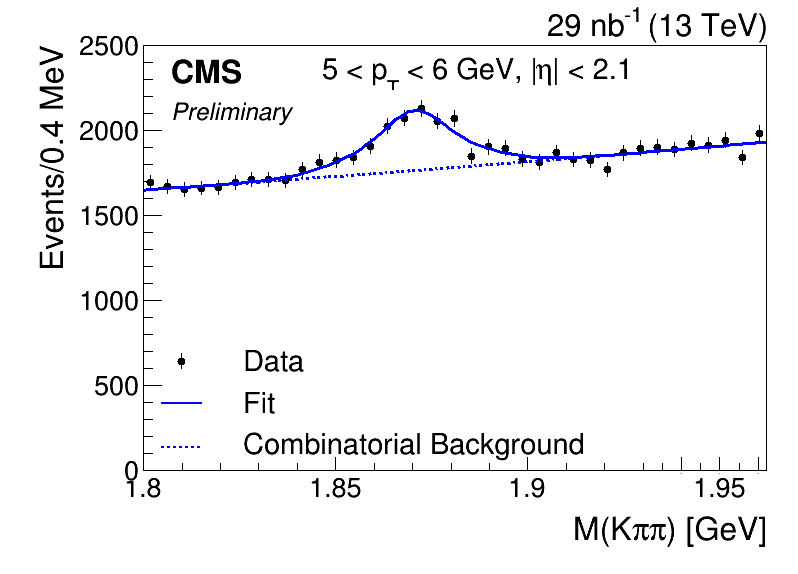
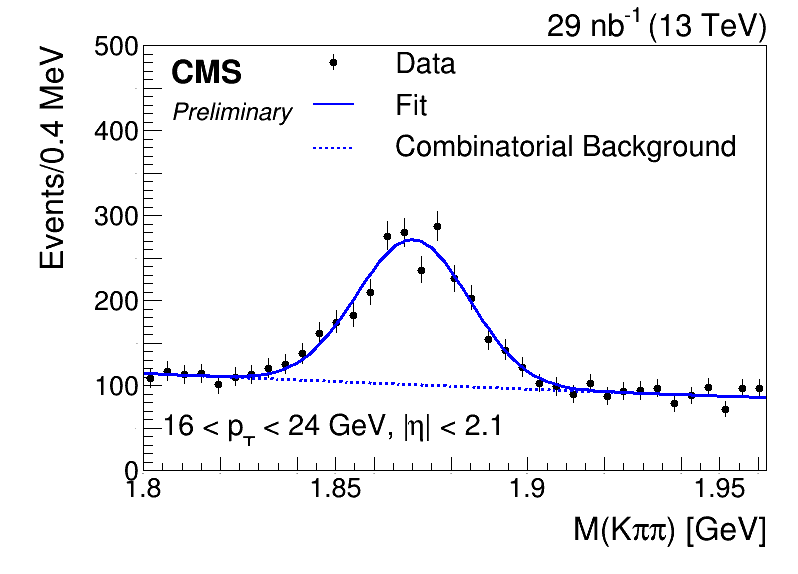
Figure 1:
Mass distributions for: $\mathrm{K^{-}} \pi^{+} \pi^{+} _{\mathrm {s}} - \mathrm{K^{-}} \pi^{+} $ (upper), $\mathrm{K^{-}} \pi^{+} $ (middle), and $\mathrm{K^{-}} \pi^{+} \pi^{+} $ (lower); charged conjugation is implied. Figures in the left column show the ${p_{\mathrm {T}}}$ bin 5-6 GeV, while the 16-24 GeV ${p_{\mathrm {T}}}$ bin is shown on the right. |
png |
Figure 1-a:
Mass distributions for: $\mathrm{K^{-}} \pi^{+} \pi^{+} _{\mathrm {s}} - \mathrm{K^{-}} \pi^{+} $ (upper), $\mathrm{K^{-}} \pi^{+} $ (middle), and $\mathrm{K^{-}} \pi^{+} \pi^{+} $ (lower); charged conjugation is implied. Figures in the left column show the ${p_{\mathrm {T}}}$ bin 5-6 GeV, while the 16-24 GeV ${p_{\mathrm {T}}}$ bin is shown on the right.-a |
png |
Figure 1-b:
Mass distributions for: $\mathrm{K^{-}} \pi^{+} \pi^{+} _{\mathrm {s}} - \mathrm{K^{-}} \pi^{+} $ (upper), $\mathrm{K^{-}} \pi^{+} $ (middle), and $\mathrm{K^{-}} \pi^{+} \pi^{+} $ (lower); charged conjugation is implied. Figures in the left column show the ${p_{\mathrm {T}}}$ bin 5-6 GeV, while the 16-24 GeV ${p_{\mathrm {T}}}$ bin is shown on the right.-b |
png |
Figure 1-c:
Mass distributions for: $\mathrm{K^{-}} \pi^{+} \pi^{+} _{\mathrm {s}} - \mathrm{K^{-}} \pi^{+} $ (upper), $\mathrm{K^{-}} \pi^{+} $ (middle), and $\mathrm{K^{-}} \pi^{+} \pi^{+} $ (lower); charged conjugation is implied. Figures in the left column show the ${p_{\mathrm {T}}}$ bin 5-6 GeV, while the 16-24 GeV ${p_{\mathrm {T}}}$ bin is shown on the right.-c |
png |
Figure 1-d:
Mass distributions for: $\mathrm{K^{-}} \pi^{+} \pi^{+} _{\mathrm {s}} - \mathrm{K^{-}} \pi^{+} $ (upper), $\mathrm{K^{-}} \pi^{+} $ (middle), and $\mathrm{K^{-}} \pi^{+} \pi^{+} $ (lower); charged conjugation is implied. Figures in the left column show the ${p_{\mathrm {T}}}$ bin 5-6 GeV, while the 16-24 GeV ${p_{\mathrm {T}}}$ bin is shown on the right.-d |
png |
Figure 1-e:
Mass distributions for: $\mathrm{K^{-}} \pi^{+} \pi^{+} _{\mathrm {s}} - \mathrm{K^{-}} \pi^{+} $ (upper), $\mathrm{K^{-}} \pi^{+} $ (middle), and $\mathrm{K^{-}} \pi^{+} \pi^{+} $ (lower); charged conjugation is implied. Figures in the left column show the ${p_{\mathrm {T}}}$ bin 5-6 GeV, while the 16-24 GeV ${p_{\mathrm {T}}}$ bin is shown on the right.-e |
png |
Figure 1-f:
Mass distributions for: $\mathrm{K^{-}} \pi^{+} \pi^{+} _{\mathrm {s}} - \mathrm{K^{-}} \pi^{+} $ (upper), $\mathrm{K^{-}} \pi^{+} $ (middle), and $\mathrm{K^{-}} \pi^{+} \pi^{+} $ (lower); charged conjugation is implied. Figures in the left column show the ${p_{\mathrm {T}}}$ bin 5-6 GeV, while the 16-24 GeV ${p_{\mathrm {T}}}$ bin is shown on the right.-f |
png pdf |
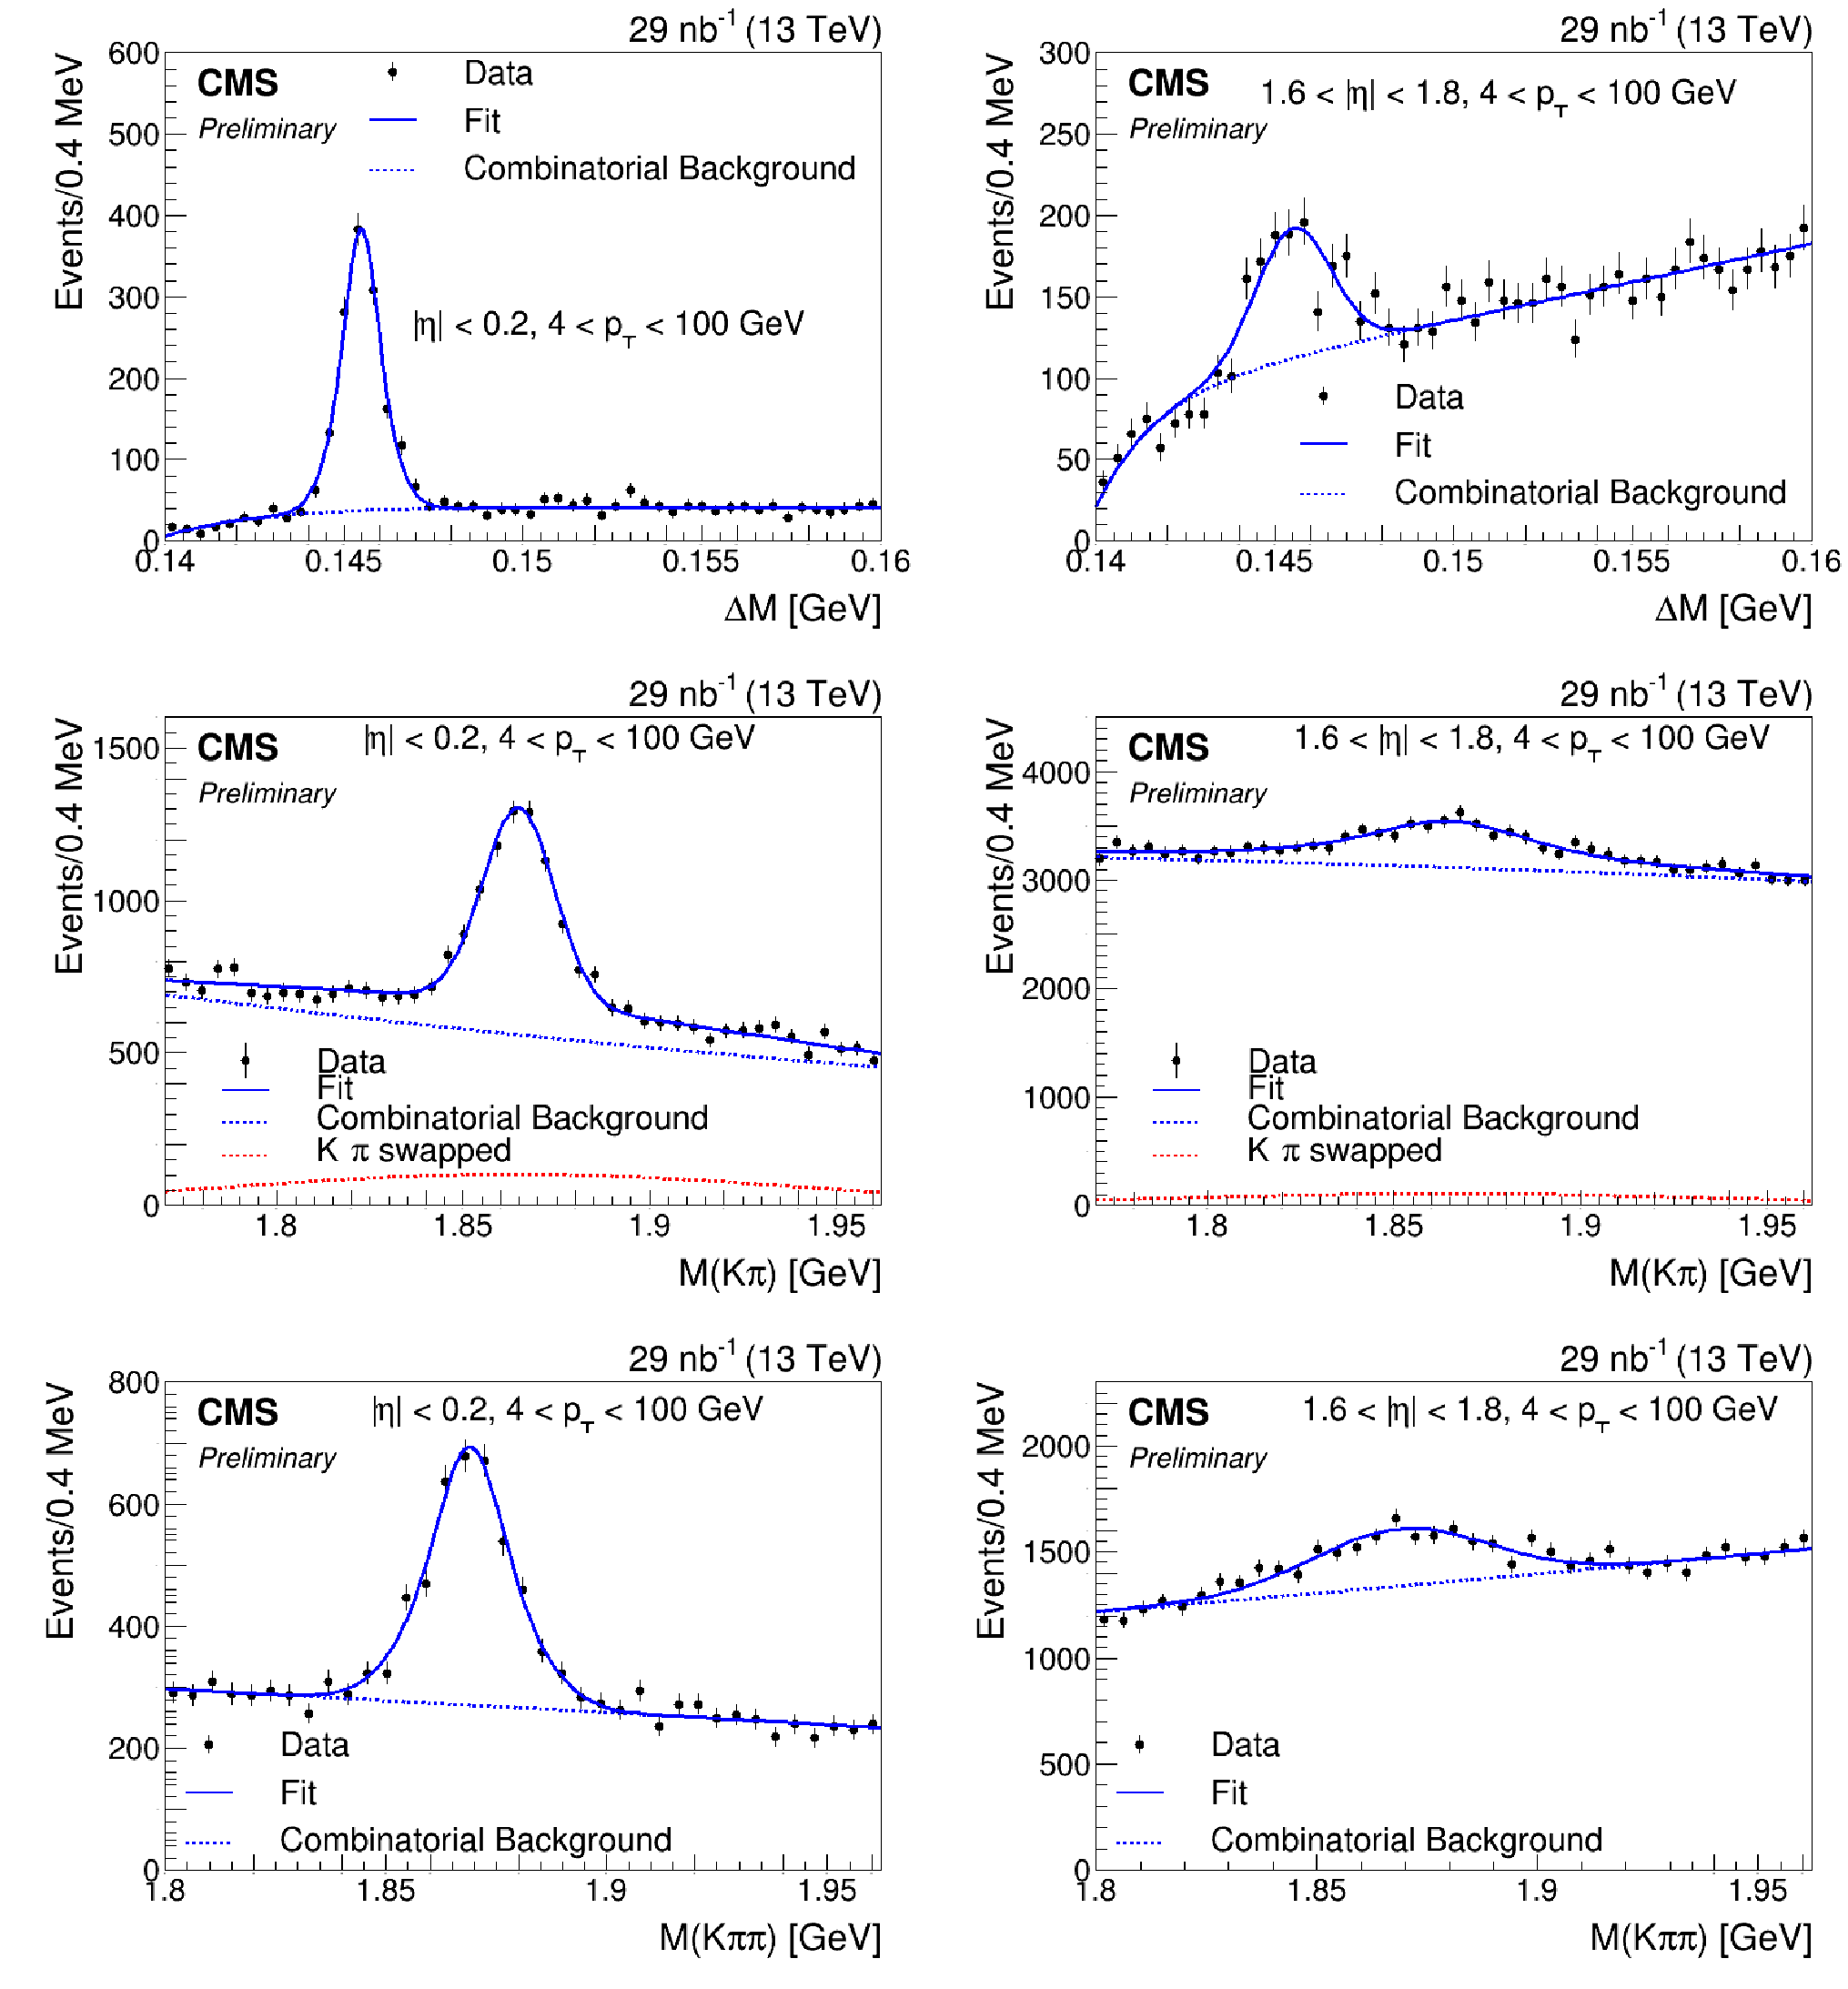
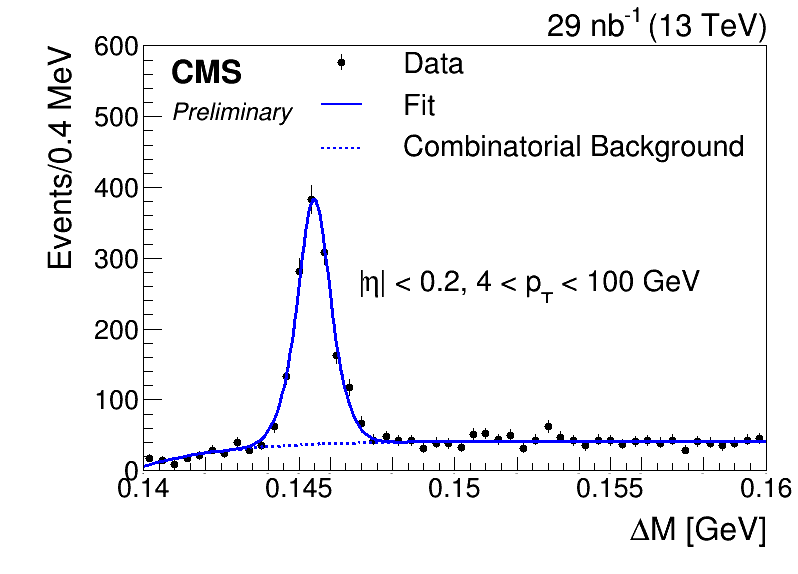
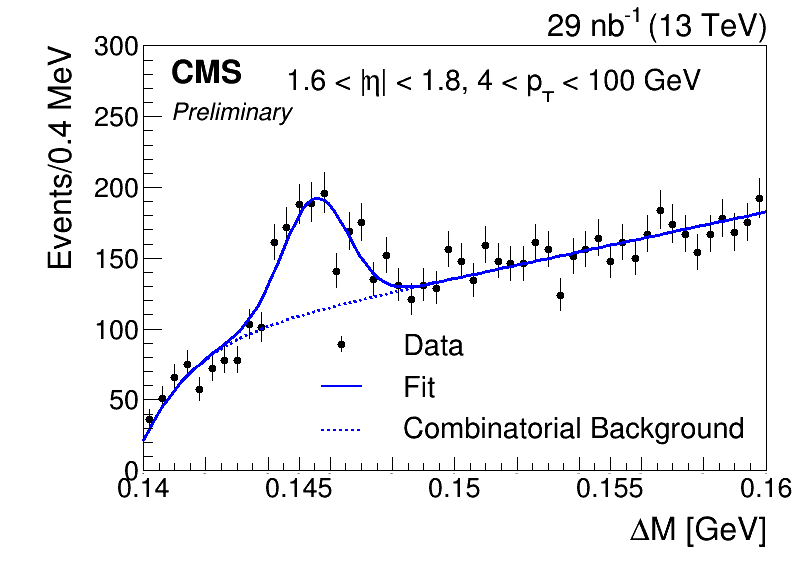
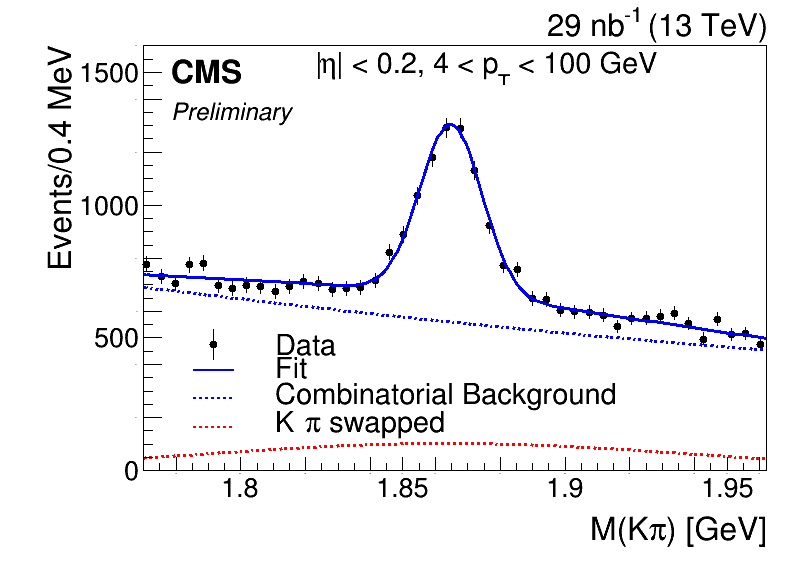
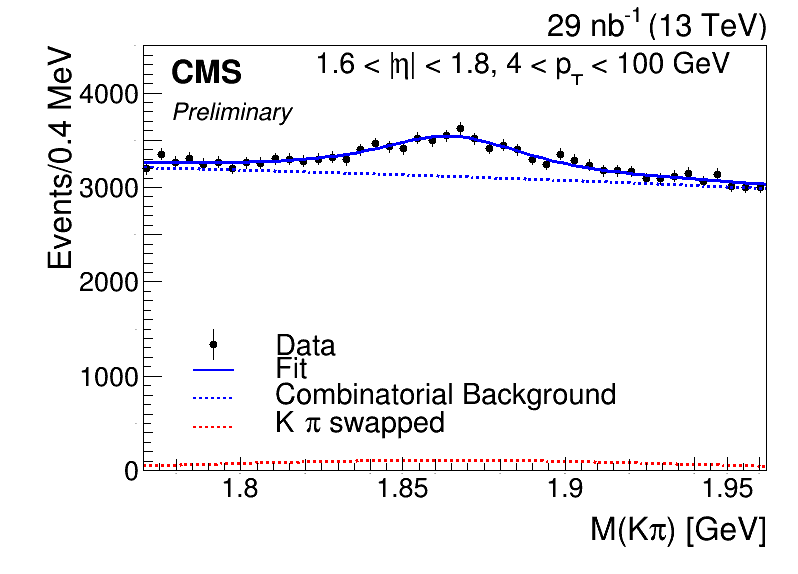
Figure 2:
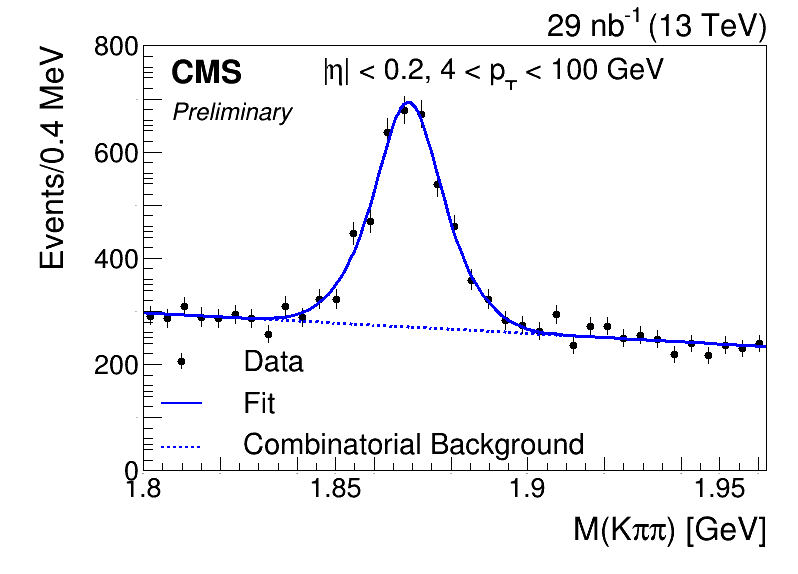
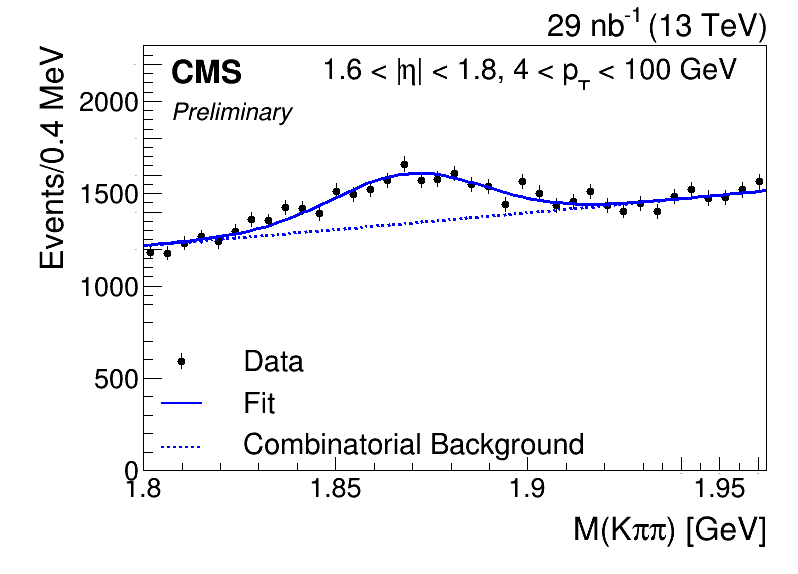
Mass distributions for: $\mathrm{K^{-}} \pi^{+} \pi^{+} _{\mathrm {s}} - \mathrm{K^{-}} \pi^{+} $ (upper), $\mathrm{K^{-}} \pi^{+} $ (middle), and $\mathrm{K^{-}} \pi^{+} \pi^{+} $ (lower); charged conjugation is implied. Figures in the left column show the $|\eta | < $ 0.2 bin, while the 1.6 $ < |\eta | < $ 1.8 bin is shown on the right. |
png |
Figure 2-a:
Mass distributions for: $\mathrm{K^{-}} \pi^{+} \pi^{+} _{\mathrm {s}} - \mathrm{K^{-}} \pi^{+} $ (upper), $\mathrm{K^{-}} \pi^{+} $ (middle), and $\mathrm{K^{-}} \pi^{+} \pi^{+} $ (lower); charged conjugation is implied. Figures in the left column show the $|\eta | < $ 0.2 bin, while the 1.6 $ < |\eta | < $ 1.8 bin is shown on the right.-a |
png |
Figure 2-b:
Mass distributions for: $\mathrm{K^{-}} \pi^{+} \pi^{+} _{\mathrm {s}} - \mathrm{K^{-}} \pi^{+} $ (upper), $\mathrm{K^{-}} \pi^{+} $ (middle), and $\mathrm{K^{-}} \pi^{+} \pi^{+} $ (lower); charged conjugation is implied. Figures in the left column show the $|\eta | < $ 0.2 bin, while the 1.6 $ < |\eta | < $ 1.8 bin is shown on the right.-b |
png |
Figure 2-c:
Mass distributions for: $\mathrm{K^{-}} \pi^{+} \pi^{+} _{\mathrm {s}} - \mathrm{K^{-}} \pi^{+} $ (upper), $\mathrm{K^{-}} \pi^{+} $ (middle), and $\mathrm{K^{-}} \pi^{+} \pi^{+} $ (lower); charged conjugation is implied. Figures in the left column show the $|\eta | < $ 0.2 bin, while the 1.6 $ < |\eta | < $ 1.8 bin is shown on the right.-c |
png |
Figure 2-d:
Mass distributions for: $\mathrm{K^{-}} \pi^{+} \pi^{+} _{\mathrm {s}} - \mathrm{K^{-}} \pi^{+} $ (upper), $\mathrm{K^{-}} \pi^{+} $ (middle), and $\mathrm{K^{-}} \pi^{+} \pi^{+} $ (lower); charged conjugation is implied. Figures in the left column show the $|\eta | < $ 0.2 bin, while the 1.6 $ < |\eta | < $ 1.8 bin is shown on the right.-d |
png |
Figure 2-e:
Mass distributions for: $\mathrm{K^{-}} \pi^{+} \pi^{+} _{\mathrm {s}} - \mathrm{K^{-}} \pi^{+} $ (upper), $\mathrm{K^{-}} \pi^{+} $ (middle), and $\mathrm{K^{-}} \pi^{+} \pi^{+} $ (lower); charged conjugation is implied. Figures in the left column show the $|\eta | < $ 0.2 bin, while the 1.6 $ < |\eta | < $ 1.8 bin is shown on the right.-e |
png |
Figure 2-f:
Mass distributions for: $\mathrm{K^{-}} \pi^{+} \pi^{+} _{\mathrm {s}} - \mathrm{K^{-}} \pi^{+} $ (upper), $\mathrm{K^{-}} \pi^{+} $ (middle), and $\mathrm{K^{-}} \pi^{+} \pi^{+} $ (lower); charged conjugation is implied. Figures in the left column show the $|\eta | < $ 0.2 bin, while the 1.6 $ < |\eta | < $ 1.8 bin is shown on the right.-f |
png pdf |
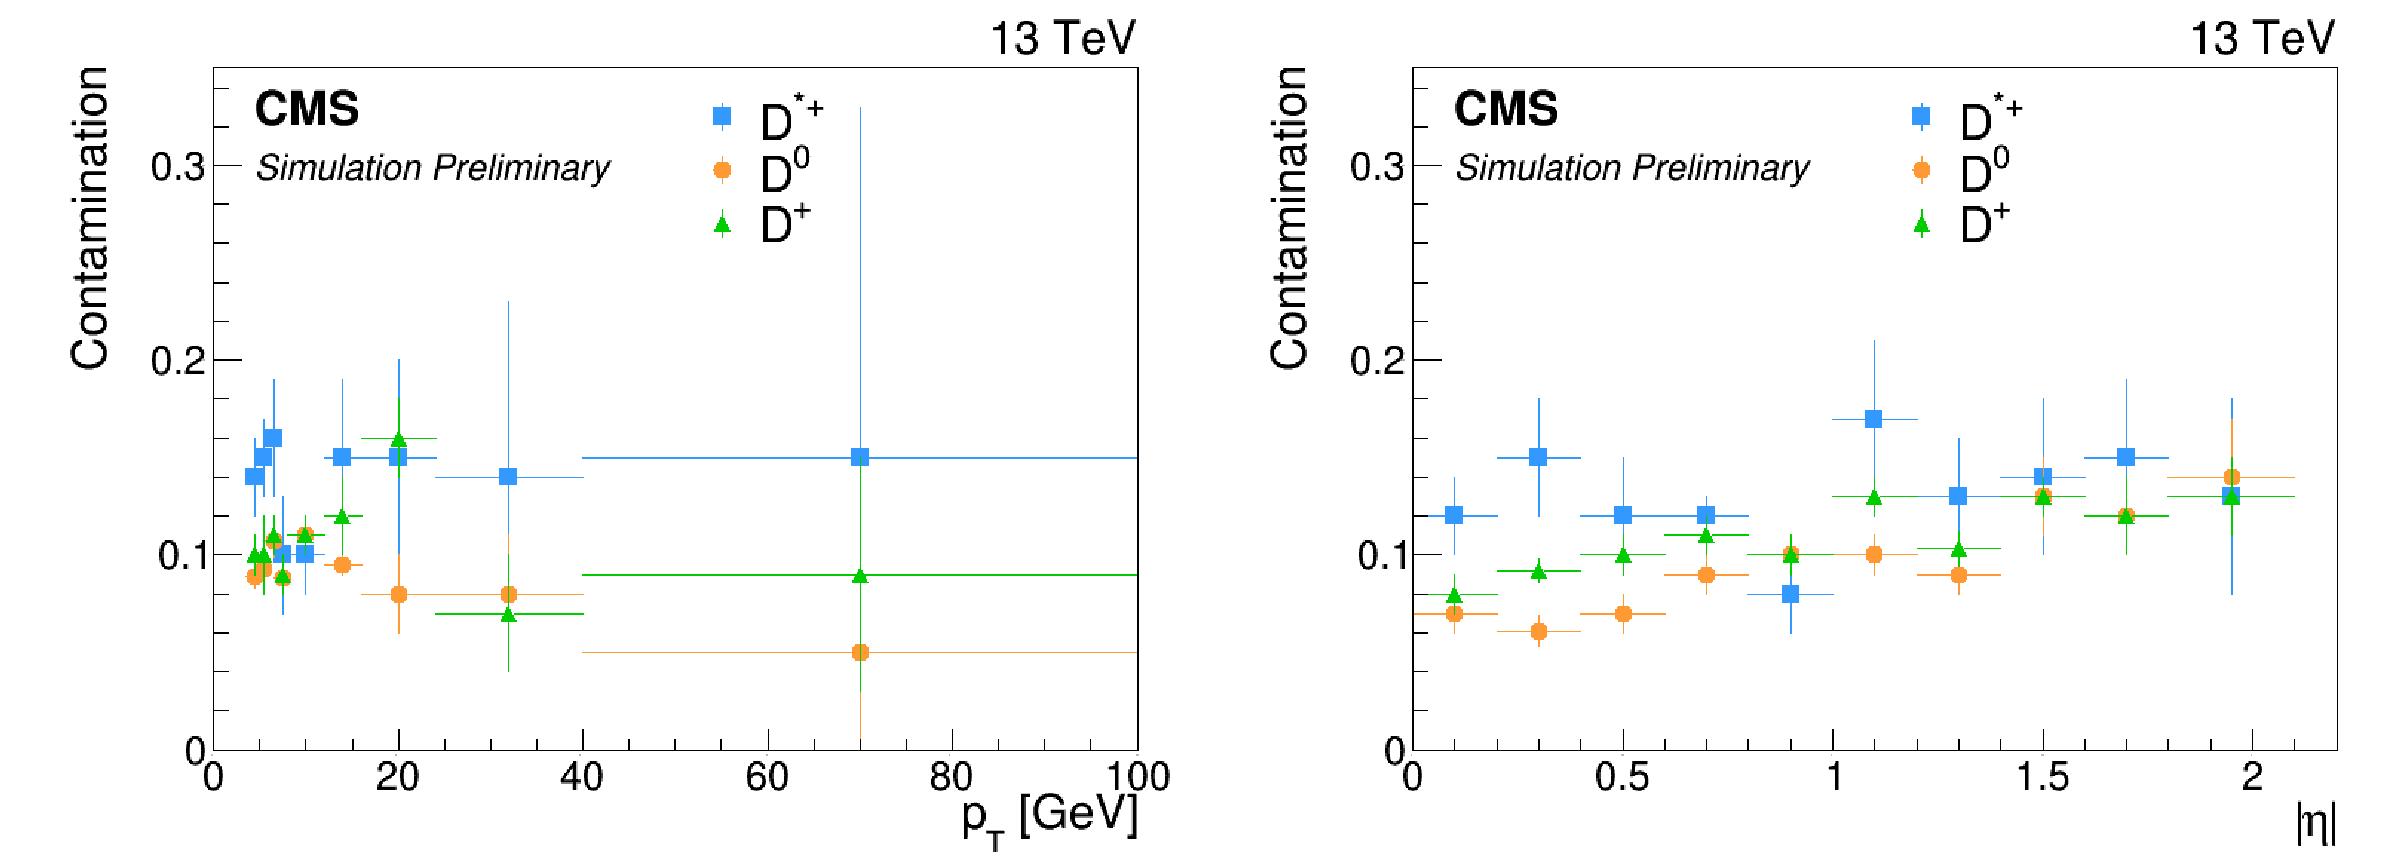
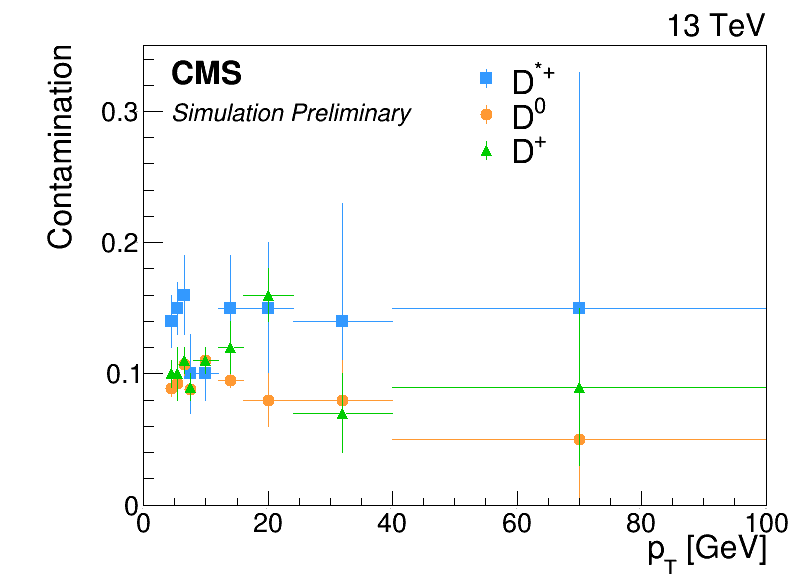
Figure 3:
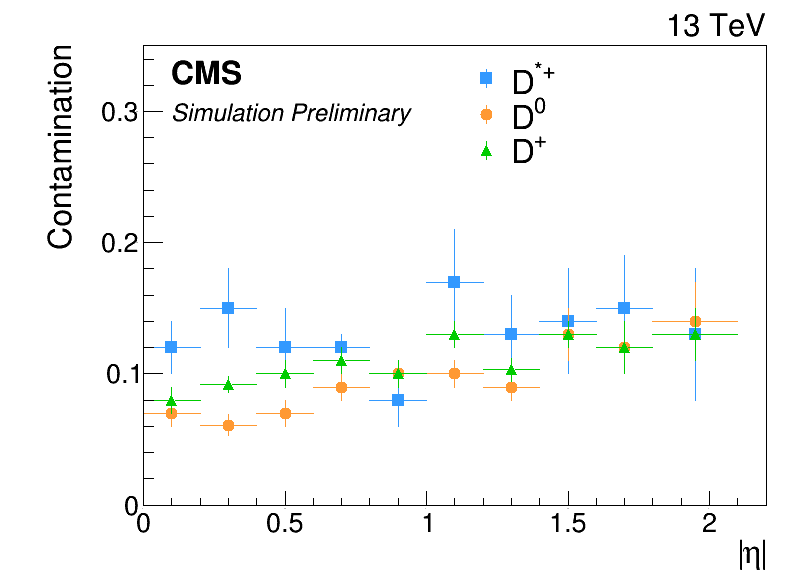
Contamination from secondary decay reported as a function of ${p_{\mathrm {T}}}$ (left) and $|\eta |$ (right) for $\mathrm{D} ^{*+}$ (square), ${\mathrm{D^0}}$ (circle), and ${\mathrm{D^+}}$ (triangle) mesons. The vertical lines represent the statistical uncertainties. |
png |
Figure 3-a:
Contamination from secondary decay reported as a function of ${p_{\mathrm {T}}}$ (left) and $|\eta |$ (right) for $\mathrm{D} ^{*+}$ (square), ${\mathrm{D^0}}$ (circle), and ${\mathrm{D^+}}$ (triangle) mesons. The vertical lines represent the statistical uncertainties. |
png |
Figure 3-b:
Contamination from secondary decay reported as a function of ${p_{\mathrm {T}}}$ (left) and $|\eta |$ (right) for $\mathrm{D} ^{*+}$ (square), ${\mathrm{D^0}}$ (circle), and ${\mathrm{D^+}}$ (triangle) mesons. The vertical lines represent the statistical uncertainties. |
png pdf |
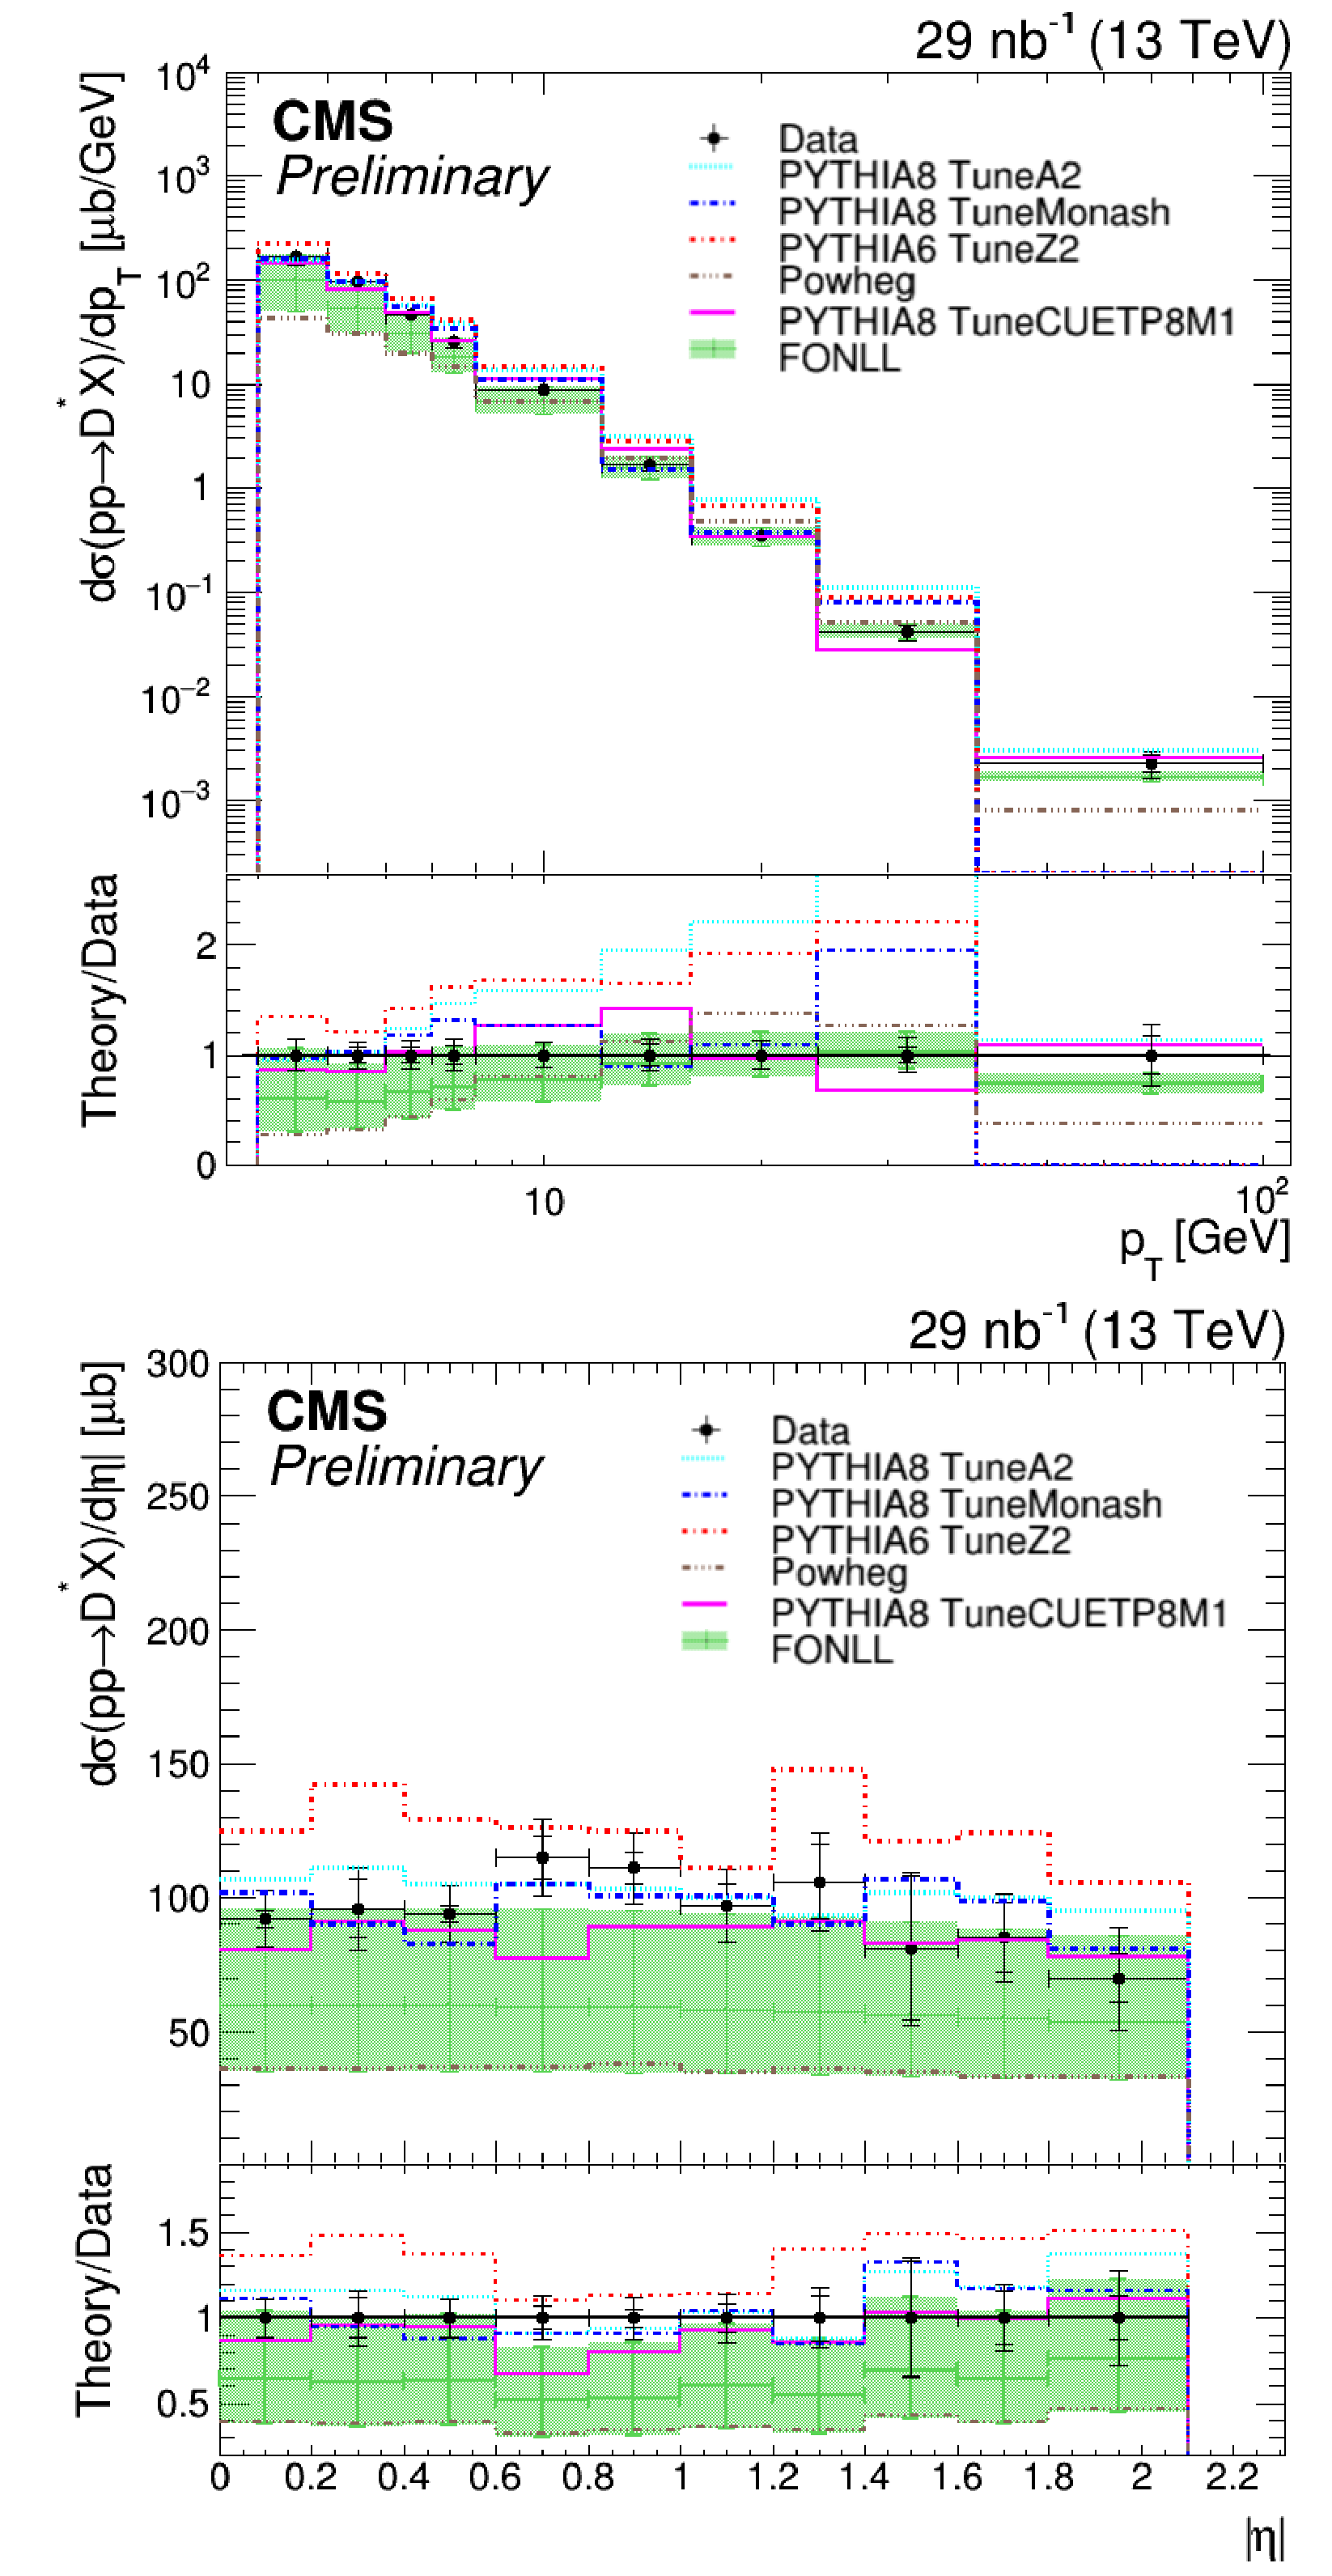
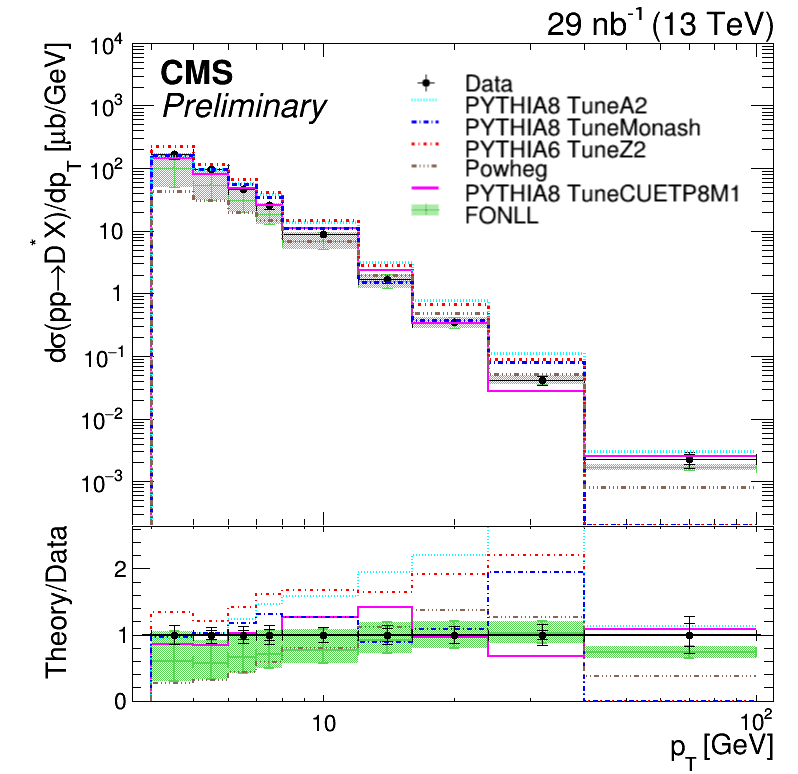
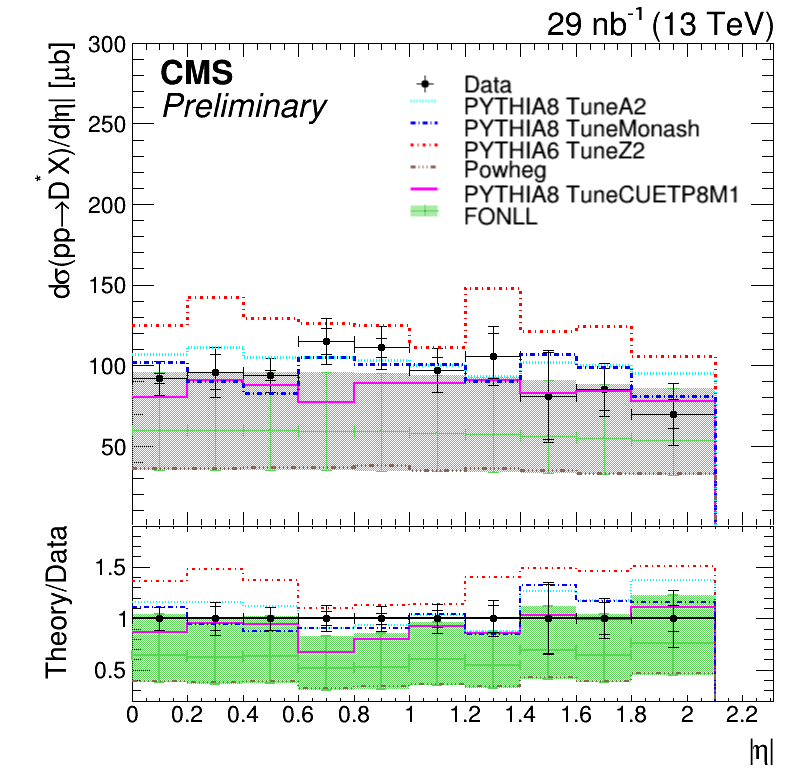
Figure 4:
Differential cross sections $\mathrm{d}\sigma /\mathrm{d}p_{\mathrm{T}}$ (upper) and $\mathrm{d}\sigma /\mathrm{d}|\eta |$ (lower) for the ${{\mathrm{D}^{*}(2010)^{\pm}}}$ meson. Data points (black) are compared with several MC simulation models and theoretical predictions. The statistical and total uncertainties are reported separated by horizontal bars. On the lower panel of the figures, the ratio of the predictions to the central value of the data is shown. |
png |
Figure 4-a:
Differential cross sections $\mathrm{d}\sigma /\mathrm{d}p_{\mathrm{T}}$ (upper) and $\mathrm{d}\sigma /\mathrm{d}|\eta |$ (lower) for the ${{\mathrm{D}^{*}(2010)^{\pm}}}$ meson. Data points (black) are compared with several MC simulation models and theoretical predictions. The statistical and total uncertainties are reported separated by horizontal bars. On the lower panel of the figures, the ratio of the predictions to the central value of the data is shown. |
png |
Figure 4-b:
Differential cross sections $\mathrm{d}\sigma /\mathrm{d}p_{\mathrm{T}}$ (upper) and $\mathrm{d}\sigma /\mathrm{d}|\eta |$ (lower) for the ${{\mathrm{D}^{*}(2010)^{\pm}}}$ meson. Data points (black) are compared with several MC simulation models and theoretical predictions. The statistical and total uncertainties are reported separated by horizontal bars. On the lower panel of the figures, the ratio of the predictions to the central value of the data is shown. |
png pdf |
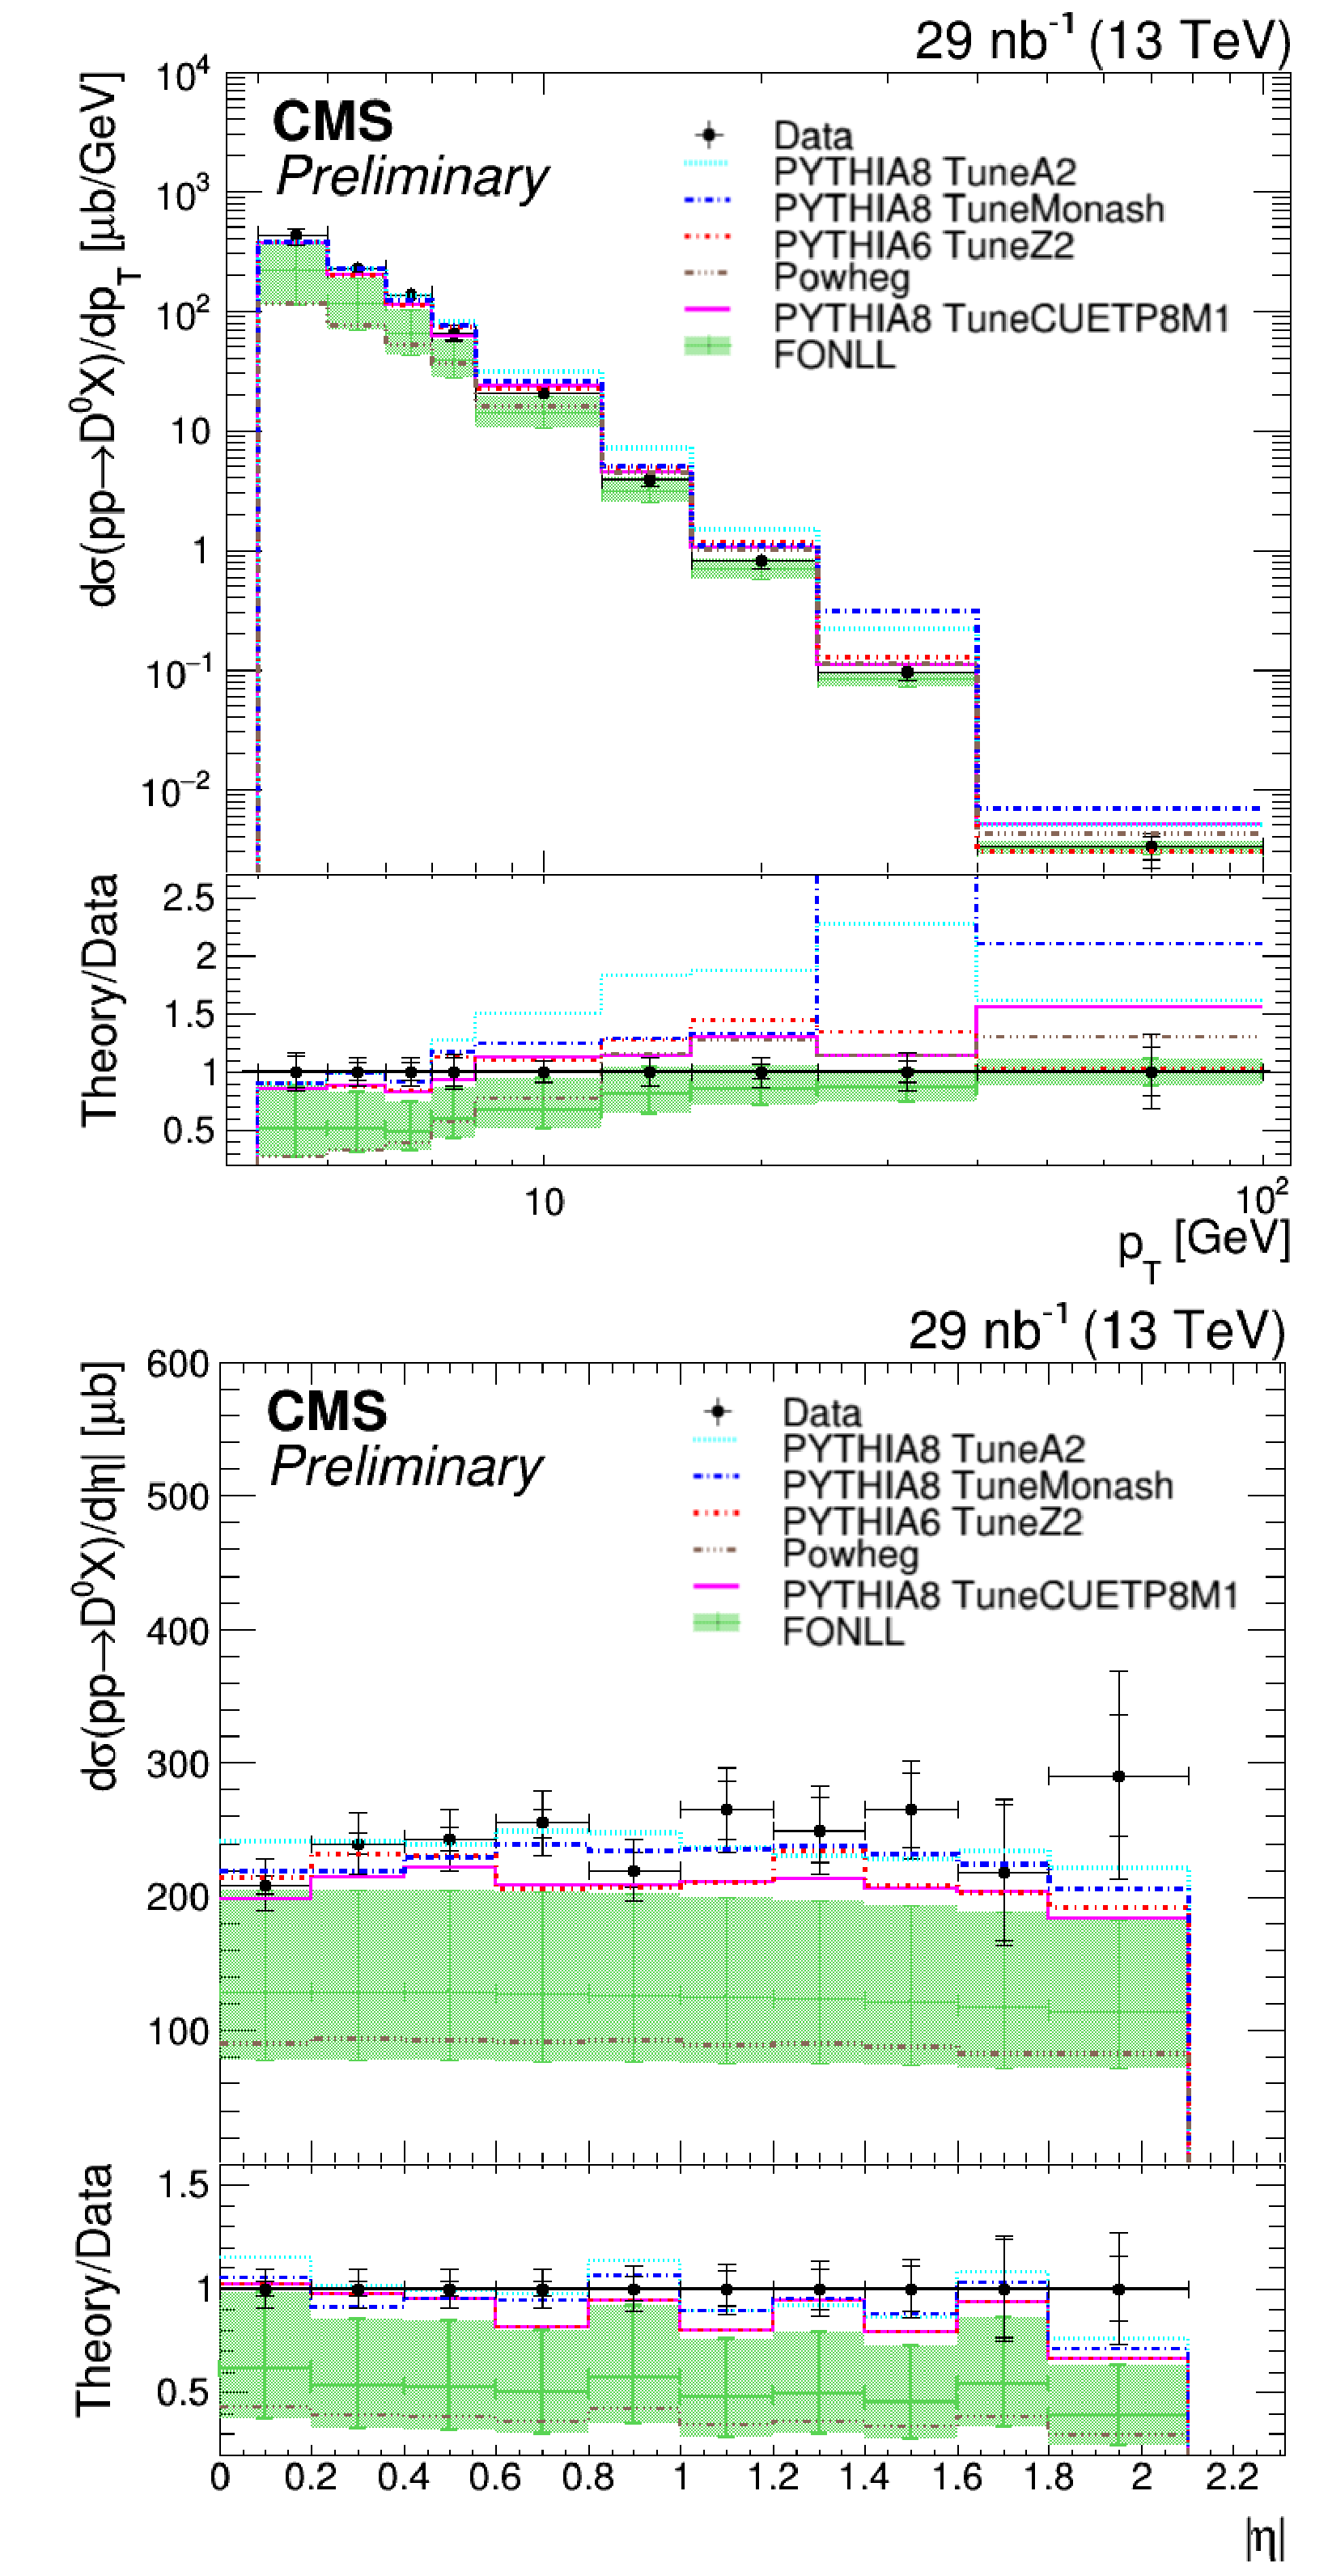
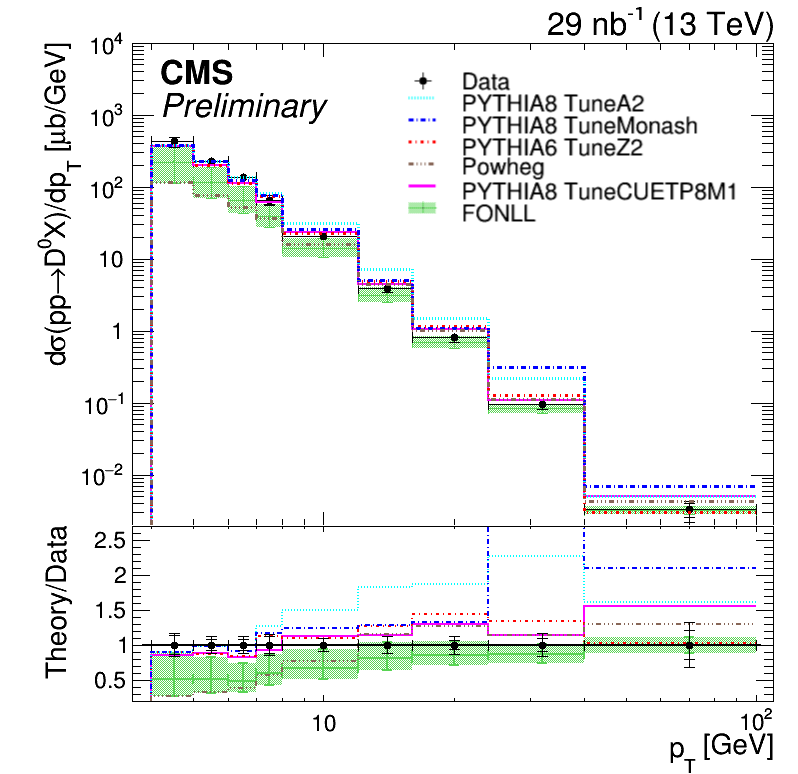
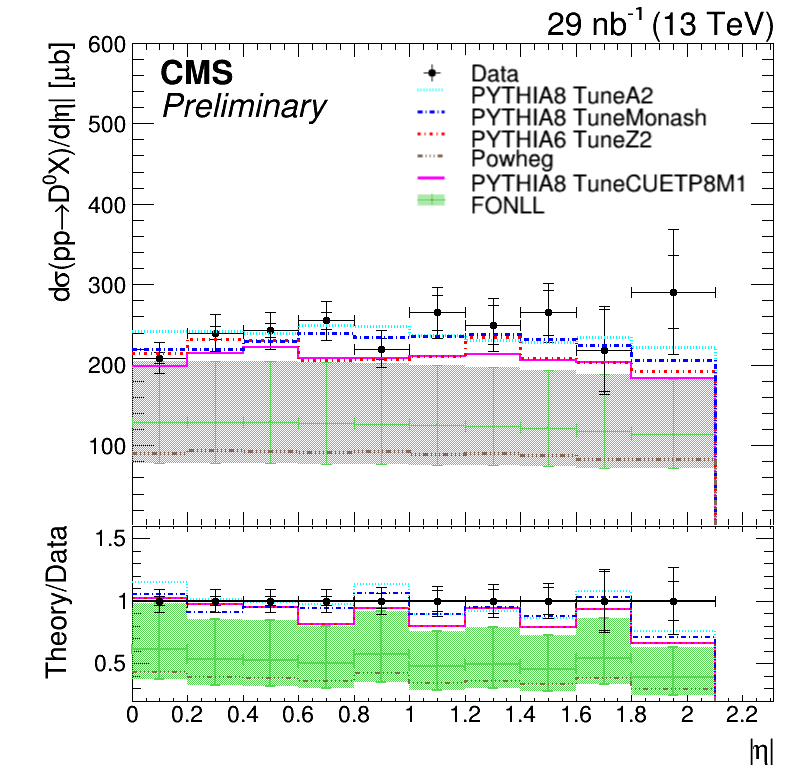
Figure 5:
Differential cross section $\mathrm{d}\sigma /\mathrm{d}p_{\mathrm{T}}$ (upper) and $\mathrm{d}\sigma /\mathrm{d}|\eta |$ (lower) for the ${\mathrm{D^0}}$ (${\mathrm{\overline{D}}^0}$) meson. Data points (black) are compared with several MC simulation models and theoretical predictions. The statistical and total uncertainties are reported separated by horizontal bars. On the lower panel of the figures, the ratio of the predictions to the central value of the data is shown. |
png |
Figure 5-a:
Differential cross section $\mathrm{d}\sigma /\mathrm{d}p_{\mathrm{T}}$ (upper) and $\mathrm{d}\sigma /\mathrm{d}|\eta |$ (lower) for the ${\mathrm{D^0}}$ (${\mathrm{\overline{D}}^0}$) meson. Data points (black) are compared with several MC simulation models and theoretical predictions. The statistical and total uncertainties are reported separated by horizontal bars. On the lower panel of the figures, the ratio of the predictions to the central value of the data is shown. |
png |
Figure 5-b:
Differential cross section $\mathrm{d}\sigma /\mathrm{d}p_{\mathrm{T}}$ (upper) and $\mathrm{d}\sigma /\mathrm{d}|\eta |$ (lower) for the ${\mathrm{D^0}}$ (${\mathrm{\overline{D}}^0}$) meson. Data points (black) are compared with several MC simulation models and theoretical predictions. The statistical and total uncertainties are reported separated by horizontal bars. On the lower panel of the figures, the ratio of the predictions to the central value of the data is shown. |
png pdf |
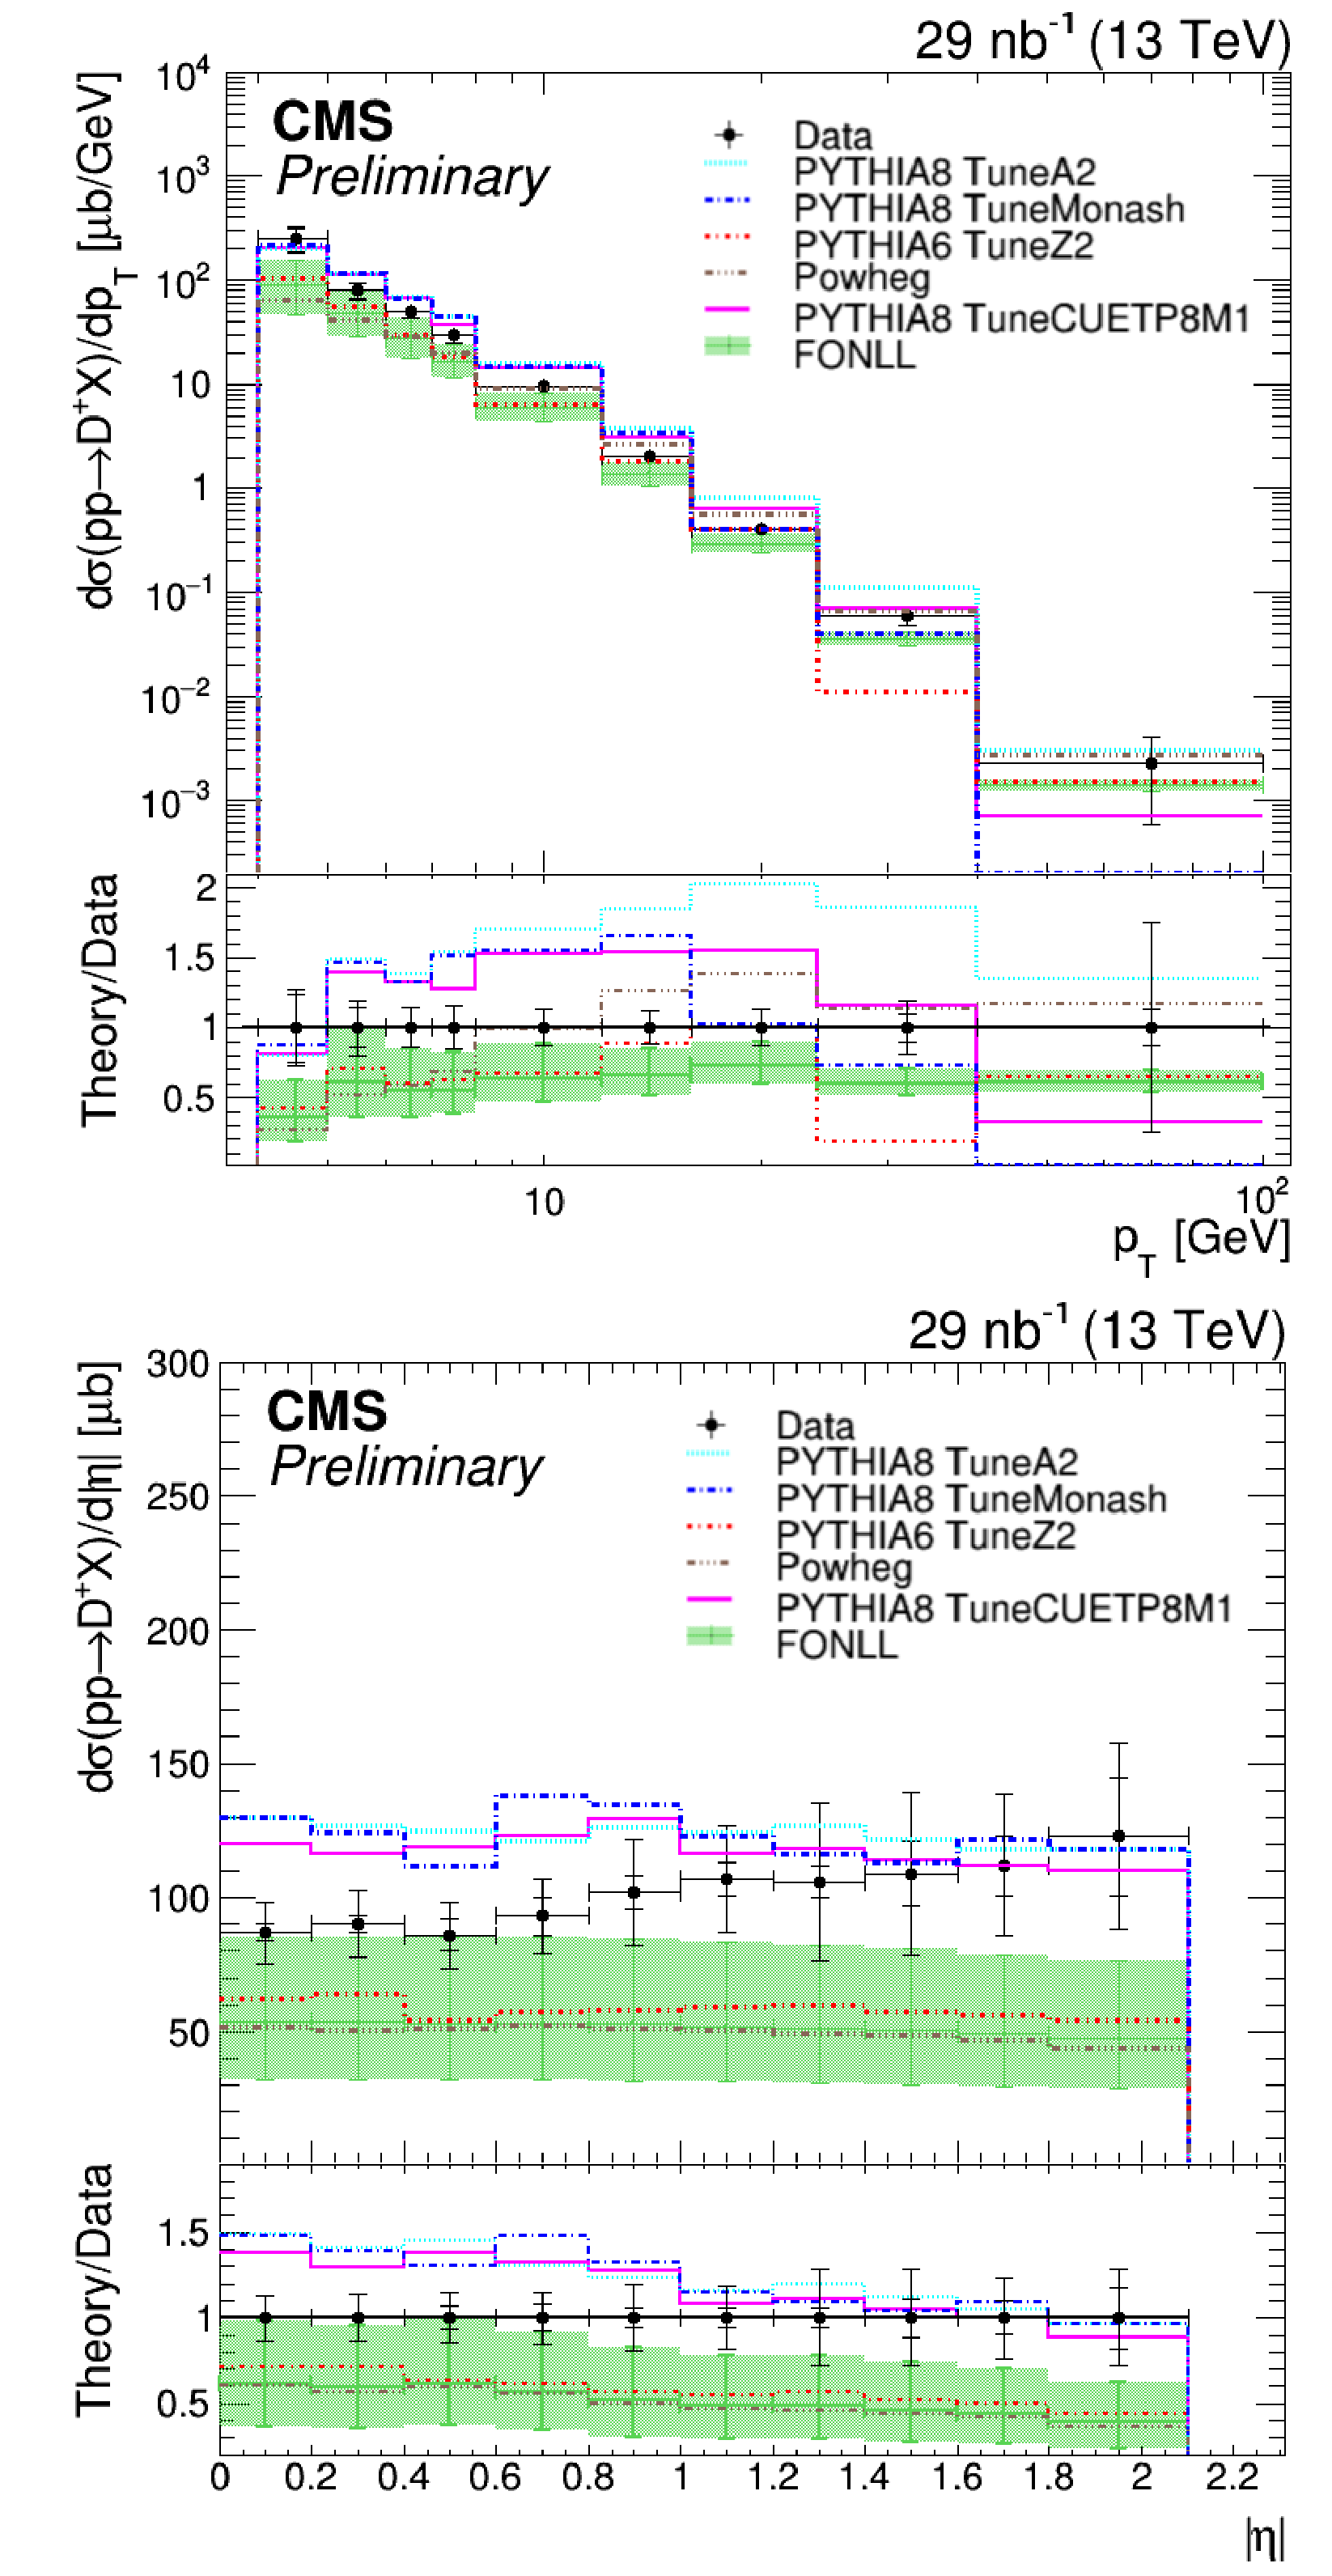
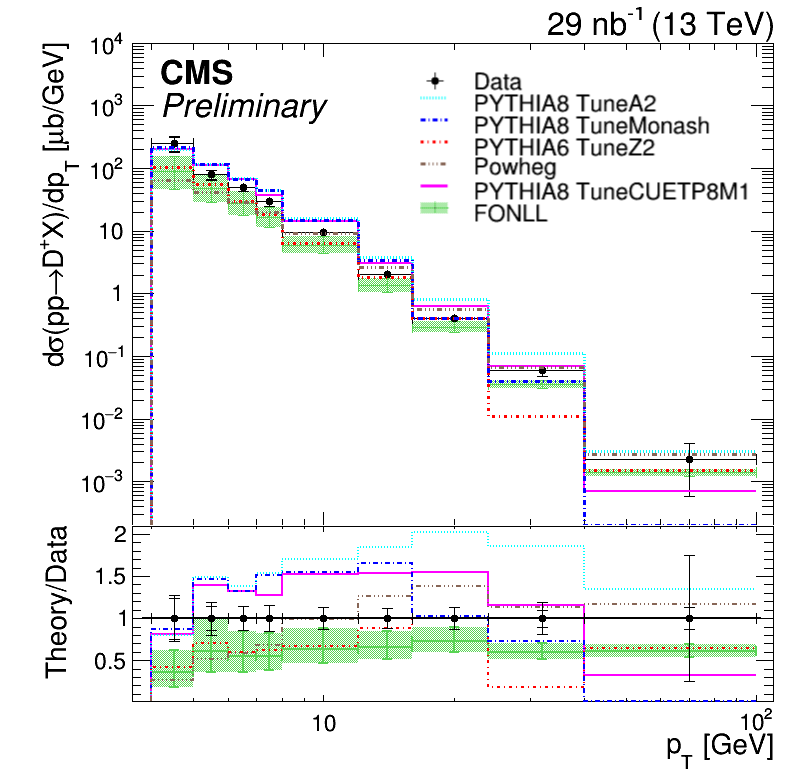
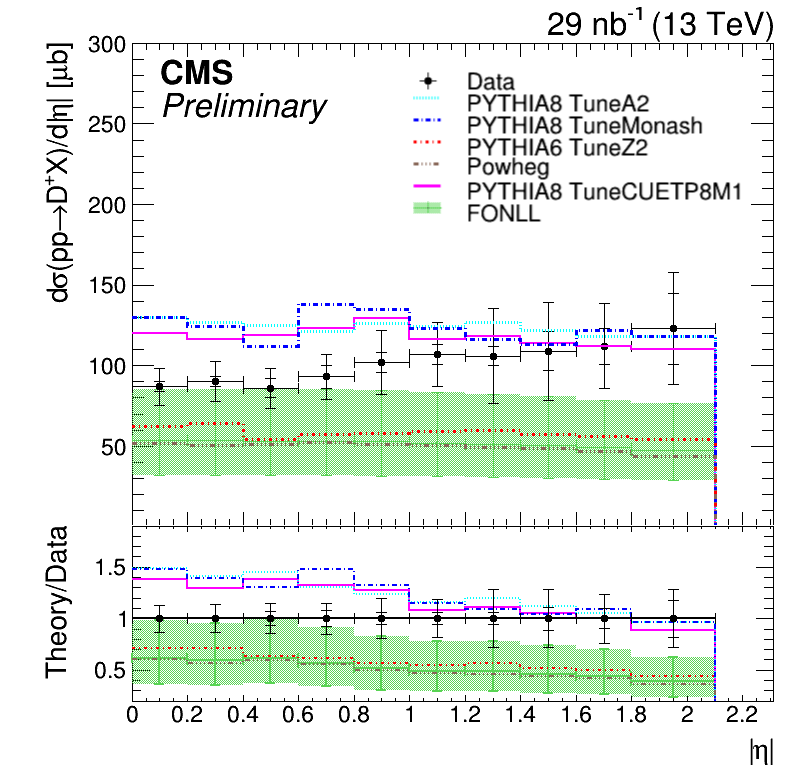
Figure 6:
Differential cross section $\mathrm{d}\sigma /\mathrm{d}p_{\mathrm{T}}$ (upper) and $\mathrm{d}\sigma /\mathrm{d}|\eta |$ (lower) for the ${\mathrm{D^{\pm}}}$ meson. Data points (black) are compared with several MC simulation models and theoretical predictions. The statistical and total uncertainties are reported separated by horizontal bars. On the lower panel of the figures, the ratio of the predictions to the central value of the data is shown. |
png |
Figure 6-a:
Differential cross section $\mathrm{d}\sigma /\mathrm{d}p_{\mathrm{T}}$ (upper) and $\mathrm{d}\sigma /\mathrm{d}|\eta |$ (lower) for the ${\mathrm{D^{\pm}}}$ meson. Data points (black) are compared with several MC simulation models and theoretical predictions. The statistical and total uncertainties are reported separated by horizontal bars. On the lower panel of the figures, the ratio of the predictions to the central value of the data is shown. |
png |
Figure 6-b:
Differential cross section $\mathrm{d}\sigma /\mathrm{d}p_{\mathrm{T}}$ (upper) and $\mathrm{d}\sigma /\mathrm{d}|\eta |$ (lower) for the ${\mathrm{D^{\pm}}}$ meson. Data points (black) are compared with several MC simulation models and theoretical predictions. The statistical and total uncertainties are reported separated by horizontal bars. On the lower panel of the figures, the ratio of the predictions to the central value of the data is shown. |
png pdf |
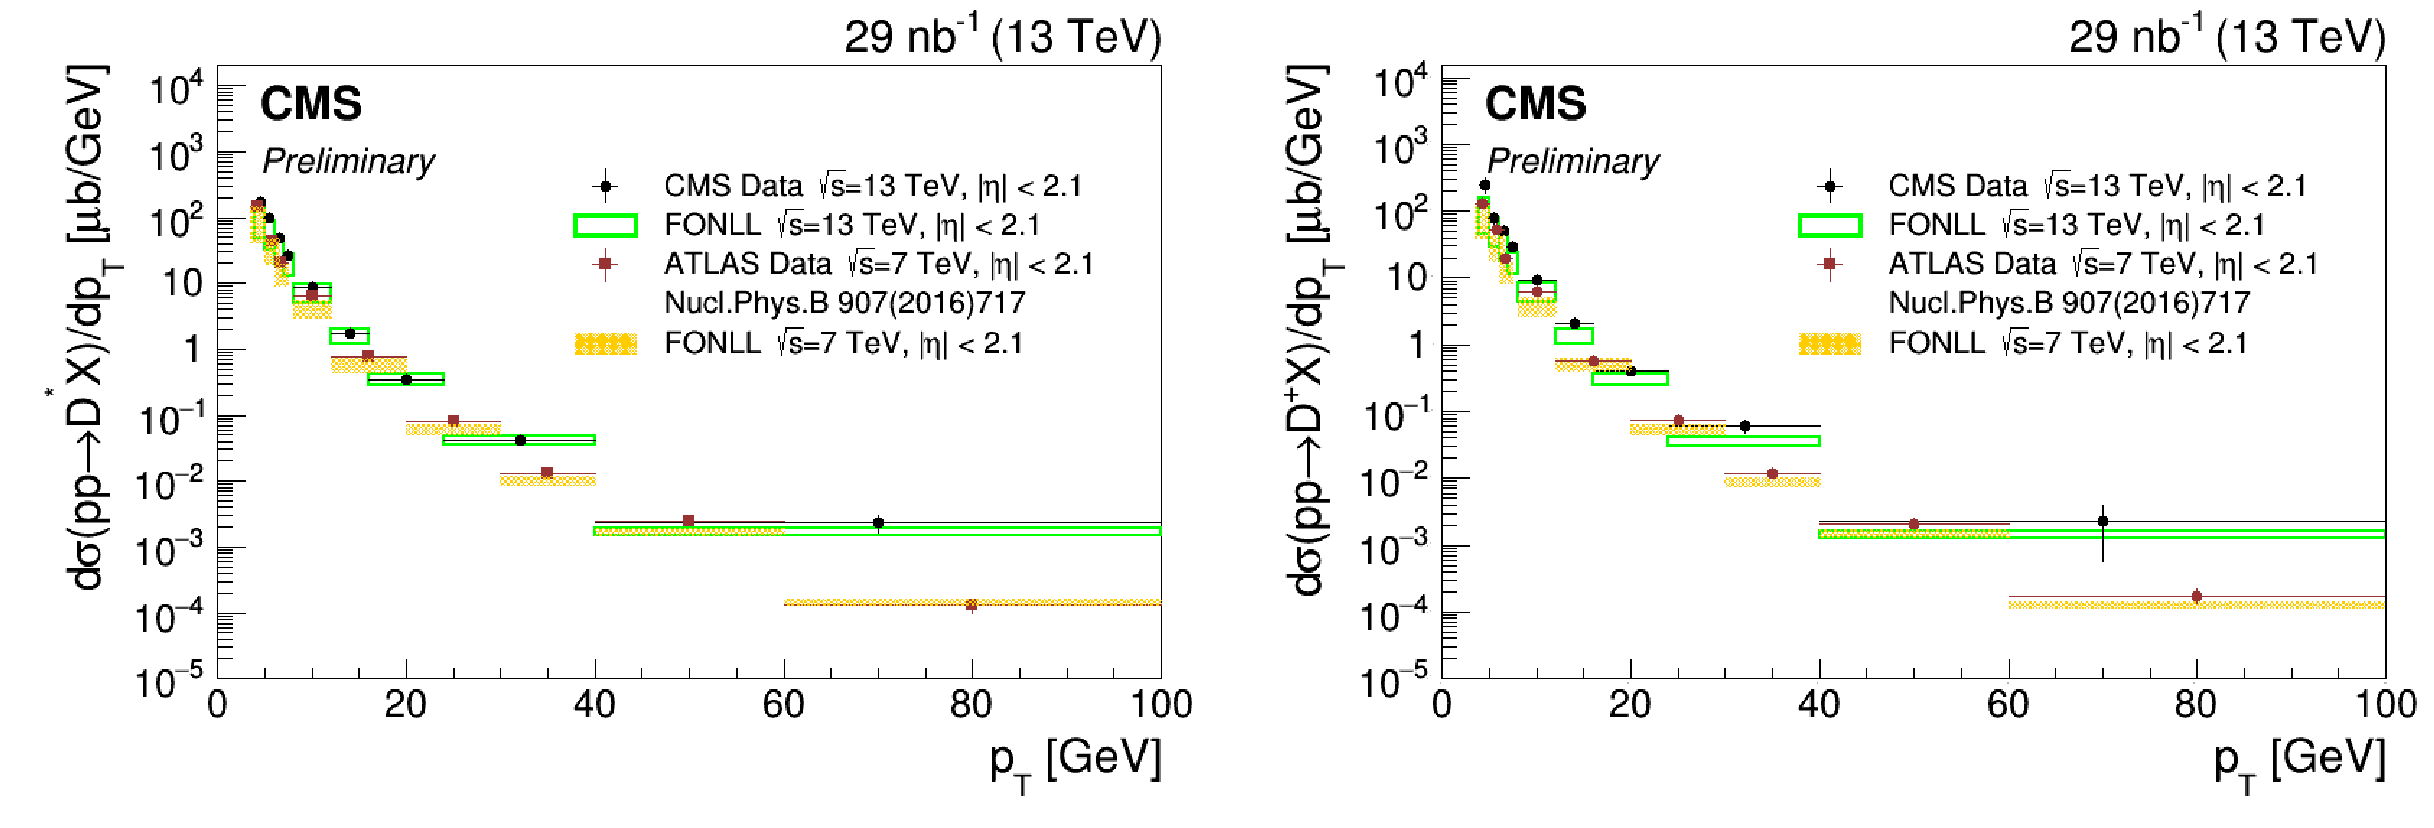
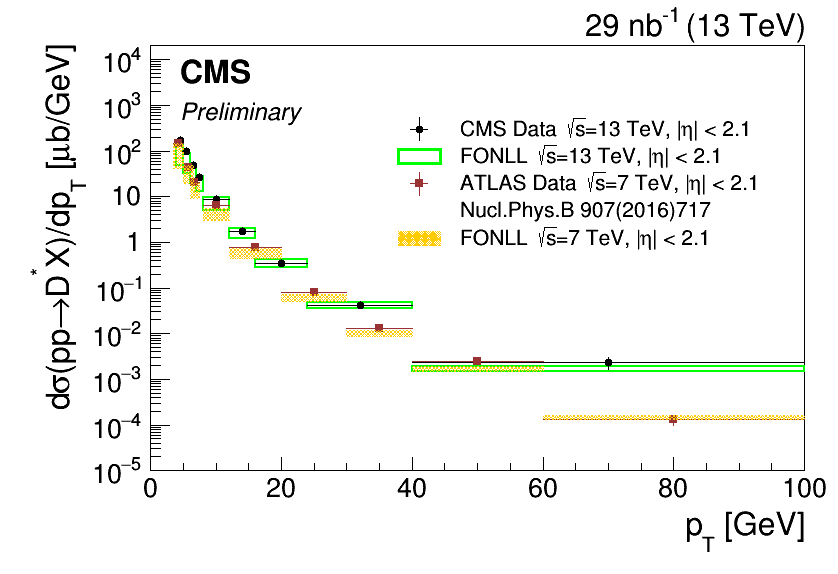
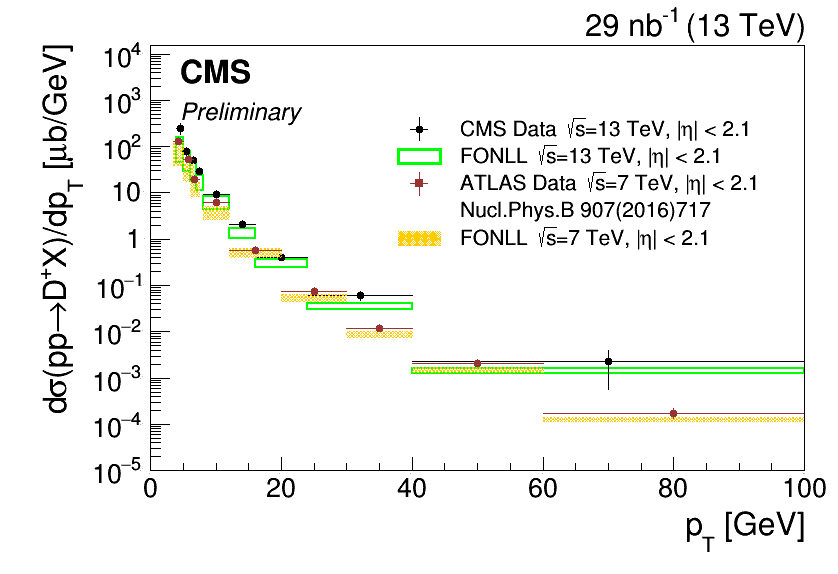
Figure 7:
Differential cross section $\mathrm{d}\sigma /\mathrm{d}p_{\mathrm{T}}$ for the $\mathrm{D}^{*+}$ (left) and ${\mathrm{D^+}}$ (right) mesons, comparing the CMS (circle) and ATLAS (square) data points to the respective FONLL predictions at $\sqrt {s}=$ 13 TeV (empty box) and $\sqrt {s}=$ 7 TeV (filled box). As the ATLAS data, the corresponding FONLL predictions include both prompt and nonprompt charm meson cross section components. |
png |
Figure 7-a:
Differential cross section $\mathrm{d}\sigma /\mathrm{d}p_{\mathrm{T}}$ for the $\mathrm{D}^{*+}$ (left) and ${\mathrm{D^+}}$ (right) mesons, comparing the CMS (circle) and ATLAS (square) data points to the respective FONLL predictions at $\sqrt {s}=$ 13 TeV (empty box) and $\sqrt {s}=$ 7 TeV (filled box). As the ATLAS data, the corresponding FONLL predictions include both prompt and nonprompt charm meson cross section components. |
png |
Figure 7-b:
Differential cross section $\mathrm{d}\sigma /\mathrm{d}p_{\mathrm{T}}$ for the $\mathrm{D}^{*+}$ (left) and ${\mathrm{D^+}}$ (right) mesons, comparing the CMS (circle) and ATLAS (square) data points to the respective FONLL predictions at $\sqrt {s}=$ 13 TeV (empty box) and $\sqrt {s}=$ 7 TeV (filled box). As the ATLAS data, the corresponding FONLL predictions include both prompt and nonprompt charm meson cross section components. |
png pdf |
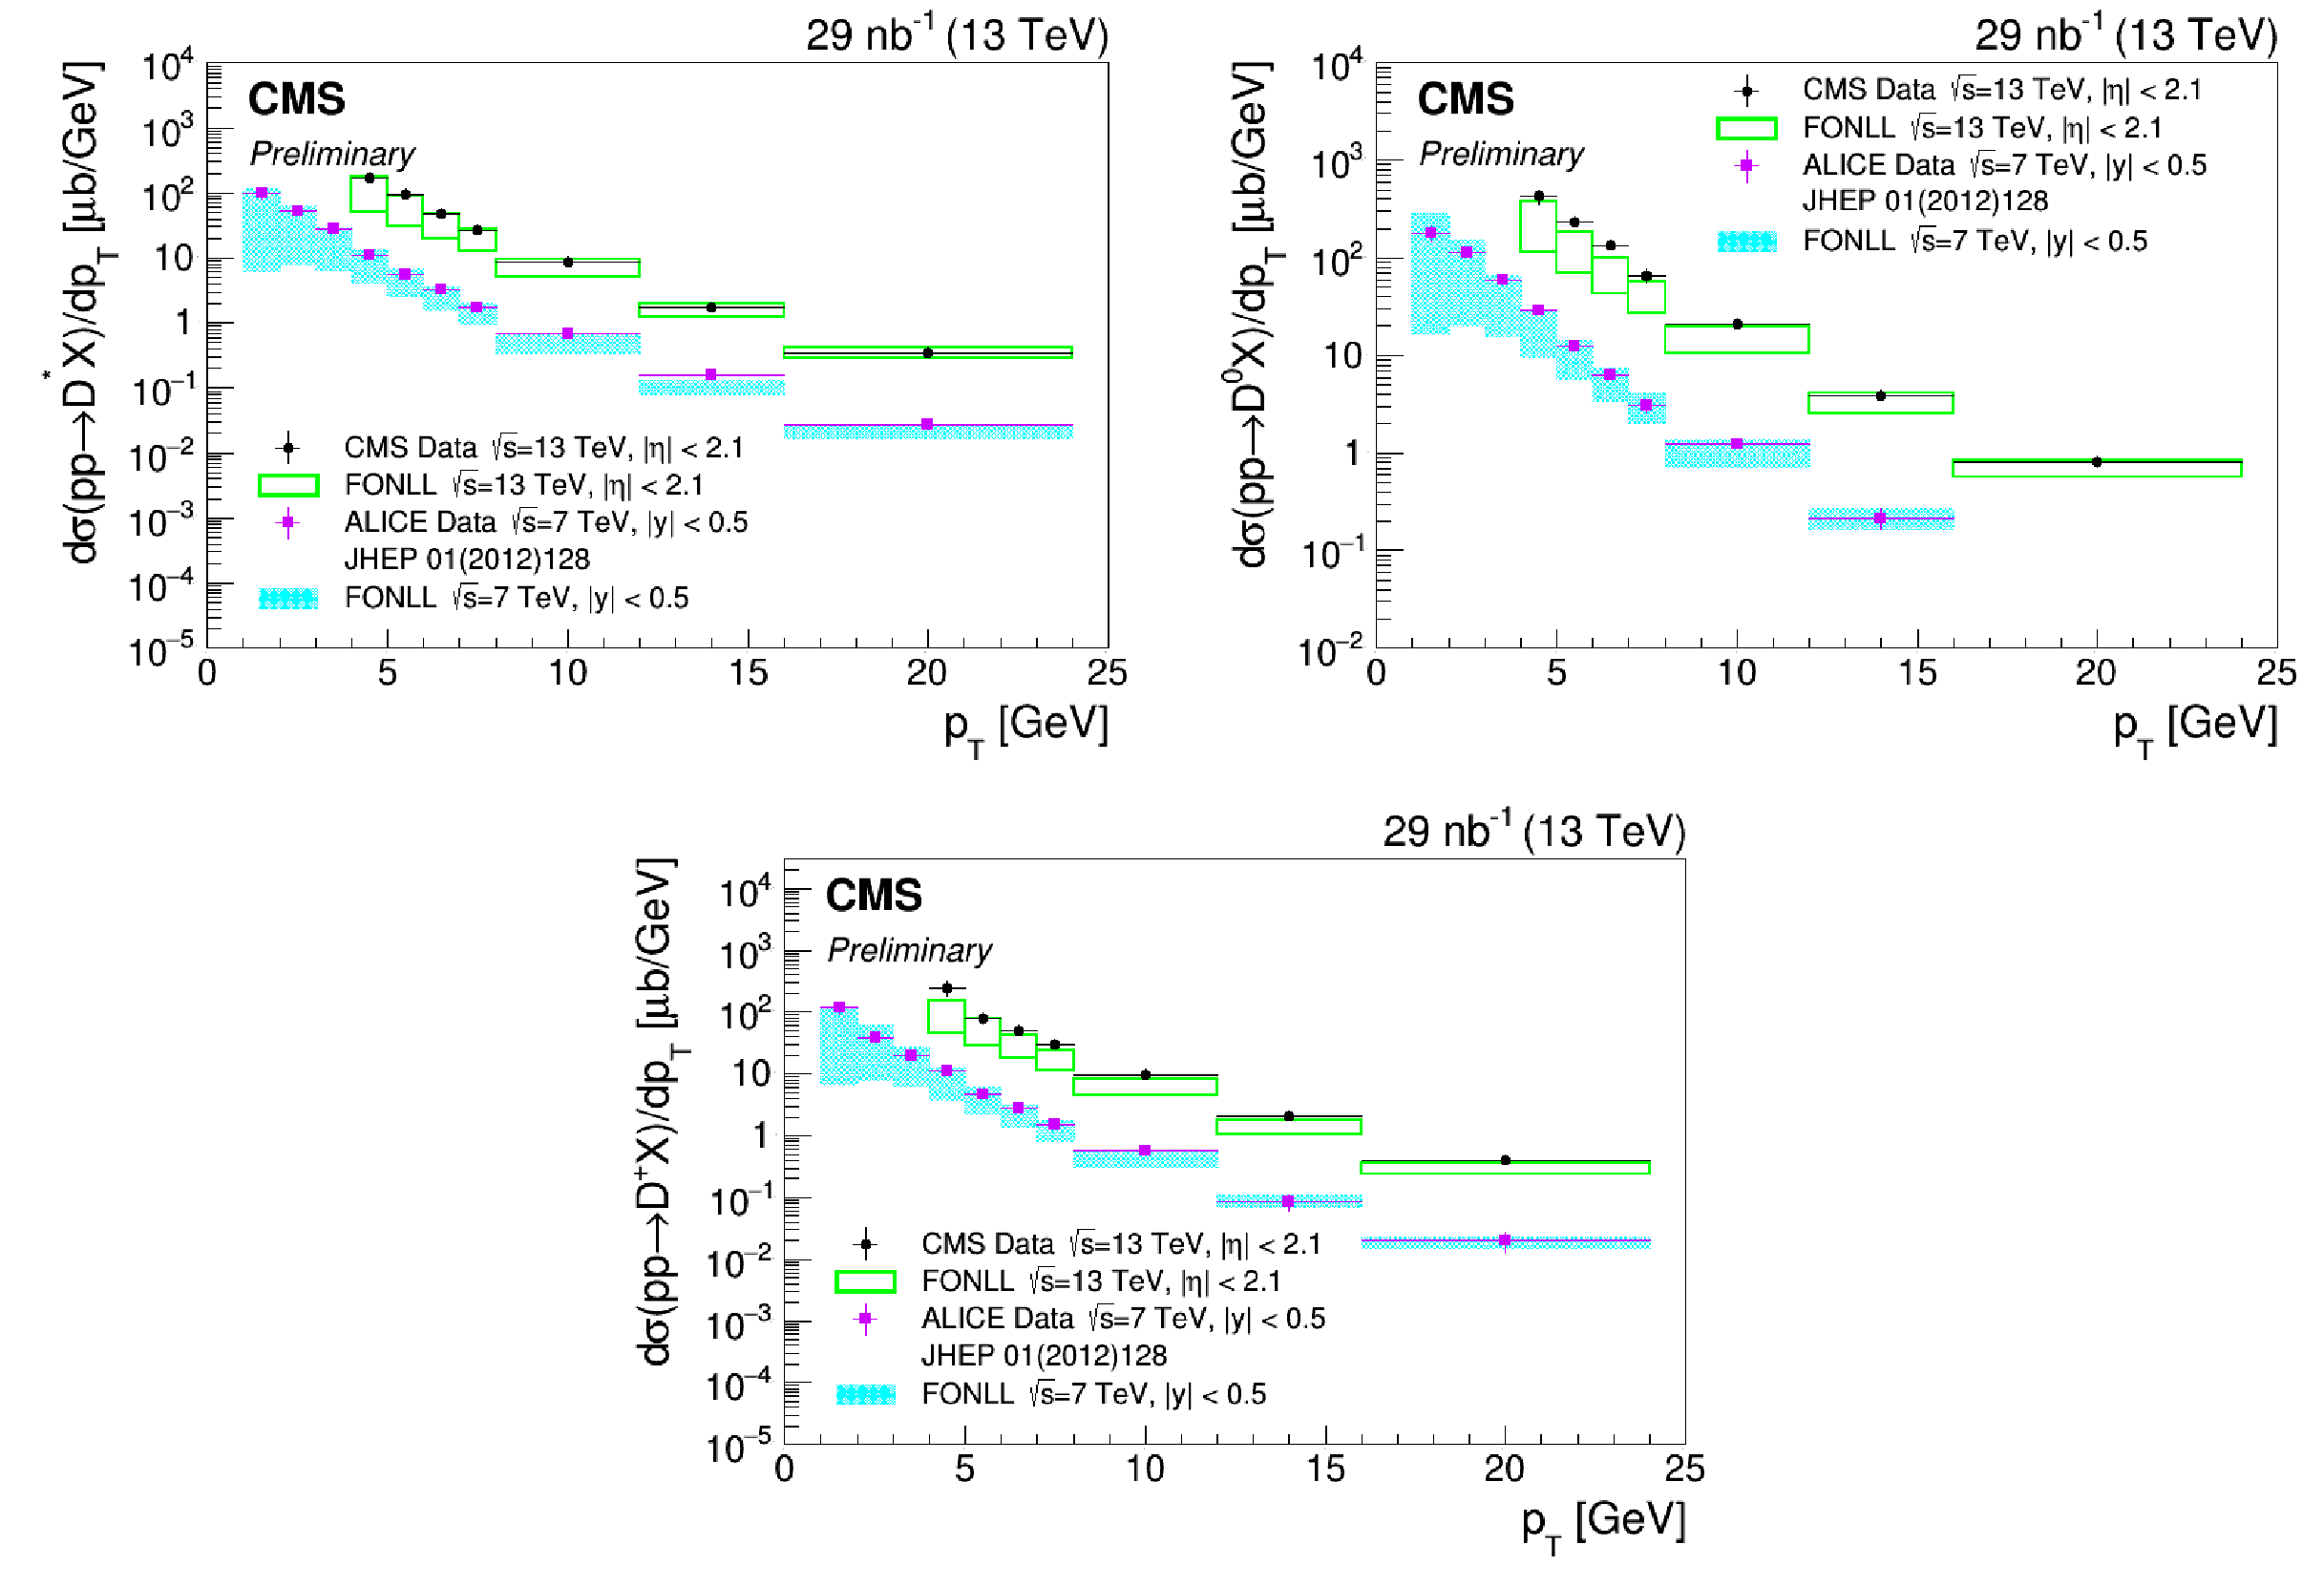
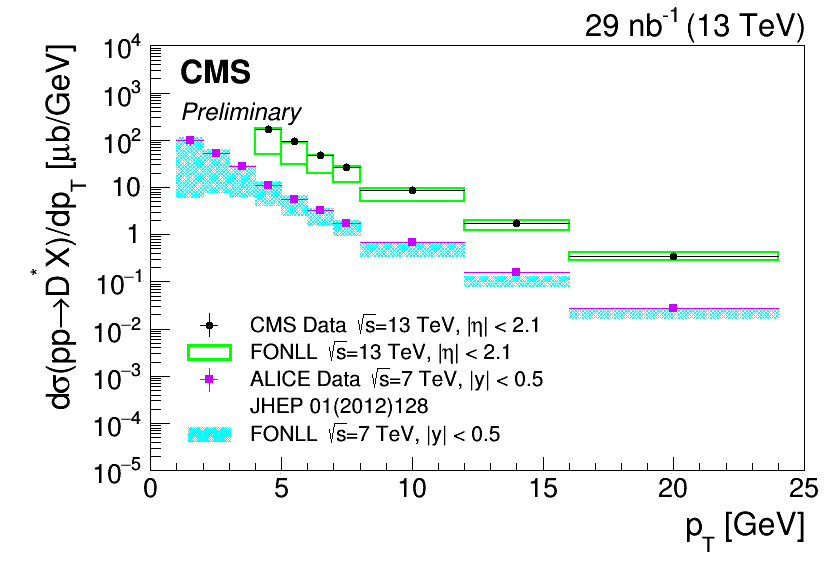
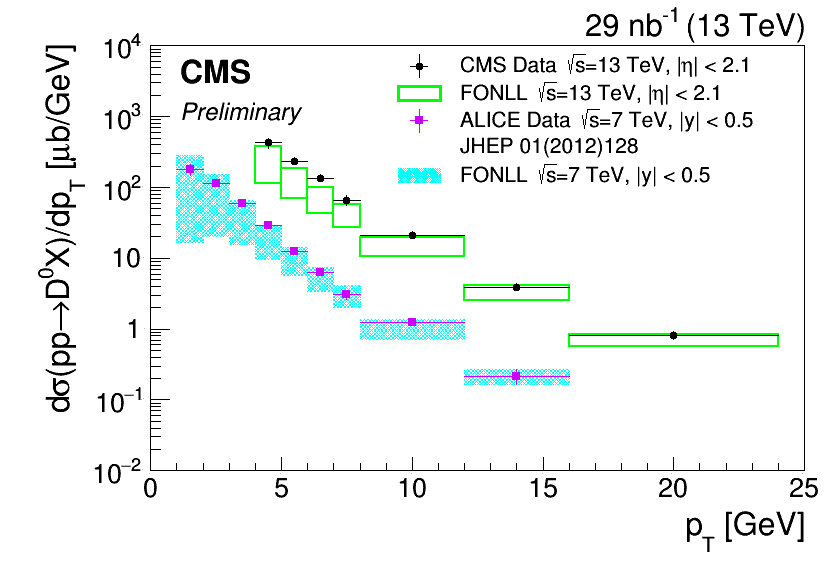
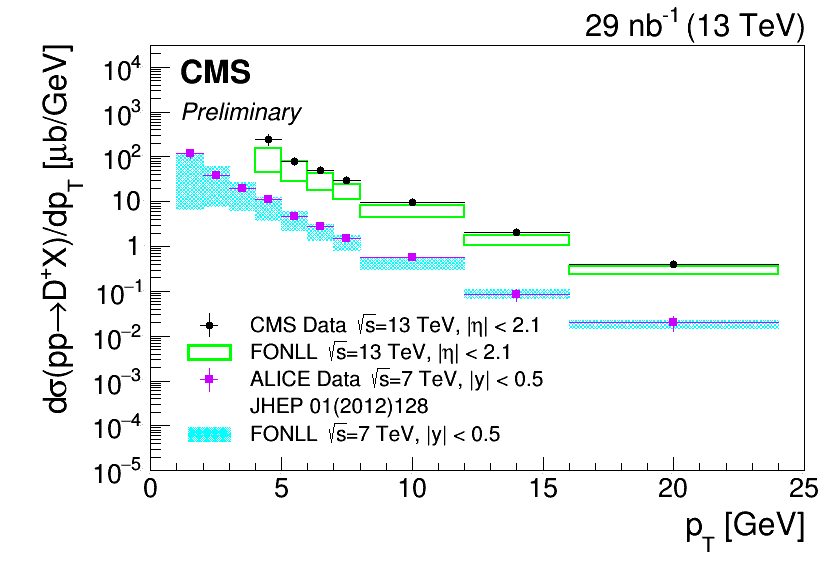
Figure 8:
Differential cross section $\mathrm{d}\sigma /\mathrm{d}p_{\mathrm{T}}$ for the $\mathrm{D}^{*+}$, ${\mathrm{D^0}}$ and ${\mathrm{D^+}}$ mesons, comparing the CMS (circle) and ALICE (square) data points to the respective FONLL predictions at $\sqrt {s}=$ 13 TeV (empty box) and $\sqrt {s}=$ 7 TeV (filled box). The cross section definition by ALICE differs by a factor two from the one by CMS, since in the former the charged conjugates are not included. The same is true for the corresponding FONLL predictions, as well. |
png |
Figure 8-a:
Differential cross section $\mathrm{d}\sigma /\mathrm{d}p_{\mathrm{T}}$ for the $\mathrm{D}^{*+}$, ${\mathrm{D^0}}$ and ${\mathrm{D^+}}$ mesons, comparing the CMS (circle) and ALICE (square) data points to the respective FONLL predictions at $\sqrt {s}=$ 13 TeV (empty box) and $\sqrt {s}=$ 7 TeV (filled box). The cross section definition by ALICE differs by a factor two from the one by CMS, since in the former the charged conjugates are not included. The same is true for the corresponding FONLL predictions, as well. |
png |
Figure 8-b:
Differential cross section $\mathrm{d}\sigma /\mathrm{d}p_{\mathrm{T}}$ for the $\mathrm{D}^{*+}$, ${\mathrm{D^0}}$ and ${\mathrm{D^+}}$ mesons, comparing the CMS (circle) and ALICE (square) data points to the respective FONLL predictions at $\sqrt {s}=$ 13 TeV (empty box) and $\sqrt {s}=$ 7 TeV (filled box). The cross section definition by ALICE differs by a factor two from the one by CMS, since in the former the charged conjugates are not included. The same is true for the corresponding FONLL predictions, as well. |
png |
Figure 8-c:
Differential cross section $\mathrm{d}\sigma /\mathrm{d}p_{\mathrm{T}}$ for the $\mathrm{D}^{*+}$, ${\mathrm{D^0}}$ and ${\mathrm{D^+}}$ mesons, comparing the CMS (circle) and ALICE (square) data points to the respective FONLL predictions at $\sqrt {s}=$ 13 TeV (empty box) and $\sqrt {s}=$ 7 TeV (filled box). The cross section definition by ALICE differs by a factor two from the one by CMS, since in the former the charged conjugates are not included. The same is true for the corresponding FONLL predictions, as well. |
png pdf |
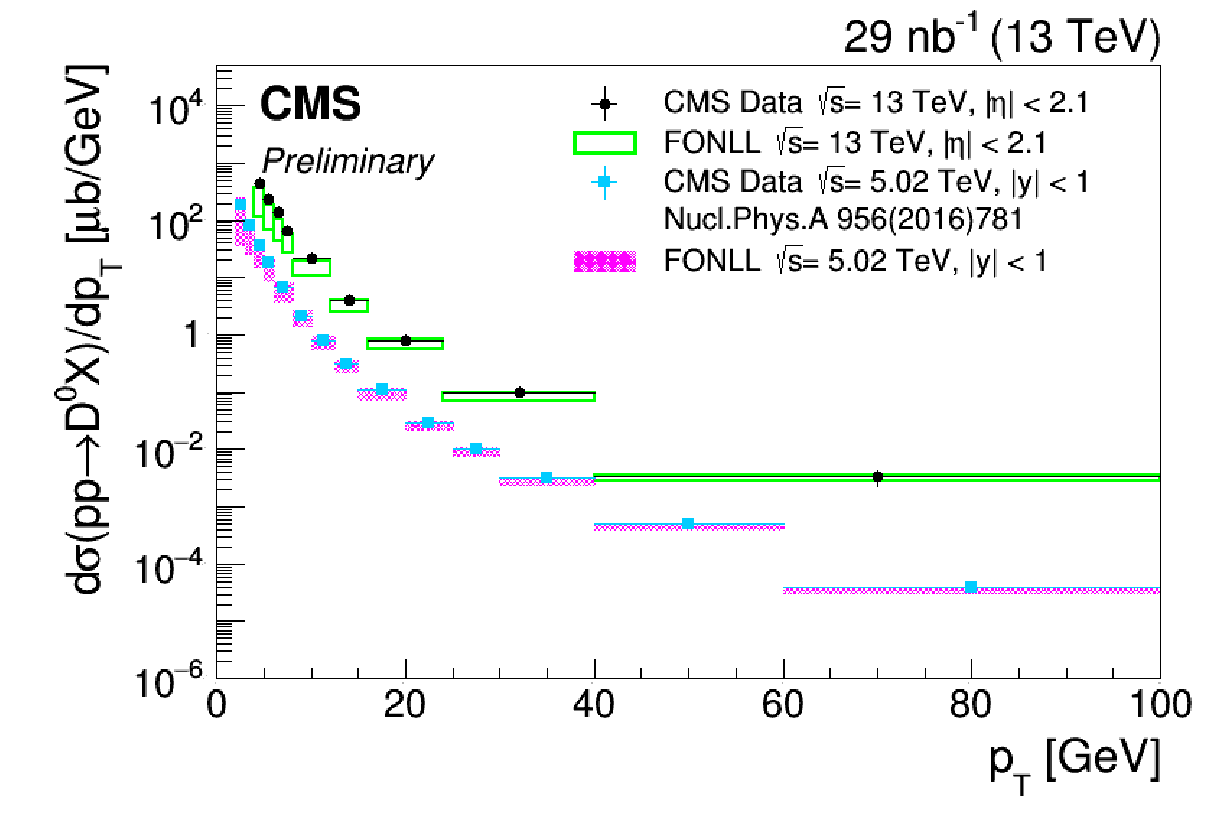
Figure 9:
Differential cross section $\mathrm{d}\sigma /\mathrm{d}p_{\mathrm{T}}$ for the ${\mathrm{D^0}}$ meson, comparing the CMS measurement at $\sqrt {s}=$ 13 TeV (circle) and 5.02 TeV (square) to the respective FONLL predictions at $\sqrt {s}=$ 13 TeV (empty box) and $\sqrt {s}=$ 5.02 TeV (filled box). |
png pdf |
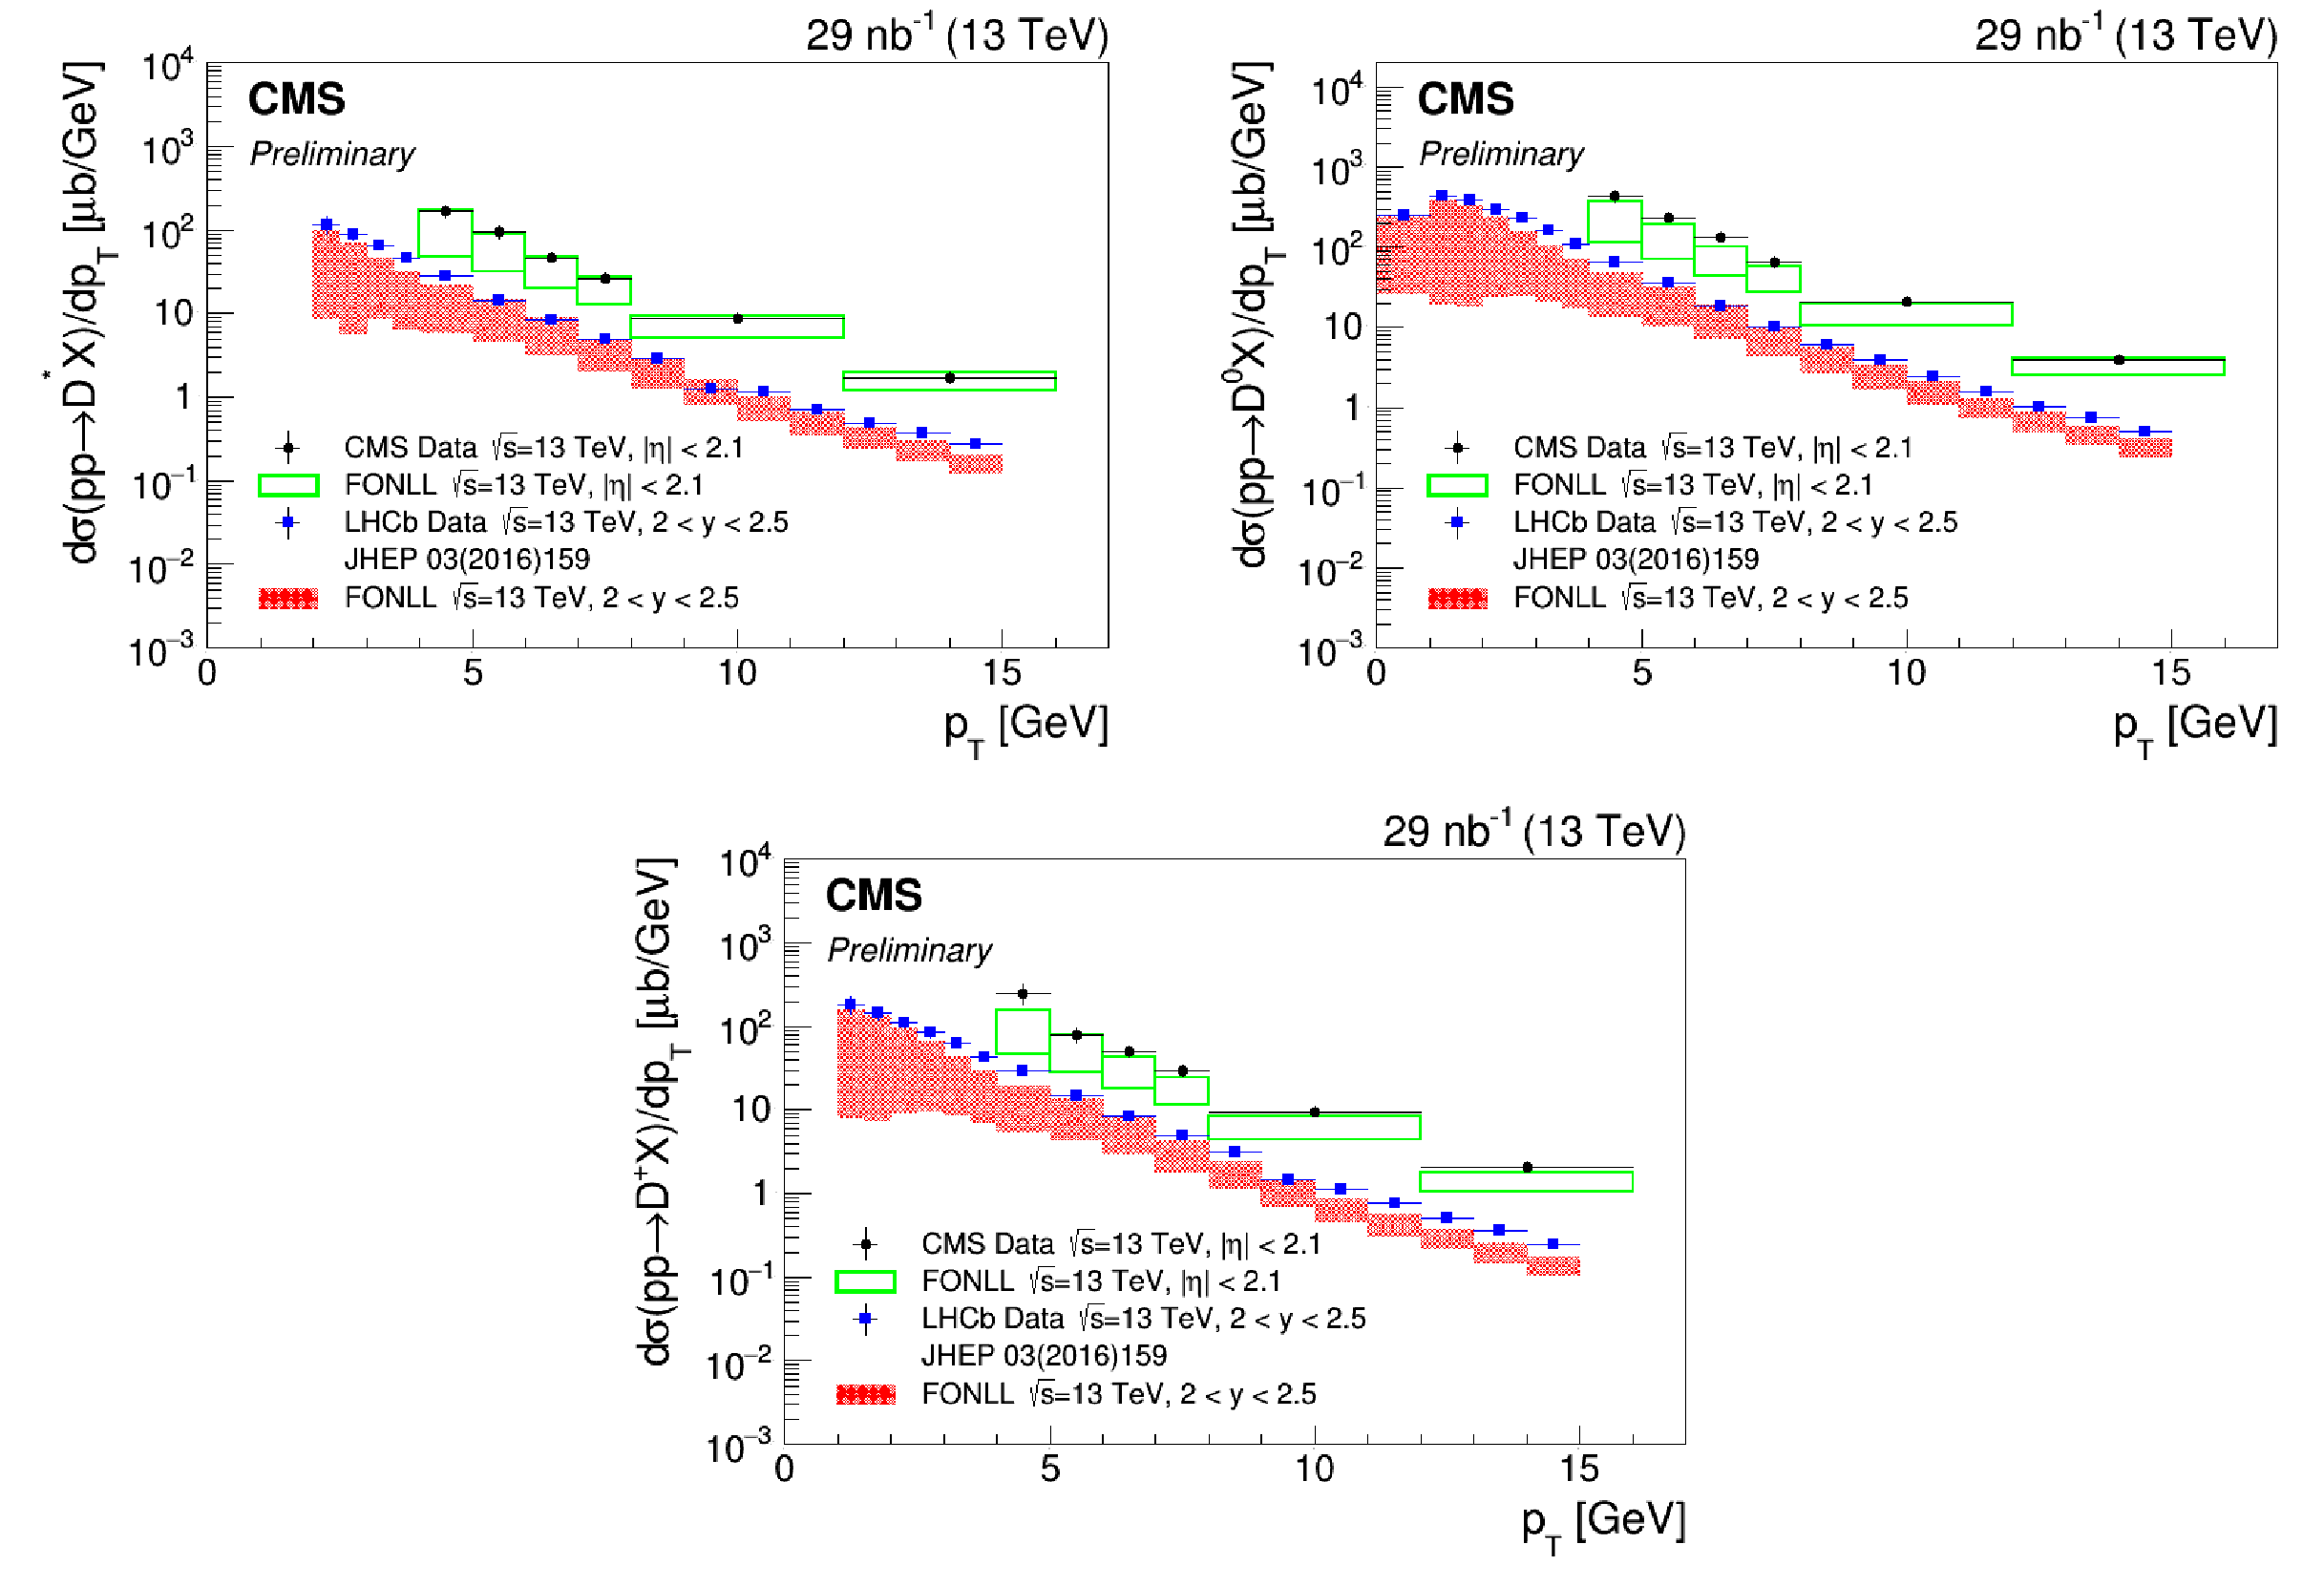
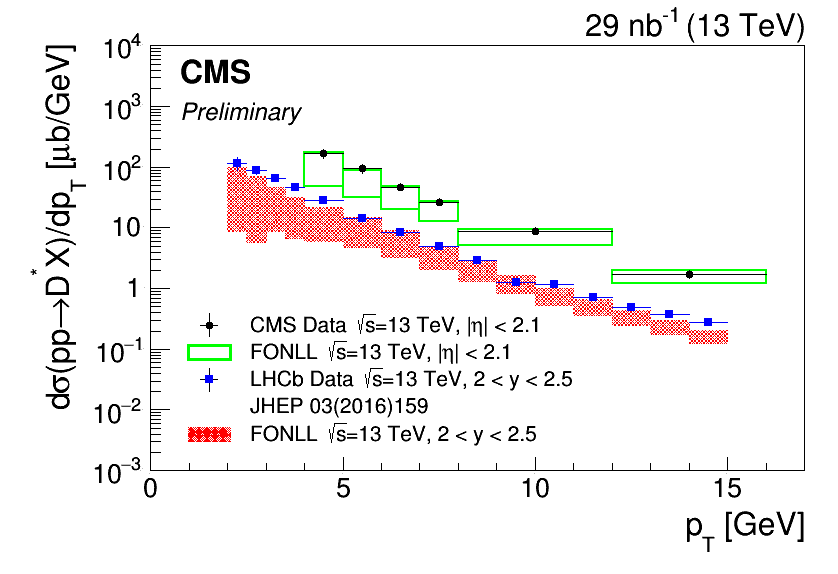
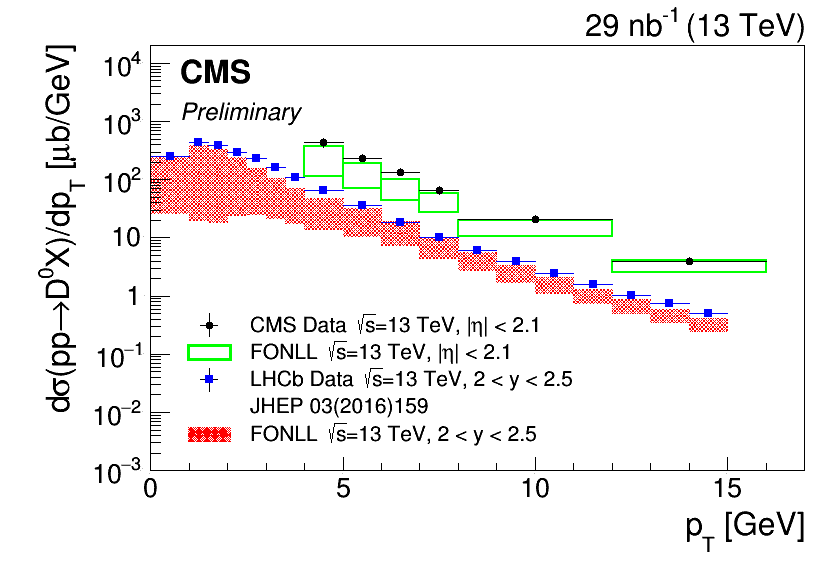
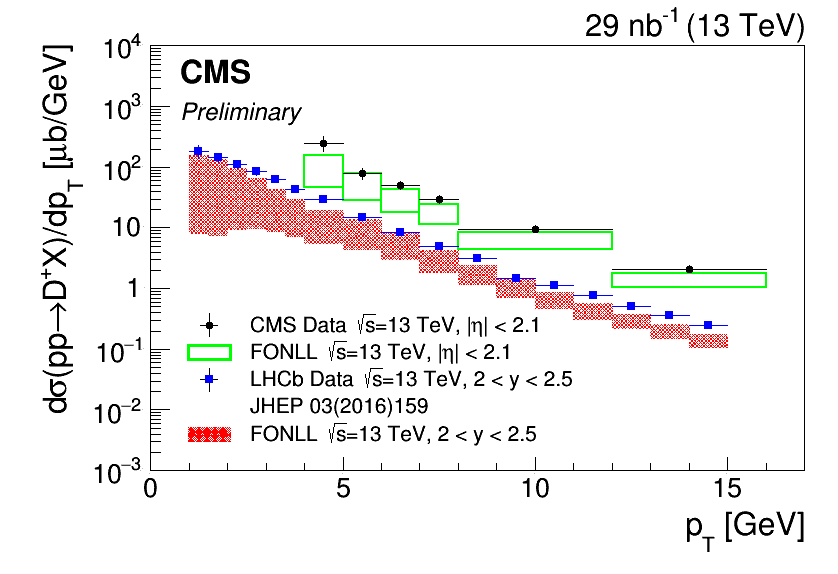
Figure 10:
Differential cross section $\mathrm{d}\sigma /d {p_{\mathrm {T}}} $ for the $\mathrm{D} ^{*+}$, ${\mathrm{D^0}}$ and ${\mathrm{D^+}}$ mesons comparing the CMS measurements at $\sqrt {s}=$ 13 TeV (circle) and the LHCb points (square) in the region 2 $ < y < $ 2.5 at $\sqrt {s}=$ 13 TeV to the respective FONLL predictions (empty and filled box). |
png |
Figure 10-a:
Differential cross section $\mathrm{d}\sigma /d {p_{\mathrm {T}}} $ for the $\mathrm{D} ^{*+}$, ${\mathrm{D^0}}$ and ${\mathrm{D^+}}$ mesons comparing the CMS measurements at $\sqrt {s}=$ 13 TeV (circle) and the LHCb points (square) in the region 2 $ < y < $ 2.5 at $\sqrt {s}=$ 13 TeV to the respective FONLL predictions (empty and filled box). |
png |
Figure 10-b:
Differential cross section $\mathrm{d}\sigma /d {p_{\mathrm {T}}} $ for the $\mathrm{D} ^{*+}$, ${\mathrm{D^0}}$ and ${\mathrm{D^+}}$ mesons comparing the CMS measurements at $\sqrt {s}=$ 13 TeV (circle) and the LHCb points (square) in the region 2 $ < y < $ 2.5 at $\sqrt {s}=$ 13 TeV to the respective FONLL predictions (empty and filled box). |
png |
Figure 10-c:
Differential cross section $\mathrm{d}\sigma /d {p_{\mathrm {T}}} $ for the $\mathrm{D} ^{*+}$, ${\mathrm{D^0}}$ and ${\mathrm{D^+}}$ mesons comparing the CMS measurements at $\sqrt {s}=$ 13 TeV (circle) and the LHCb points (square) in the region 2 $ < y < $ 2.5 at $\sqrt {s}=$ 13 TeV to the respective FONLL predictions (empty and filled box). |
| Tables | |
png pdf |
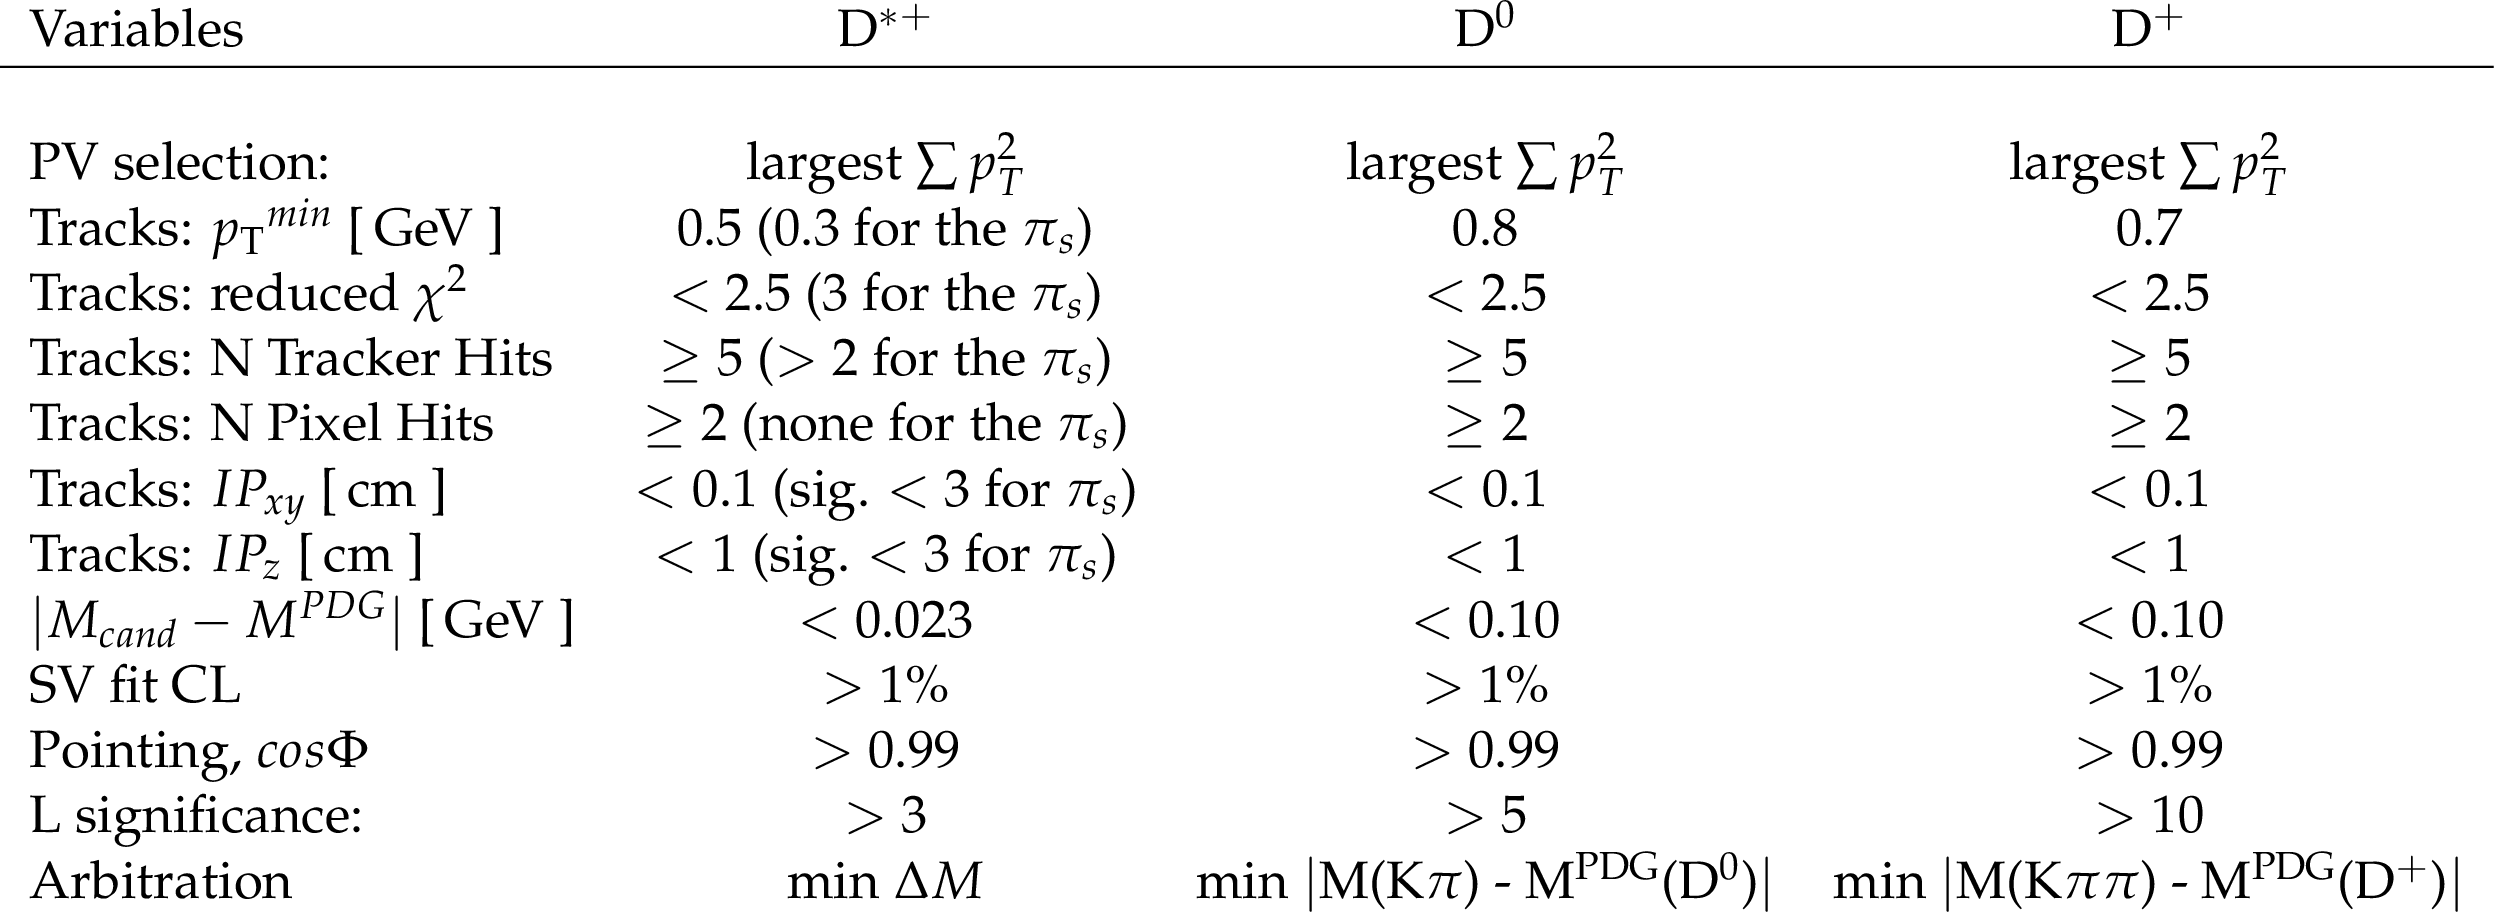
Table 1:
The values of the selection requirements for each charm meson. |
png pdf |
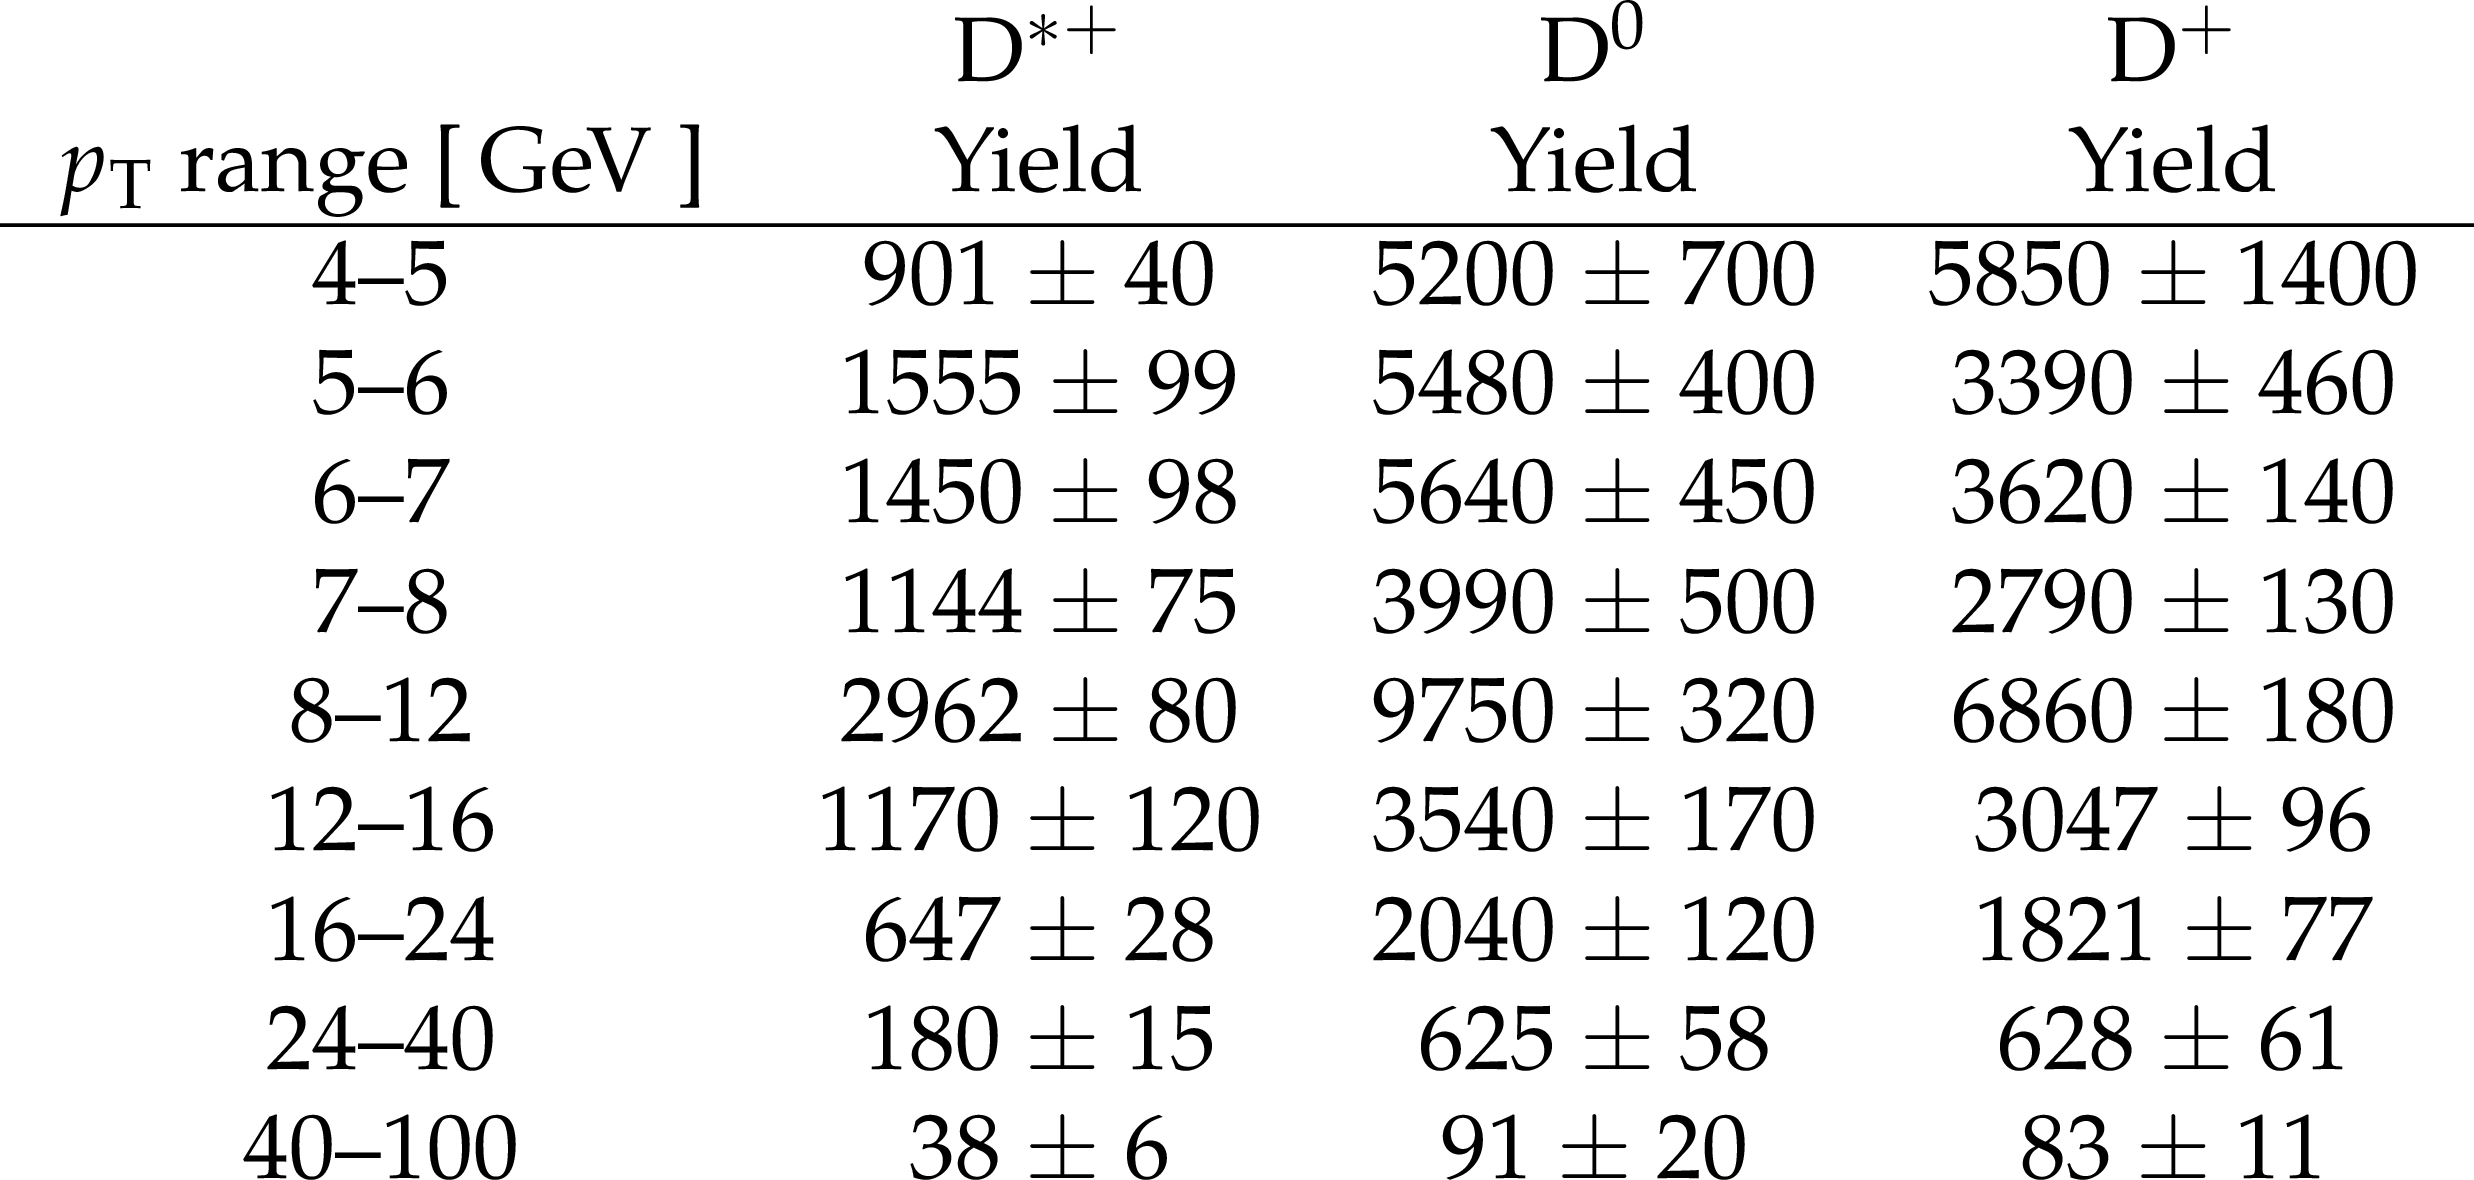
Table 2:
The signal yields in data and the statistical uncertainties for $\mathrm{D} ^{*+}$, ${\mathrm{D^0}}$, and ${\mathrm{D^+}}$ mesons in ${p_{\mathrm {T}}}$ bins for $|\eta | < $ 2.1. |
png pdf |
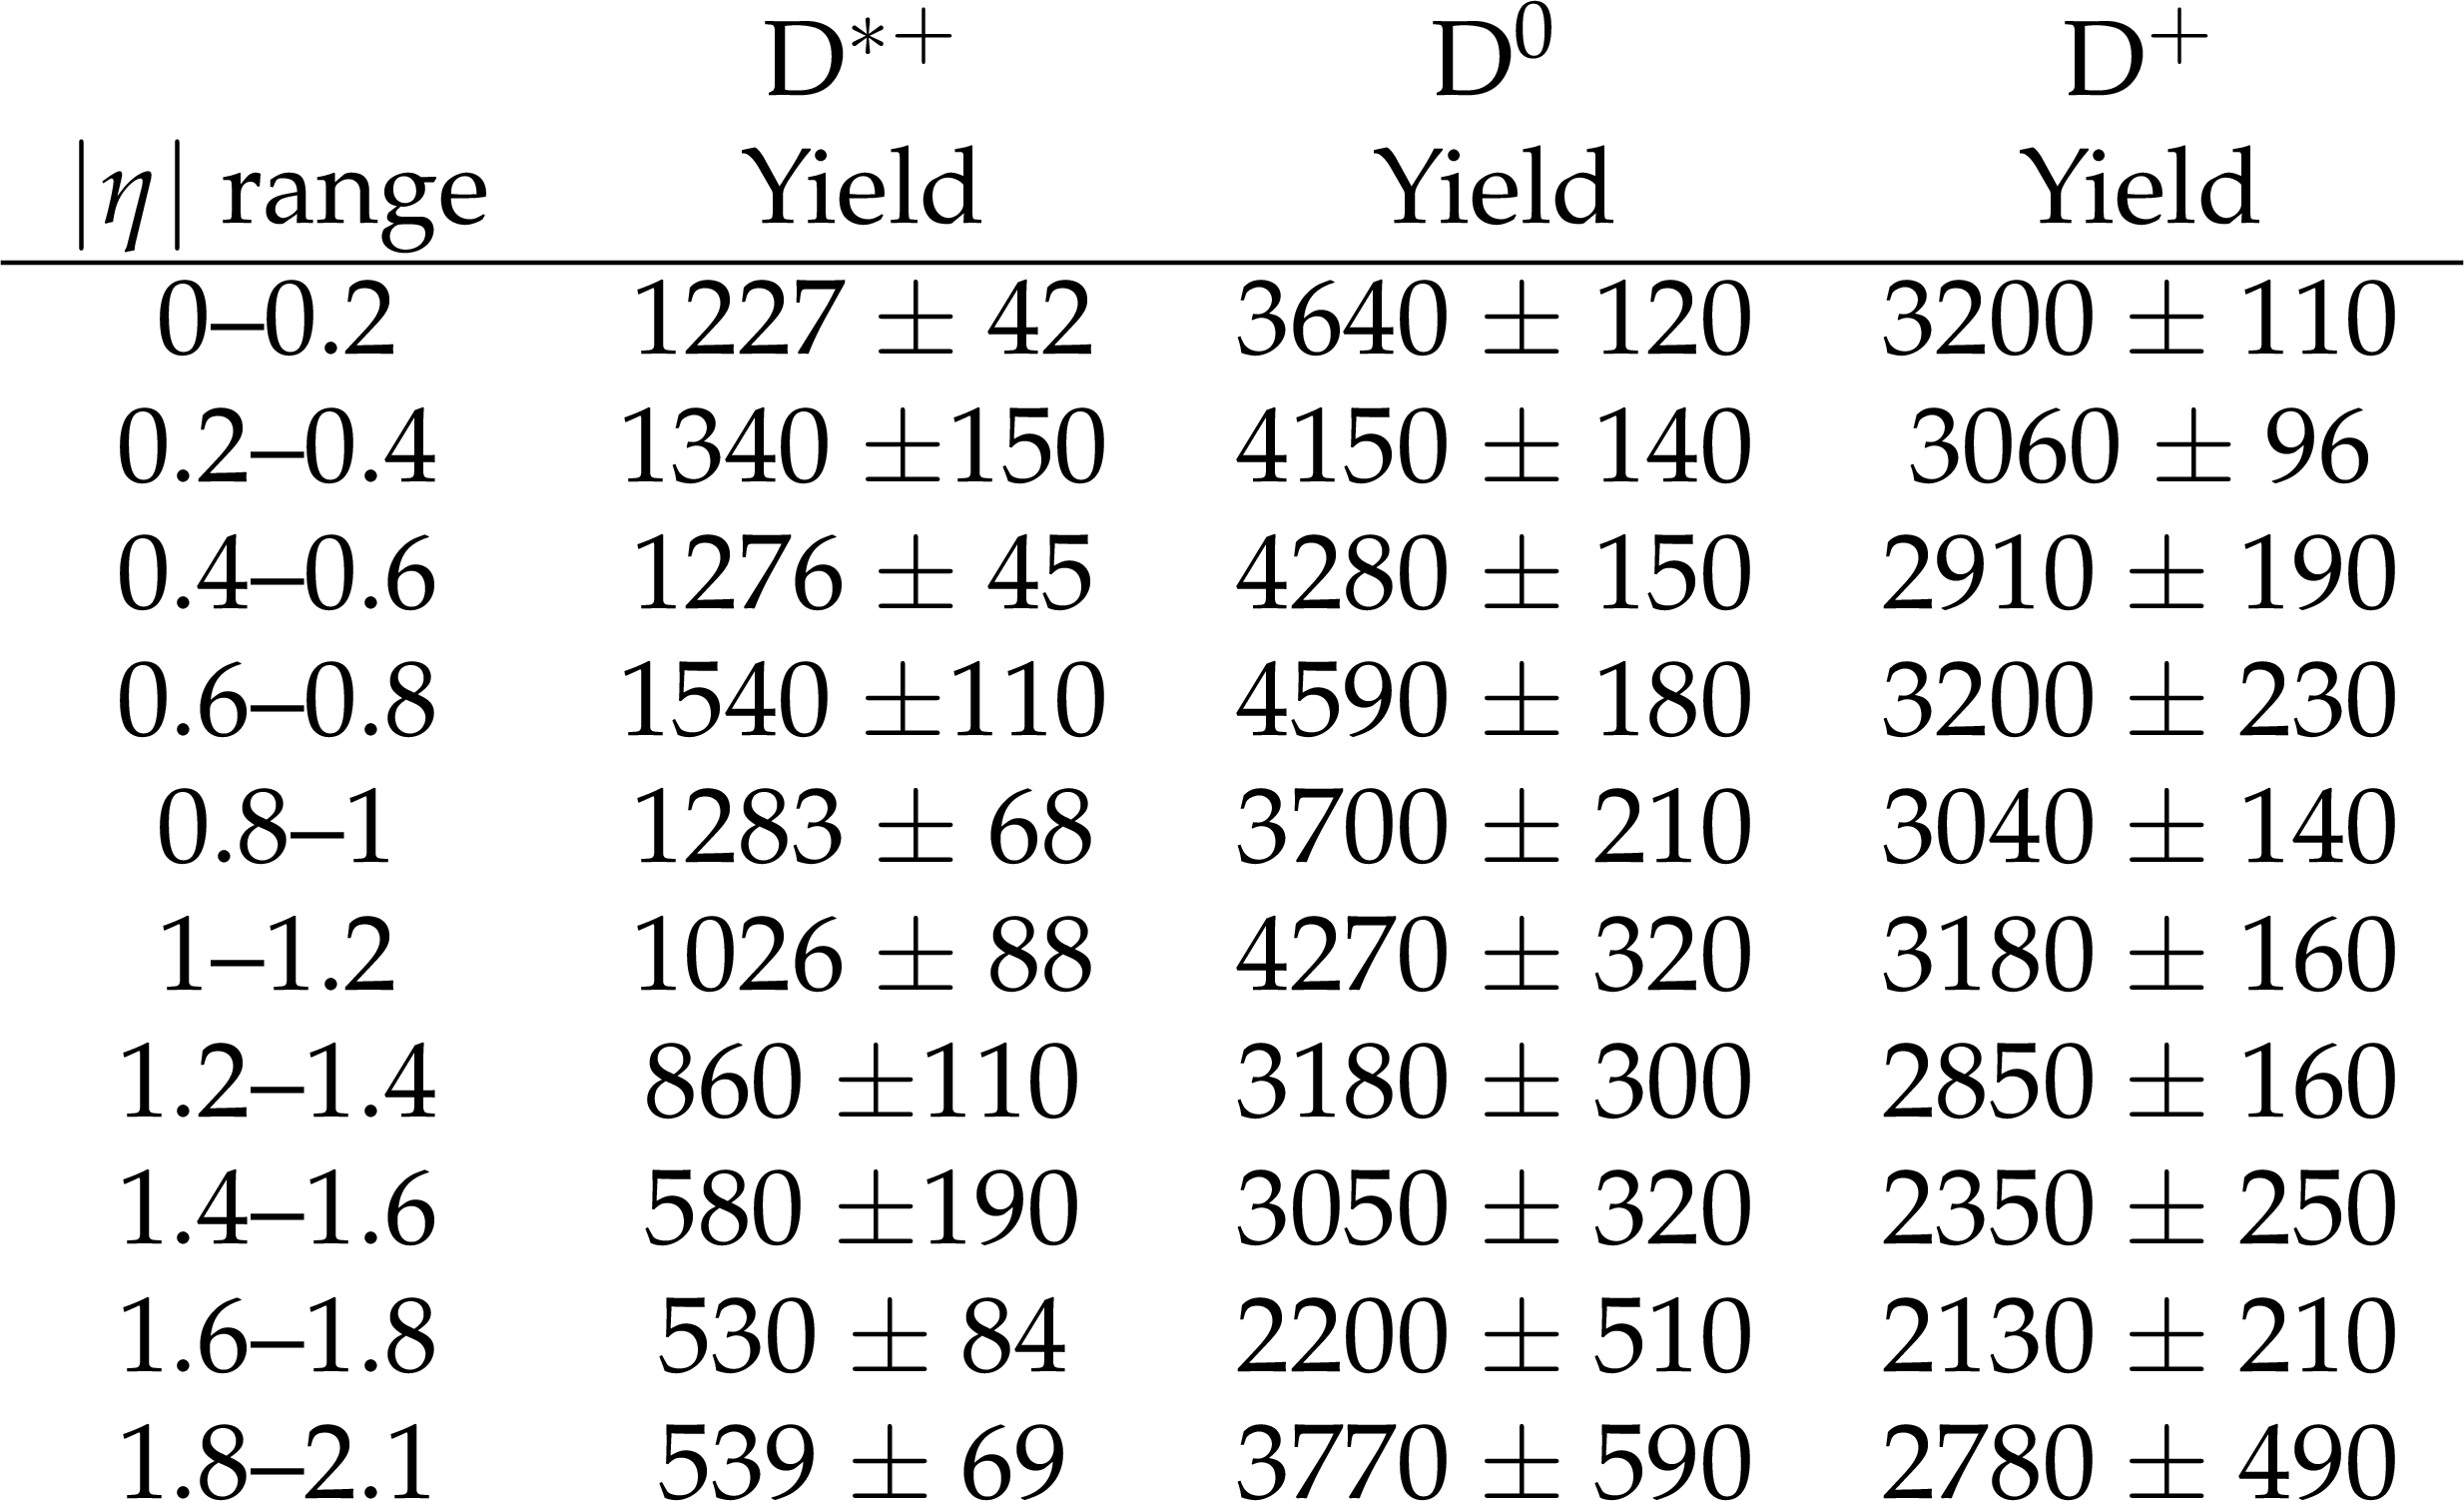
Table 3:
The signal yields in data and the statistical uncertainties for $\mathrm{D} ^{*+}$, ${\mathrm{D^0}}$, and ${\mathrm{D^+}}$ mesons with 4 $ < {p_{\mathrm {T}}} < $ 100 GeV in $\eta $ bins. |
png pdf |
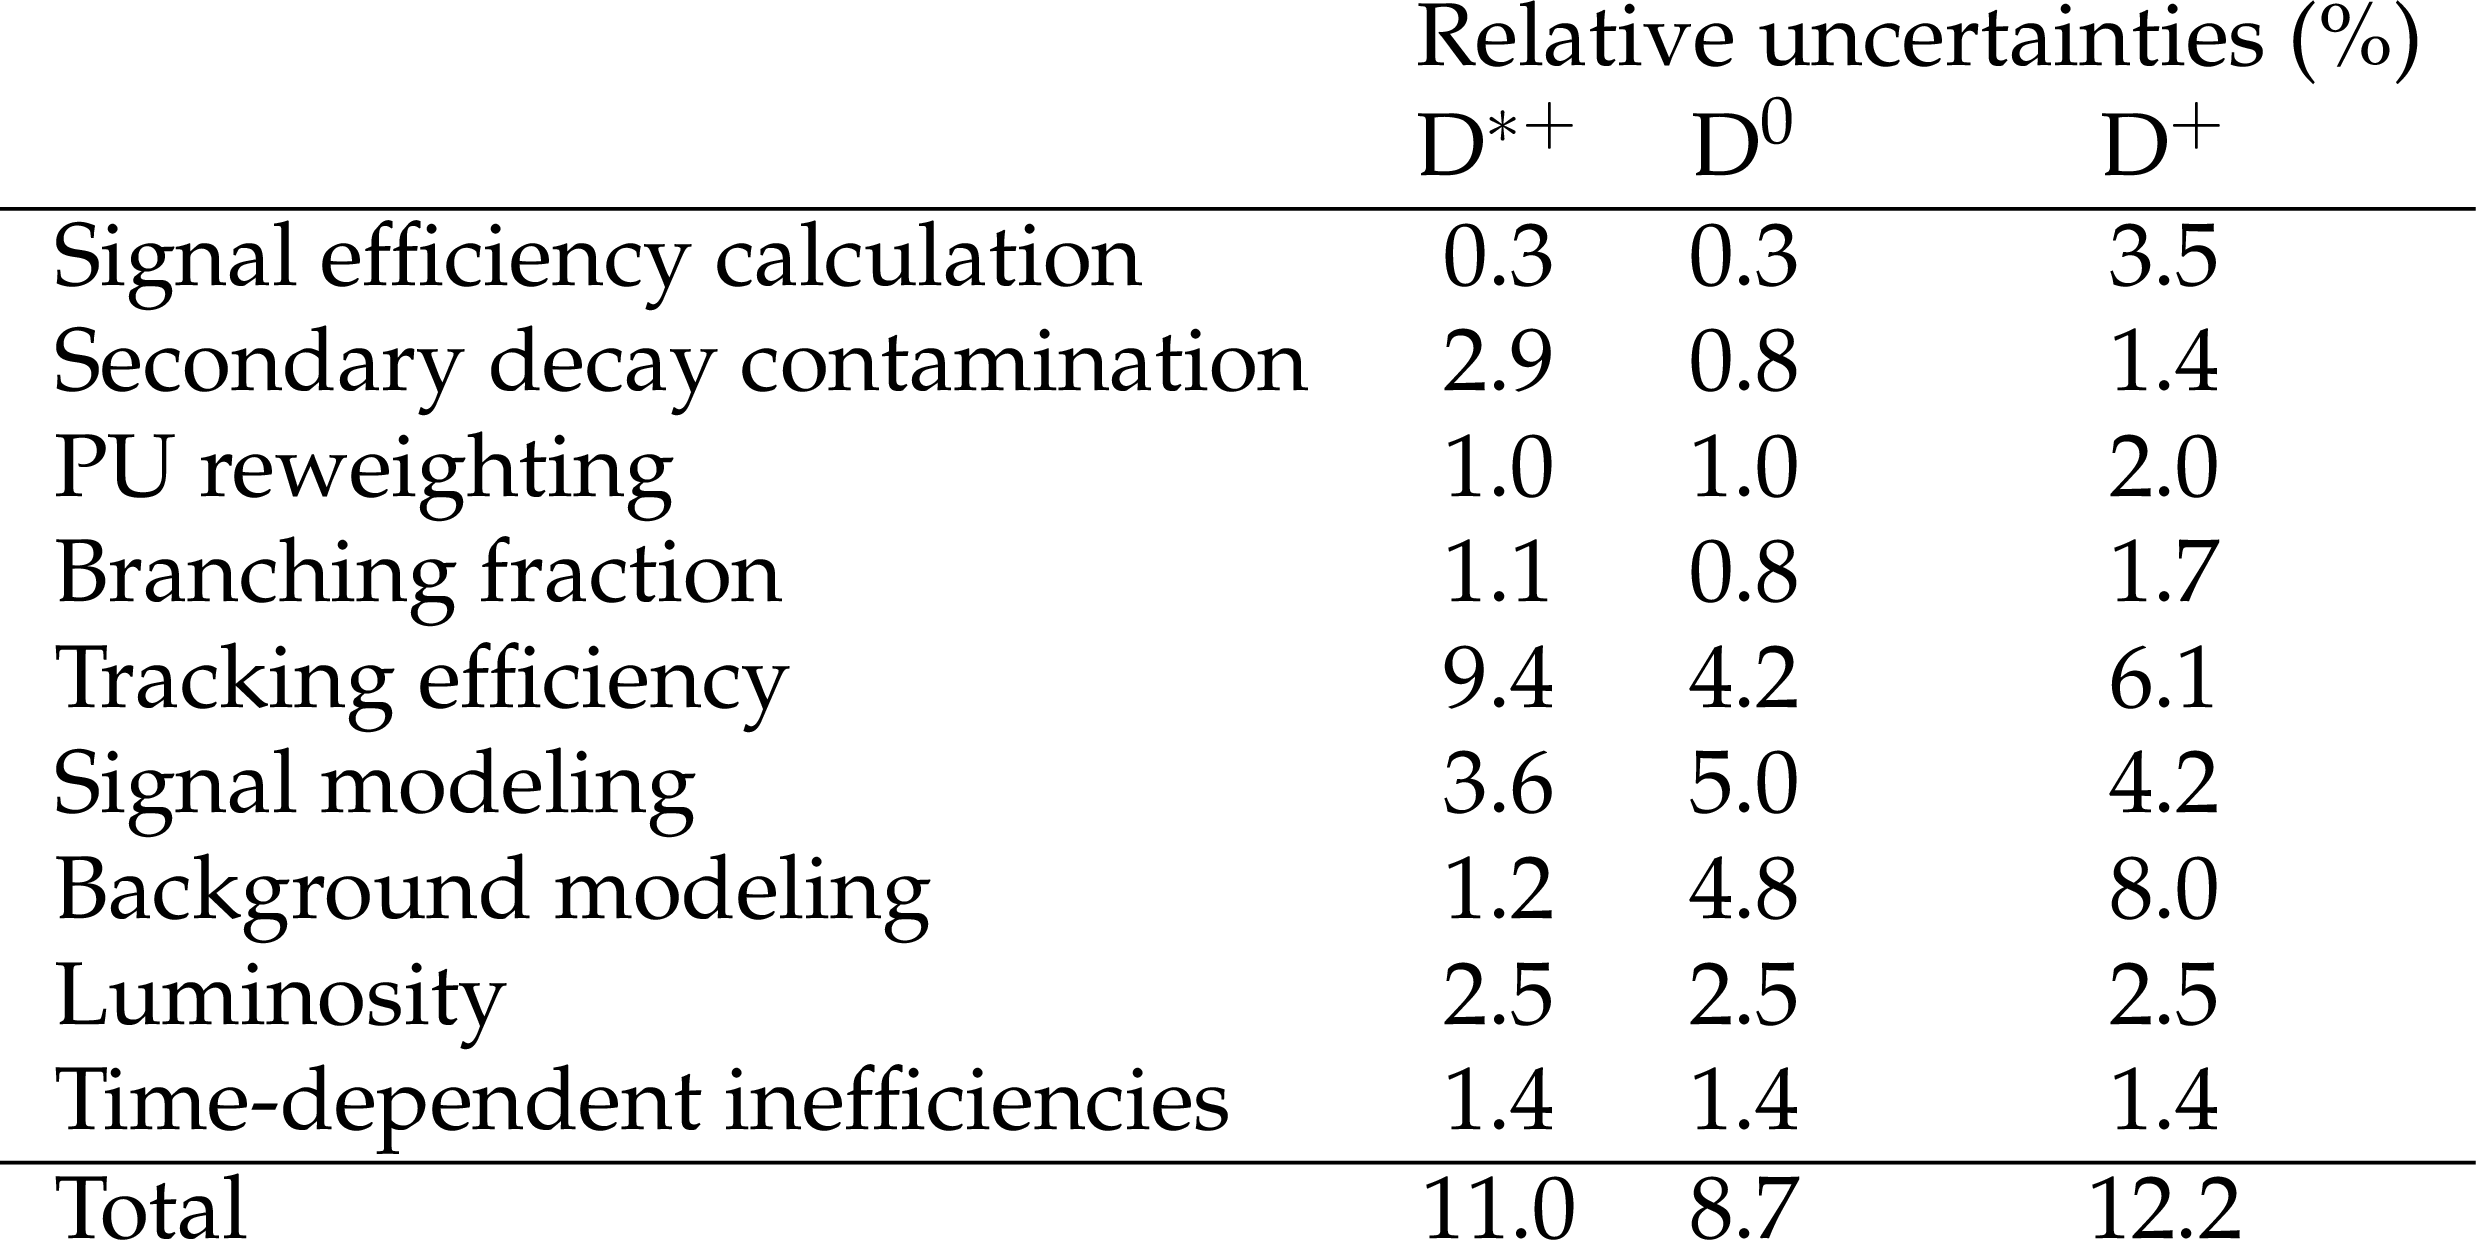
Table 4:
Summary of the systematic uncertainties in the $\mathrm{D} ^{*+}$, ${\mathrm{D^0}}$, and ${\mathrm{D^+}}$ cross sections. The total uncertainty is the sum in quadrature of the individual contributions. |
png pdf |
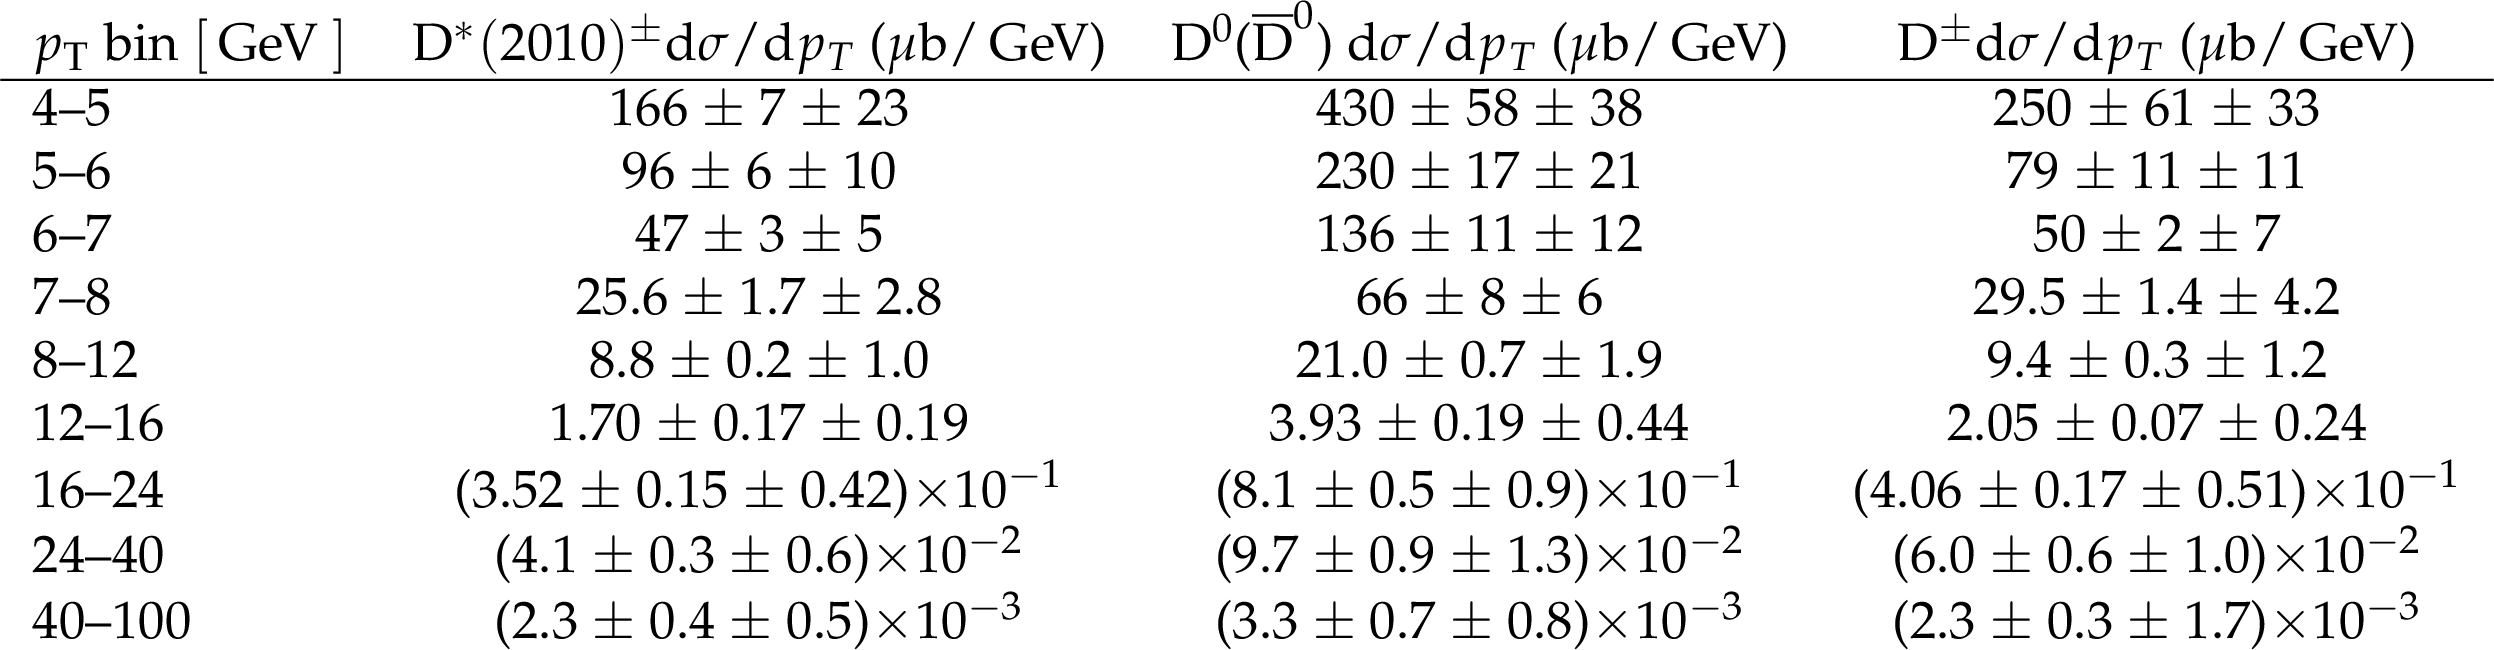
Table 5:
The differential cross sections of ${{\mathrm{D}^{*}(2010)^{\pm}}}$, ${\mathrm{D^0}}$ (${\mathrm{\overline{D}}^0}$), and ${\mathrm{D^{\pm}}}$ in ${p_{\mathrm {T}}}$ bins with $|\eta | < $ 2.1; the first uncertainty is statistical, the second is systematic. |
png pdf |
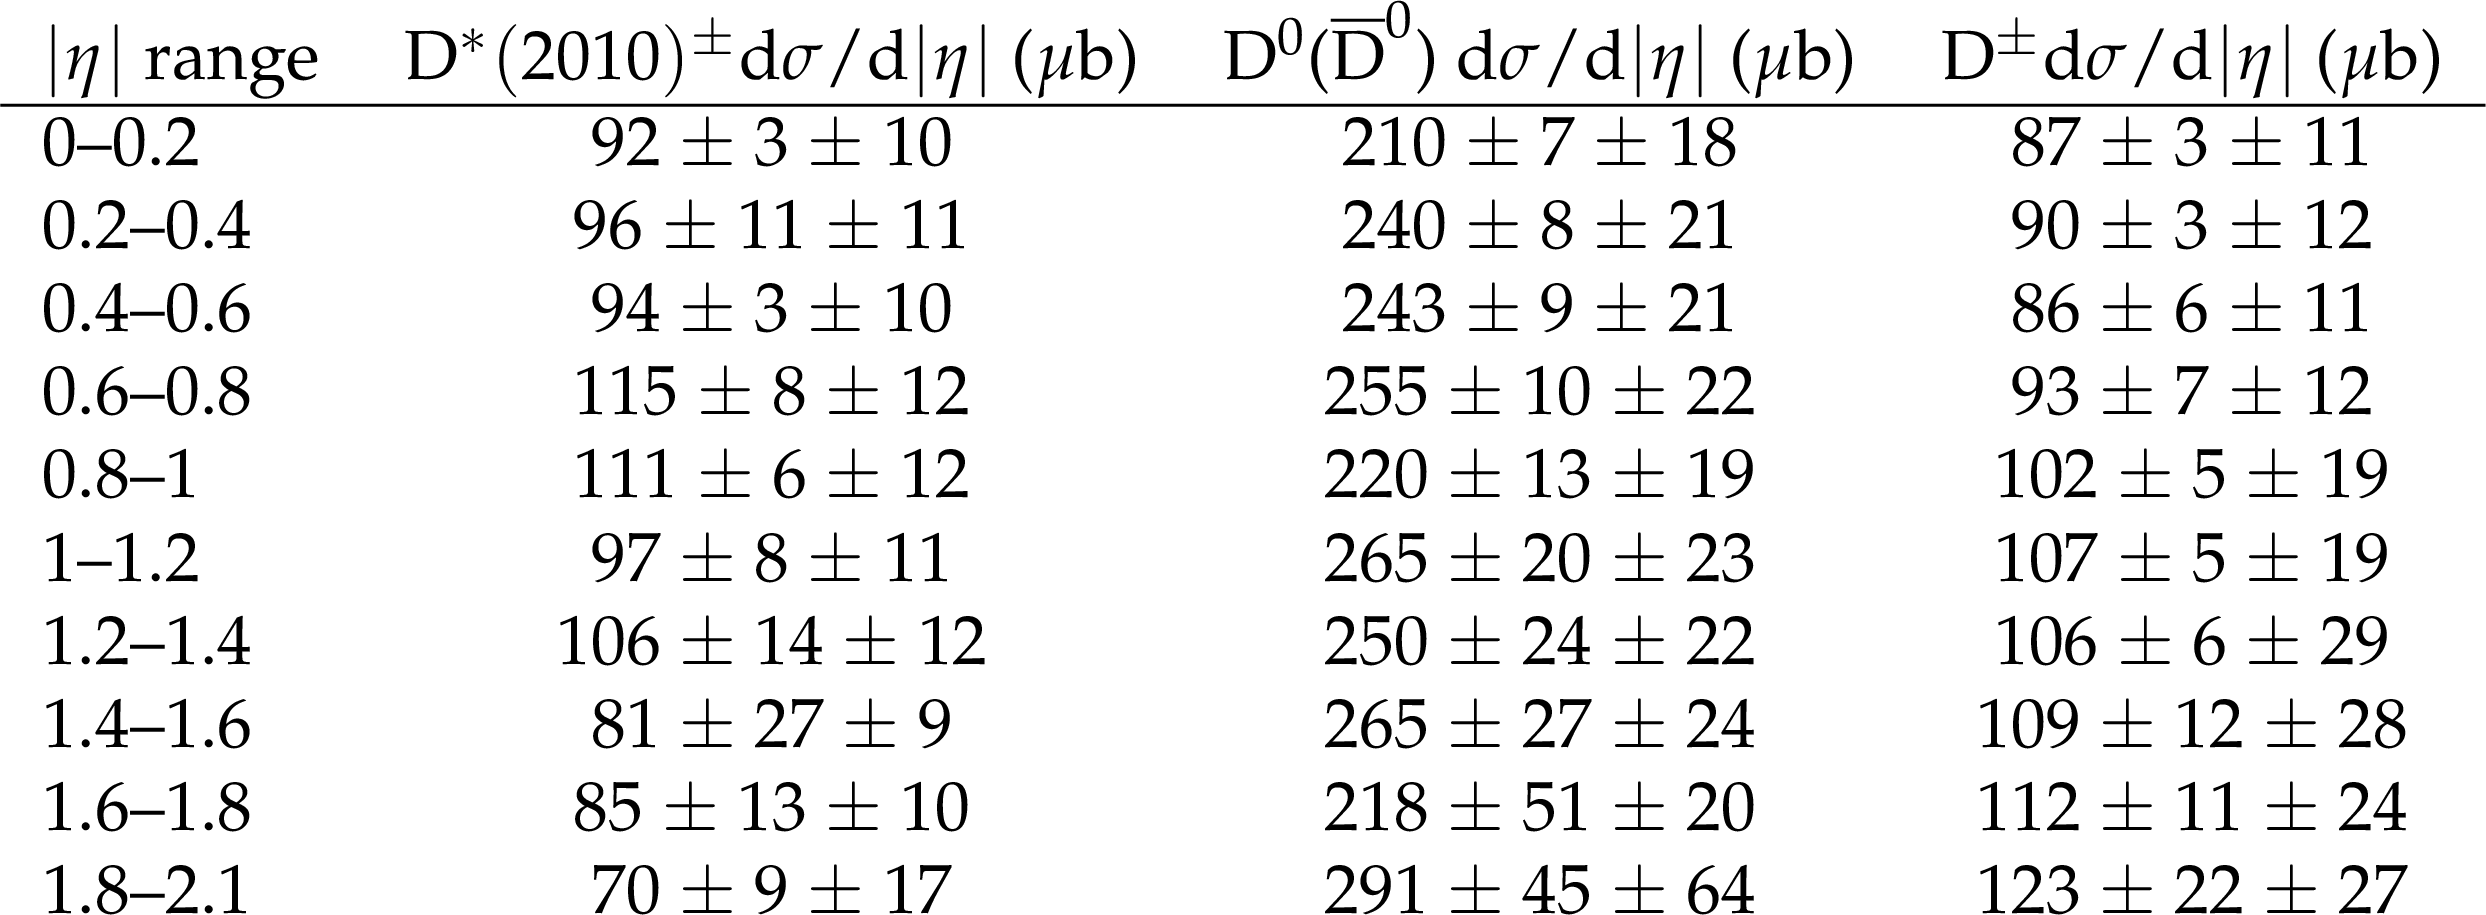
Table 6:
The differential cross sections of ${{\mathrm{D}^{*}(2010)^{\pm}}}$, ${\mathrm{D^0}}$ (${\mathrm{\overline{D}}^0}$), and ${\mathrm{D^{\pm}}}$ in $\eta $ bins with 4 $ < {p_{\mathrm {T}}} < $ 100 GeV; the first uncertainty is statistical, the second is systematic. |
| Summary |
| The differential cross sections $\mathrm{d}\sigma/\mathrm{d}p_{\mathrm{T}}$ and $\mathrm{d}\sigma/\mathrm{d}|\eta|$ are measured for the charm mesons ${{\mathrm{D}^{*}(2010)^{\pm}}}$, ${\mathrm{D^0}}$ (${\mathrm{\overline{D}}^0}$), and ${\mathrm{D^{\pm}}}$ in the range 4 $ < {p_{\mathrm{T}}} < $ 100 GeV and $|\eta| < $ 2.1, using data collected by the CMS experiment in proton-proton collisions in 2016 at $\sqrt{s} = 13$ TeV, corresponding to an integrated luminosity of 29 nb$^{-1}$. The charm mesons were identified in a wide kinematic range with signal invariant mass peaks of high statistical significance. The contamination arising from nonprompt D mesons originating from b hadron decays is removed using Monte Carlo event simulations. The measured cross section values are compared to different Monte Carlo event generators and theoretical predictions. The agreement with the various models can be considered fair, but no single Monte Carlo simulation or theoretical prediction describes the data well over the entire kinematic range. The measurements tend to favor a higher cross section than predicted by the FONLL calculations [10] and smaller than estimated by the PYTHIA event generators [7,8]. Overall, the best description is obtained by the upper edge of the FONLL uncertainty band, which can be taken as a reference prediction for background estimations for other processes. This measurement makes a contribution to the understanding of charm meson production in hadronic collisions, which is still dominated by large uncertainties in the present theoretical models. |
| References | ||||
| 1 | ALICE Collaboration | Measurement of charm production at central rapidity in proton-proton collisions at $ \sqrt{s} = $ 7 TeV | JHEP 01 (2012) 128 | 1111.1553 |
| 2 | ATLAS Collaboration | Measurement of $ D^{*\pm} $, $ D^\pm $ and $ D_s^\pm $ meson production cross sections in pp collisions at $ \sqrt{s}= $ 7 TeV with the ATLAS detector | NPB 907 (2016) 717 | 1512.02913 |
| 3 | LHCb Collaboration | Measurements of prompt charm production cross-sections in pp collisions at $ \sqrt{s}= $ 5 TeV | JHEP 06 (2017) 147 | 1610.02230 |
| 4 | LHCb Collaboration | Prompt charm production in pp collisions at $ \sqrt{s} = $ 7 TeV | NPB 871 (2013) 1 | 1302.2864 |
| 5 | LHCb Collaboration | Measurements of prompt charm production cross-sections in $ pp $ collisions at $ \sqrt{s}= $ 13 TeV | JHEP 03 (2016) 159 | 1510.01707 |
| 6 | CMS Collaboration | Nuclear modification factor of D$ ^0 $ mesons in PbPb collisions at $ \sqrt{s_\mathrm{NN}} = $ 5.02 TeV | PLB 782 (2018) 474 | CMS-HIN-16-001 1708.04962 |
| 7 | T. Sjostrand, S. Mrenna, and P. Z. Skands | PYTHIA 6.4 physics and manual | JHEP 05 (2006) 026 | hep-ph/0603175 |
| 8 | T. Sjostrand et al. | An introduction to PYTHIA 8.2 | CPC 191 (2015) 159--177 | 1410.3012 |
| 9 | S. Frixione, P. Nason, and G. Ridolfi | A positive-weight next-to-leading-order Monte Carlo for heavy flavour hadroproduction | JHEP 09 (2007) 126 | 0707.3088 |
| 10 | M. Cacciari, M. Greco, and P. Nason | The $ {p_{\mathrm{T}}} $ spectrum in heavy flavor hadroproduction | JHEP 05 (1998) 007 | hep-ph/9803400 |
| 11 | GEANT4 Collaboration | GEANT4: a simulation toolkit | NIMA 506 (2003) 250 | |
| 12 | D. J. Lange | The EvtGen particle decay simulation package | NIMA 462 (2001) 152 | |
| 13 | M. Cacciari, G. P. Salam, and G. Soyez | The anti-$ k_t $ jet clustering algorithm | JHEP 04 (2008) 063 | 0802.1189 |
| 14 | M. Cacciari, G. P. Salam, and G. Soyez | FastJet user manual | EPJC 72 (2012) 1896 | 1111.6097 |
| 15 | Particle Data Group Collaboration | Review of particle physics | PRD 98 (2018) 030001 | |
| 16 | CMS Collaboration | Measurement of Tracking Efficiency | CDS | |
| 17 | CMS Collaboration | Tracking POG results for pion efficiency with the D* meson using data from 2016 and 2017 | CDS | |
| 18 | M. J. Oreglia | A study of the reactions $ \psi' \to \gamma\gamma\psi $ | SLAC-R-236 (1980) | |
| 19 | J. E. Gaiser | Charmonium spectroscopy from radiative decays of the J/$ \psi $ and $ \psi $' | SLAC-R-255 (1982) | |
| 20 | CMS Collaboration | CMS Luminosity Measurements for the 2016 data taking period | CMS-PAS-LUM-17-001 | CMS-PAS-LUM-17-001 |
|
|
Compact Muon Solenoid LHC, CERN |
|

|

|

|

|

|