

Compact Muon Solenoid
LHC, CERN
| CMS-PAS-BPH-17-004 | ||
| Search for $\tau \to 3\mu$ decays using $\tau$ leptons produced in D and B meson decays | ||
| CMS Collaboration | ||
| March 2019 | ||
| Abstract: A search for charged lepton flavor violating decays $\tau\to3\mu$ has been performed using proton-proton collisions with a center-of-mass energy of 13 TeV. The analysis uses the data set collected by the CMS detector in 2016, corresponding to an integrated luminosity of 33 fb$^{-1}$, and exploits $\tau$ leptons produced in D and B meson decays. No signal is observed, and an upper limit of $ 8.8 \times 10^{-8}$ is set at the 90% confidence level on the branching fraction of the $\tau$ lepton to three muons. | ||
|
Links:
CDS record (PDF) ;
CADI line (restricted) ;
These preliminary results are superseded in this paper, JHEP 01 (2021) 163. The superseded preliminary plots can be found here. |
||
| Figures | |

png pdf |
Figure 1:
Distributions of trimuon mass resolutions for simulated $ {\tau}\to 3 {{\mu}}$ events (solid line) and $3 {{\mu}}$ sideband data events (dots), passing all selection criteria. The vertical lines at $\delta m/m=$ 0.007 and 0.01 separate three event categories (A, B, and C) used in the analysis. |
png pdf |
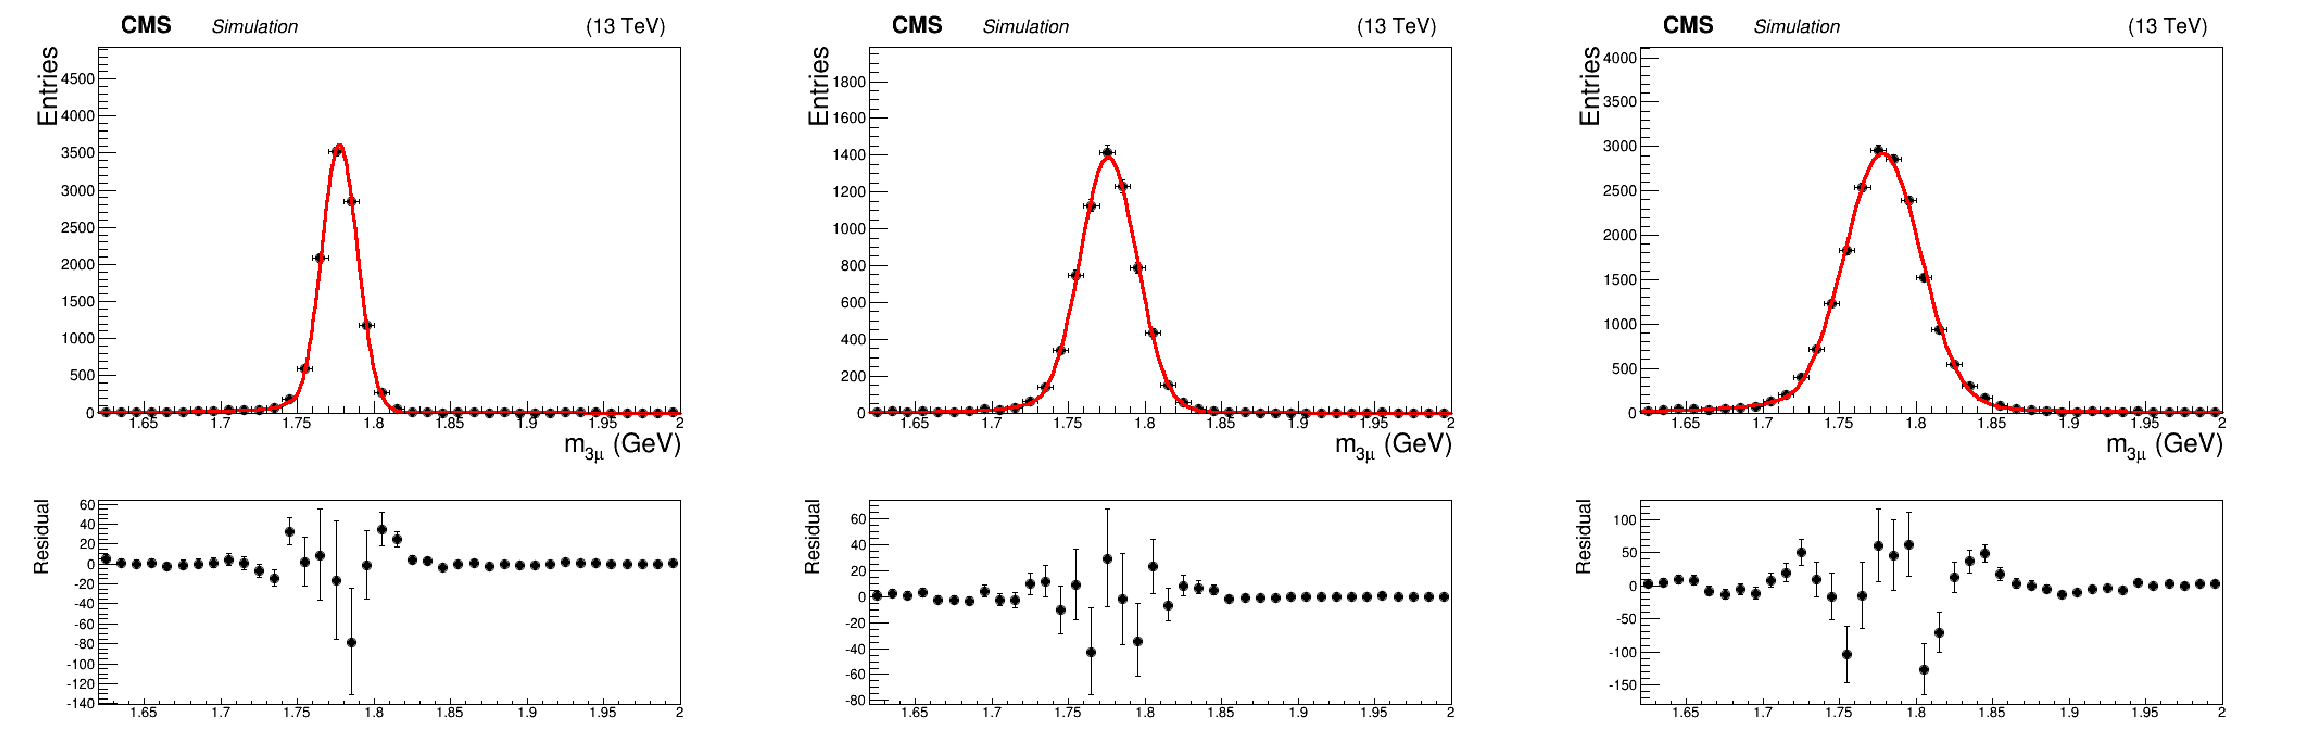
Figure 2:
Trimuon mass distributions for simulated $ {\tau}\to 3 {{\mu}}$ events passing all selection criteria and falling into category A (left), category B (center) or category C (right). The solid line is the result of the fit with Crystal-Ball plus Gaussian function. |
png |
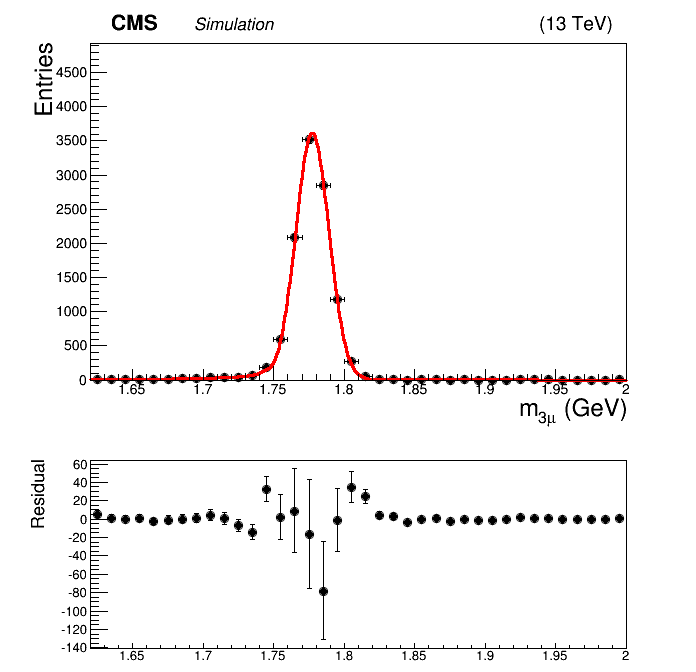
Figure 2-a:
Trimuon mass distributions for simulated $ {\tau}\to 3 {{\mu}}$ events passing all selection criteria and falling into category A (left), category B (center) or category C (right). The solid line is the result of the fit with Crystal-Ball plus Gaussian function. |
png |
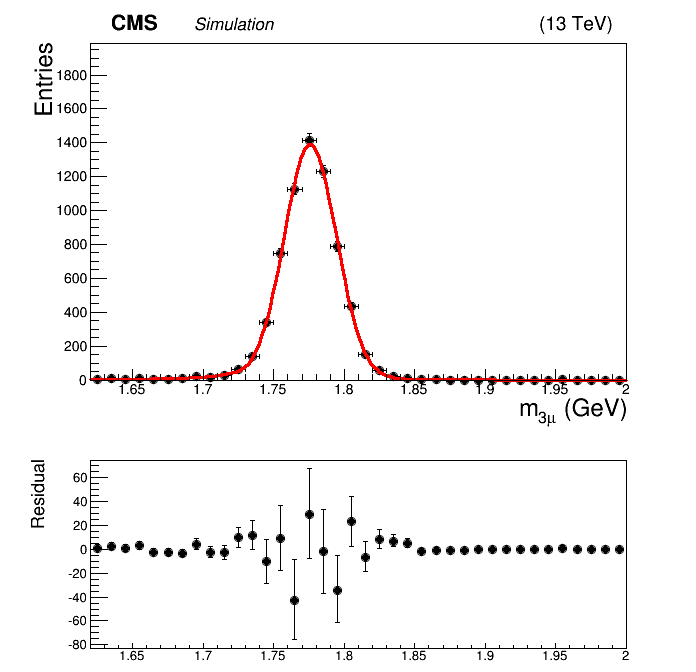
Figure 2-b:
Trimuon mass distributions for simulated $ {\tau}\to 3 {{\mu}}$ events passing all selection criteria and falling into category A (left), category B (center) or category C (right). The solid line is the result of the fit with Crystal-Ball plus Gaussian function. |
png |
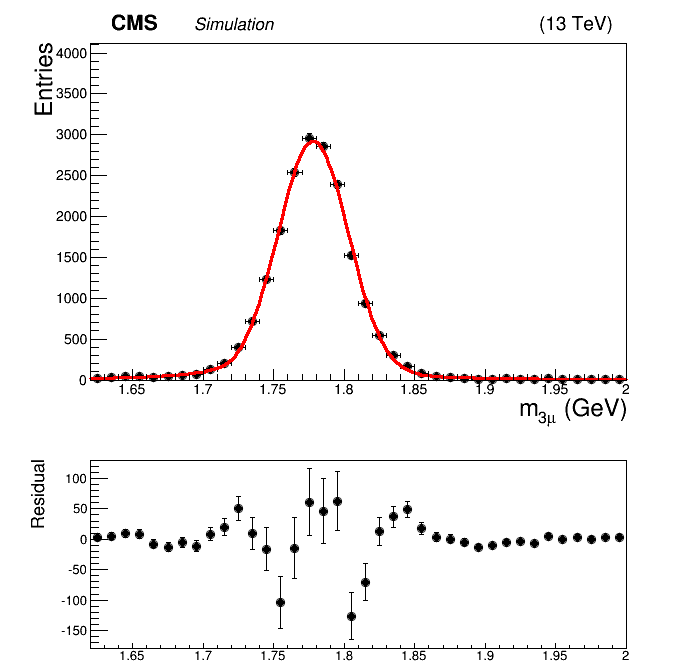
Figure 2-c:
Trimuon mass distributions for simulated $ {\tau}\to 3 {{\mu}}$ events passing all selection criteria and falling into category A (left), category B (center) or category C (right). The solid line is the result of the fit with Crystal-Ball plus Gaussian function. |

png pdf |
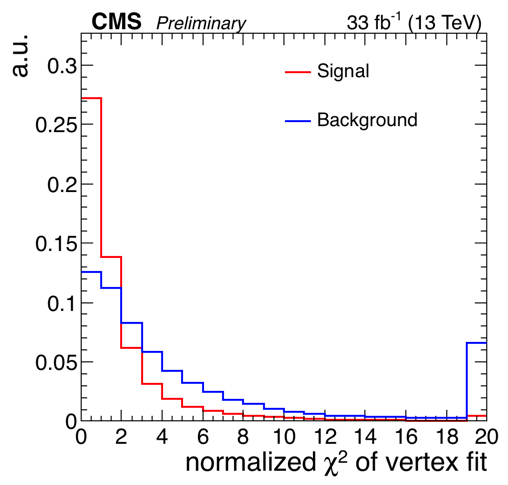
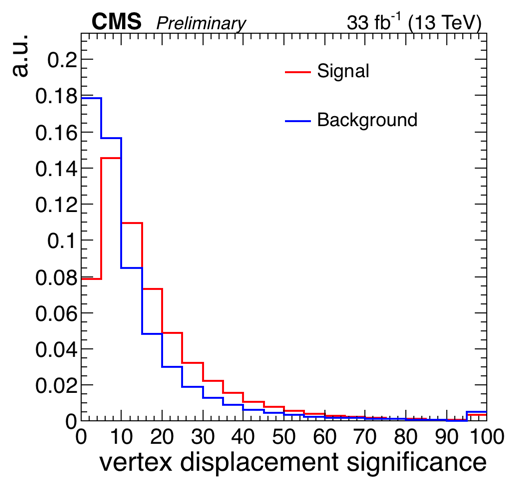
Figure 3:
Signal and background distributions for the four observables with the best discriminating power used for the BDT training: (top-left) normalized $\chi ^2$ of the trimuon vertex fit; (top-right) pointing angle $\alpha $; (bottom-left) significance of the trimuon vertex 3D displacement; (bottom-right) track kink parameter. All distributions are normalized to unity. |
png |
Figure 3-a:
Signal and background distributions for the four observables with the best discriminating power used for the BDT training: (top-left) normalized $\chi ^2$ of the trimuon vertex fit; (top-right) pointing angle $\alpha $; (bottom-left) significance of the trimuon vertex 3D displacement; (bottom-right) track kink parameter. All distributions are normalized to unity. |

png |
Figure 3-b:
Signal and background distributions for the four observables with the best discriminating power used for the BDT training: (top-left) normalized $\chi ^2$ of the trimuon vertex fit; (top-right) pointing angle $\alpha $; (bottom-left) significance of the trimuon vertex 3D displacement; (bottom-right) track kink parameter. All distributions are normalized to unity. |
png |
Figure 3-c:
Signal and background distributions for the four observables with the best discriminating power used for the BDT training: (top-left) normalized $\chi ^2$ of the trimuon vertex fit; (top-right) pointing angle $\alpha $; (bottom-left) significance of the trimuon vertex 3D displacement; (bottom-right) track kink parameter. All distributions are normalized to unity. |

png |
Figure 3-d:
Signal and background distributions for the four observables with the best discriminating power used for the BDT training: (top-left) normalized $\chi ^2$ of the trimuon vertex fit; (top-right) pointing angle $\alpha $; (bottom-left) significance of the trimuon vertex 3D displacement; (bottom-right) track kink parameter. All distributions are normalized to unity. |
png pdf |
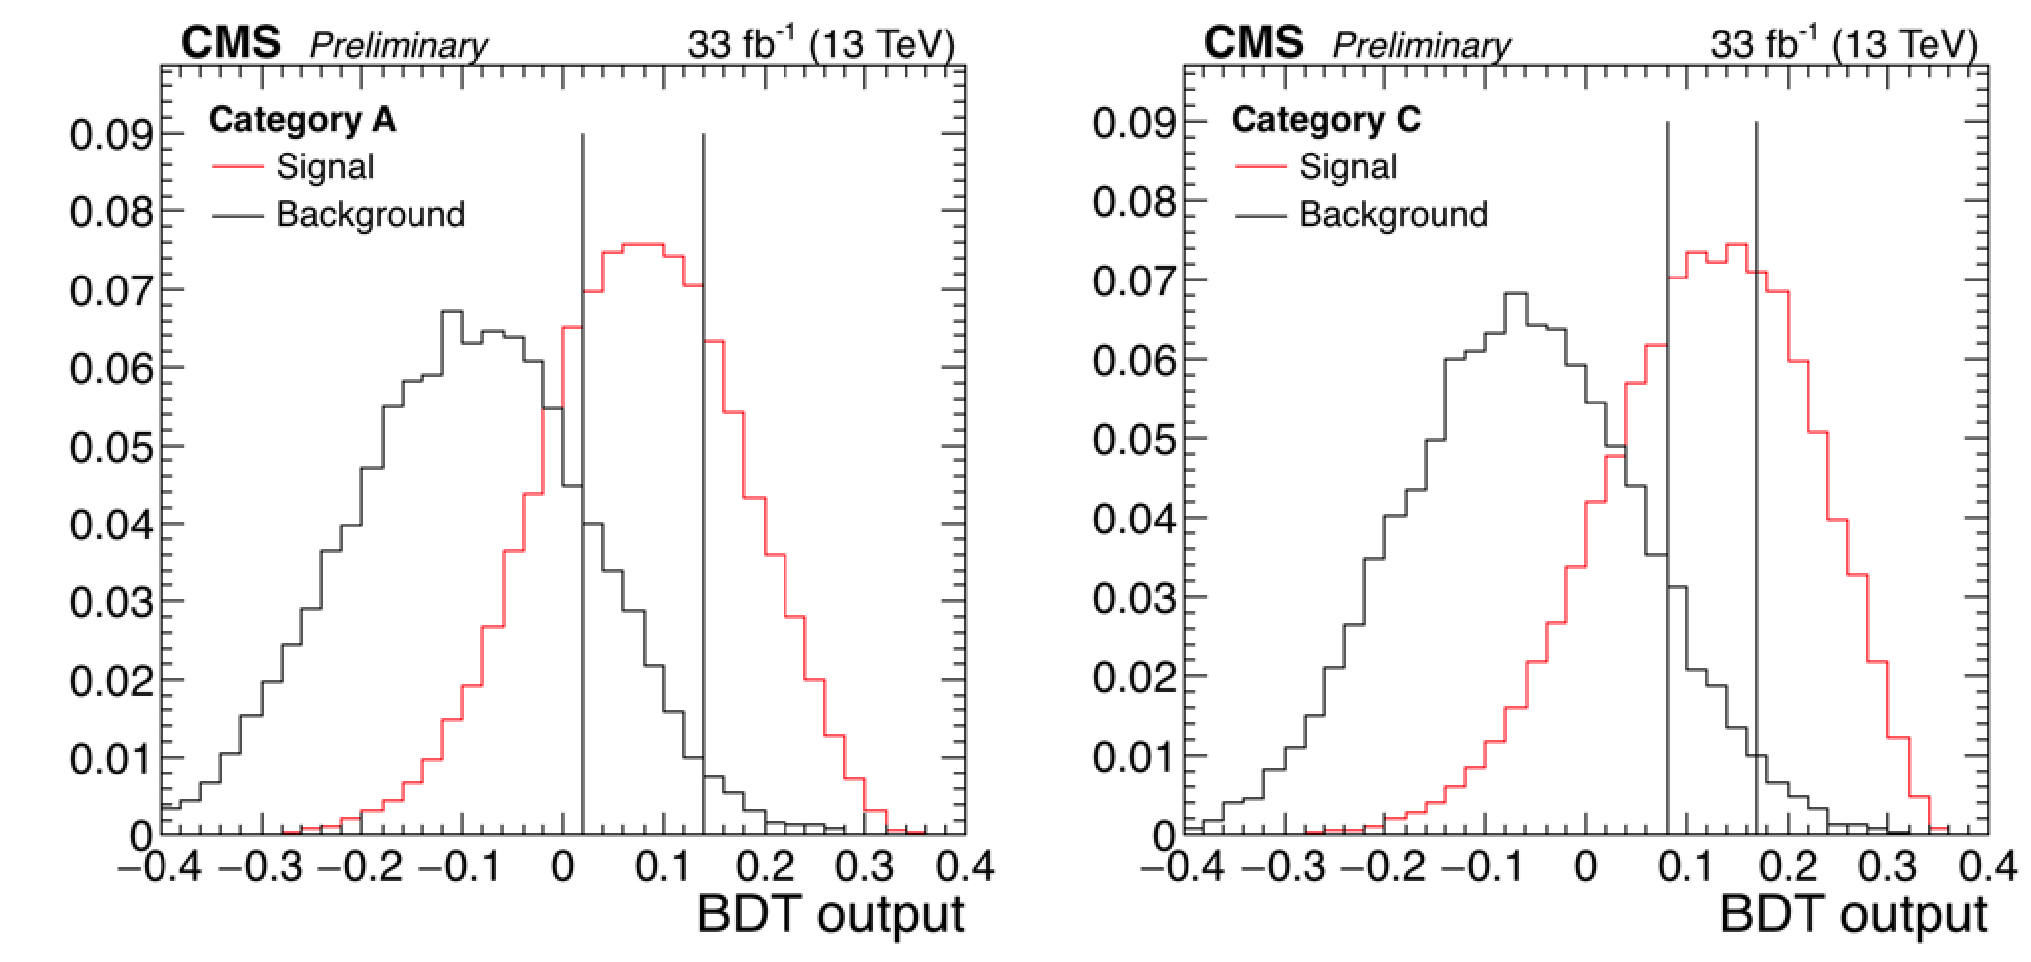
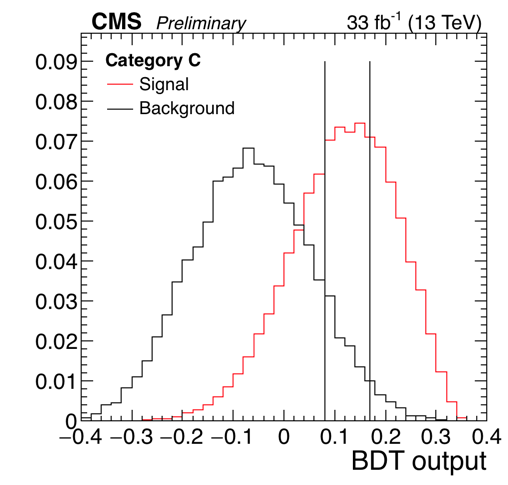
Figure 4:
BDT score distributions for signal and background events passing all selection criteria and falling into category A (left) or category C (right). All distributions are normalized to unity. The vertical lines separate subcategories with different signal-to-background ratios. The two subcategories on the right are used in the signal search. |

png |
Figure 4-a:
BDT score distributions for signal and background events passing all selection criteria and falling into category A (left) or category C (right). All distributions are normalized to unity. The vertical lines separate subcategories with different signal-to-background ratios. The two subcategories on the right are used in the signal search. |
png |
Figure 4-b:
BDT score distributions for signal and background events passing all selection criteria and falling into category A (left) or category C (right). All distributions are normalized to unity. The vertical lines separate subcategories with different signal-to-background ratios. The two subcategories on the right are used in the signal search. |
png pdf |
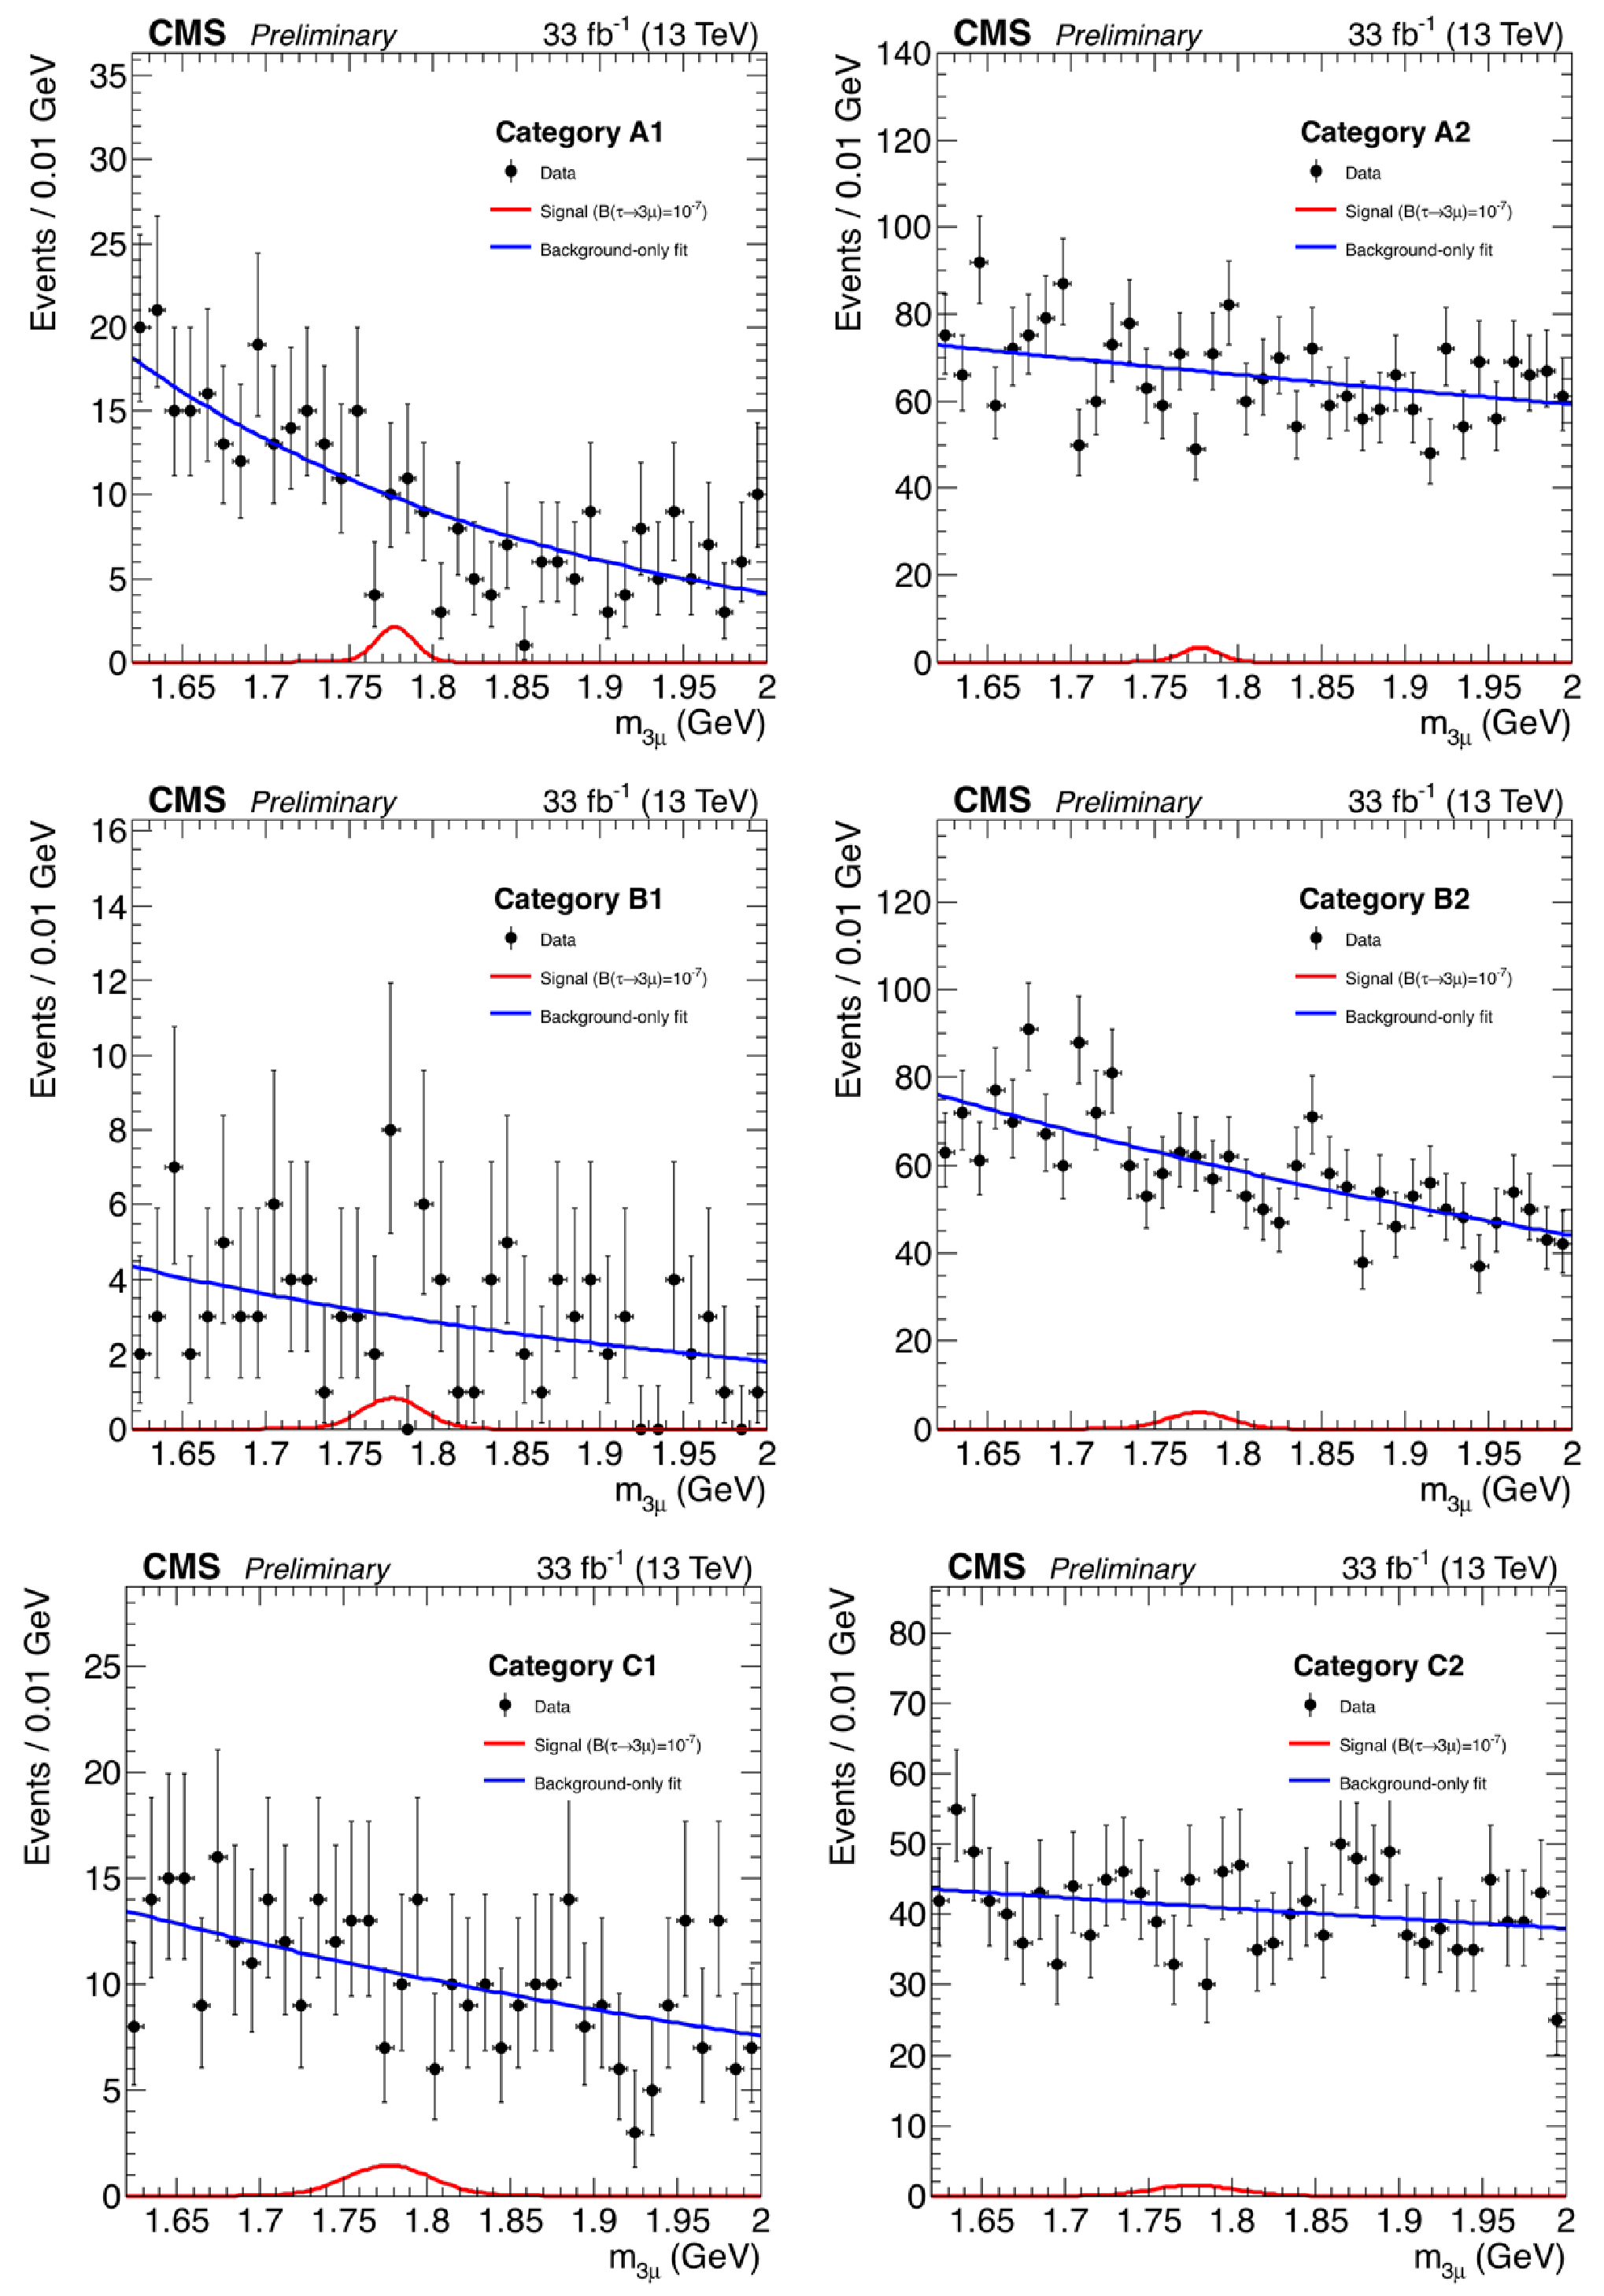
Figure 5:
Trimuon mass distributions in the six independent event categories used in the analysis: A1, A2; B1, B2; C1, C2. The six event categories are defined in the text. Data are shown with points. The background-only fit and the expected signal for $\mathcal {B}({\tau}\to 3 {{\mu}})=10^{-7}$ are shown with lines. |

png |
Figure 5-a:
Trimuon mass distributions in the six independent event categories used in the analysis: A1, A2; B1, B2; C1, C2. The six event categories are defined in the text. Data are shown with points. The background-only fit and the expected signal for $\mathcal {B}({\tau}\to 3 {{\mu}})=10^{-7}$ are shown with lines. |

png |
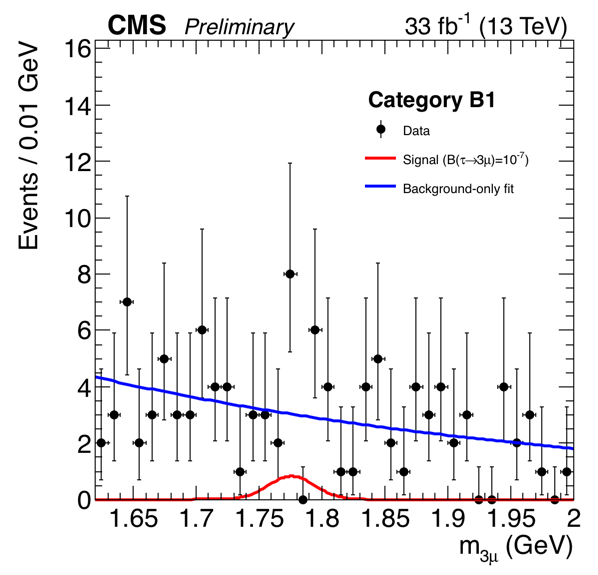
Figure 5-b:
Trimuon mass distributions in the six independent event categories used in the analysis: A1, A2; B1, B2; C1, C2. The six event categories are defined in the text. Data are shown with points. The background-only fit and the expected signal for $\mathcal {B}({\tau}\to 3 {{\mu}})=10^{-7}$ are shown with lines. |
png |
Figure 5-c:
Trimuon mass distributions in the six independent event categories used in the analysis: A1, A2; B1, B2; C1, C2. The six event categories are defined in the text. Data are shown with points. The background-only fit and the expected signal for $\mathcal {B}({\tau}\to 3 {{\mu}})=10^{-7}$ are shown with lines. |

png |
Figure 5-d:
Trimuon mass distributions in the six independent event categories used in the analysis: A1, A2; B1, B2; C1, C2. The six event categories are defined in the text. Data are shown with points. The background-only fit and the expected signal for $\mathcal {B}({\tau}\to 3 {{\mu}})=10^{-7}$ are shown with lines. |
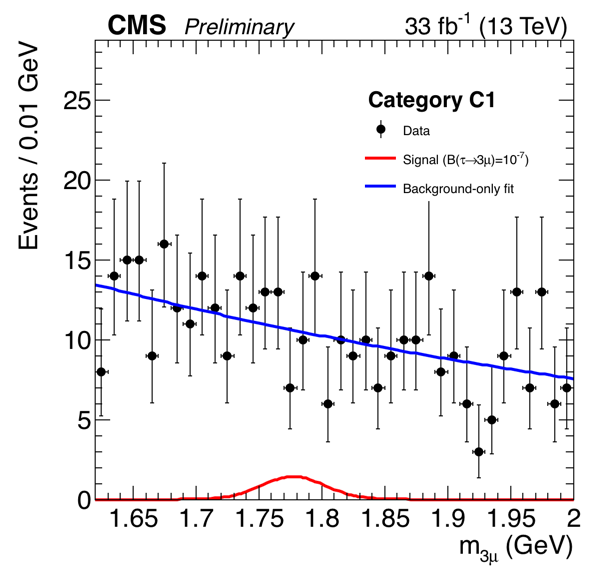
png |
Figure 5-e:
Trimuon mass distributions in the six independent event categories used in the analysis: A1, A2; B1, B2; C1, C2. The six event categories are defined in the text. Data are shown with points. The background-only fit and the expected signal for $\mathcal {B}({\tau}\to 3 {{\mu}})=10^{-7}$ are shown with lines. |
png |
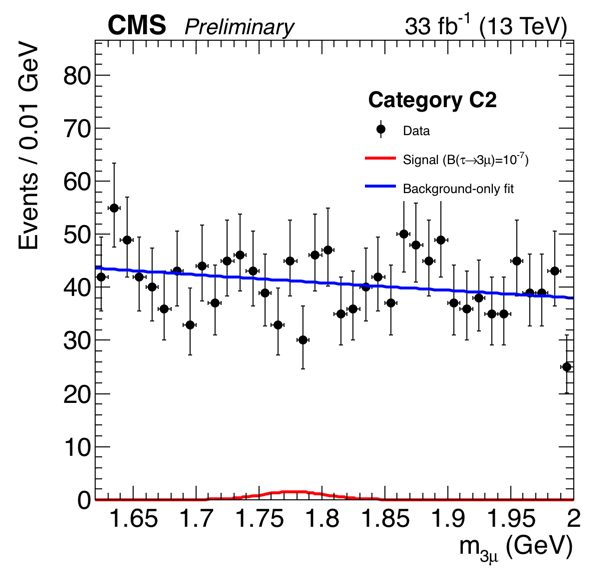
Figure 5-f:
Trimuon mass distributions in the six independent event categories used in the analysis: A1, A2; B1, B2; C1, C2. The six event categories are defined in the text. Data are shown with points. The background-only fit and the expected signal for $\mathcal {B}({\tau}\to 3 {{\mu}})=10^{-7}$ are shown with lines. |
png pdf |
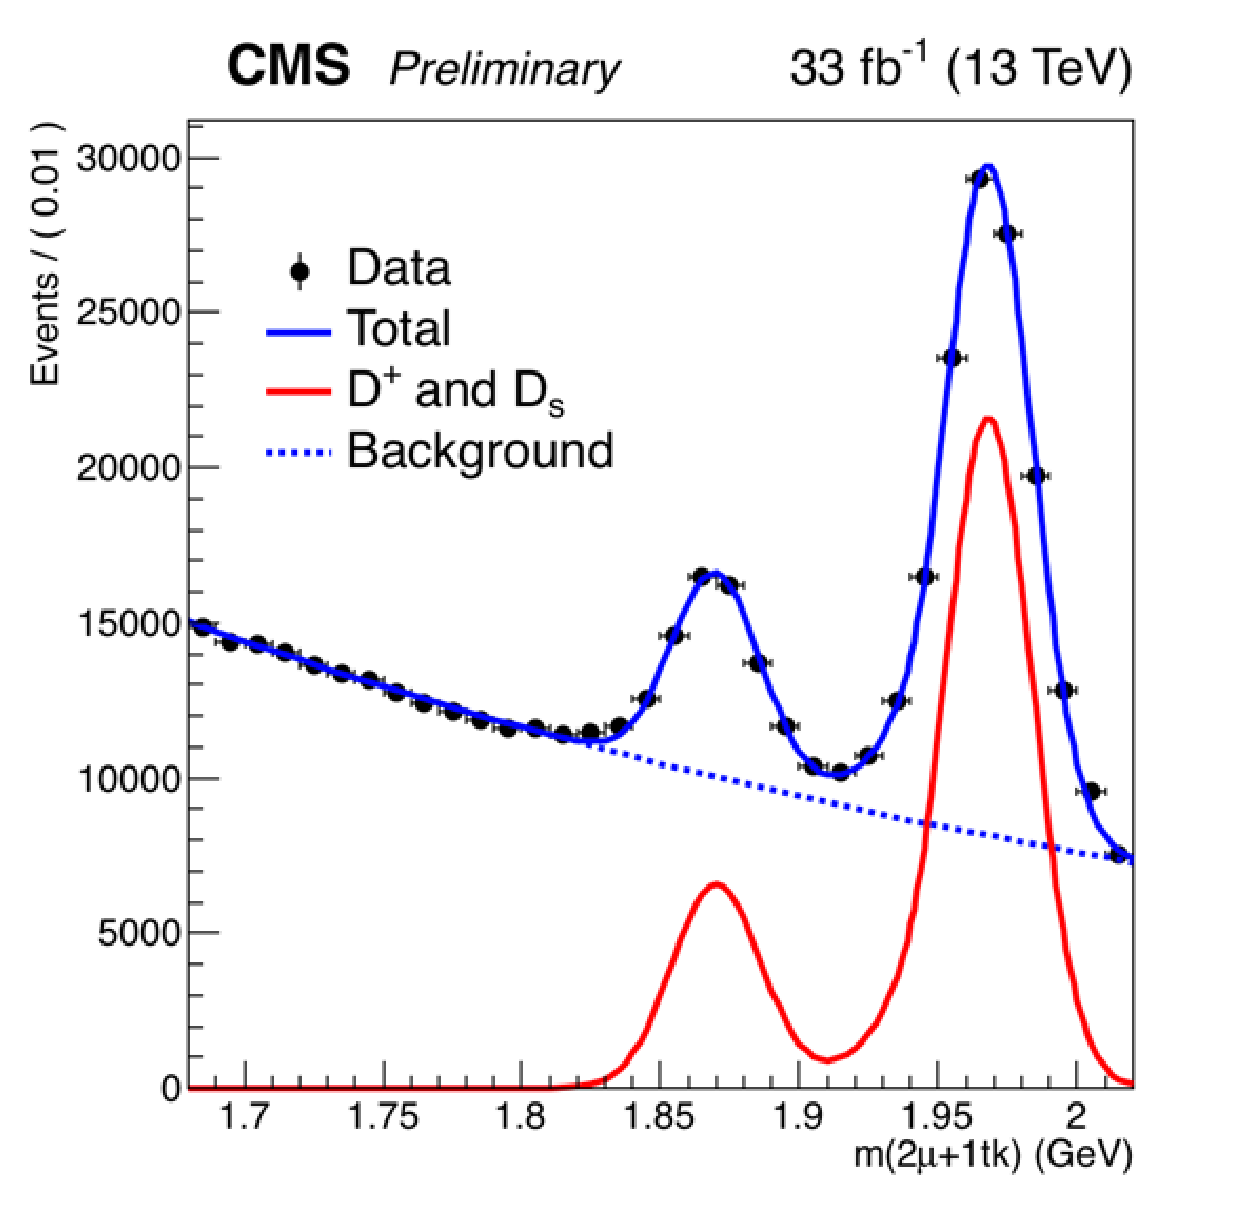
Figure 6:
The invariant mass distribution for two muons and a pion after applying signal-like kinematic cuts on two muons and a pion, and after requiring that the two muons have opposite signs and their invariant mass is consistent the $\phi $ meson mass. The two peaks are associated with $ {\mathrm {D}}_\text {s}$ (1.97 GeV) and $ {\mathrm {D^+}}$ (1.87 GeV) decays, and modelled with Crystal-Ball functions, while the background is fitted with an exponential function. |

png pdf |
Figure 7:
Fit prompt and non-prompt $ {\mathrm {D}}_\text {s}$ contributions to data. The histograms are from $ {\mathrm {D}}_\text {s} \to \phi ({{\mu}} {{\mu}}) {\pi}$ MC. The filled histogram is the $ {{\mathrm {B}}}\to {\mathrm {D}}_\text {s}$ component, while the opened histogram stacked on the other is the prompt $ {\mathrm {D}}_\text {s}$ component. They fit to data (sideband subtracted) using the proper decay length ($L M/p$). |

png pdf |
Figure 8:
S/(S+B)-weighted trimuon mass distribution including events from all the categories used in the analysis. Data are shown with points. The background-only fit and the expected signal for $\mathcal {B}({\tau}\to 3 {{\mu}})=10^{-7}$ are shown with lines. |
| Tables | |
png pdf |
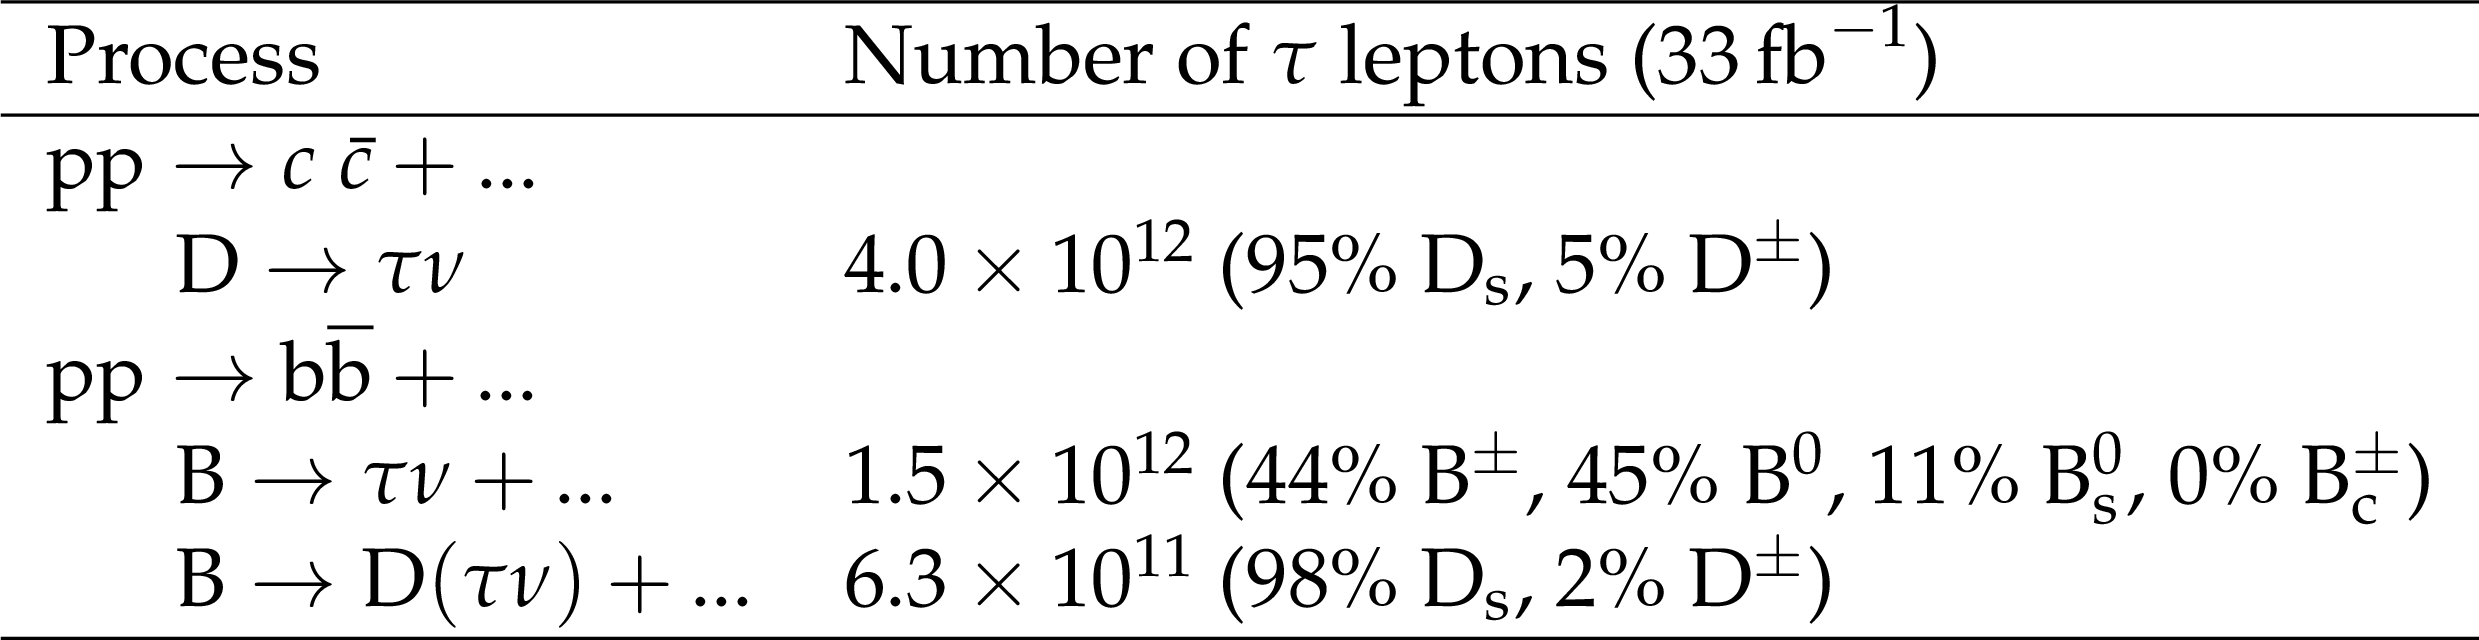
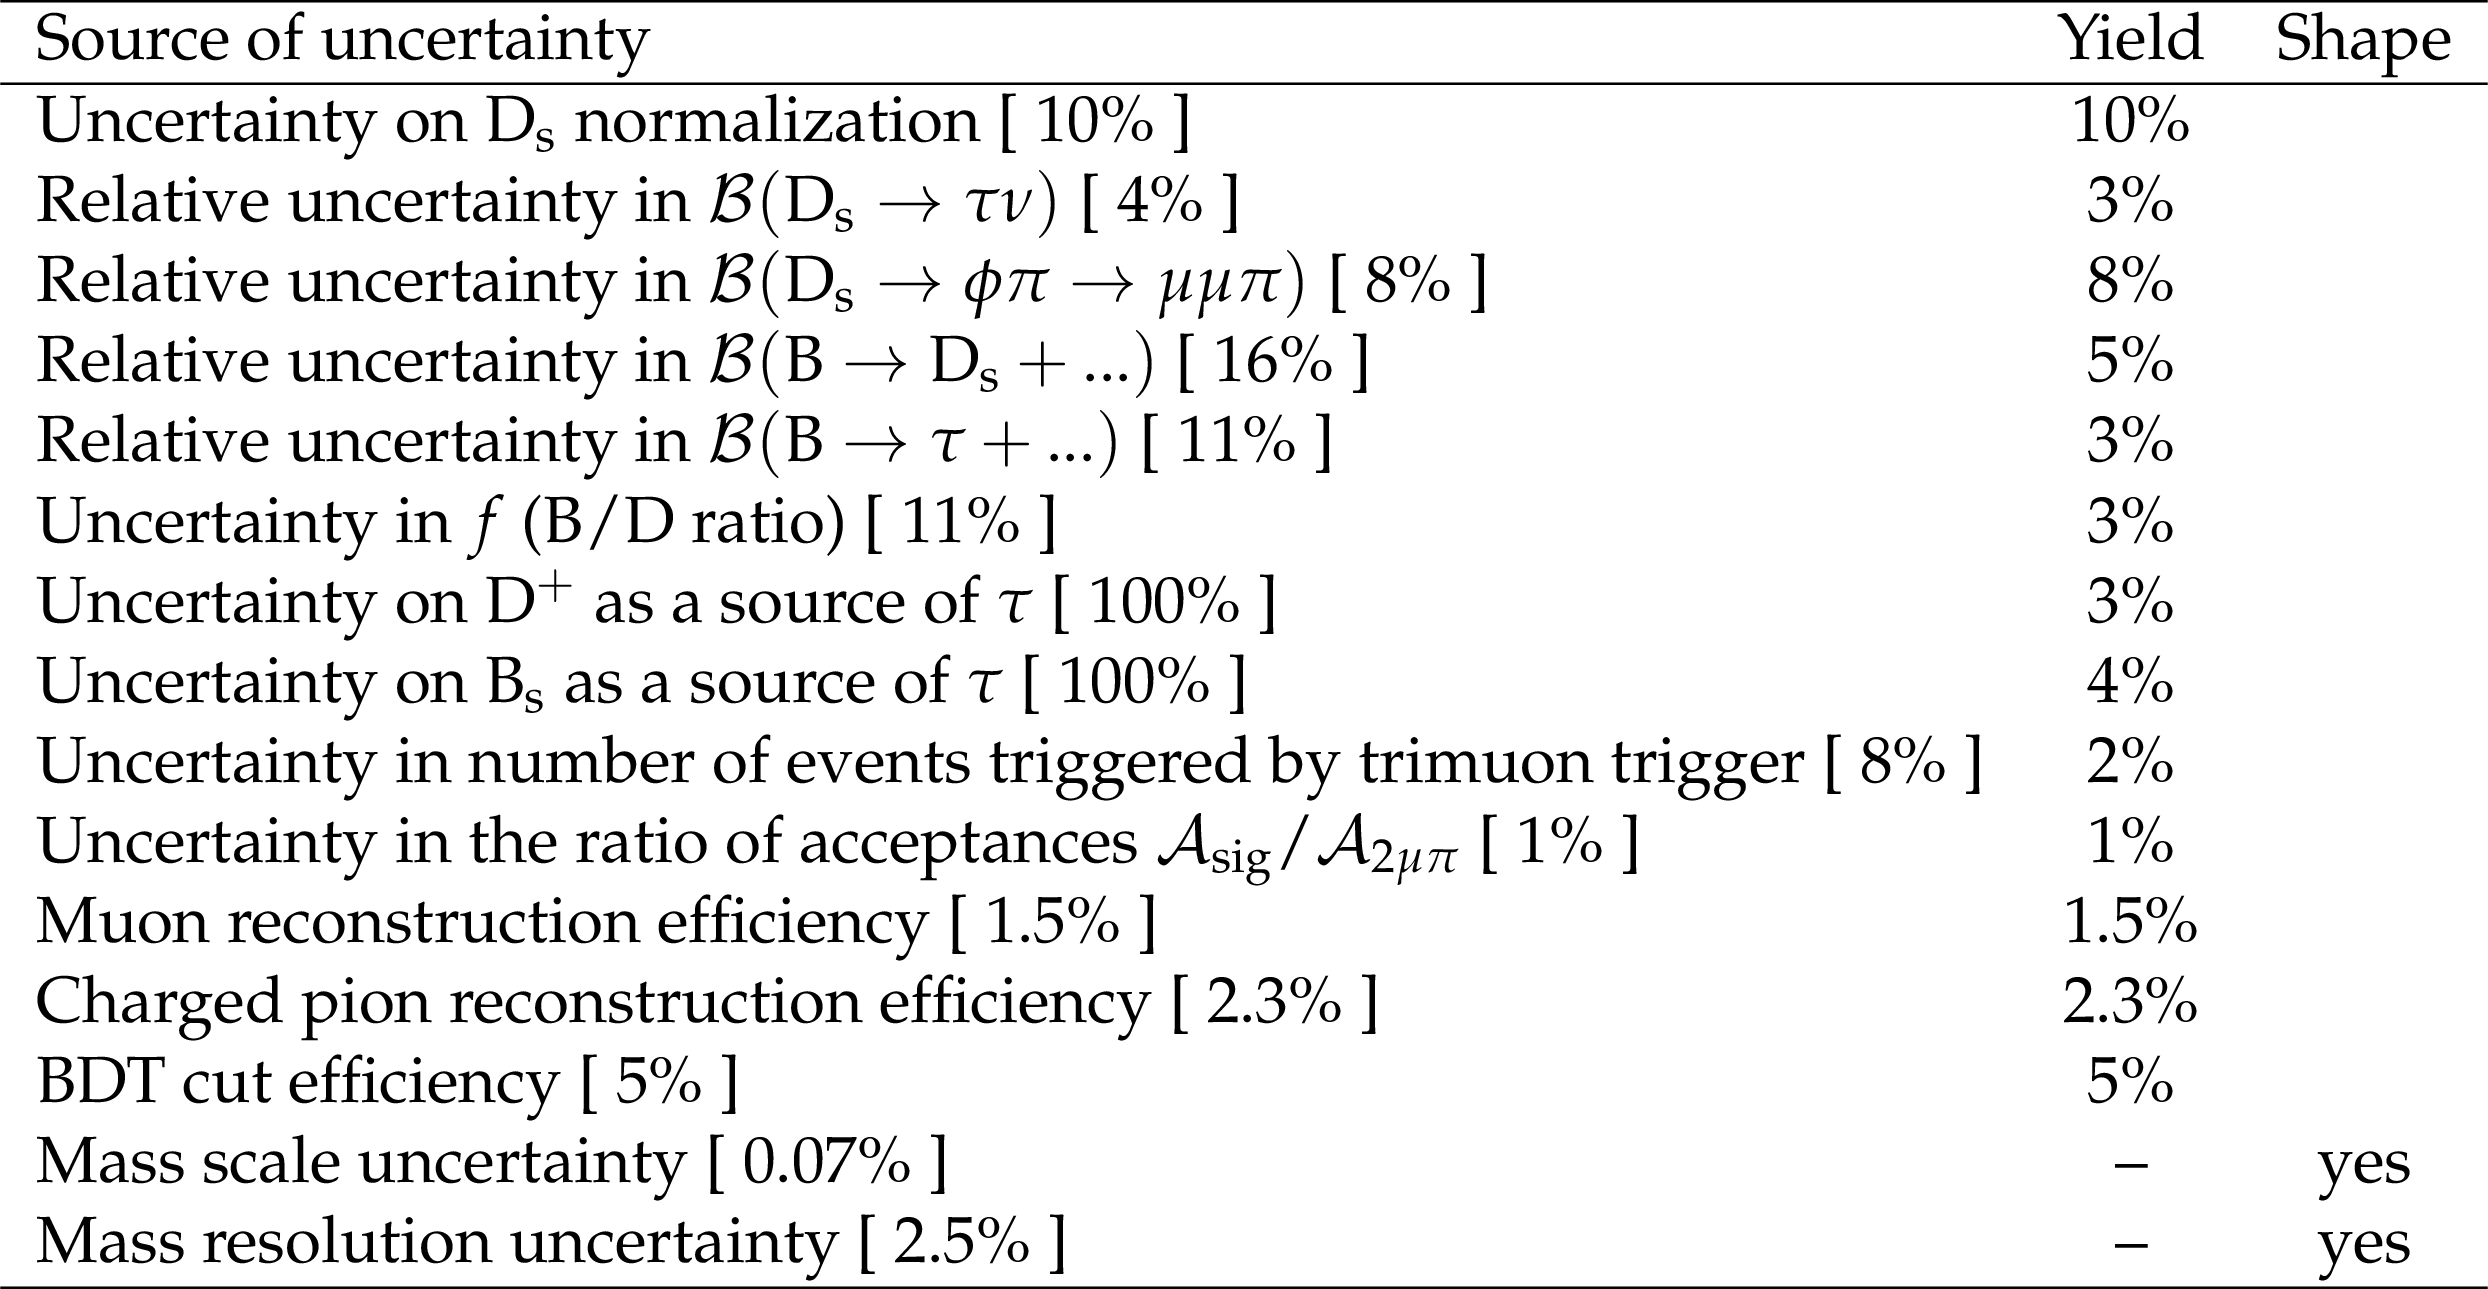
Table 1:
The expected inclusive number of $ {\tau}$ leptons produced in D and B meson decays at LHC (13 TeV) for an integrated luminosity of 33 fb$^{-1}$. Numbers are from PYTHIA (without EVTGEN). Charge conjugated states are implied. For comparison, the number of $ {\tau}$ leptons produced in W and Z boson decays is $8 \times 10^{8}$. |
png pdf |
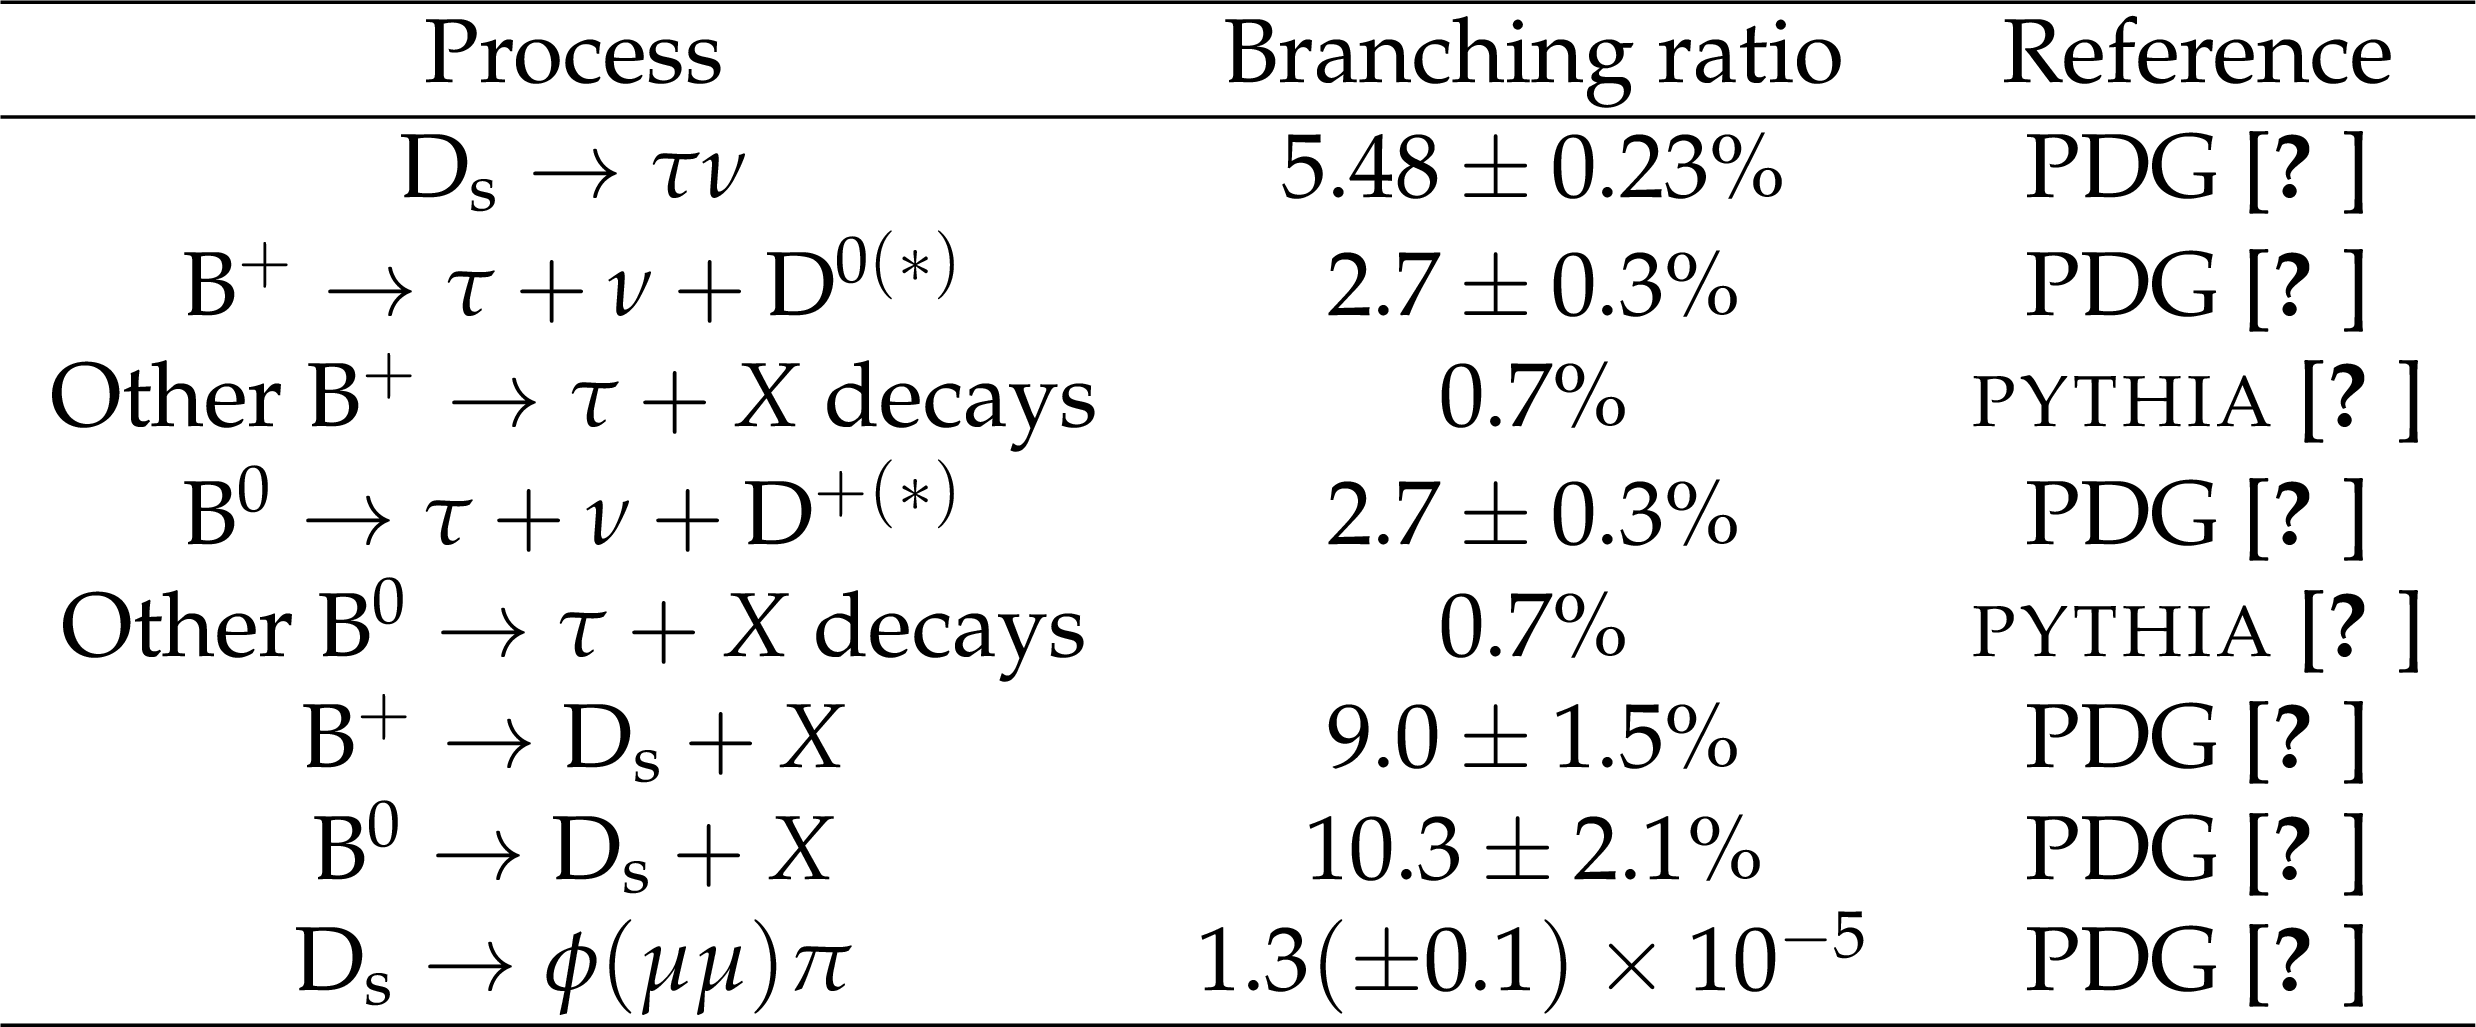
Table 2:
D and B meson decay branching fractions (and their uncertainties) used in this analysis. |
png pdf |
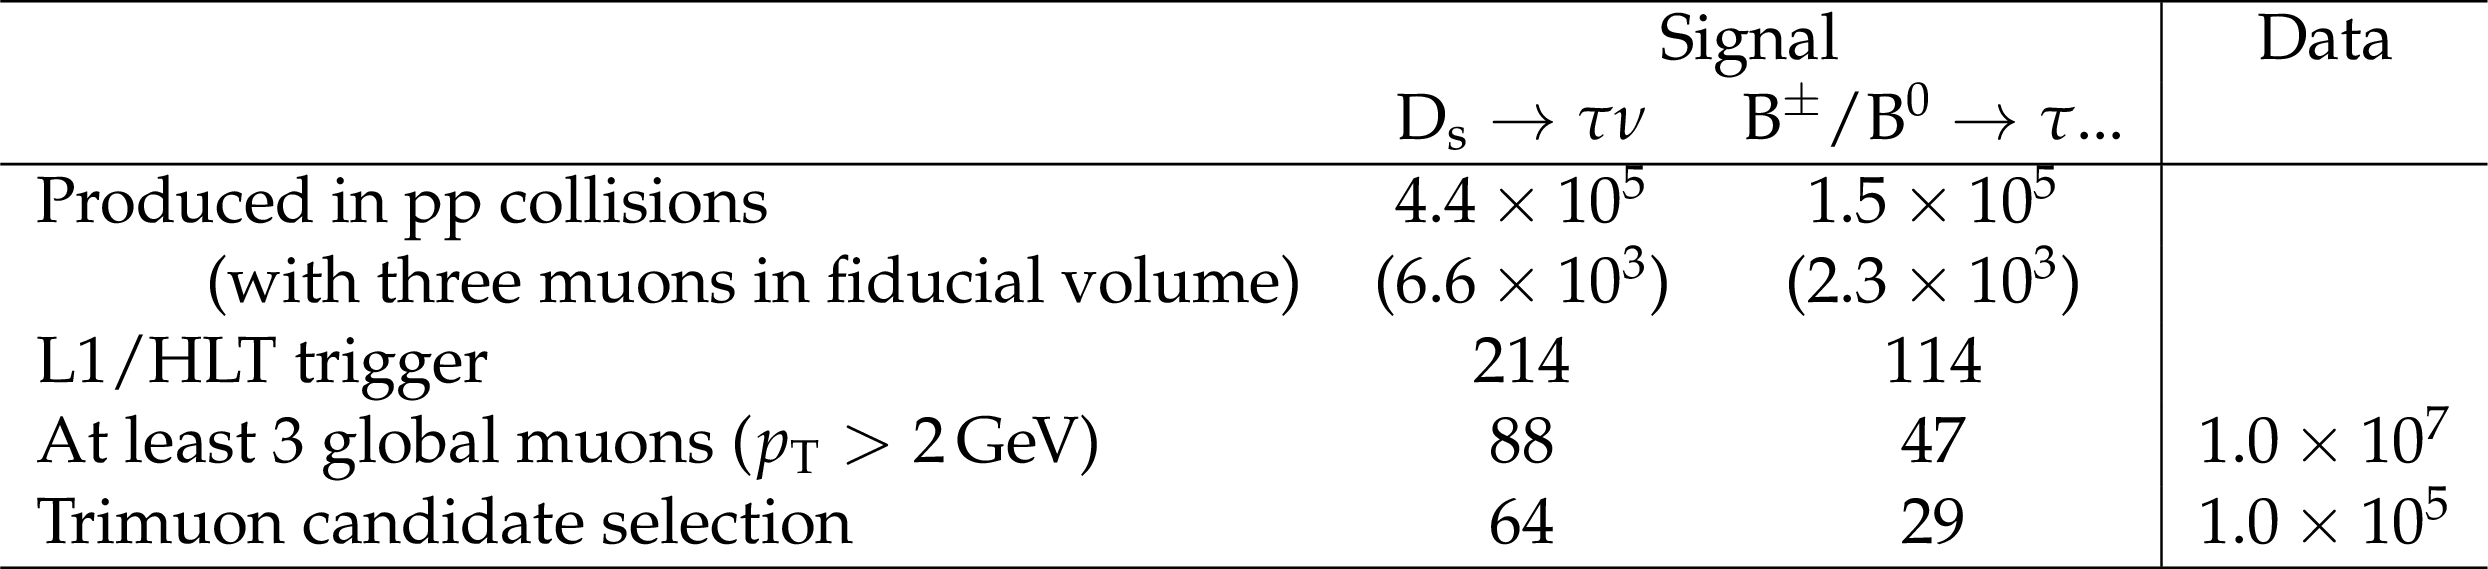
Table 3:
Number of expected signal events, assuming $\mathcal {B}({\tau}\to 3 {{\mu}})=10^{-7}$, and the number of observed events in data at each step of the event selection. Events are counted in the trimuon mass range 1.62-2.00 GeV. |
png pdf |
Table 4:
Sources of systematic uncertainties affecting the signal modeling, and their impacts on the expected signal event yield and trimuon mass distribution shape. |

png pdf |
Table 5:
Signal and data yields for the six event categories in the mass range 1.62-2.00 GeV. The signal yields are shown for $\mathcal {B}({\tau}\to 3 {{\mu}})=10^{-7}$. The data yields inside parentheses are in the mass ranges of 1.78 GeV $\pm$ 2$ \sigma $, where $\sigma $ is the mass resolution (12 MeV, 19 MeV, and 25 MeV for the category A, B, and C respectively). |
| Summary |
| The first search for the charged lepton flavor violating decay $\tau\to 3\mu$ using the CMS detector has been presented. The analysis uses 33 fb$^{-1}$ of proton-proton collisions collected at a center-of-mass energy of 13 TeV by the CMS detector in 2016. It exploits $\tau$ leptons produced in D and B meson decays, which is the main source of $\tau$ leptons at the LHC. No excess above the expected background is observed. An upper limit of $8.8\times 10^{-8}$ is set on the branching fraction $\mathcal{B}(\tau \rightarrow 3\mu)$ at 90% confidence level. The corresponding upper limit at 95% confidence level is $1.1 \times 10^{-7}$. |
| References | ||||
| 1 | X.-Y. Pham | Lepton flavor changing in neutrinoless tau decays | EPJC 8 (1999) 513--516 | hep-ph/9810484 |
| 2 | W. J. Marciano, T. Mori, and J. M. Roney | Charged Lepton Flavor Violation Experiments | Ann. Rev. Nucl. Part. Sci. 58 (2008) 315 | |
| 3 | K. Hayasaka et al. | Search for Lepton Flavor Violating Tau Decays into Three Leptons with 719 Million Produced Tau+Tau- Pairs | PLB 687 (2010) 139 | 1001.3221 |
| 4 | BaBar Collaboration | Limits on tau Lepton-Flavor Violating Decays in three charged leptons | PRD 81 (2010) 111101 | 1002.4550 |
| 5 | T. Sjostrand, S. Mrenna, and P. Z. Skands | A Brief Introduction to PYTHIA 8.1 | CPC 178 (2008) 852 | 0710.3820 |
| 6 | LHCb Collaboration | The LHCb Detector at the LHC | JINST 3 (2008) S08005 | |
| 7 | ATLAS Collaboration | The ATLAS Experiment at the CERN Large Hadron Collider | JINST 3 (2008) S08003 | |
| 8 | LHCb Collaboration | Search for the lepton flavour violating decay $ \tau^-\rightarrow\mu^-\mu^+\mu^- $ | JHEP 02 (2015) 121 | 1409.8548 |
| 9 | ATLAS Collaboration | Probing lepton flavour violation via neutrinoless $ \tau\rightarrow 3\mu $ decays with the ATLAS detector | 1601.03567 | |
| 10 | CMS Collaboration | The CMS experiment at the CERN LHC | JINST 3 (2008) S08004 | CMS-00-001 |
| 11 | CMS Collaboration | Event generator tunes obtained from underlying event and multiparton scattering measurements | EPJC 76 (2016), no. 3, 155 | CMS-GEN-14-001 1512.00815 |
| 12 | GEANT4 Collaboration | GEANT4 --- a simulation toolkit | NIMA 506 (2003) 250 | |
| 13 | Particle Data Group Collaboration | Review of Particle Physics | PRD 98 (2018), no. 3, 030001 | |
| 14 | CMS Collaboration | Particle-flow reconstruction and global event description with the CMS detector | JINST 12 (2017) P10003 | CMS-PRF-14-001 1706.04965 |
| 15 | CMS Collaboration | Performance of the CMS muon detector and muon reconstruction with proton-proton collisions at $ \sqrt{s}= $ 13 TeV | JINST 13 (2018) P06015 | CMS-MUO-16-001 1804.04528 |
| 16 | CMS Collaboration | Measurements of properties of the Higgs boson decaying into the four-lepton final state in pp collisions at $ \sqrt{s}= $ 13 TeV | JHEP 11 (2017) 047 | CMS-HIG-16-041 1706.09936 |
| 17 | CMS Collaboration | Measurement of the inclusive $ W $ and $ Z $ production cross sections in $ pp $ collisions at $ \sqrt{s}= $ 7 TeV | JHEP 10 (2011) 132 | CMS-EWK-10-005 1107.4789 |
| 18 | T. Junk | Confidence level computation for combining searches with small statistics | NIMA 434 (1999) 435 | |
| 19 | A. L. Read | Presentation of search results: the CLs technique | JPG: Nucl. Part. Phys. 28 (2002) 2693 | |
|
|
Compact Muon Solenoid LHC, CERN |
|

|

|

|

|

|