

Compact Muon Solenoid
LHC, CERN
| CMS-SMP-19-003 ; CERN-EP-2020-040 | ||
| Dependence of inclusive jet production on the anti-${k_{\mathrm{T}}}$ distance parameter in pp collisions at $\sqrt{s} = $ 13 TeV | ||
| CMS Collaboration | ||
| 11 May 2020 | ||
| JHEP 12 (2020) 082 | ||
| Abstract: The dependence of inclusive jet production in proton-proton collisions with a center-of-mass energy of 13 TeV on the distance parameter $R$ of the anti-${k_{\mathrm{T}}}$ algorithm is studied using data corresponding to integrated luminosities up to 35.9 fb$^{-1}$ collected by the CMS experiment in 2016. The ratios of the inclusive cross sections as functions of transverse momentum ${p_{\mathrm{T}}}$ and rapidity $y$, for $R$ in the range 0.1 to 1.2 to those using $R= $ 0.4 are presented in the region 84 $ < {p_{\mathrm{T}}} < $ 1588 GeV and $|y| < $ 2.0. The results are compared to calculations at leading and next-to-leading order in the strong coupling constant using different parton shower models. The variation of the ratio of cross sections with $R$ is well described by calculations including a parton shower model, but not by a leading-order quantum chromodynamics calculation including nonperturbative effects. The agreement between the data and the theoretical predictions for the ratios of cross sections is significantly improved when next-to-leading order calculations with nonperturbative effects are used. | ||
| Links: e-print arXiv:2005.05159 [hep-ex] (PDF) ; CDS record ; inSPIRE record ; HepData record ; CADI line (restricted) ; | ||
| Figures | |
png pdf |
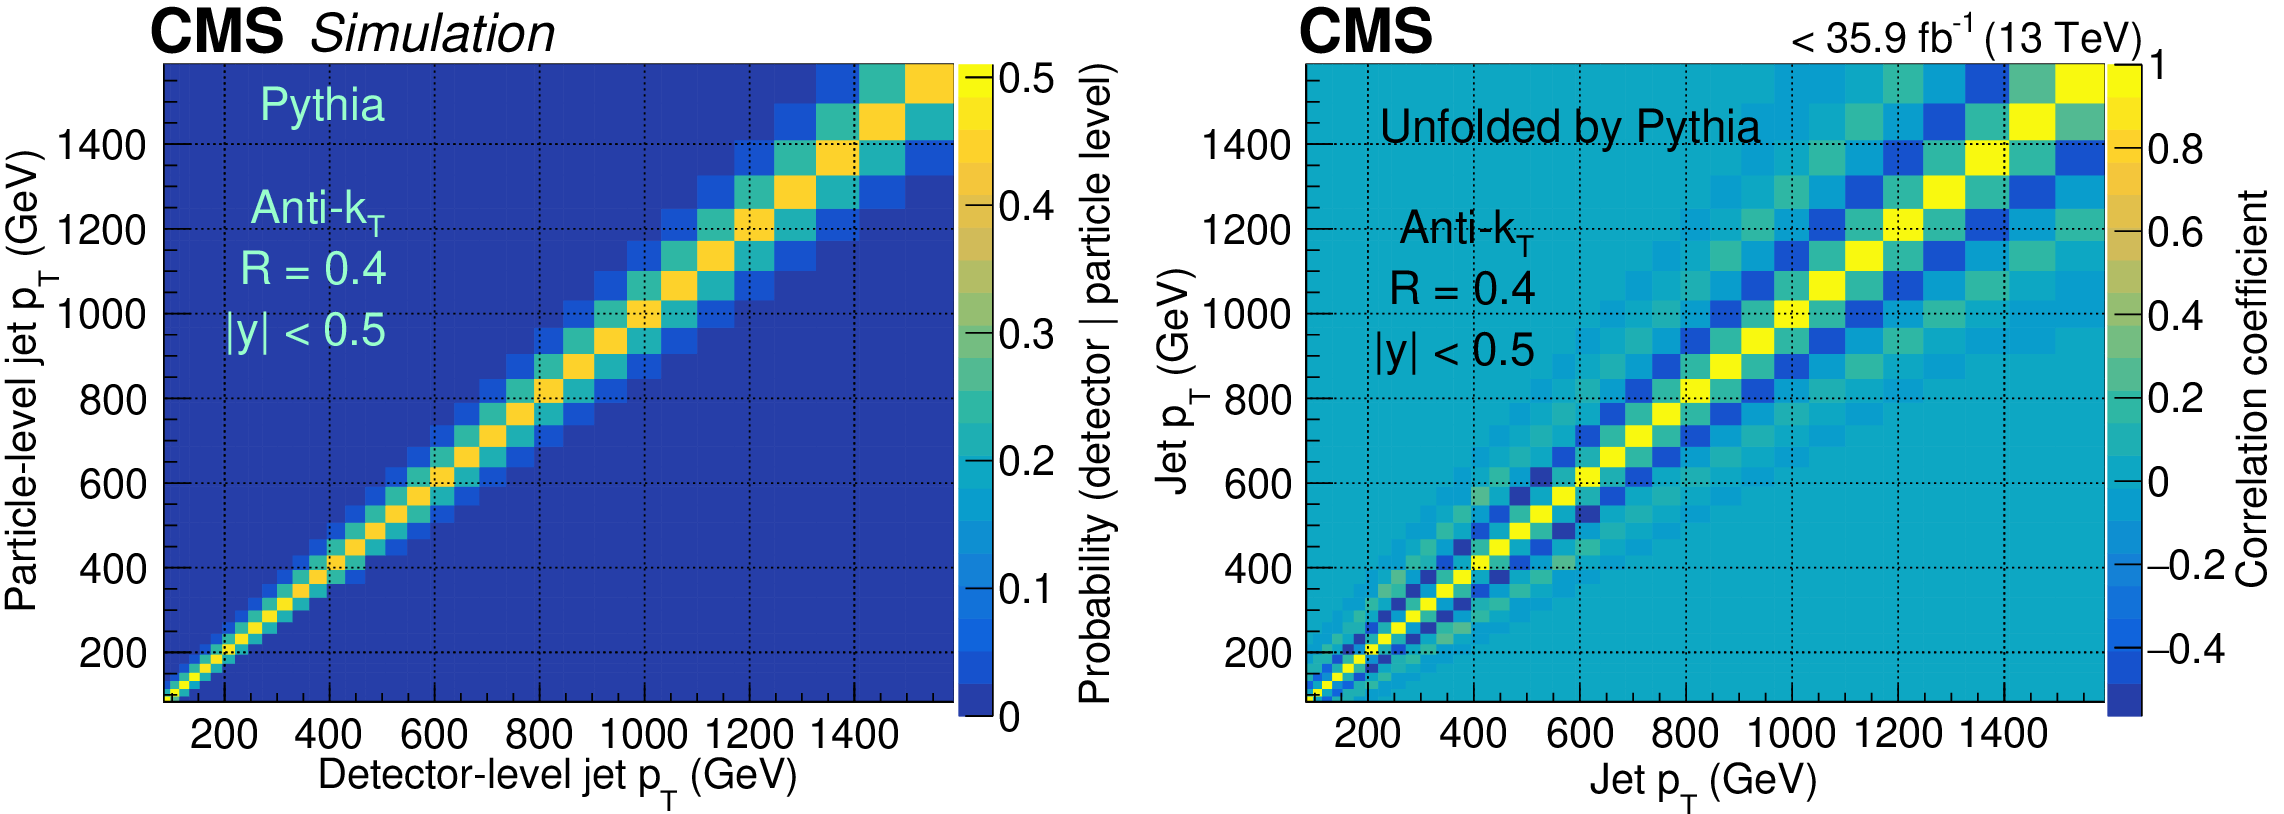
Figure 1:
Response matrix constructed from a simulation of a sample generated using PYTHIA, for AK4 jets in the $ {| y |} < $ 0.5 bin (left). A correlation matrix generated after data is unfolded by the D'Agostini unfolding using PYTHIA simulation for AK4 jets (right). |

png pdf |
Figure 1-a:
Response matrix constructed from a simulation of a sample generated using PYTHIA, for AK4 jets in the $ {| y |} < $ 0.5 bin. |
png pdf |
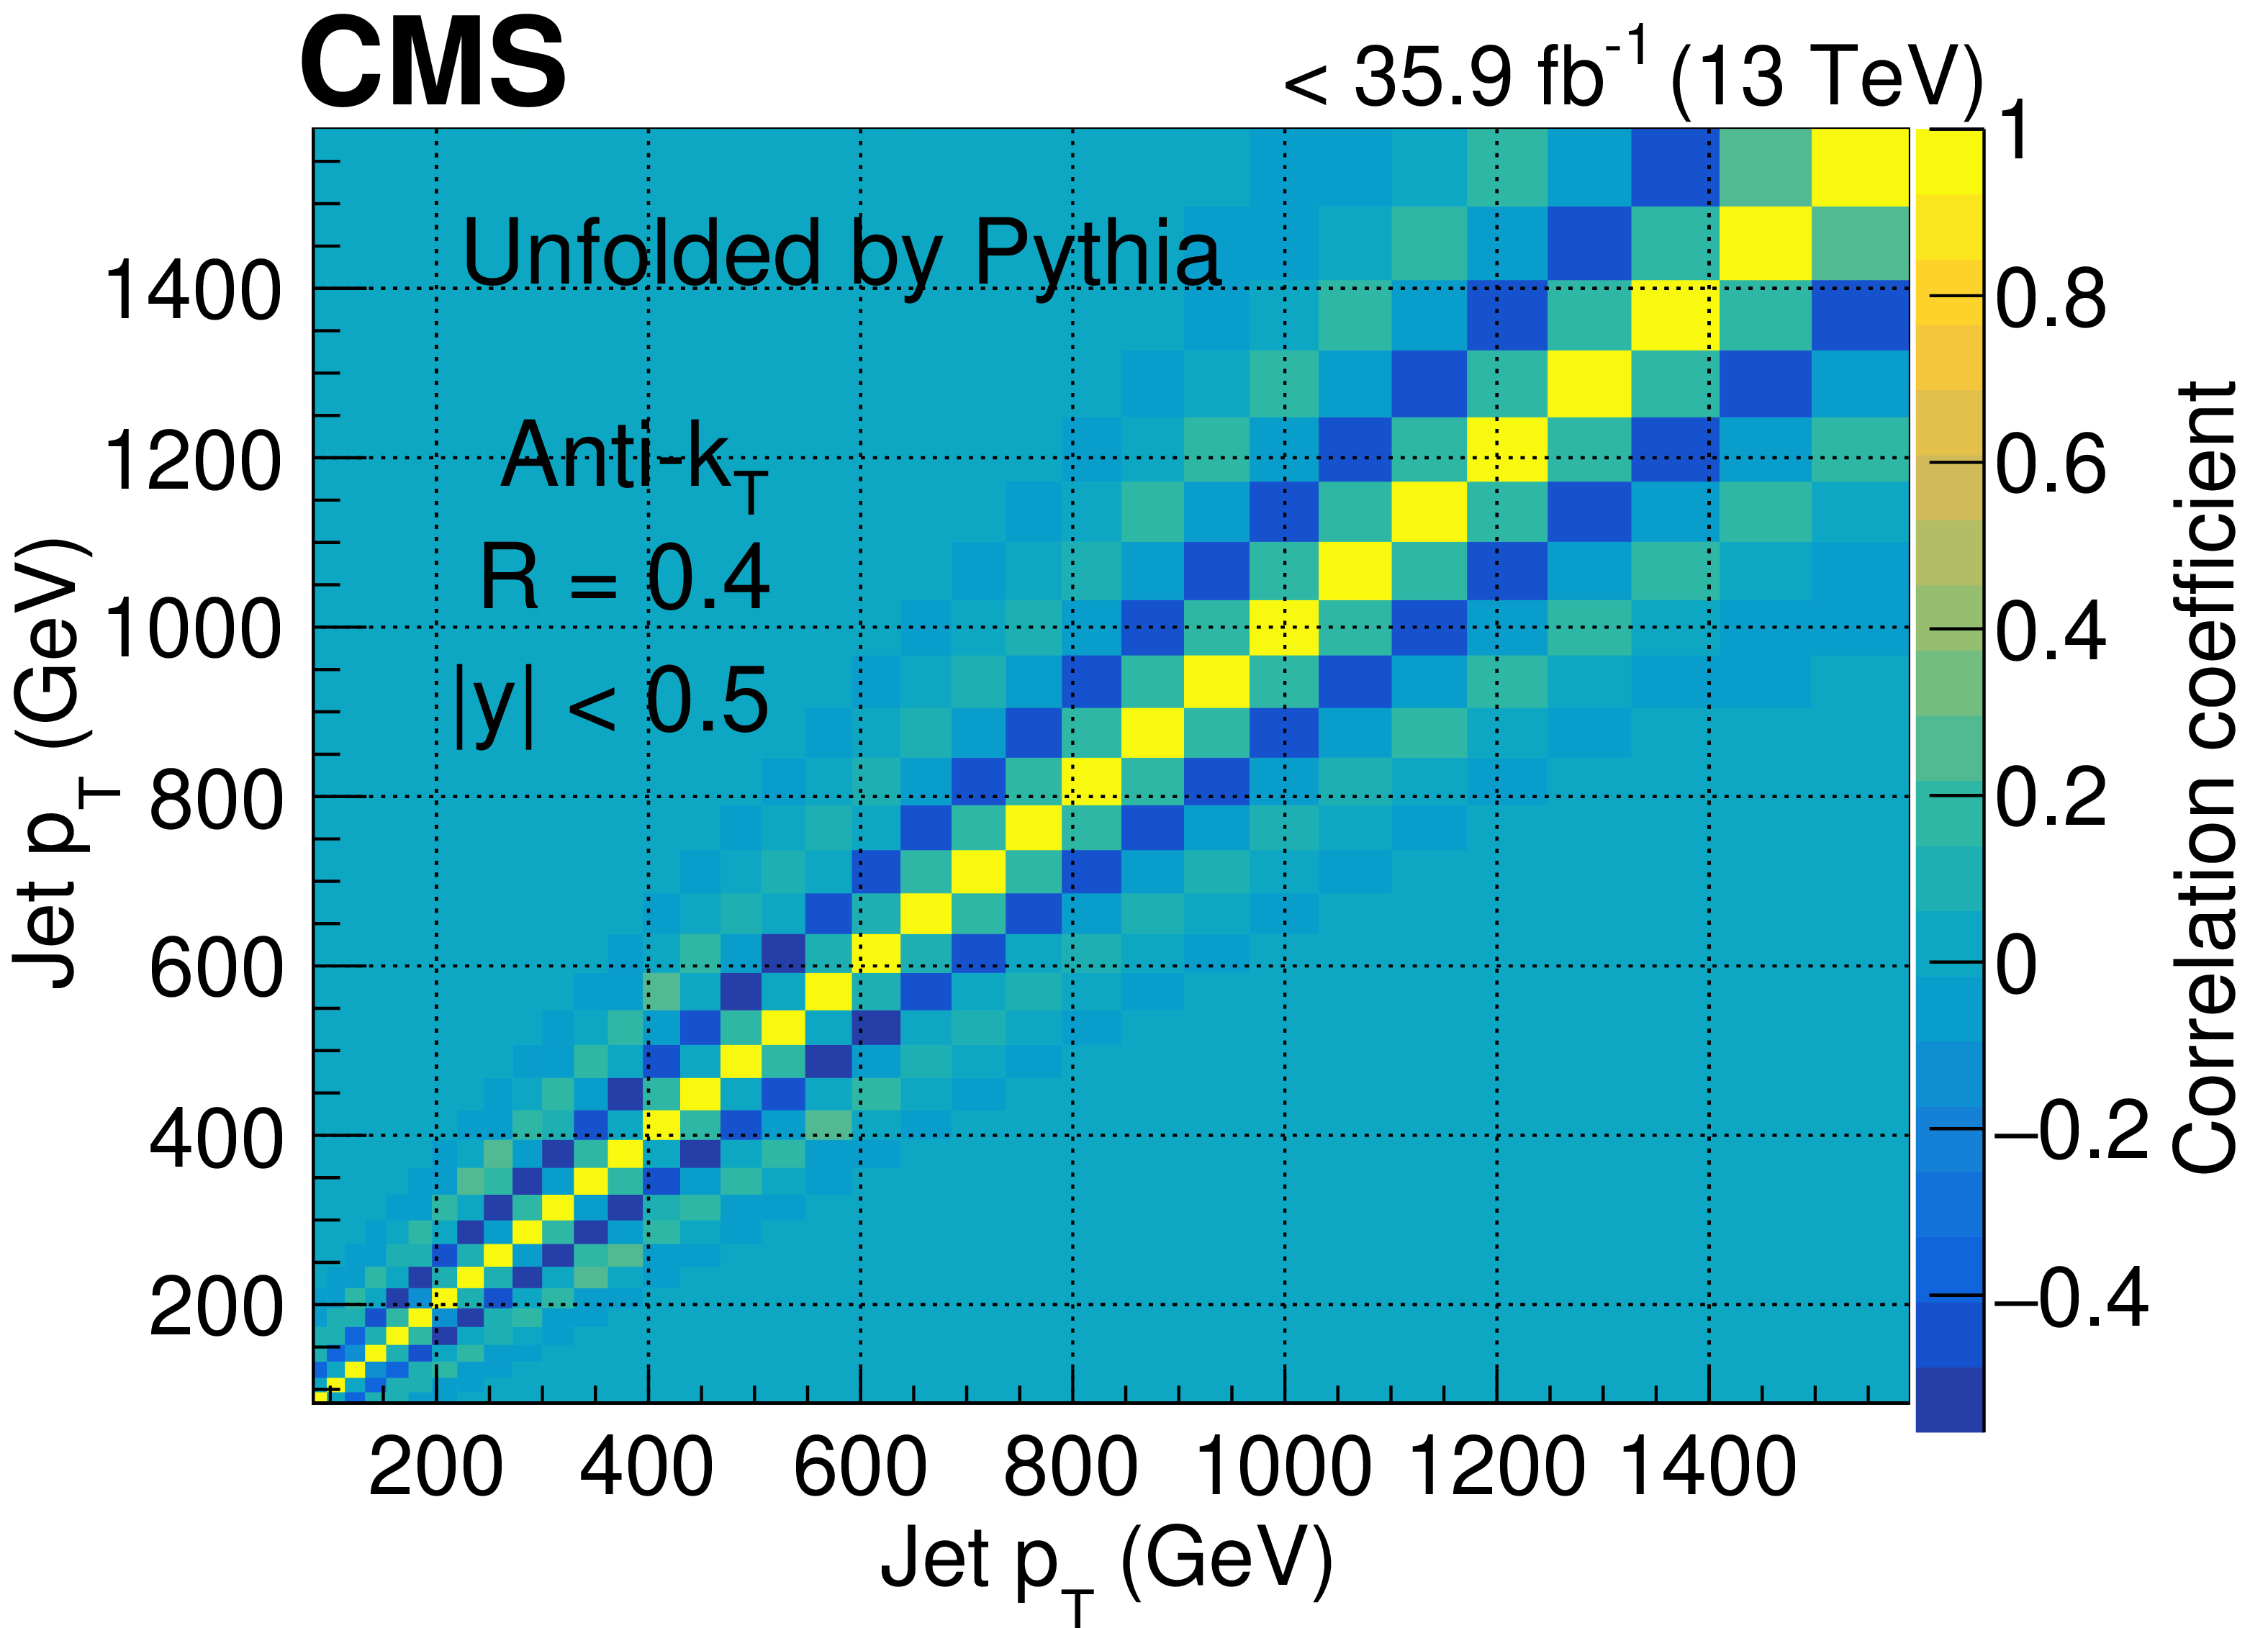
Figure 1-b:
A correlation matrix generated after data is unfolded by the D'Agostini unfolding using PYTHIA simulation for AK4 jets. |
png pdf |
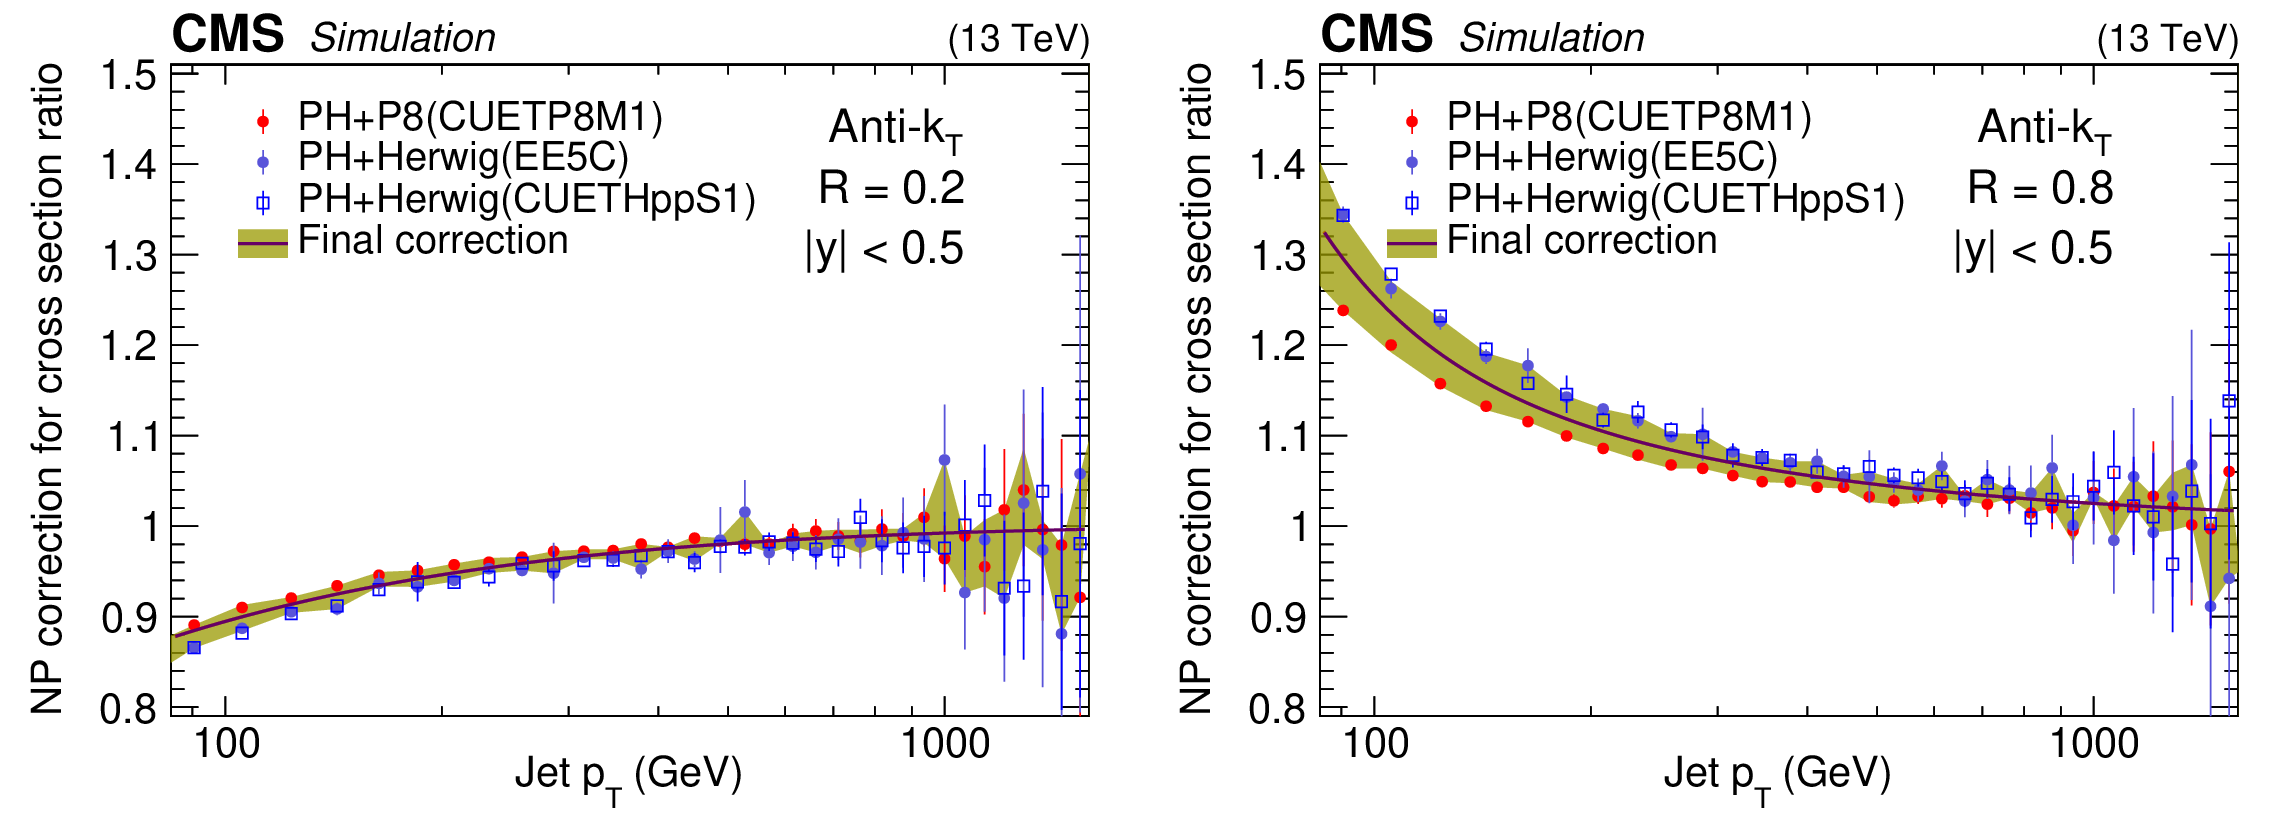
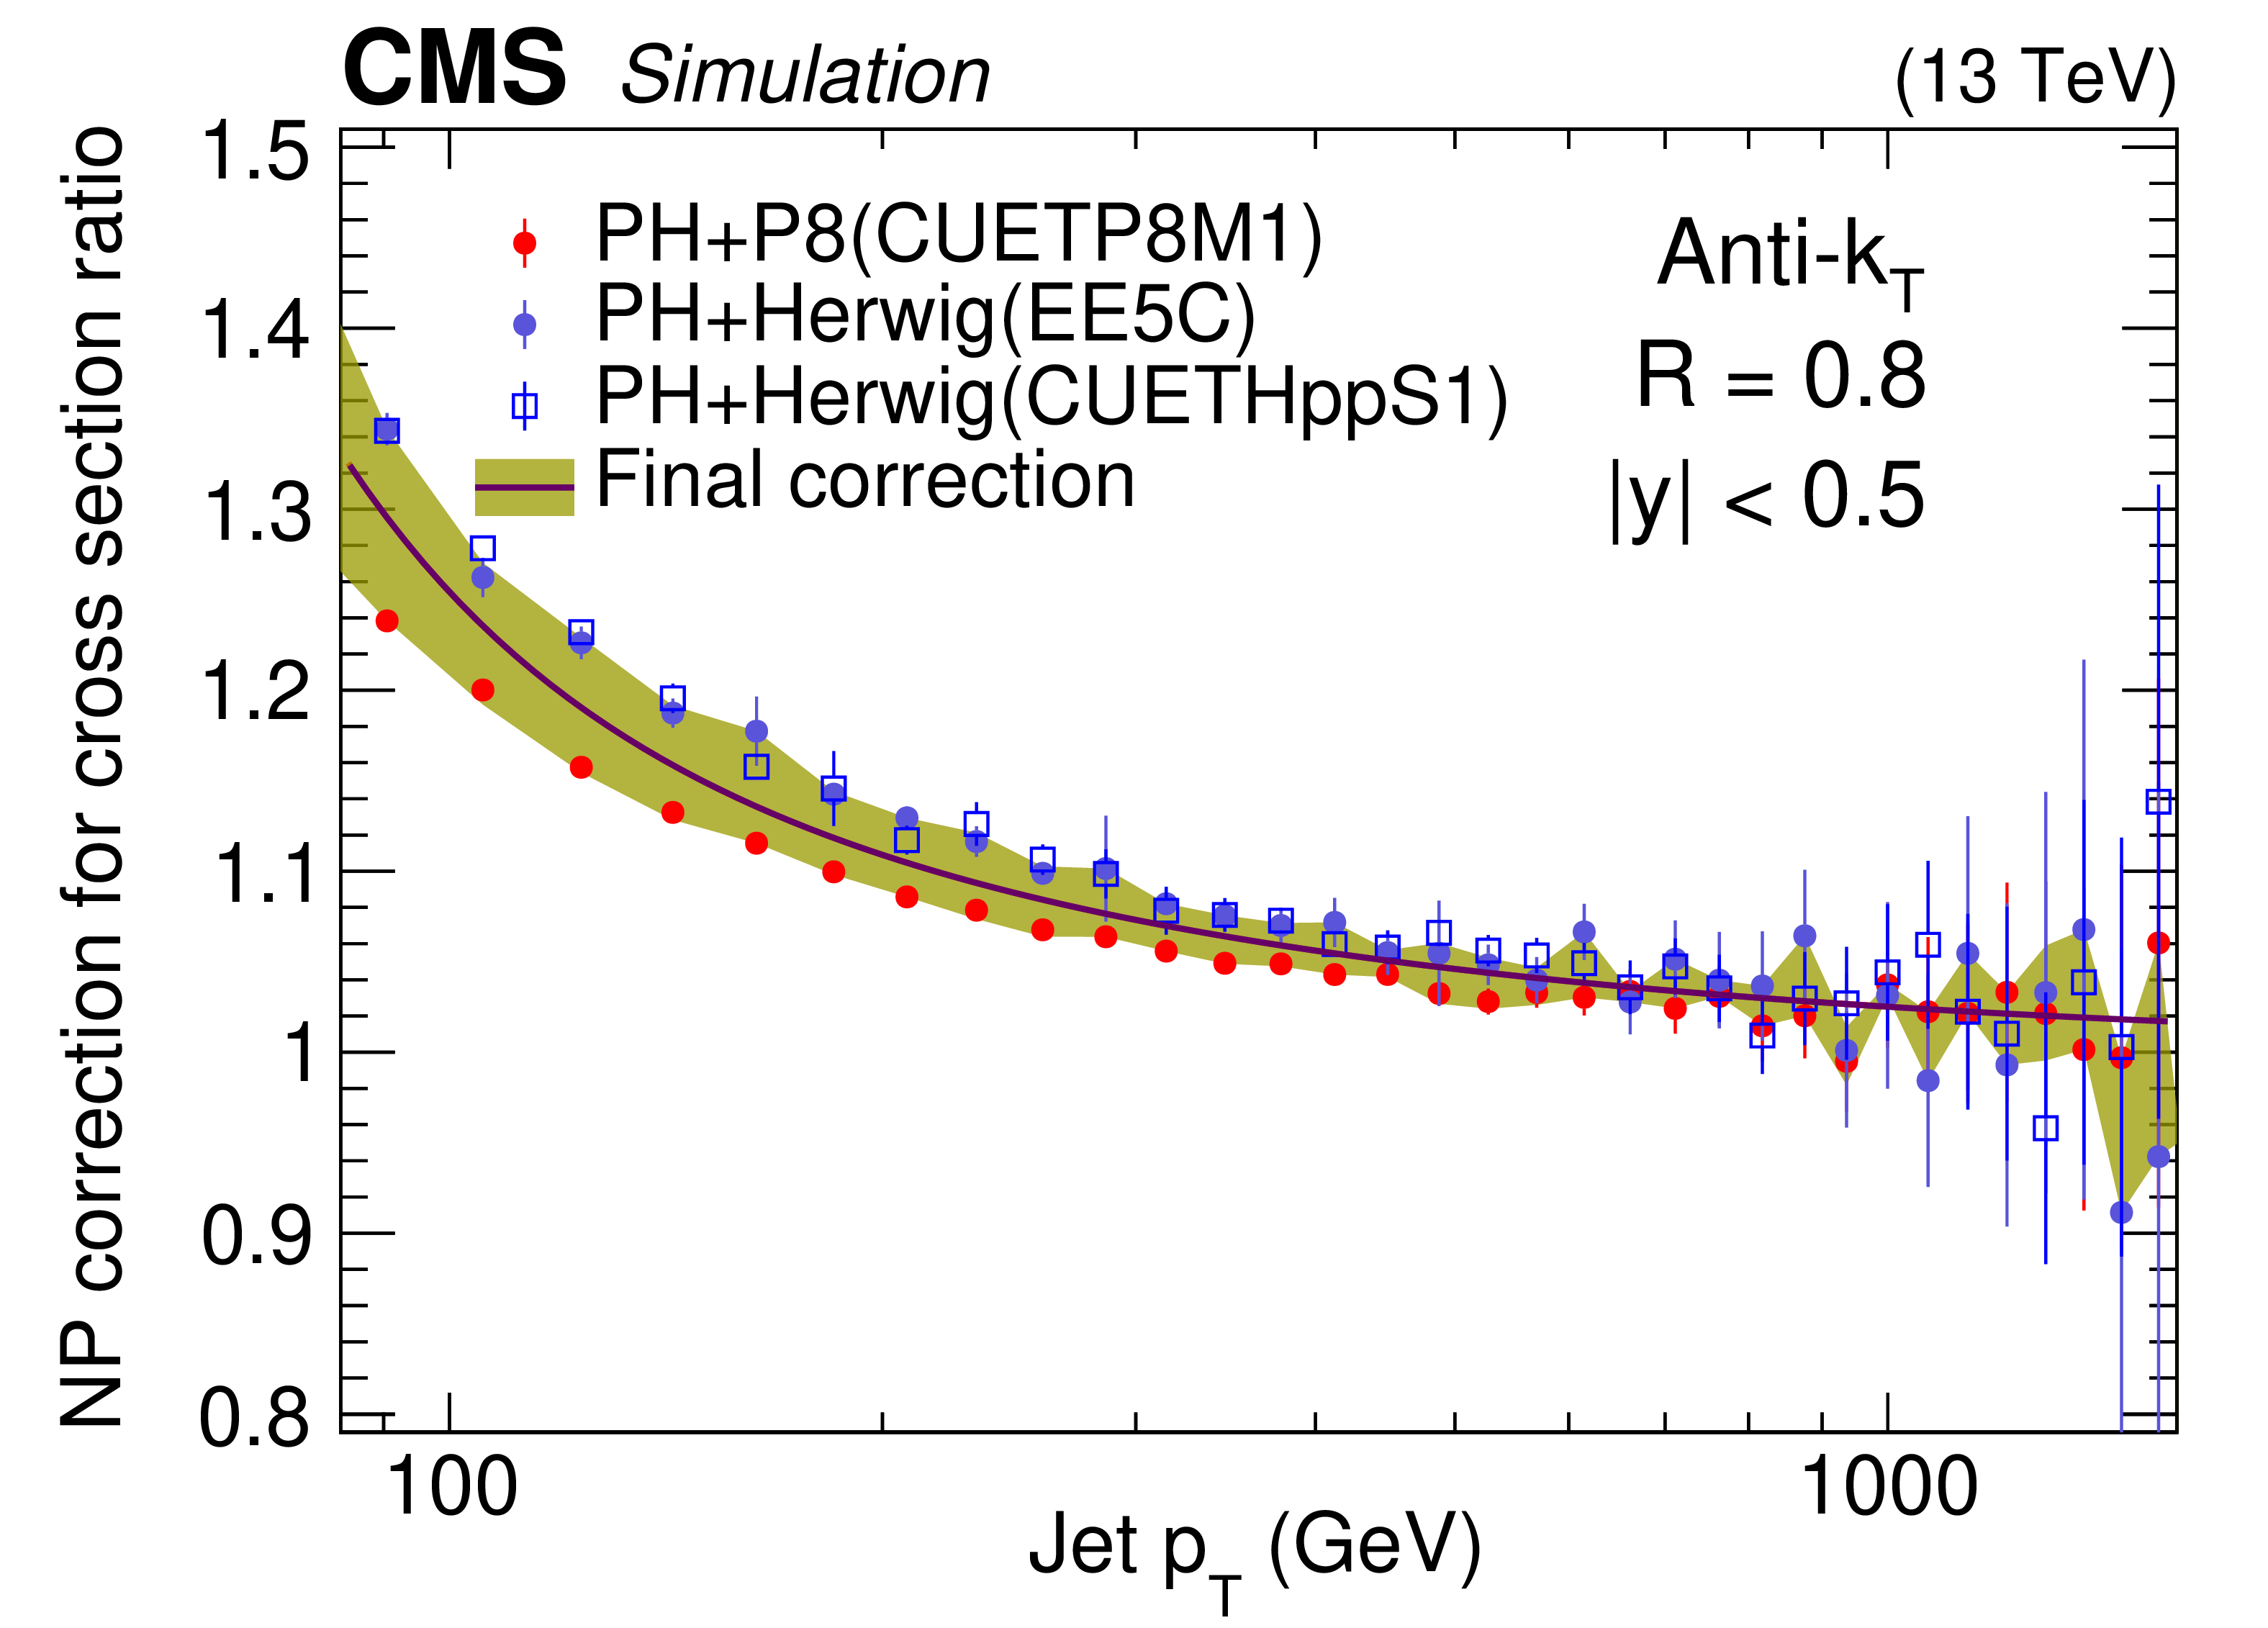
Figure 2:
Nonperturbative correction factor for the cross section ratio of inclusive AK2 (left) and AK8 jets (right) with respect to the AK4 jets in the rapidity bin $ {| y |} < $ 0.5. Vertical error bars represent the statistical uncertainty of the NP correction for different predictions. |
png pdf |
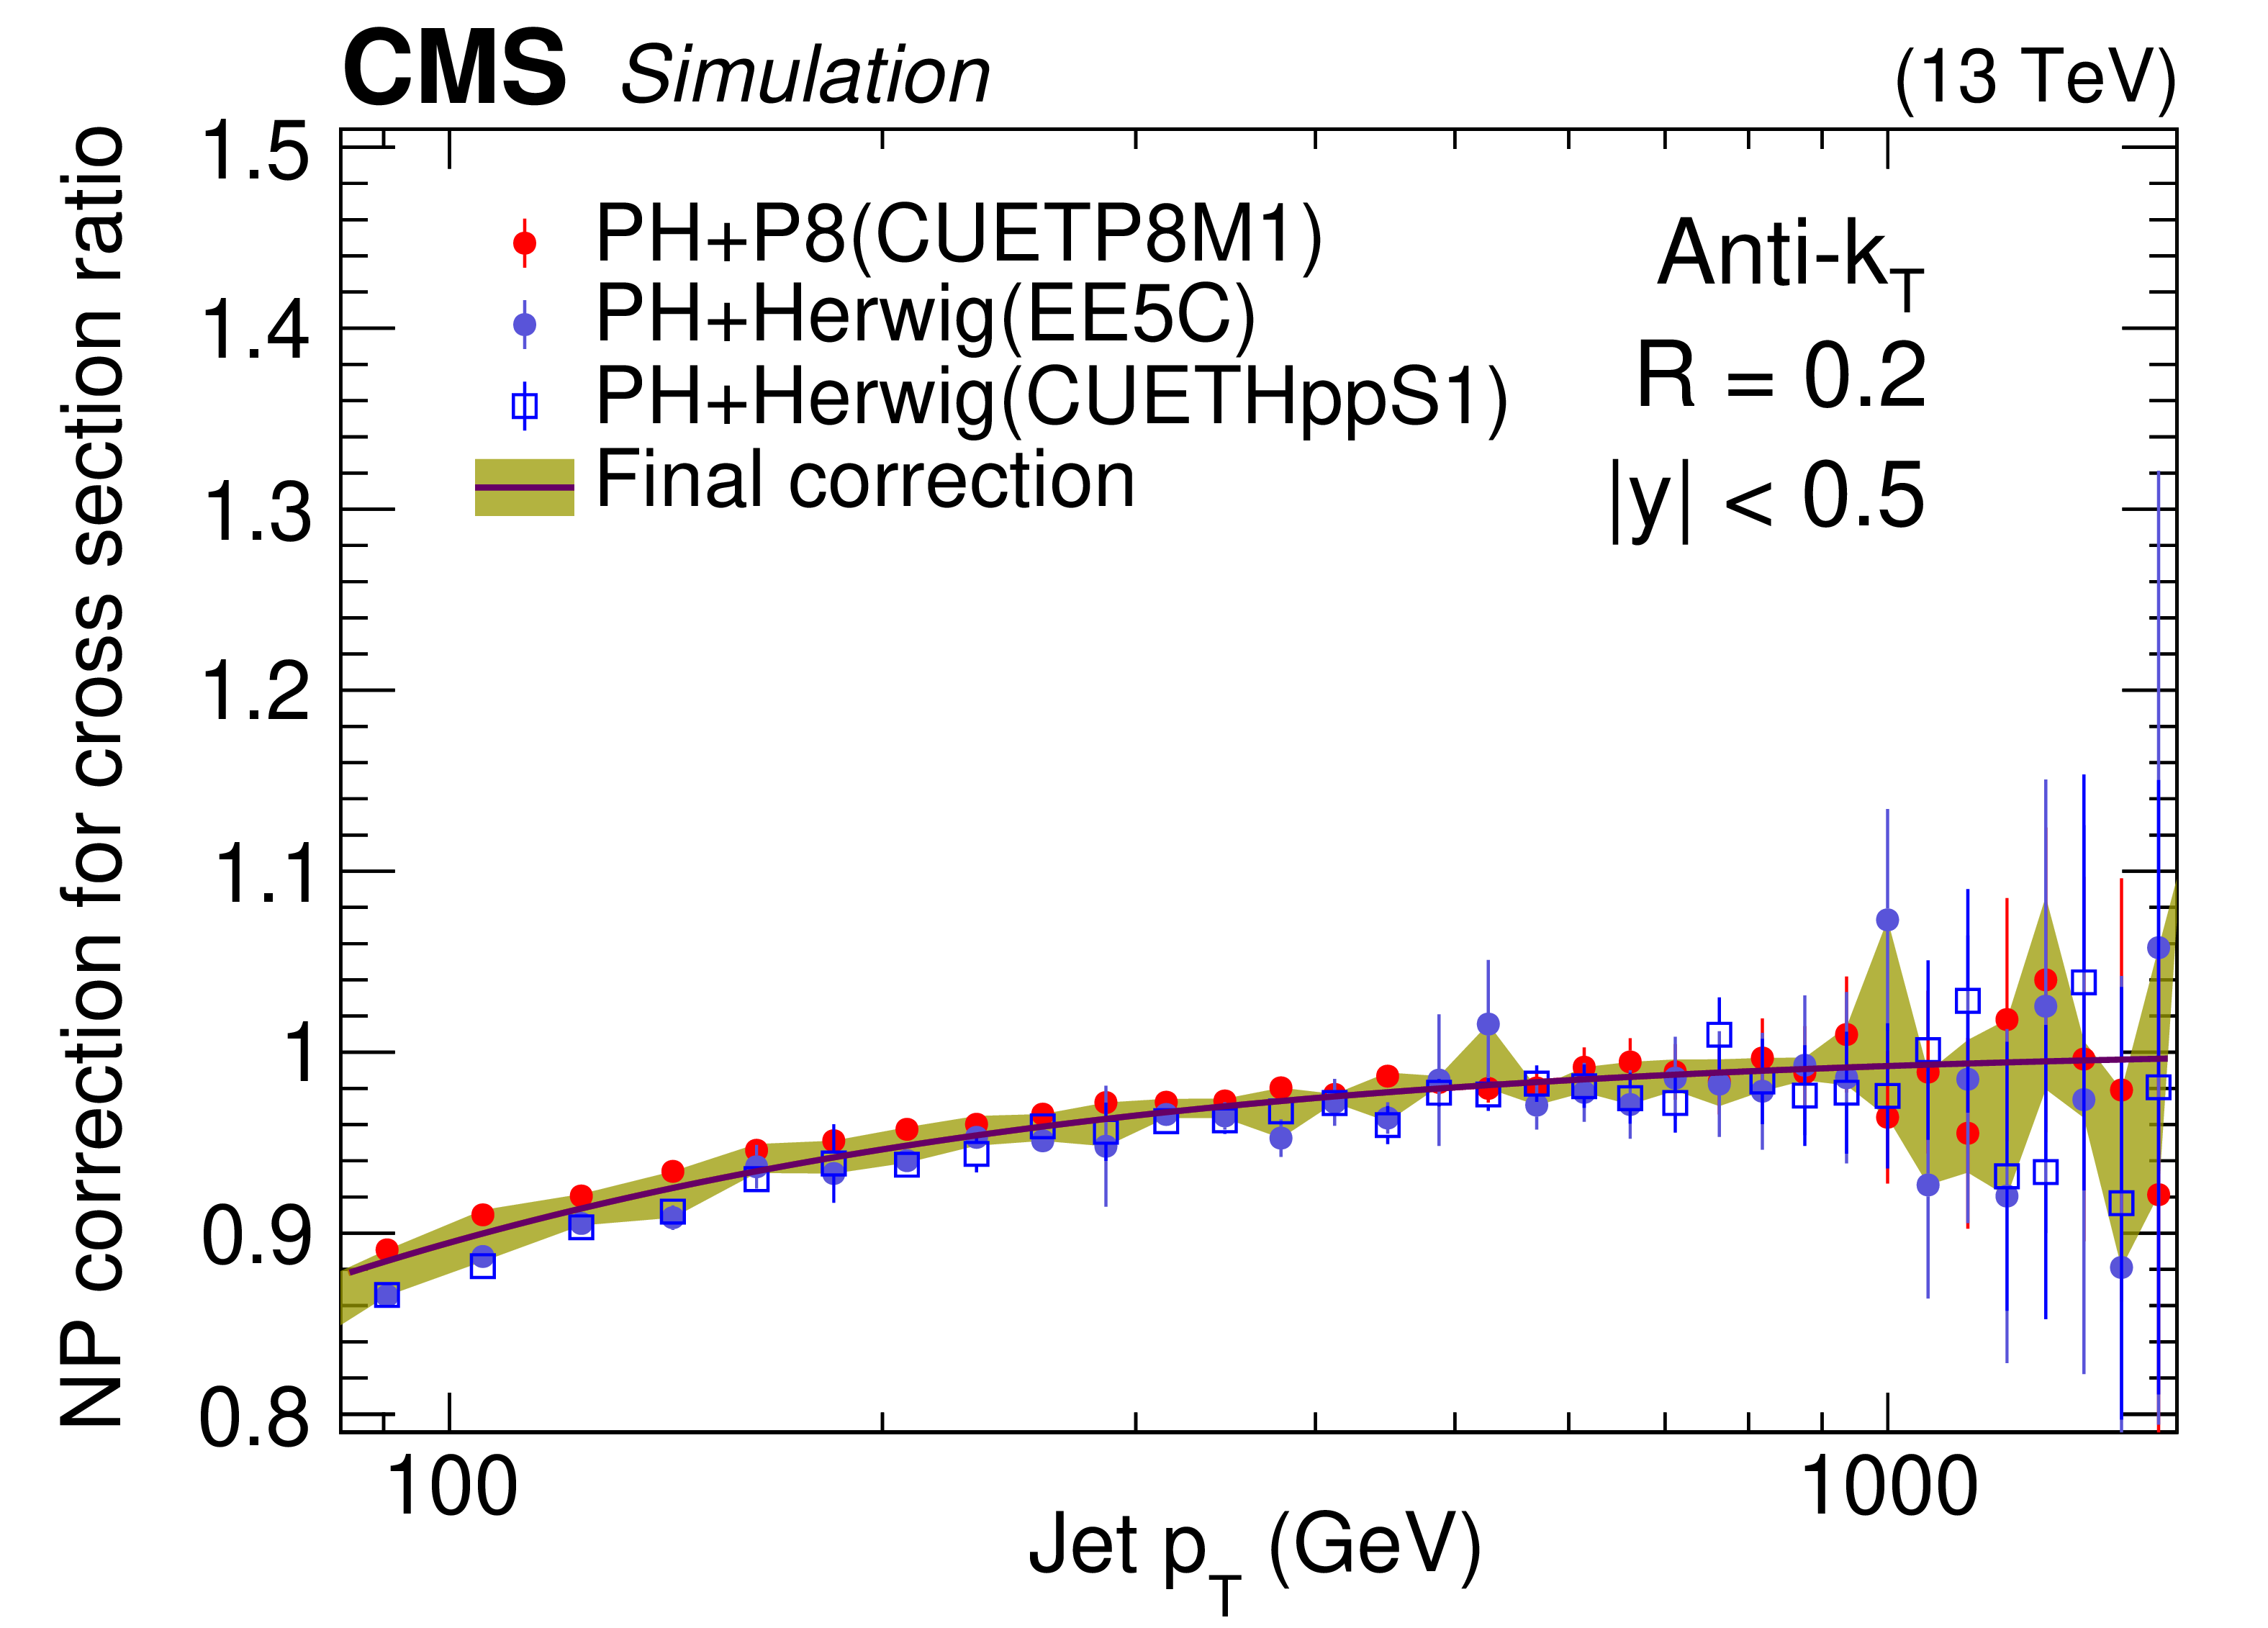
Figure 2-a:
Nonperturbative correction factor for the cross section ratio of inclusive AK2 jets with respect to the AK4 jets in the rapidity bin $ {| y |} < $ 0.5. Vertical error bars represent the statistical uncertainty of the NP correction for different predictions. |
png pdf |
Figure 2-b:
Nonperturbative correction factor for the cross section ratio of inclusive AK8 jets with respect to the AK4 jets in the rapidity bin $ {| y |} < $ 0.5. Vertical error bars represent the statistical uncertainty of the NP correction for different predictions. |
png pdf |
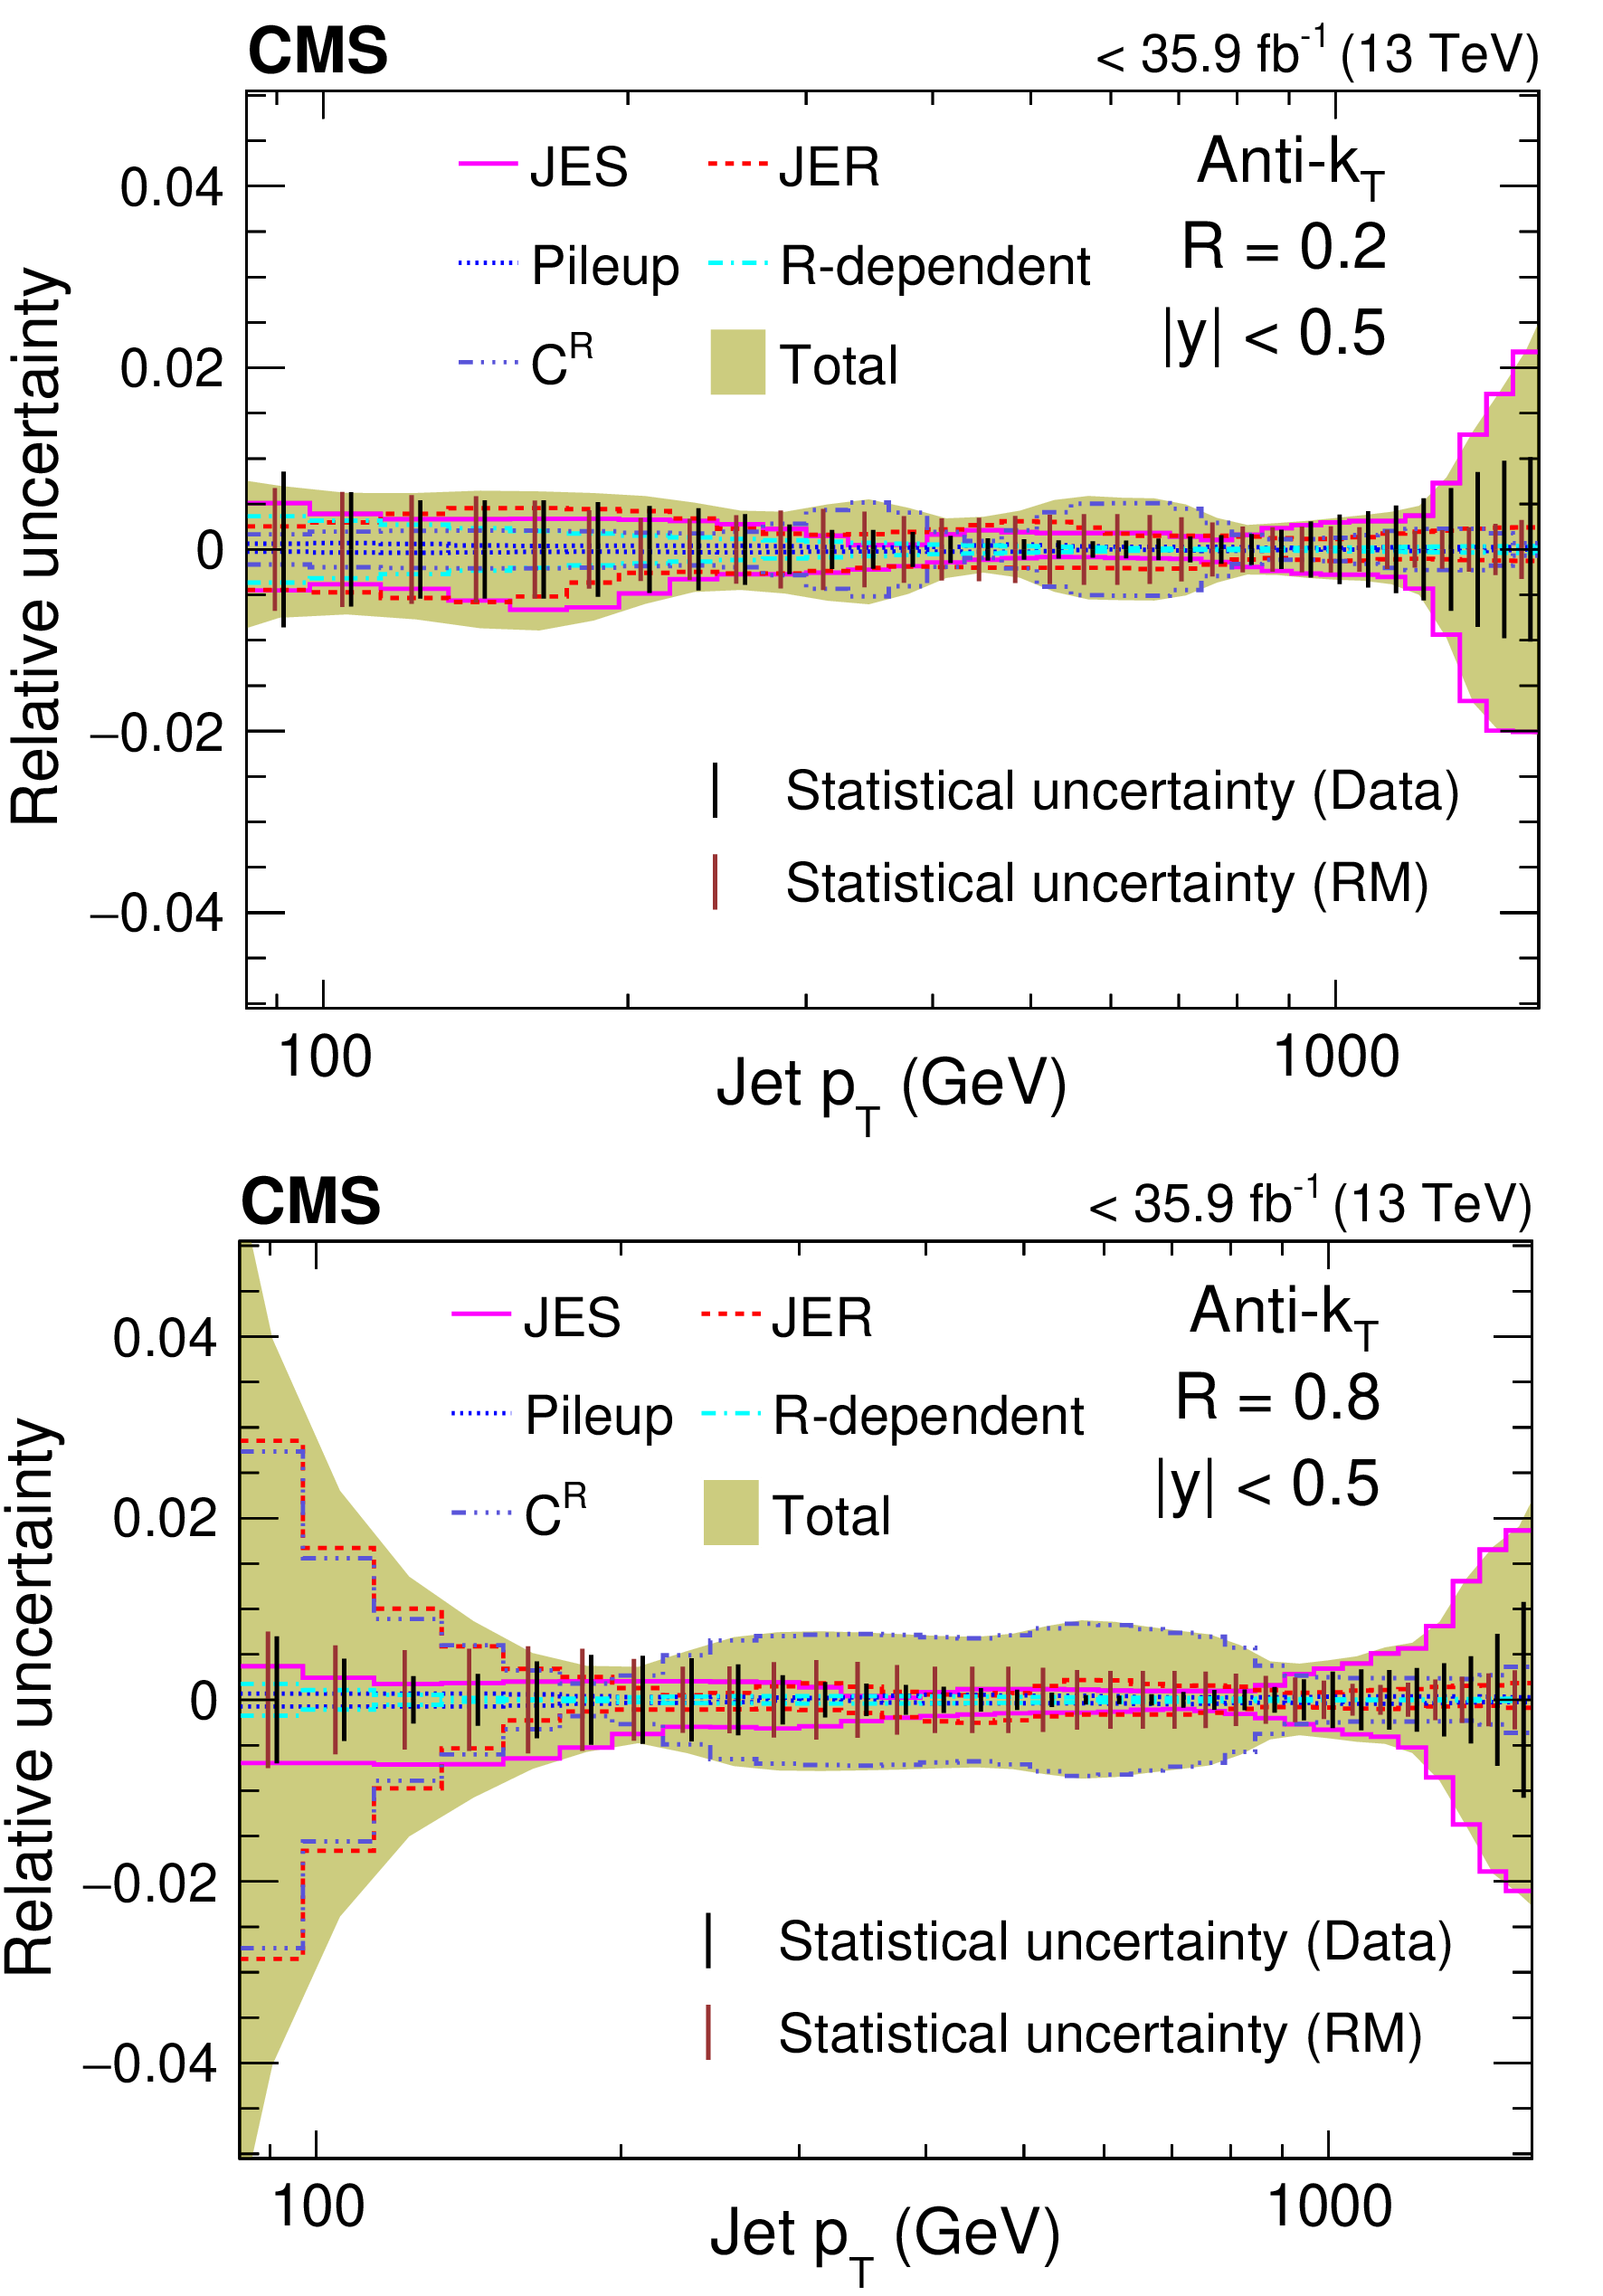
Figure 3:
Total uncertainty (relative) from experimental sources for the ratio of cross section of inclusive jets of size 0.2 (top) and 0.8 (bottom) with respect to that of AK4 jets in the rapidity bin $ {| y |} < $ 0.5. Statistical uncertainties are also overlaid as vertical black (red) bars for data (response matrices, RM, in simulation). |
png pdf |
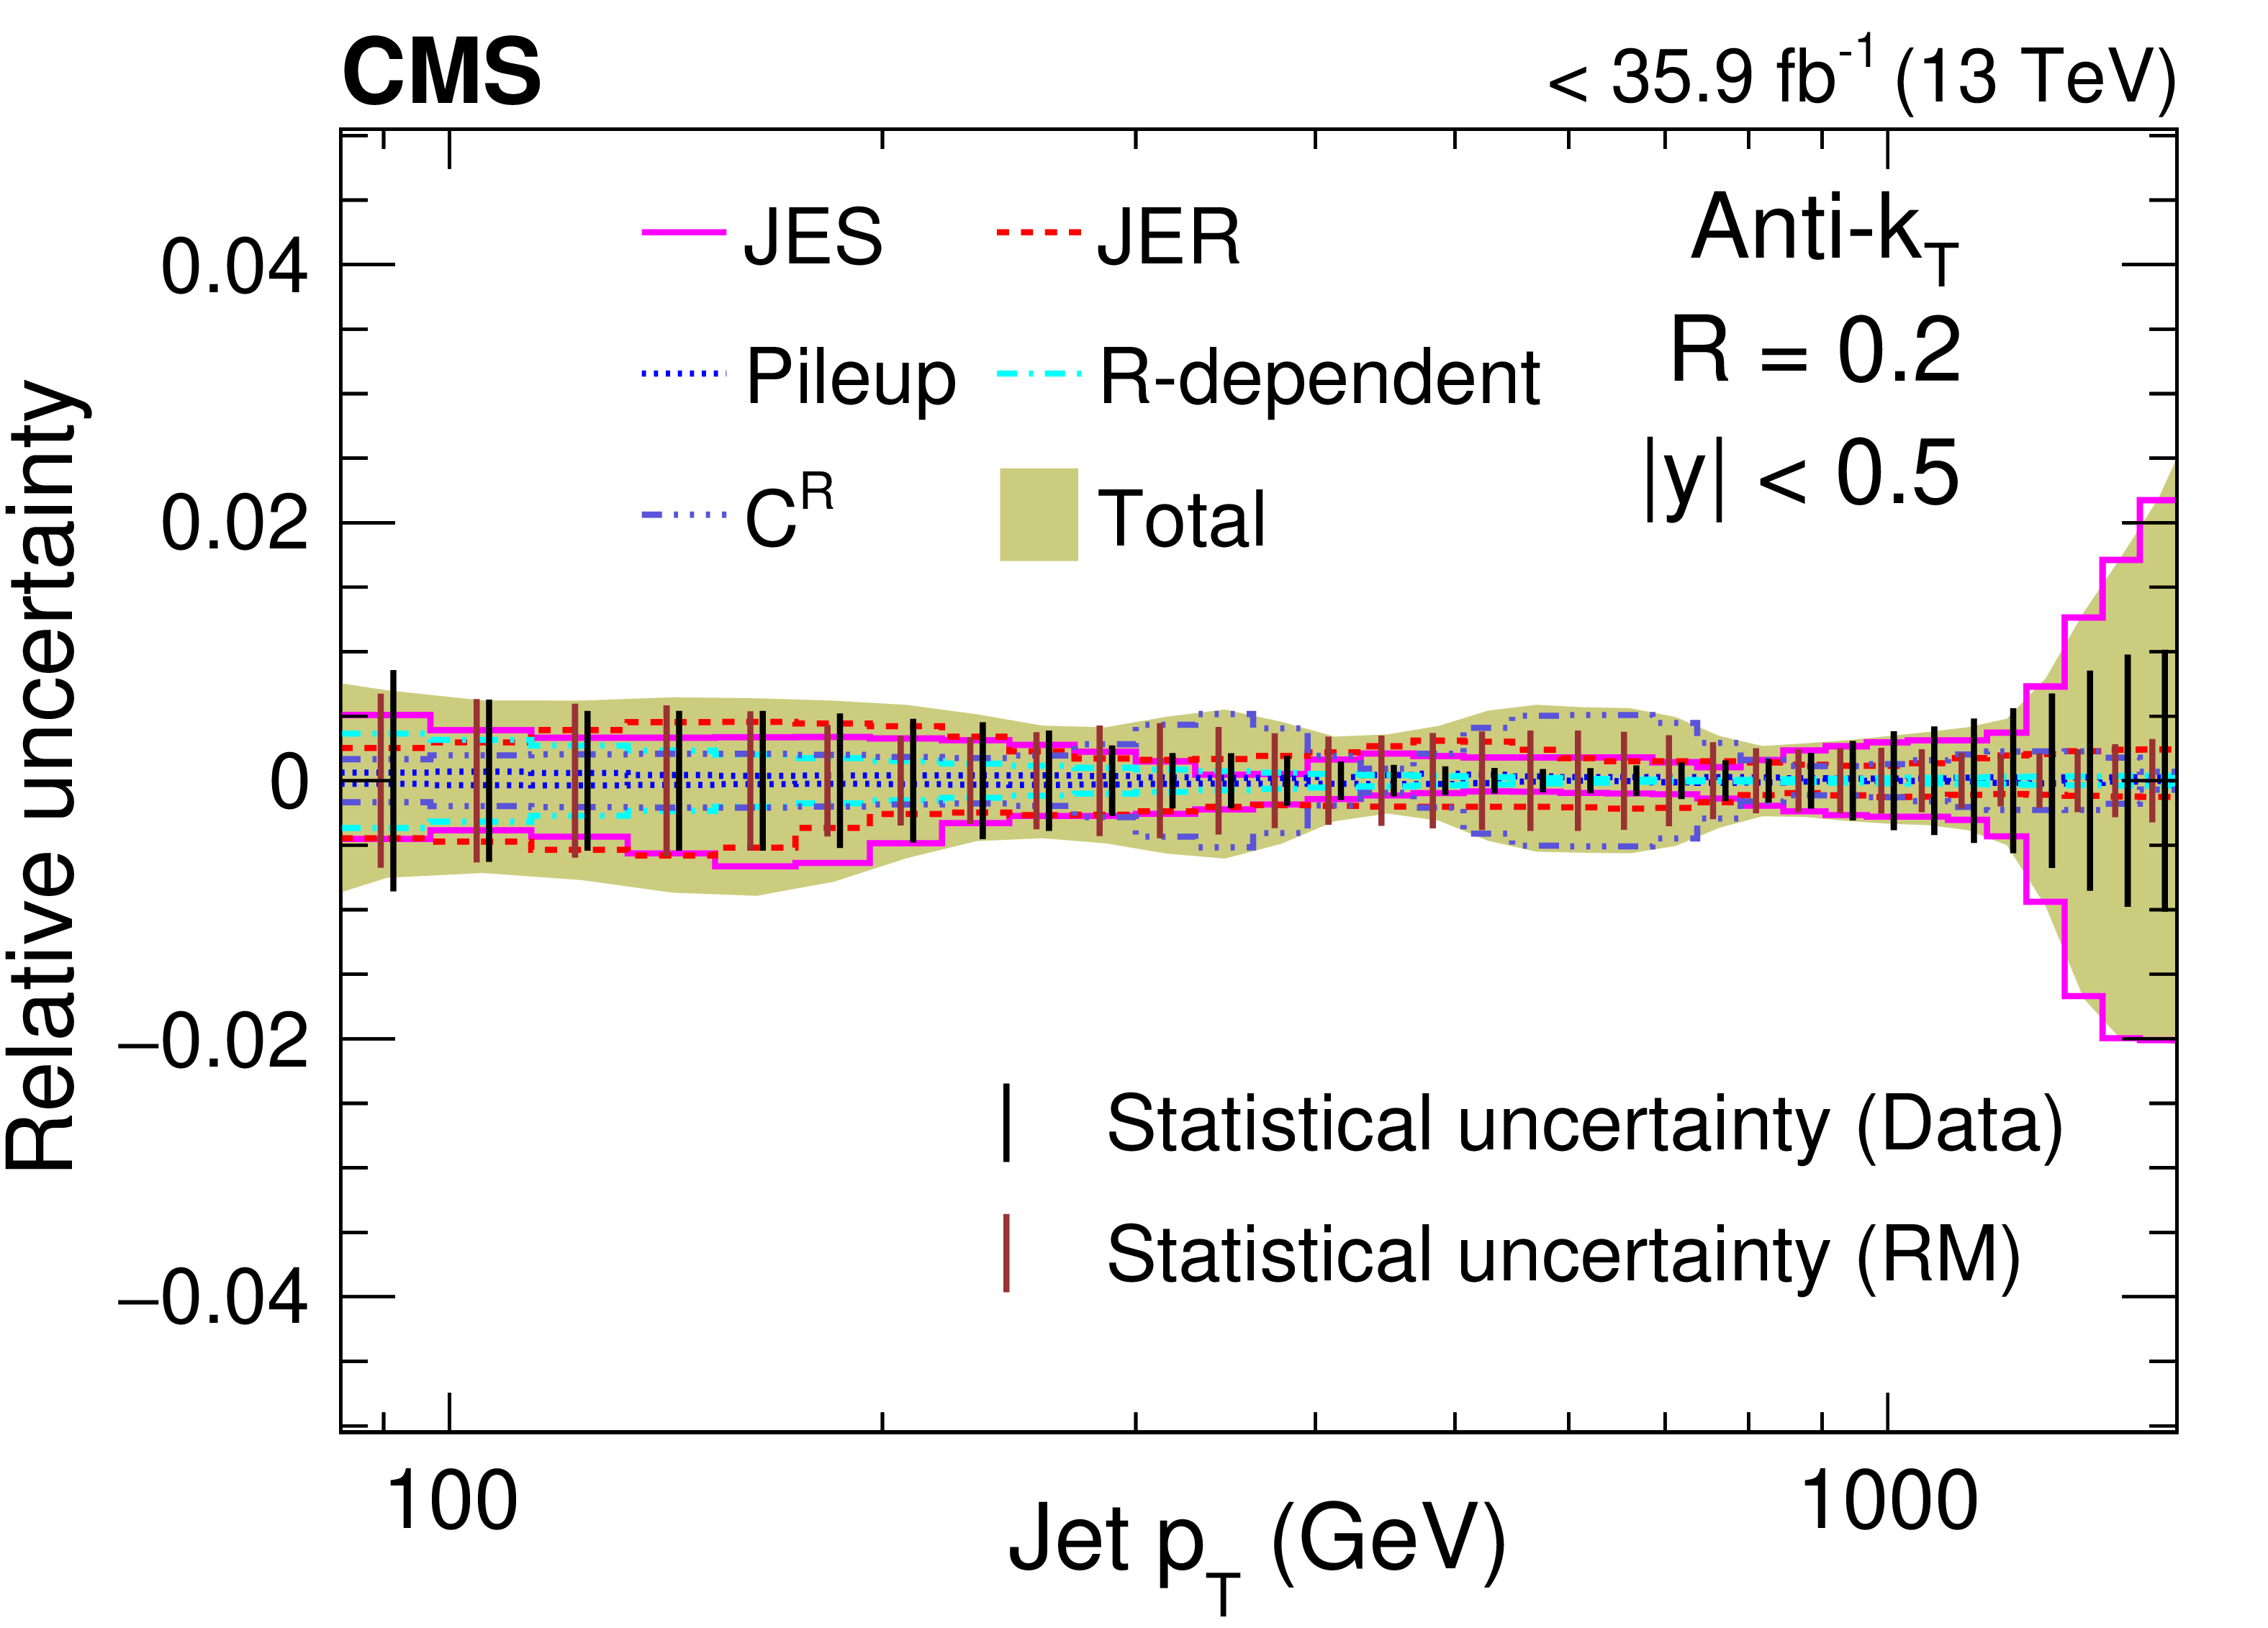
Figure 3-a:
Total uncertainty (relative) from experimental sources for the ratio of cross section of inclusive jets of size 0.2 with respect to that of AK4 jets in the rapidity bin $ {| y |} < $ 0.5. Statistical uncertainties are also overlaid as vertical black (red) bars for data (response matrices, RM, in simulation). |
png pdf |
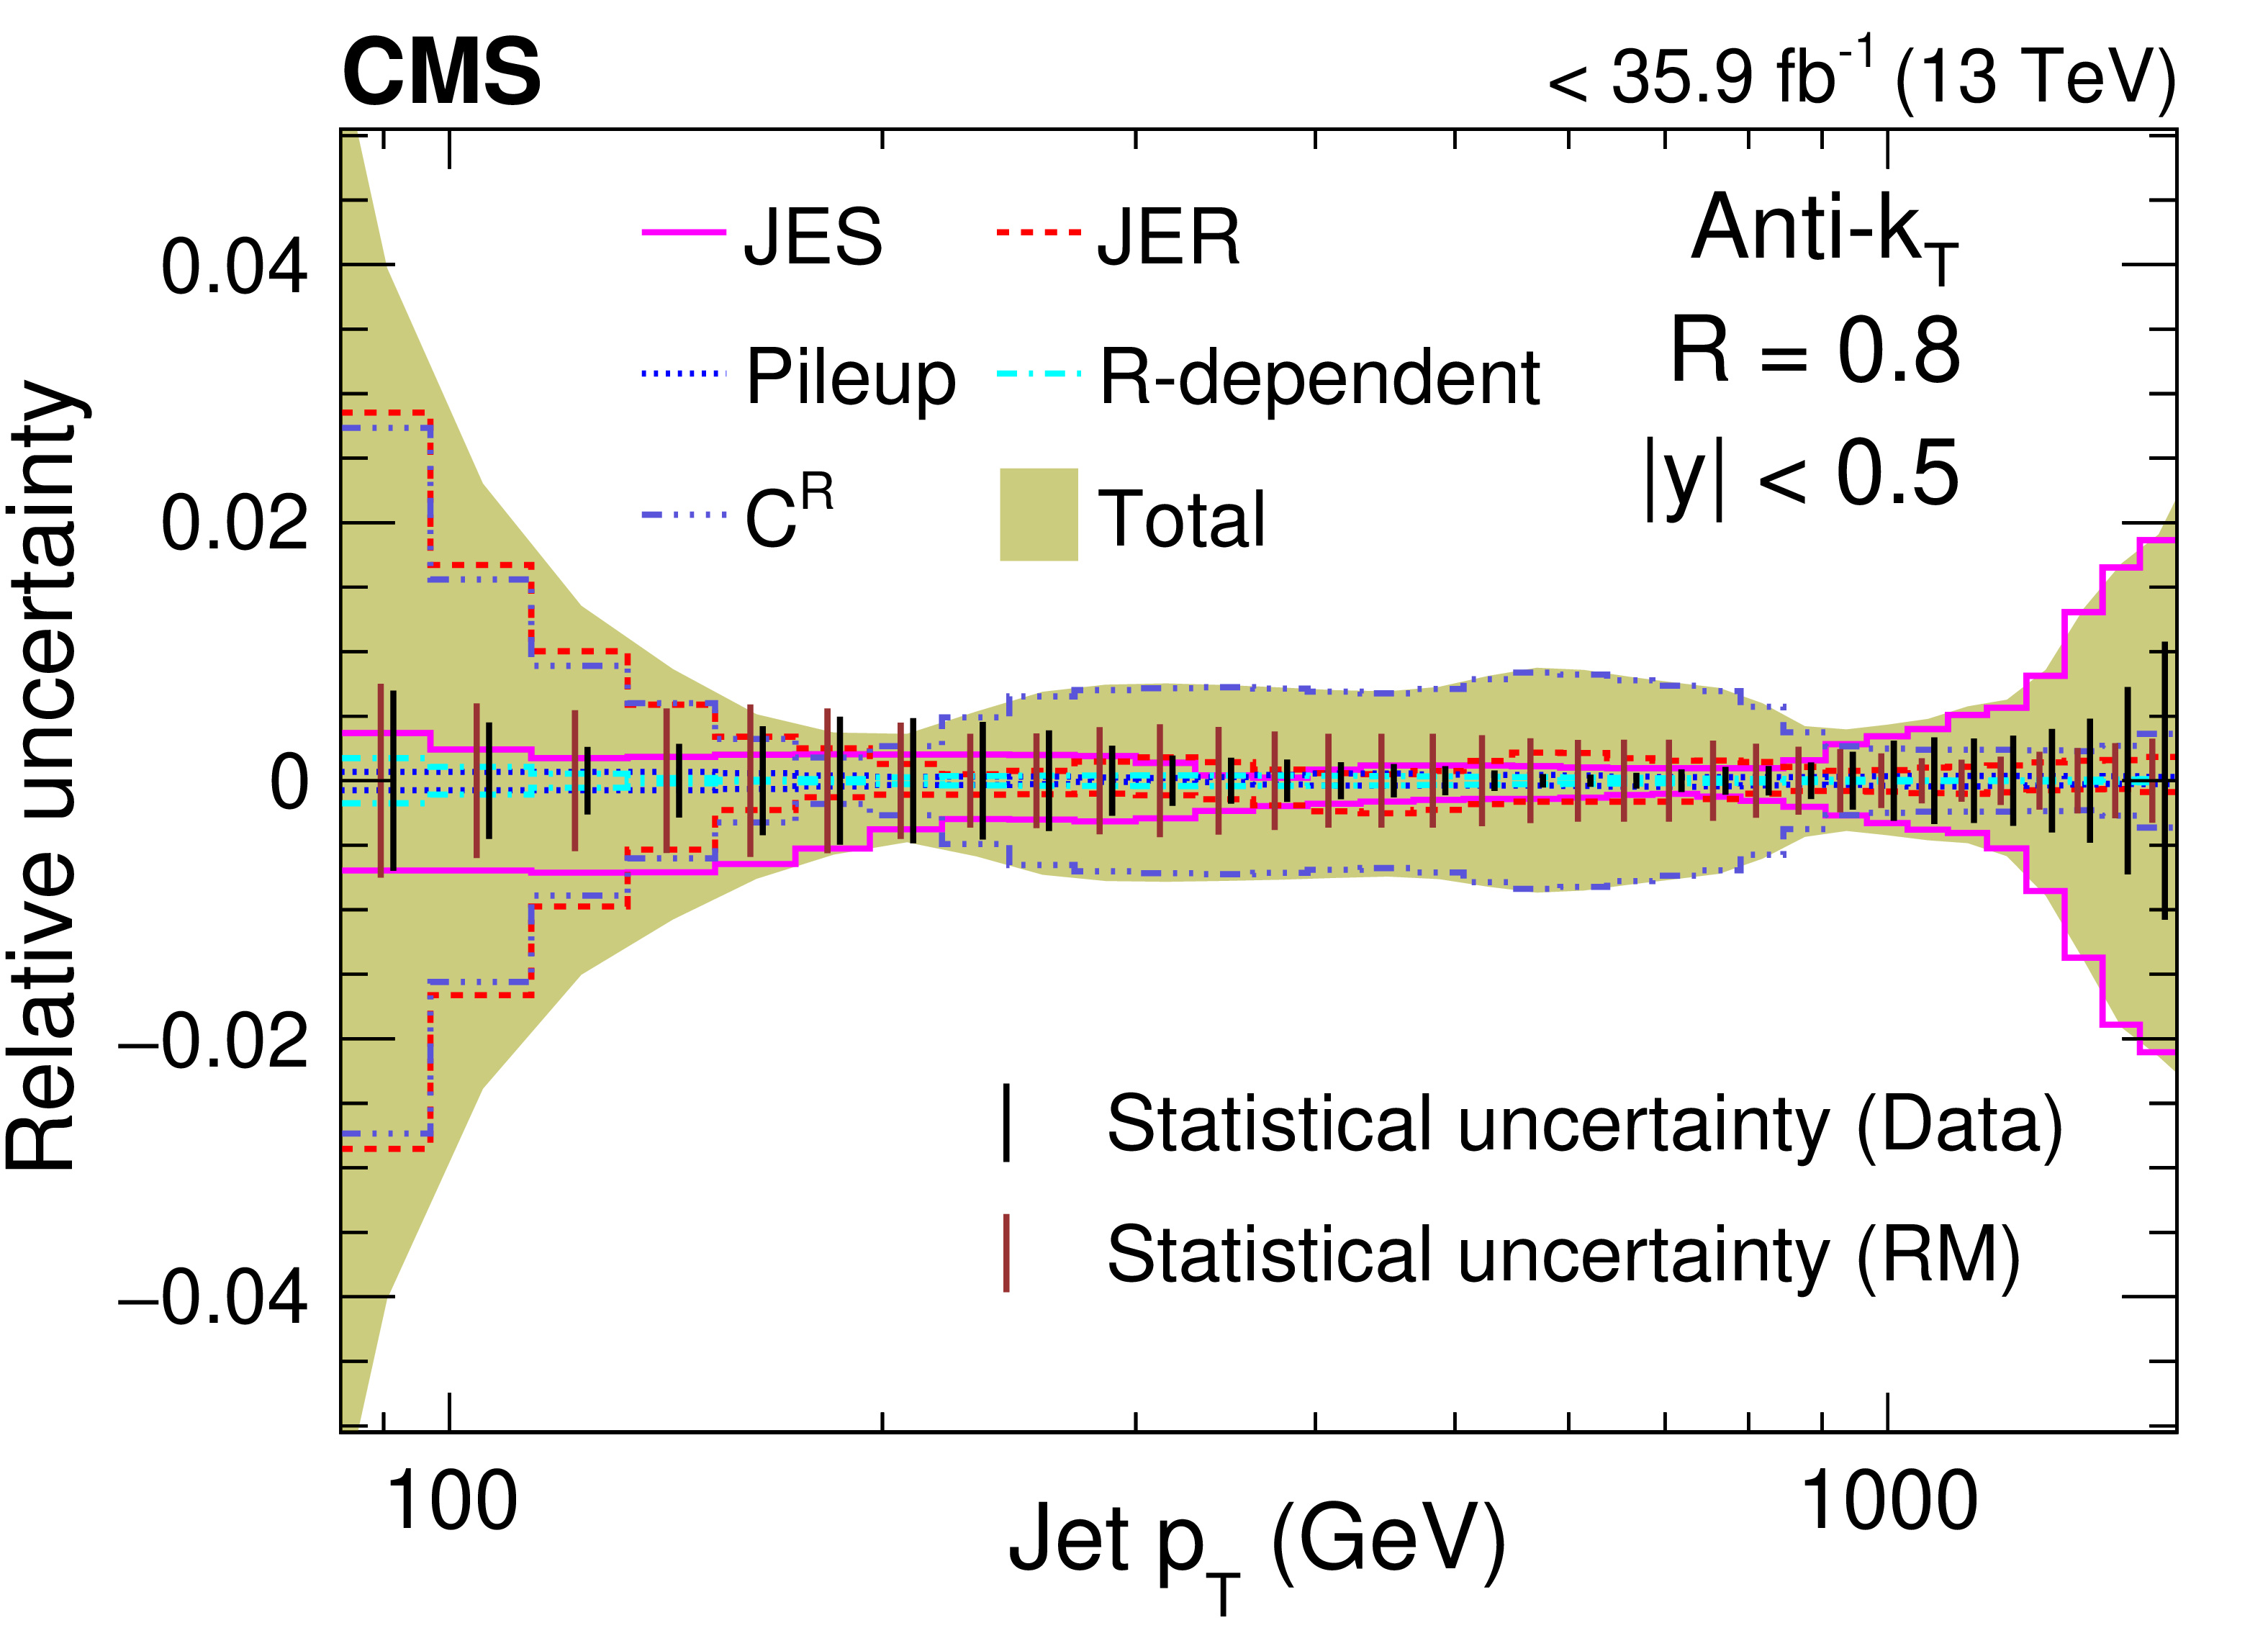
Figure 3-b:
Total uncertainty (relative) from experimental sources for the ratio of cross section of inclusive jets of size 0.8 with respect to that of AK4 jets in the rapidity bin $ {| y |} < $ 0.5. Statistical uncertainties are also overlaid as vertical black (red) bars for data (response matrices, RM, in simulation). |
png pdf |
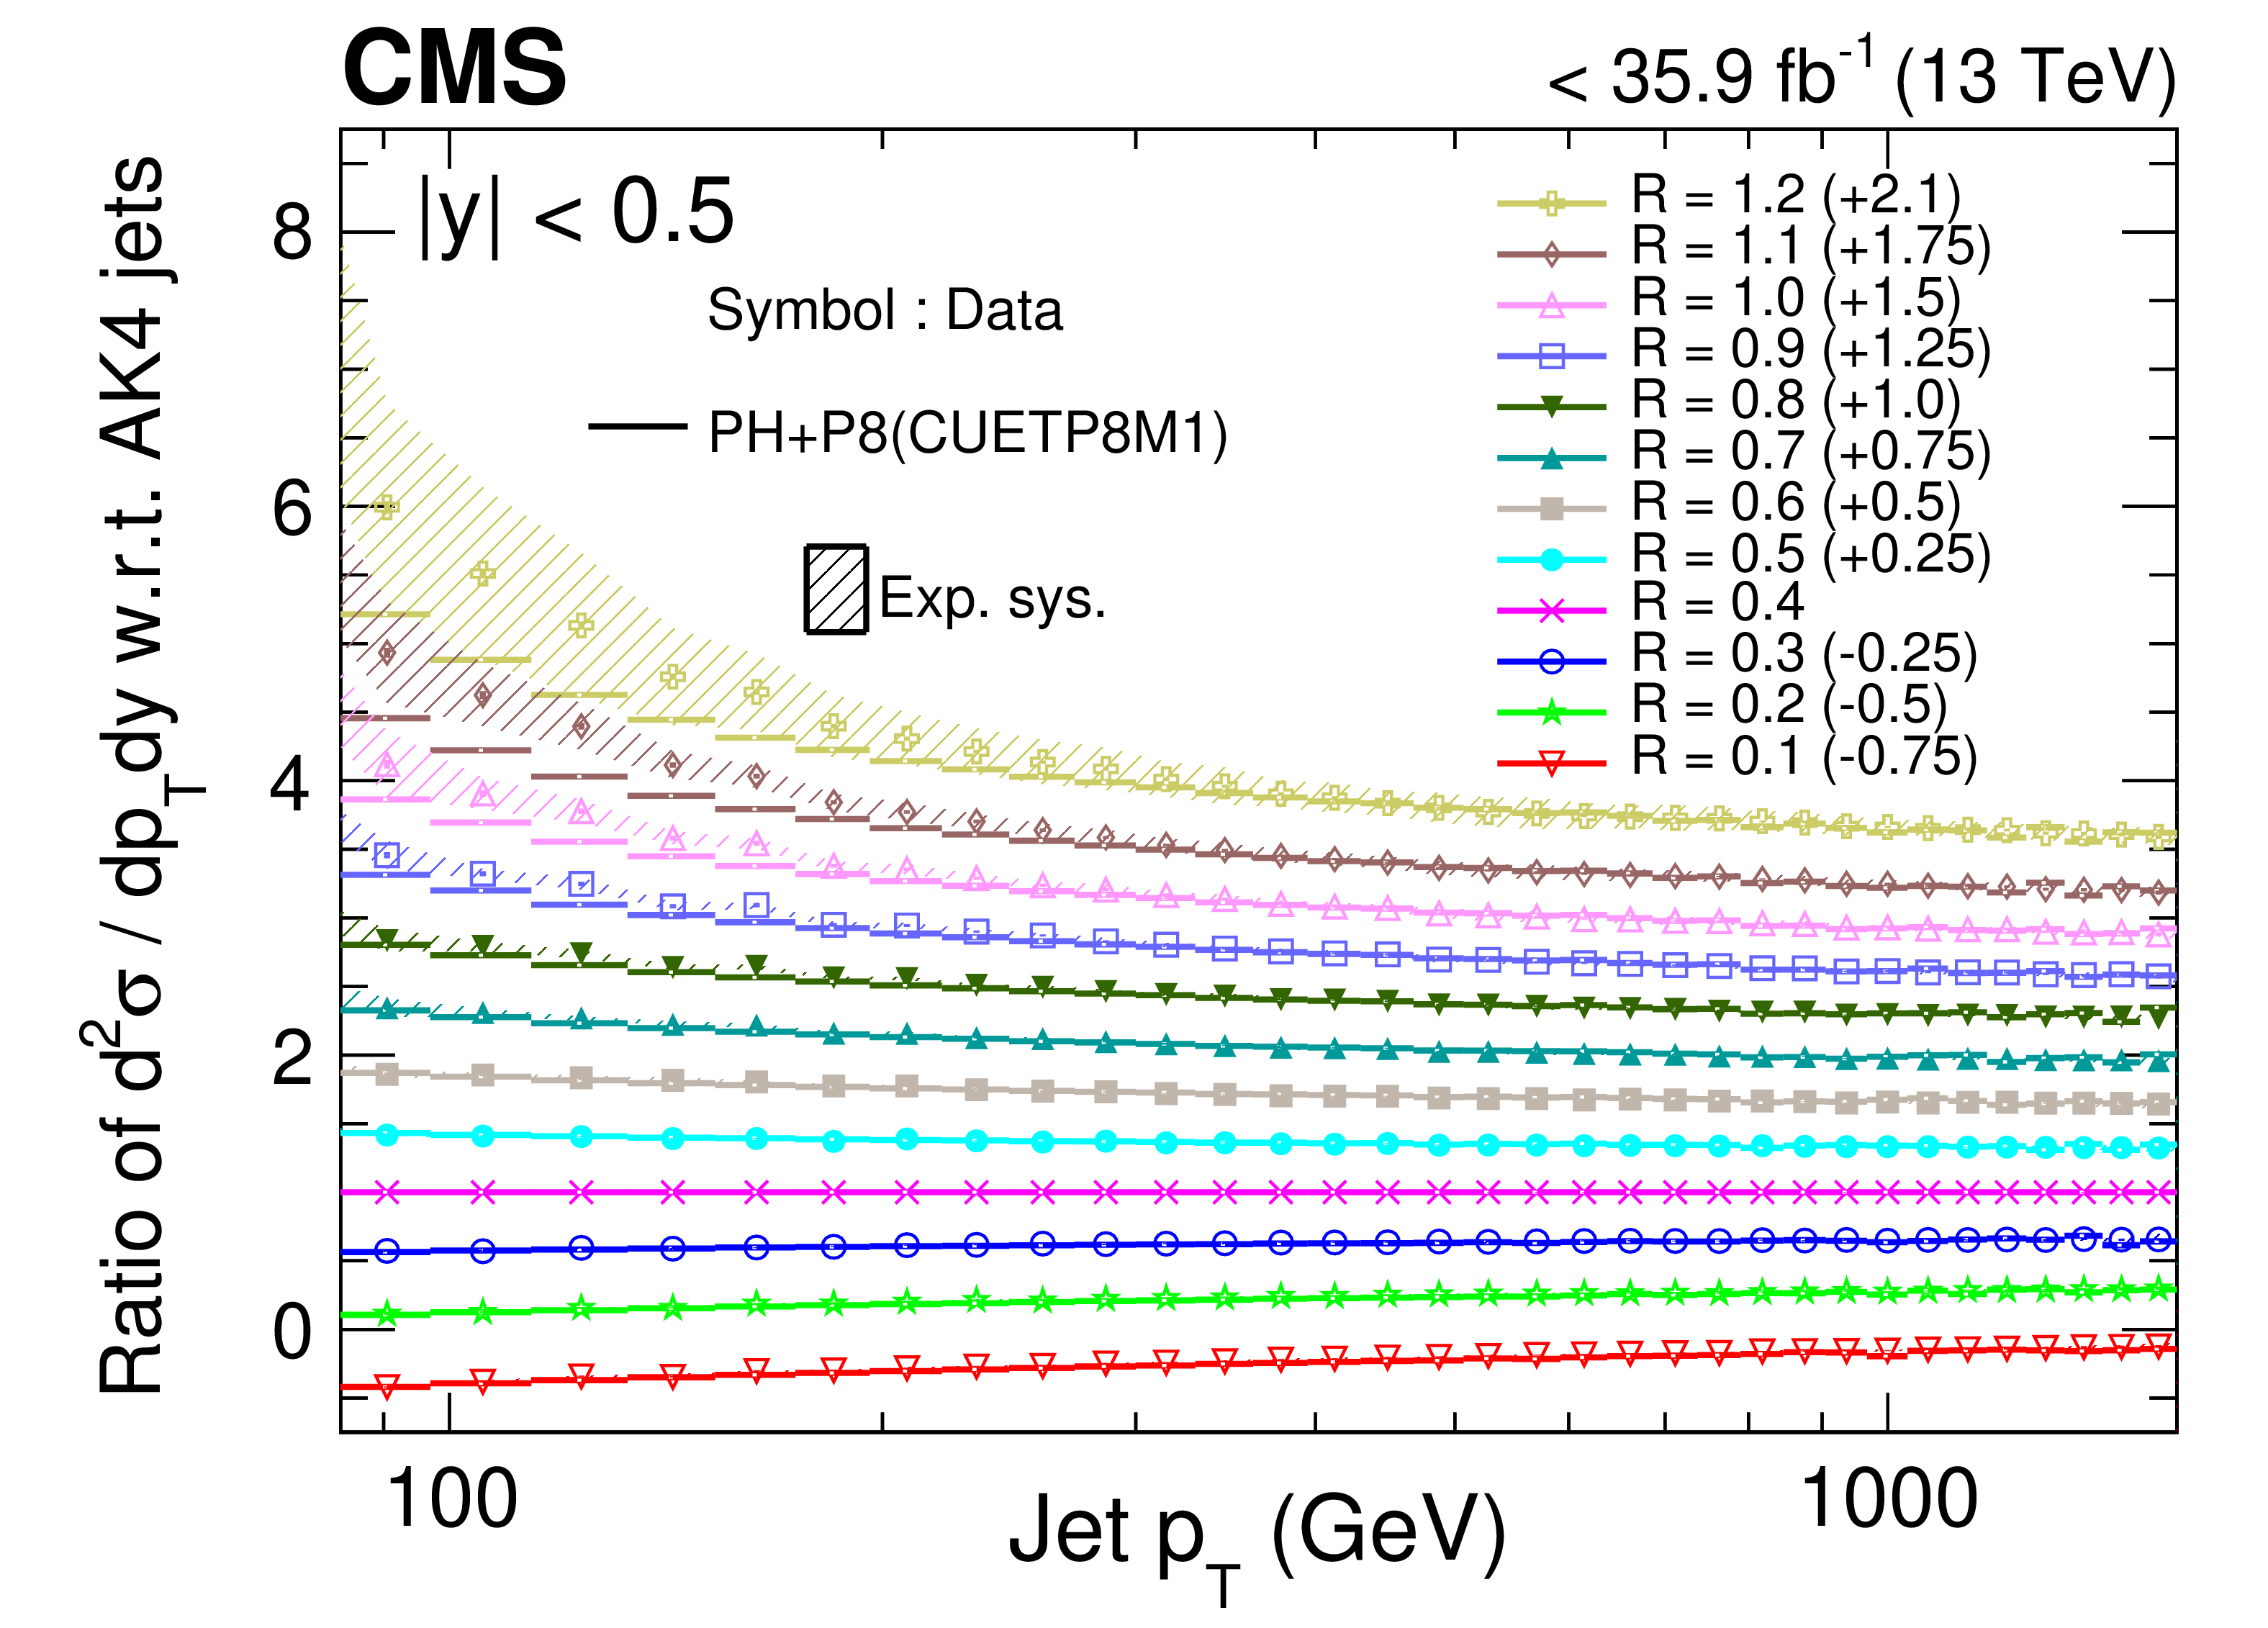
Figure 4:
Comparison of the ratio of the differential cross sections of jets of different sizes with respect to that of AK4 jets from data and from NLO predictions using POWHEG $+$ PYTHIA (CUETP8M1 tune) in the region $ {| y |} < $ 0.5. Colored symbols indicate data and colored lines represent prediction from simulation. Offsets by the amount written in the parentheses have been added to the corresponding data points to separate the results for different jet sizes. |

png pdf |
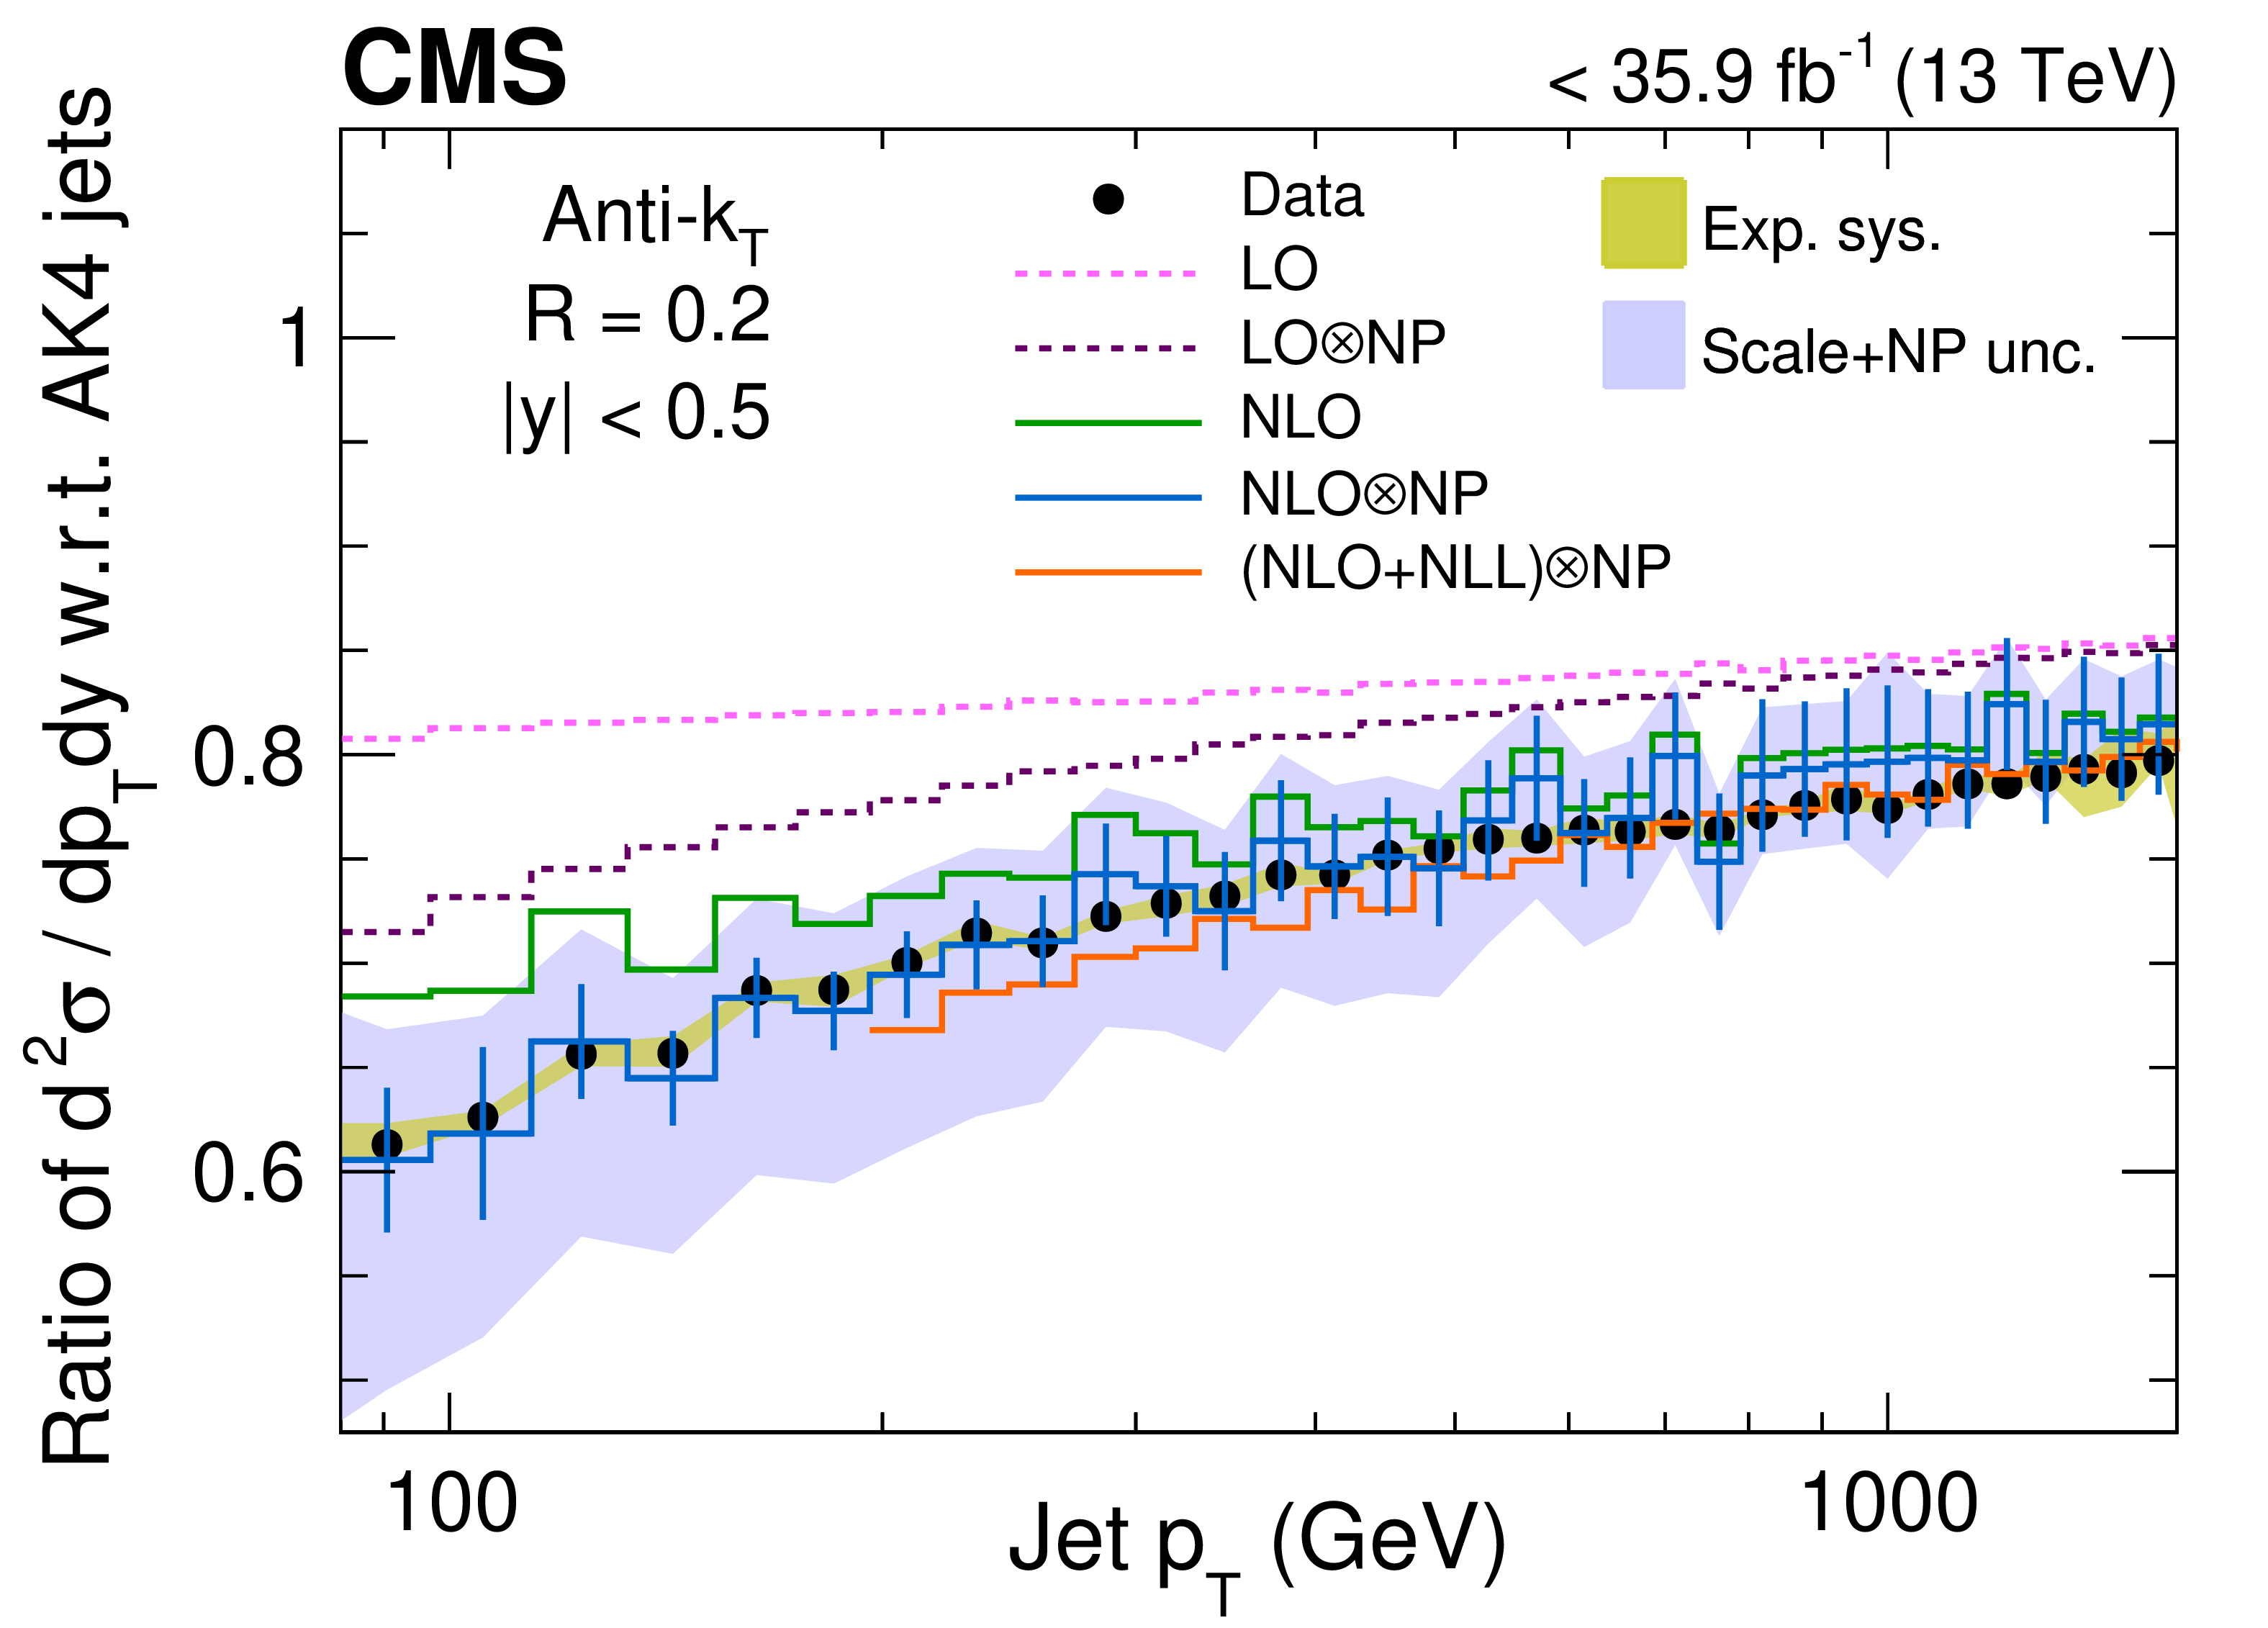
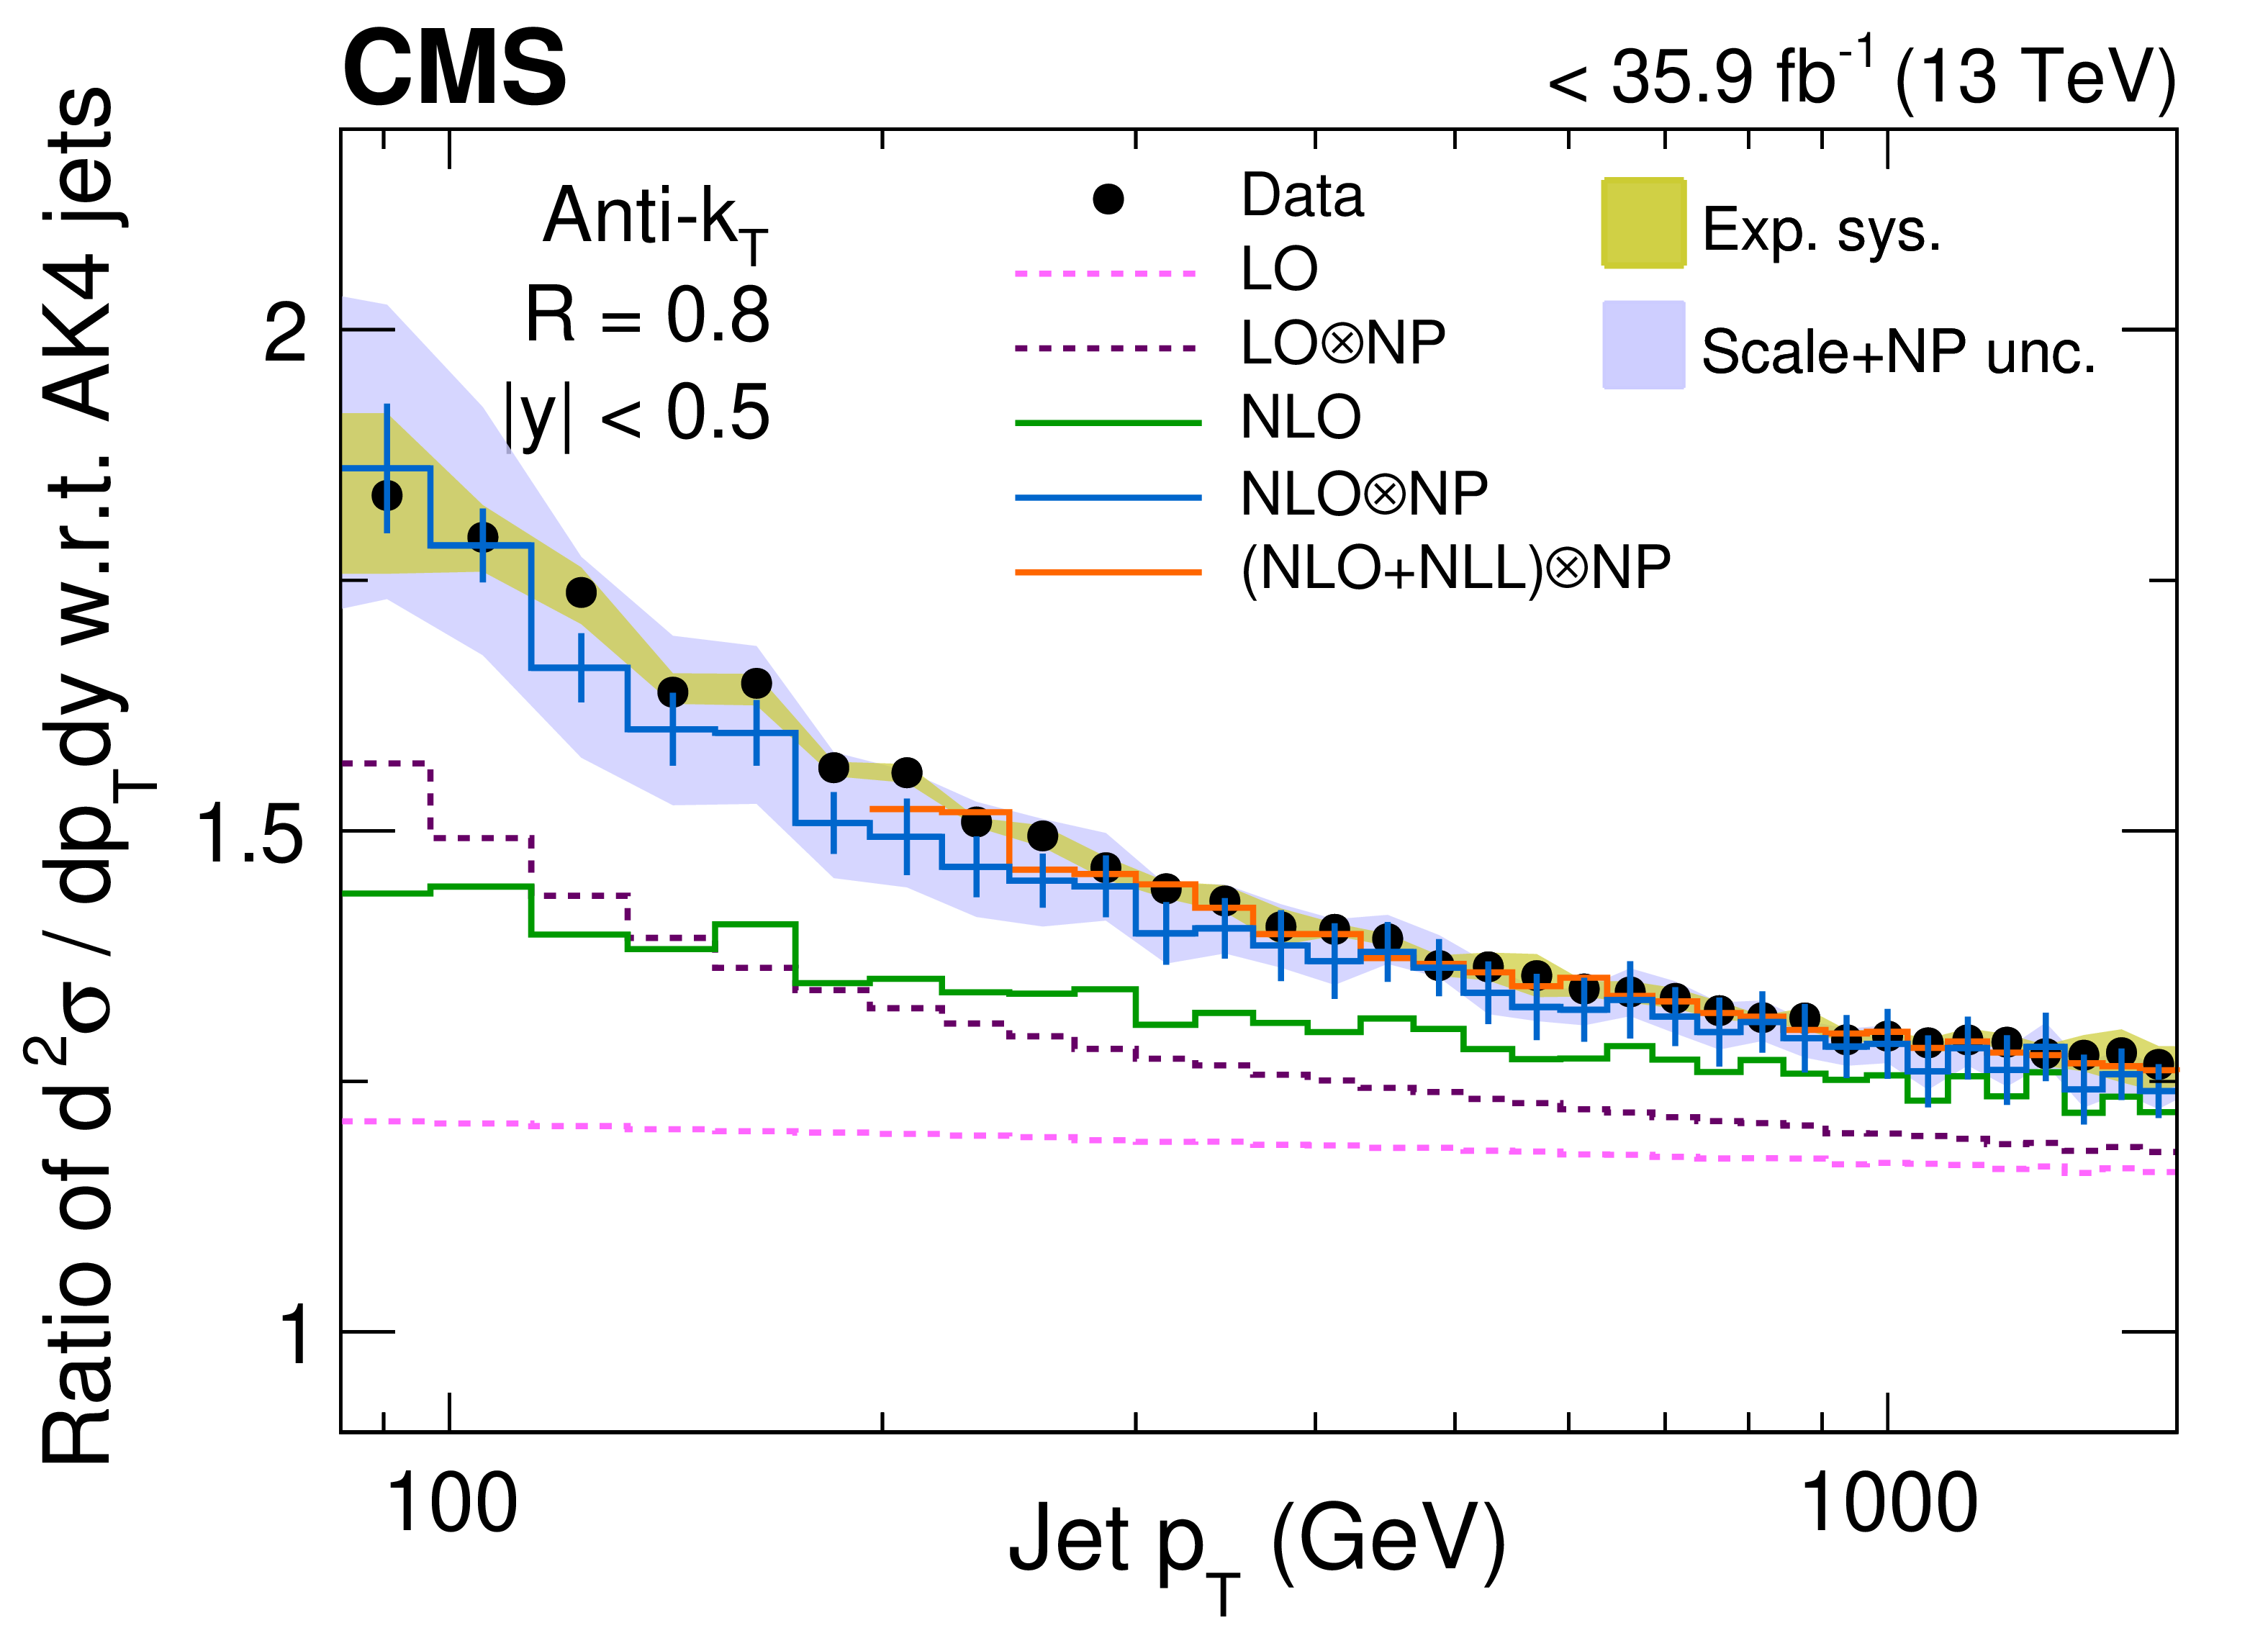
Figure 5:
Comparison of the ratios of differential cross sections for the AK2 (upper) and AK8 (lower) jets with respect to that of AK4 jets from data and ${p\text {QCD}}$ predictions using NLOJET++ in the region $ {| y |} < $ 0.5. Black symbols indicate data and colored lines represent ${p\text {QCD}}$ predictions. Statistical uncertainties are shown as vertical bars for the data and the NLO$\otimes $NP prediction. The yellowish olive region around data represents the experimental systematic uncertainty whereas the region shaded in light blue color around NLO$\otimes $NP prediction shows the theoretical uncertainty in the prediction. |
png pdf |
Figure 5-a:
Comparison of the ratios of differential cross sections for the AK2 jets with respect to that of AK4 jets from data and ${p\text {QCD}}$ predictions using NLOJET++ in the region $ {| y |} < $ 0.5. Black symbols indicate data and colored lines represent ${p\text {QCD}}$ predictions. Statistical uncertainties are shown as vertical bars for the data and the NLO$\otimes $NP prediction. The yellowish olive region around data represents the experimental systematic uncertainty whereas the region shaded in light blue color around NLO$\otimes $NP prediction shows the theoretical uncertainty in the prediction. |
png pdf |
Figure 5-b:
Comparison of the ratios of differential cross sections for the AK8 jets with respect to that of AK4 jets from data and ${p\text {QCD}}$ predictions using NLOJET++ in the region $ {| y |} < $ 0.5. Black symbols indicate data and colored lines represent ${p\text {QCD}}$ predictions. Statistical uncertainties are shown as vertical bars for the data and the NLO$\otimes $NP prediction. The yellowish olive region around data represents the experimental systematic uncertainty whereas the region shaded in light blue color around NLO$\otimes $NP prediction shows the theoretical uncertainty in the prediction. |
png pdf |
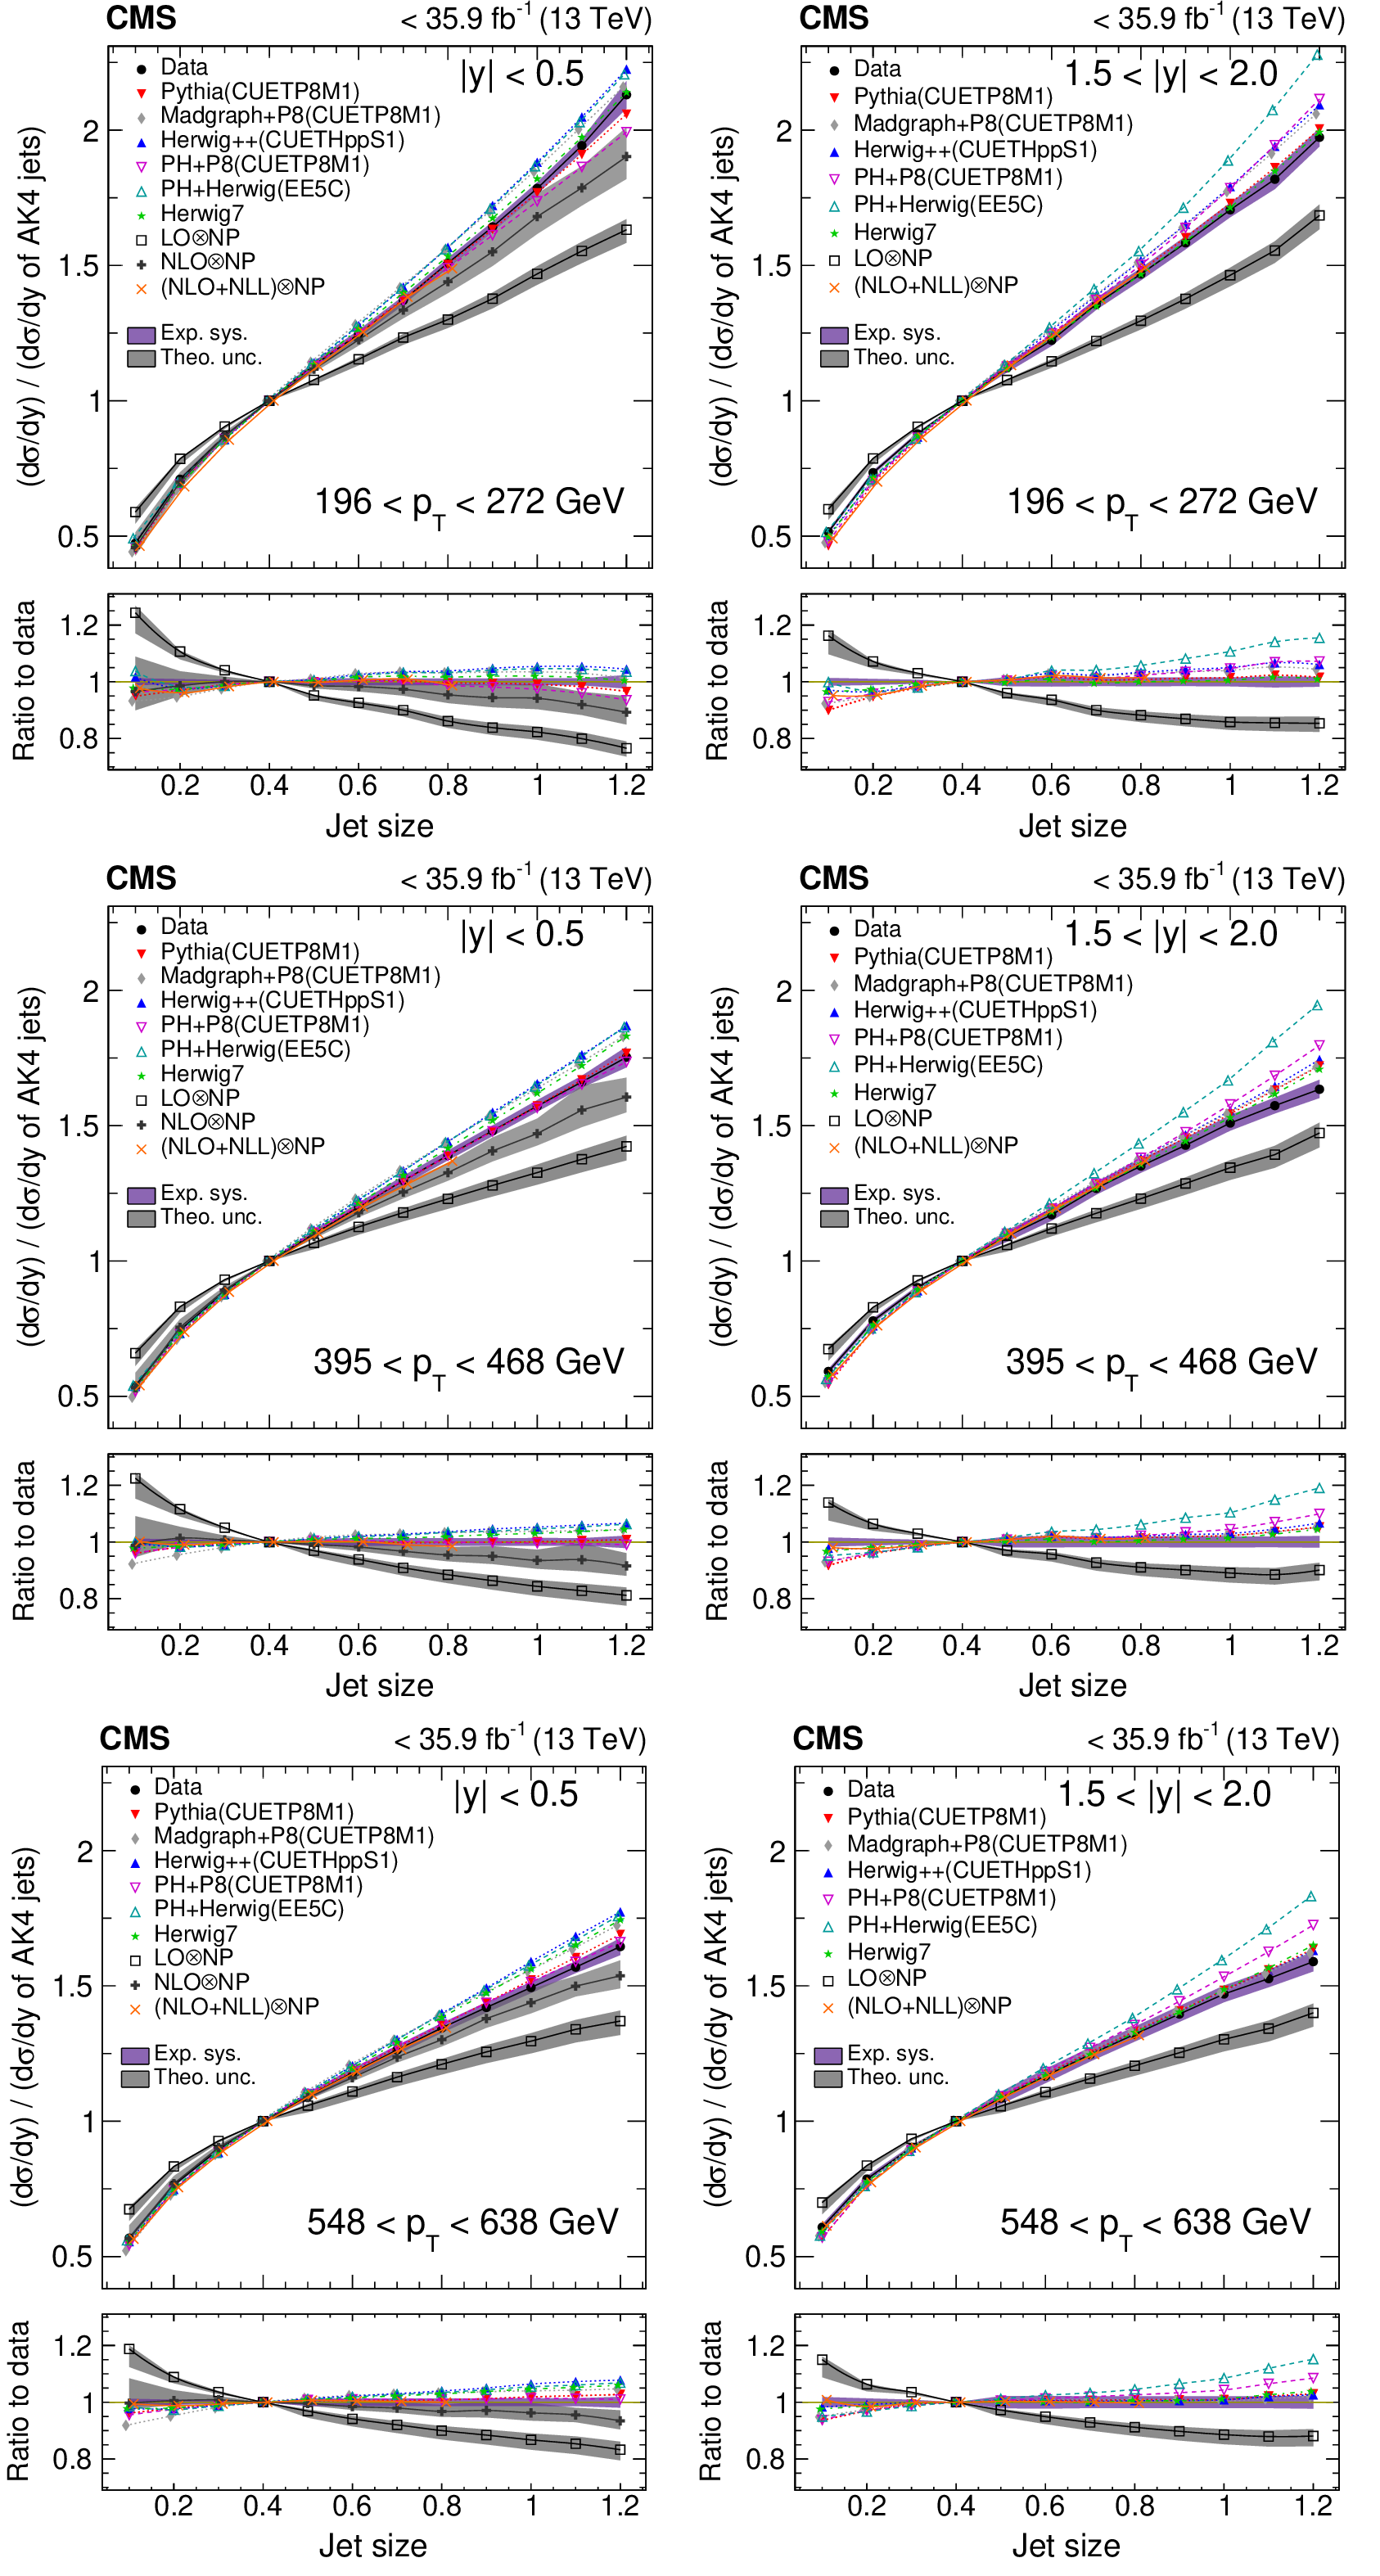
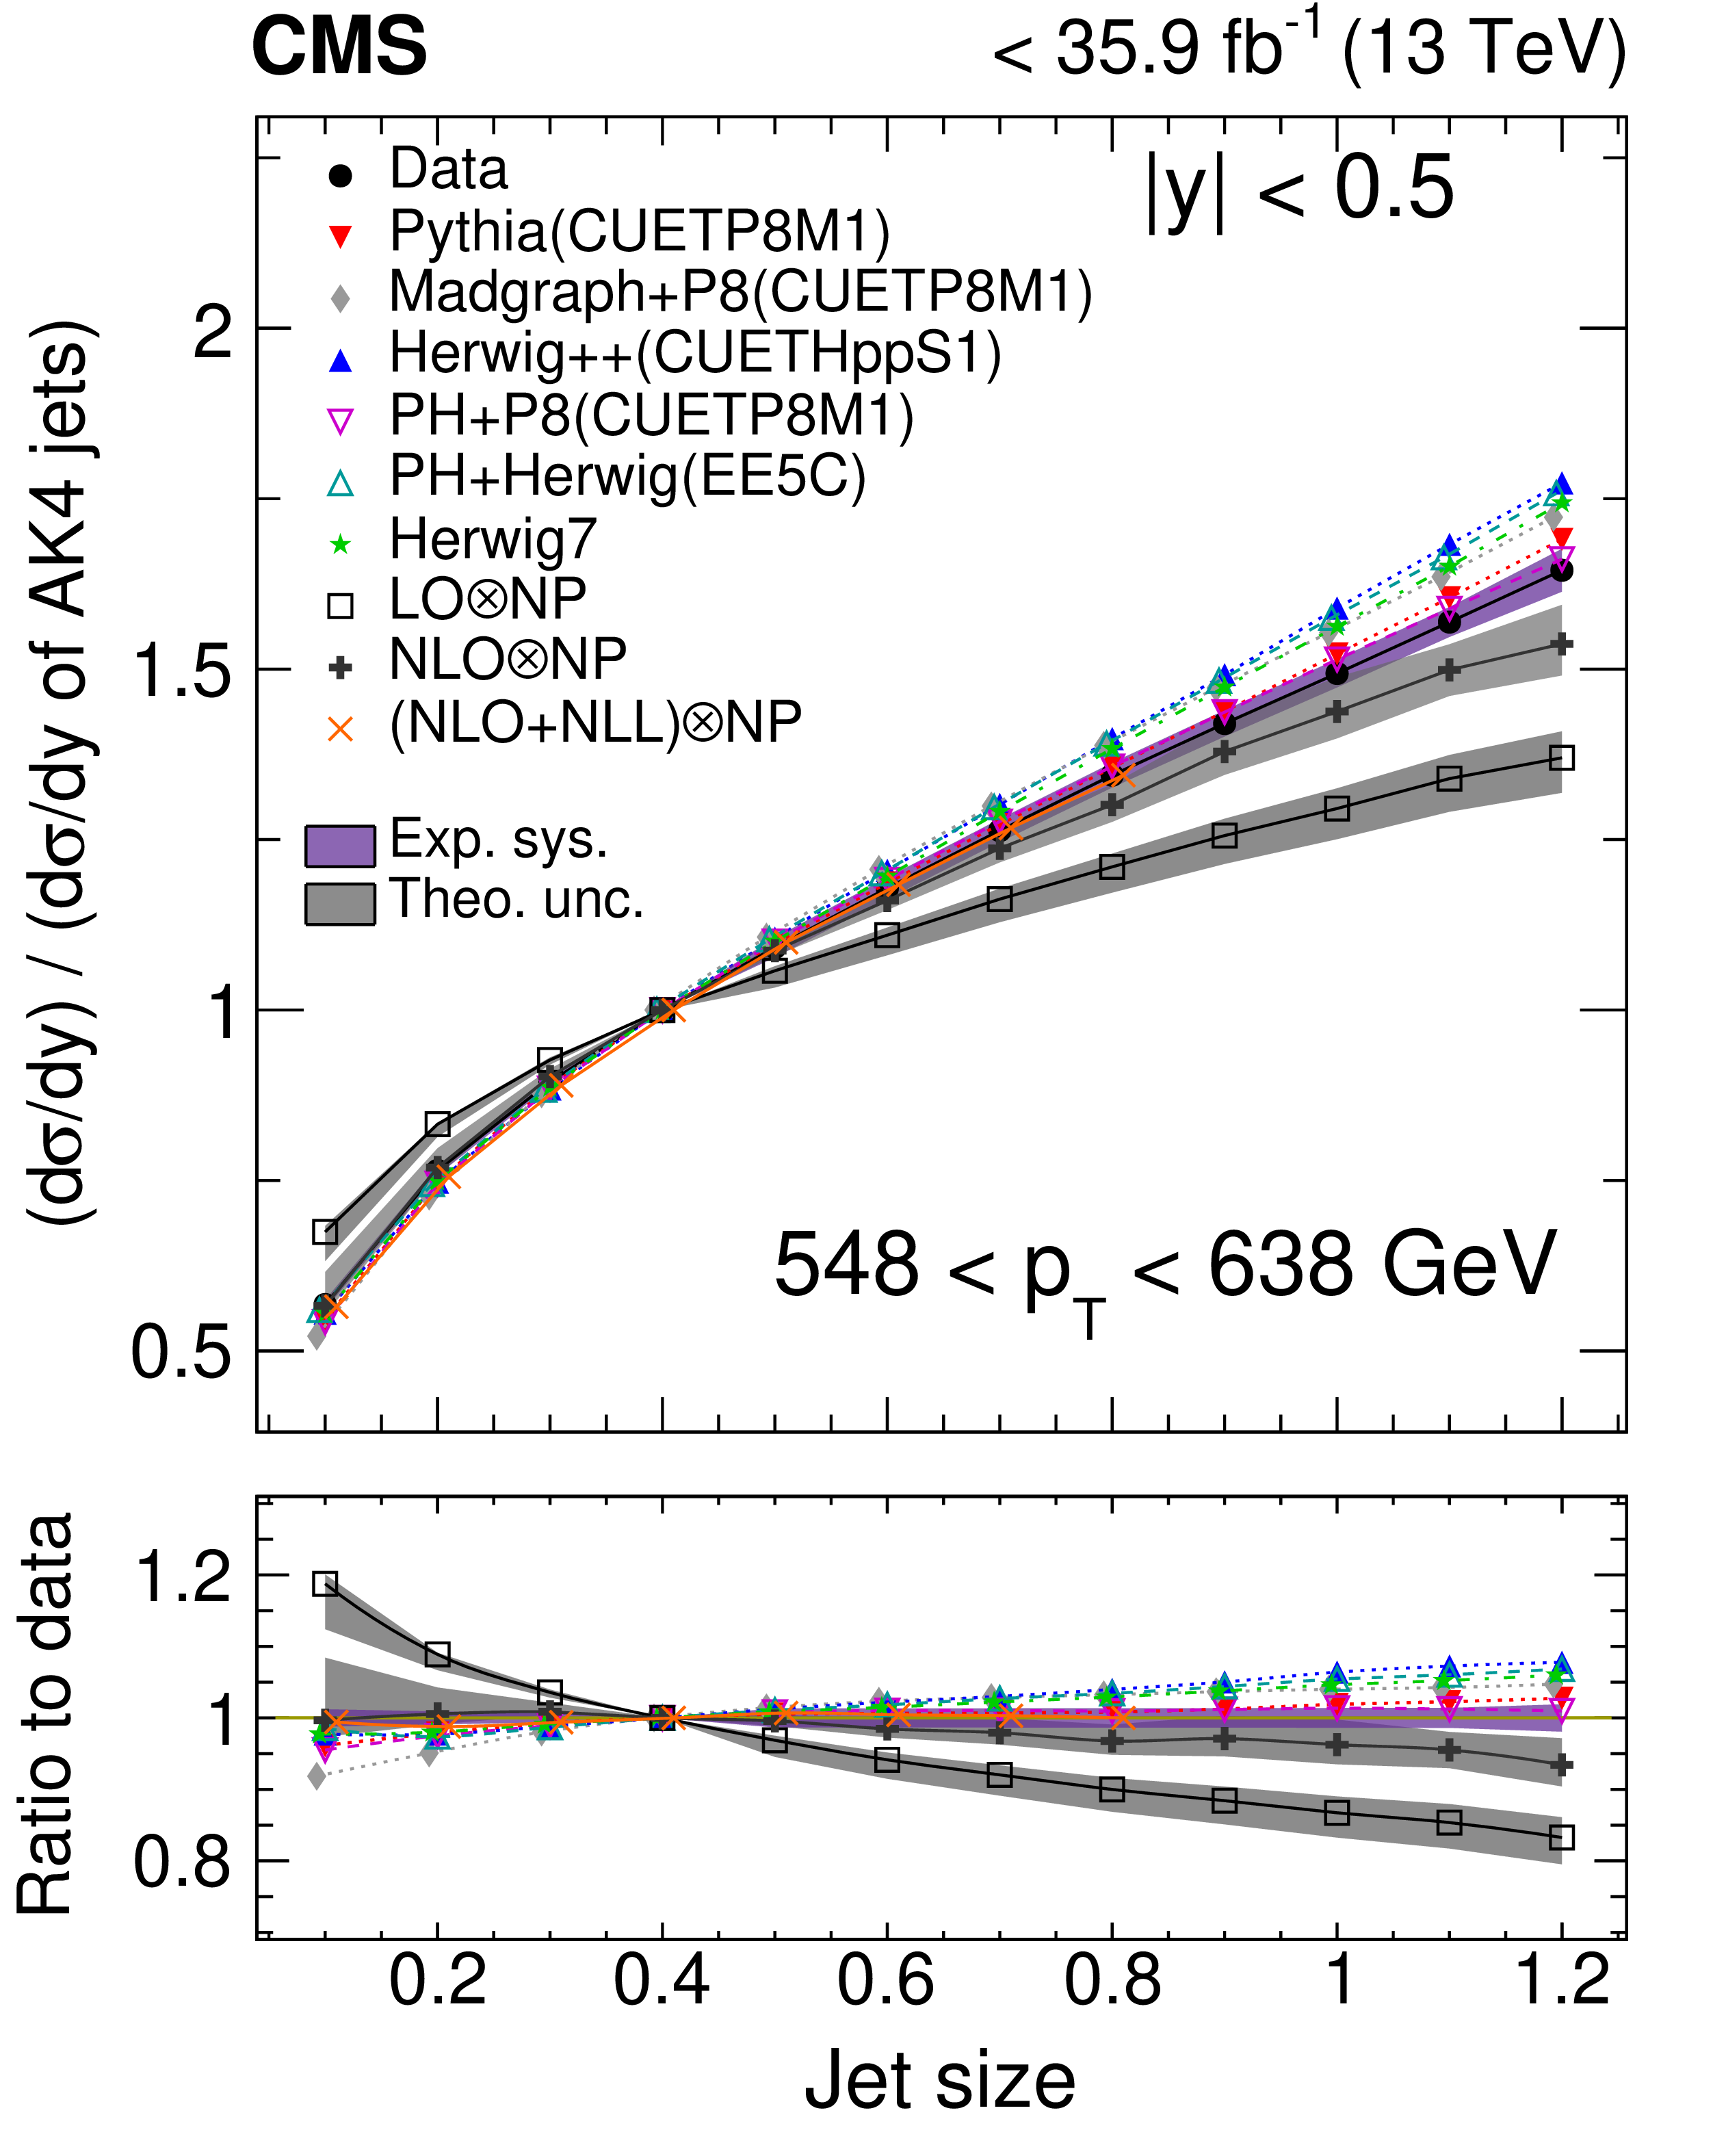
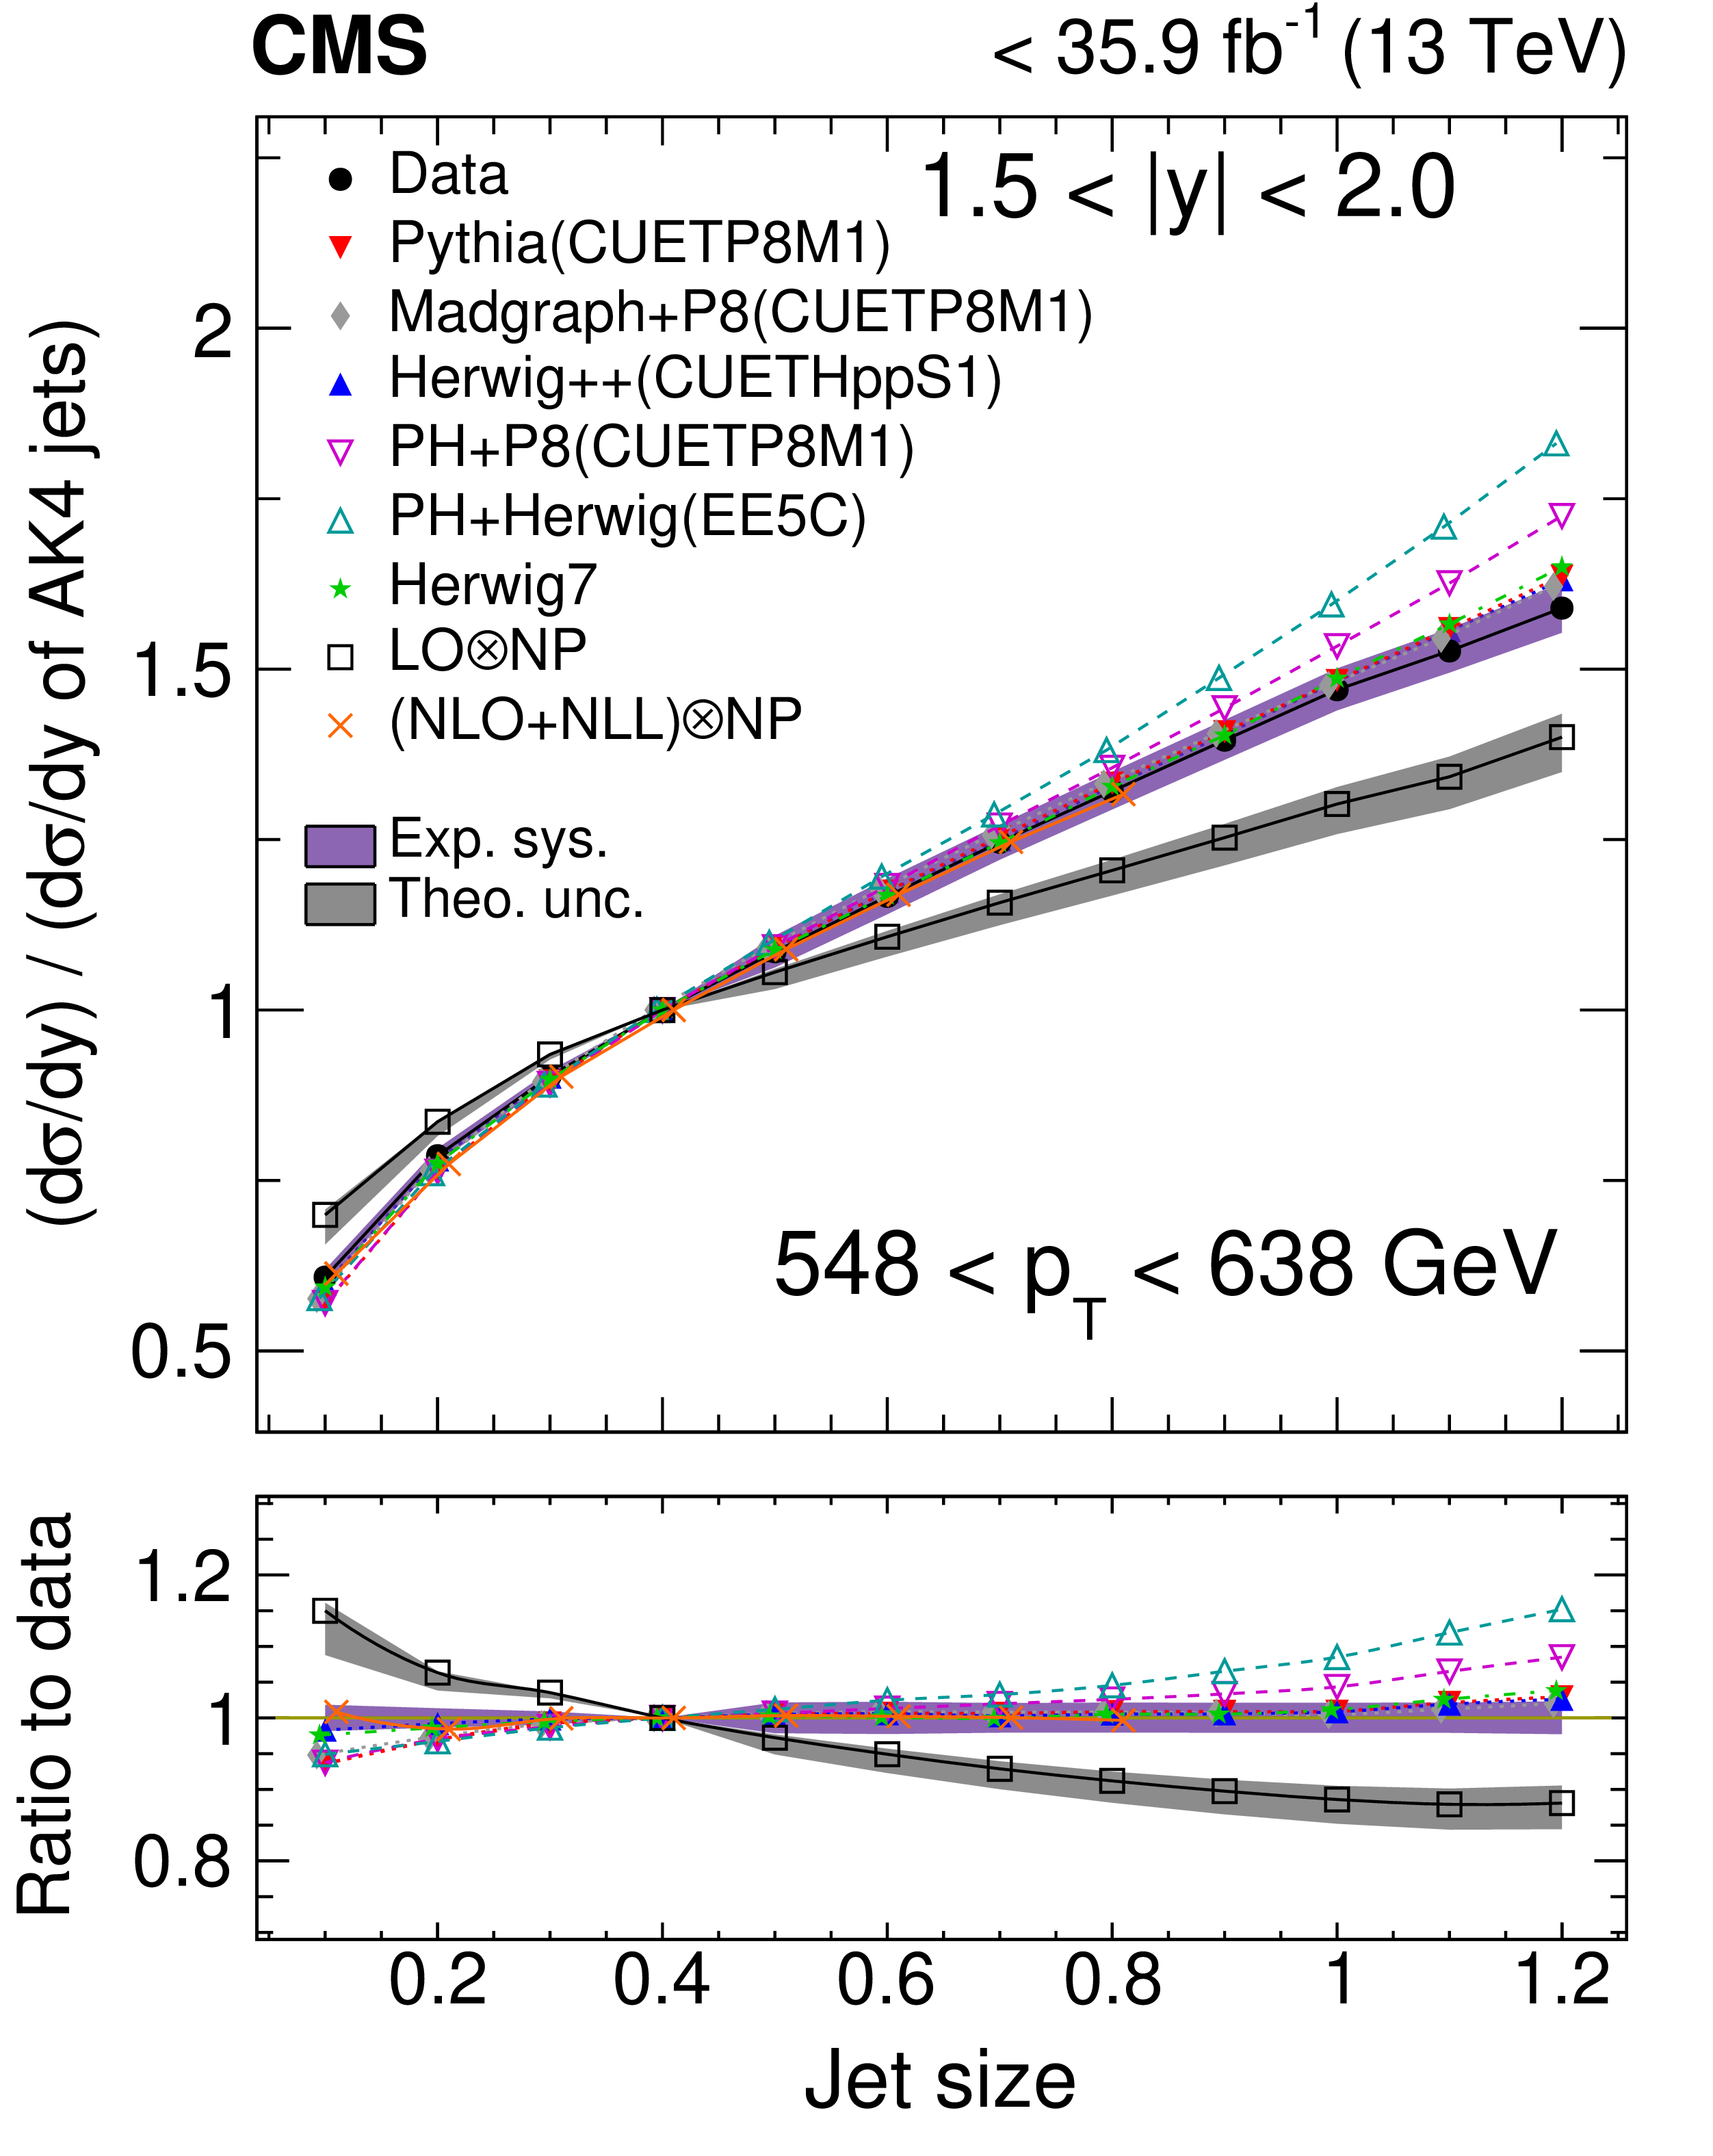
Figure 6:
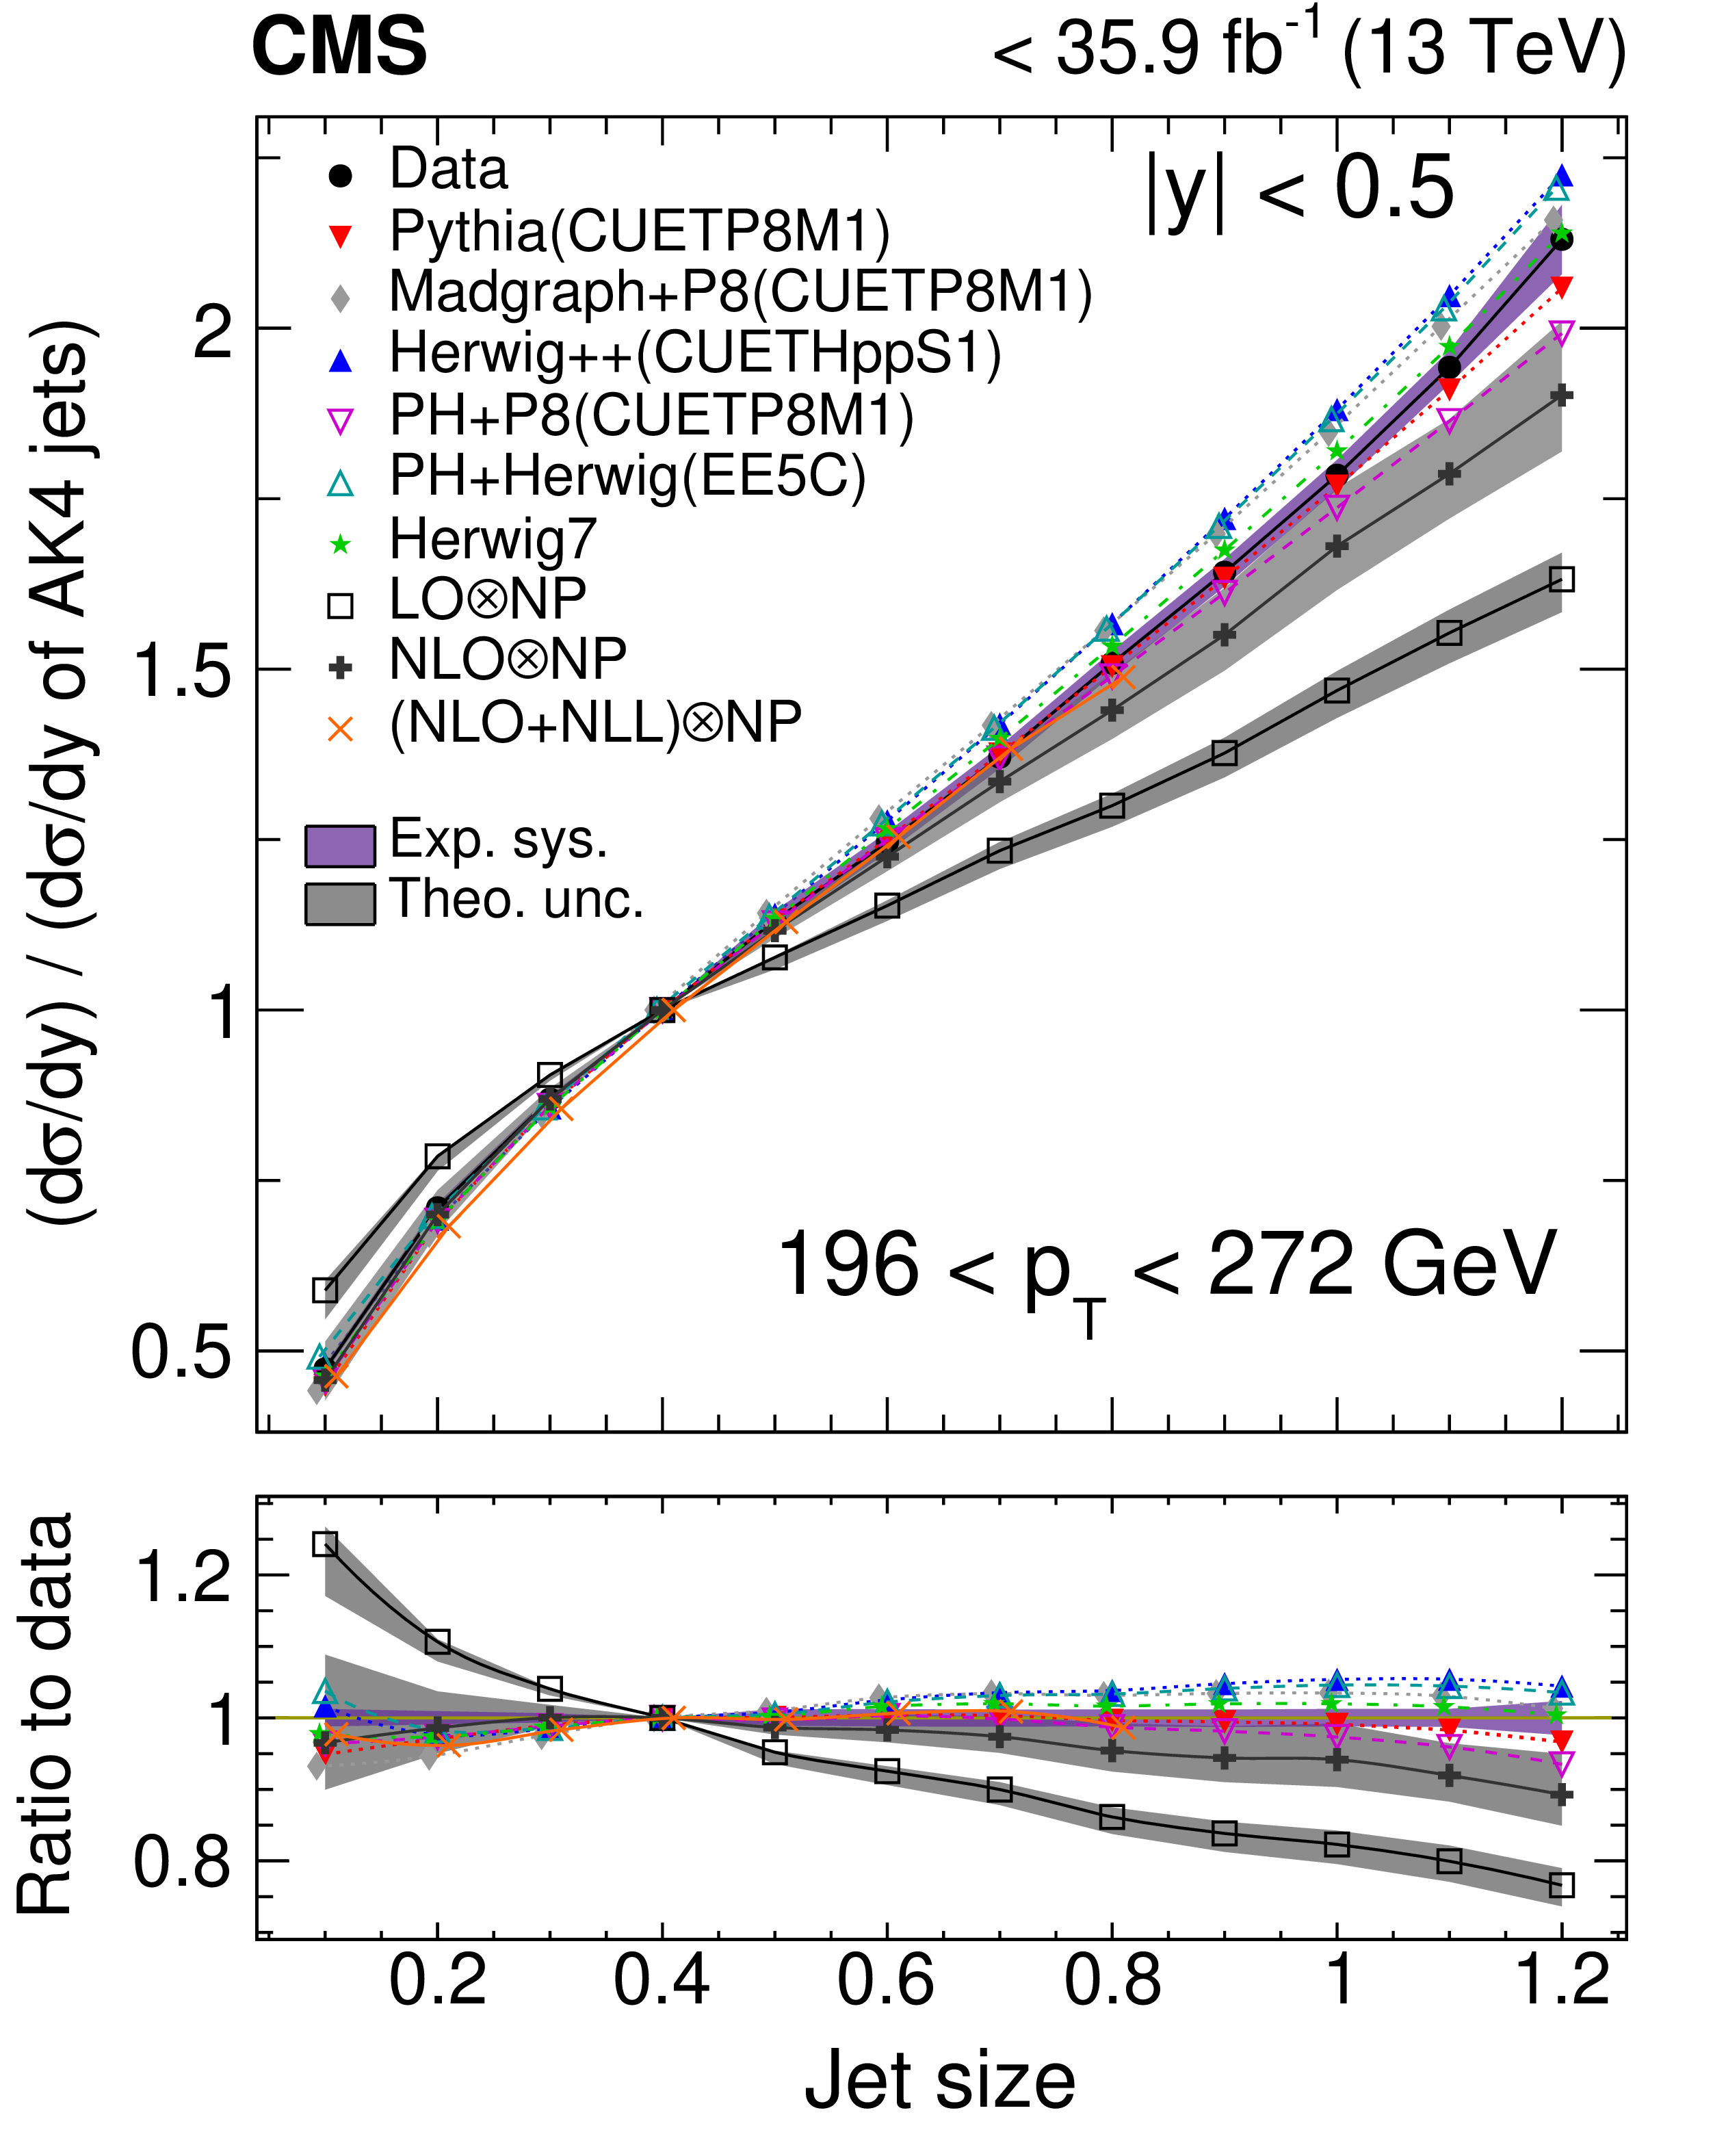
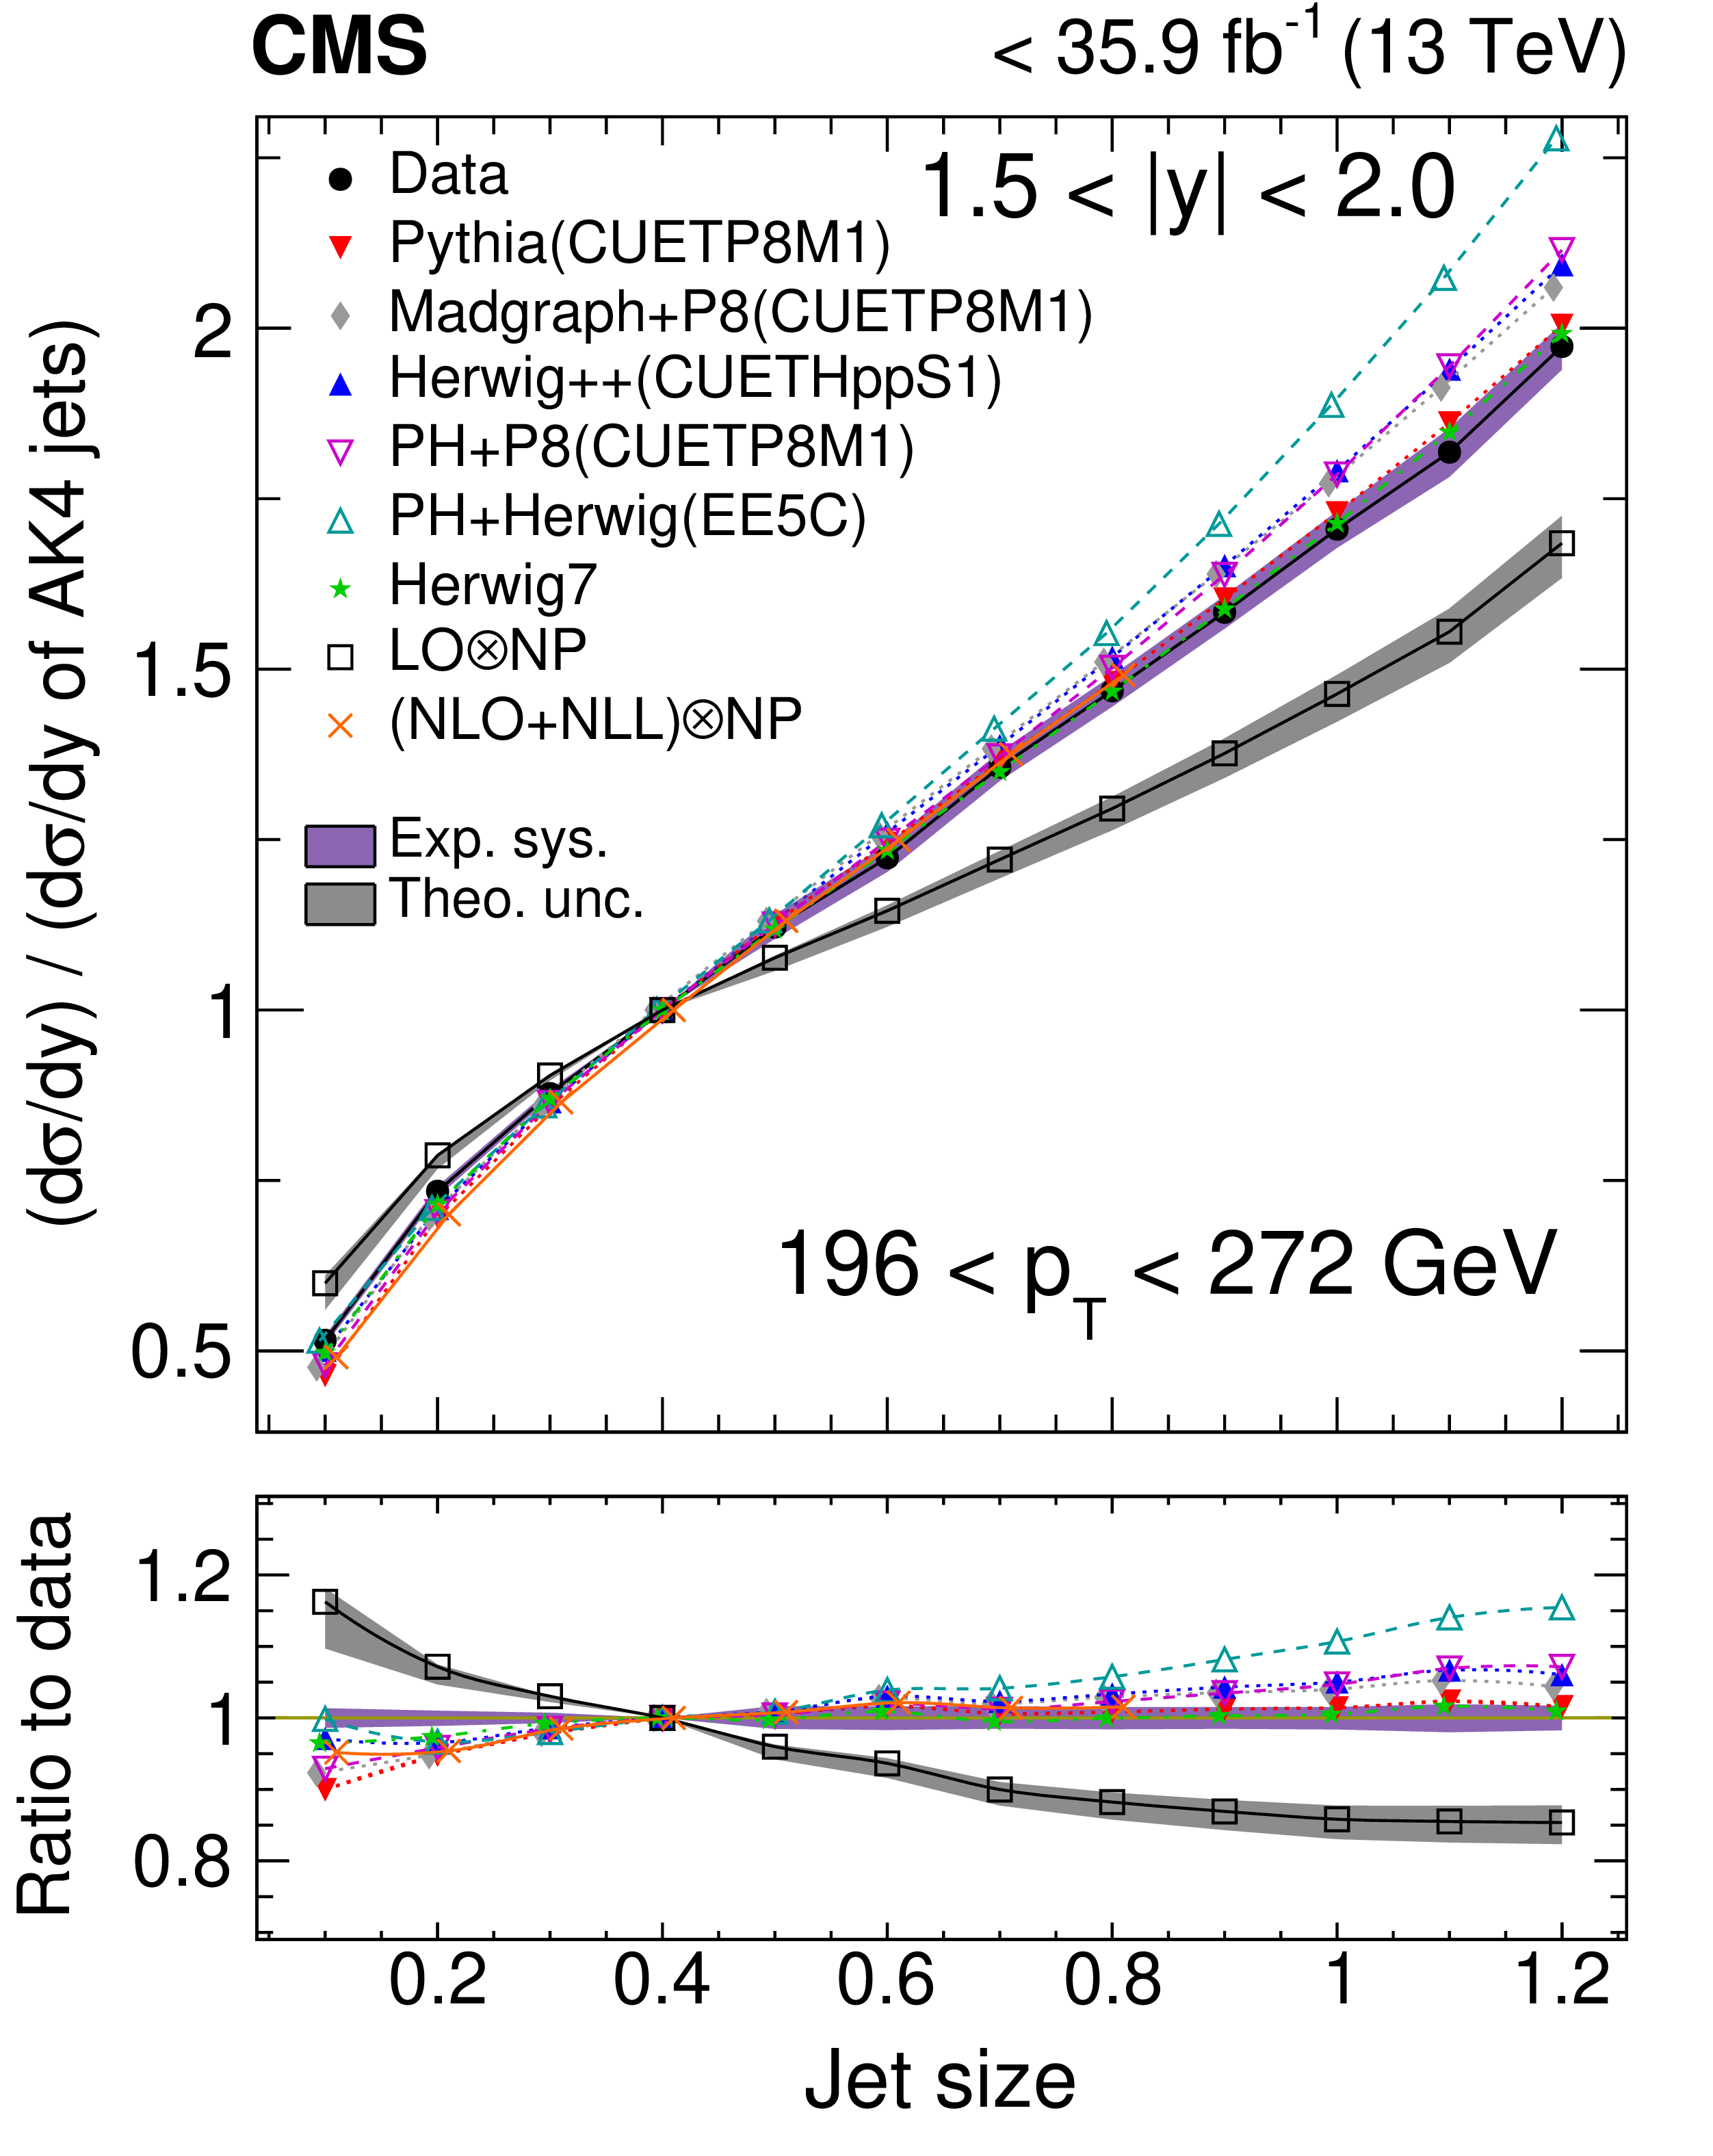
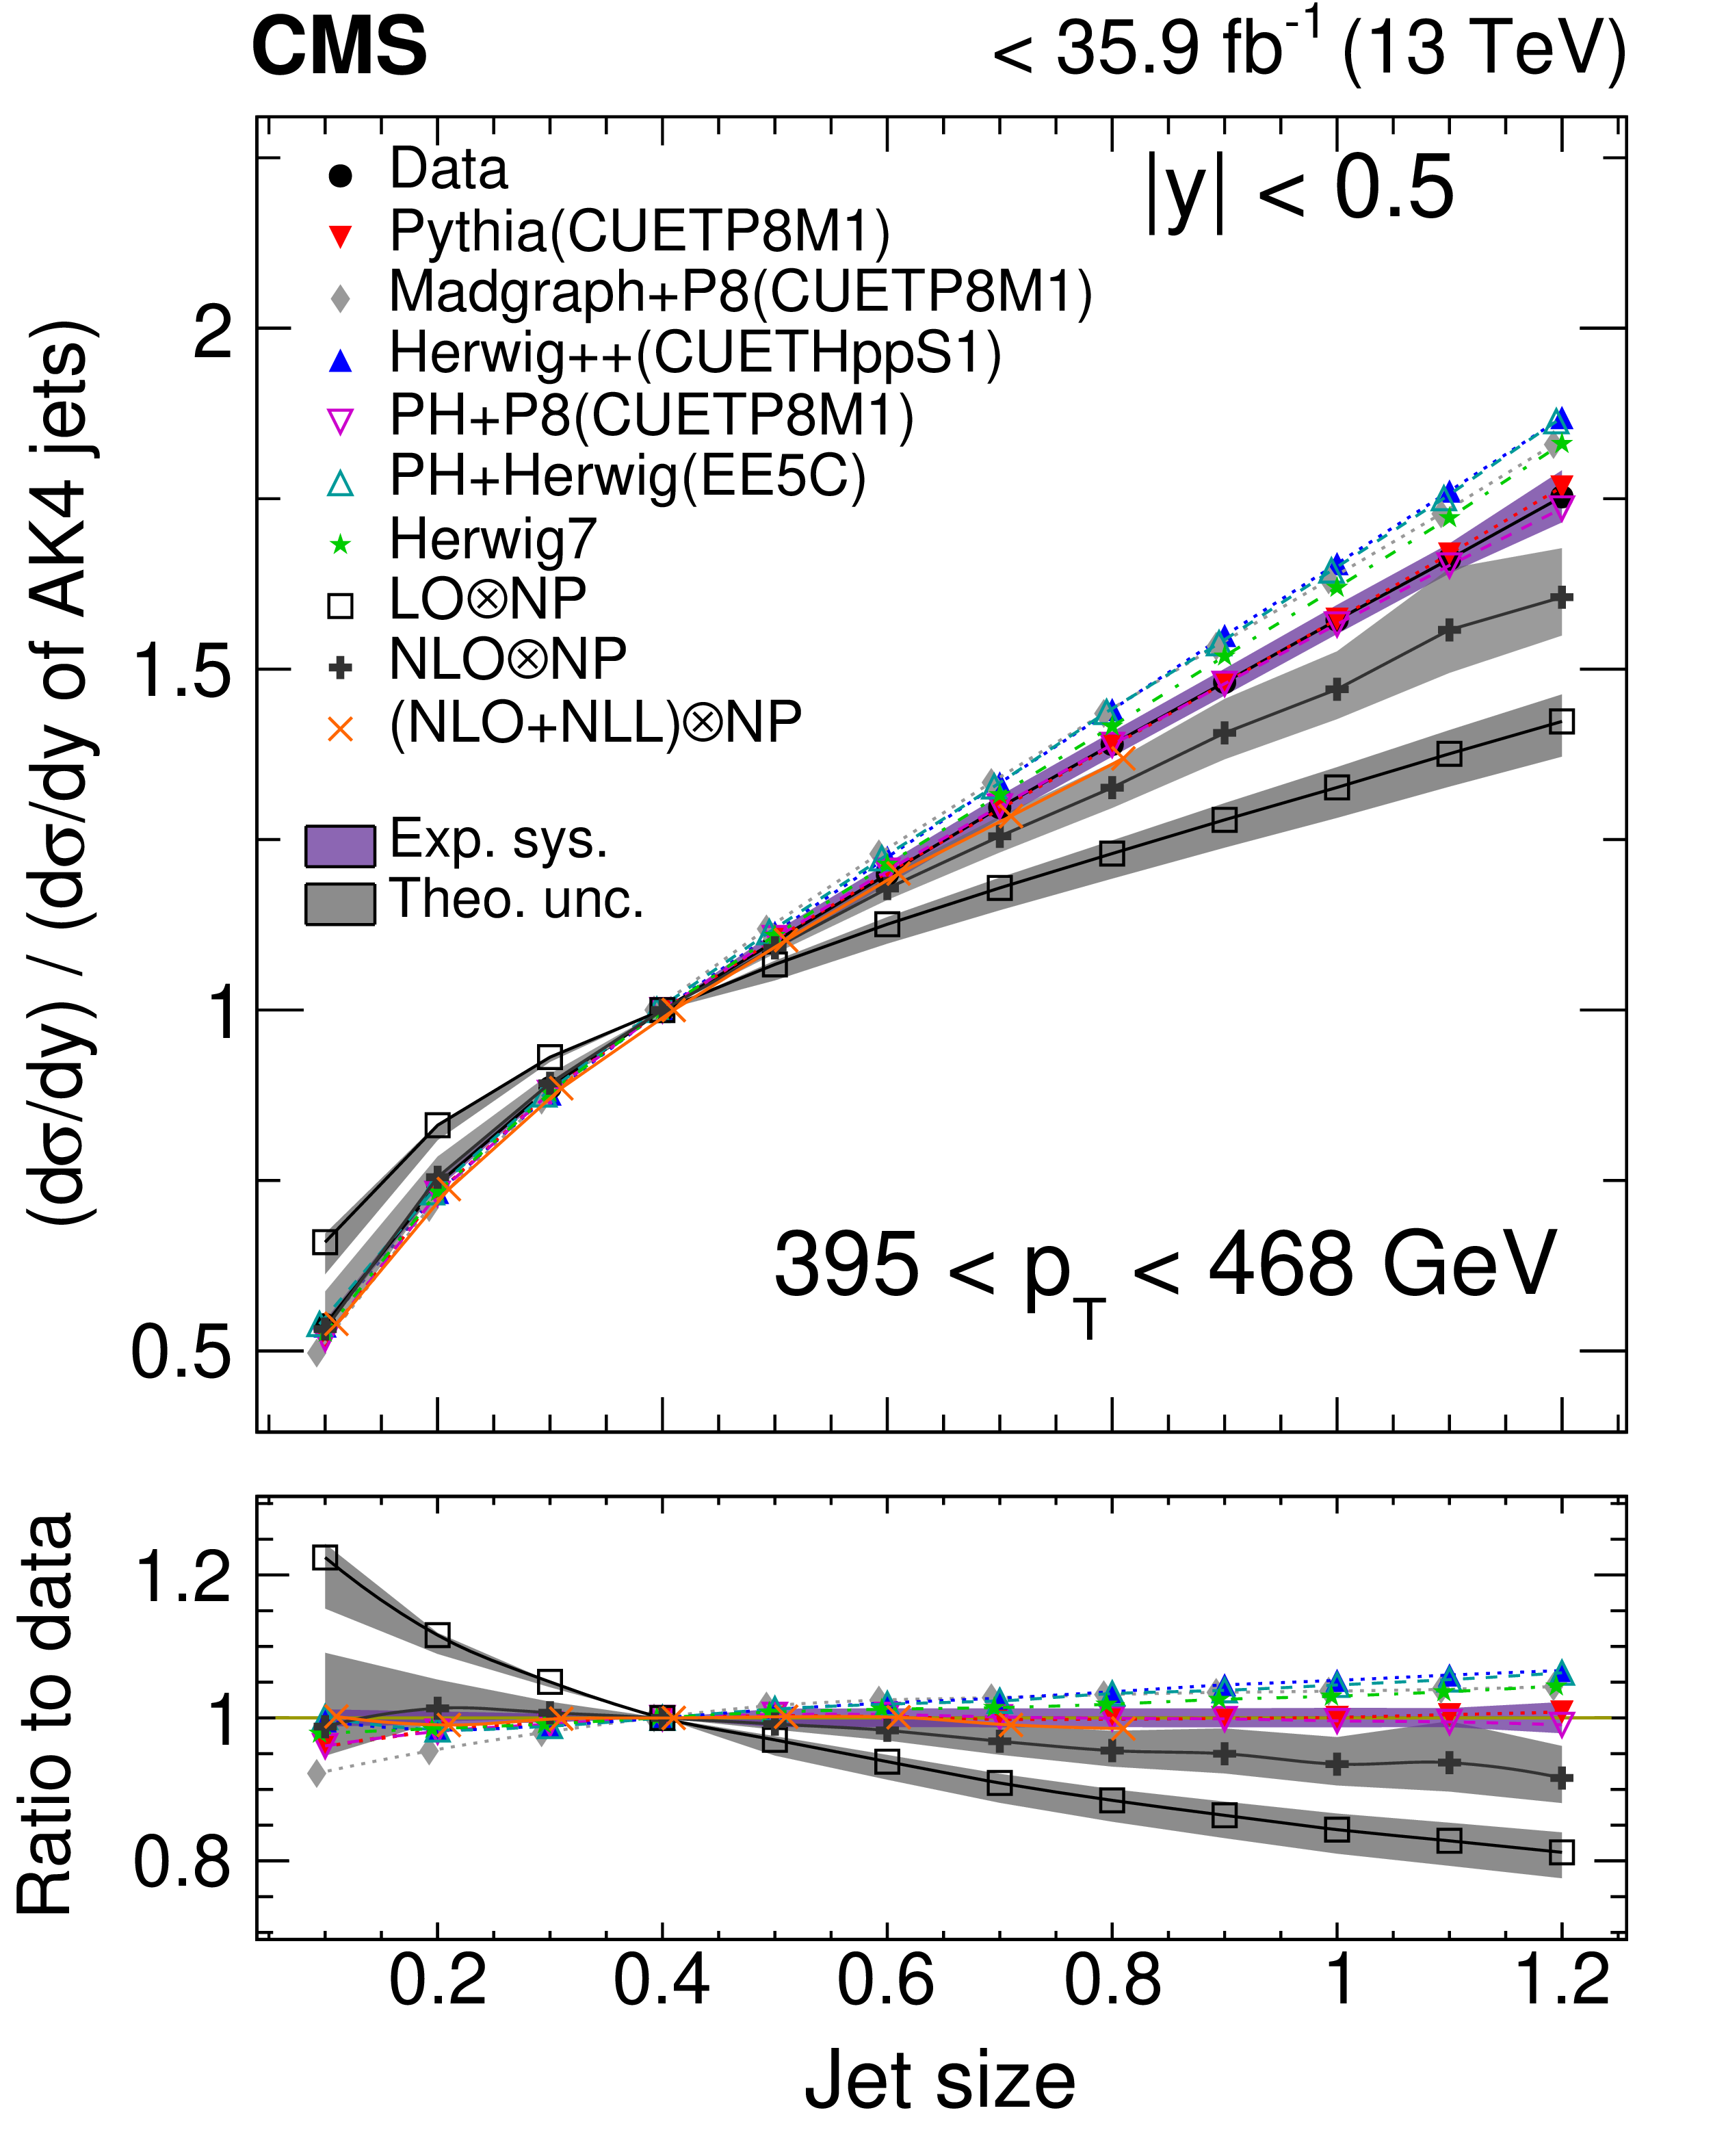
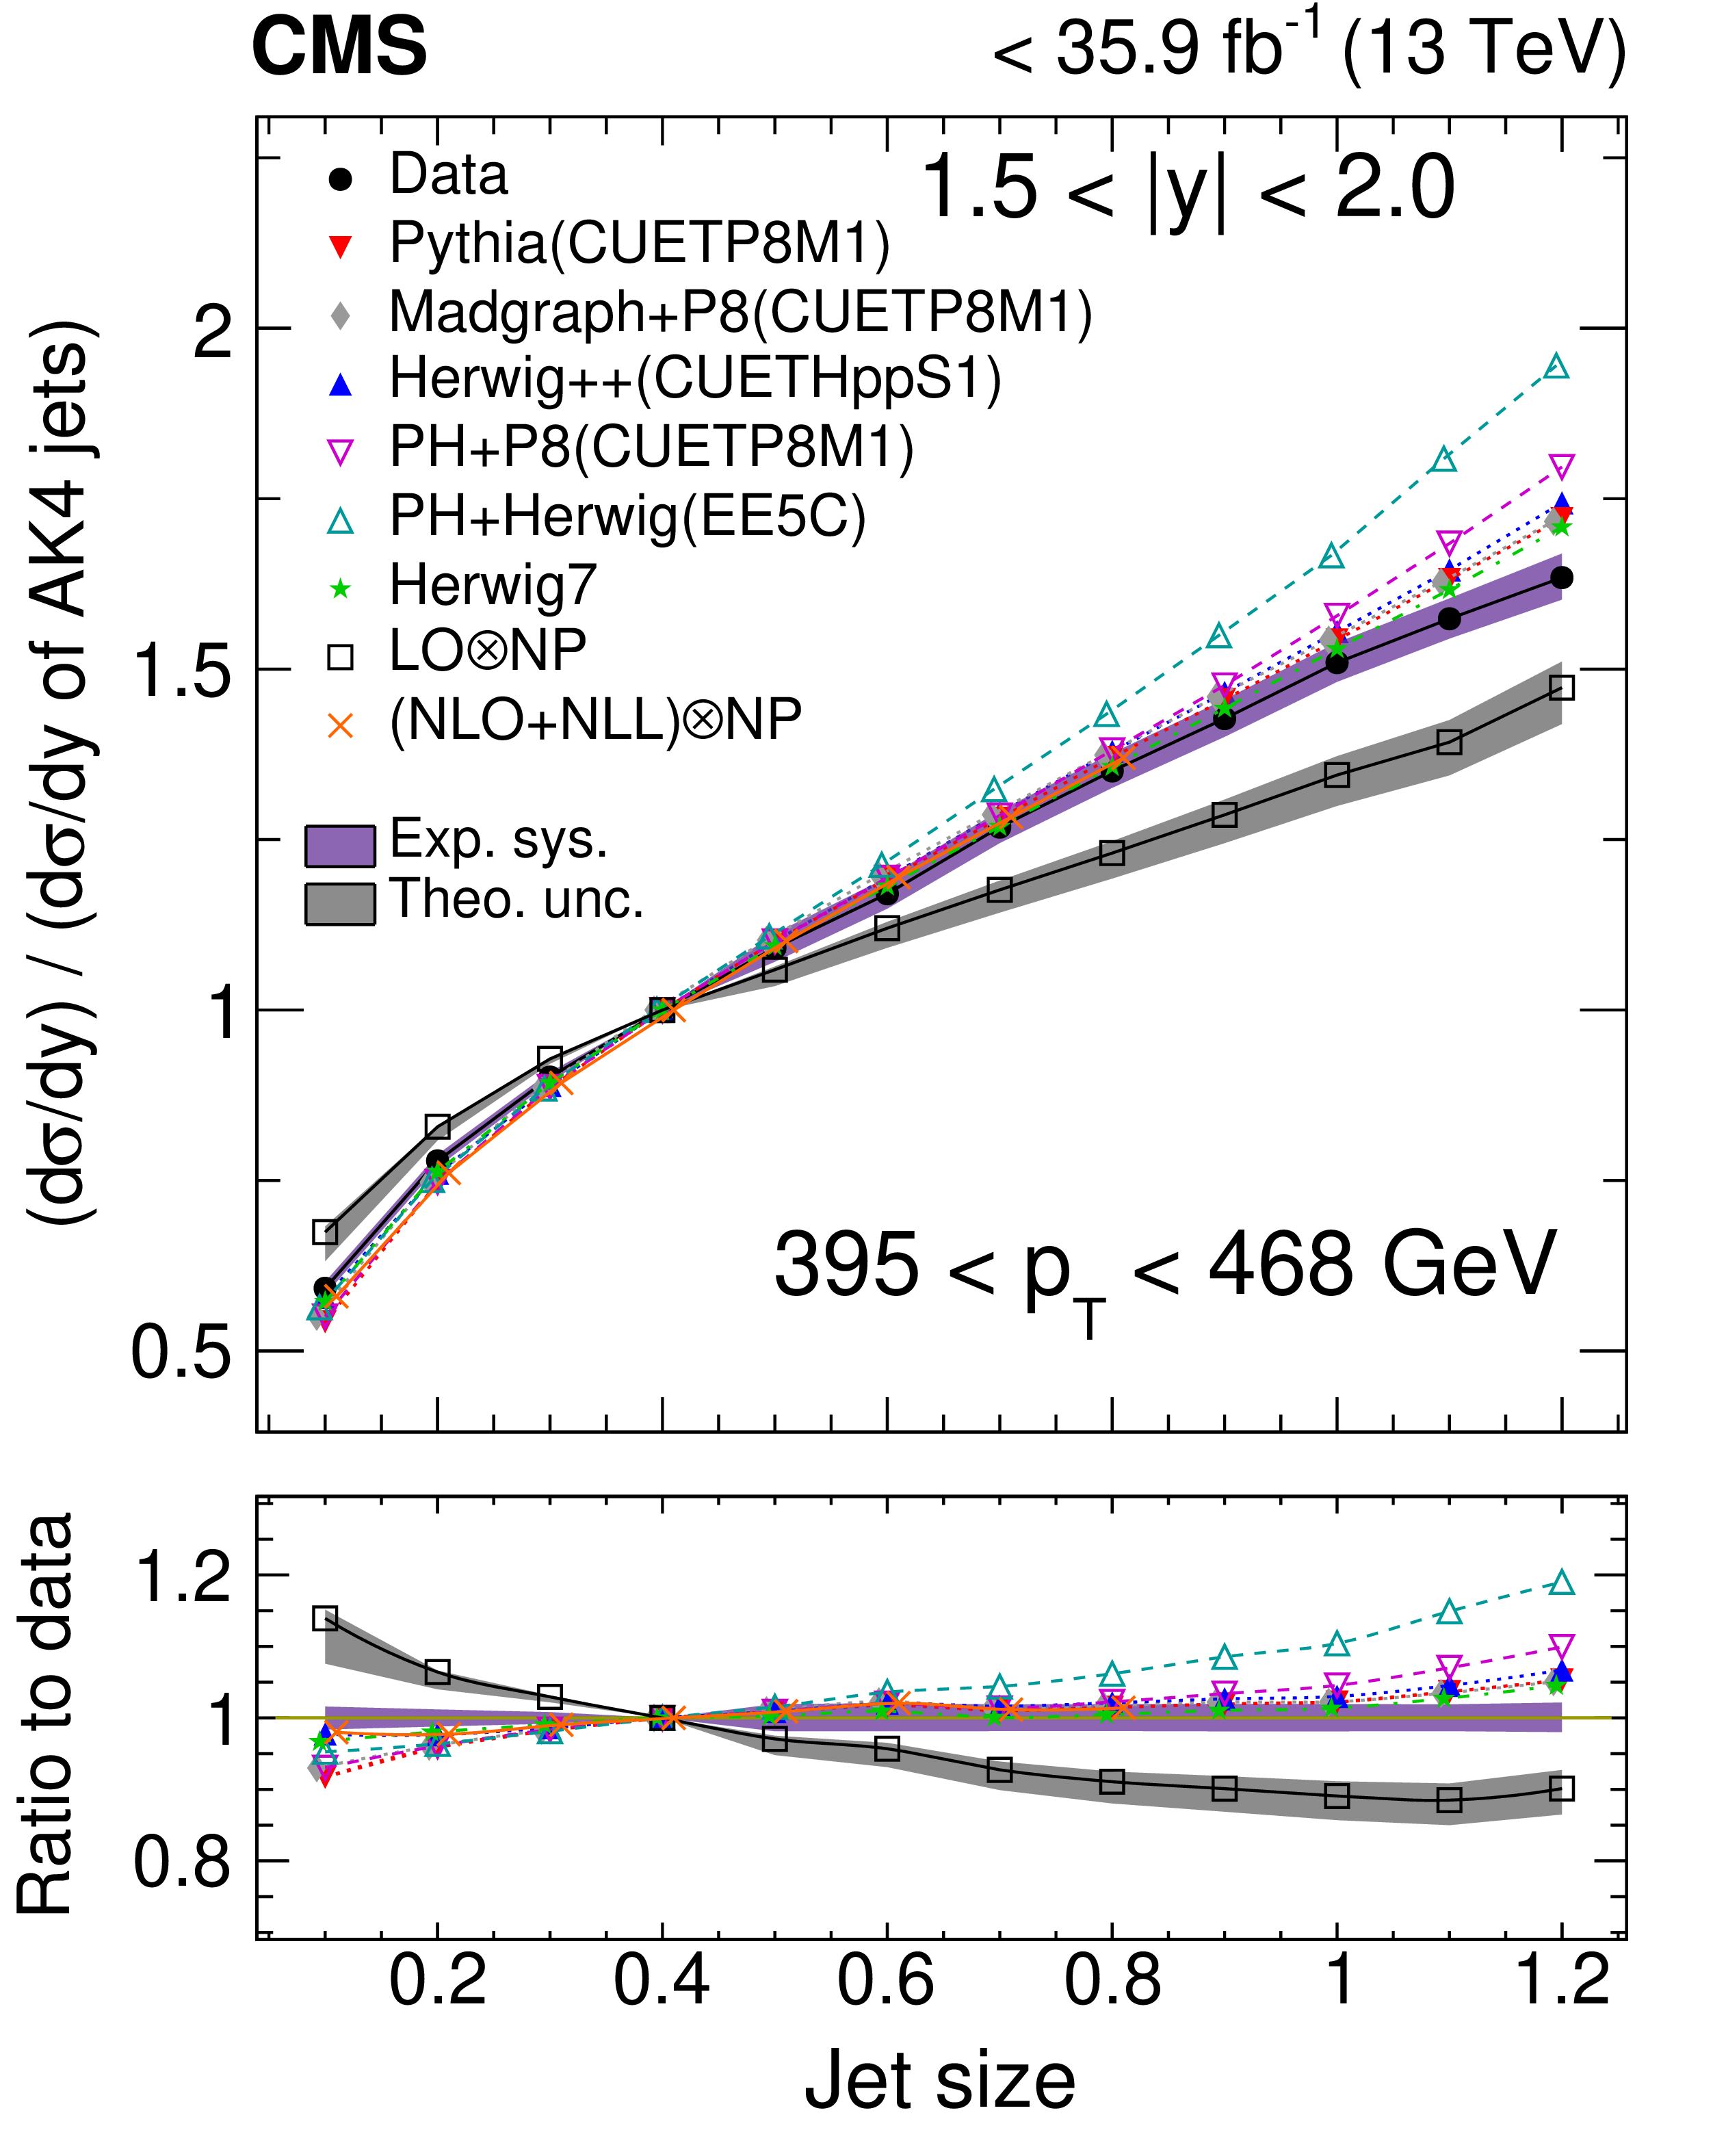
Comparison of the ratio of cross sections of inclusive jets of various sizes with respect to AK4 jets, as a function of jet size in different regions of jet ${p_{\mathrm {T}}}$ in data, and for multiple theoretical predictions in rapidity bins $ {| y |} < $ 0.5 (left column) and 1.5 $ < {| y |} < $ 2.0 (right column) at particle level. When the dijet production cross section ratio is presented using pure NLO predictions for two jet sizes, the ratio becomes LO at ${\alpha _S} $; this is quoted as LO$\otimes $NP in the figure. Points corresponding to a particular prediction are connected via lines to guide the eye. Experimental uncertainties in the ratio of cross sections are shown with bands around the data points, whereas theoretical uncertainties are shown with the bands around the fixed-order predictions. |
png pdf |
Figure 6-a:
Comparison of the ratio of cross sections of inclusive jets of various sizes with respect to AK4 jets, as a function of jet size in different regions of 196 $<$ jet ${p_{\mathrm {T}}} < $ 272 GeV in data, and for multiple theoretical predictions in rapidity bin $ {| y |} < $ 0.5 at particle level. When the dijet production cross section ratio is presented using pure NLO predictions for two jet sizes, the ratio becomes LO at ${\alpha _S} $; this is quoted as LO$\otimes $NP in the figure. Points corresponding to a particular prediction are connected via lines to guide the eye. Experimental uncertainties in the ratio of cross sections are shown with bands around the data points, whereas theoretical uncertainties are shown with the bands around the fixed-order predictions. |
png pdf |
Figure 6-b:
Comparison of the ratio of cross sections of inclusive jets of various sizes with respect to AK4 jets, as a function of jet size in different regions of 196 $<$ jet ${p_{\mathrm {T}}} < $ 272 GeV in data, and for multiple theoretical predictions in rapidity bin 1.5 $ < {| y |} < $ 2.0 at particle level. When the dijet production cross section ratio is presented using pure NLO predictions for two jet sizes, the ratio becomes LO at ${\alpha _S} $; this is quoted as LO$\otimes $NP in the figure. Points corresponding to a particular prediction are connected via lines to guide the eye. Experimental uncertainties in the ratio of cross sections are shown with bands around the data points, whereas theoretical uncertainties are shown with the bands around the fixed-order predictions. |
png pdf |
Figure 6-c:
Comparison of the ratio of cross sections of inclusive jets of various sizes with respect to AK4 jets, as a function of jet size in different regions of 395 $<$ jet ${p_{\mathrm {T}}} < $ 468 GeV in data, and for multiple theoretical predictions in rapidity bin $ {| y |} < $ 0.5 at particle level. When the dijet production cross section ratio is presented using pure NLO predictions for two jet sizes, the ratio becomes LO at ${\alpha _S} $; this is quoted as LO$\otimes $NP in the figure. Points corresponding to a particular prediction are connected via lines to guide the eye. Experimental uncertainties in the ratio of cross sections are shown with bands around the data points, whereas theoretical uncertainties are shown with the bands around the fixed-order predictions. |
png pdf |
Figure 6-d:
Comparison of the ratio of cross sections of inclusive jets of various sizes with respect to AK4 jets, as a function of jet size in different regions of 395 $<$ jet ${p_{\mathrm {T}}} < $ 468 GeV in data, and for multiple theoretical predictions in rapidity bin 1.5 $ < {| y |} < $ 2.0 at particle level. When the dijet production cross section ratio is presented using pure NLO predictions for two jet sizes, the ratio becomes LO at ${\alpha _S} $; this is quoted as LO$\otimes $NP in the figure. Points corresponding to a particular prediction are connected via lines to guide the eye. Experimental uncertainties in the ratio of cross sections are shown with bands around the data points, whereas theoretical uncertainties are shown with the bands around the fixed-order predictions. |
png pdf |
Figure 6-e:
Comparison of the ratio of cross sections of inclusive jets of various sizes with respect to AK4 jets, as a function of jet size in different regions of 548 $<$ jet ${p_{\mathrm {T}}} < $ 638 GeV in data, and for multiple theoretical predictions in rapidity bin $ {| y |} < $ 0.5 at particle level. When the dijet production cross section ratio is presented using pure NLO predictions for two jet sizes, the ratio becomes LO at ${\alpha _S} $; this is quoted as LO$\otimes $NP in the figure. Points corresponding to a particular prediction are connected via lines to guide the eye. Experimental uncertainties in the ratio of cross sections are shown with bands around the data points, whereas theoretical uncertainties are shown with the bands around the fixed-order predictions. |
png pdf |
Figure 6-f:
Comparison of the ratio of cross sections of inclusive jets of various sizes with respect to AK4 jets, as a function of jet size in different regions of 548 $<$ jet ${p_{\mathrm {T}}} < $ 638 GeV in data, and for multiple theoretical predictions in rapidity bin 1.5 $ < {| y |} < $ 2.0 at particle level. When the dijet production cross section ratio is presented using pure NLO predictions for two jet sizes, the ratio becomes LO at ${\alpha _S} $; this is quoted as LO$\otimes $NP in the figure. Points corresponding to a particular prediction are connected via lines to guide the eye. Experimental uncertainties in the ratio of cross sections are shown with bands around the data points, whereas theoretical uncertainties are shown with the bands around the fixed-order predictions. |
| Tables | |
png pdf |
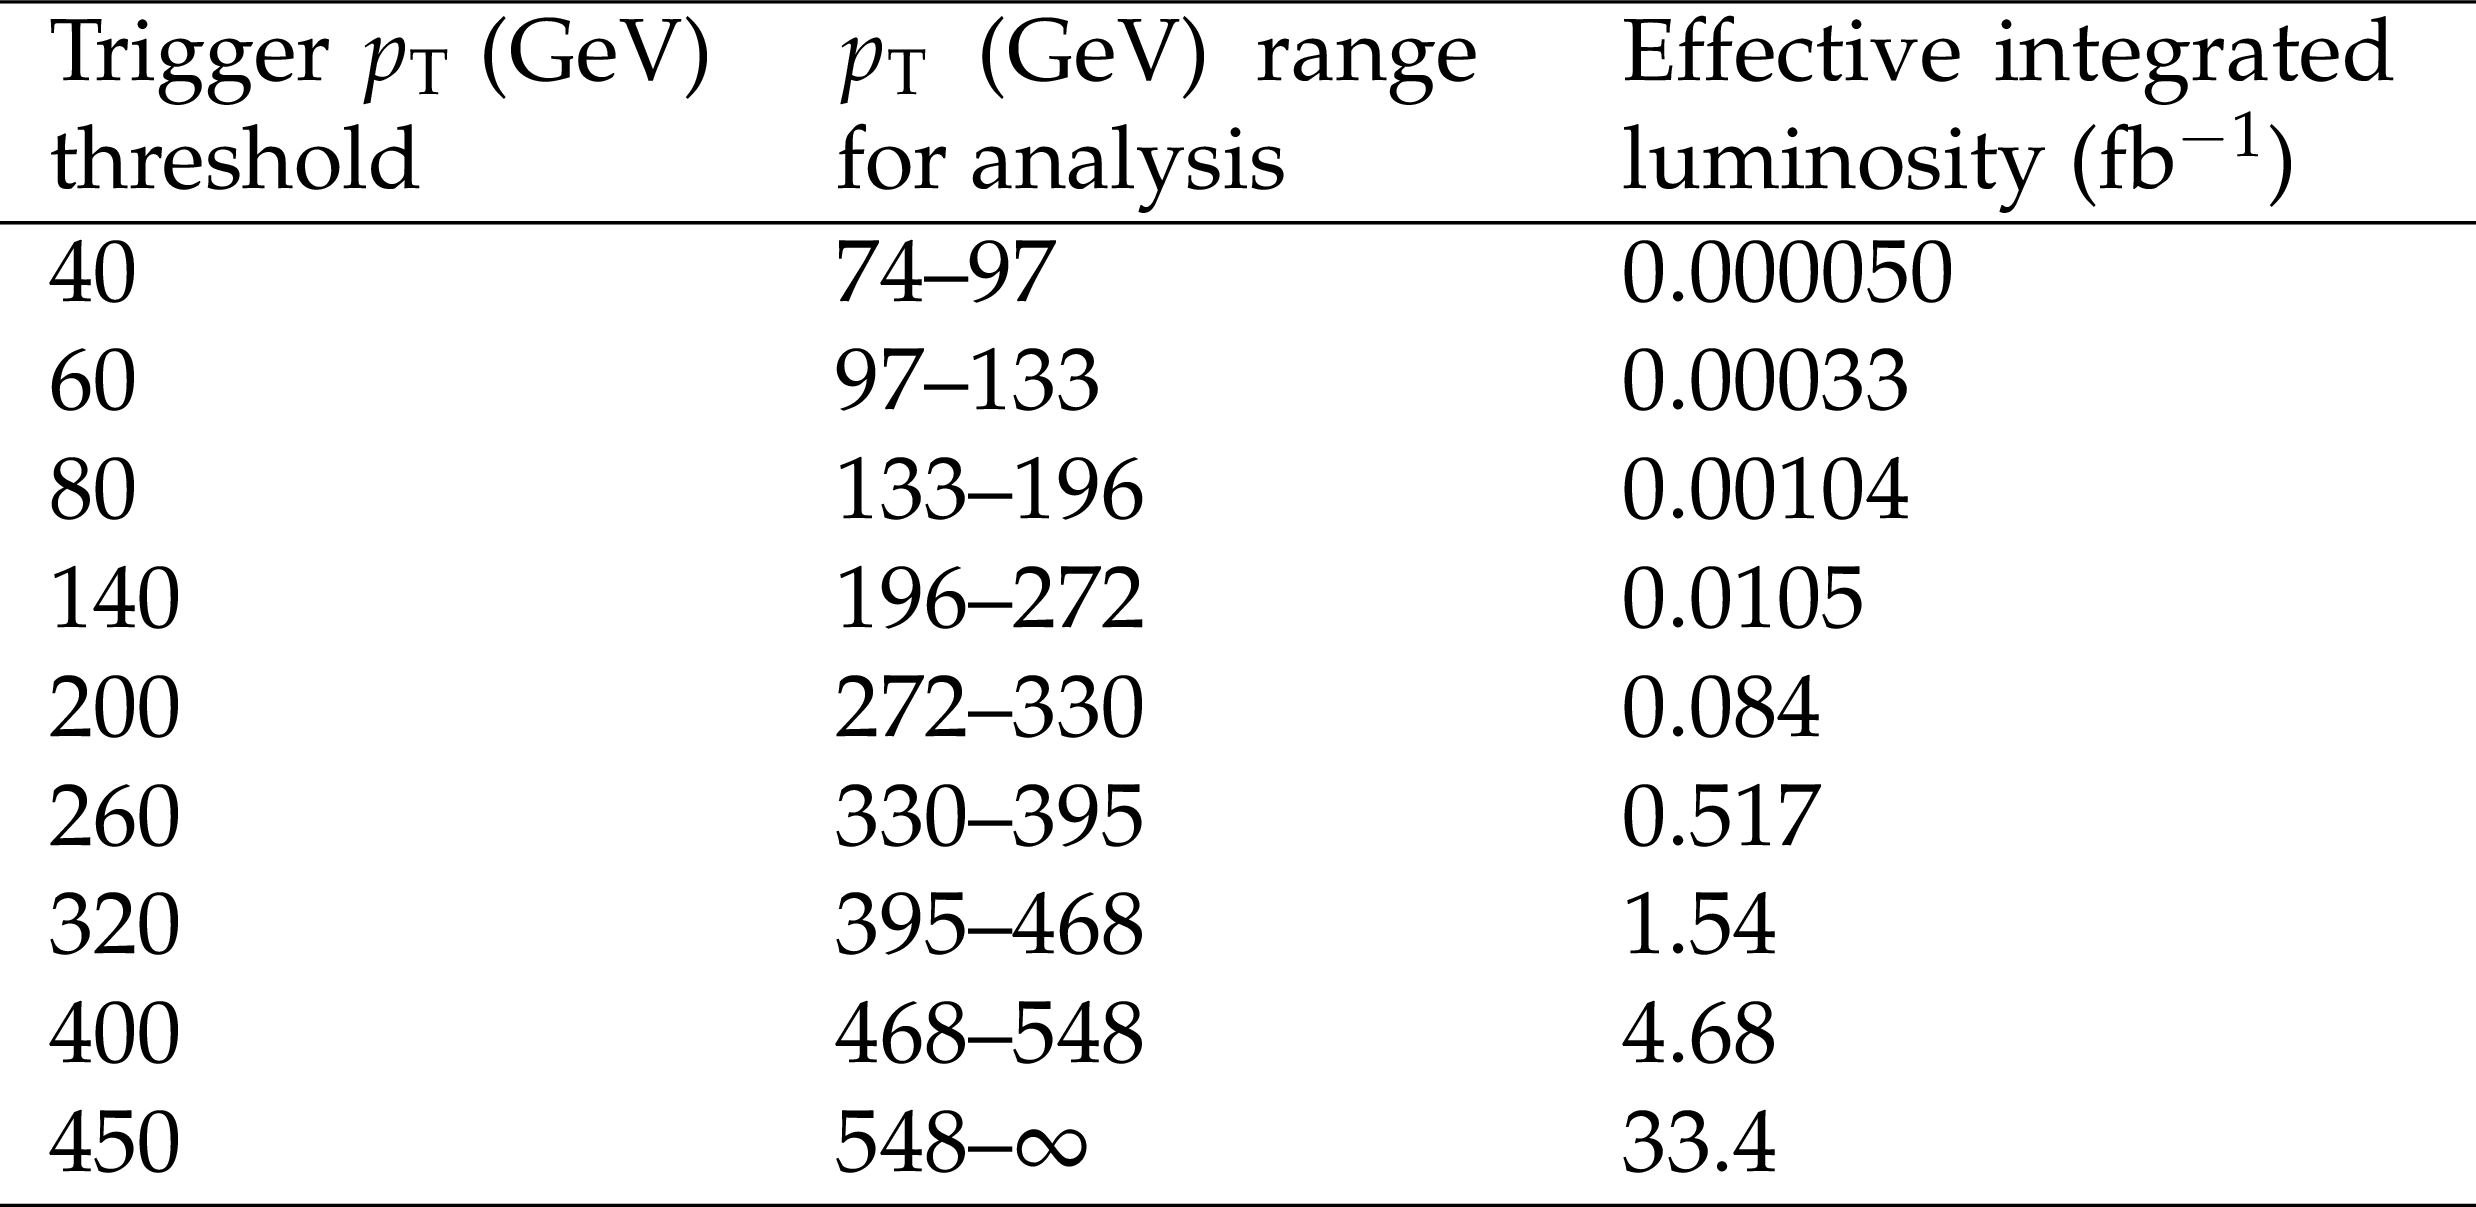
Table 1:
Trigger ${p_{\mathrm {T}}}$ thresholds and effective integrated luminosity of the HLT triggers based on AK8 jets. These triggers were not active during the initial part of data taking in 2016, thus the maximum integrated luminosity is less than 35.9 fb$^{-1}$. |
| Summary |
|
A measurement has been made of the ratio of cross sections of inclusive anti-${k_{\mathrm{T}}}$ jets of multiple sizes with respect to jets with the distance parameter $R = $ 0.4; this is the first such result from the CMS Collaboration. Because of cancellation of many experimental and theoretical systematic uncertainties for the ratio, it is more sensitive to perturbative and nonperturbative effects than the absolute cross section measurement; the experimental systematic uncertainty in the cross section ratio is of similar size as the statistical uncertainty, whereas the theoretical uncertainty is dominated by the choice of the renormalization and factorization scales. From the ratio measurement, we observe that the nonperturbative correction is important in describing the data at low transverse momentum. Thus, the modeling of nonperturbative effects, such as hadronization and the underlying event has a significant impact on the description of the data in different regions of phase space. Finally, the variation of the ratio of cross sections with jet size $R$ emphasizes the importance of the inclusion of parton showering algorithms to capture the effects of higher-order terms in the perturbation series by the resummation approach, which are absent in the case of fixed-order computation. This is also demonstrated by the analytic calculations using joint resummation in threshold for single jet production, and jet size. Therefore, this study shows the importance of final-state radiation modeled in Monte Carlo simulation to describe the data, and also implies that the differences between various parton showering and hadronization models are significant. |
| References | ||||
| 1 | G. Sterman and S. Weinberg | Jets from quantum chromodynamics | PRL 39 (1977) 1436 | |
| 2 | T. Sjostrand | A model for initial state parton showers | PLB 157 (1985) 321 | |
| 3 | T. D. Gottschalk | Backwards evolved initial state parton showers | NPB 277 (1986) 700 | |
| 4 | G. Marchesini and B. R. Webber | Simulation of QCD jets including soft gluon interference | NPB 238 (1984) 1 | |
| 5 | Y. L. Dokshitzer and B. R. Webber | Calculation of power corrections to hadronic event shapes | PLB 352 (1995) 451 | hep-ph/9504219 |
| 6 | CDF Collaboration | Charged jet evolution and the underlying event in proton-antiproton collisions at $ 1.8 $ TeV | PRD 65 (2002) 092002 | |
| 7 | N. Kidonakis, G. Oderda, and G. F. Sterman | Threshold resummation for dijet cross-sections | NPB 525 (1998) 299 | hep-ph/9801268 |
| 8 | M. H. Seymour | Jet shapes in hadron collisions: Higher orders, resummation and hadronization | NPB 513 (1998) 269 | |
| 9 | X. Liu, S.-O. Moch, and F. Ringer | Threshold and jet radius joint resummation for single-inclusive jet production | PRL 119 (2017) 212001 | 1708.04641 |
| 10 | M. Cacciari, G. P. Salam, and G. Soyez | The anti-$ {k_{\mathrm{T}}} $ jet clustering algorithm | JHEP 04 (2008) 063 | 0802.1189 |
| 11 | CMS Collaboration | The CMS experiment at the CERN LHC | JINST 3 (2008) S08004 | CMS-00-001 |
| 12 | CMS Collaboration | Measurement of the inclusive jet cross section in pp collisions at $ \sqrt{s}= $ 7 TeV | PRL 107 (2011) 132001 | CMS-QCD-10-011 1106.0208 |
| 13 | CMS Collaboration | Measurement and QCD analysis of double-differential inclusive jet cross sections in pp collisions at $ \sqrt{s}= $ 8 TeV and cross section ratios to 2.76 and 7 TeV | JHEP 03 (2017) 156 | CMS-SMP-14-001 1609.05331 |
| 14 | CMS Collaboration | Measurement of the double-differential inclusive jet cross section in proton-proton collisions at $ \sqrt{s} = $ 13 TeV | EPJC 76 (2016) 451 | CMS-SMP-15-007 1605.04436 |
| 15 | Z. Nagy | Next-to-leading order calculation of three jet observables in hadron hadron collision | PRD 68 (2003) 094002 | hep-ph/0307268 |
| 16 | T. Kluge, K. Rabbertz, and M. Wobisch | FastNLO: fast pQCD calculations for PDF fits | in Deep inelastic scattering. Proceedings, 14th International Workshop, DIS 2006, Tsukuba, Japan, April 20-24, 2006, p. 483 2006 | hep-ph/0609285 |
| 17 | S. Frixione, P. Nason, and C. Oleari | Matching NLO QCD computations with parton shower simulations: the POWHEG method | JHEP 11 (2007) 070 | 0709.2092 |
| 18 | T. Sjostrand et al. | An introduction to PYTHIA 8.2 | CPC 191 (2015) 159 | 1410.3012 |
| 19 | M. Bahr et al. | Herwig++ physics and manual | EPJC 58 (2008) 639 | 0803.0883 |
| 20 | ATLAS Collaboration | Measurement of the inclusive jet cross sections in proton-proton collisions at $ \sqrt{s}= $ 8 TeV with the ATLAS detector | JHEP 09 (2017) 020 | 1706.03192 |
| 21 | ALICE Collaboration | Measurement of the inclusive differential jet cross section in pp collisions at $ \sqrt{s} = $ 2.76 TeV | PLB 722 (2013) 262 | 1301.3475 |
| 22 | CMS Collaboration | Measurement of the ratio of inclusive jet cross sections using the anti-$ {k_{\mathrm{T}}} $ algorithm with radius parameters $ R= $ 0.5 and 0.7 in pp collisions at $ \sqrt{s}= $ 7 TeV | PRD 90 (2014) 072006 | CMS-SMP-13-002 1406.0324 |
| 23 | ALICE Collaboration | Measurements of inclusive jet spectra in pp and central Pb-Pb collisions at $ \sqrt{s_{\rm{NN}}} = $ 5.02 TeV | PRC 101 (2020) 034911 | 1909.09718 |
| 24 | F. Aversa, P. Chiappetta, M. Greco, and J. P. Guillet | QCD corrections to parton-parton scattering processes | NPB 327 (1989) 105 | |
| 25 | D. de Florian and W. Vogelsang | Resummed cross section for jet production at hadron colliders | PRD 76 (2007) 074031 | 0704.1677 |
| 26 | M. Dasgupta, L. Magnea, and G. P. Salam | Nonperturbative QCD effects in jets at hadron colliders | JHEP 02 (2008) 055 | 0712.3014 |
| 27 | M. Beneke | Renormalons | PR 317 (1999) 1 | hep-ph/9807443 |
| 28 | M. Cacciari, G. P. Salam, and G. Soyez | The catchment area of jets | JHEP 04 (2008) 005 | 0802.1188 |
| 29 | Z. Nagy | Three jet cross sections in hadron hadron collisions at next-to-leading order | PRL 88 (2002) 122003 | hep-ph/0110315 |
| 30 | G. Soyez | A simple description of jet cross section ratios | PLB 698 (2011) 59 | 1101.2665 |
| 31 | CMS Collaboration | Description and performance of track and primary-vertex reconstruction with the CMS tracker | JINST 9 (2014) P10009 | CMS-TRK-11-001 1405.6569 |
| 32 | CMS Collaboration | Performance of photon reconstruction and identification with the CMS detector in proton-proton collisions at $ \sqrt{s} = $ 8 TeV | JINST 10 (2015) P08010 | CMS-EGM-14-001 1502.02702 |
| 33 | CMS Collaboration | The CMS hadron calorimeter project | CDS | |
| 34 | CMS Collaboration | Jet energy scale and resolution performances with 13 TeV data | CDS | |
| 35 | CMS Collaboration | The CMS trigger system | JINST 12 (2017) P01020 | CMS-TRG-12-001 1609.02366 |
| 36 | CMS Collaboration | Particle-flow reconstruction and global event description with the CMS detector | JINST 12 (2017) P10003 | CMS-PRF-14-001 1706.04965 |
| 37 | M. Cacciari, G. P. Salam, and G. Soyez | FastJet user manual | EPJC 72 (2012) 1896 | 1111.6097 |
| 38 | M. Cacciari and G. P. Salam | Pileup subtraction using jet areas | PLB 659 (2008) 119 | 0707.1378 |
| 39 | CMS Collaboration | Jet energy scale and resolution in the CMS experiment in pp collisions at 8 TeV | JINST 12 (2017) P02014 | CMS-JME-13-004 1607.03663 |
| 40 | CMS Collaboration | Jet algorithms performance in 13 TeV data | CMS-PAS-JME-16-003 | CMS-PAS-JME-16-003 |
| 41 | CMS Collaboration | Performance of missing transverse momentum reconstruction in proton-proton collisions at $ \sqrt{s} = $ 13 TeV using the CMS detector | JINST 14 (2019) P07004 | CMS-JME-17-001 1903.06078 |
| 42 | CMS Collaboration | Determination of jet energy calibration and transverse momentum resolution in CMS | JINST 6 (2011) 11002 | CMS-JME-10-011 1107.4277 |
| 43 | NNPDF Collaboration | A determination of parton distributions with faithful uncertainty estimation | NPB 809 (2009) 1 | 0808.1231 |
| 44 | CMS Collaboration | Event generator tunes obtained from underlying event and multiparton scattering measurements | EPJC 76 (2016) 155 | CMS-GEN-14-001 1512.00815 |
| 45 | P. Skands, S. Carrazza, and J. Rojo | Tuning PYTHIA 8.1: the Monash 2013 tune | EPJC 74 (2014) 3024 | 1404.5630 |
| 46 | J. Alwall et al. | The automated computation of tree-level and next-to-leading order differential cross sections, and their matching to parton shower simulations | JHEP 07 (2014) 079 | 1405.0301 |
| 47 | J. Alwall et al. | Comparative study of various algorithms for the merging of parton showers and matrix elements in hadronic collisions | EPJC 53 (2008) 473 | 0706.2569 |
| 48 | S. Alioli et al. | Jet pair production in POWHEG | JHEP 04 (2011) 081 | 1012.3380 |
| 49 | M. H. Seymour and A. Siodmok | Constraining MPI models using $ \sigma_{eff} $ and recent Tevatron and LHC Underlying Event data | JHEP 10 (2013) 113 | 1307.5015 |
| 50 | J. Bellm et al. | Herwig 7.0/Herwig++ 3.0 release note | EPJC 76 (2016) 196 | 1512.01178 |
| 51 | R. Frederix and S. Frixione | Merging meets matching in MC@NLO | JHEP 12 (2012) 061 | 1209.6215 |
| 52 | X. Liu, S.-O. Moch, and F. Ringer | Phenomenology of single-inclusive jet production with jet radius and threshold resummation | PRD 97 (2018) 056026 | 1801.07284 |
| 53 | T. Adye | Unfolding algorithms and tests using RooUnfold | in Proceedings, PHYSTAT 2011 Workshop on Statistical Issues Related to Discovery Claims in Search Experiments and Unfolding, CERN,Geneva, Switzerland 17-20 January 2011, p. 313 CERN | 1105.1160 |
| 54 | G. D'Agostini | A multidimensional unfolding method based on Bayes' theorem | NIMA 362 (1995) 487 | |
| 55 | A. Hocker and V. Kartvelishvili | SVD approach to data unfolding | NIMA 372 (1996) 469 | hep-ph/9509307 |
| 56 | S. Schmitt | Data unfolding methods in high energy physics | EPJWeb Conf. 137 (2017) 11008 | 1611.01927 |
| 57 | S. Schmitt | TUnfold: an algorithm for correcting migration effects in high energy physics | JINST 7 (2012) T10003 | 1205.6201 |
| 58 | GEANT4 Collaboration | GEANT4--a simulation toolkit | NIMA 506 (2003) 250 | |
| 59 | B. Efron and R. J. Tibshirani | An introduction to the bootstrap | Mono. Stat. Appl. Probab. Chapman and Hall, London | |
| 60 | CMS Collaboration | Jet energy scale and resolution performance with 13 TeV data collected by CMS in 2016 | CDS | |
| 61 | CMS Collaboration | Measurement of the inelastic proton-proton cross section at $ \sqrt{s}= $ 13 TeV | JHEP 07 (2018) 161 | CMS-FSQ-15-005 1802.02613 |
| 62 | S. Dulat et al. | New parton distribution functions from a global analysis of quantum chromodynamics | PRD 93 (2016) 033006 | 1506.07443 |
| 63 | J. Butterworth et al. | PDF4LHC recommendations for LHC Run II | JPG 43 (2016) 023001 | 1510.03865 |
|
|
Compact Muon Solenoid LHC, CERN |
|

|

|

|

|

|