

Compact Muon Solenoid
LHC, CERN
| CMS-BPH-10-003 ; CERN-PH-EP-2010-055 | ||
| Upsilon production cross section in pp collisions at $\sqrt{s}$ = 7 TeV | ||
| CMS Collaboration | ||
| 27 December 2010 | ||
| Phys. Rev. D 83 (2011) 112004 | ||
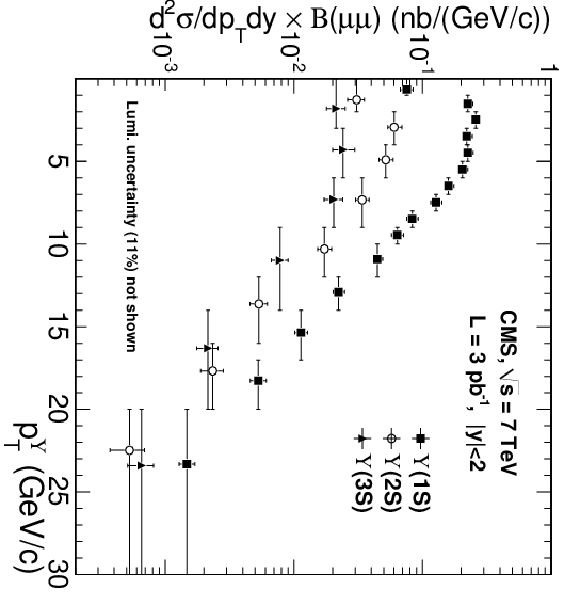
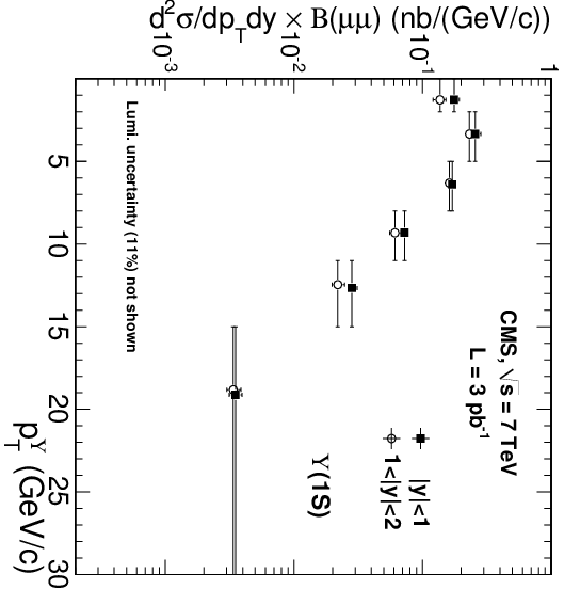
| Abstract: The Upsilon production cross section in proton-proton collisions at $\sqrt{s}$ = 7 TeV is measured using a data sample collected with the CMS detector at the LHC, corresponding to an integrated luminosity of 3.1 +/- 0.3 inverse picobarns. Integrated over the rapidity range |y|<2, we find the product of the Upsilon(1S) production cross section and branching fraction to dimuons to be sigma(pp to Upsilon(1S) X ) B(Upsilon(1S) to mu+ mu-) = 7.37 +/- 0.13^{+0.61}_{-0.42}pm 0.81 nb, where the first uncertainty is statistical, the second is systematic, and the third is associated with the estimation of the integrated luminosity of the data sample. This cross section is obtained assuming unpolarized Upsilon(1S) production. If the Upsilon(1S) production polarization is fully transverse or fully longitudinal the cross section changes by about 20%. We also report the measurement of the Upsilon(1S), Upsilon(2S), and Upsilon(3S) differential cross sections as a function of transverse momentum and rapidity. | ||
| Links: e-print arXiv:1012.5545 [hep-ex] (PDF) ; CDS record ; inSPIRE record ; Public twiki page ; HepData record ; CADI line (restricted) ; | ||
| Figures | |
png pdf |
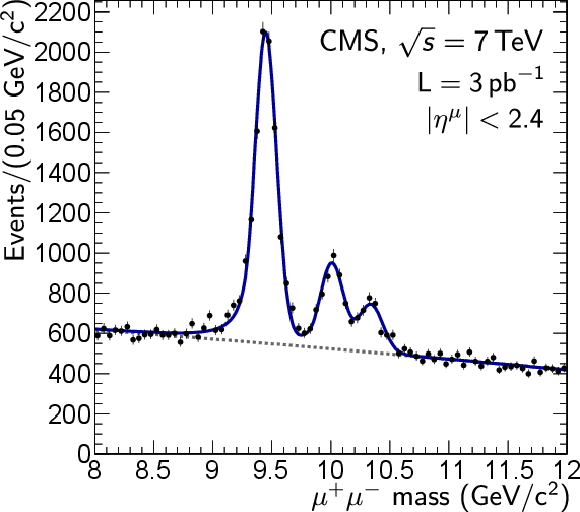
Figure 1-a:
The dimuon invariant-mass distribution in the vicinity of the $ {\Upsilon }(nS)$ resonances for the full rapidity covered by the analysis (left) and for the subset of events where the pseudorapidity of each muon satisfies $|\eta ^{\mu }|<1$ (right). The solid line shows the result of a fit to the invariant-mass distribution before accounting for acceptance and efficiency, with the dashed line denoting the background component. Details of the fit are described in Section {crosssection}. |
png pdf |
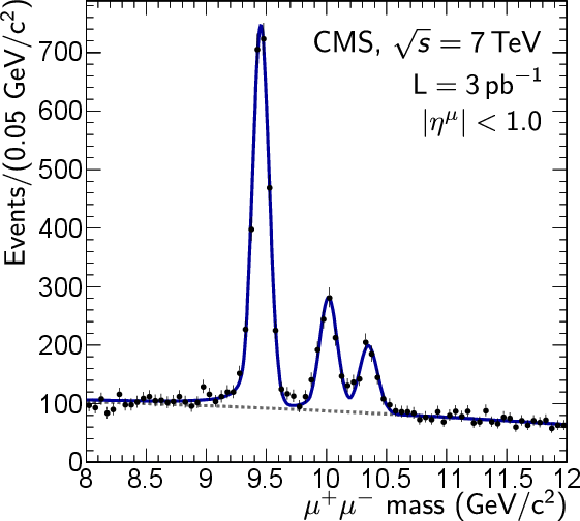
Figure 1-b:
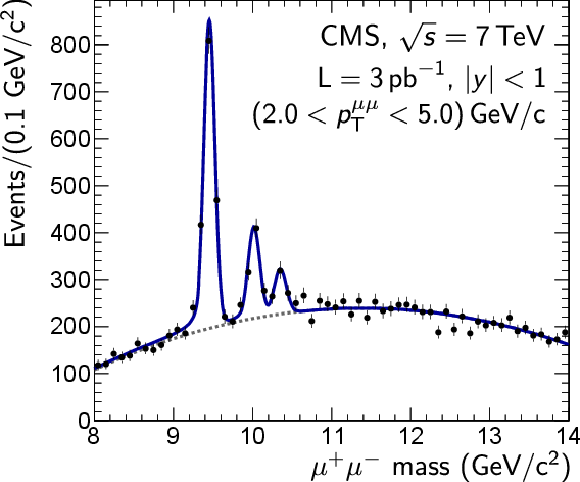
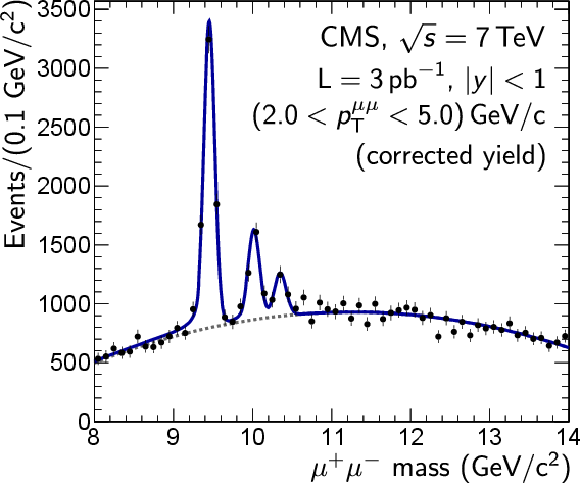
The dimuon invariant-mass distribution in the vicinity of the $ {\Upsilon }(nS)$ resonances for the full rapidity covered by the analysis (left) and for the subset of events where the pseudorapidity of each muon satisfies $|\eta ^{\mu }|<1$ (right). The solid line shows the result of a fit to the invariant-mass distribution before accounting for acceptance and efficiency, with the dashed line denoting the background component. Details of the fit are described in Section {crosssection}. |
png pdf |
Figure 2-a:
|
png pdf |
Figure 2-b:
|

png pdf |
Figure 3:
|

png pdf |
Figure 4:
|

png pdf |
Figure 5:
|
png pdf |
Figure 6-a:
|
png pdf |
Figure 6-b:
|
png pdf |
Figure 7-a:
|
png pdf |
Figure 7-b:
|

png pdf |
Figure 7-c:
|
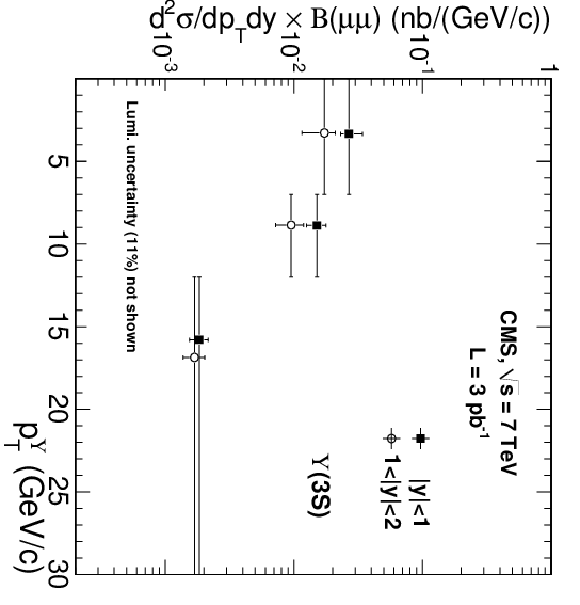
png pdf |
Figure 7-d:
|
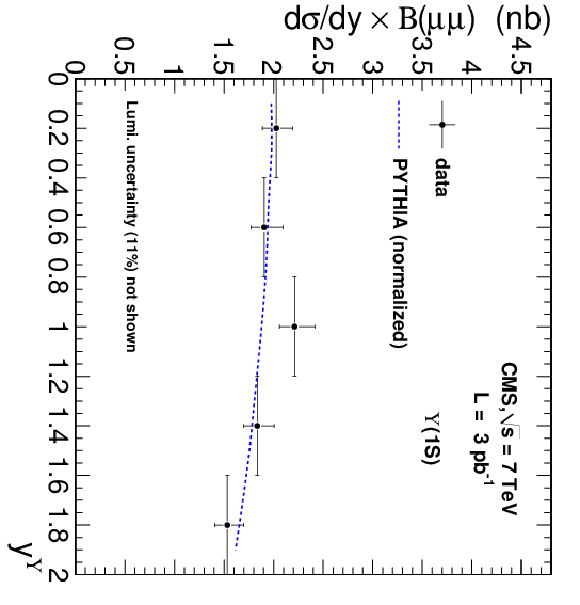
png pdf |
Figure 8-a:
|
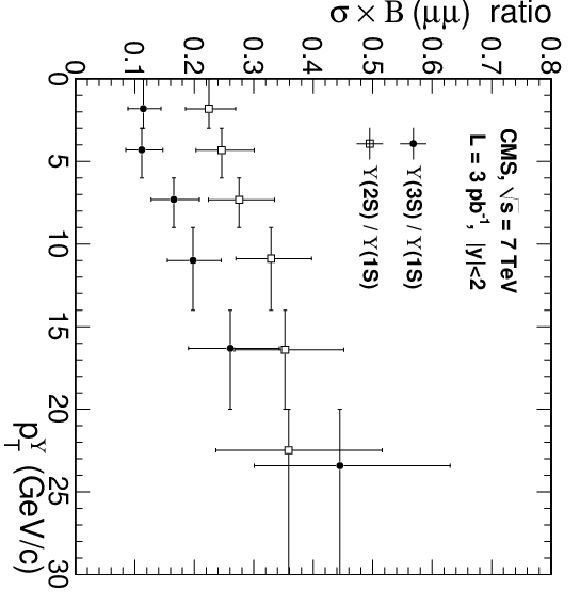
png pdf |
Figure 8-b:
|

png pdf |
Figure 9-a:
|
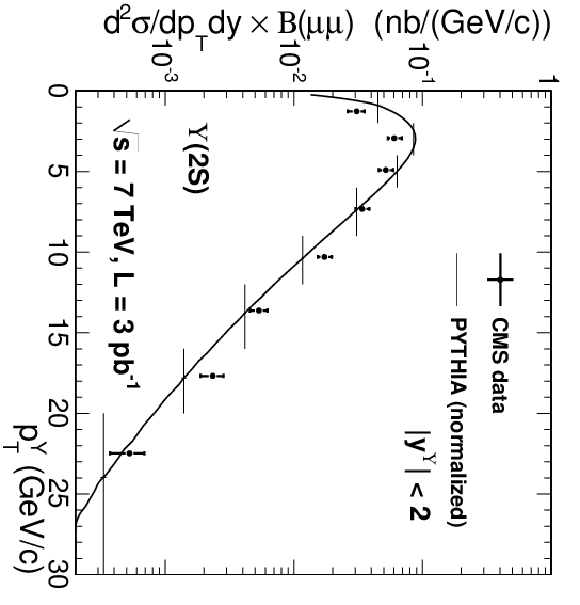
png pdf |
Figure 9-b:
|
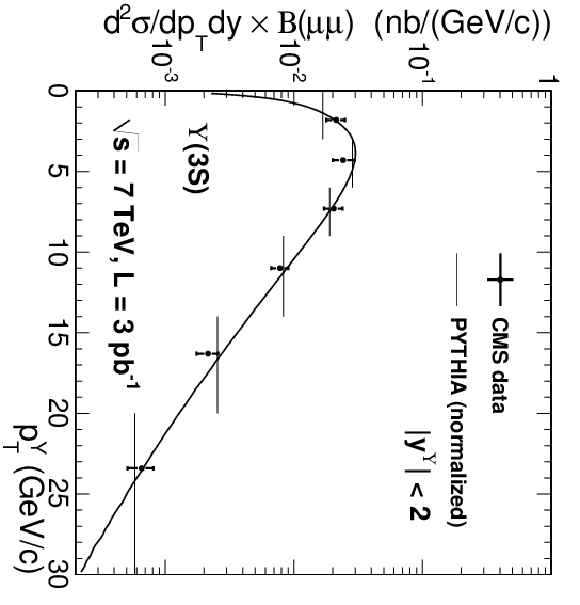
png pdf |
Figure 9-c:
|
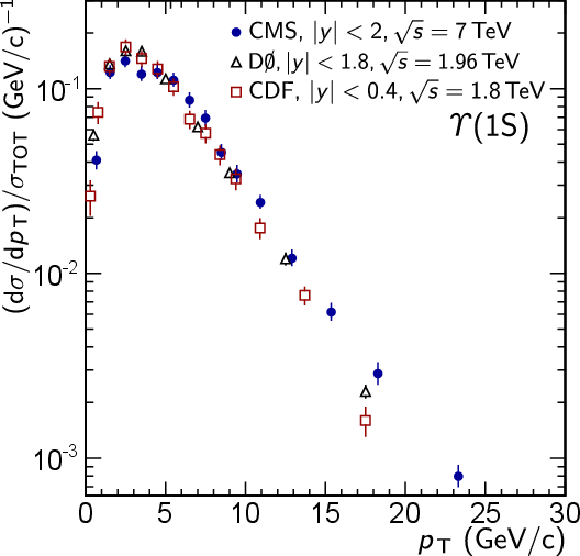
png pdf |
Figure 10-a:
|
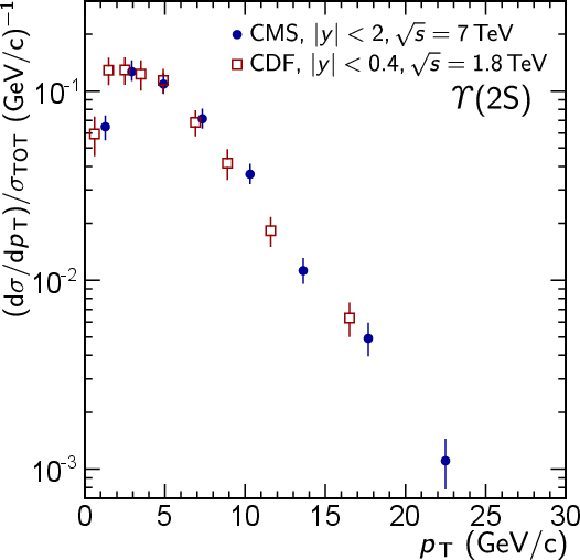
png pdf |
Figure 10-b:
|
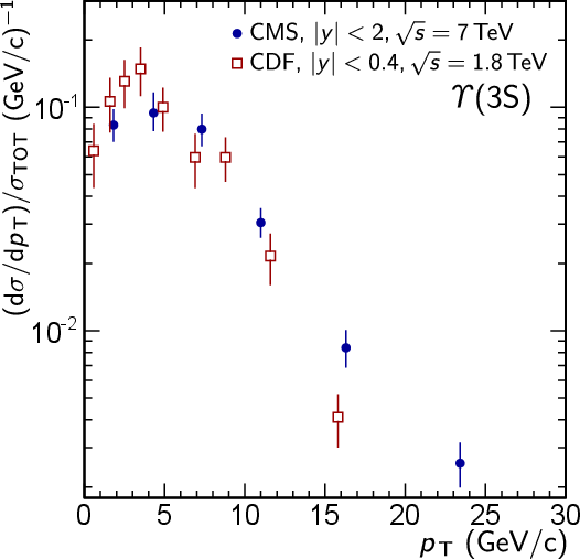
png pdf |
Figure 10-c:
|

|
Compact Muon Solenoid LHC, CERN |

|

|

|

|

|

|