

Compact Muon Solenoid
LHC, CERN
| CMS-PAS-SMP-22-004 | ||
| Measurement of event shape variables using charged particles inside jets in proton-proton collisions at $ \sqrt{s} = $ 13 TeV | ||
| CMS Collaboration | ||
| 3 April 2025 | ||
| Abstract: Event shape variables, constructed from the four-momenta of the final-state objects in an event, are sensitive to the predictions of quantum chromodynamics in multijet production, while minimizing the impact of systematic uncertainties. A study of five event shape variables is presented, using proton-proton collision data collected at a centre-of-mass energy of 13 TeV with the CMS detector during 2016-2018, corresponding to an integrated luminosity of 138 fb$^{-1}$. The variables are evaluated using the charged particles inside jets. After correcting for detector effects, their distributions are compared with the predictions from a number of models for multijet production. In general, the agreement between the theoretical prediction and the data improves with the increasing average transverse momentum of the two highest $ p_{\mathrm{T}} $ jets of the event. | ||
| Links: CDS record (PDF) ; CADI line (restricted) ; | ||
| Figures | |

png pdf |
Figure 2:
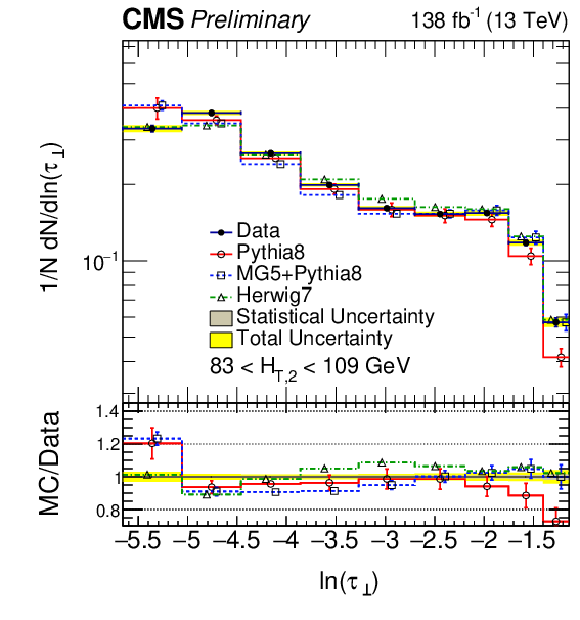
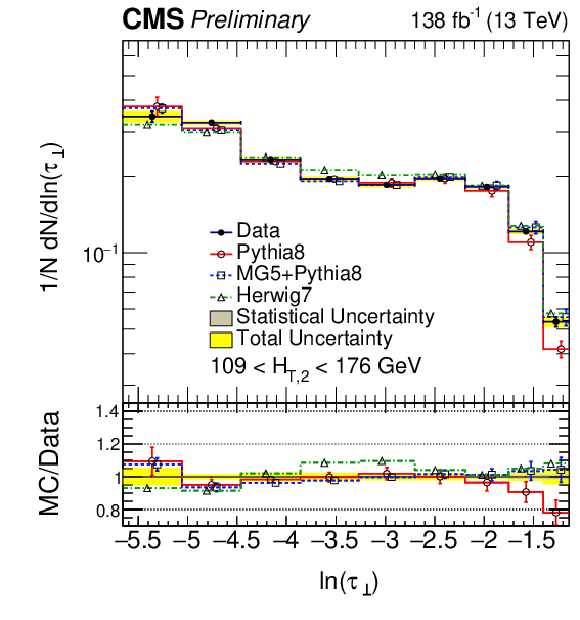
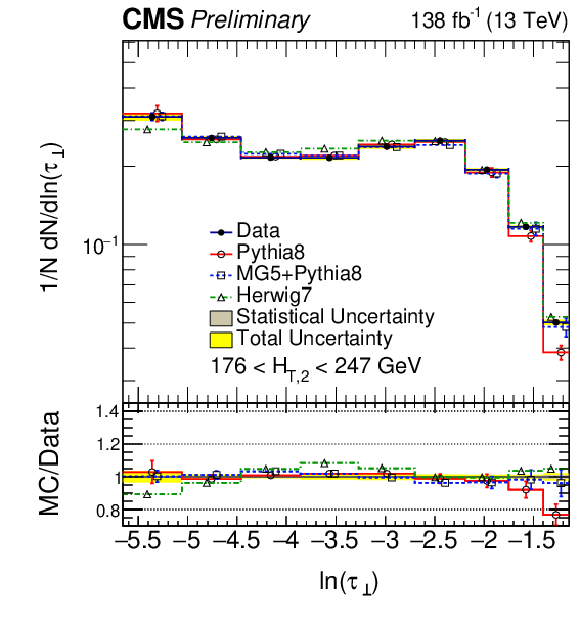
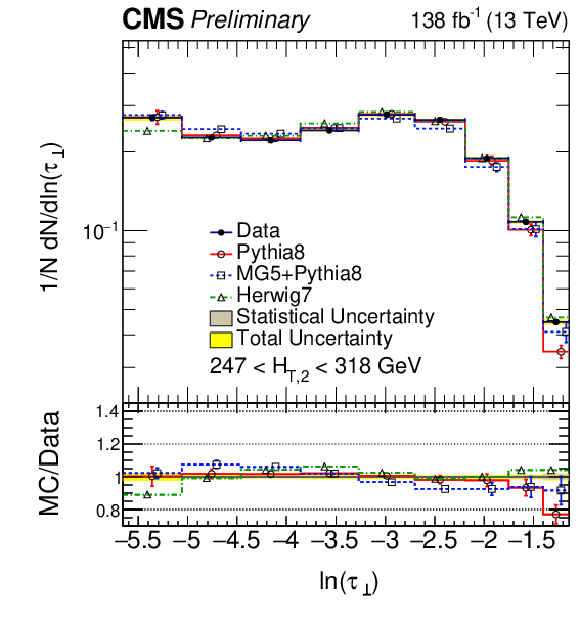
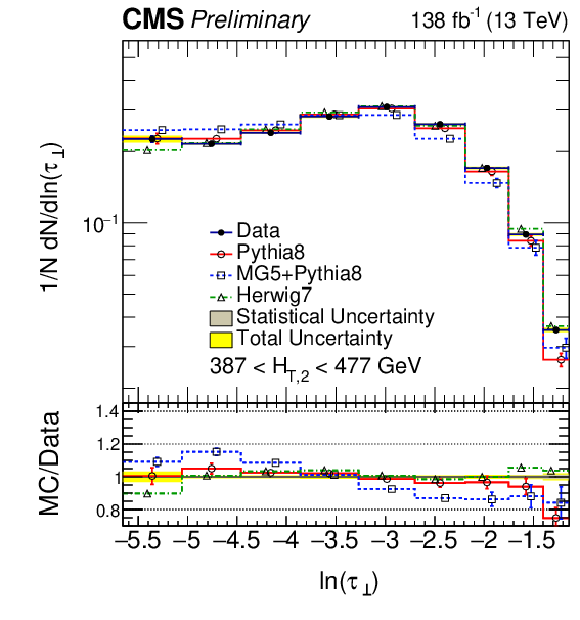
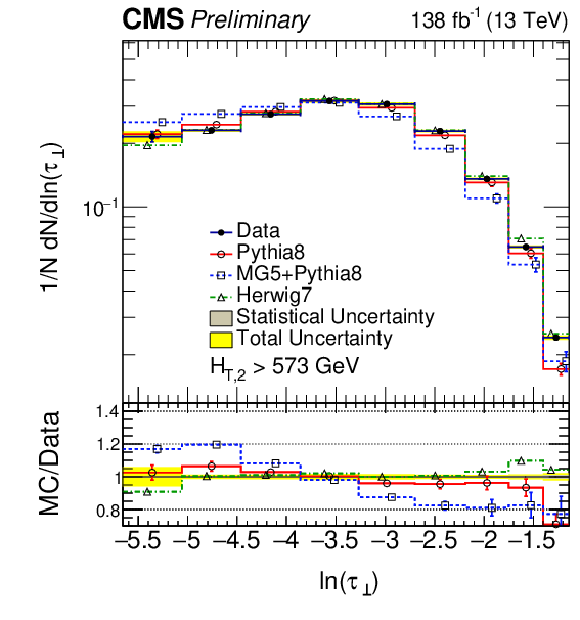
Normalized, unfolded distributions of the complement of transverse thrust ($ \tau_{\mathrm{\perp}} $) are compared with the predictions of PYTHIA8 (CP5 tune) (red, solid), HERWIG 7 (CH3 tune) (green, dash-dot) and MG5+PYTHIA8 (blue, dotted) for different $ {H_{\mathrm{T,2}}} $ ranges. For each plot the inner grey band and the yellow band represent the statistical and total uncertainties and the lower panel shows the ratio of simulation with respect to data. The error bars corresponding to PYTHIA8 (in red) and MG5+PYTHIA8 (in blue) represent their respective variations of the renormalization and factorization scales. |
png pdf |
Figure 2-a:
Normalized, unfolded distributions of the complement of transverse thrust ($ \tau_{\mathrm{\perp}} $) are compared with the predictions of PYTHIA8 (CP5 tune) (red, solid), HERWIG 7 (CH3 tune) (green, dash-dot) and MG5+PYTHIA8 (blue, dotted) for different $ {H_{\mathrm{T,2}}} $ ranges. For each plot the inner grey band and the yellow band represent the statistical and total uncertainties and the lower panel shows the ratio of simulation with respect to data. The error bars corresponding to PYTHIA8 (in red) and MG5+PYTHIA8 (in blue) represent their respective variations of the renormalization and factorization scales. |
png pdf |
Figure 2-b:
Normalized, unfolded distributions of the complement of transverse thrust ($ \tau_{\mathrm{\perp}} $) are compared with the predictions of PYTHIA8 (CP5 tune) (red, solid), HERWIG 7 (CH3 tune) (green, dash-dot) and MG5+PYTHIA8 (blue, dotted) for different $ {H_{\mathrm{T,2}}} $ ranges. For each plot the inner grey band and the yellow band represent the statistical and total uncertainties and the lower panel shows the ratio of simulation with respect to data. The error bars corresponding to PYTHIA8 (in red) and MG5+PYTHIA8 (in blue) represent their respective variations of the renormalization and factorization scales. |
png pdf |
Figure 2-c:
Normalized, unfolded distributions of the complement of transverse thrust ($ \tau_{\mathrm{\perp}} $) are compared with the predictions of PYTHIA8 (CP5 tune) (red, solid), HERWIG 7 (CH3 tune) (green, dash-dot) and MG5+PYTHIA8 (blue, dotted) for different $ {H_{\mathrm{T,2}}} $ ranges. For each plot the inner grey band and the yellow band represent the statistical and total uncertainties and the lower panel shows the ratio of simulation with respect to data. The error bars corresponding to PYTHIA8 (in red) and MG5+PYTHIA8 (in blue) represent their respective variations of the renormalization and factorization scales. |
png pdf |
Figure 2-d:
Normalized, unfolded distributions of the complement of transverse thrust ($ \tau_{\mathrm{\perp}} $) are compared with the predictions of PYTHIA8 (CP5 tune) (red, solid), HERWIG 7 (CH3 tune) (green, dash-dot) and MG5+PYTHIA8 (blue, dotted) for different $ {H_{\mathrm{T,2}}} $ ranges. For each plot the inner grey band and the yellow band represent the statistical and total uncertainties and the lower panel shows the ratio of simulation with respect to data. The error bars corresponding to PYTHIA8 (in red) and MG5+PYTHIA8 (in blue) represent their respective variations of the renormalization and factorization scales. |

png pdf |
Figure 2-e:
Normalized, unfolded distributions of the complement of transverse thrust ($ \tau_{\mathrm{\perp}} $) are compared with the predictions of PYTHIA8 (CP5 tune) (red, solid), HERWIG 7 (CH3 tune) (green, dash-dot) and MG5+PYTHIA8 (blue, dotted) for different $ {H_{\mathrm{T,2}}} $ ranges. For each plot the inner grey band and the yellow band represent the statistical and total uncertainties and the lower panel shows the ratio of simulation with respect to data. The error bars corresponding to PYTHIA8 (in red) and MG5+PYTHIA8 (in blue) represent their respective variations of the renormalization and factorization scales. |
png pdf |
Figure 2-f:
Normalized, unfolded distributions of the complement of transverse thrust ($ \tau_{\mathrm{\perp}} $) are compared with the predictions of PYTHIA8 (CP5 tune) (red, solid), HERWIG 7 (CH3 tune) (green, dash-dot) and MG5+PYTHIA8 (blue, dotted) for different $ {H_{\mathrm{T,2}}} $ ranges. For each plot the inner grey band and the yellow band represent the statistical and total uncertainties and the lower panel shows the ratio of simulation with respect to data. The error bars corresponding to PYTHIA8 (in red) and MG5+PYTHIA8 (in blue) represent their respective variations of the renormalization and factorization scales. |

png pdf |
Figure 2-g:
Normalized, unfolded distributions of the complement of transverse thrust ($ \tau_{\mathrm{\perp}} $) are compared with the predictions of PYTHIA8 (CP5 tune) (red, solid), HERWIG 7 (CH3 tune) (green, dash-dot) and MG5+PYTHIA8 (blue, dotted) for different $ {H_{\mathrm{T,2}}} $ ranges. For each plot the inner grey band and the yellow band represent the statistical and total uncertainties and the lower panel shows the ratio of simulation with respect to data. The error bars corresponding to PYTHIA8 (in red) and MG5+PYTHIA8 (in blue) represent their respective variations of the renormalization and factorization scales. |
png pdf |
Figure 2-h:
Normalized, unfolded distributions of the complement of transverse thrust ($ \tau_{\mathrm{\perp}} $) are compared with the predictions of PYTHIA8 (CP5 tune) (red, solid), HERWIG 7 (CH3 tune) (green, dash-dot) and MG5+PYTHIA8 (blue, dotted) for different $ {H_{\mathrm{T,2}}} $ ranges. For each plot the inner grey band and the yellow band represent the statistical and total uncertainties and the lower panel shows the ratio of simulation with respect to data. The error bars corresponding to PYTHIA8 (in red) and MG5+PYTHIA8 (in blue) represent their respective variations of the renormalization and factorization scales. |
png pdf |
Figure 3:
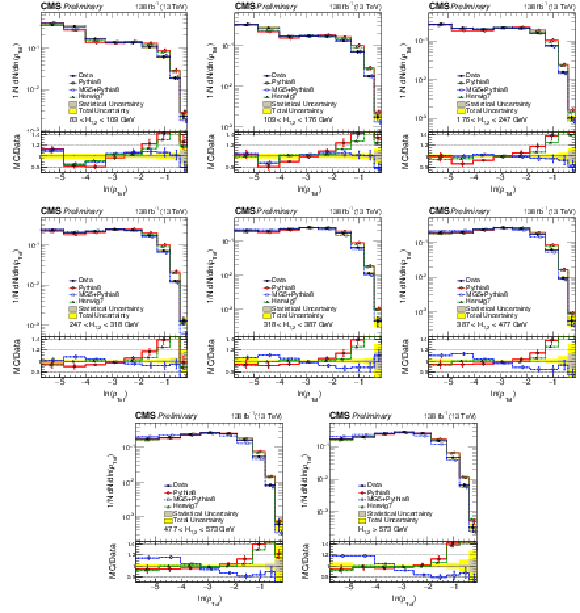
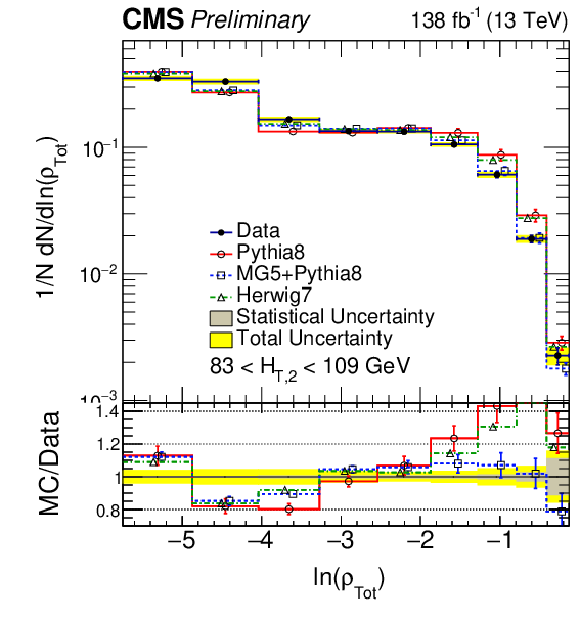
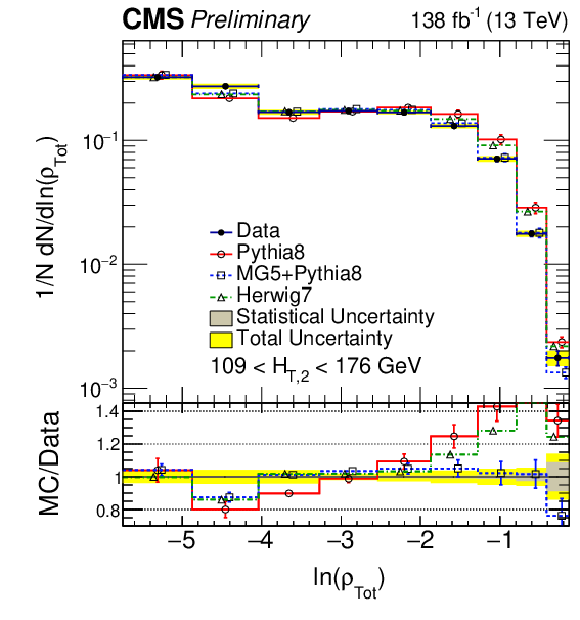
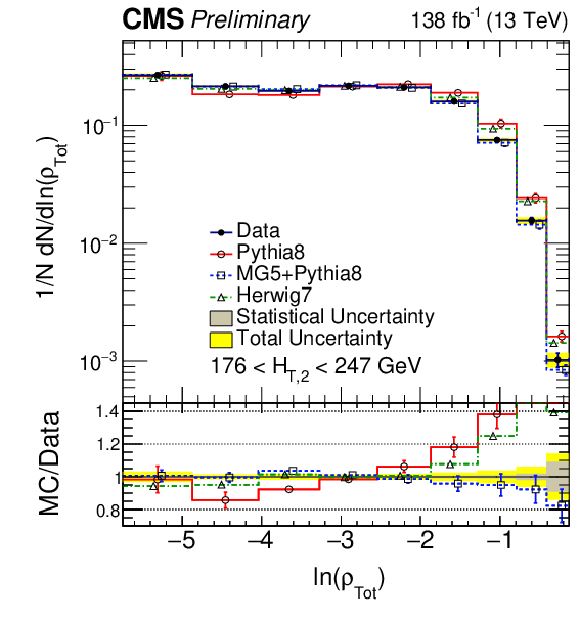
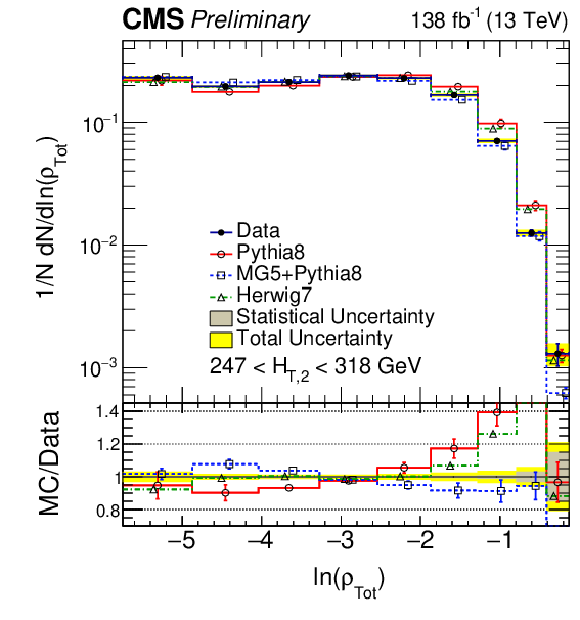
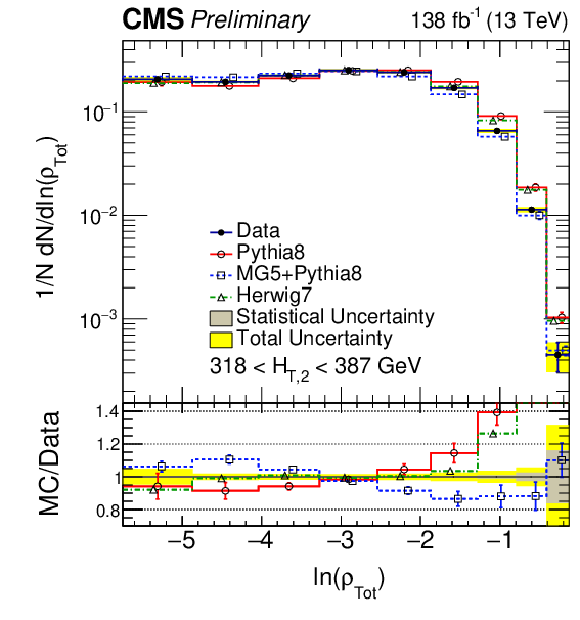
Normalized, unfolded distributions of total jet mass ($ \rho_{\mathrm{Tot}} $) are compared with the predictions of PYTHIA8 (CP5 tune)(red, solid), HERWIG 7 (CH3 tune)(green, dash-dot) and MG5+PYTHIA8 (blue, dot) for different $ {H_{\mathrm{T,2}}} $ ranges. For each plot the inner grey band and the yellow band represent the statistical and total uncertainties and the lower panel shows the ratio of simulation with respect to data. The error bars corresponding to PYTHIA8 (in red) and MG5+PYTHIA8 (in blue) represent their respective variations of the renormalization and factorization scales. |
png pdf |
Figure 3-a:
Normalized, unfolded distributions of total jet mass ($ \rho_{\mathrm{Tot}} $) are compared with the predictions of PYTHIA8 (CP5 tune)(red, solid), HERWIG 7 (CH3 tune)(green, dash-dot) and MG5+PYTHIA8 (blue, dot) for different $ {H_{\mathrm{T,2}}} $ ranges. For each plot the inner grey band and the yellow band represent the statistical and total uncertainties and the lower panel shows the ratio of simulation with respect to data. The error bars corresponding to PYTHIA8 (in red) and MG5+PYTHIA8 (in blue) represent their respective variations of the renormalization and factorization scales. |
png pdf |
Figure 3-b:
Normalized, unfolded distributions of total jet mass ($ \rho_{\mathrm{Tot}} $) are compared with the predictions of PYTHIA8 (CP5 tune)(red, solid), HERWIG 7 (CH3 tune)(green, dash-dot) and MG5+PYTHIA8 (blue, dot) for different $ {H_{\mathrm{T,2}}} $ ranges. For each plot the inner grey band and the yellow band represent the statistical and total uncertainties and the lower panel shows the ratio of simulation with respect to data. The error bars corresponding to PYTHIA8 (in red) and MG5+PYTHIA8 (in blue) represent their respective variations of the renormalization and factorization scales. |
png pdf |
Figure 3-c:
Normalized, unfolded distributions of total jet mass ($ \rho_{\mathrm{Tot}} $) are compared with the predictions of PYTHIA8 (CP5 tune)(red, solid), HERWIG 7 (CH3 tune)(green, dash-dot) and MG5+PYTHIA8 (blue, dot) for different $ {H_{\mathrm{T,2}}} $ ranges. For each plot the inner grey band and the yellow band represent the statistical and total uncertainties and the lower panel shows the ratio of simulation with respect to data. The error bars corresponding to PYTHIA8 (in red) and MG5+PYTHIA8 (in blue) represent their respective variations of the renormalization and factorization scales. |
png pdf |
Figure 3-d:
Normalized, unfolded distributions of total jet mass ($ \rho_{\mathrm{Tot}} $) are compared with the predictions of PYTHIA8 (CP5 tune)(red, solid), HERWIG 7 (CH3 tune)(green, dash-dot) and MG5+PYTHIA8 (blue, dot) for different $ {H_{\mathrm{T,2}}} $ ranges. For each plot the inner grey band and the yellow band represent the statistical and total uncertainties and the lower panel shows the ratio of simulation with respect to data. The error bars corresponding to PYTHIA8 (in red) and MG5+PYTHIA8 (in blue) represent their respective variations of the renormalization and factorization scales. |
png pdf |
Figure 3-e:
Normalized, unfolded distributions of total jet mass ($ \rho_{\mathrm{Tot}} $) are compared with the predictions of PYTHIA8 (CP5 tune)(red, solid), HERWIG 7 (CH3 tune)(green, dash-dot) and MG5+PYTHIA8 (blue, dot) for different $ {H_{\mathrm{T,2}}} $ ranges. For each plot the inner grey band and the yellow band represent the statistical and total uncertainties and the lower panel shows the ratio of simulation with respect to data. The error bars corresponding to PYTHIA8 (in red) and MG5+PYTHIA8 (in blue) represent their respective variations of the renormalization and factorization scales. |
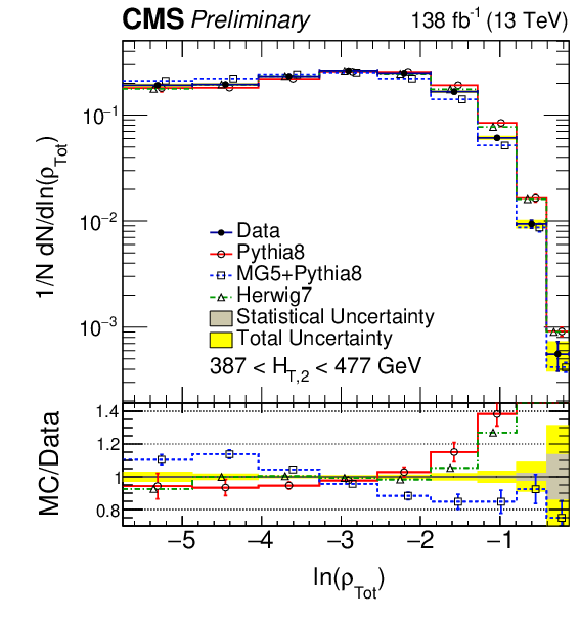
png pdf |
Figure 3-f:
Normalized, unfolded distributions of total jet mass ($ \rho_{\mathrm{Tot}} $) are compared with the predictions of PYTHIA8 (CP5 tune)(red, solid), HERWIG 7 (CH3 tune)(green, dash-dot) and MG5+PYTHIA8 (blue, dot) for different $ {H_{\mathrm{T,2}}} $ ranges. For each plot the inner grey band and the yellow band represent the statistical and total uncertainties and the lower panel shows the ratio of simulation with respect to data. The error bars corresponding to PYTHIA8 (in red) and MG5+PYTHIA8 (in blue) represent their respective variations of the renormalization and factorization scales. |
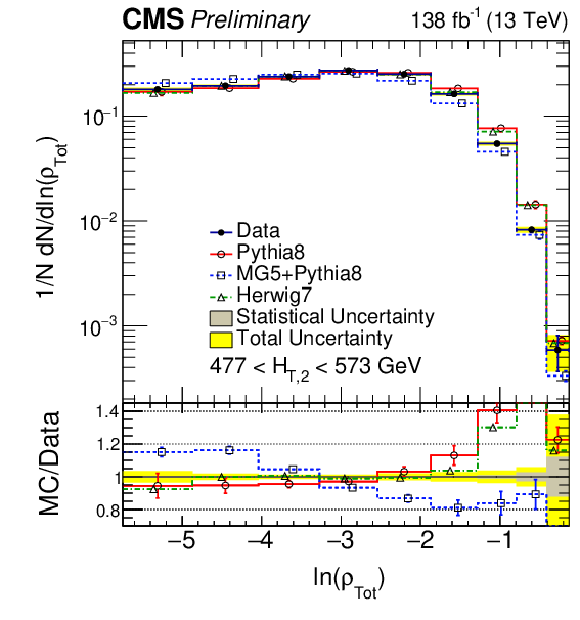
png pdf |
Figure 3-g:
Normalized, unfolded distributions of total jet mass ($ \rho_{\mathrm{Tot}} $) are compared with the predictions of PYTHIA8 (CP5 tune)(red, solid), HERWIG 7 (CH3 tune)(green, dash-dot) and MG5+PYTHIA8 (blue, dot) for different $ {H_{\mathrm{T,2}}} $ ranges. For each plot the inner grey band and the yellow band represent the statistical and total uncertainties and the lower panel shows the ratio of simulation with respect to data. The error bars corresponding to PYTHIA8 (in red) and MG5+PYTHIA8 (in blue) represent their respective variations of the renormalization and factorization scales. |
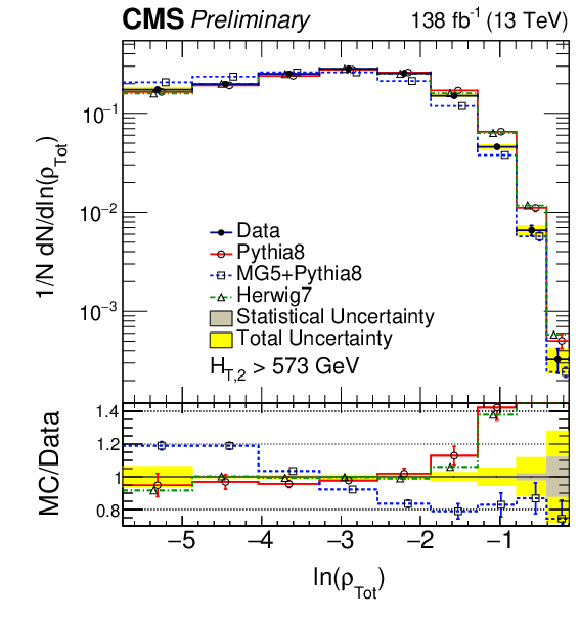
png pdf |
Figure 3-h:
Normalized, unfolded distributions of total jet mass ($ \rho_{\mathrm{Tot}} $) are compared with the predictions of PYTHIA8 (CP5 tune)(red, solid), HERWIG 7 (CH3 tune)(green, dash-dot) and MG5+PYTHIA8 (blue, dot) for different $ {H_{\mathrm{T,2}}} $ ranges. For each plot the inner grey band and the yellow band represent the statistical and total uncertainties and the lower panel shows the ratio of simulation with respect to data. The error bars corresponding to PYTHIA8 (in red) and MG5+PYTHIA8 (in blue) represent their respective variations of the renormalization and factorization scales. |

png pdf |
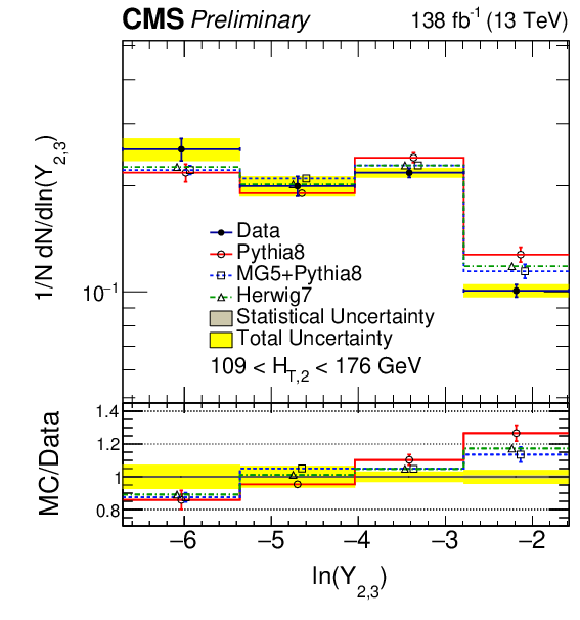
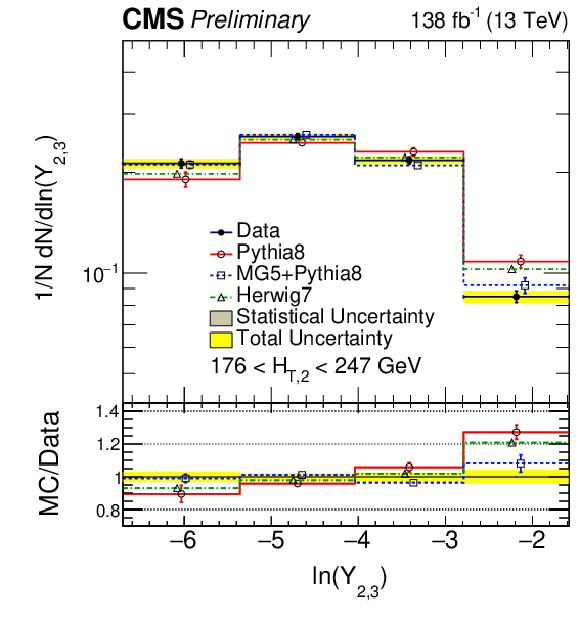
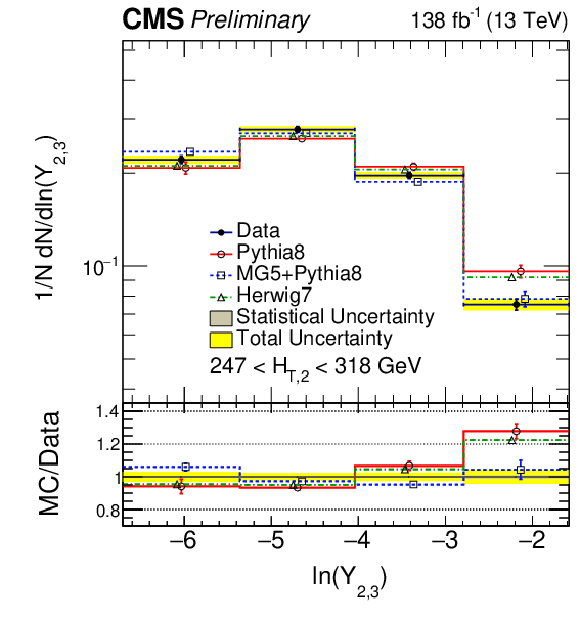
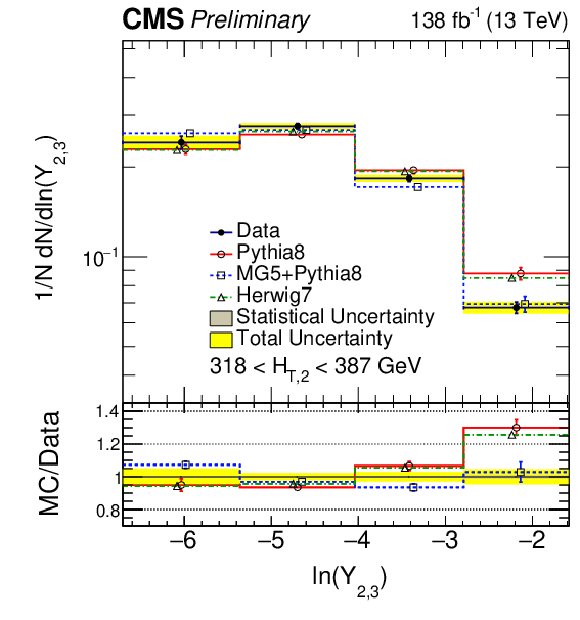
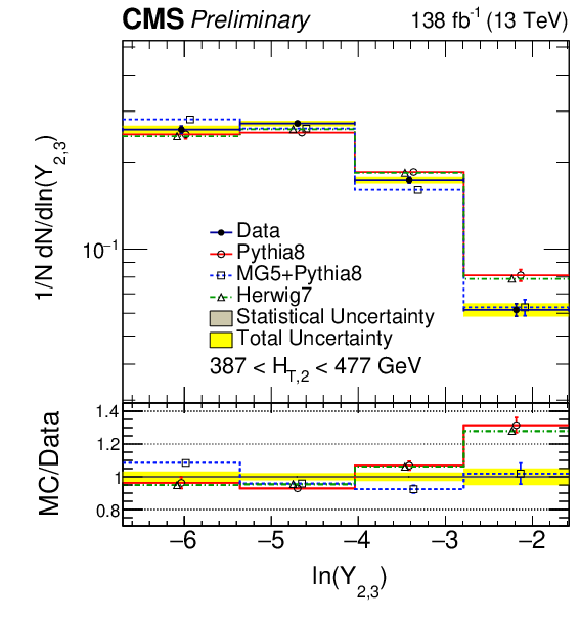
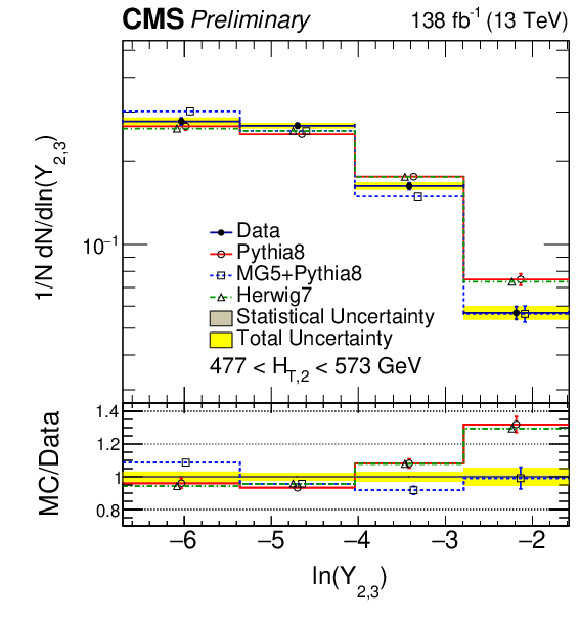
Figure 4:
Normalized, unfolded distributions of the third jet resolution parameter ($ \mathrm Y_{\mathrm{23}} $) are compared with the predictions of PYTHIA8 (CP5 tune)(red, solid), HERWIG 7 (CH3 tune)(green, dash-dot) and MG5+PYTHIA8 (blue, dot) for different $ {H_{\mathrm{T,2}}} $ ranges. For each plot the inner grey band and the yellow band represent the statistical and total uncertainties and the lower panel shows the ratio of simulation with respect to data. The error bars corresponding to PYTHIA8 (in red) and MG5+PYTHIA8 (in blue) represent their respective variations of the renormalization and factorization scales. |
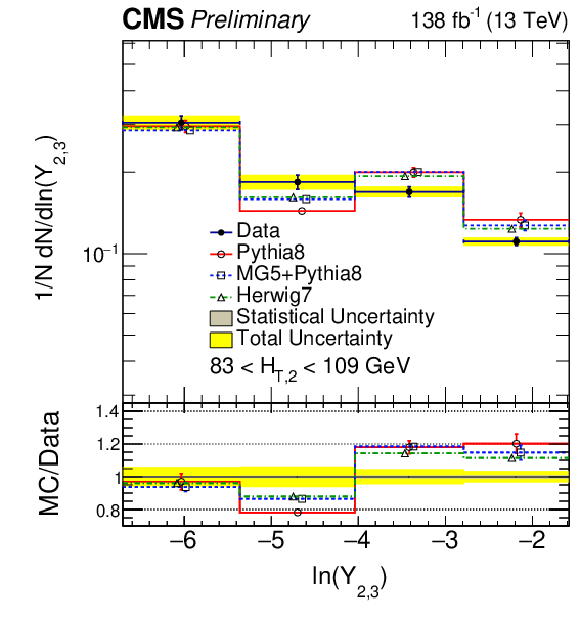
png pdf |
Figure 4-a:
Normalized, unfolded distributions of the third jet resolution parameter ($ \mathrm Y_{\mathrm{23}} $) are compared with the predictions of PYTHIA8 (CP5 tune)(red, solid), HERWIG 7 (CH3 tune)(green, dash-dot) and MG5+PYTHIA8 (blue, dot) for different $ {H_{\mathrm{T,2}}} $ ranges. For each plot the inner grey band and the yellow band represent the statistical and total uncertainties and the lower panel shows the ratio of simulation with respect to data. The error bars corresponding to PYTHIA8 (in red) and MG5+PYTHIA8 (in blue) represent their respective variations of the renormalization and factorization scales. |
png pdf |
Figure 4-b:
Normalized, unfolded distributions of the third jet resolution parameter ($ \mathrm Y_{\mathrm{23}} $) are compared with the predictions of PYTHIA8 (CP5 tune)(red, solid), HERWIG 7 (CH3 tune)(green, dash-dot) and MG5+PYTHIA8 (blue, dot) for different $ {H_{\mathrm{T,2}}} $ ranges. For each plot the inner grey band and the yellow band represent the statistical and total uncertainties and the lower panel shows the ratio of simulation with respect to data. The error bars corresponding to PYTHIA8 (in red) and MG5+PYTHIA8 (in blue) represent their respective variations of the renormalization and factorization scales. |
png pdf |
Figure 4-c:
Normalized, unfolded distributions of the third jet resolution parameter ($ \mathrm Y_{\mathrm{23}} $) are compared with the predictions of PYTHIA8 (CP5 tune)(red, solid), HERWIG 7 (CH3 tune)(green, dash-dot) and MG5+PYTHIA8 (blue, dot) for different $ {H_{\mathrm{T,2}}} $ ranges. For each plot the inner grey band and the yellow band represent the statistical and total uncertainties and the lower panel shows the ratio of simulation with respect to data. The error bars corresponding to PYTHIA8 (in red) and MG5+PYTHIA8 (in blue) represent their respective variations of the renormalization and factorization scales. |
png pdf |
Figure 4-d:
Normalized, unfolded distributions of the third jet resolution parameter ($ \mathrm Y_{\mathrm{23}} $) are compared with the predictions of PYTHIA8 (CP5 tune)(red, solid), HERWIG 7 (CH3 tune)(green, dash-dot) and MG5+PYTHIA8 (blue, dot) for different $ {H_{\mathrm{T,2}}} $ ranges. For each plot the inner grey band and the yellow band represent the statistical and total uncertainties and the lower panel shows the ratio of simulation with respect to data. The error bars corresponding to PYTHIA8 (in red) and MG5+PYTHIA8 (in blue) represent their respective variations of the renormalization and factorization scales. |
png pdf |
Figure 4-e:
Normalized, unfolded distributions of the third jet resolution parameter ($ \mathrm Y_{\mathrm{23}} $) are compared with the predictions of PYTHIA8 (CP5 tune)(red, solid), HERWIG 7 (CH3 tune)(green, dash-dot) and MG5+PYTHIA8 (blue, dot) for different $ {H_{\mathrm{T,2}}} $ ranges. For each plot the inner grey band and the yellow band represent the statistical and total uncertainties and the lower panel shows the ratio of simulation with respect to data. The error bars corresponding to PYTHIA8 (in red) and MG5+PYTHIA8 (in blue) represent their respective variations of the renormalization and factorization scales. |
png pdf |
Figure 4-f:
Normalized, unfolded distributions of the third jet resolution parameter ($ \mathrm Y_{\mathrm{23}} $) are compared with the predictions of PYTHIA8 (CP5 tune)(red, solid), HERWIG 7 (CH3 tune)(green, dash-dot) and MG5+PYTHIA8 (blue, dot) for different $ {H_{\mathrm{T,2}}} $ ranges. For each plot the inner grey band and the yellow band represent the statistical and total uncertainties and the lower panel shows the ratio of simulation with respect to data. The error bars corresponding to PYTHIA8 (in red) and MG5+PYTHIA8 (in blue) represent their respective variations of the renormalization and factorization scales. |
png pdf |
Figure 4-g:
Normalized, unfolded distributions of the third jet resolution parameter ($ \mathrm Y_{\mathrm{23}} $) are compared with the predictions of PYTHIA8 (CP5 tune)(red, solid), HERWIG 7 (CH3 tune)(green, dash-dot) and MG5+PYTHIA8 (blue, dot) for different $ {H_{\mathrm{T,2}}} $ ranges. For each plot the inner grey band and the yellow band represent the statistical and total uncertainties and the lower panel shows the ratio of simulation with respect to data. The error bars corresponding to PYTHIA8 (in red) and MG5+PYTHIA8 (in blue) represent their respective variations of the renormalization and factorization scales. |

png pdf |
Figure 4-h:
Normalized, unfolded distributions of the third jet resolution parameter ($ \mathrm Y_{\mathrm{23}} $) are compared with the predictions of PYTHIA8 (CP5 tune)(red, solid), HERWIG 7 (CH3 tune)(green, dash-dot) and MG5+PYTHIA8 (blue, dot) for different $ {H_{\mathrm{T,2}}} $ ranges. For each plot the inner grey band and the yellow band represent the statistical and total uncertainties and the lower panel shows the ratio of simulation with respect to data. The error bars corresponding to PYTHIA8 (in red) and MG5+PYTHIA8 (in blue) represent their respective variations of the renormalization and factorization scales. |
png pdf |
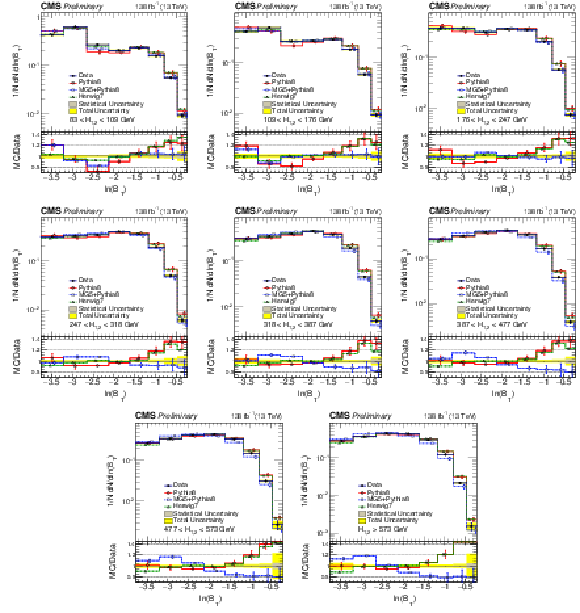
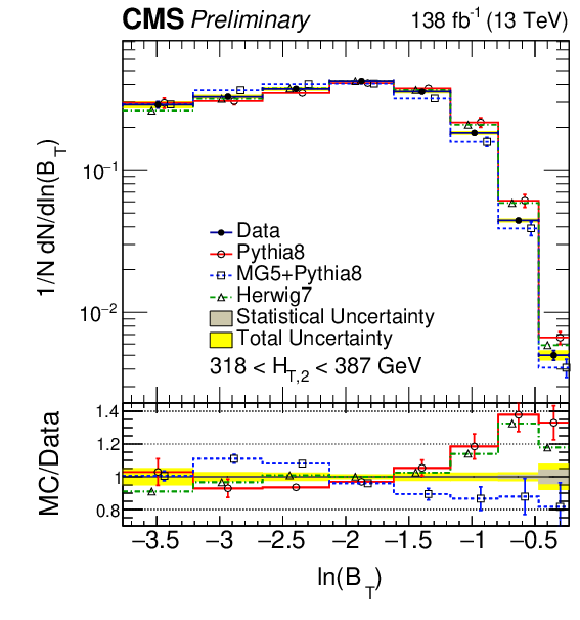
Figure 5:
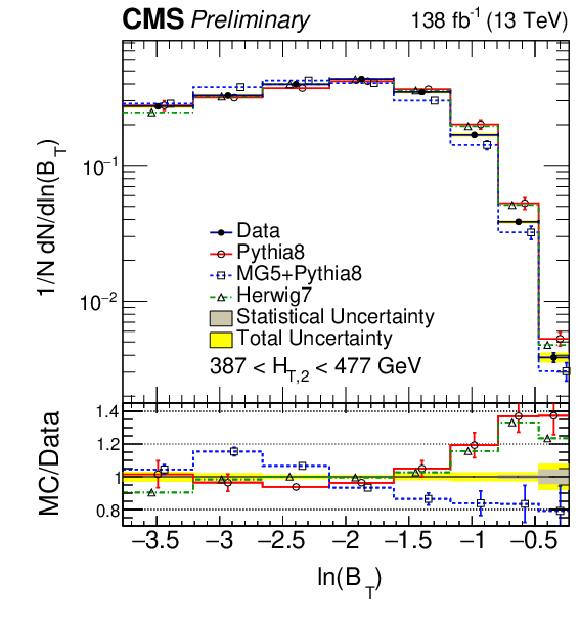
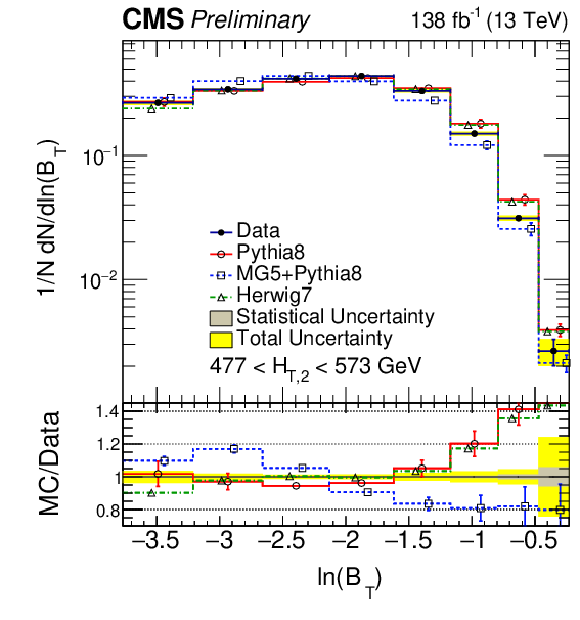
Normalized, unfolded distributions of total jet broadening ($ \mathrm B_{\mathrm{T}} $) are compared with the predictions of PYTHIA8 (CP5 tune)(red, solid), HERWIG 7 (CH3 tune)(green, dash-dot) and MG5+PYTHIA8 (blue, dot) for different $ {H_{\mathrm{T,2}}} $ ranges. For each plot the inner grey band and the yellow band represent the statistical and total uncertainties and the lower panel shows the ratio of simulation with respect to data. The error bars corresponding to PYTHIA8 (in red) and MG5+PYTHIA8 (in blue) represent their respective variations of the renormalization and factorization scales. |

png pdf |
Figure 5-a:
Normalized, unfolded distributions of total jet broadening ($ \mathrm B_{\mathrm{T}} $) are compared with the predictions of PYTHIA8 (CP5 tune)(red, solid), HERWIG 7 (CH3 tune)(green, dash-dot) and MG5+PYTHIA8 (blue, dot) for different $ {H_{\mathrm{T,2}}} $ ranges. For each plot the inner grey band and the yellow band represent the statistical and total uncertainties and the lower panel shows the ratio of simulation with respect to data. The error bars corresponding to PYTHIA8 (in red) and MG5+PYTHIA8 (in blue) represent their respective variations of the renormalization and factorization scales. |

png pdf |
Figure 5-b:
Normalized, unfolded distributions of total jet broadening ($ \mathrm B_{\mathrm{T}} $) are compared with the predictions of PYTHIA8 (CP5 tune)(red, solid), HERWIG 7 (CH3 tune)(green, dash-dot) and MG5+PYTHIA8 (blue, dot) for different $ {H_{\mathrm{T,2}}} $ ranges. For each plot the inner grey band and the yellow band represent the statistical and total uncertainties and the lower panel shows the ratio of simulation with respect to data. The error bars corresponding to PYTHIA8 (in red) and MG5+PYTHIA8 (in blue) represent their respective variations of the renormalization and factorization scales. |

png pdf |
Figure 5-c:
Normalized, unfolded distributions of total jet broadening ($ \mathrm B_{\mathrm{T}} $) are compared with the predictions of PYTHIA8 (CP5 tune)(red, solid), HERWIG 7 (CH3 tune)(green, dash-dot) and MG5+PYTHIA8 (blue, dot) for different $ {H_{\mathrm{T,2}}} $ ranges. For each plot the inner grey band and the yellow band represent the statistical and total uncertainties and the lower panel shows the ratio of simulation with respect to data. The error bars corresponding to PYTHIA8 (in red) and MG5+PYTHIA8 (in blue) represent their respective variations of the renormalization and factorization scales. |

png pdf |
Figure 5-d:
Normalized, unfolded distributions of total jet broadening ($ \mathrm B_{\mathrm{T}} $) are compared with the predictions of PYTHIA8 (CP5 tune)(red, solid), HERWIG 7 (CH3 tune)(green, dash-dot) and MG5+PYTHIA8 (blue, dot) for different $ {H_{\mathrm{T,2}}} $ ranges. For each plot the inner grey band and the yellow band represent the statistical and total uncertainties and the lower panel shows the ratio of simulation with respect to data. The error bars corresponding to PYTHIA8 (in red) and MG5+PYTHIA8 (in blue) represent their respective variations of the renormalization and factorization scales. |
png pdf |
Figure 5-e:
Normalized, unfolded distributions of total jet broadening ($ \mathrm B_{\mathrm{T}} $) are compared with the predictions of PYTHIA8 (CP5 tune)(red, solid), HERWIG 7 (CH3 tune)(green, dash-dot) and MG5+PYTHIA8 (blue, dot) for different $ {H_{\mathrm{T,2}}} $ ranges. For each plot the inner grey band and the yellow band represent the statistical and total uncertainties and the lower panel shows the ratio of simulation with respect to data. The error bars corresponding to PYTHIA8 (in red) and MG5+PYTHIA8 (in blue) represent their respective variations of the renormalization and factorization scales. |
png pdf |
Figure 5-f:
Normalized, unfolded distributions of total jet broadening ($ \mathrm B_{\mathrm{T}} $) are compared with the predictions of PYTHIA8 (CP5 tune)(red, solid), HERWIG 7 (CH3 tune)(green, dash-dot) and MG5+PYTHIA8 (blue, dot) for different $ {H_{\mathrm{T,2}}} $ ranges. For each plot the inner grey band and the yellow band represent the statistical and total uncertainties and the lower panel shows the ratio of simulation with respect to data. The error bars corresponding to PYTHIA8 (in red) and MG5+PYTHIA8 (in blue) represent their respective variations of the renormalization and factorization scales. |
png pdf |
Figure 5-g:
Normalized, unfolded distributions of total jet broadening ($ \mathrm B_{\mathrm{T}} $) are compared with the predictions of PYTHIA8 (CP5 tune)(red, solid), HERWIG 7 (CH3 tune)(green, dash-dot) and MG5+PYTHIA8 (blue, dot) for different $ {H_{\mathrm{T,2}}} $ ranges. For each plot the inner grey band and the yellow band represent the statistical and total uncertainties and the lower panel shows the ratio of simulation with respect to data. The error bars corresponding to PYTHIA8 (in red) and MG5+PYTHIA8 (in blue) represent their respective variations of the renormalization and factorization scales. |

png pdf |
Figure 5-h:
Normalized, unfolded distributions of total jet broadening ($ \mathrm B_{\mathrm{T}} $) are compared with the predictions of PYTHIA8 (CP5 tune)(red, solid), HERWIG 7 (CH3 tune)(green, dash-dot) and MG5+PYTHIA8 (blue, dot) for different $ {H_{\mathrm{T,2}}} $ ranges. For each plot the inner grey band and the yellow band represent the statistical and total uncertainties and the lower panel shows the ratio of simulation with respect to data. The error bars corresponding to PYTHIA8 (in red) and MG5+PYTHIA8 (in blue) represent their respective variations of the renormalization and factorization scales. |
png pdf |
Figure 6:
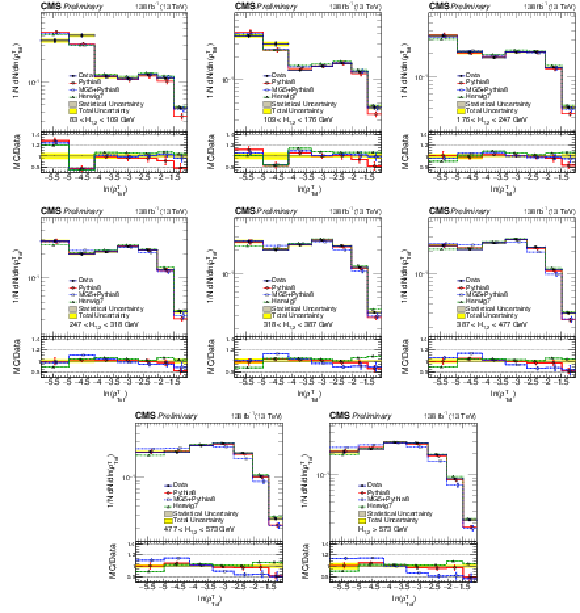
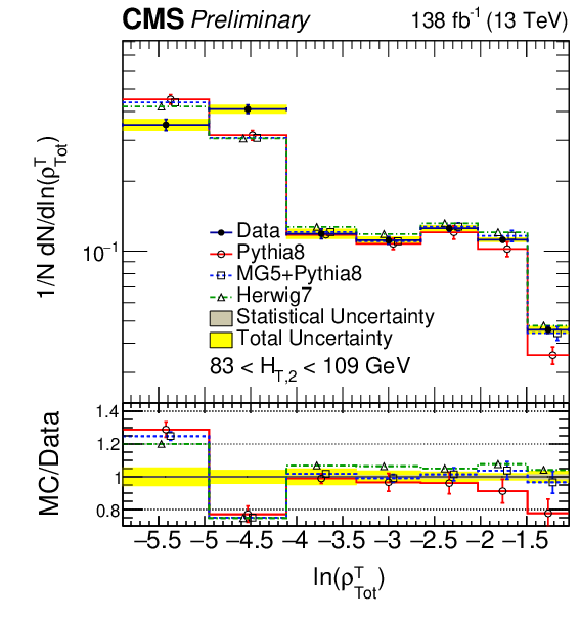
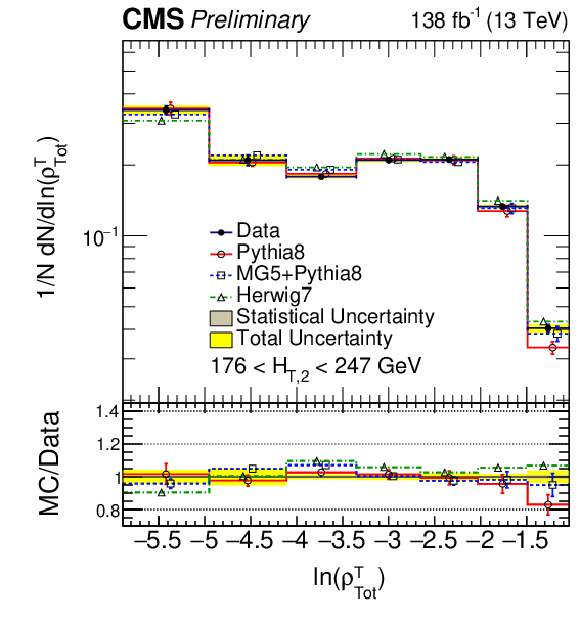
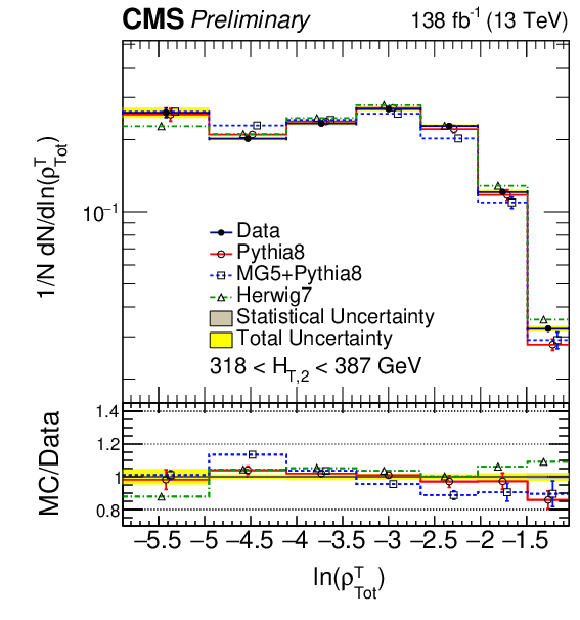
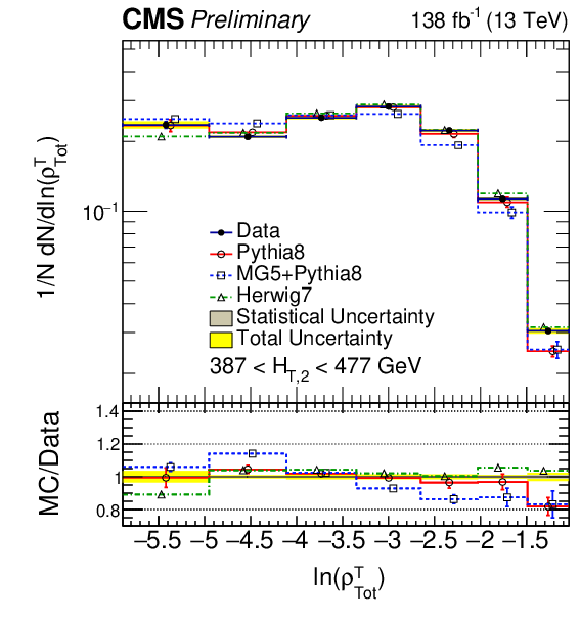
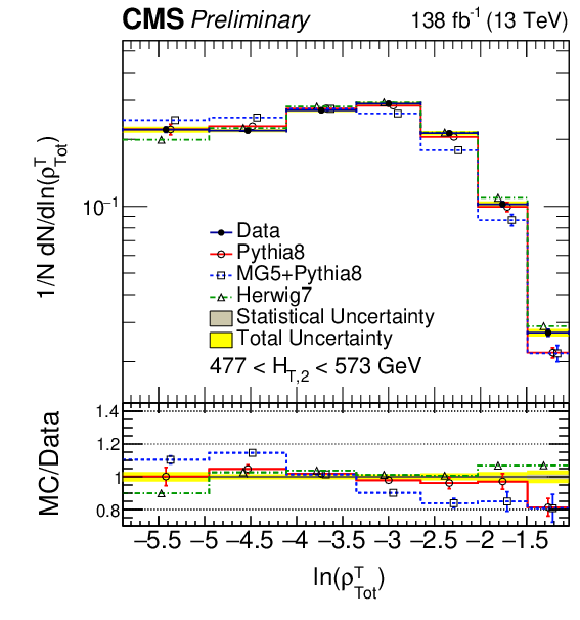
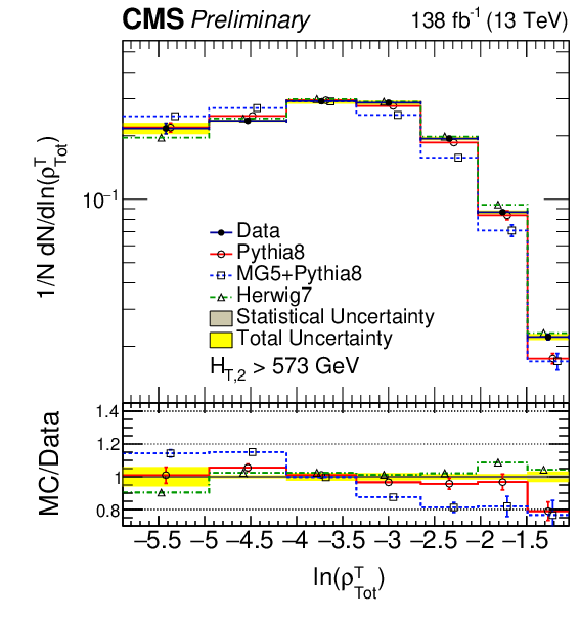
Normalized, unfolded distributions of total transverse jet mass ($ \rho^{{\mathrm T}}_{\mathrm{Tot}} $) are compared with the predictions of PYTHIA8 (CP5 tune)(red, solid), HERWIG 7 (CH3 tune)(green, dash-dot) and MG5+PYTHIA8 (blue, dot) for different $ {H_{\mathrm{T,2}}} $ ranges. For each plot the inner grey band and the yellow band represent the statistical and total uncertainties and the lower panel shows the ratio of simulation with respect to data. The error bars corresponding to PYTHIA8 (in red) and MG5+PYTHIA8 (in blue) represent their respective variations of the renormalization and factorization scales. |
png pdf |
Figure 6-a:
Normalized, unfolded distributions of total transverse jet mass ($ \rho^{{\mathrm T}}_{\mathrm{Tot}} $) are compared with the predictions of PYTHIA8 (CP5 tune)(red, solid), HERWIG 7 (CH3 tune)(green, dash-dot) and MG5+PYTHIA8 (blue, dot) for different $ {H_{\mathrm{T,2}}} $ ranges. For each plot the inner grey band and the yellow band represent the statistical and total uncertainties and the lower panel shows the ratio of simulation with respect to data. The error bars corresponding to PYTHIA8 (in red) and MG5+PYTHIA8 (in blue) represent their respective variations of the renormalization and factorization scales. |

png pdf |
Figure 6-b:
Normalized, unfolded distributions of total transverse jet mass ($ \rho^{{\mathrm T}}_{\mathrm{Tot}} $) are compared with the predictions of PYTHIA8 (CP5 tune)(red, solid), HERWIG 7 (CH3 tune)(green, dash-dot) and MG5+PYTHIA8 (blue, dot) for different $ {H_{\mathrm{T,2}}} $ ranges. For each plot the inner grey band and the yellow band represent the statistical and total uncertainties and the lower panel shows the ratio of simulation with respect to data. The error bars corresponding to PYTHIA8 (in red) and MG5+PYTHIA8 (in blue) represent their respective variations of the renormalization and factorization scales. |
png pdf |
Figure 6-c:
Normalized, unfolded distributions of total transverse jet mass ($ \rho^{{\mathrm T}}_{\mathrm{Tot}} $) are compared with the predictions of PYTHIA8 (CP5 tune)(red, solid), HERWIG 7 (CH3 tune)(green, dash-dot) and MG5+PYTHIA8 (blue, dot) for different $ {H_{\mathrm{T,2}}} $ ranges. For each plot the inner grey band and the yellow band represent the statistical and total uncertainties and the lower panel shows the ratio of simulation with respect to data. The error bars corresponding to PYTHIA8 (in red) and MG5+PYTHIA8 (in blue) represent their respective variations of the renormalization and factorization scales. |

png pdf |
Figure 6-d:
Normalized, unfolded distributions of total transverse jet mass ($ \rho^{{\mathrm T}}_{\mathrm{Tot}} $) are compared with the predictions of PYTHIA8 (CP5 tune)(red, solid), HERWIG 7 (CH3 tune)(green, dash-dot) and MG5+PYTHIA8 (blue, dot) for different $ {H_{\mathrm{T,2}}} $ ranges. For each plot the inner grey band and the yellow band represent the statistical and total uncertainties and the lower panel shows the ratio of simulation with respect to data. The error bars corresponding to PYTHIA8 (in red) and MG5+PYTHIA8 (in blue) represent their respective variations of the renormalization and factorization scales. |
png pdf |
Figure 6-e:
Normalized, unfolded distributions of total transverse jet mass ($ \rho^{{\mathrm T}}_{\mathrm{Tot}} $) are compared with the predictions of PYTHIA8 (CP5 tune)(red, solid), HERWIG 7 (CH3 tune)(green, dash-dot) and MG5+PYTHIA8 (blue, dot) for different $ {H_{\mathrm{T,2}}} $ ranges. For each plot the inner grey band and the yellow band represent the statistical and total uncertainties and the lower panel shows the ratio of simulation with respect to data. The error bars corresponding to PYTHIA8 (in red) and MG5+PYTHIA8 (in blue) represent their respective variations of the renormalization and factorization scales. |
png pdf |
Figure 6-f:
Normalized, unfolded distributions of total transverse jet mass ($ \rho^{{\mathrm T}}_{\mathrm{Tot}} $) are compared with the predictions of PYTHIA8 (CP5 tune)(red, solid), HERWIG 7 (CH3 tune)(green, dash-dot) and MG5+PYTHIA8 (blue, dot) for different $ {H_{\mathrm{T,2}}} $ ranges. For each plot the inner grey band and the yellow band represent the statistical and total uncertainties and the lower panel shows the ratio of simulation with respect to data. The error bars corresponding to PYTHIA8 (in red) and MG5+PYTHIA8 (in blue) represent their respective variations of the renormalization and factorization scales. |
png pdf |
Figure 6-g:
Normalized, unfolded distributions of total transverse jet mass ($ \rho^{{\mathrm T}}_{\mathrm{Tot}} $) are compared with the predictions of PYTHIA8 (CP5 tune)(red, solid), HERWIG 7 (CH3 tune)(green, dash-dot) and MG5+PYTHIA8 (blue, dot) for different $ {H_{\mathrm{T,2}}} $ ranges. For each plot the inner grey band and the yellow band represent the statistical and total uncertainties and the lower panel shows the ratio of simulation with respect to data. The error bars corresponding to PYTHIA8 (in red) and MG5+PYTHIA8 (in blue) represent their respective variations of the renormalization and factorization scales. |
png pdf |
Figure 6-h:
Normalized, unfolded distributions of total transverse jet mass ($ \rho^{{\mathrm T}}_{\mathrm{Tot}} $) are compared with the predictions of PYTHIA8 (CP5 tune)(red, solid), HERWIG 7 (CH3 tune)(green, dash-dot) and MG5+PYTHIA8 (blue, dot) for different $ {H_{\mathrm{T,2}}} $ ranges. For each plot the inner grey band and the yellow band represent the statistical and total uncertainties and the lower panel shows the ratio of simulation with respect to data. The error bars corresponding to PYTHIA8 (in red) and MG5+PYTHIA8 (in blue) represent their respective variations of the renormalization and factorization scales. |
| Tables | |
png pdf |
Table 1:
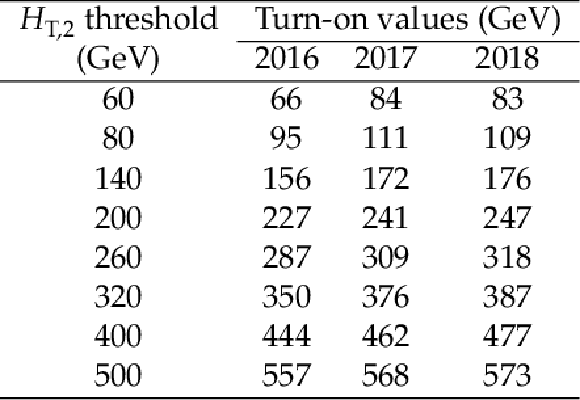
The $ {H_{\mathrm{T,2}}} $ threshold values, and trigger turn on points, for the 2016, 2017, and 2018 data sets. |
png pdf |
Table 2:
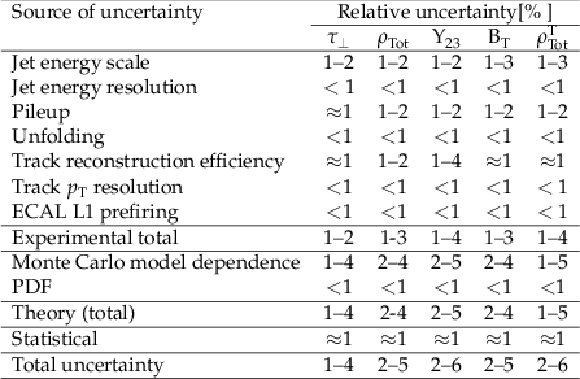
Summary of the relative uncertainties in the normalized unfolded distributions of the five ESVs. |
| Summary |
| This is the first CMS study that uses charged particles inside jets to evaluate event shape variables. The complement of transverse thrust ($ \tau_{\mathrm{\perp}} $), total jet mass ($ \rho_{\mathrm{Tot}} $), third jet resolution parameter ($ \mathrm Y_{\mathrm{23}} $), total jet broadening ($ \mathrm B_{\mathrm{T}} $), and total transverse jet mass ($ \rho^{{\mathrm T}}_{\mathrm{Tot}} $) are studied with data of pp collisions at $ \sqrt{s} = $ 13 TeV collected during 2016-2018. For each variable, detector effects are corrected using a two-dimensional unfolding in which the average $ p_{\mathrm{T}} $ of the leading and the second leading jets in events($ {H_{\mathrm{T,2}}} $) and variables are unfolded simultaneously. Detailed comparisons of the predictions of PYTHIA8 (CP5 tune), MG5+PYTHIA8 (CP5 tune), and HERWIG 7 (CH3 tune) with data have been made, covering a wide phase space, and the MC event generators show broad agreement with data for the event shape variables. With the increase in the energy involved in the event, the agreement improves for PYTHIA8, remains unchanged for HERWIG 7, but worsens for MG5+PYTHIA8. Overall, the results indicate that our understanding of the energy flow of an event at different energy scales needs improvement. |
| References | ||||
| 1 | A. Banfi, G. P. Salam, and G. Zanderighi | Phenomenology of event shapes at hadron colliders | JHEP 06 (2010) 038 | 1001.4082 |
| 2 | A. Banfi, G. P. Salam, and G. Zanderighi | Resummed event shapes at hadron-hadron colliders | JHEP 08 (2004) 062 | hep-ph/0407287 |
| 3 | M. Dasgupta and G. P. Salam | Event shapes in $ \mathrm{e^{+}e^{-}} $ annihilation and deep inelastic scattering | JPG 30 (2004) R143 | hep-ph/0312283 |
| 4 | R. M. Chatterjee, M. Guchait, and D. Sengupta | Probing supersymmetry using event shape variables at 8 TeV LHC | PRD 86 (2012) 075014 | 1206.5770 |
| 5 | A. Datta, A. Datta, and S. Poddar | Enriching the exploration of the mUED model with event shape variables at the CERN LHC | PLB 712 (2012) 219 | 1111.2912 |
| 6 | P. Konar and P. Roy | Event shape discrimination of supersymmetry from large extra dimensions at a linear collider | PLB 634 (2006) 295 | hep-ph/0509161 |
| 7 | PLUTO Collaboration | Energy Dependence of Jet Measures in $ e^+ e^- $ Annihilation | Z. Phys. C 12 (1982) 297 | |
| 8 | TASSO Collaboration | Global jet properties at 14--44 GeV center-of-mass energy in $ e^+ e^- $ annihilation | Z. Phys. C 47 (1990) 187 | |
| 9 | JADE Collaboration | Determination of the strong coupling $ \alpha_\mathrm{S} $ from hadronic event shapes with $ \mathcal{O}(\alpha_\mathrm{S}^{3}) $ and resummed QCD predictions using JADE data | EPJC 64 (2009) 351 | 0810.1389 |
| 10 | DELPHI Collaboration | A Study of the energy evolution of event shape distributions and their means with the DELPHI detector at LEP | EPJC 29 (2003) 285 | hep-ex/0307048 |
| 11 | L3 Collaboration | Study of hadronic events and measurements of $ \alpha_{s} $ between 30 GeV and 91 GeV | PLB 411 (1997) 339 | |
| 12 | L3 Collaboration | Determination of $ \alpha_\mathrm{S} $ from hadronic event shapes in $ e^{+} e^{-} $ annihilation at 192 $ \leq\sqrt{s}\leq $ 208 GeV | PLB 536 (2002) 217 | hep-ex/0206052 |
| 13 | L3 Collaboration | Studies of hadronic event structure in $ \mathrm{e^{+}e^{-}} $ annihilation from 30 GeV to 209 GeV with the L3 detector | Phys. Rept. 399 (2004) 71 | hep-ex/0406049 |
| 14 | OPAL Collaboration | Determination of $ \alpha_\mathrm{S} $ using OPAL hadronic event shapes at $ \sqrt{s}= $ 91-209 GeV and resummed NNLO calculations | EPJC 71 (2011) 1733 | 1101.1470 |
| 15 | H1 Collaboration | Measurement of event shape variables in deep inelastic $ \mathrm{e}\mathrm{p} $ scattering | PLB 406 (1997) 256 | hep-ex/9706002 |
| 16 | H1 Collaboration | Investigation of power corrections to event shape variables measured in deep inelastic scattering | EPJC 14 (2000) 255 | hep-ex/9912052 |
| 17 | H1 Collaboration | Measurement of event shape variables in deep-inelastic scattering at HERA | EPJC 46 (2006) 343 | hep-ex/0512014 |
| 18 | ZEUS Collaboration | Measurement of event shapes in deep inelastic scattering at HERA | EPJC 27 (2003) 531 | hep-ex/0211040 |
| 19 | ZEUS Collaboration | Event shapes in deep inelastic scattering at HERA | NPB 767 (2007) 1 | hep-ex/0604032 |
| 20 | CDF Collaboration | Measurement of event shapes in proton-antiproton collisions at $ \sqrt{s} = $ 1.96 TeV | PRD 83 (2011) 112007 | 1103.5143 |
| 21 | P. Skands, S. Carrazza, and J. Rojo | Tuning PYTHIA 8.1: the Monash 2013 tune | EPJC 74 (2014) 3024 | 1404.5630 |
| 22 | DELPHI Collaboration | Tuning and test of fragmentation models based on identified particles and precision event shape data | Z. Phys. C 73 (1996) 11 | |
| 23 | G. Dissertori et al. | First determination of the strong coupling constant using NNLO predictions for hadronic event shapes in $ \mathrm{e^{+} e^{-}} $ annihilations | JHEP 02 (2008) 040 | 0712.0327 |
| 24 | G. Dissertori et al. | Determination of the strong coupling constant using matched NNLO+NLLA predictions for hadronic event shapes in $ \mathrm{e^{+}e^{-}} $ annihilations | JHEP 08 (2009) 036 | 0906.3436 |
| 25 | R. W. L. Jones et al. | Theoretical uncertainties on $ \alpha{_s} $ from event shape variables in $ \mathrm{e^{+}e^{-}} $ annihilations | JHEP 12 (2003) 007 | hep-ph/0312016 |
| 26 | ATLAS Collaboration | Measurement of event shapes at large momentum transfer with the ATLAS detector in $ pp $ collisions at $ \sqrt{s} = $ 7 TeV | EPJC 72 (2012) 2211 | 1206.2135 |
| 27 | ATLAS Collaboration | Determination of the strong coupling constant $ \alpha _\mathrm {s} $ from transverse energy-energy correlations in multijet events at $ \sqrt{s} = $ 8 TeV using the ATLAS detector | EPJC 77 (2017) 872 | 1707.02562 |
| 28 | ATLAS Collaboration | Measurement of event-shape observables in $ Z \rightarrow \ell ^{+} \ell ^{-} $ events in $ pp $ collisions at $ \sqrt{s}= $ 7 TeV with the ATLAS detector at the LHC | EPJC 76 (2016) 375 | 1602.08980 |
| 29 | ATLAS Collaboration | Measurement of hadronic event shapes in high-p$ _{T} $ multijet final states at $ \sqrt{s} $ = 13 TeV with the ATLAS detector | JHEP 01 (2021) 188 | 2007.12600 |
| 30 | CMS Collaboration | First measurement of hadronic event shapes in pp collisions at $ \sqrt{s} = $ 7 TeV | PLB 699 (2011) 48 | CMS-QCD-10-013 1102.0068 |
| 31 | CMS Collaboration | Event shapes and azimuthal correlations in Z+jets events in pp collisions at $ \sqrt{s} = $ 7 TeV | PLB 722 (2013) 238 | CMS-EWK-11-021 1301.1646 |
| 32 | CMS Collaboration | Study of hadronic event-shape variables in multijet final states in pp collisions at $ \sqrt{s} = $ 7 TeV | JHEP 10 (2014) 087 | CMS-SMP-12-022 1407.2856 |
| 33 | CMS Collaboration | Event shape variables measured using multijet final states in proton-proton collisions at $ \sqrt{s} = $ 13 TeV | JHEP 12 (2018) 117 | CMS-SMP-17-003 1811.00588 |
| 34 | ALICE Collaboration | Transverse sphericity of primary charged particles in minimum bias proton-proton collisions at $ \sqrt{s}= $ 0.9, 2.76 and 7 TeV | EPJC 72 (2012) 2124 | 1205.3963 |
| 35 | ALICE Collaboration | Charged-particle production as a function of multiplicity and transverse spherocity in pp collisions at $ \sqrt{s} = $ 5.02 and 13 TeV | no.~10, 857, 2019 EPJC 79 (2019) |
1905.07208 |
| 36 | ATLAS Collaboration | Measurement of charged-particle event shape variables in $ \sqrt{s} = $ 7 TeV proton-proton interactions with the ATLAS detector | PRD 88 (2013) 032004 | 1207.6915 |
| 37 | T. Sjöstrand et al. | An Introduction to PYTHIA 8.2 | Comput. Phys. Commun. 191 (2015) 159 | 1410.3012 |
| 38 | J. Alwall et al. | The automated computation of tree-level and next-to-leading order differential cross sections, and their matching to parton shower simulations | JHEP 07 (2014) 079 | 1405.0301 |
| 39 | M. Bahr et al. | Herwig++ physics and manual | EPJC 58 (2008) 639 | 0803.0883 |
| 40 | CMS Collaboration | The CMS experiment at the CERN LHC | JINST 3 (2008) S08004 | |
| 41 | CMS Tracker Group Collaboration | The CMS Phase-1 Pixel Detector Upgrade | JINST 16 (2021) P02027 | 2012.14304 |
| 42 | CMS Collaboration | Track impact parameter resolution for the full pseudo rapidity coverage in the 2017 dataset with the CMS phase-1 pixel detector | CMS Detector Performance Summary CMS-DP-2020-049, 2020 CDS |
|
| 43 | CMS Collaboration | Performance of photon reconstruction and identification with the CMS detector in proton-proton collisions at $ \sqrt{s} = $ 8 TeV | JINST 10 (2015) P08010 | CMS-EGM-14-001 1502.02702 |
| 44 | CMS Collaboration | Jet energy scale and resolution in the CMS experiment in pp collisions at 8 TeV | JINST 12 (2017) P02014 | CMS-JME-13-004 1607.03663 |
| 45 | CMS Collaboration | Performance of the CMS Level-1 trigger in proton-proton collisions at $ \sqrt{s} = $ 13 TeV | JINST 15 (2020) P10017 | CMS-TRG-17-001 2006.10165 |
| 46 | CMS Collaboration | The CMS trigger system | JINST 12 (2017) P01020 | CMS-TRG-12-001 1609.02366 |
| 47 | CMS Collaboration | Particle-flow reconstruction and global event description with the CMS detector | JINST 12 (2017) P10003 | CMS-PRF-14-001 1706.04965 |
| 48 | CMS Collaboration | Technical proposal for the phase-II upgrade of the Compact Muon Solenoid | CMS Technical proposal CERN-LHCC-2015-010, CMS-TDR-15-02, CERN, 2015 CDS |
|
| 49 | M. Cacciari, G. P. Salam, and G. Soyez | The anti-$ k_{\mathrm{T}} $ jet clustering algorithm | JHEP 04 (2008) 063 | 0802.1189 |
| 50 | M. Cacciari, G. P. Salam, and G. Soyez | FastJet User Manual | EPJC 72 (2012) 1896 | 1111.6097 |
| 51 | CMS Collaboration | Pileup mitigation at CMS in 13 TeV data | JINST 15 (2020) P09018 | CMS-JME-18-001 2003.00503 |
| 52 | GEANT4 Collaboration | GEANT4: A simulation toolkit | NIM A 506 (2003) 250 | |
| 53 | T. Sjostrand and P. Z. Skands | Transverse-momentum-ordered showers and interleaved multiple interactions | EPJC 39 (2005) 129 | hep-ph/0408302 |
| 54 | R. Corke and T. Sjostrand | Interleaved parton showers and tuning prospects | JHEP 03 (2011) 032 | 1011.1759 |
| 55 | B. Andersson, G. Gustafson, G. Ingelman, and T. Sjostrand | Parton fragmentation and string dynamics | Phys. Rept. 97 (1983) 31 | |
| 56 | CMS Collaboration | Extraction and validation of a new set of CMS PYTHIA8 tunes from underlying-event measurements | EPJC 80 (2020) 4 | CMS-GEN-17-001 1903.12179 |
| 57 | J. Bellm et al. | Herwig 7.0/Herwig++ 3.0 release note | EPJC 76 (2016) 196 | 1512.01178 |
| 58 | A. Banfi, G. Corcella, and M. Dasgupta | Angular ordering and parton showers for non-global QCD observables | JHEP 03 (2007) 050 | hep-ph/0612282 |
| 59 | S. Gieseke, C. Rohr, and A. Siodmok | Colour reconnections in Herwig++ | EPJC 72 (2012) 2225 | 1206.0041 |
| 60 | S. Gieseke, F. Loshaj, and P. Kirchgaeser | Soft and diffractive scattering with the cluster model in Herwig | EPJC 77 (2017) 156 | 1612.04701 |
| 61 | CMS Collaboration | Development and validation of HERWIG 7 tunes from CMS underlying-event measurements | EPJC 81 (2021) 312 | CMS-GEN-19-001 2011.03422 |
| 62 | S. Hoeche et al. | Matching parton showers and matrix elements | in HERA and the LHC: A Workshop on the Implications of HERA for LHC Physics: CERN, DESY, 2005 DESY Workshop 200 (2005) 288 |
hep-ph/0602031 |
| 63 | S. Schmitt | TUnfold: an algorithm for correcting migration effects in high energy physics | JINST 7 (2012) T10003 | 1205.6201 |
| 64 | CMS Collaboration | Jet energy scale and resolution performance with 13 TeV data collected by CMS in 2016--2018 | CMS Detector Performance Summary CMS-DP-2020-019, 2020 CDS |
|
| 65 | CMS Collaboration | Tracking performances for charged pions with Run 2 legacy data | CMS Detector Performance Summary CMS-DP-2022-012, 2022 CDS |
|
| 66 | CMS Collaboration | Description and performance of track and primary-vertex reconstruction with the CMS tracker | JINST 9 (2014) P10009 | CMS-TRK-11-001 1405.6569 |
| 67 | P. L. S. Connor and R. Žlebčík | STEP: A tool to perform tests of smoothness on differential distributions based on expansion of polynomials | SciPost Phys. Core 6 (2023) 040 | 2111.09968 |

|
Compact Muon Solenoid LHC, CERN |

|

|

|

|

|

|