

Compact Muon Solenoid
LHC, CERN
| CMS-PAS-HIG-17-007 | ||
| Search for the standard model Higgs boson in the dilepton plus photon channel in pp collisions at $\sqrt{s}= $ 13 TeV | ||
| CMS Collaboration | ||
| March 2018 | ||
| Abstract: A search for a Higgs boson decaying into a pair of electrons or muons plus a photon is described. This final state has contributions from Higgs decays to a $\mathrm{Z}$ boson and a photon ($\mathrm{H}\rightarrow \mathrm{Z}\gamma\rightarrow \ell\ell\gamma, \ell=\mathrm{e}$ or $\mu$), or to two photons, one of which has an internal conversion into a lepton pair ($\mathrm{H}\rightarrow \gamma^{*}\gamma\rightarrow\mu\mu\gamma$). The analysis is performed using a dataset recorded by the CMS experiment at the LHC from proton-proton collisions at a center-of-mass energy of 13 TeV, corresponding to an integrated luminosity of 35.9 fb$^{-1}$. No significant excess above the background prediction has been found in the 120-130 GeV mass range. Limits are set on the cross section for a standard model Higgs boson decaying to opposite-sign electron or muon pairs and a photon. The observed limits on cross section times the corresponding branching fractions fluctuate between 4 and 1.4 (11 and 6) times the standard model cross section for $\mathrm{H}\rightarrow \gamma^{*}\gamma\rightarrow\mu\mu\gamma$ ($\mathrm{H}\to\mathrm{Z}\gamma\to\ell\ell\gamma$). The $\mathrm{H}\to\gamma^*\gamma\to\mu\mu\gamma$ and $\mathrm{H}\to\mathrm{Z}\gamma\to\ell\ell\gamma$ analyses are combined for $m_\mathrm{H}= $ 125 GeV, obtaining an observed (expected) 95% upper limit of 3.9 (2.0) times the standard model cross section. | ||
|
Links:
CDS record (PDF) ;
inSPIRE record ;
CADI line (restricted) ;
These preliminary results are superseded in this paper, JHEP 11 (2018) 152. The superseded preliminary plots can be found here. |
||
| Figures & Tables | Summary | Additional Figures | References | CMS Publications |
|---|
| Figures | |
png pdf |
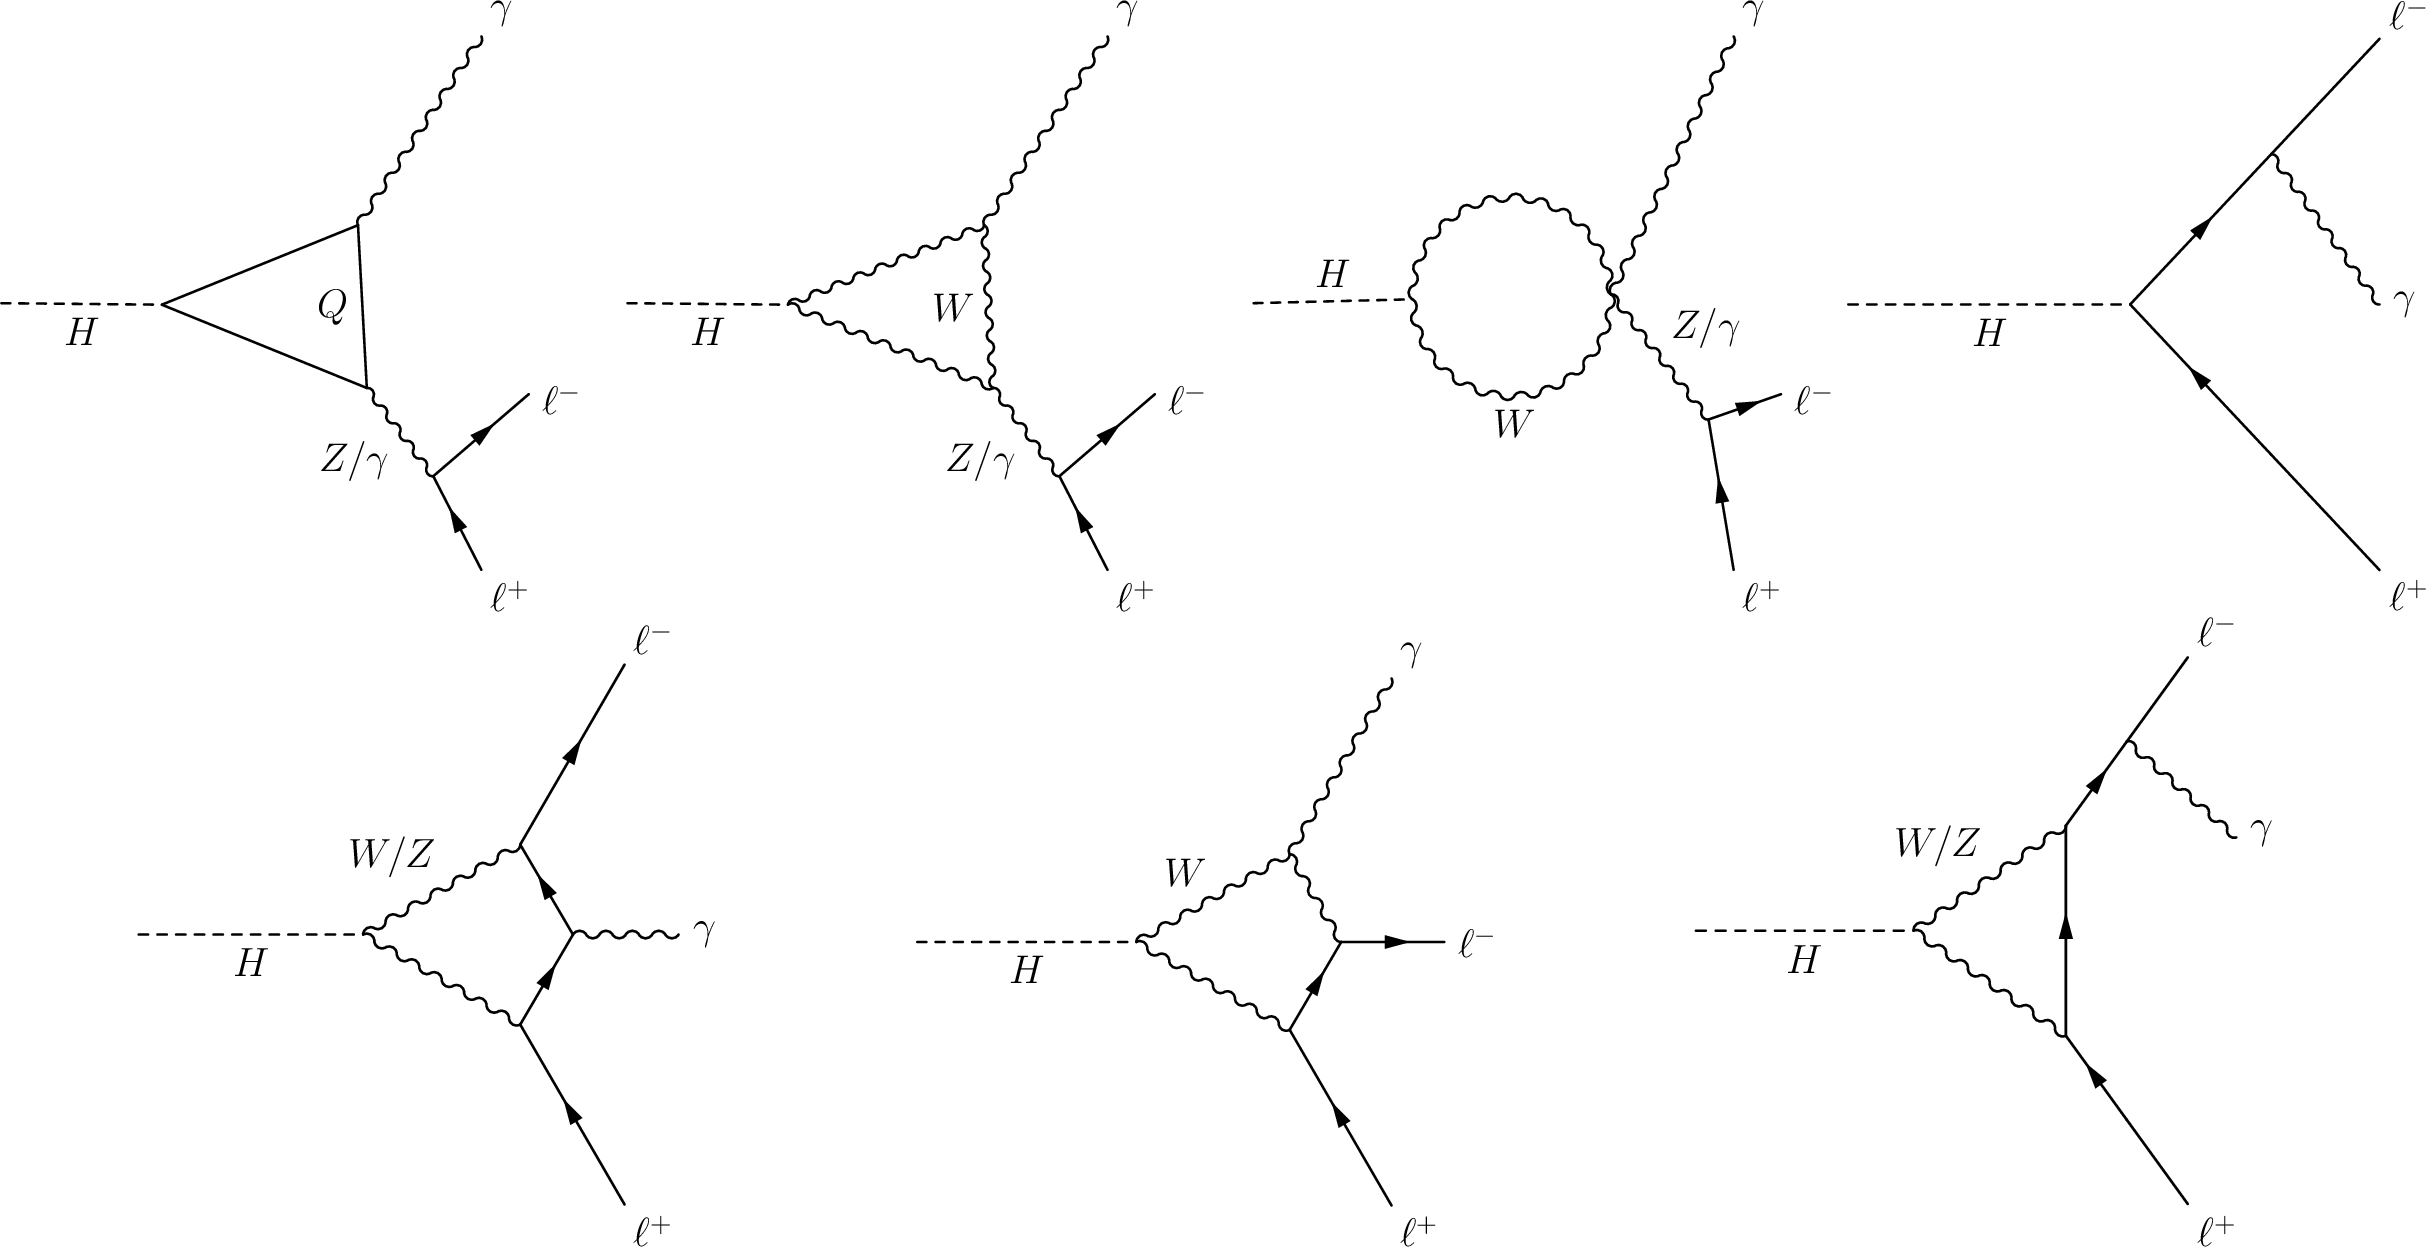
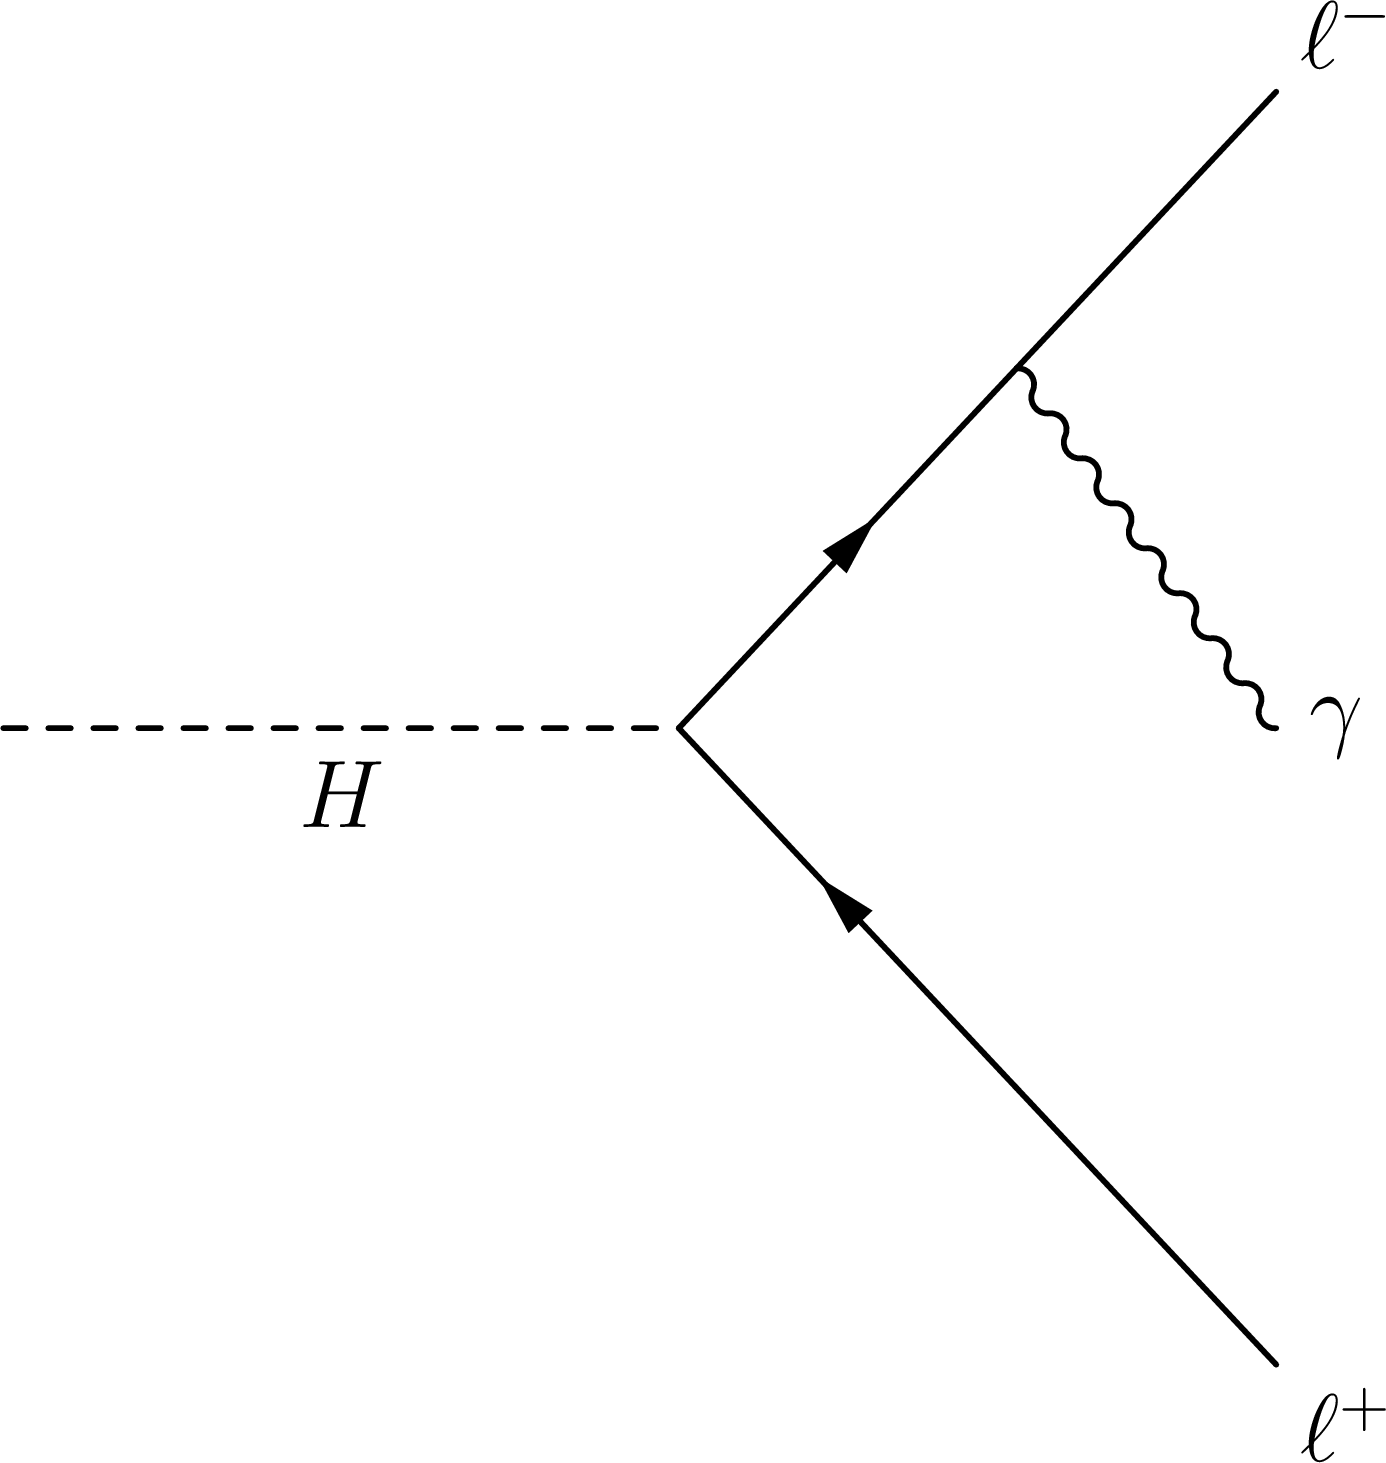
Figure 1:
Dominant diagrams contributing to $ {\mathrm {H}} \to \ell \ell \gamma $ process. |
png pdf |
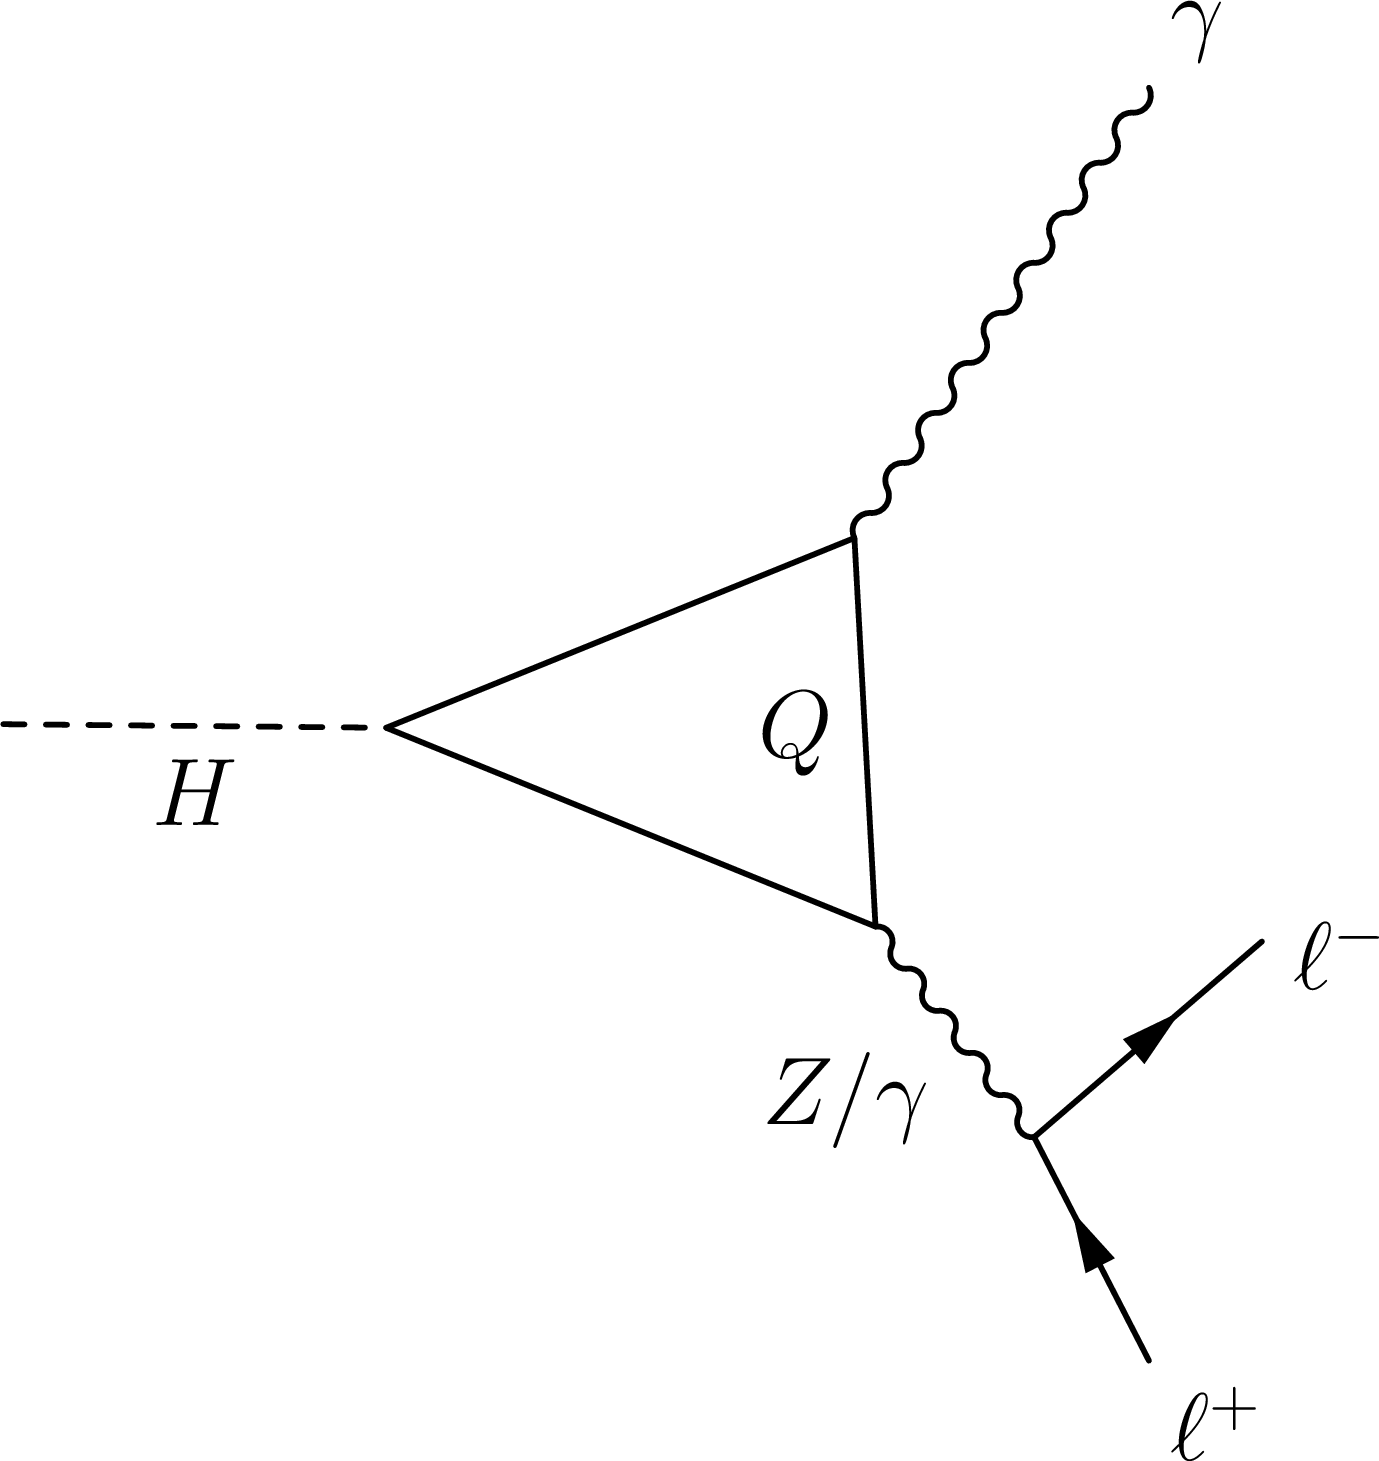
Figure 1-a:
A dominant diagram contributing to $ {\mathrm {H}} \to \ell \ell \gamma $ process. |
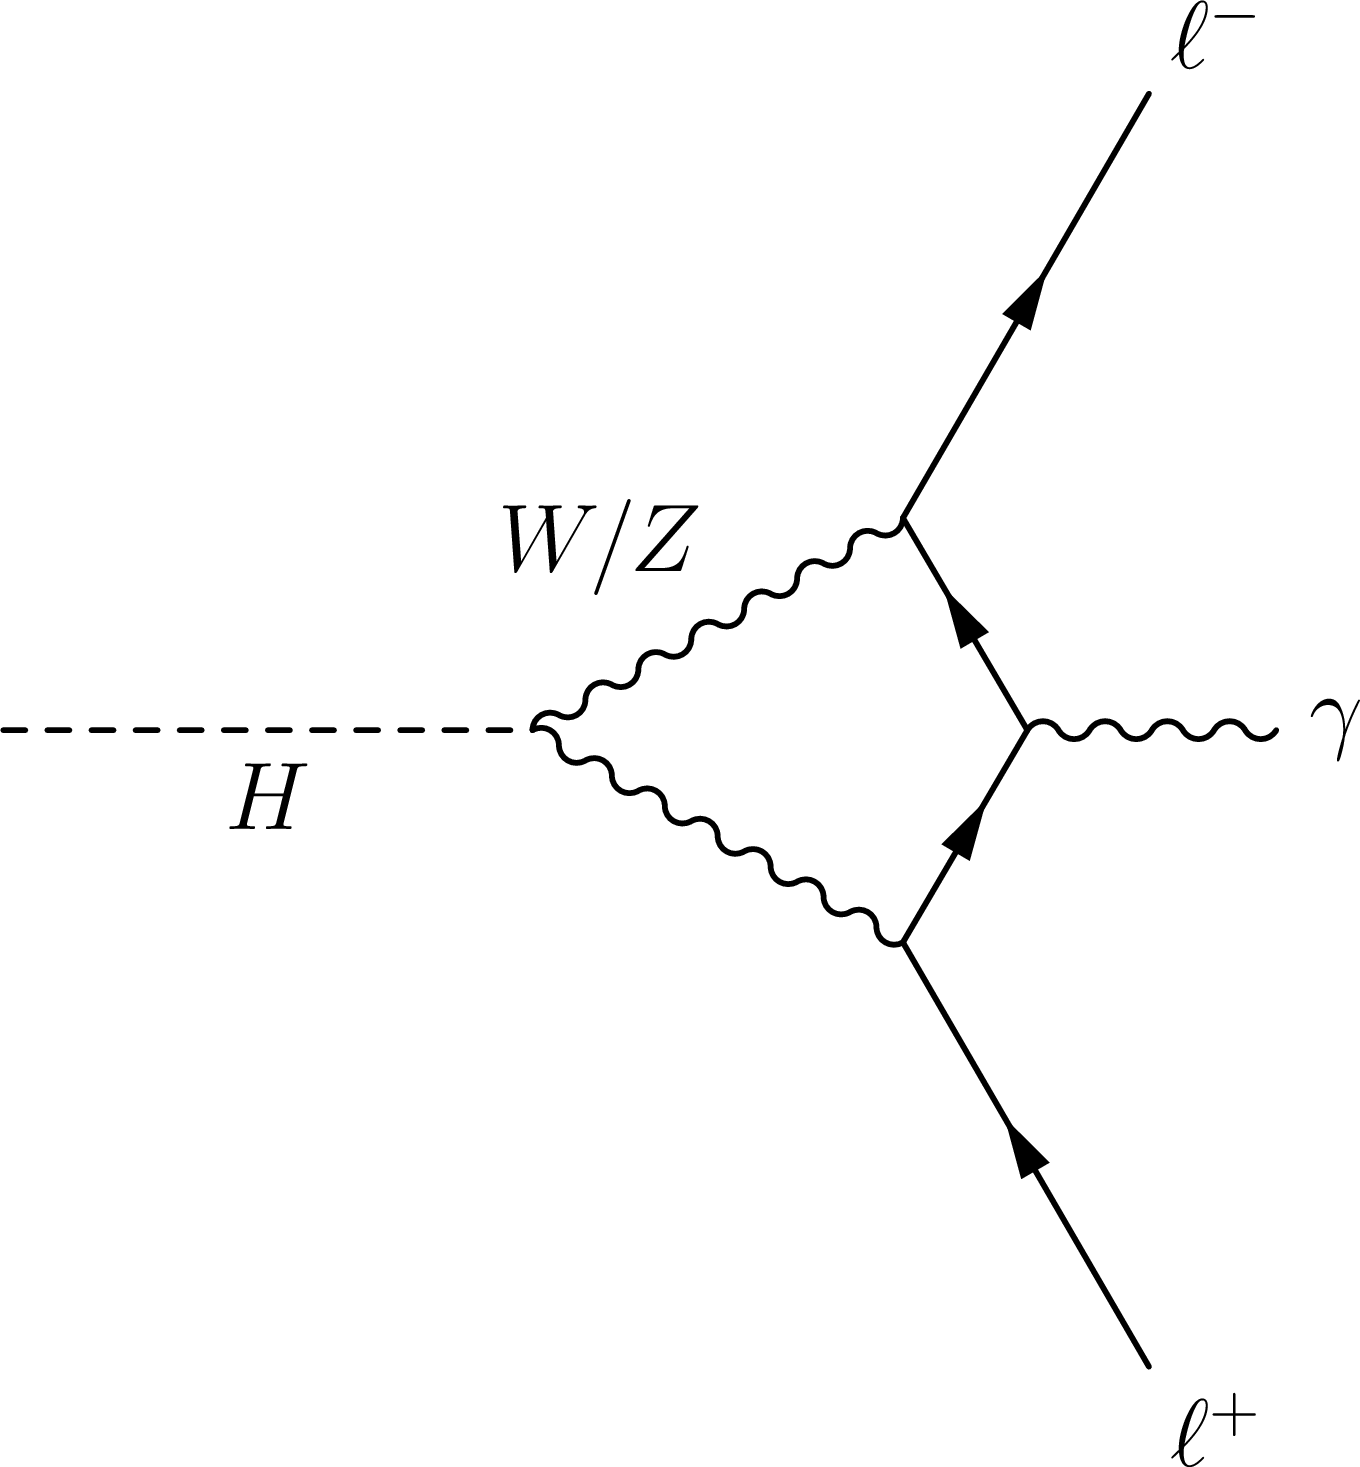
png pdf |
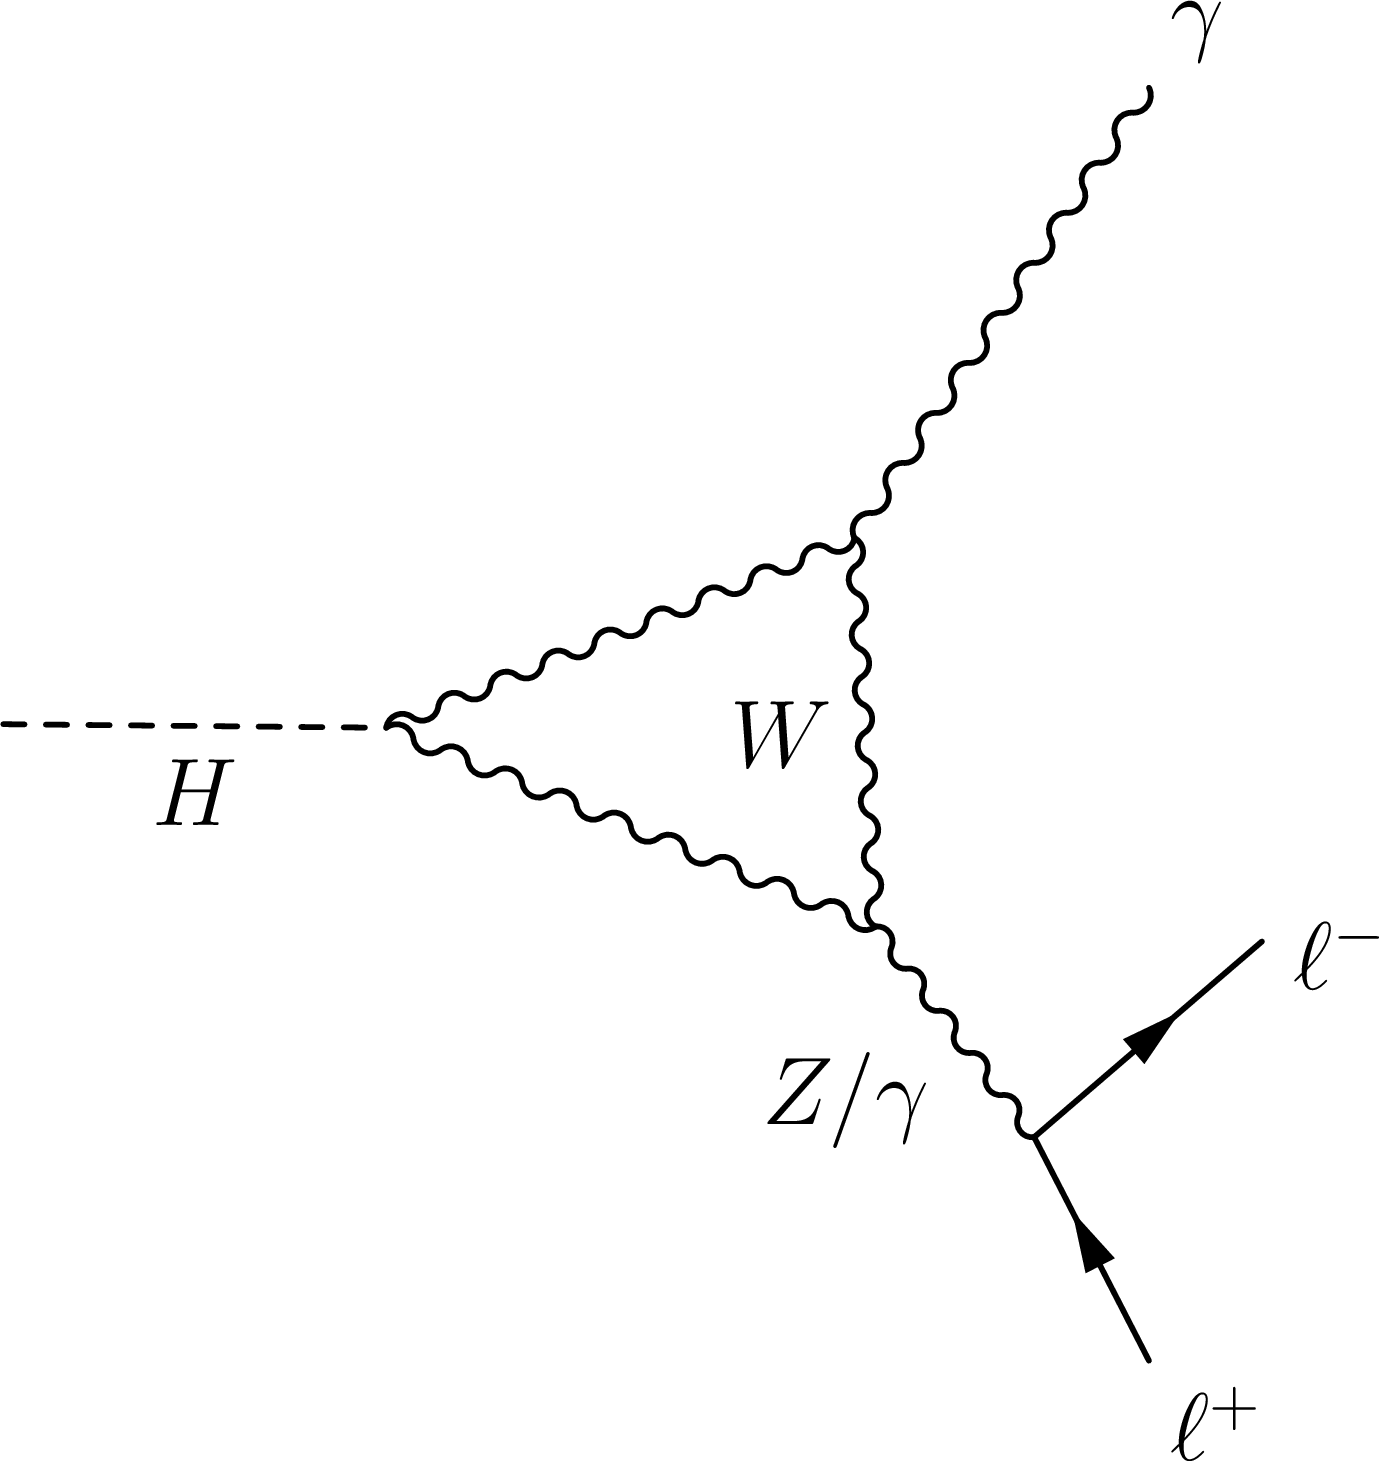
Figure 1-b:
A dominant diagram contributing to $ {\mathrm {H}} \to \ell \ell \gamma $ process. |
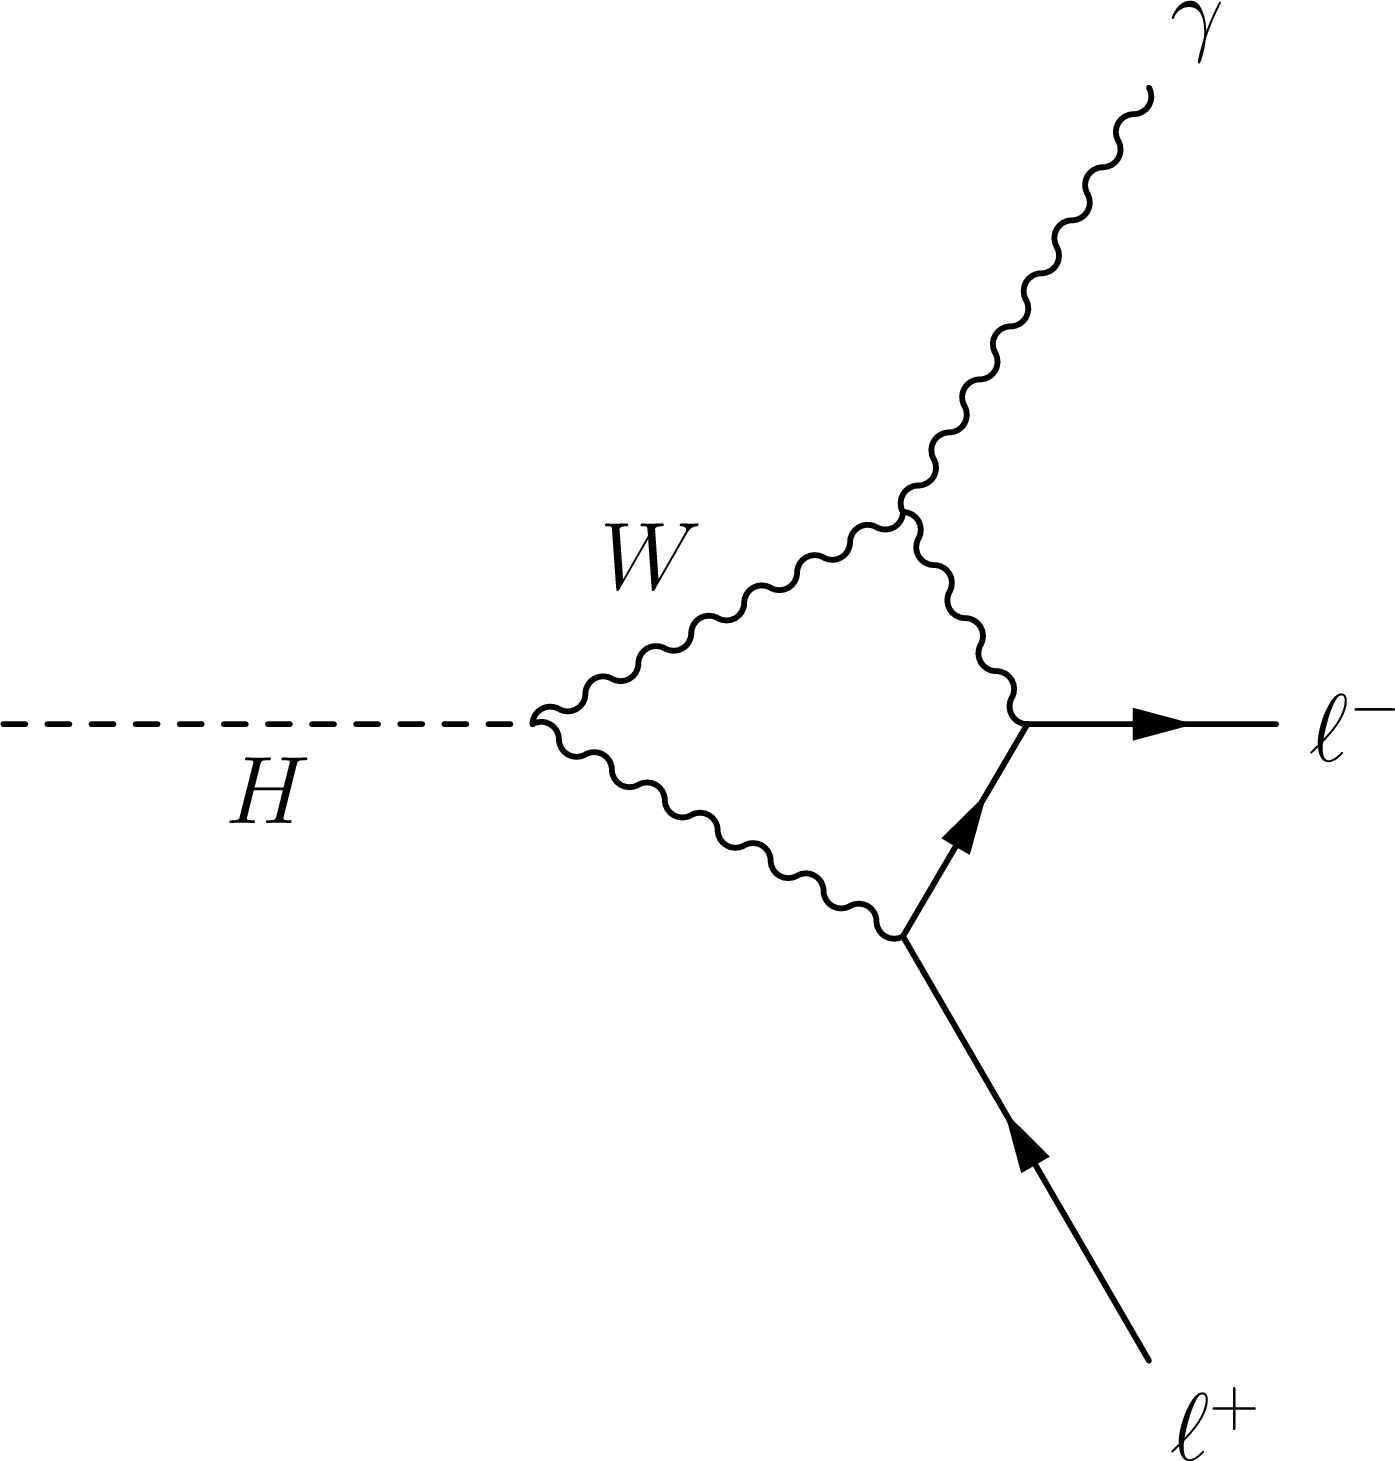
png pdf |
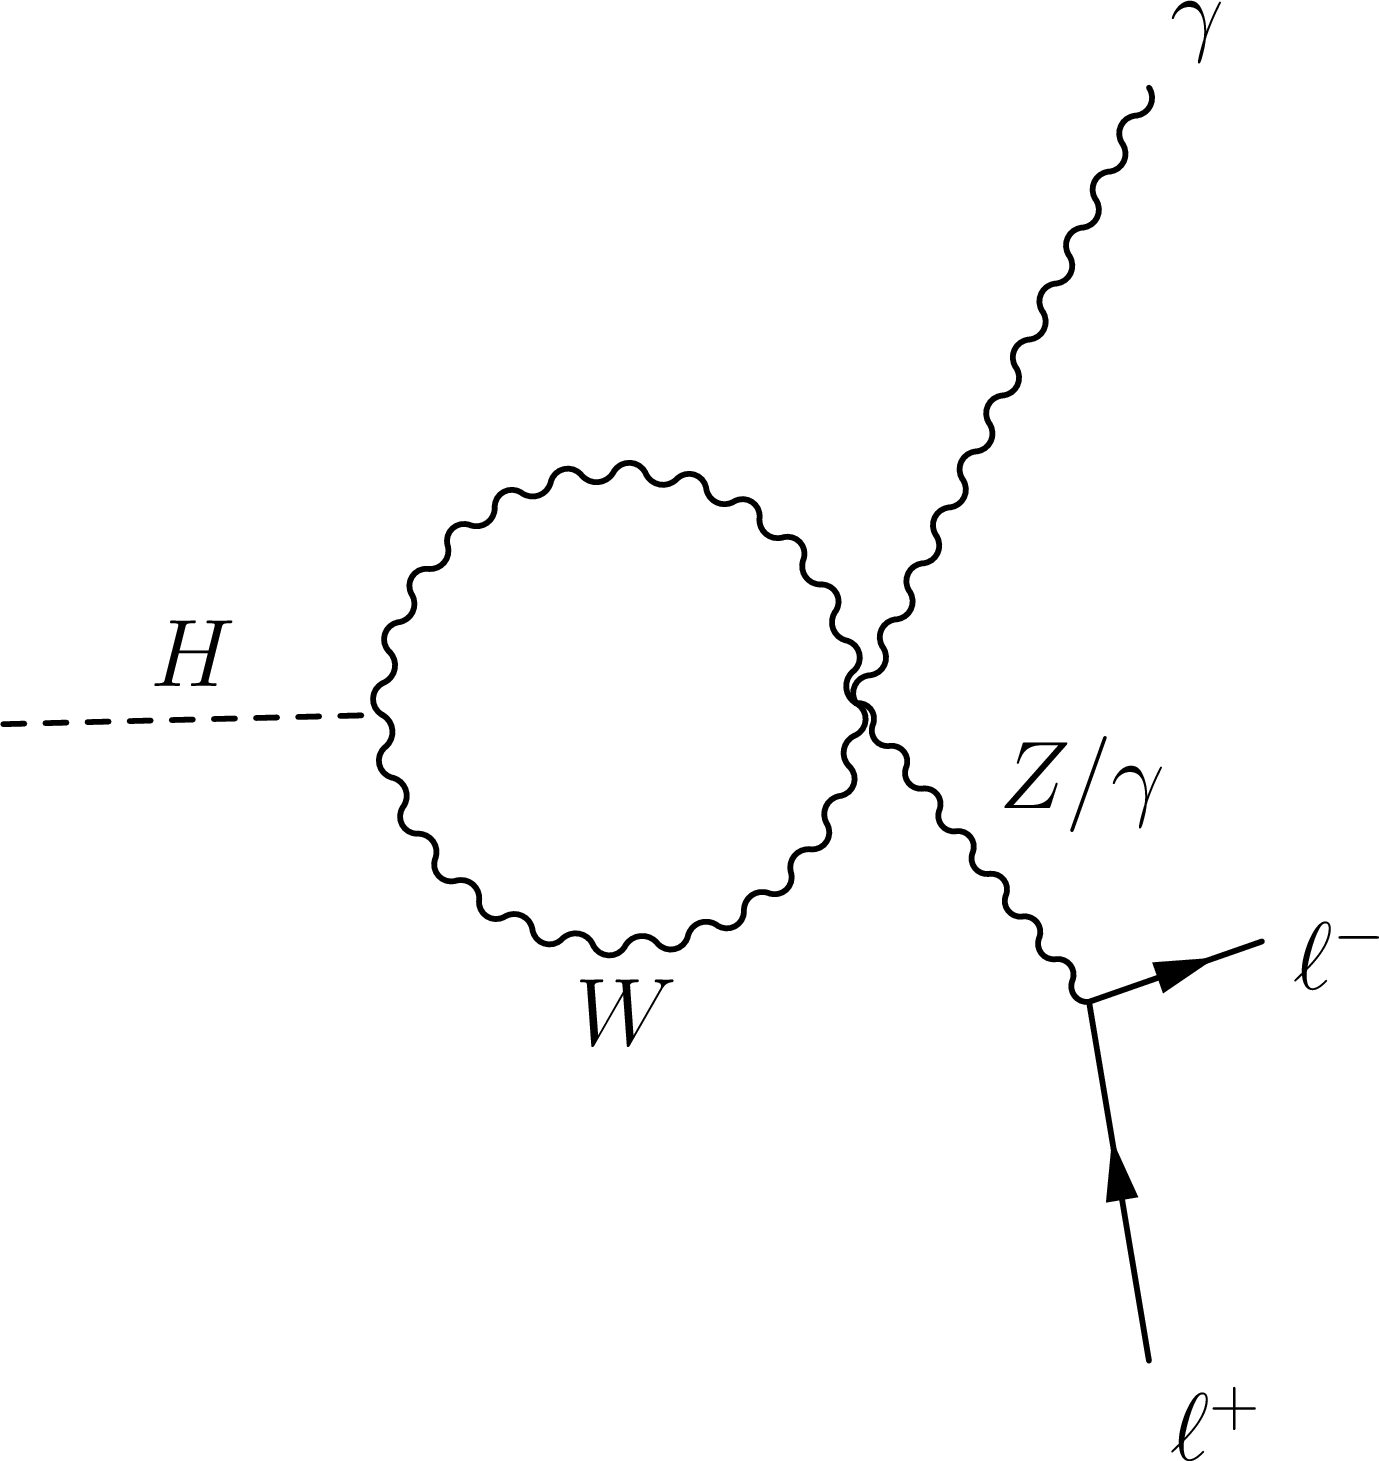
Figure 1-c:
A dominant diagram contributing to $ {\mathrm {H}} \to \ell \ell \gamma $ process. |
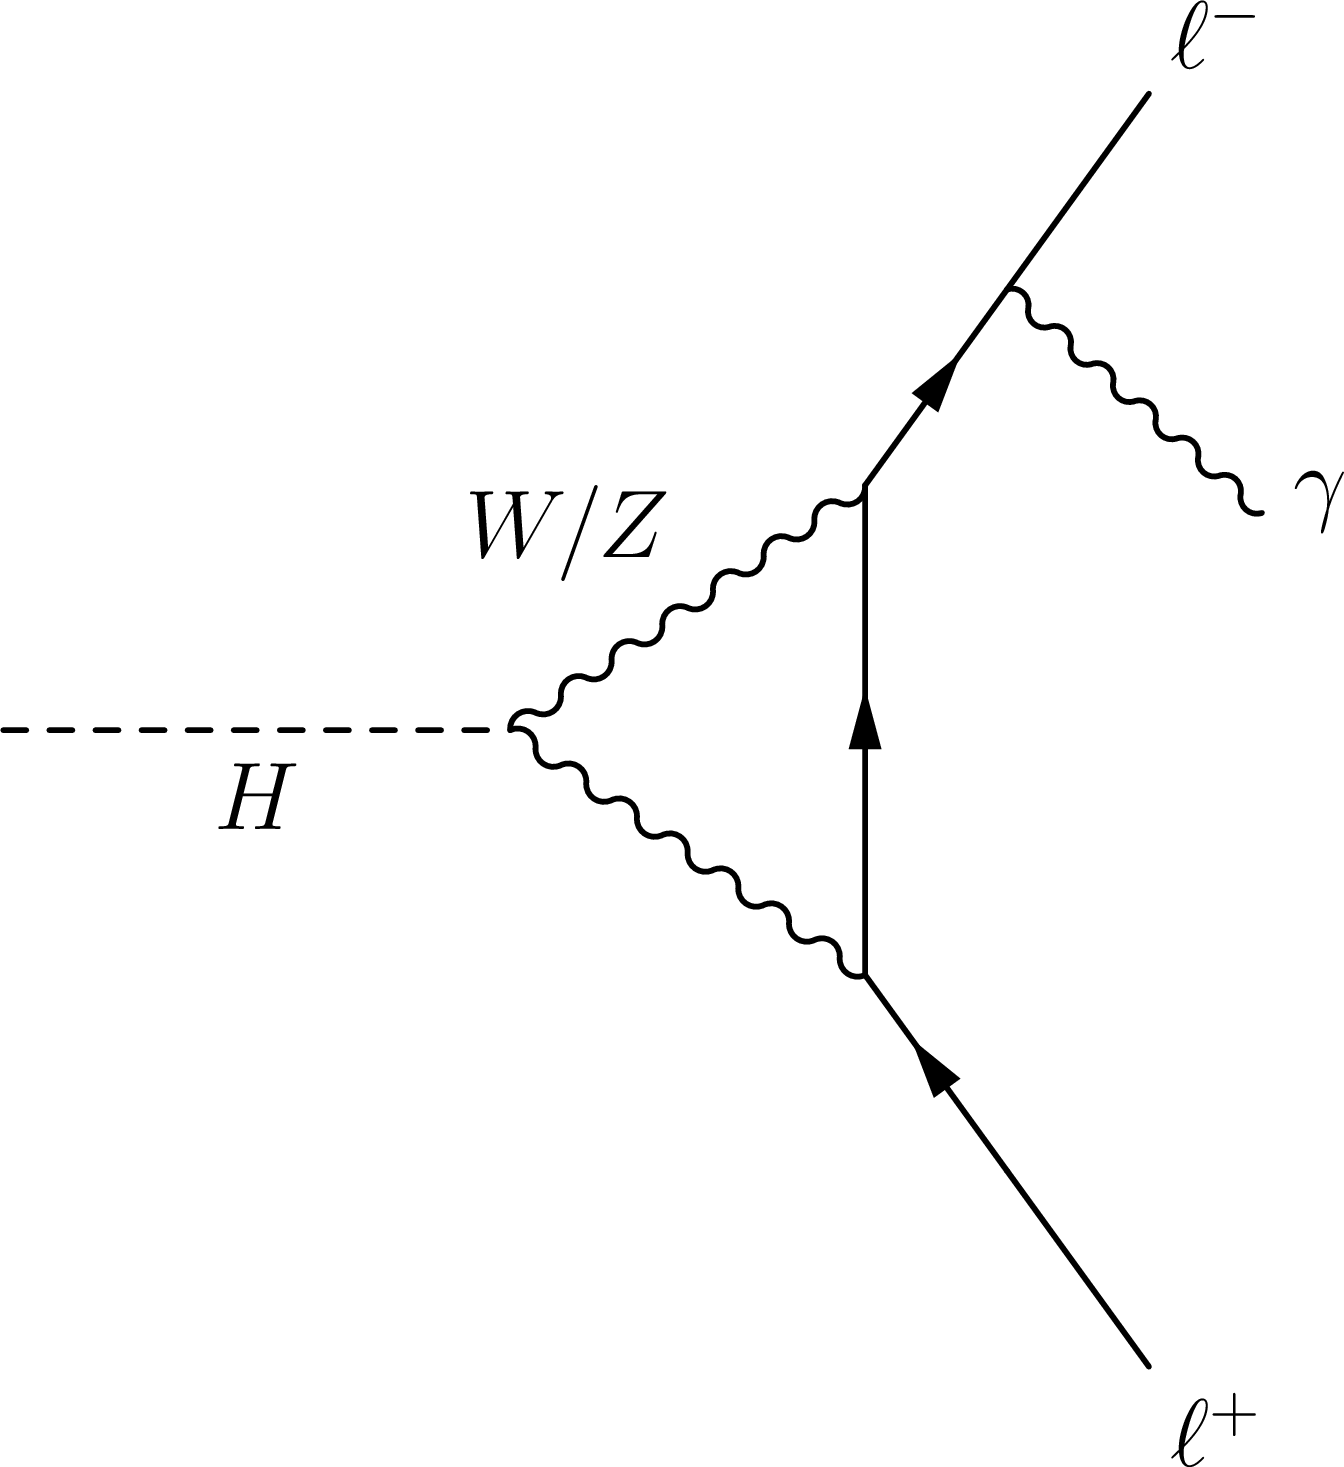
png pdf |
Figure 1-d:
A dominant diagram contributing to $ {\mathrm {H}} \to \ell \ell \gamma $ process. |
png pdf |
Figure 1-e:
A dominant diagram contributing to $ {\mathrm {H}} \to \ell \ell \gamma $ process. |
png pdf |
Figure 1-f:
A dominant diagram contributing to $ {\mathrm {H}} \to \ell \ell \gamma $ process. |
png pdf |
Figure 1-g:
A dominant diagram contributing to $ {\mathrm {H}} \to \ell \ell \gamma $ process. |
png pdf |
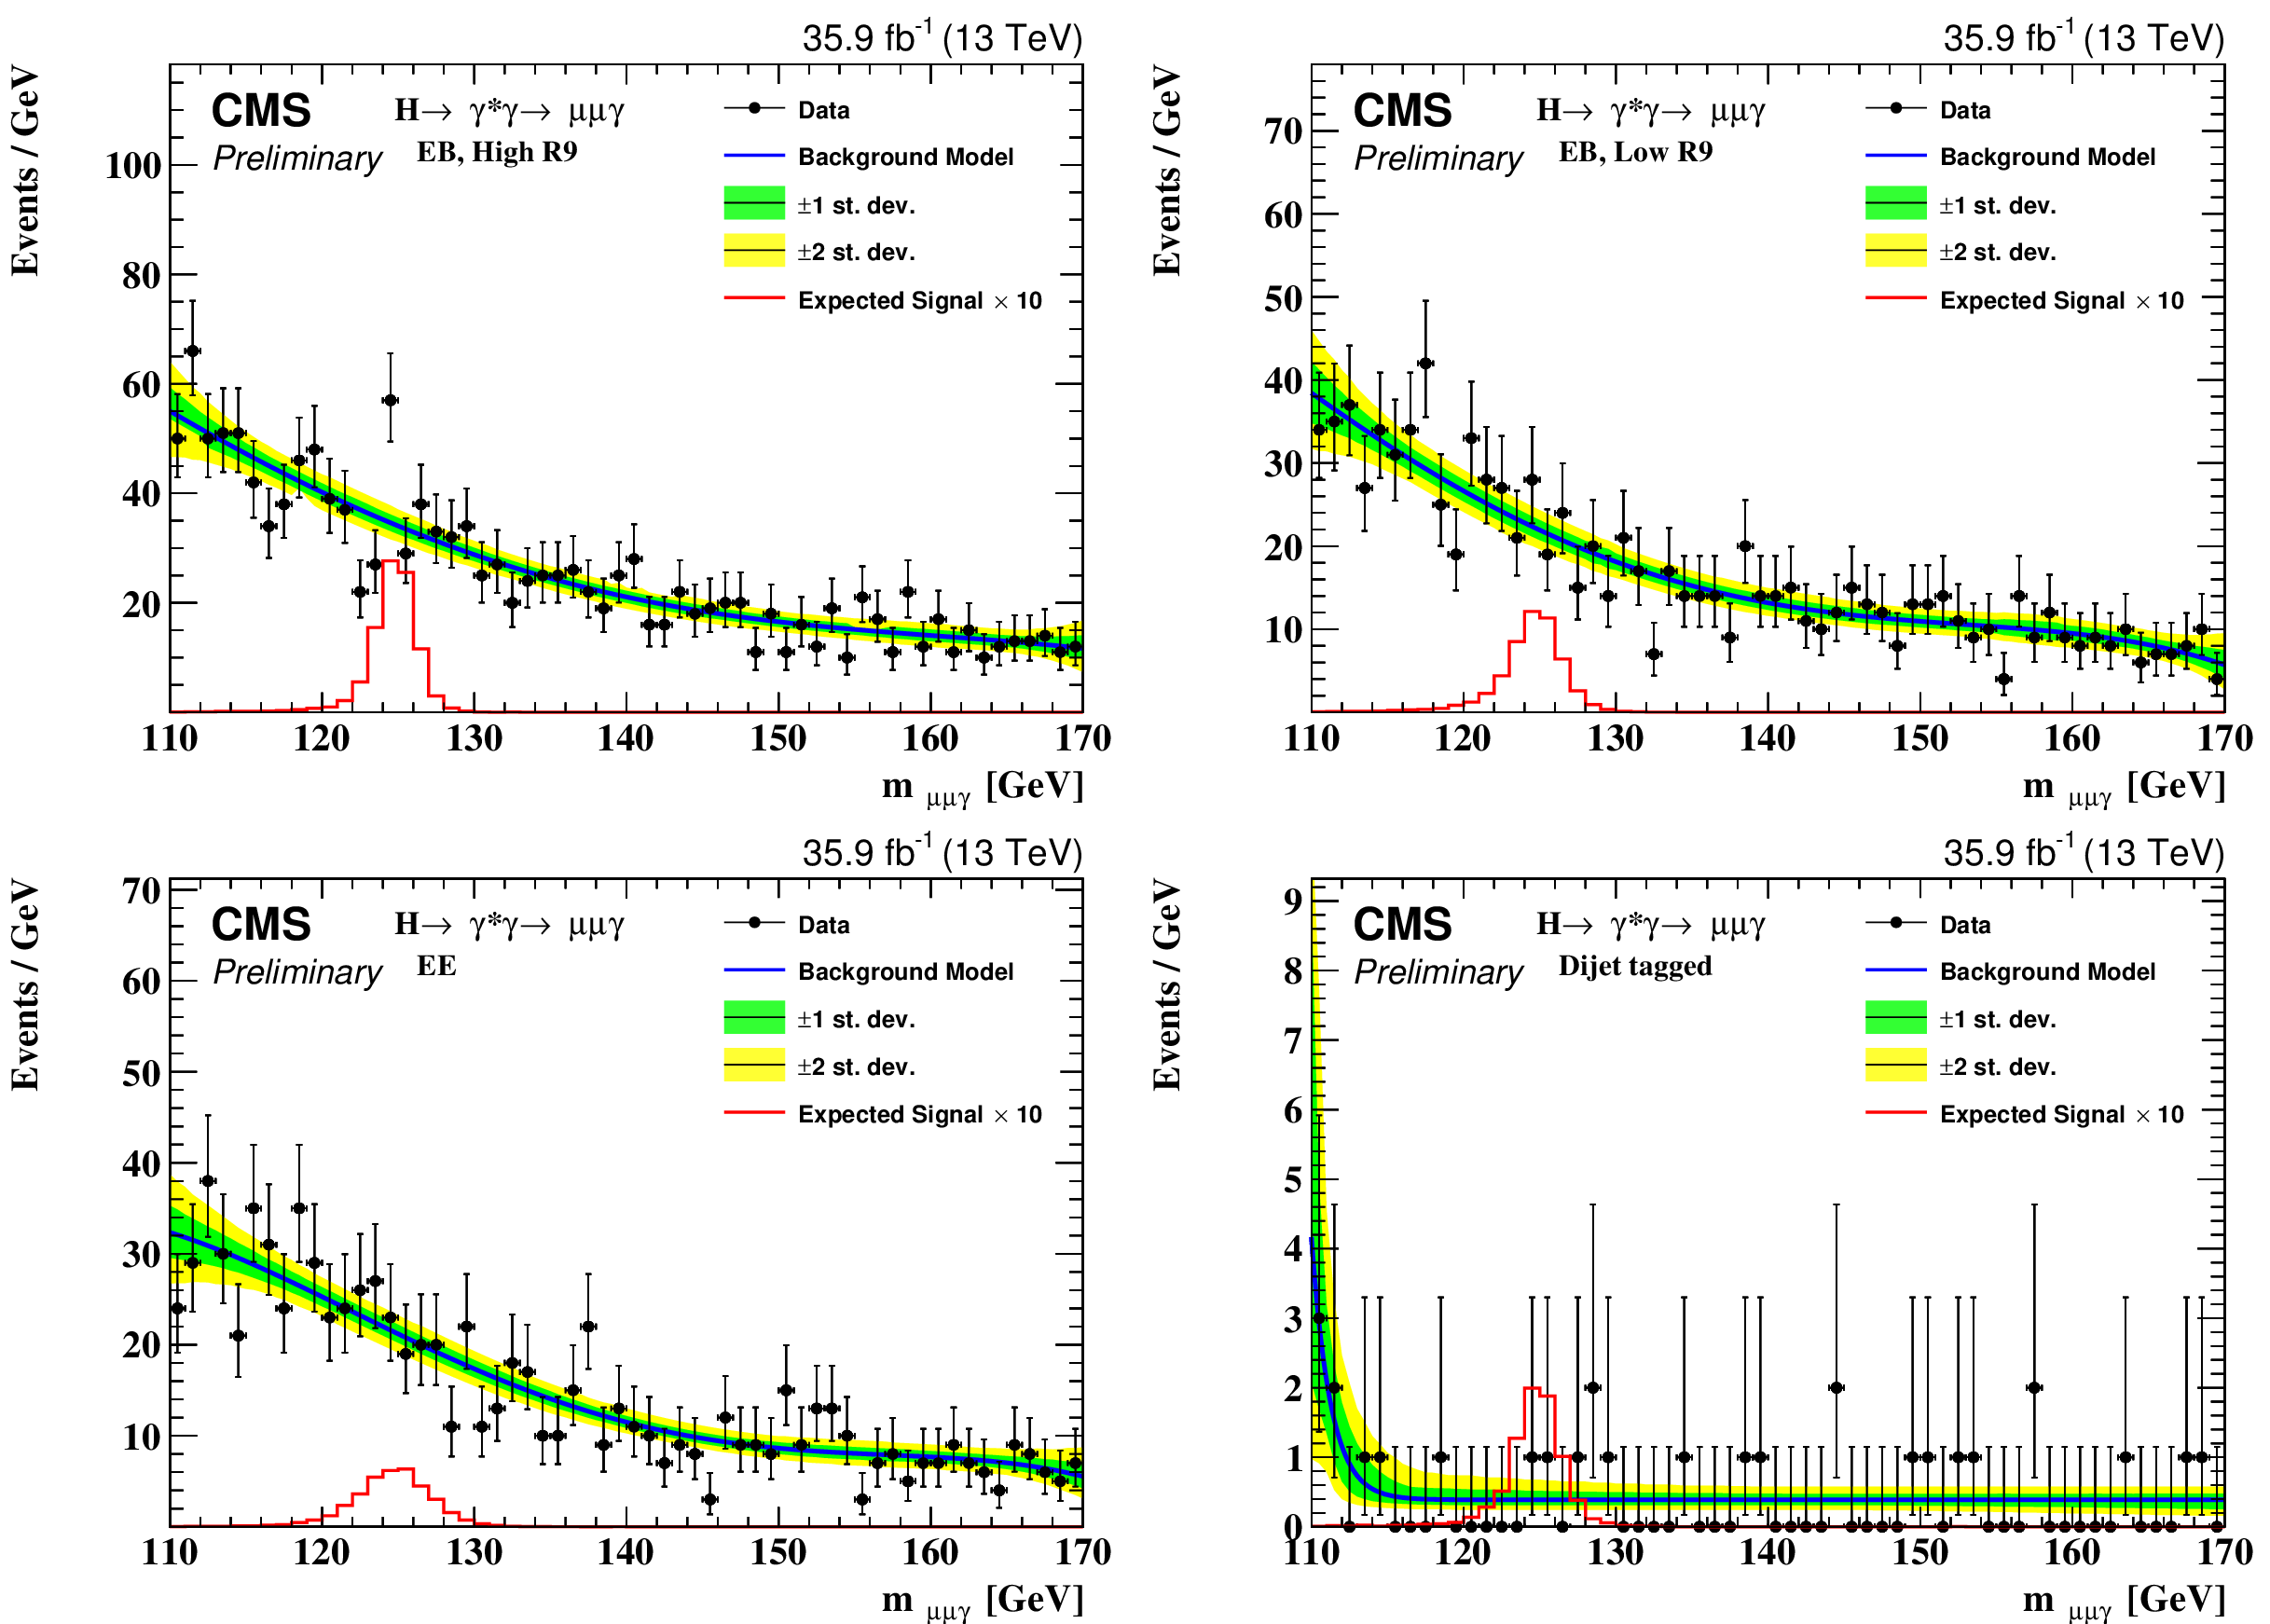
Figure 2:
Background model fit to the $m_{\mu \mu \gamma}$ distribution for all event classes for the $ {\mathrm {H}} \to \gamma ^*\gamma \to \mu \mu \gamma $ selection. The green and yellow bands represent the 68% and 95% uncertainties in the fit to the data. |
png pdf |
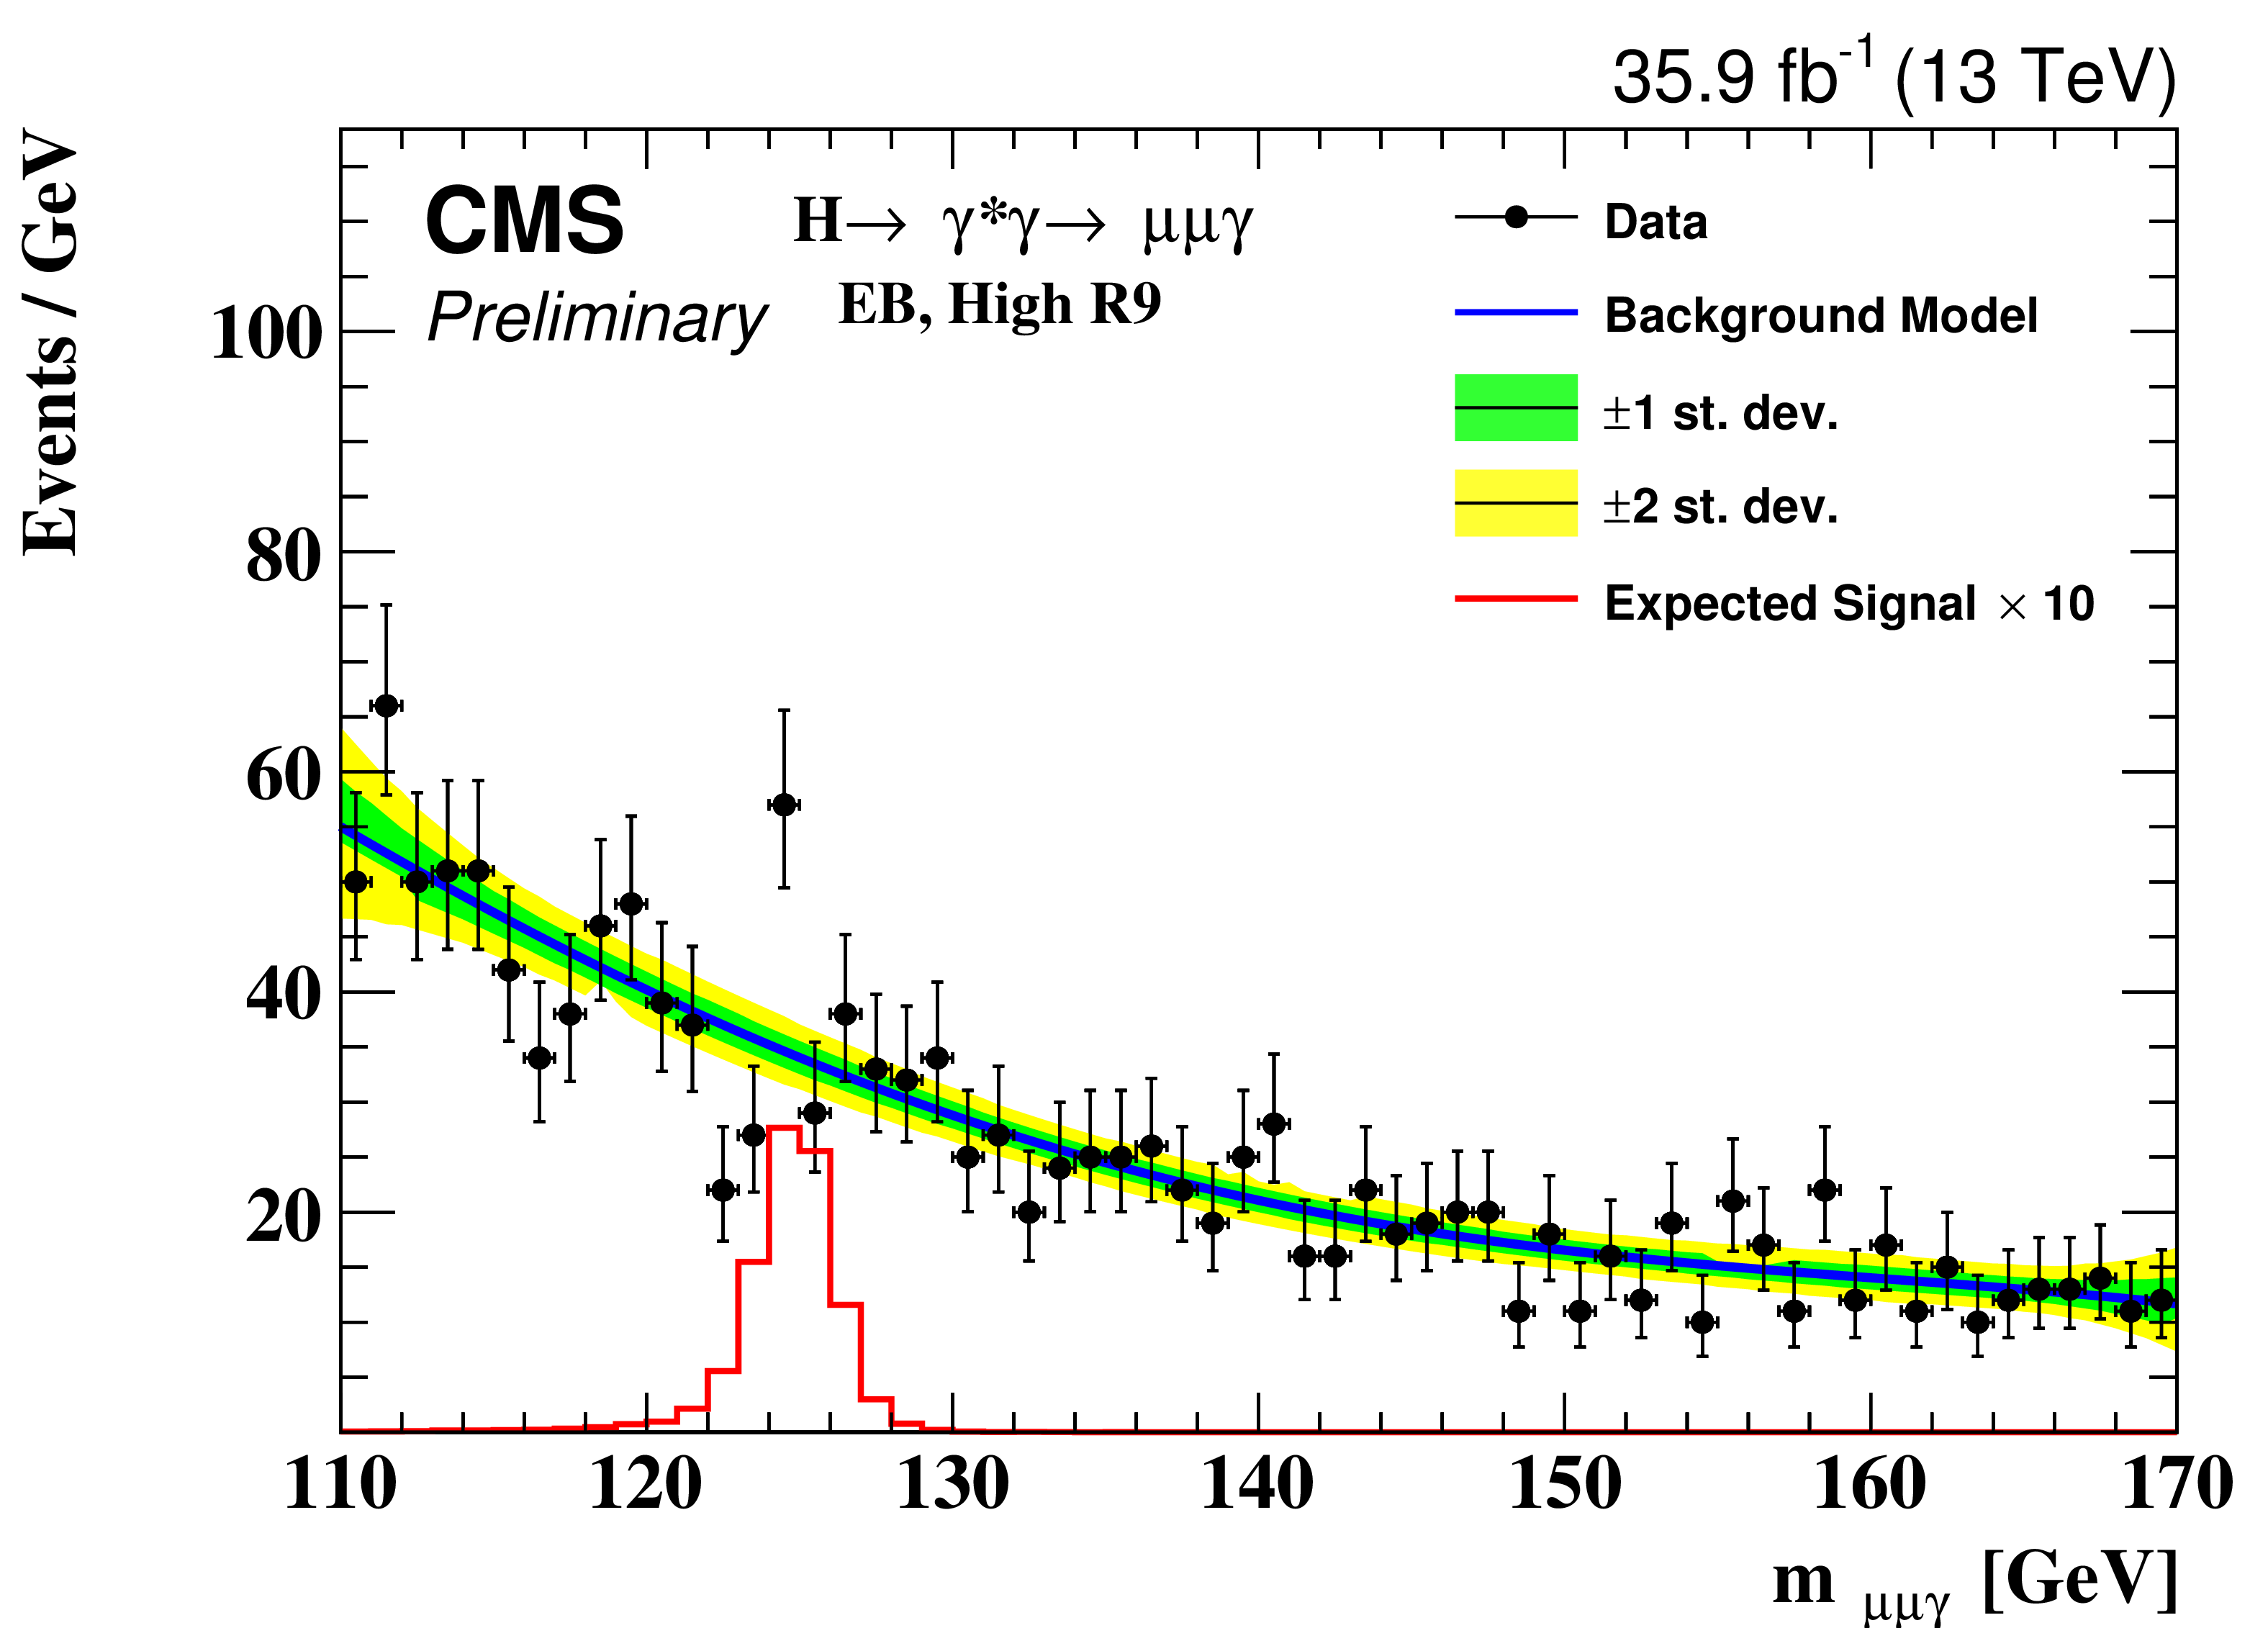
Figure 2-a:
Background model fit to the $m_{\mu \mu \gamma}$ distribution for the EB, High R9 event class for the $ {\mathrm {H}} \to \gamma ^*\gamma \to \mu \mu \gamma $ selection. The green and yellow bands represent the 68% and 95% uncertainties in the fit to the data. |
png pdf |
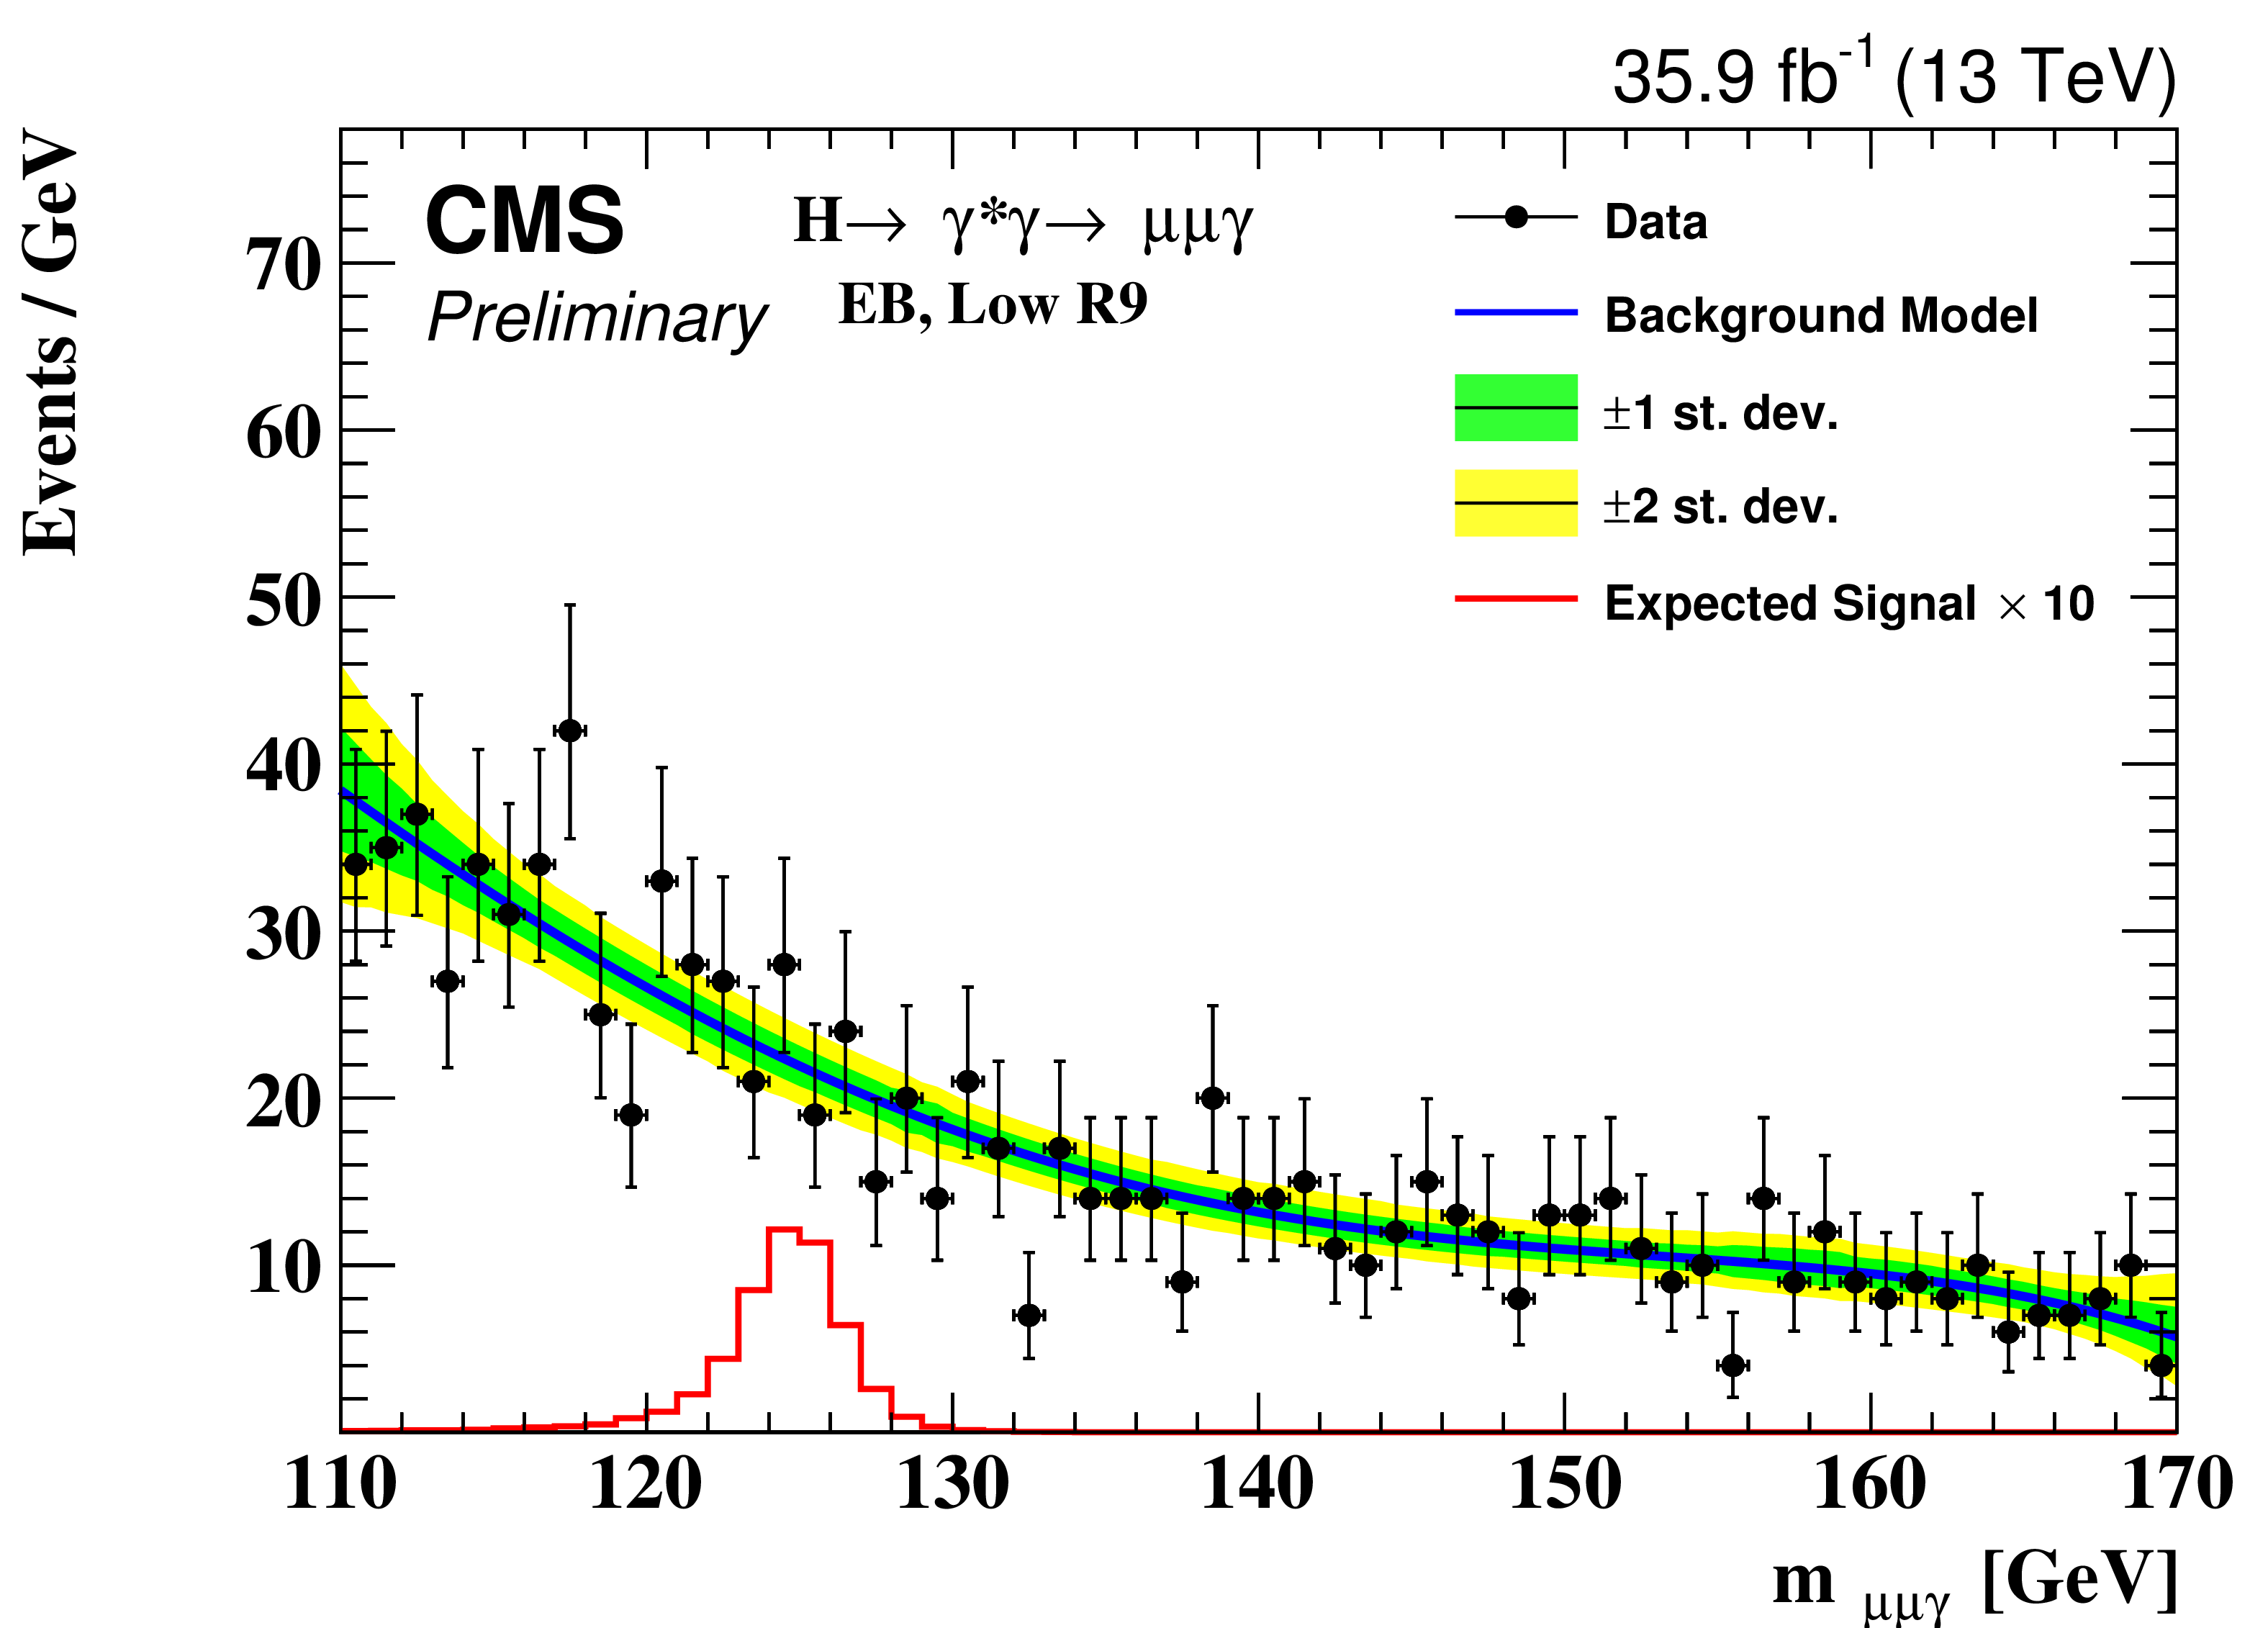
Figure 2-b:
Background model fit to the $m_{\mu \mu \gamma}$ distribution for the EB, Low R9 event class for the $ {\mathrm {H}} \to \gamma ^*\gamma \to \mu \mu \gamma $ selection. The green and yellow bands represent the 68% and 95% uncertainties in the fit to the data. |
png pdf |
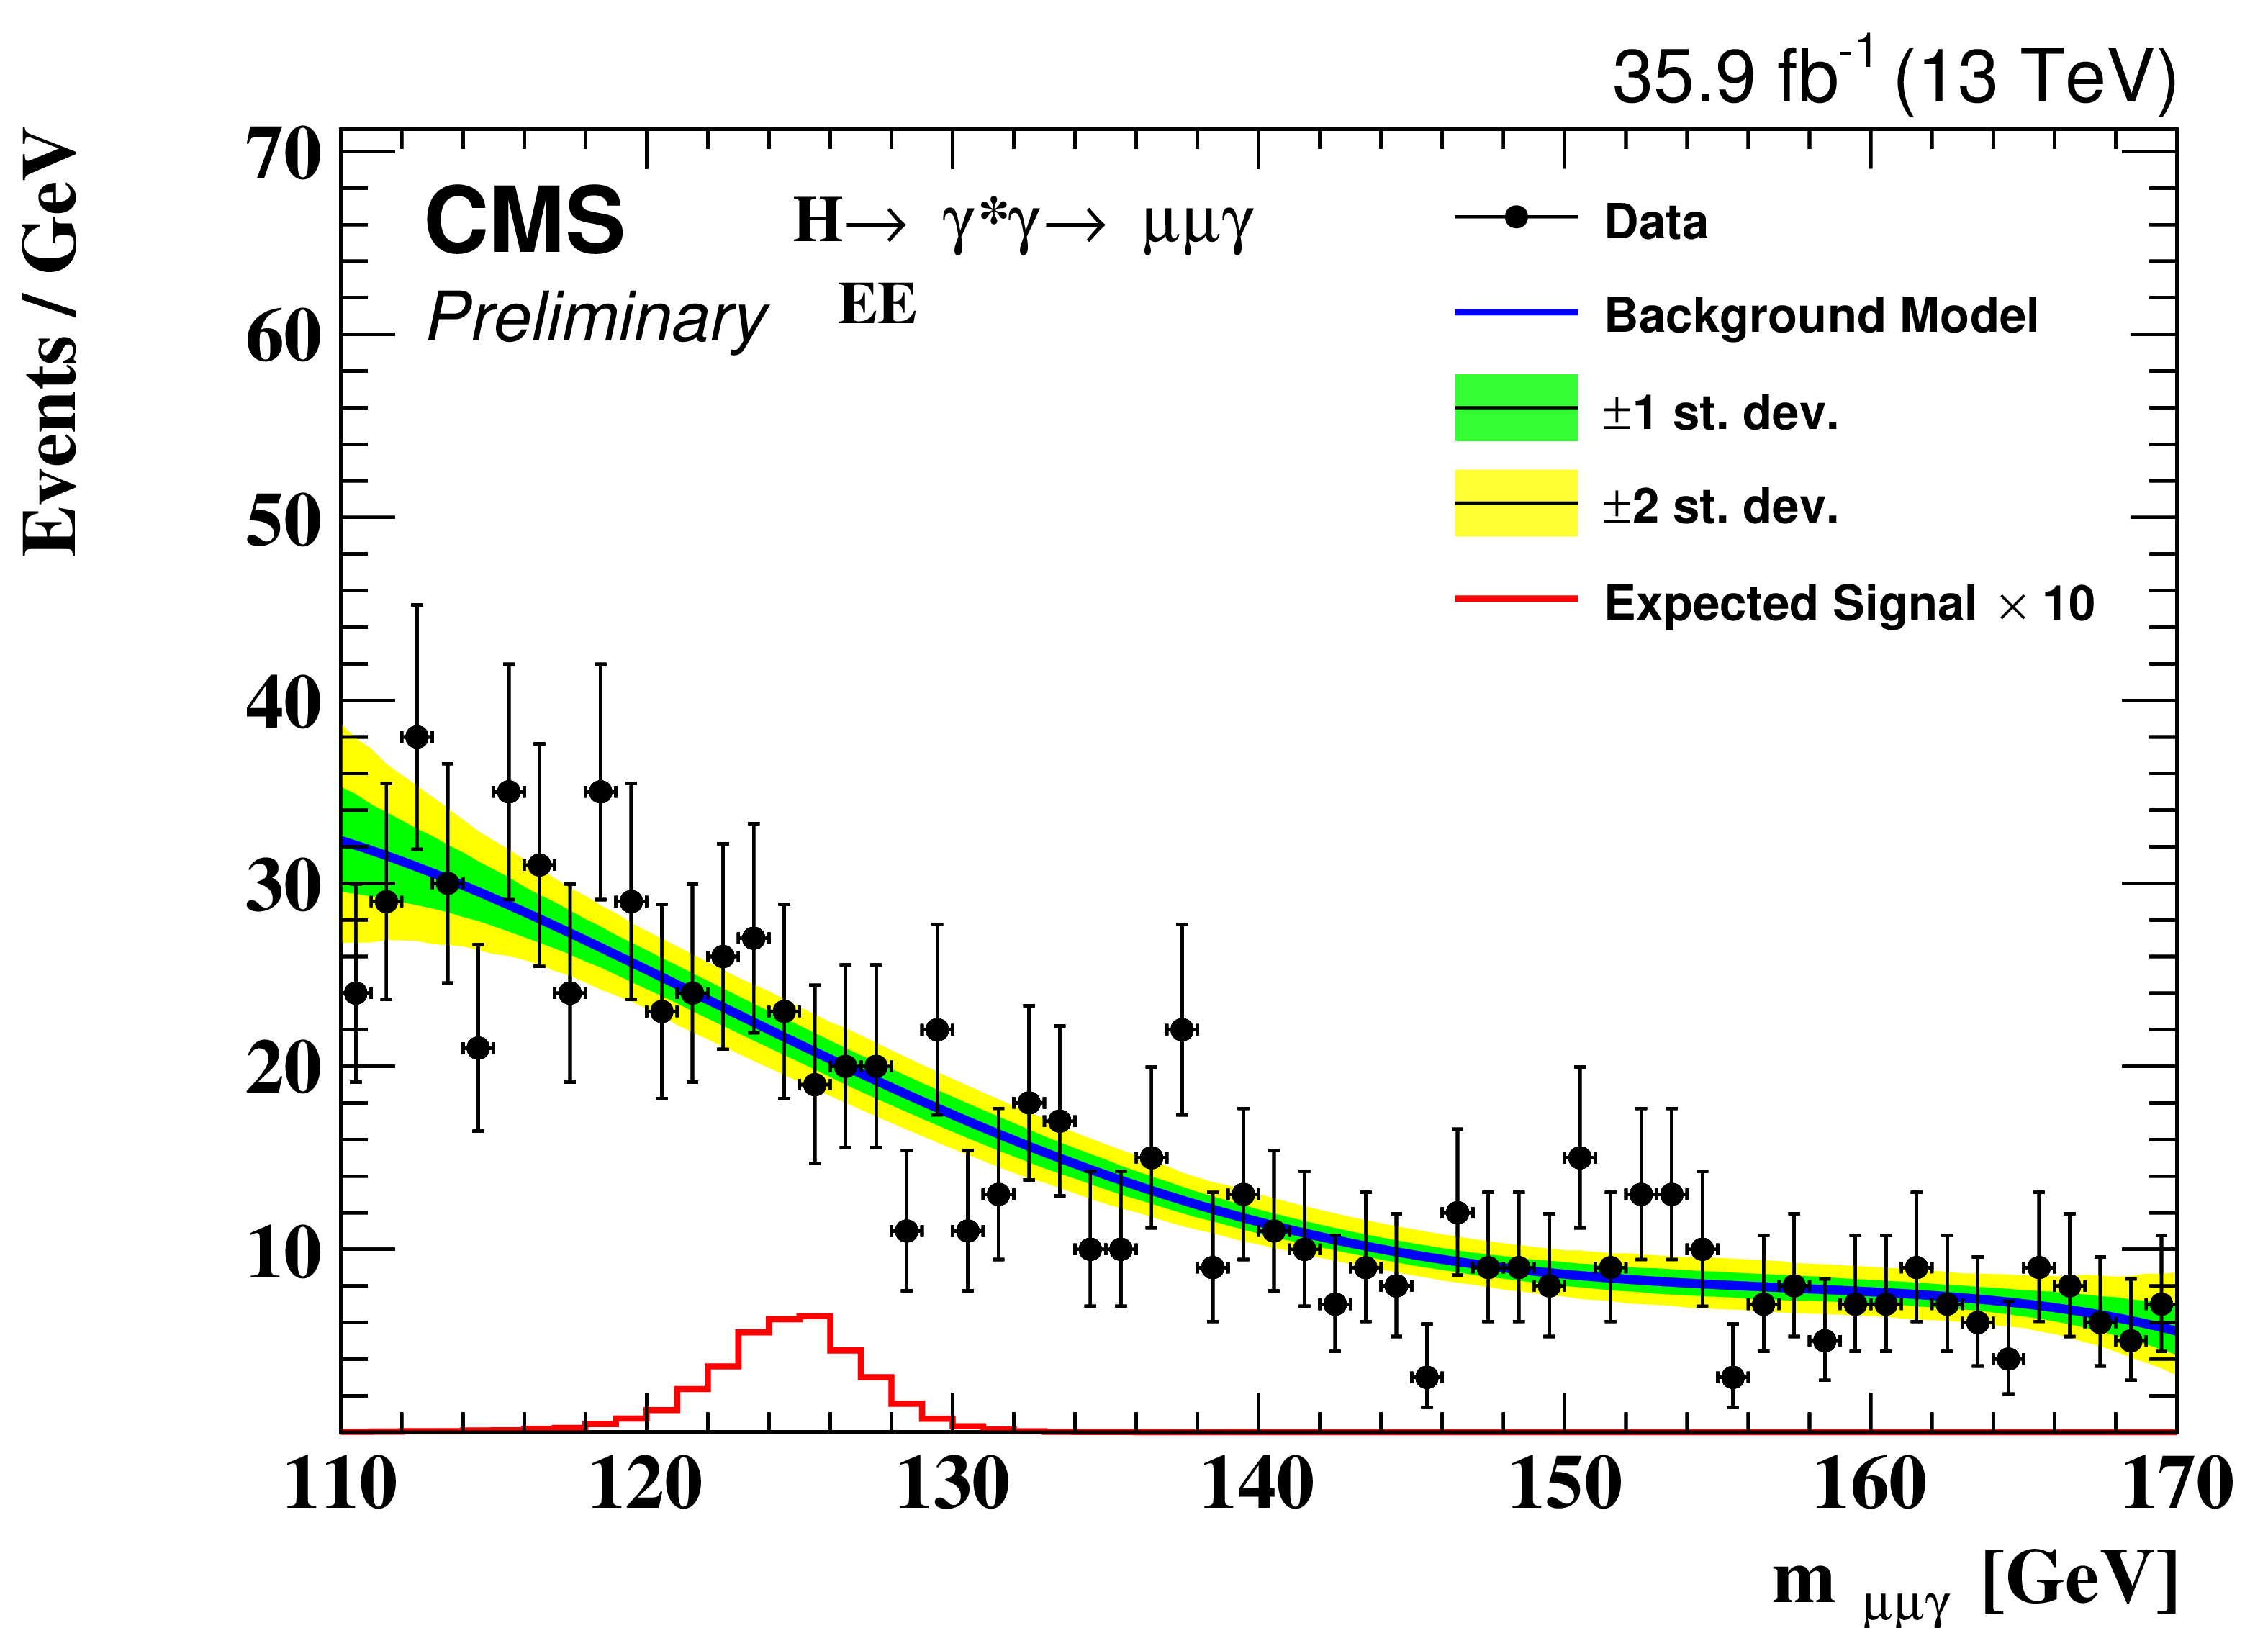
Figure 2-c:
Background model fit to the $m_{\mu \mu \gamma}$ distribution for the EE event class for the $ {\mathrm {H}} \to \gamma ^*\gamma \to \mu \mu \gamma $ selection. The green and yellow bands represent the 68% and 95% uncertainties in the fit to the data. |
png pdf |
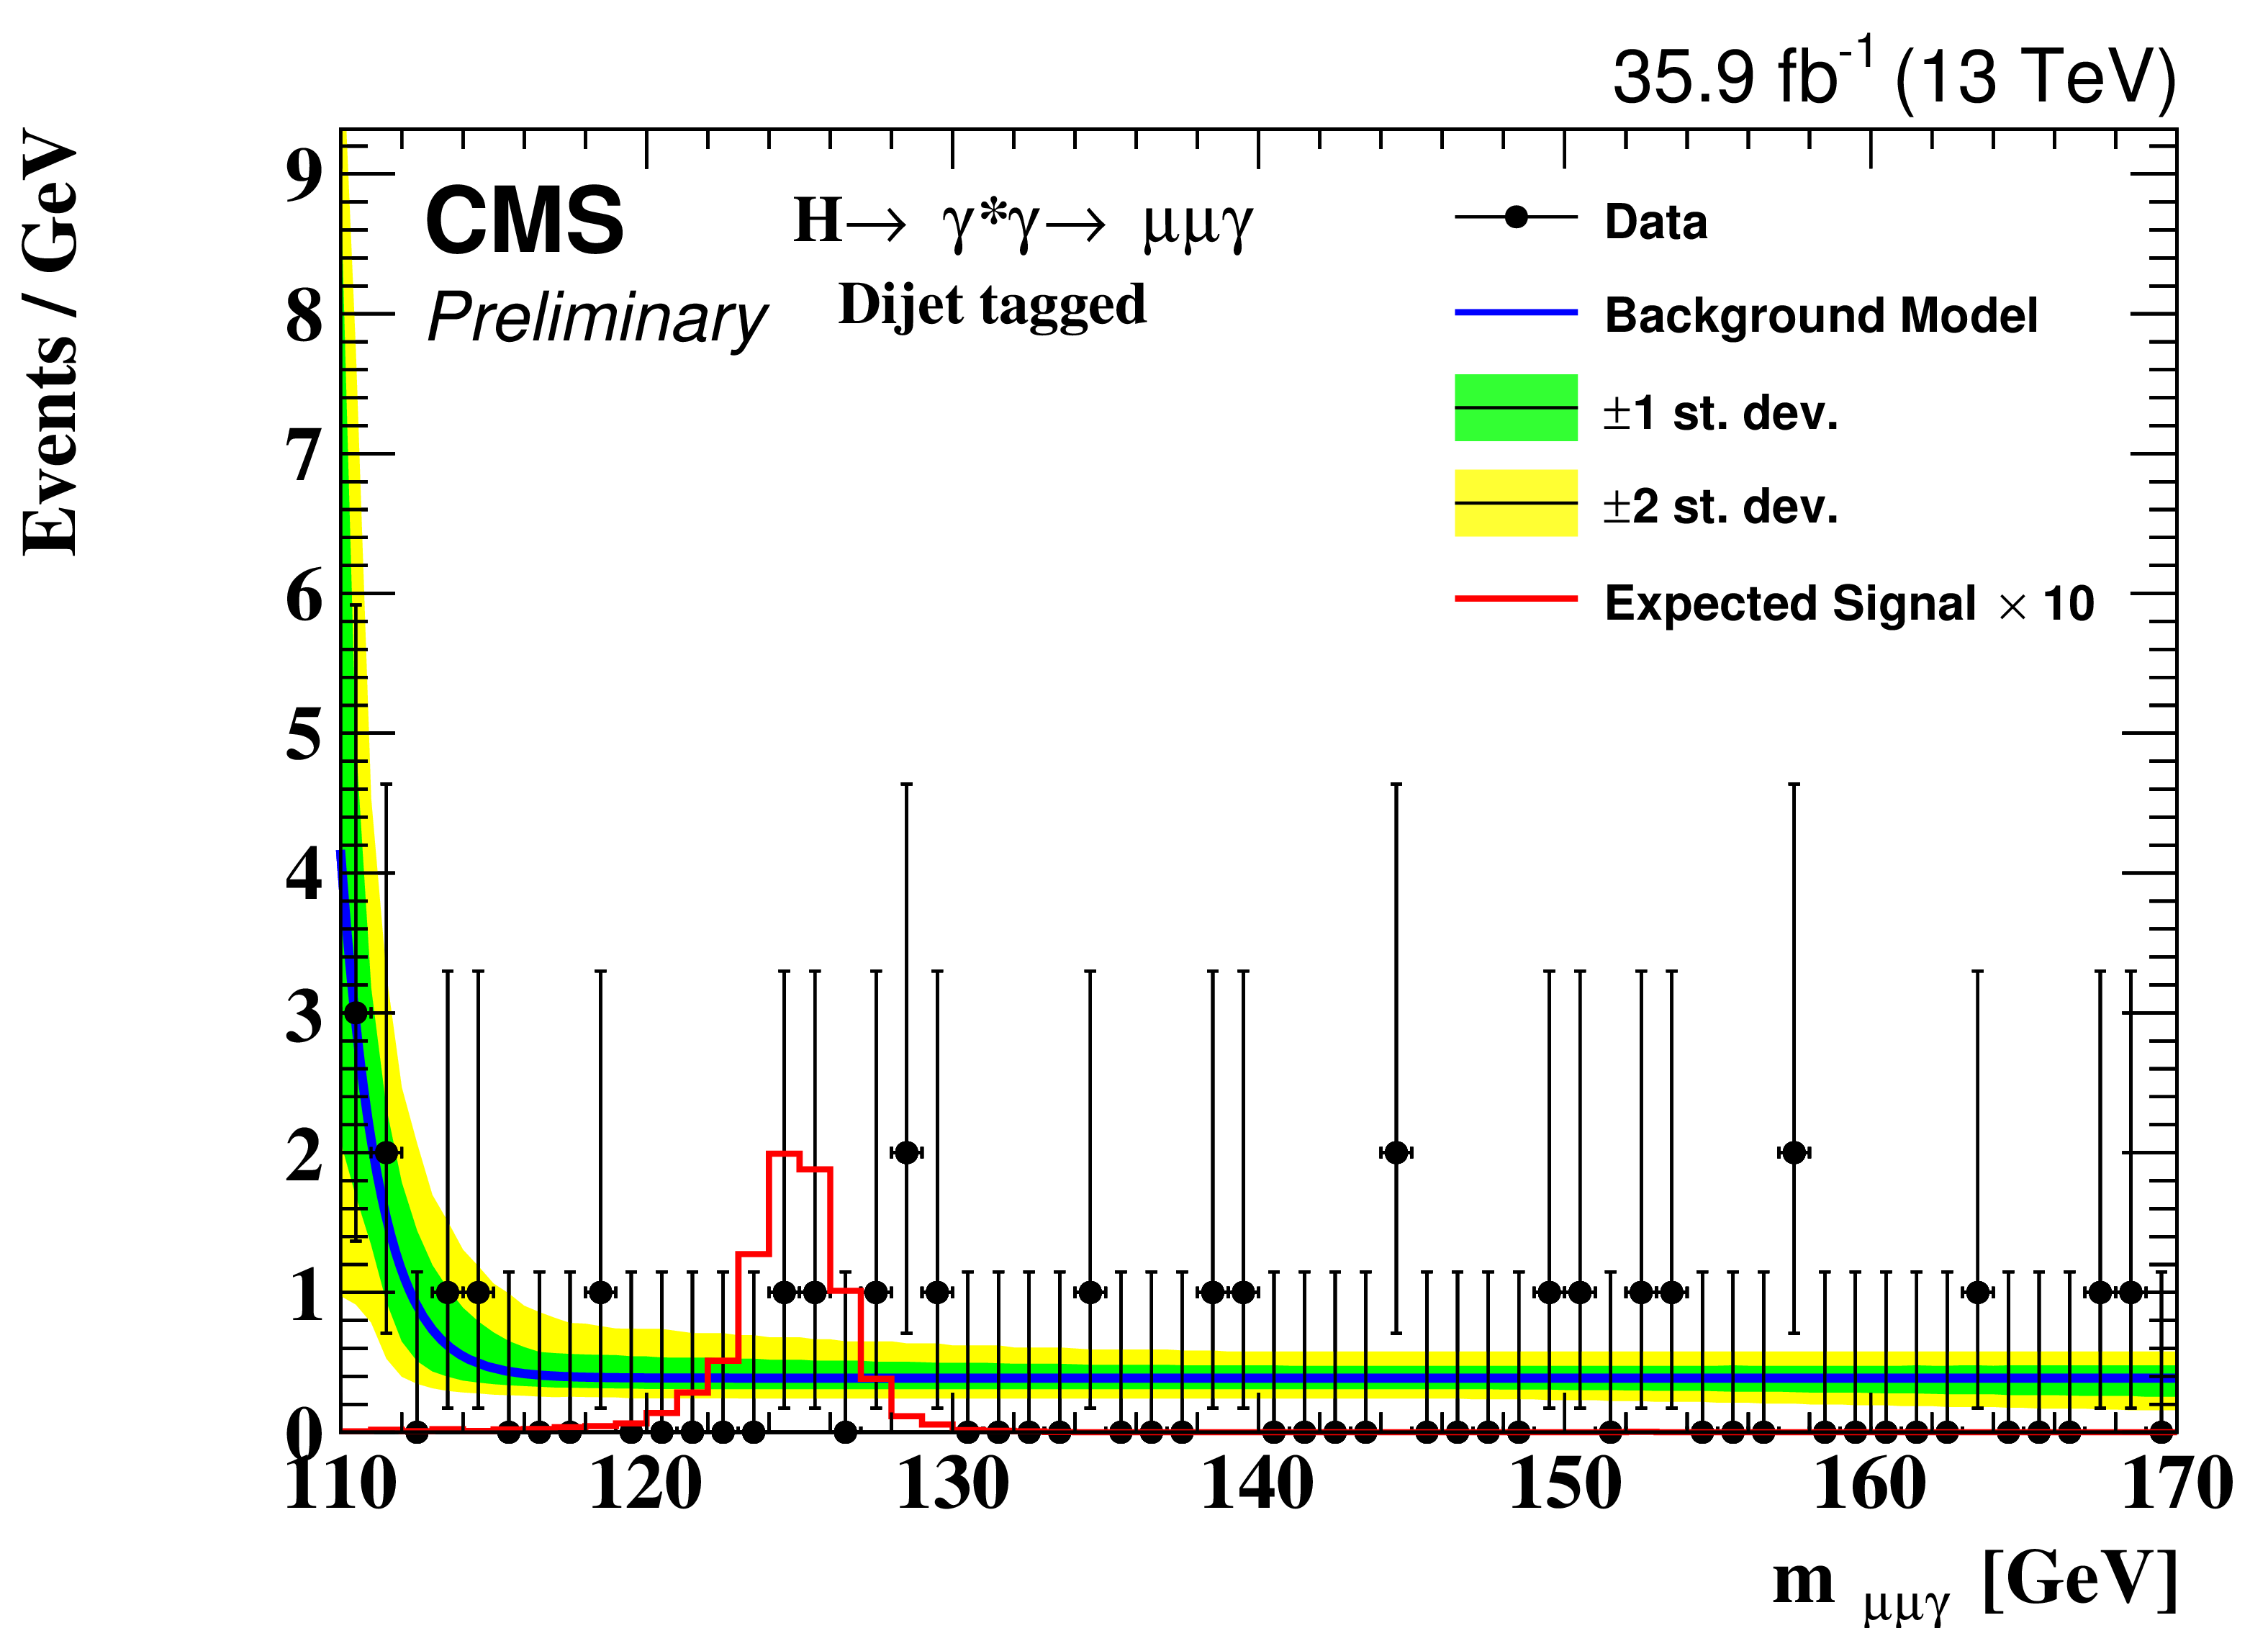
Figure 2-d:
Background model fit to the $m_{\mu \mu \gamma}$ distribution for the Dijet Tagged event class for the $ {\mathrm {H}} \to \gamma ^*\gamma \to \mu \mu \gamma $ selection. The green and yellow bands represent the 68% and 95% uncertainties in the fit to the data. |
png pdf |
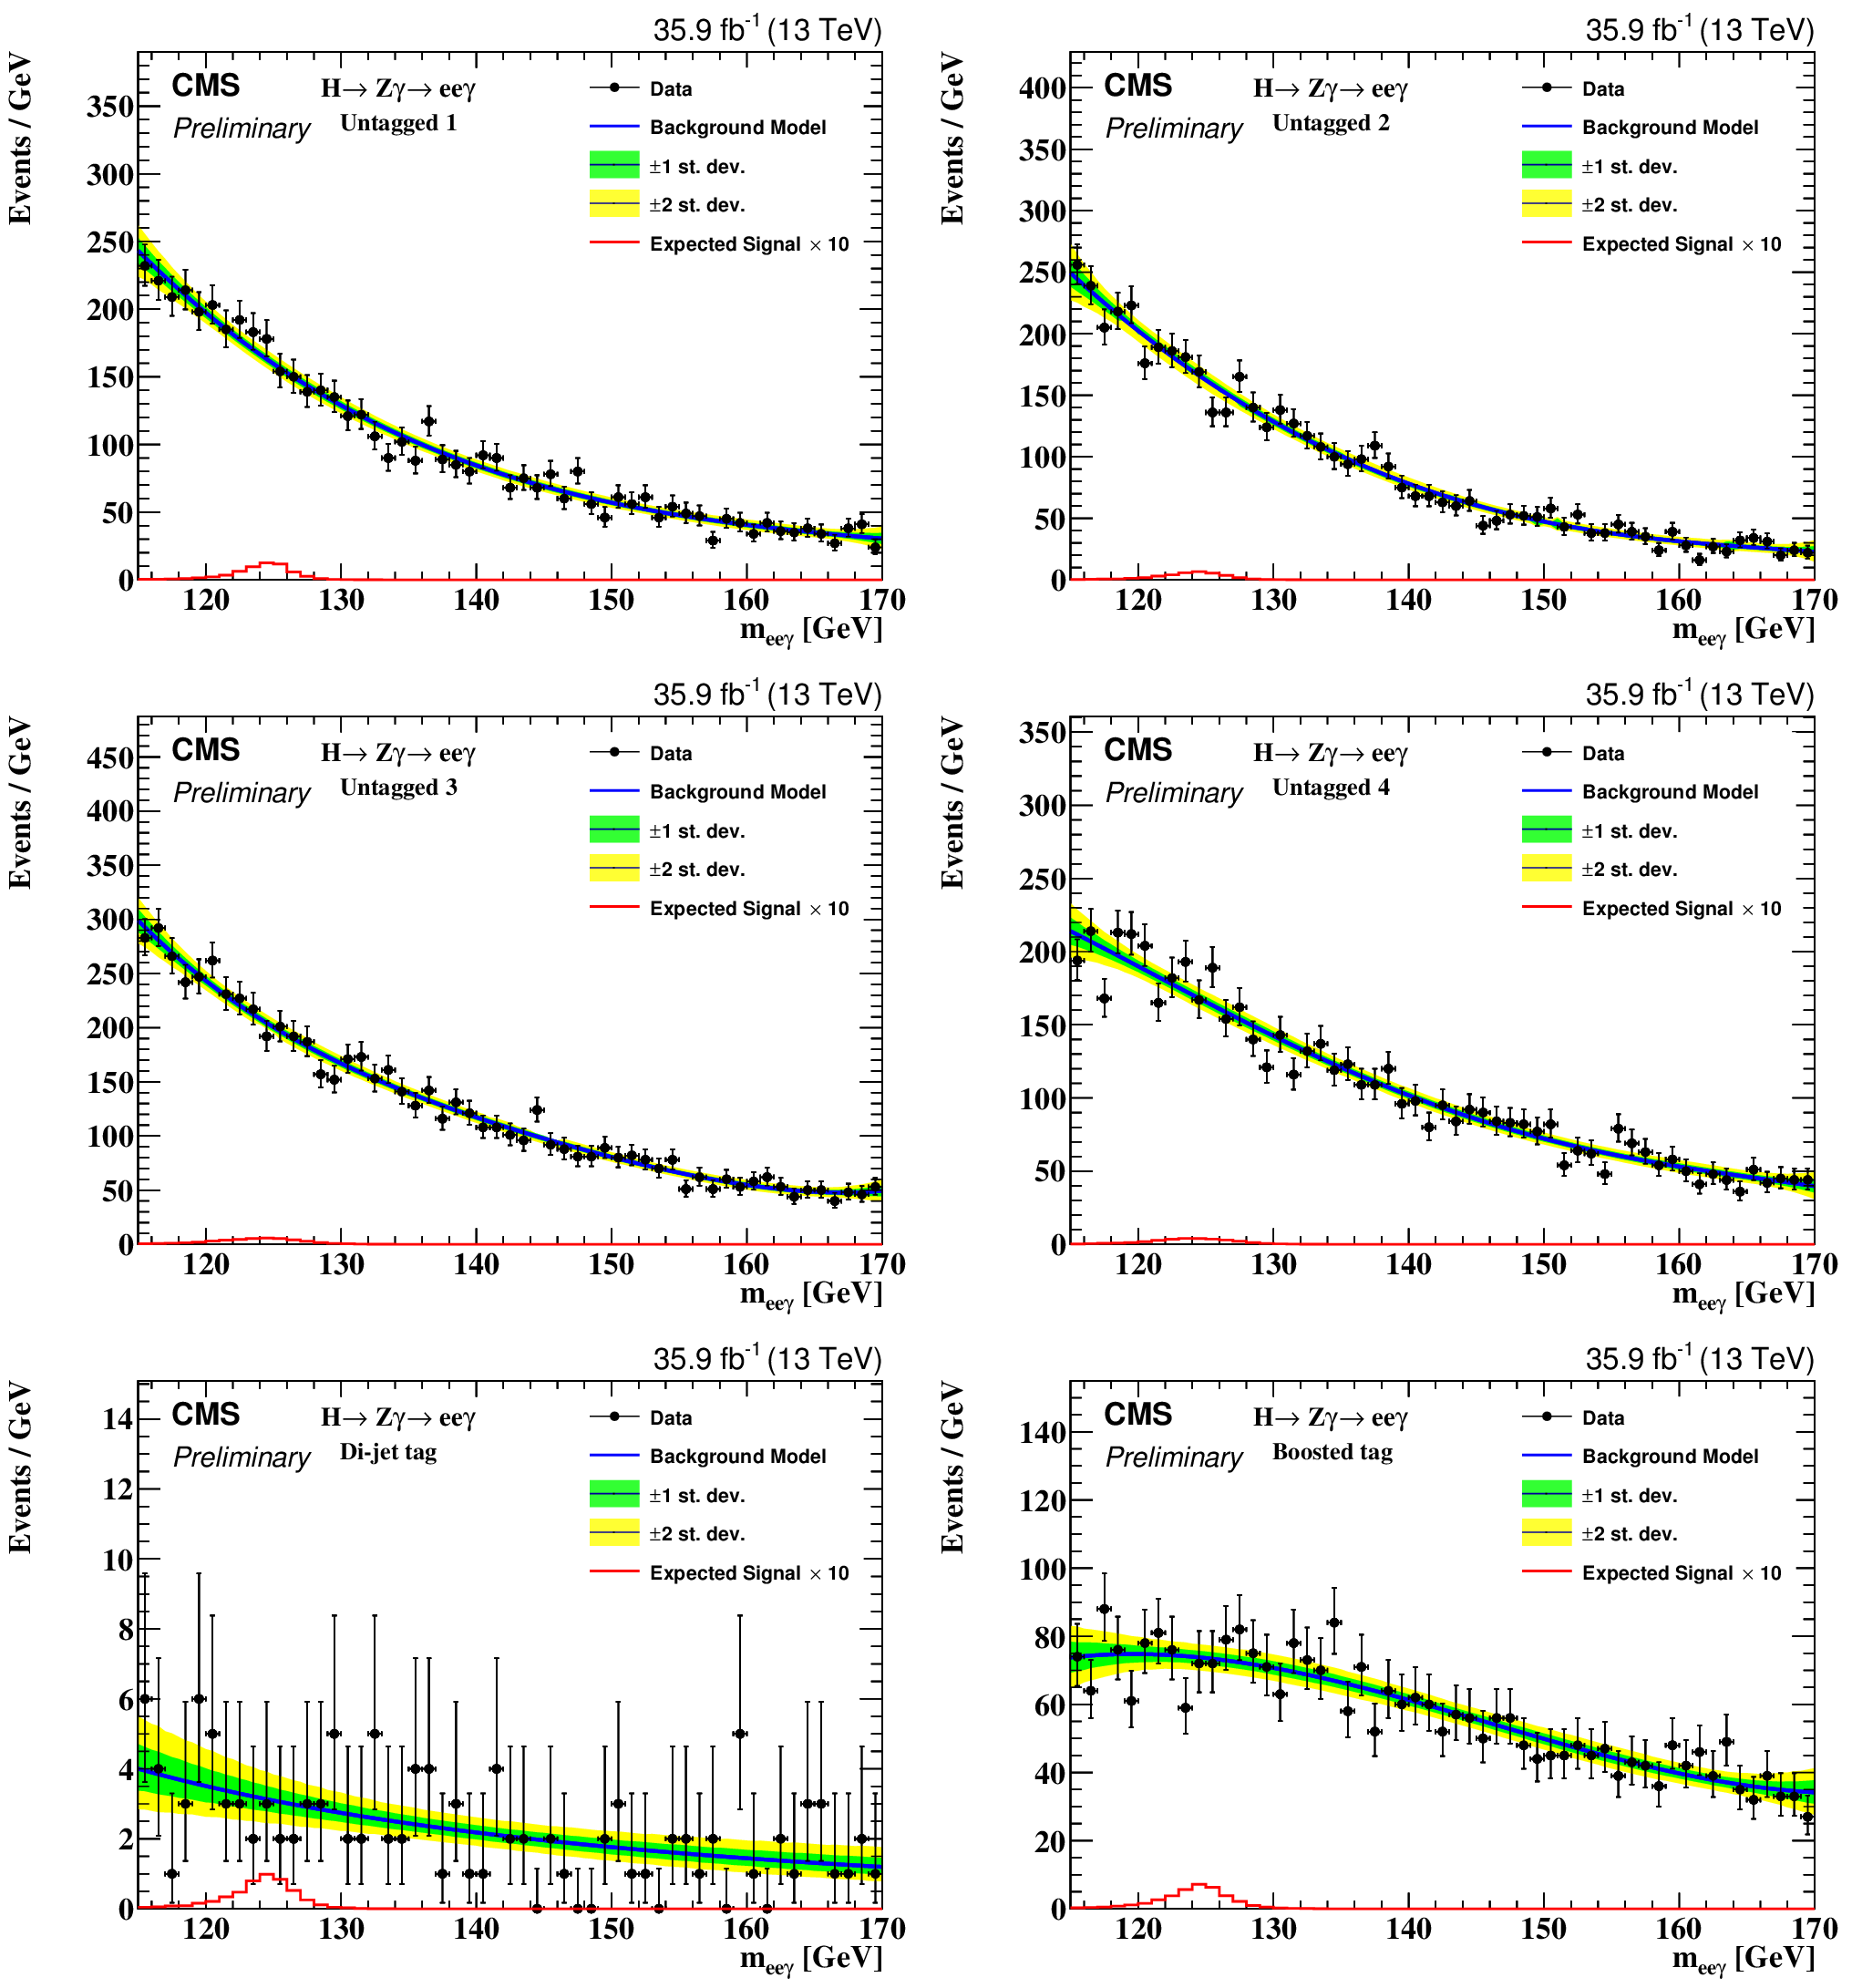
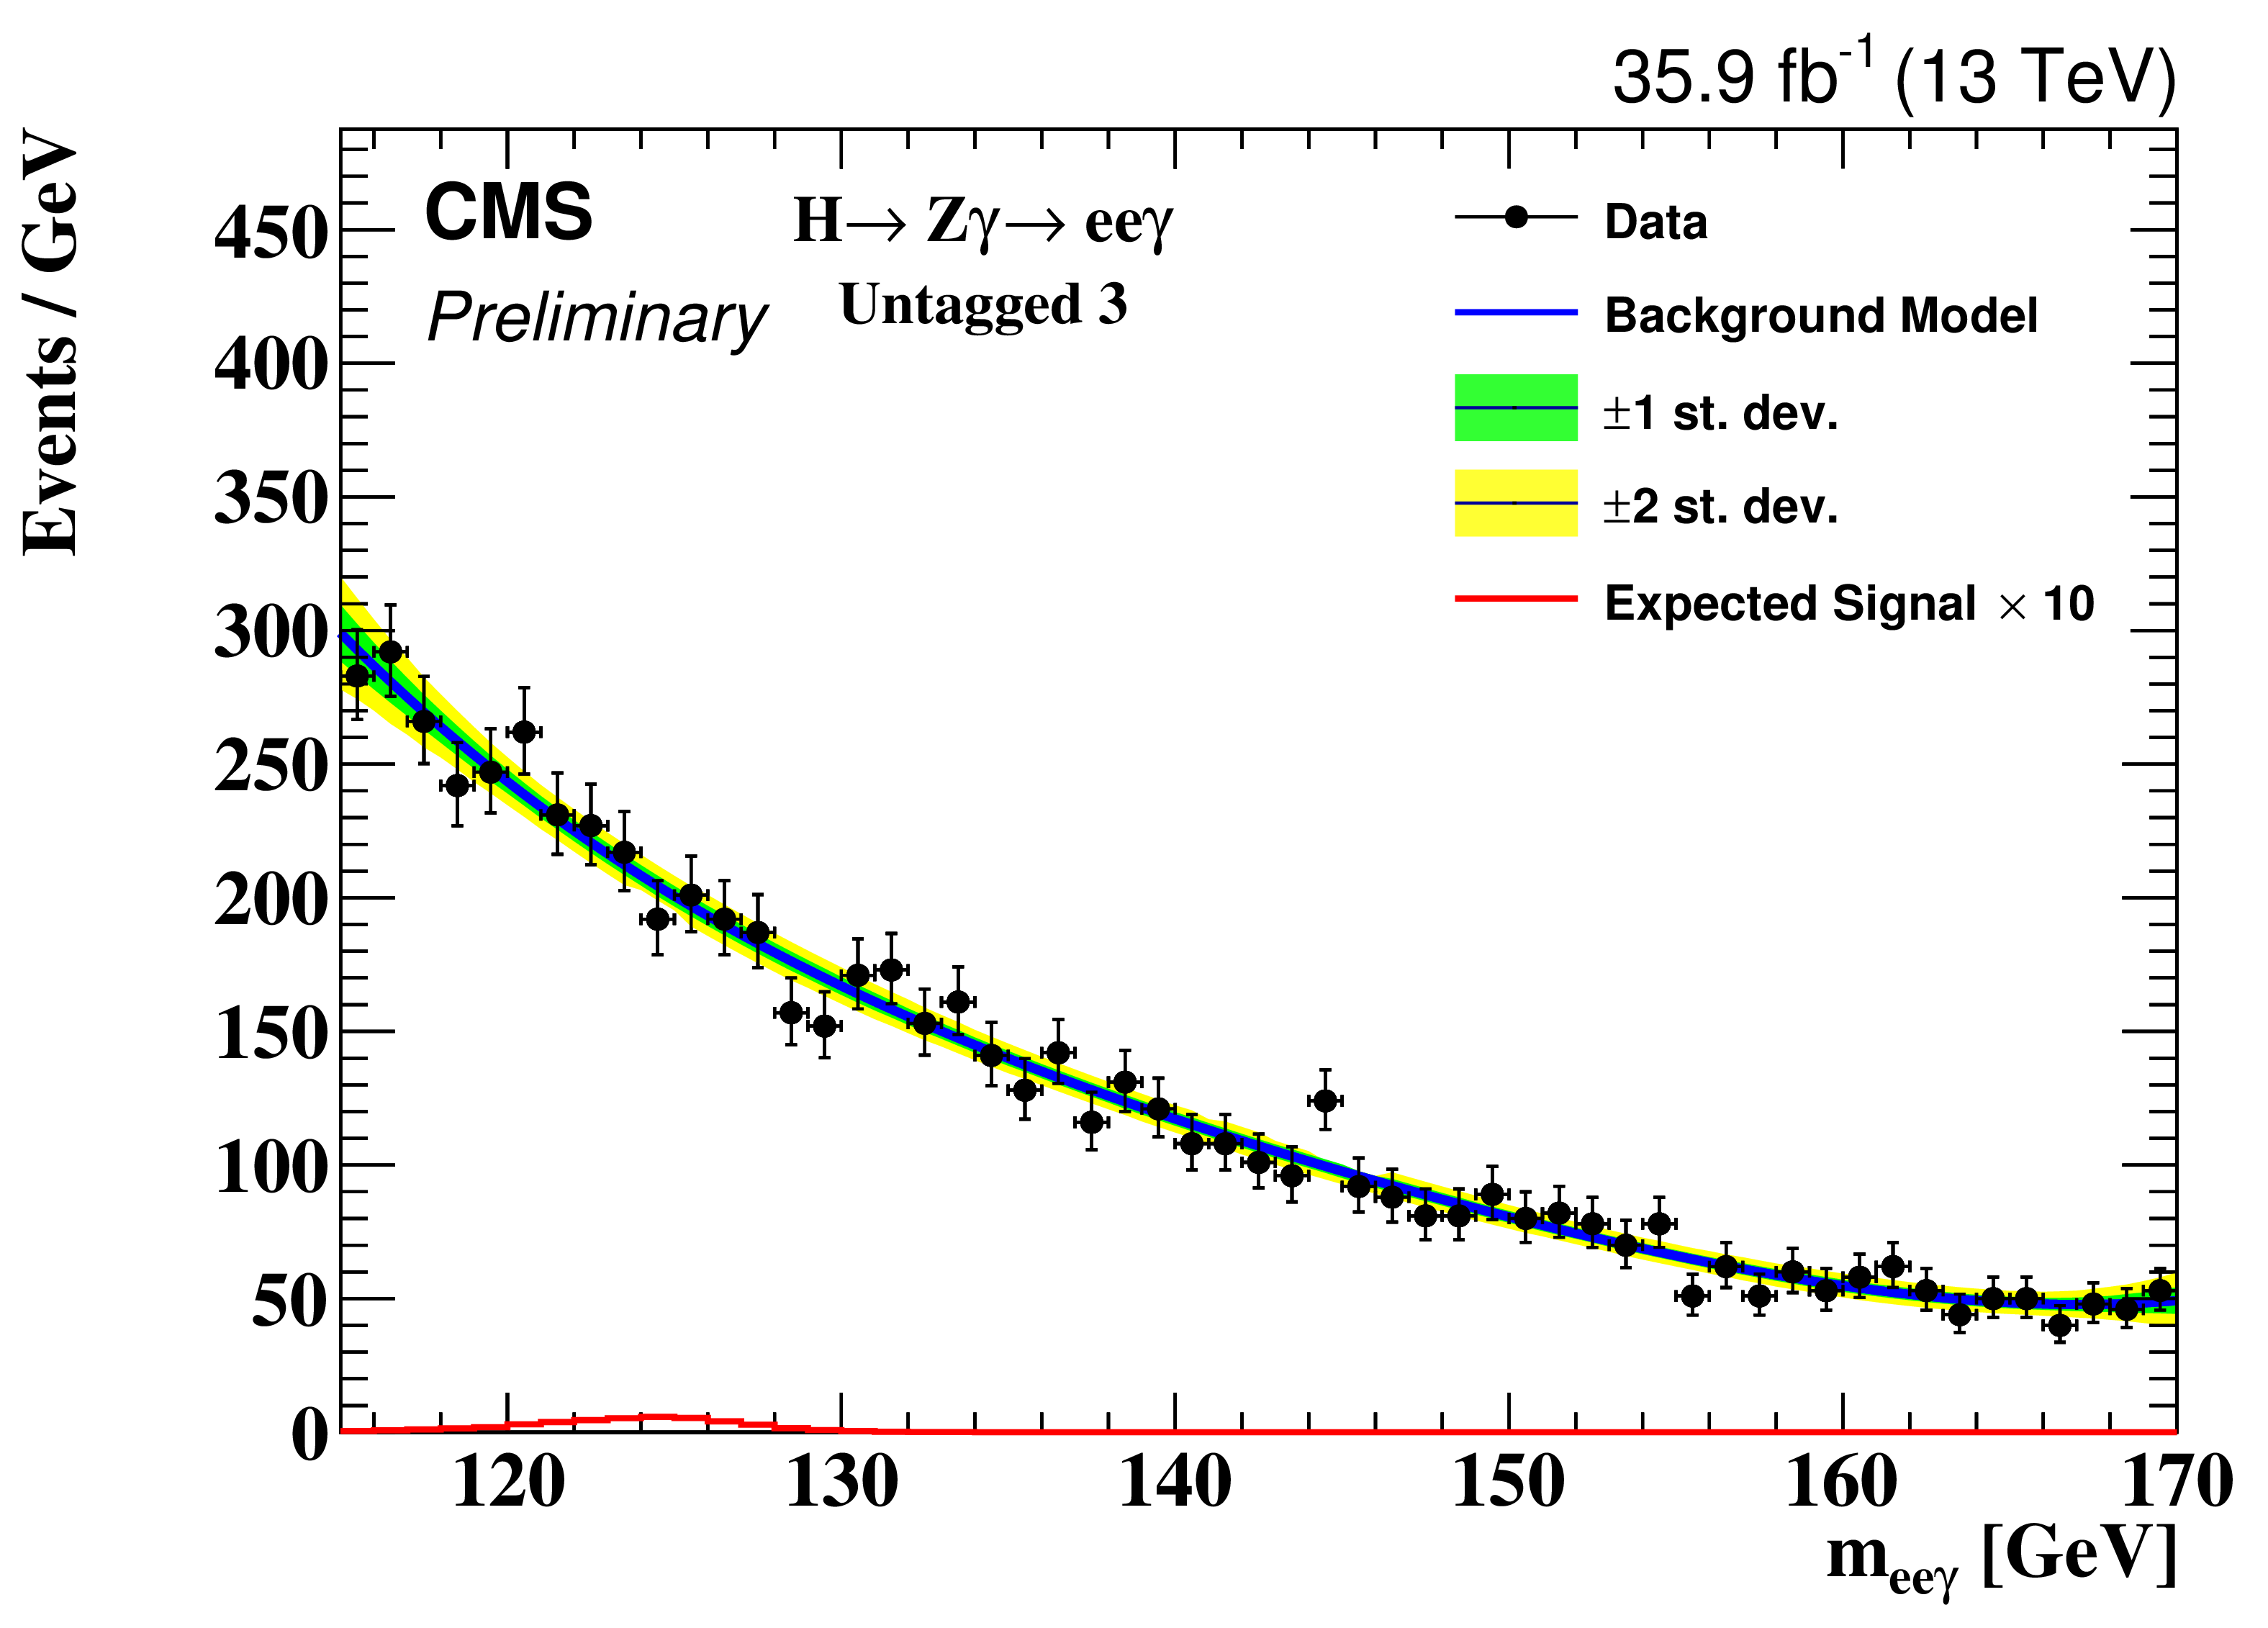
Figure 3:
Background model fit to the $m_{{\mathrm {e}} {\mathrm {e}}\gamma}$ distribution for untagged 1 (top left), untagged 2 (top right), untagged 3 (middle left), untagged 4 (middle right), di-jet tagged (bottom left) and boosted tag (bottom right) for the $ {\mathrm {H}} \to {\mathrm {Z}}\gamma \to {\mathrm {e}} {\mathrm {e}}\gamma $ selection. The green and yellow bands represent the 68% and 95% uncertainties in the fit to the data. |
png pdf |
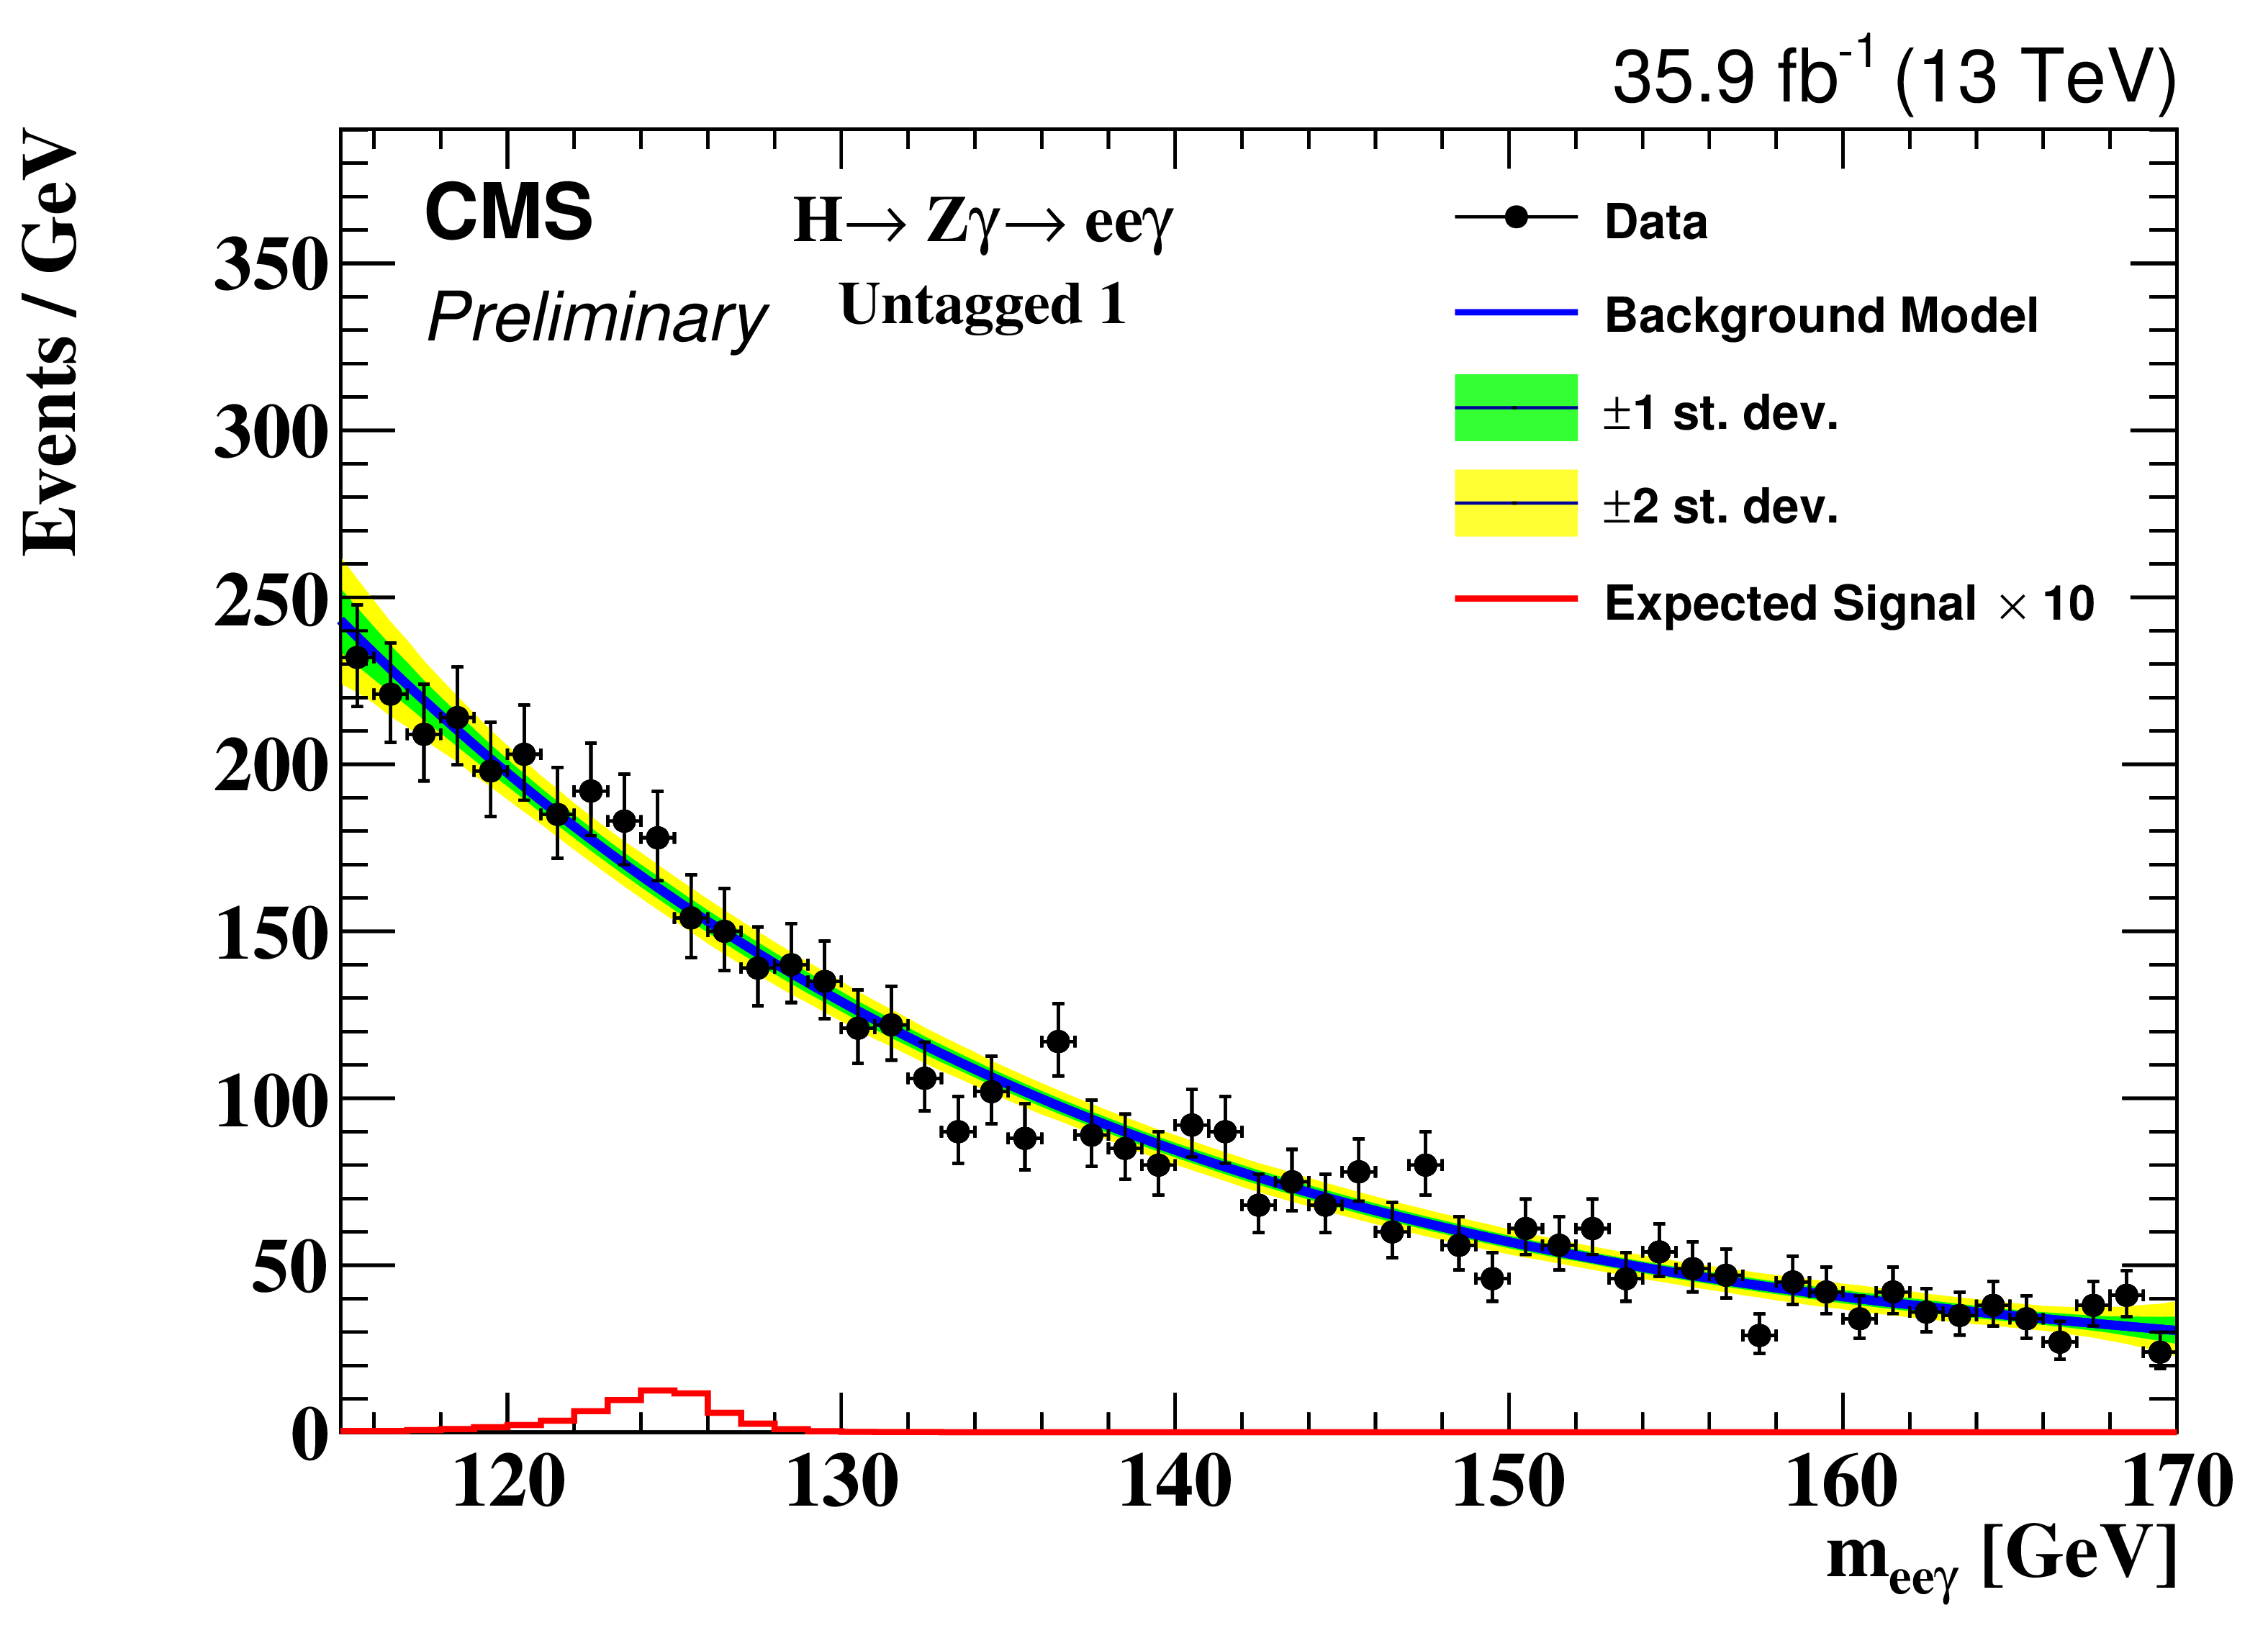
Figure 3-a:
Background model fit to the $m_{{\mathrm {e}} {\mathrm {e}}\gamma}$ distribution for untagged 1 for the $ {\mathrm {H}} \to {\mathrm {Z}}\gamma \to {\mathrm {e}} {\mathrm {e}}\gamma $ selection. The green and yellow bands represent the 68% and 95% uncertainties in the fit to the data. |
png pdf |
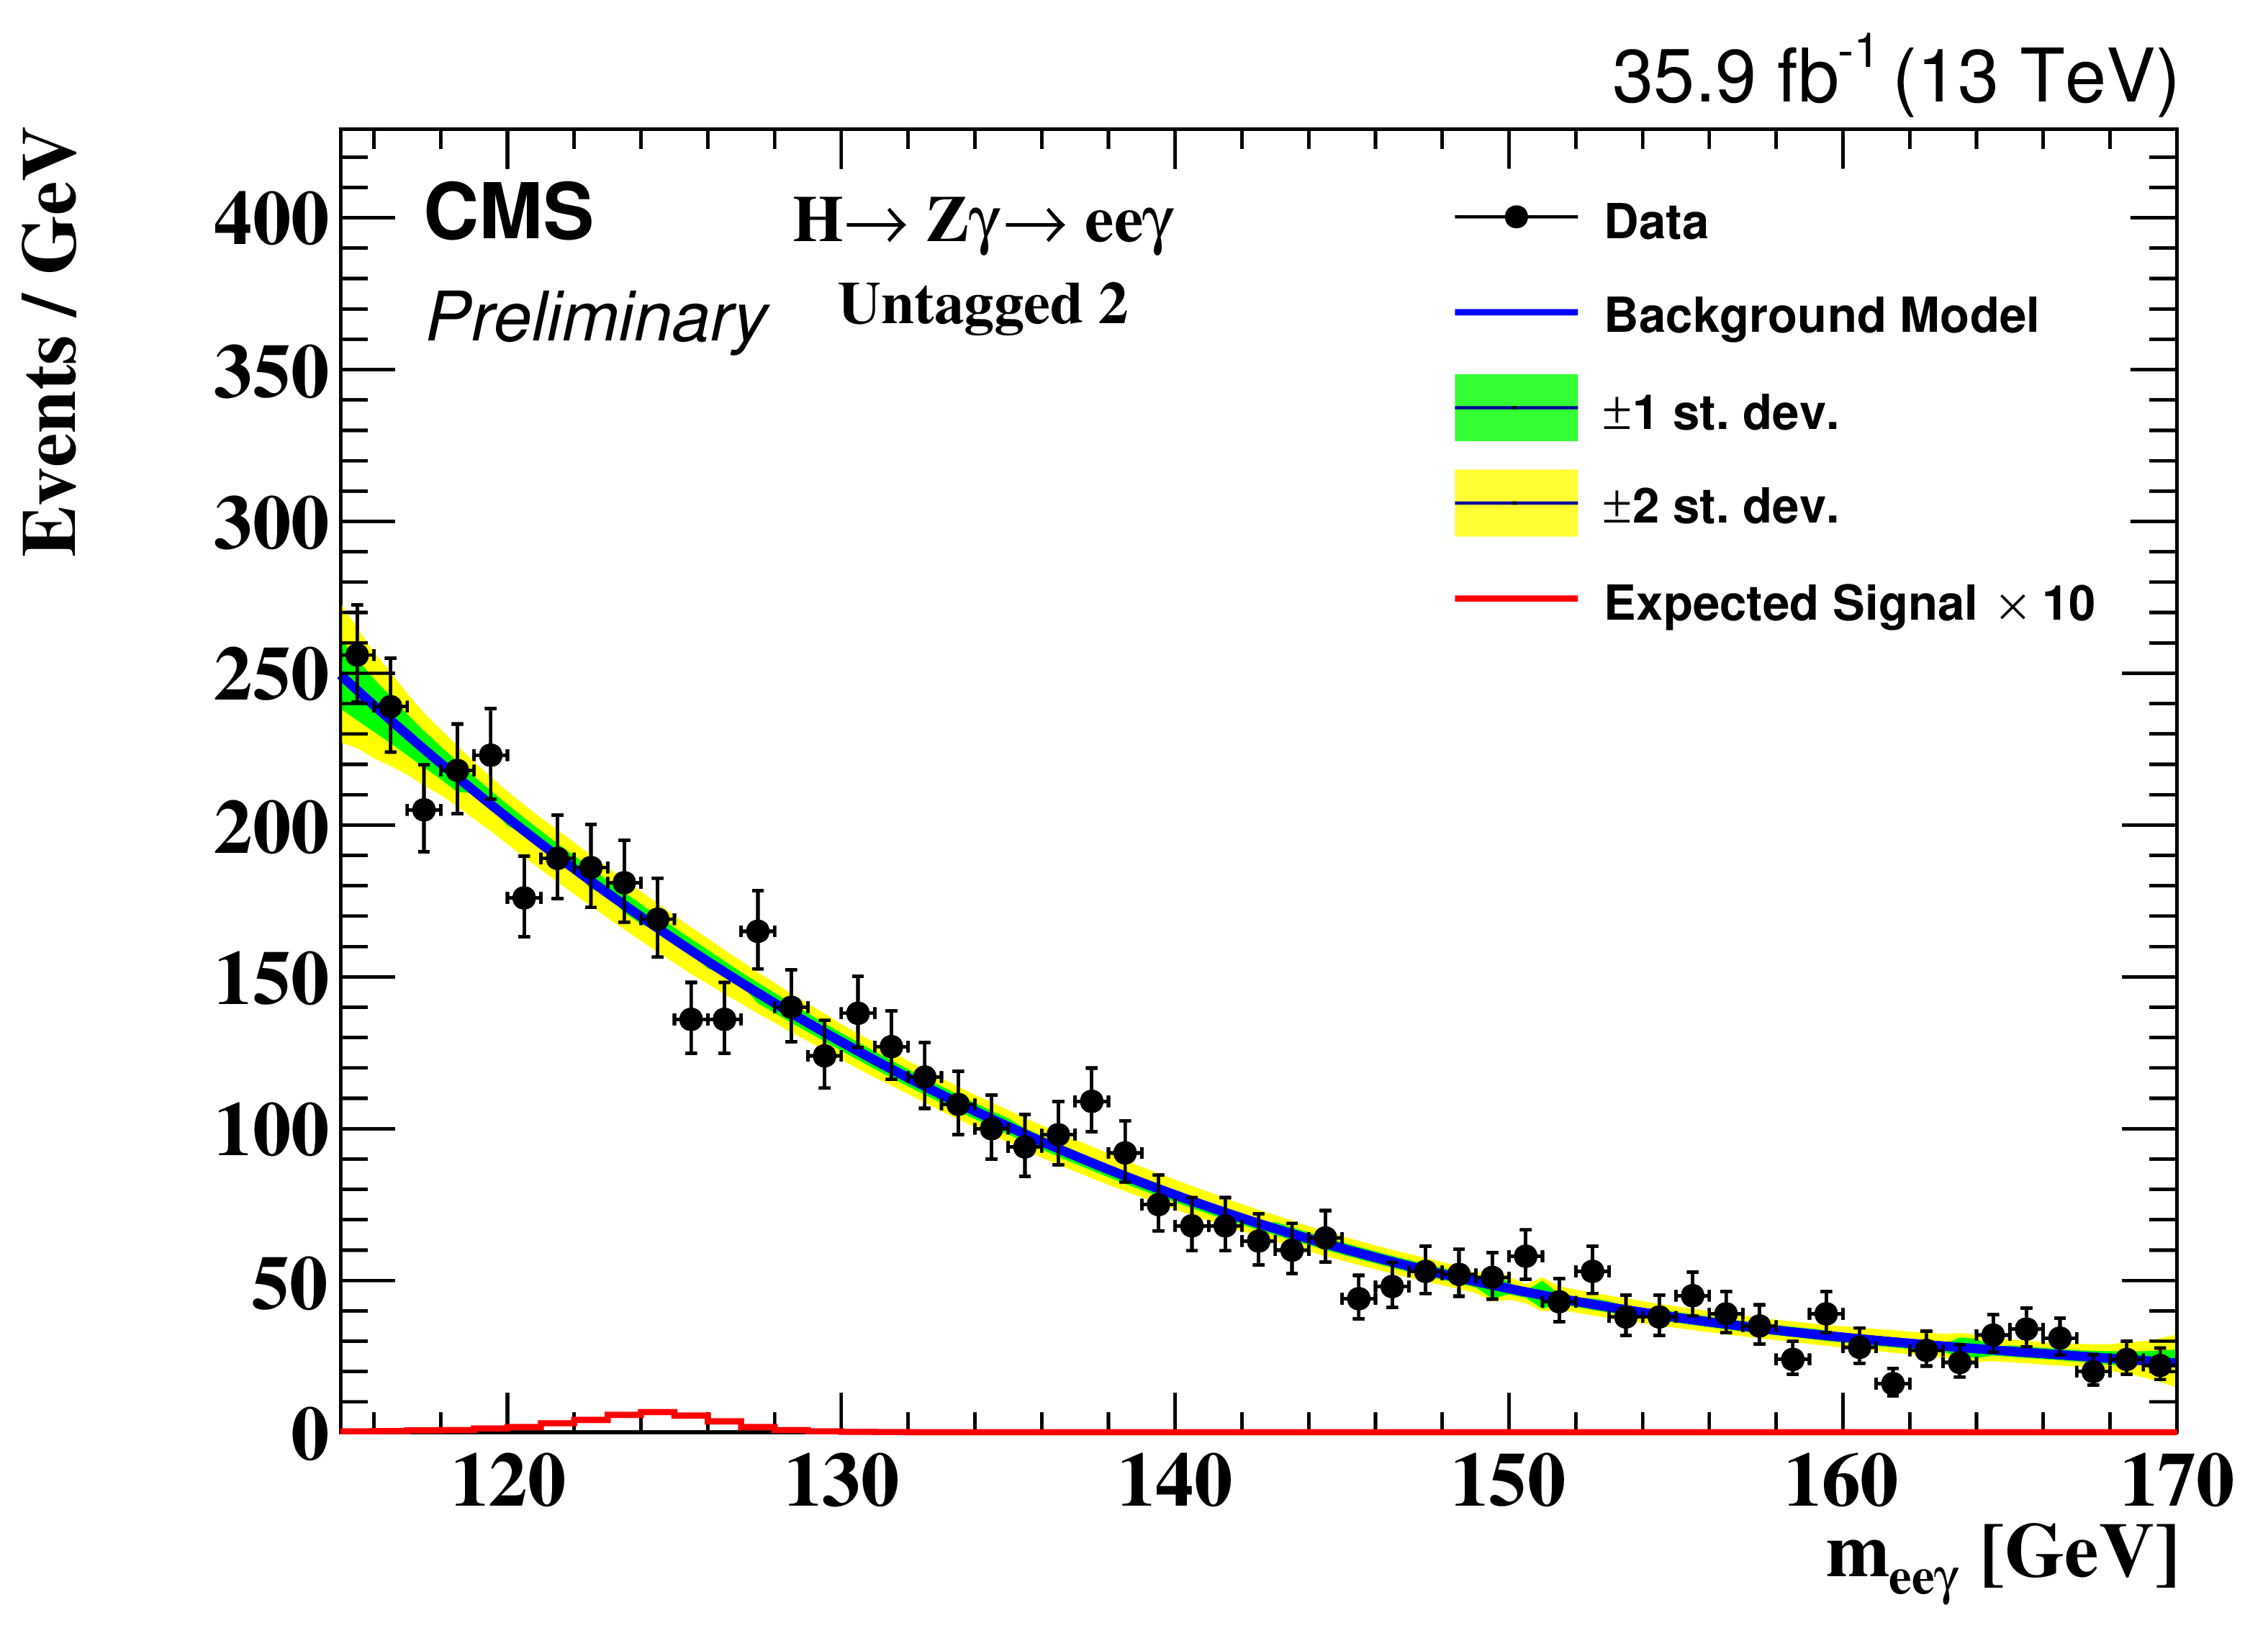
Figure 3-b:
Background model fit to the $m_{{\mathrm {e}} {\mathrm {e}}\gamma}$ distribution for untagged 2 for the $ {\mathrm {H}} \to {\mathrm {Z}}\gamma \to {\mathrm {e}} {\mathrm {e}}\gamma $ selection. The green and yellow bands represent the 68% and 95% uncertainties in the fit to the data. |
png pdf |
Figure 3-c:
Background model fit to the $m_{{\mathrm {e}} {\mathrm {e}}\gamma}$ distribution for untagged 3 for the $ {\mathrm {H}} \to {\mathrm {Z}}\gamma \to {\mathrm {e}} {\mathrm {e}}\gamma $ selection. The green and yellow bands represent the 68% and 95% uncertainties in the fit to the data. |
png pdf |
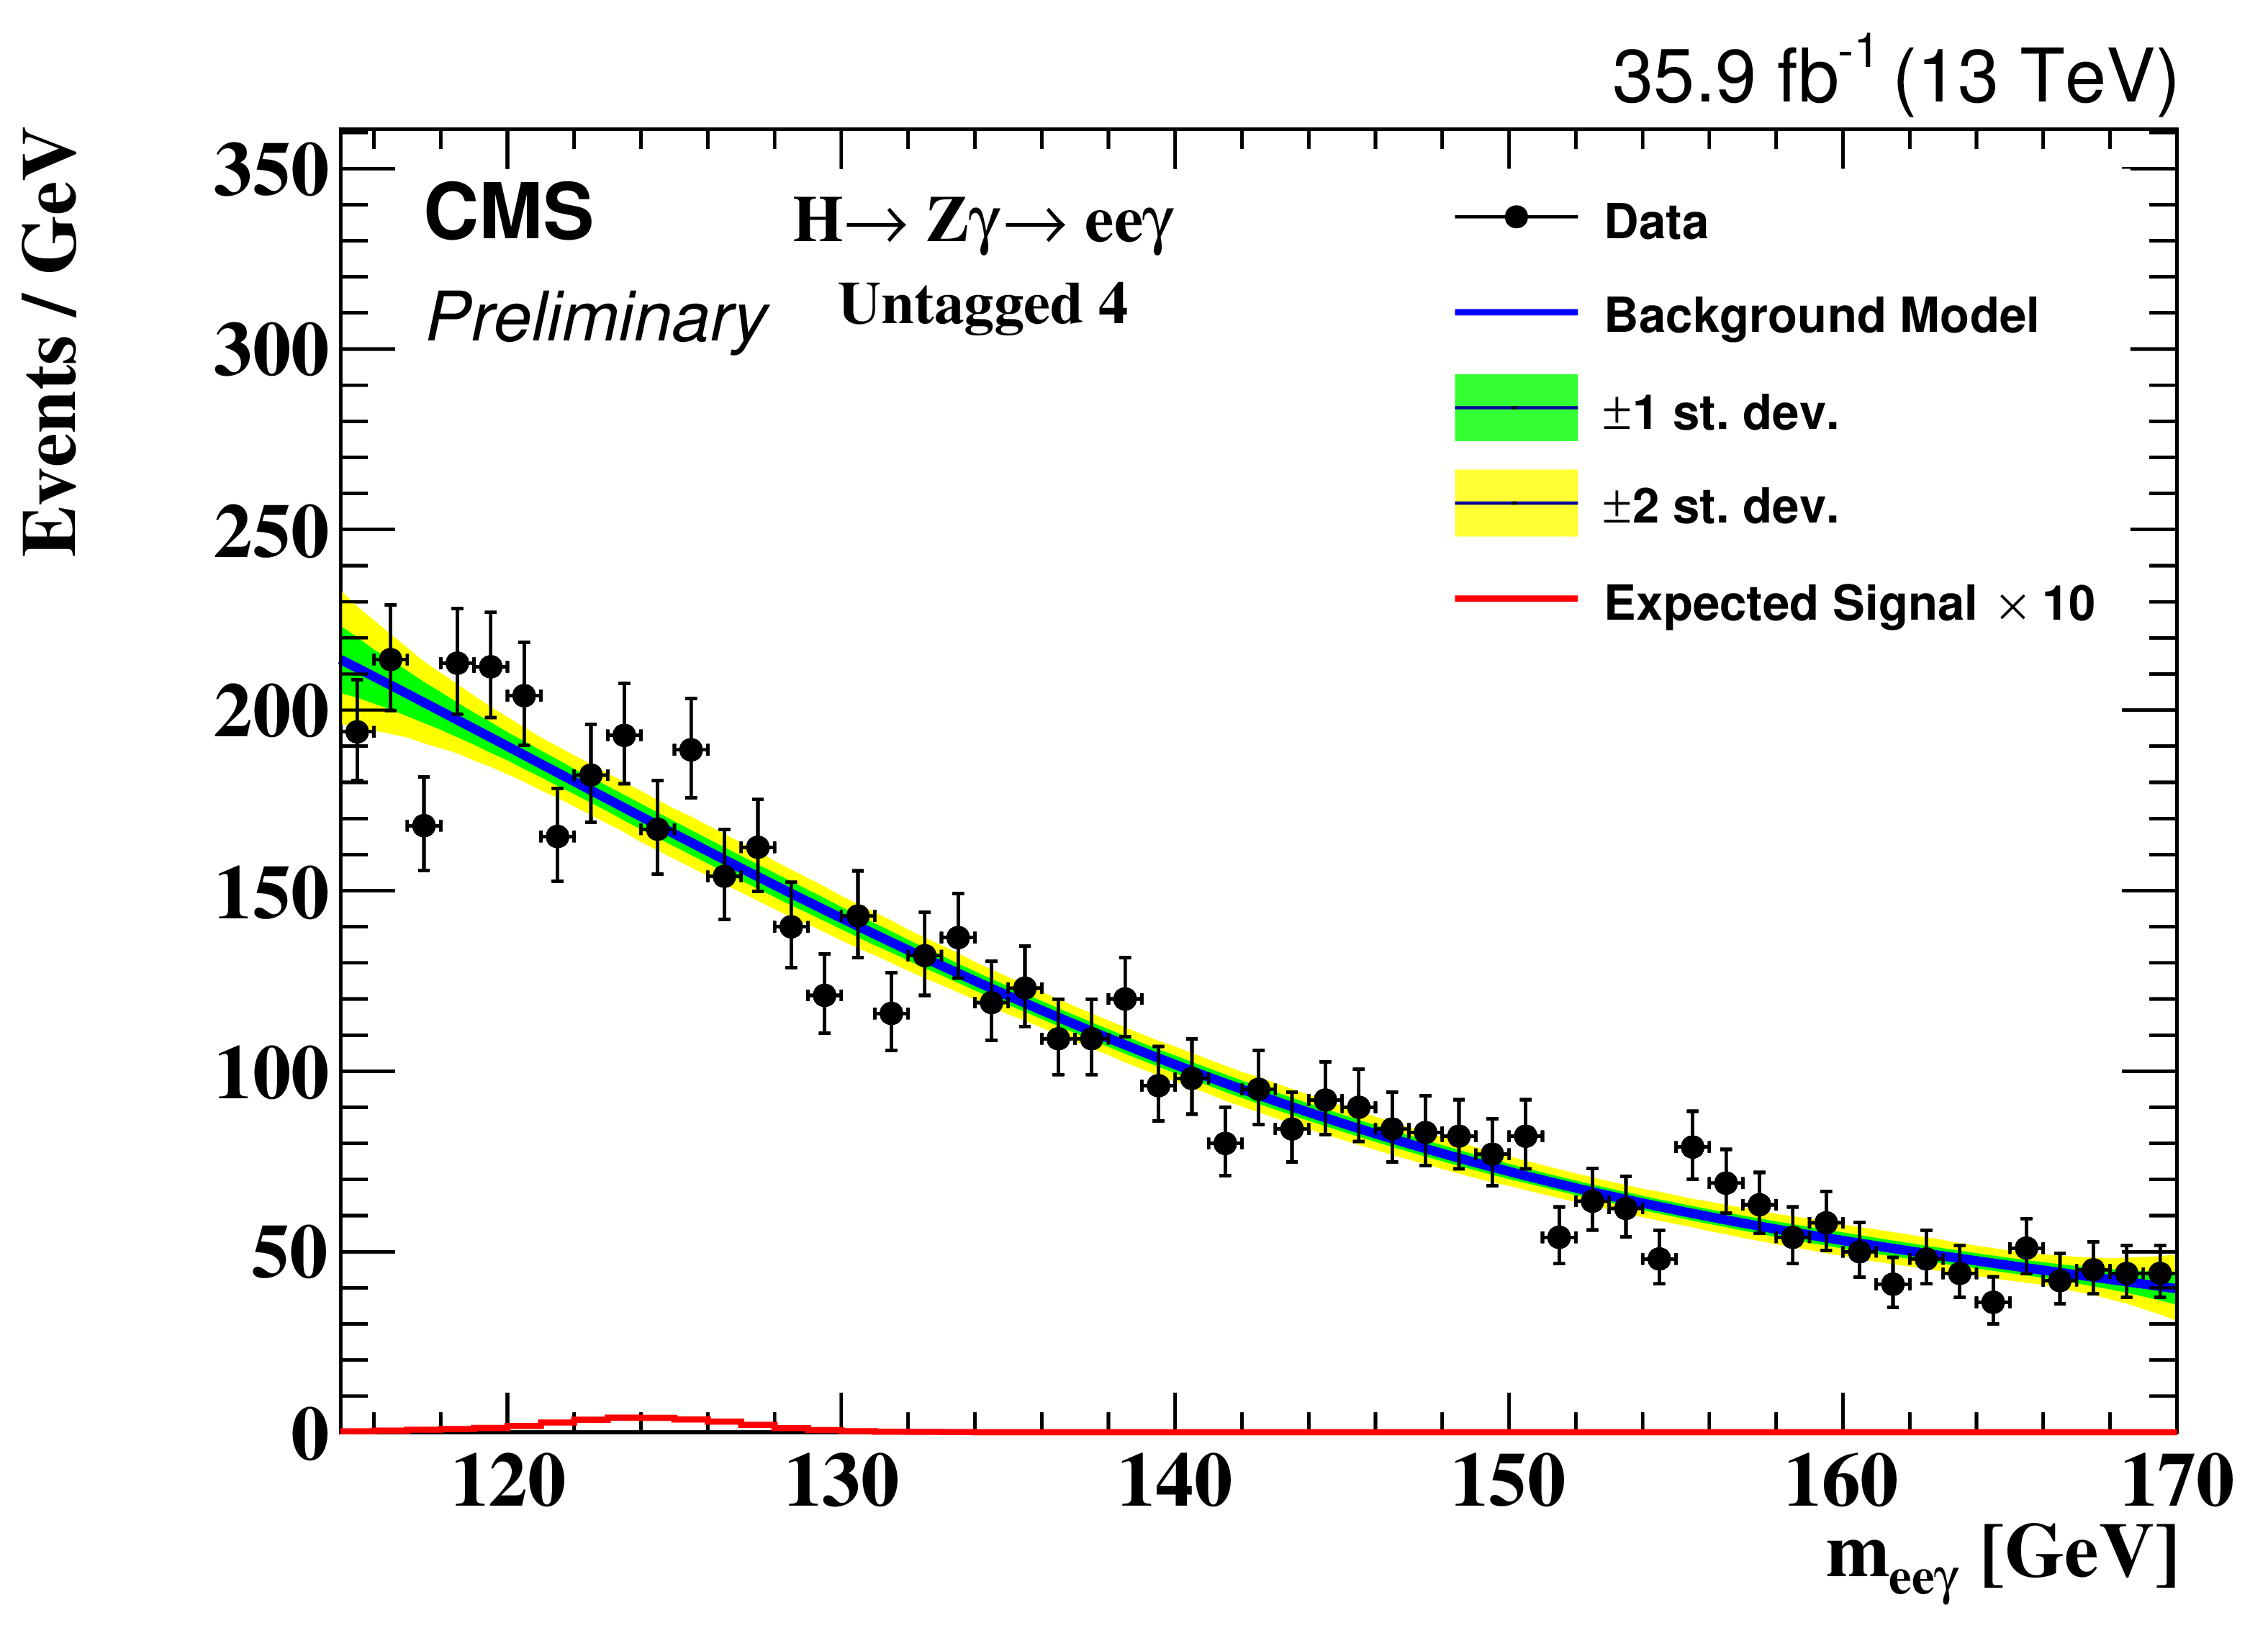
Figure 3-d:
Background model fit to the $m_{{\mathrm {e}} {\mathrm {e}}\gamma}$ distribution for untagged 4 for the $ {\mathrm {H}} \to {\mathrm {Z}}\gamma \to {\mathrm {e}} {\mathrm {e}}\gamma $ selection. The green and yellow bands represent the 68% and 95% uncertainties in the fit to the data. |
png pdf |
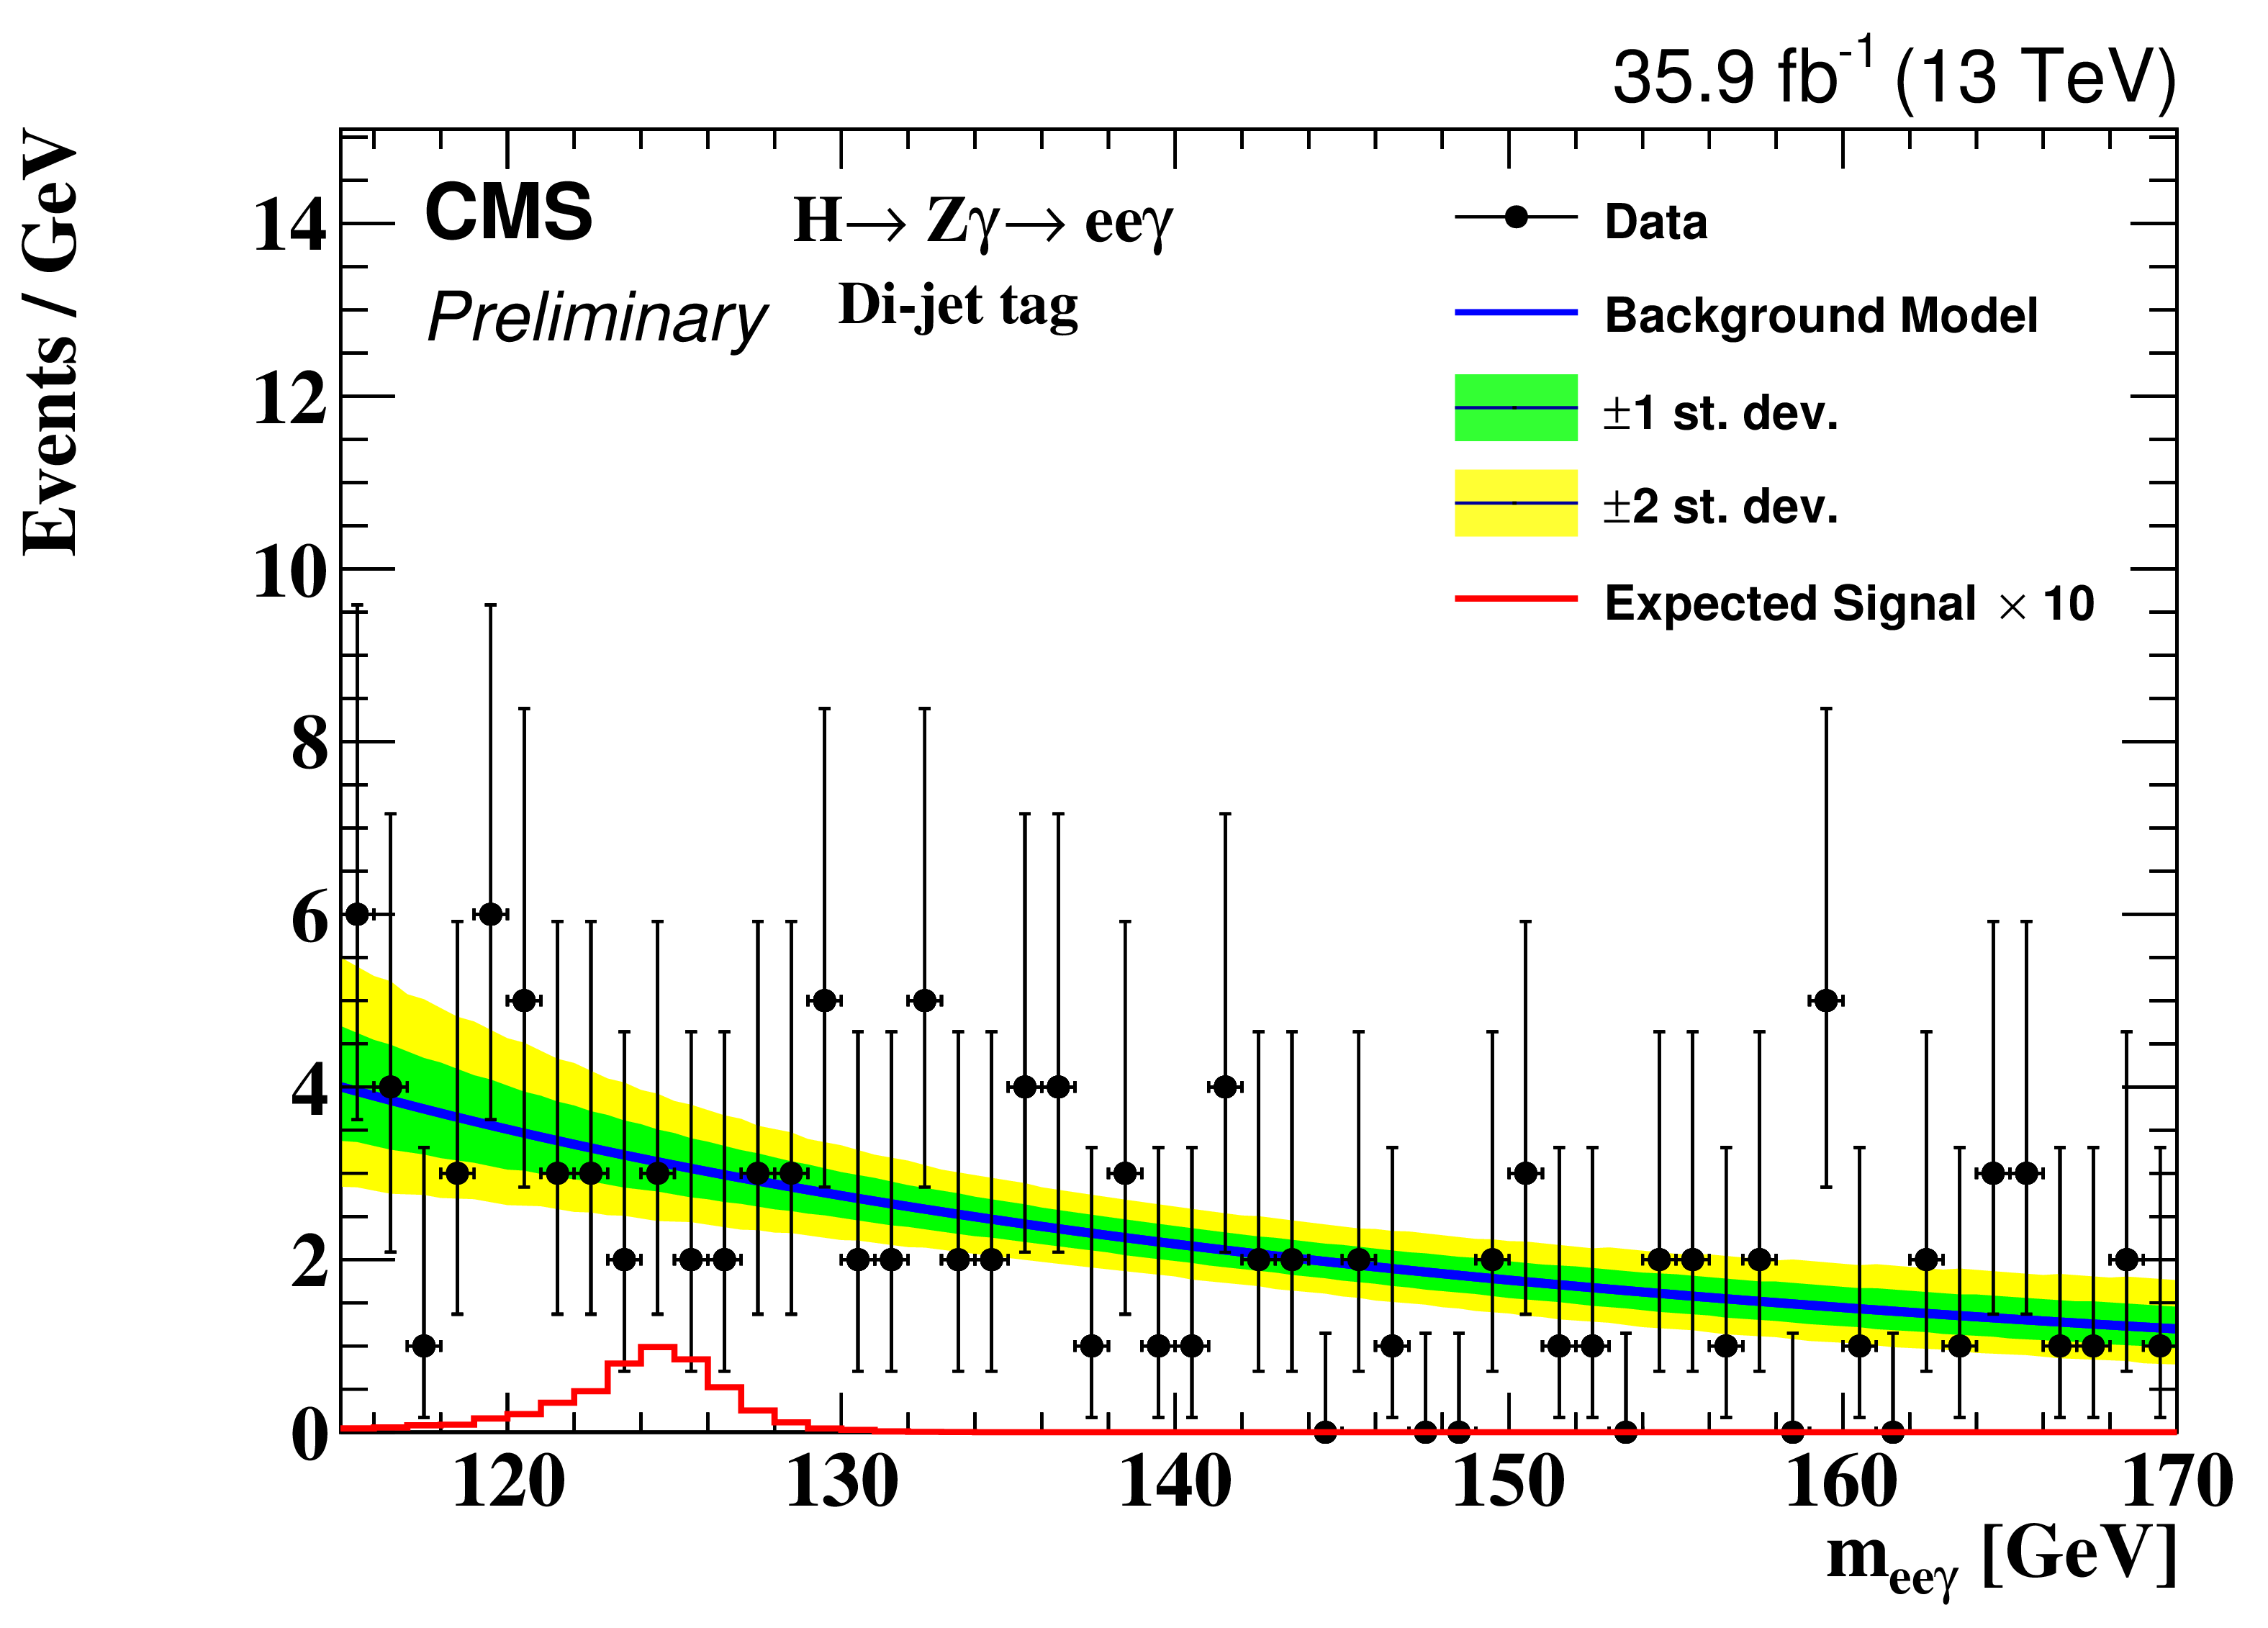
Figure 3-e:
Background model fit to the $m_{{\mathrm {e}} {\mathrm {e}}\gamma}$ distribution for di-jet tag for the $ {\mathrm {H}} \to {\mathrm {Z}}\gamma \to {\mathrm {e}} {\mathrm {e}}\gamma $ selection. The green and yellow bands represent the 68% and 95% uncertainties in the fit to the data. |
png pdf |
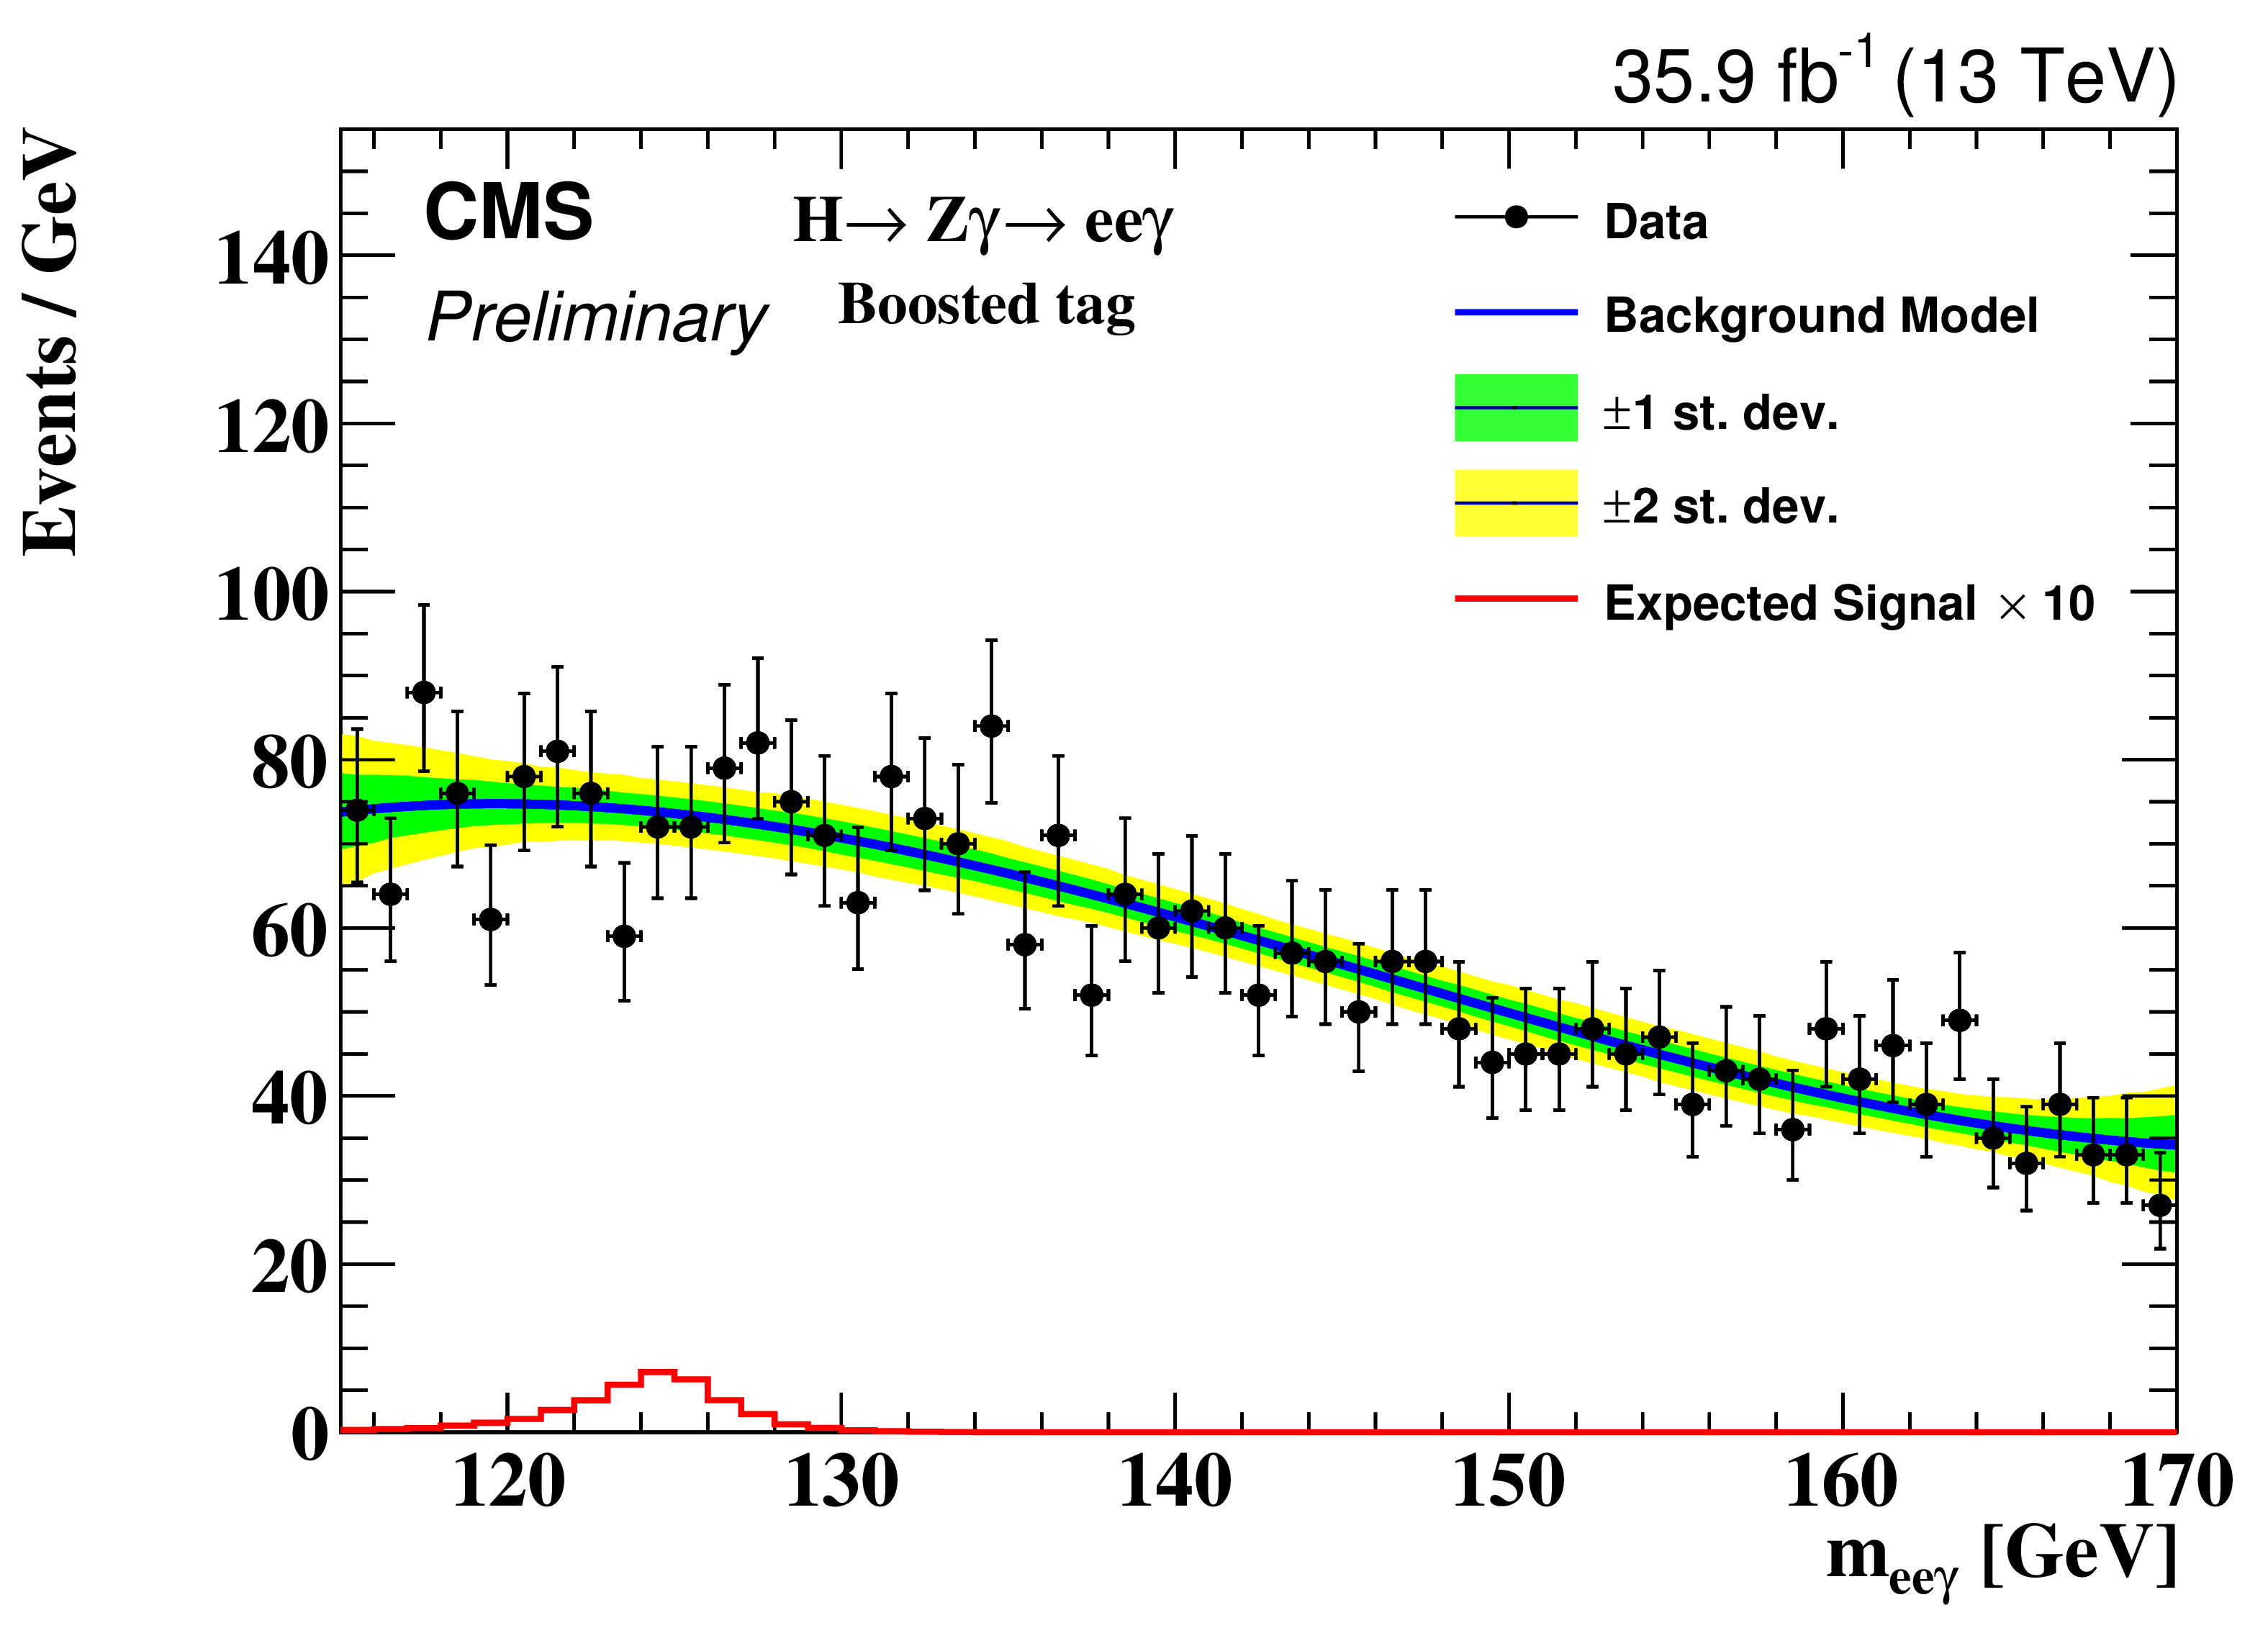
Figure 3-f:
Background model fit to the $m_{{\mathrm {e}} {\mathrm {e}}\gamma}$ distribution for boosted tag for the $ {\mathrm {H}} \to {\mathrm {Z}}\gamma \to {\mathrm {e}} {\mathrm {e}}\gamma $ selection. The green and yellow bands represent the 68% and 95% uncertainties in the fit to the data. |
png pdf |
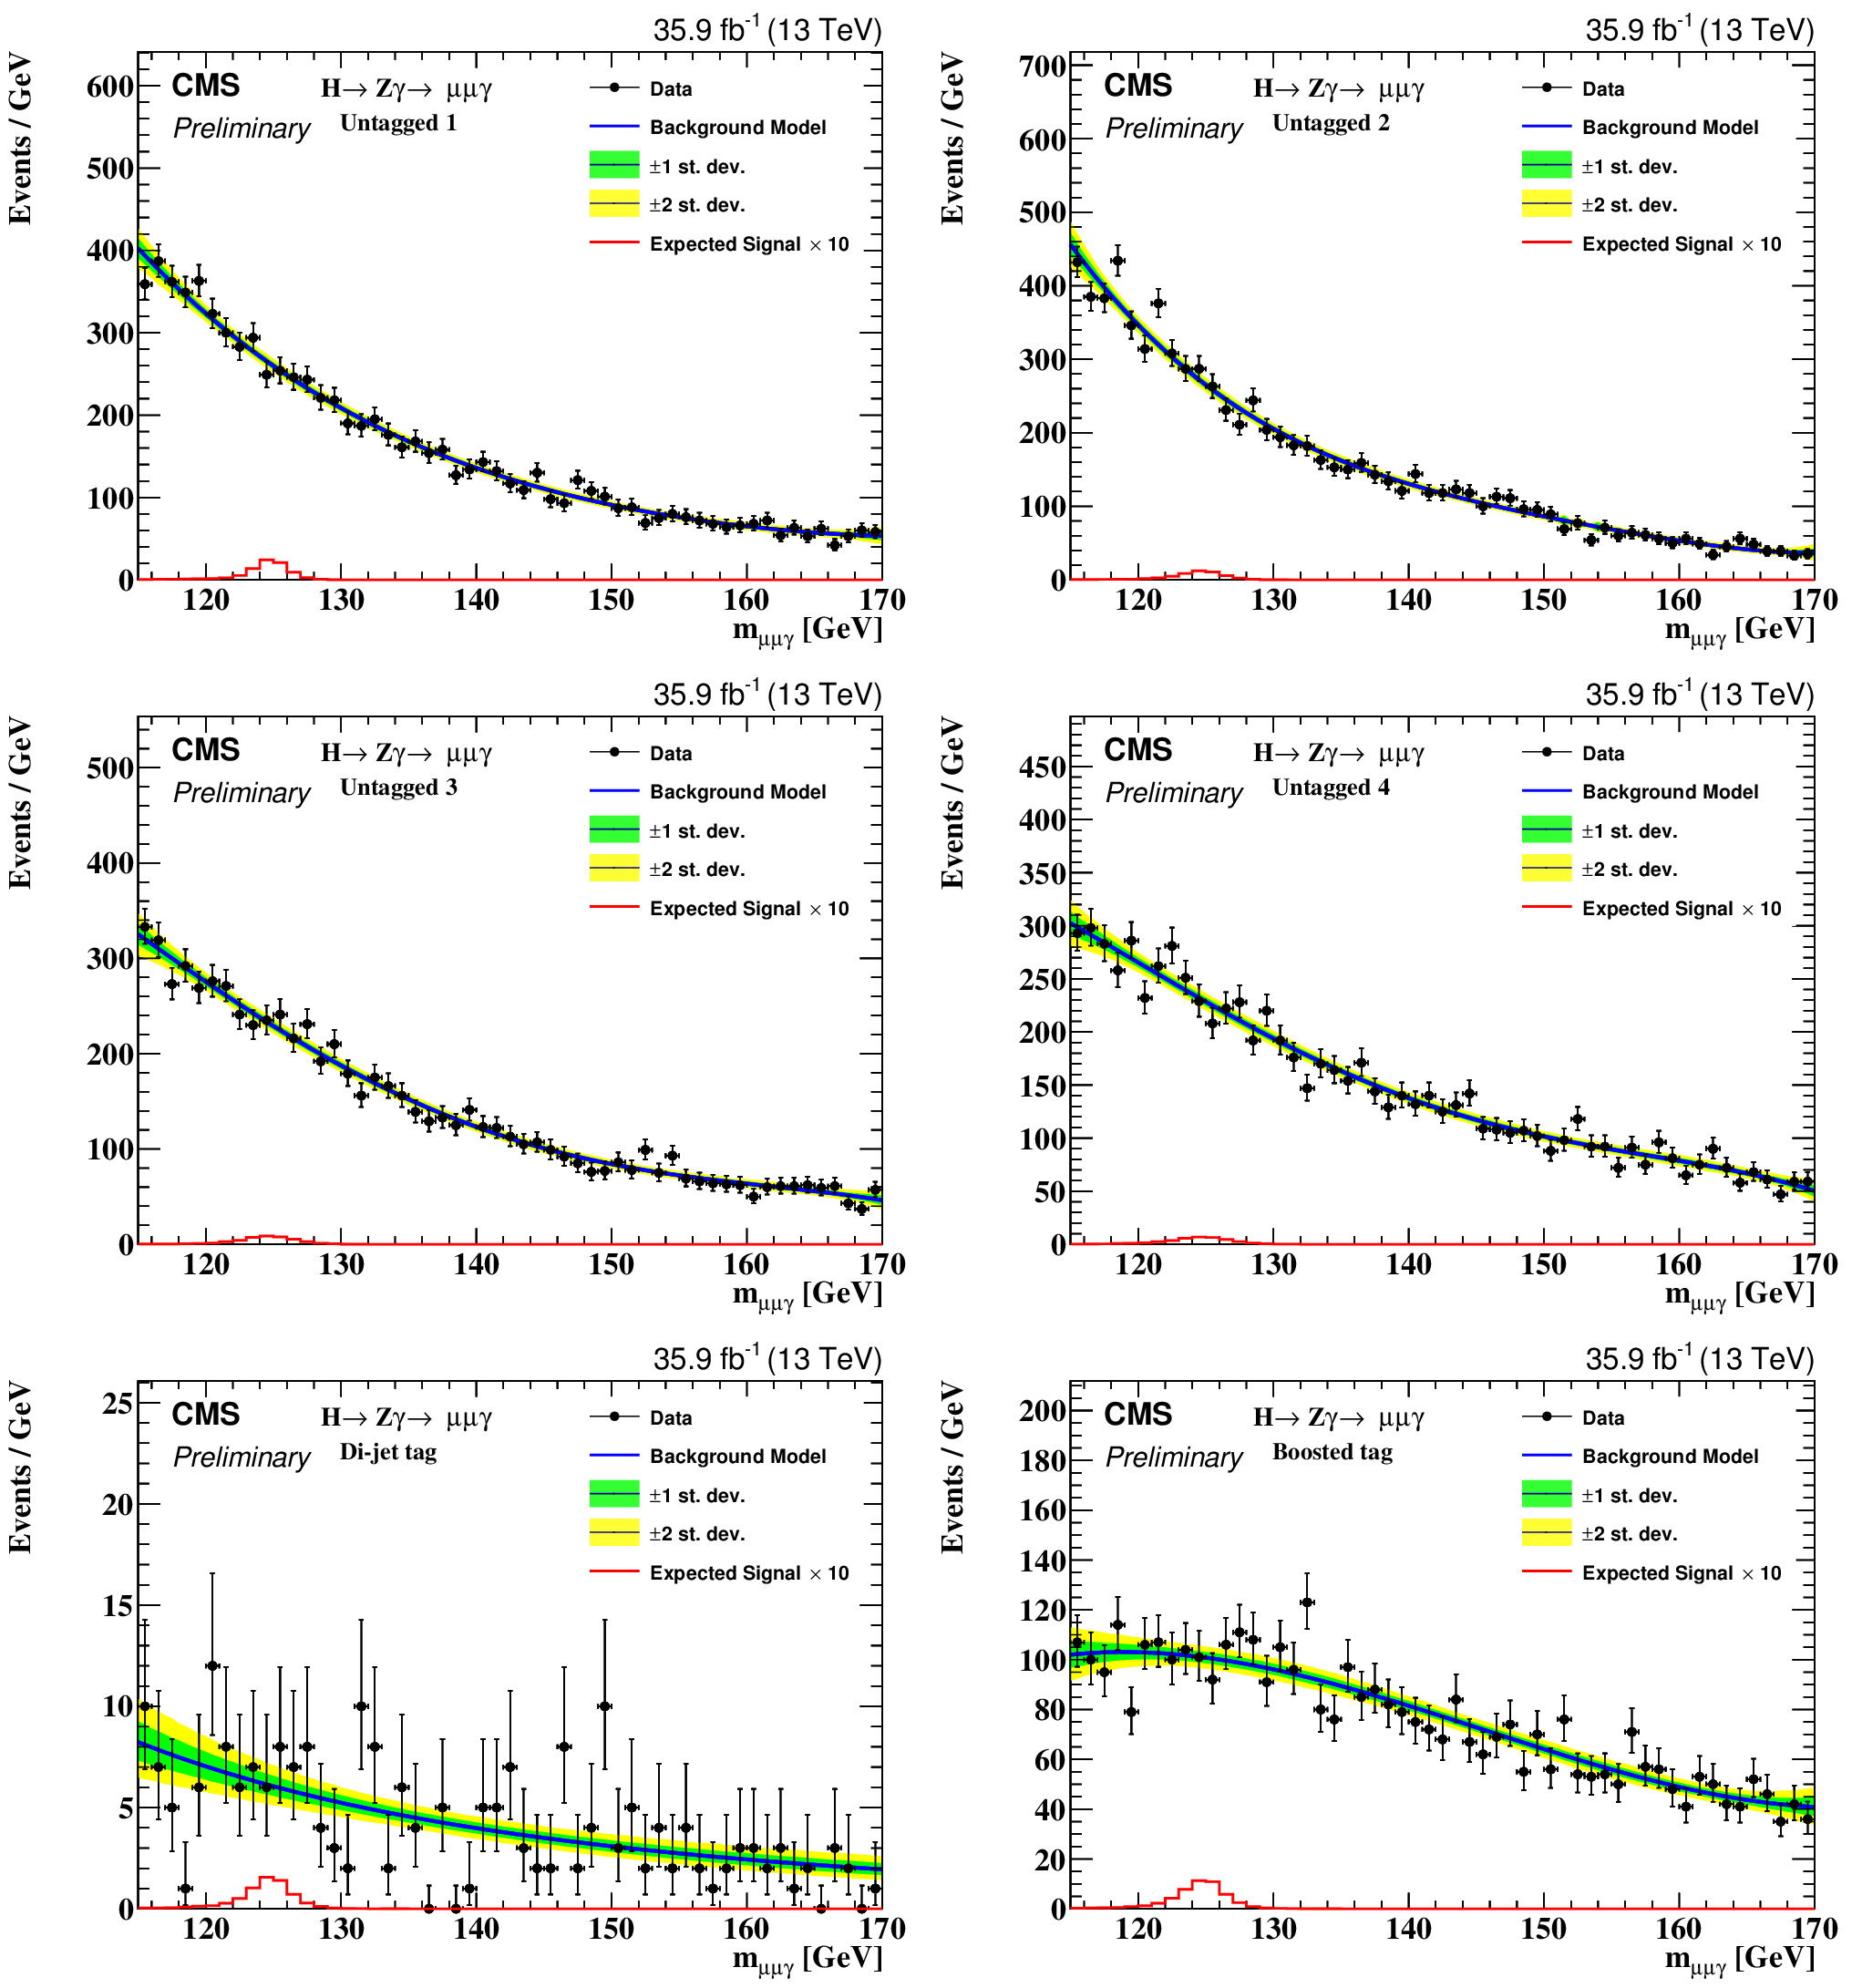
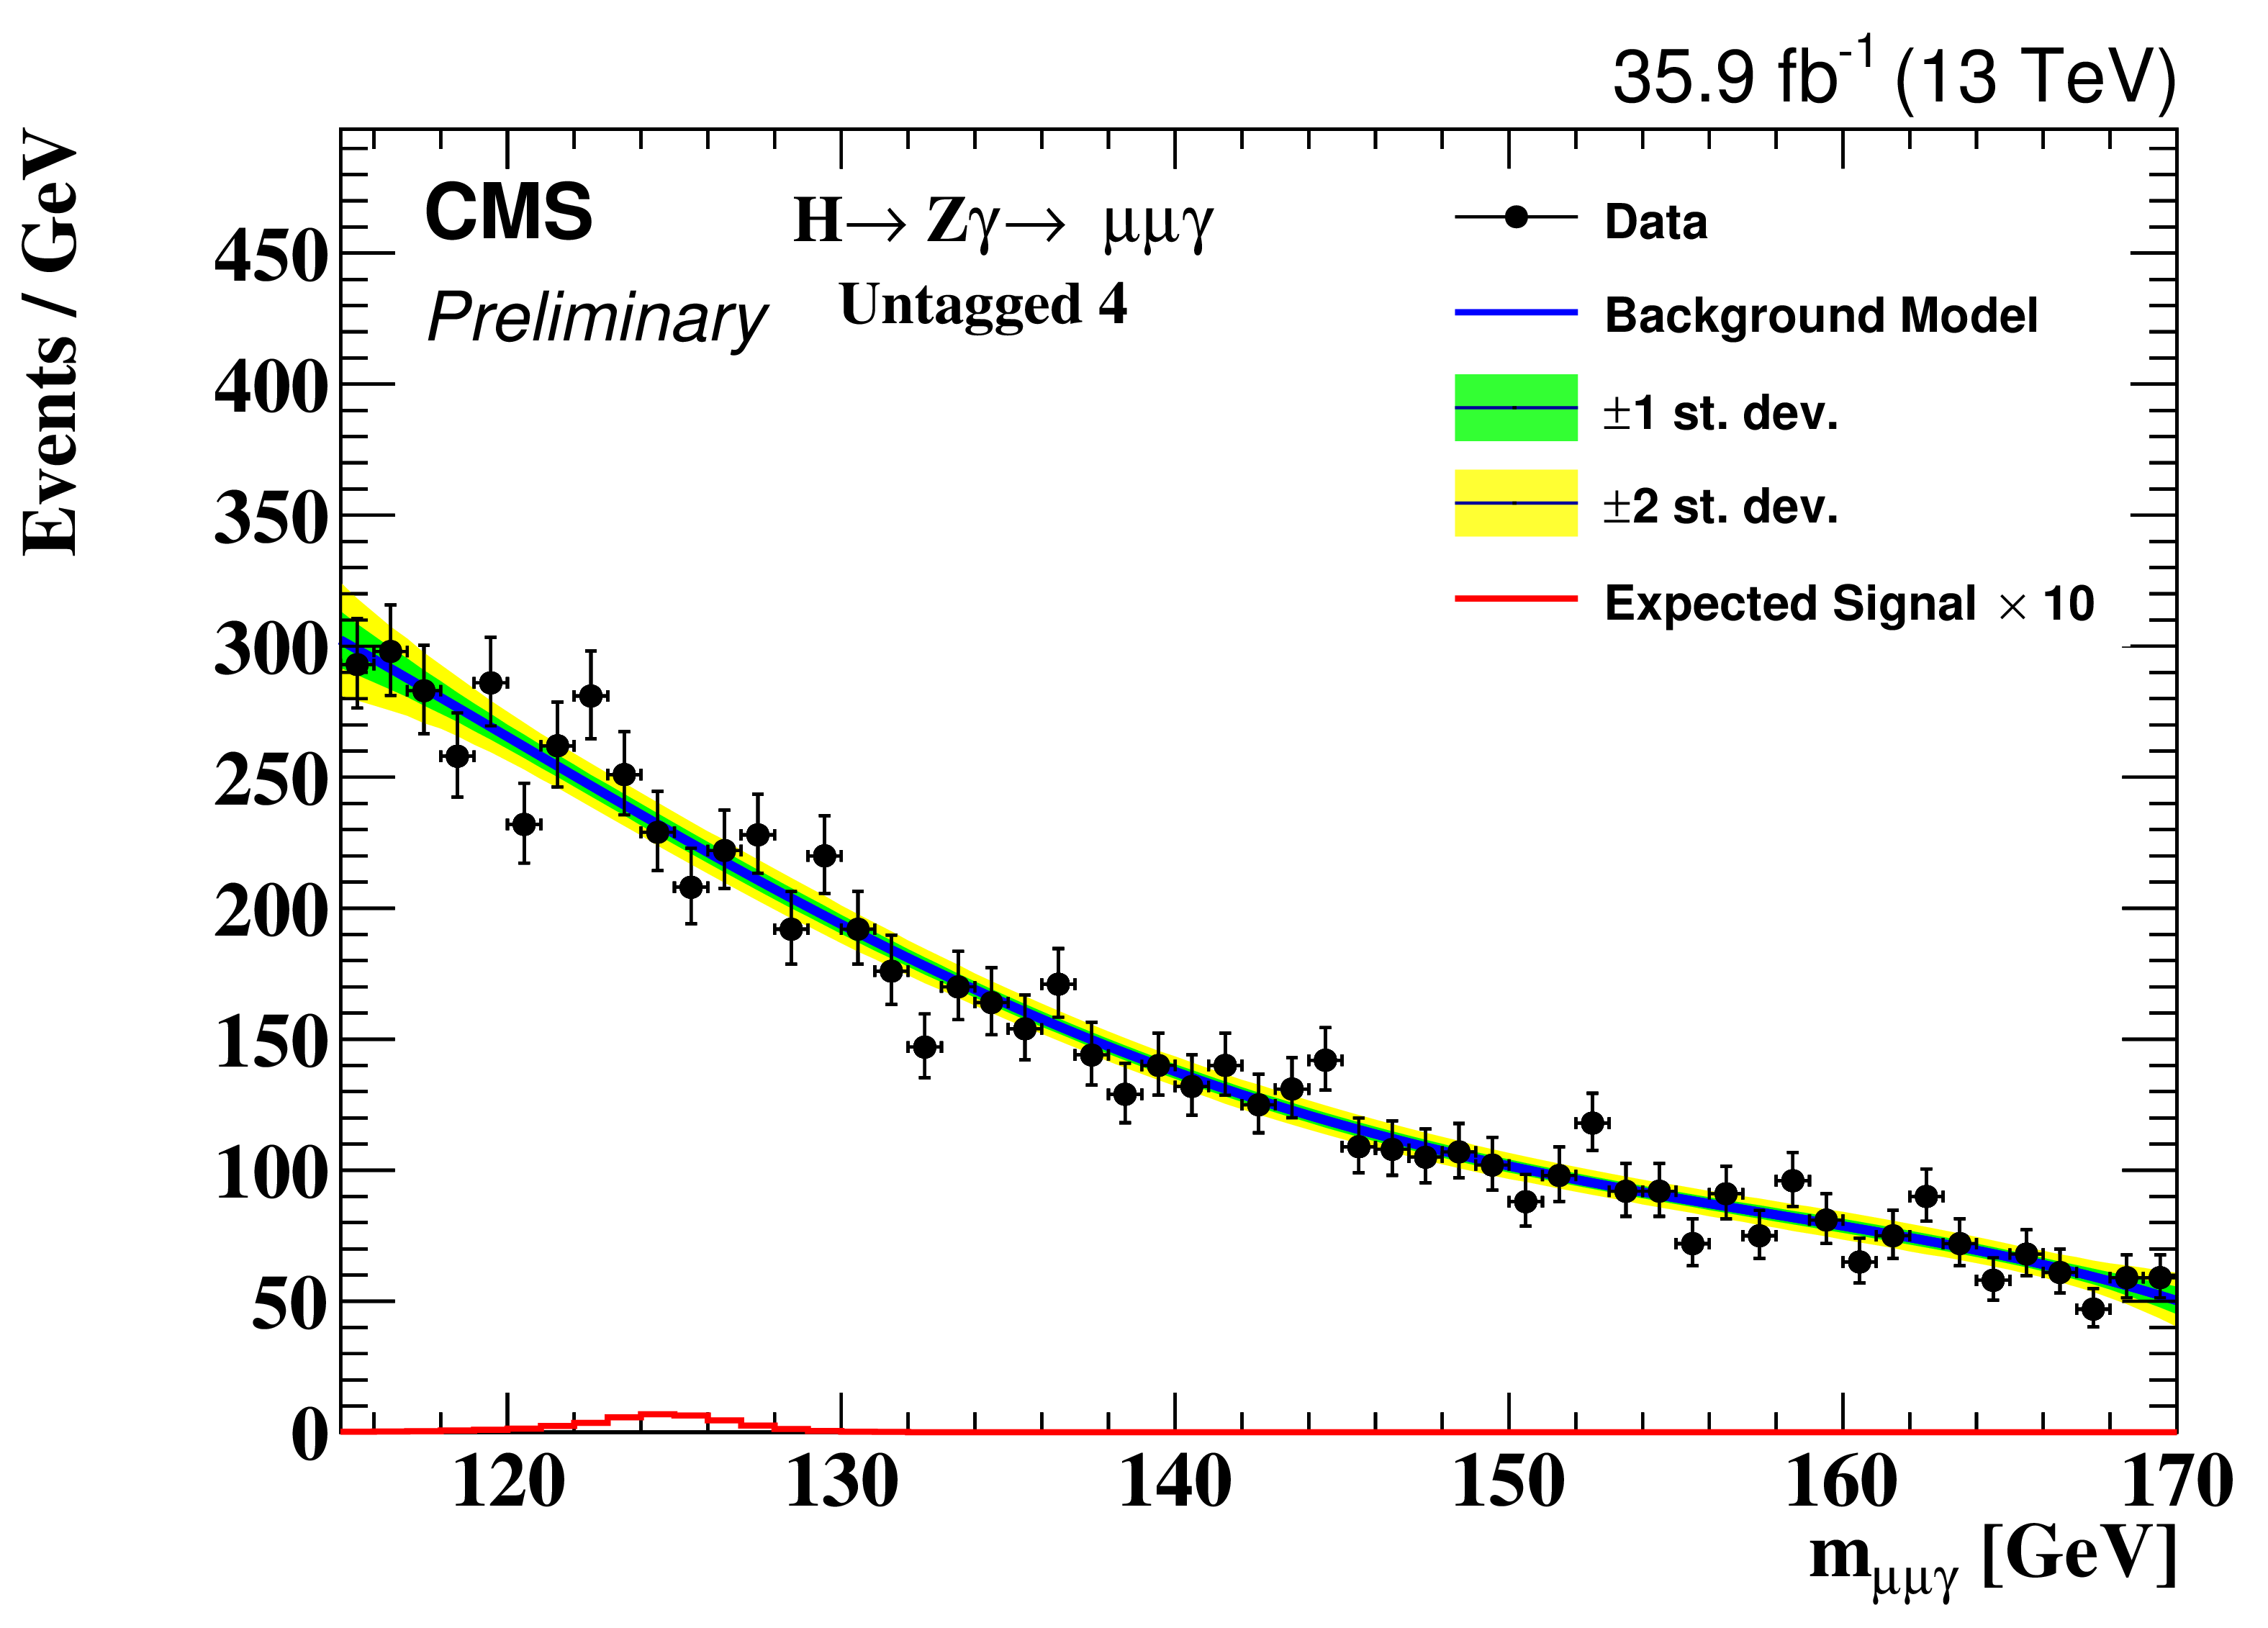
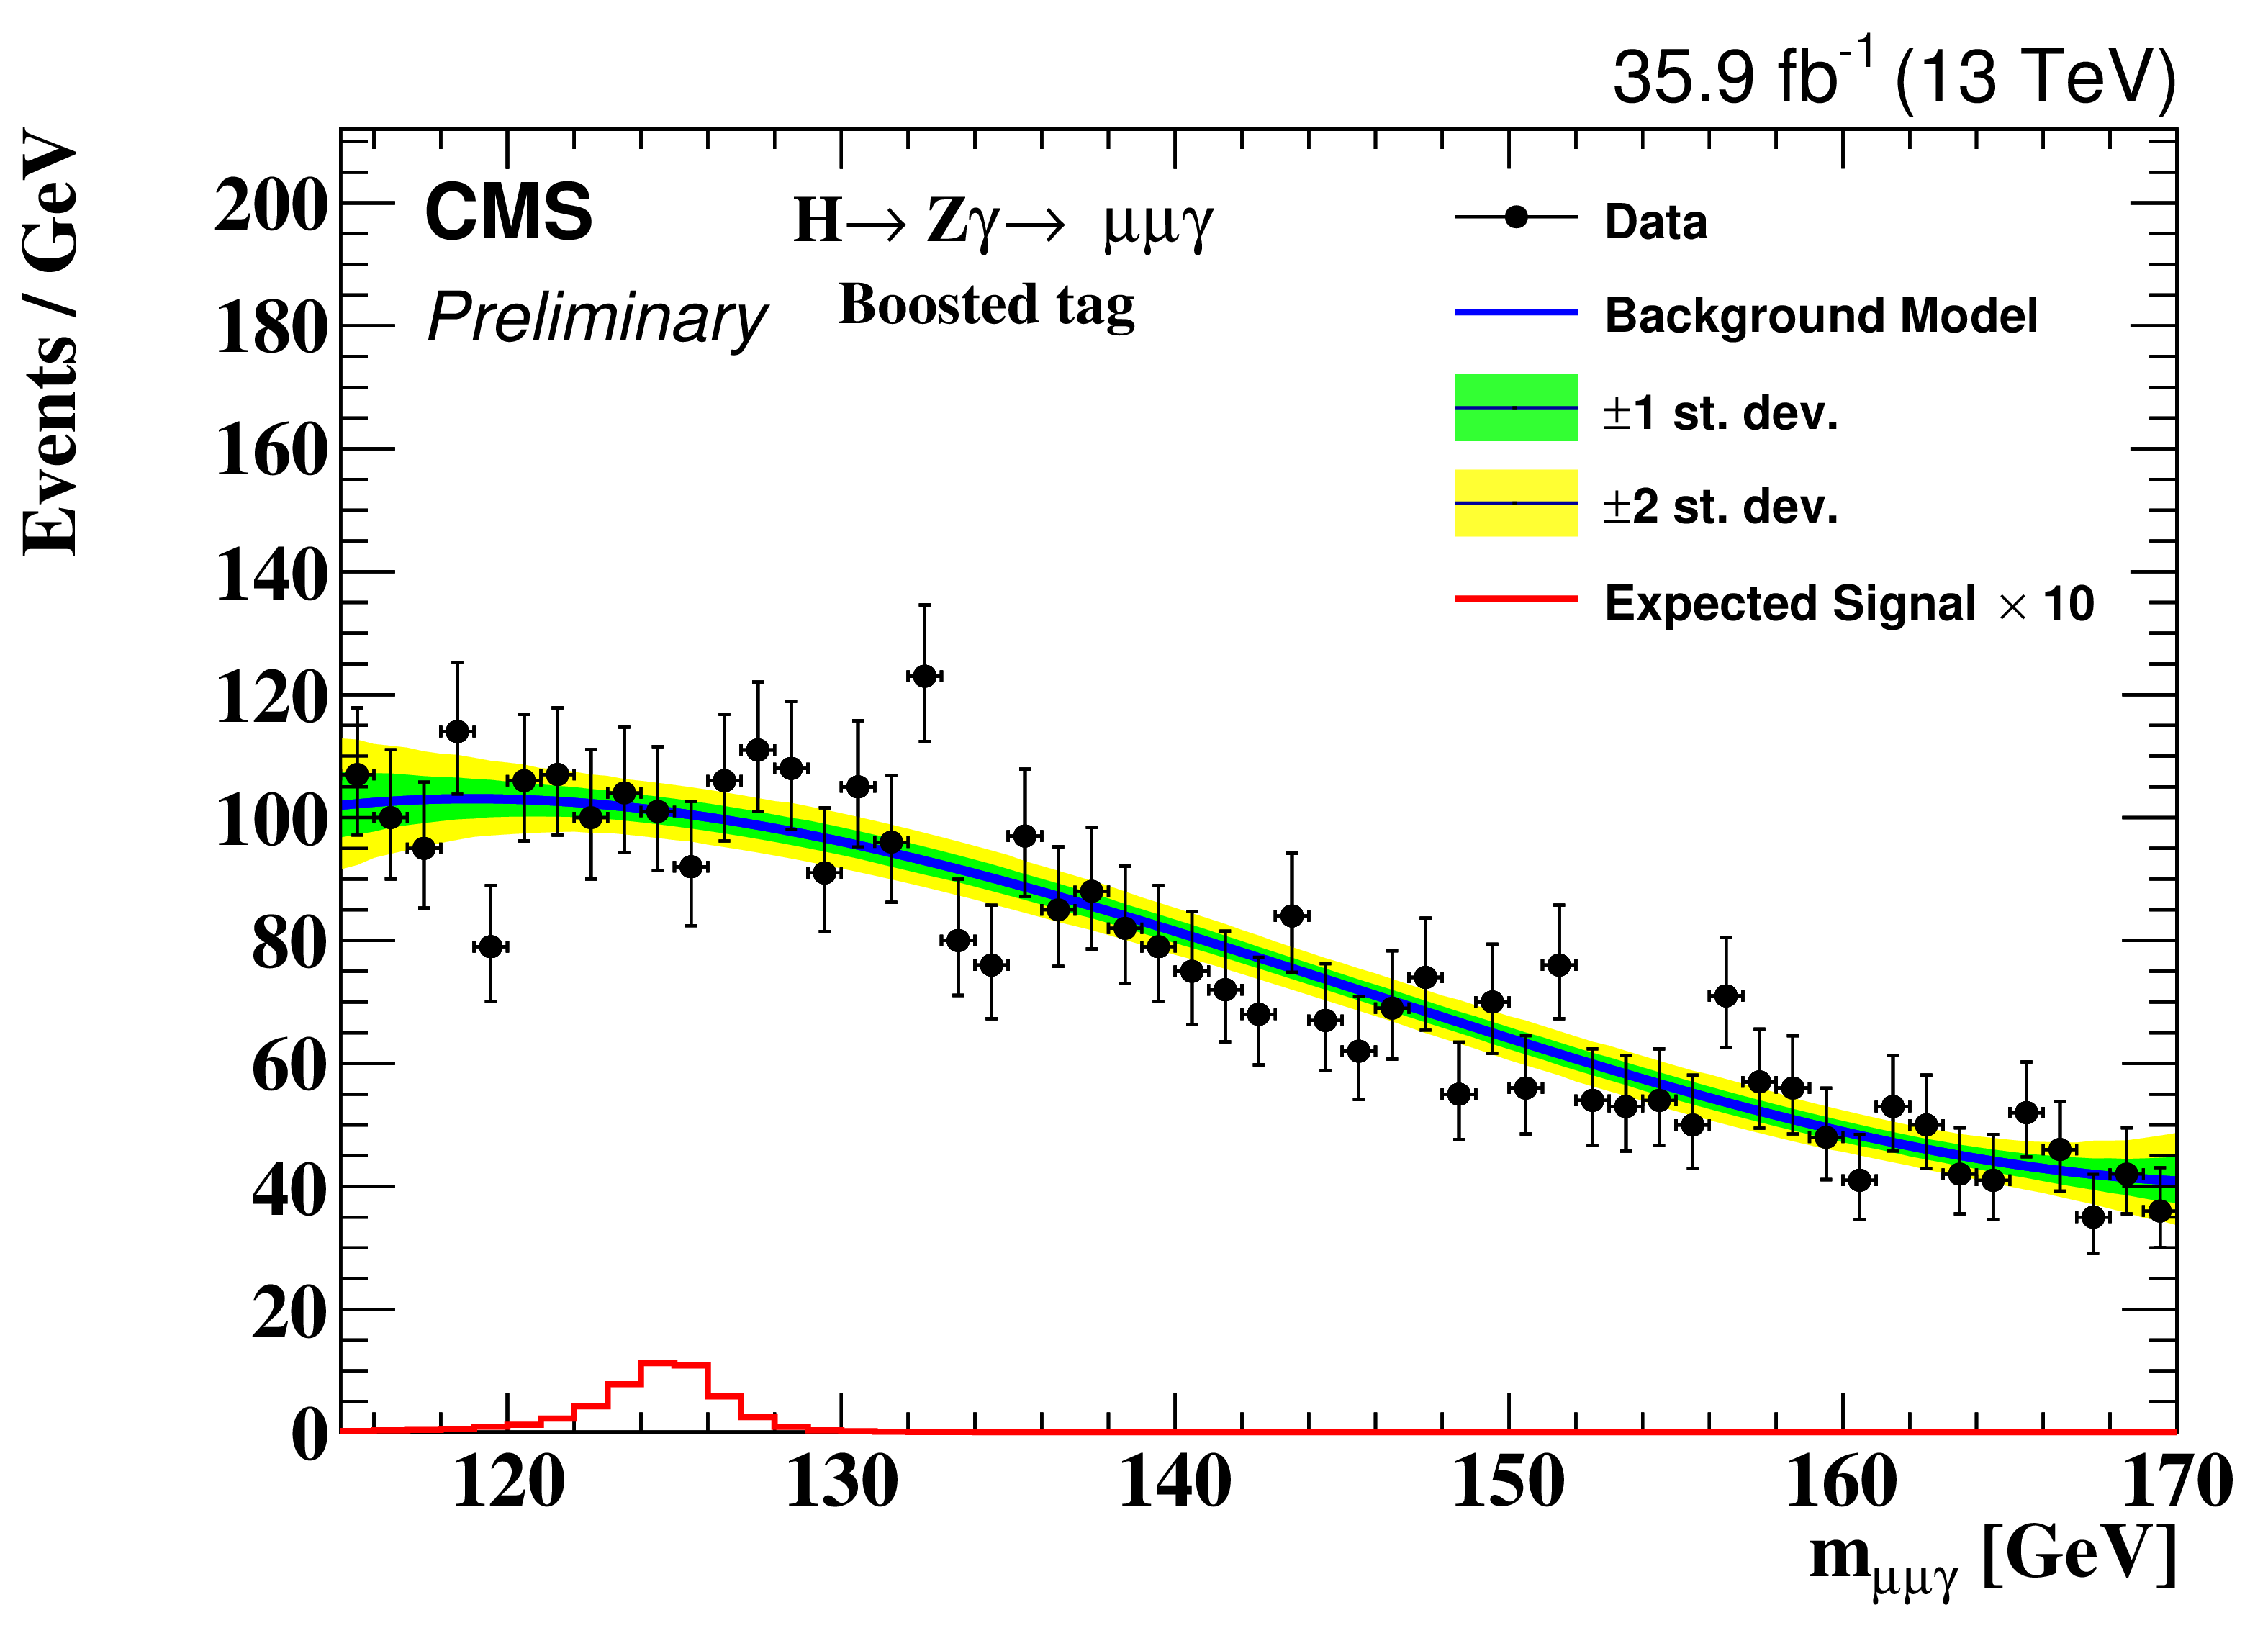
Figure 4:
Background model fit to the $m_{\mu \mu \gamma}$ distribution for untagged 1 (top left), untagged 2 (top right), untagged 3 (middle left), untagged 4 (middle right), di-jet tagged (bottom left) and boosted tag (bottom right) for the $ {\mathrm {H}} \to {\mathrm {Z}}\gamma \to \mu \mu \gamma $ selection. The green and yellow bands represent the 68% and 95% uncertainties in the fit to the data. |
png pdf |
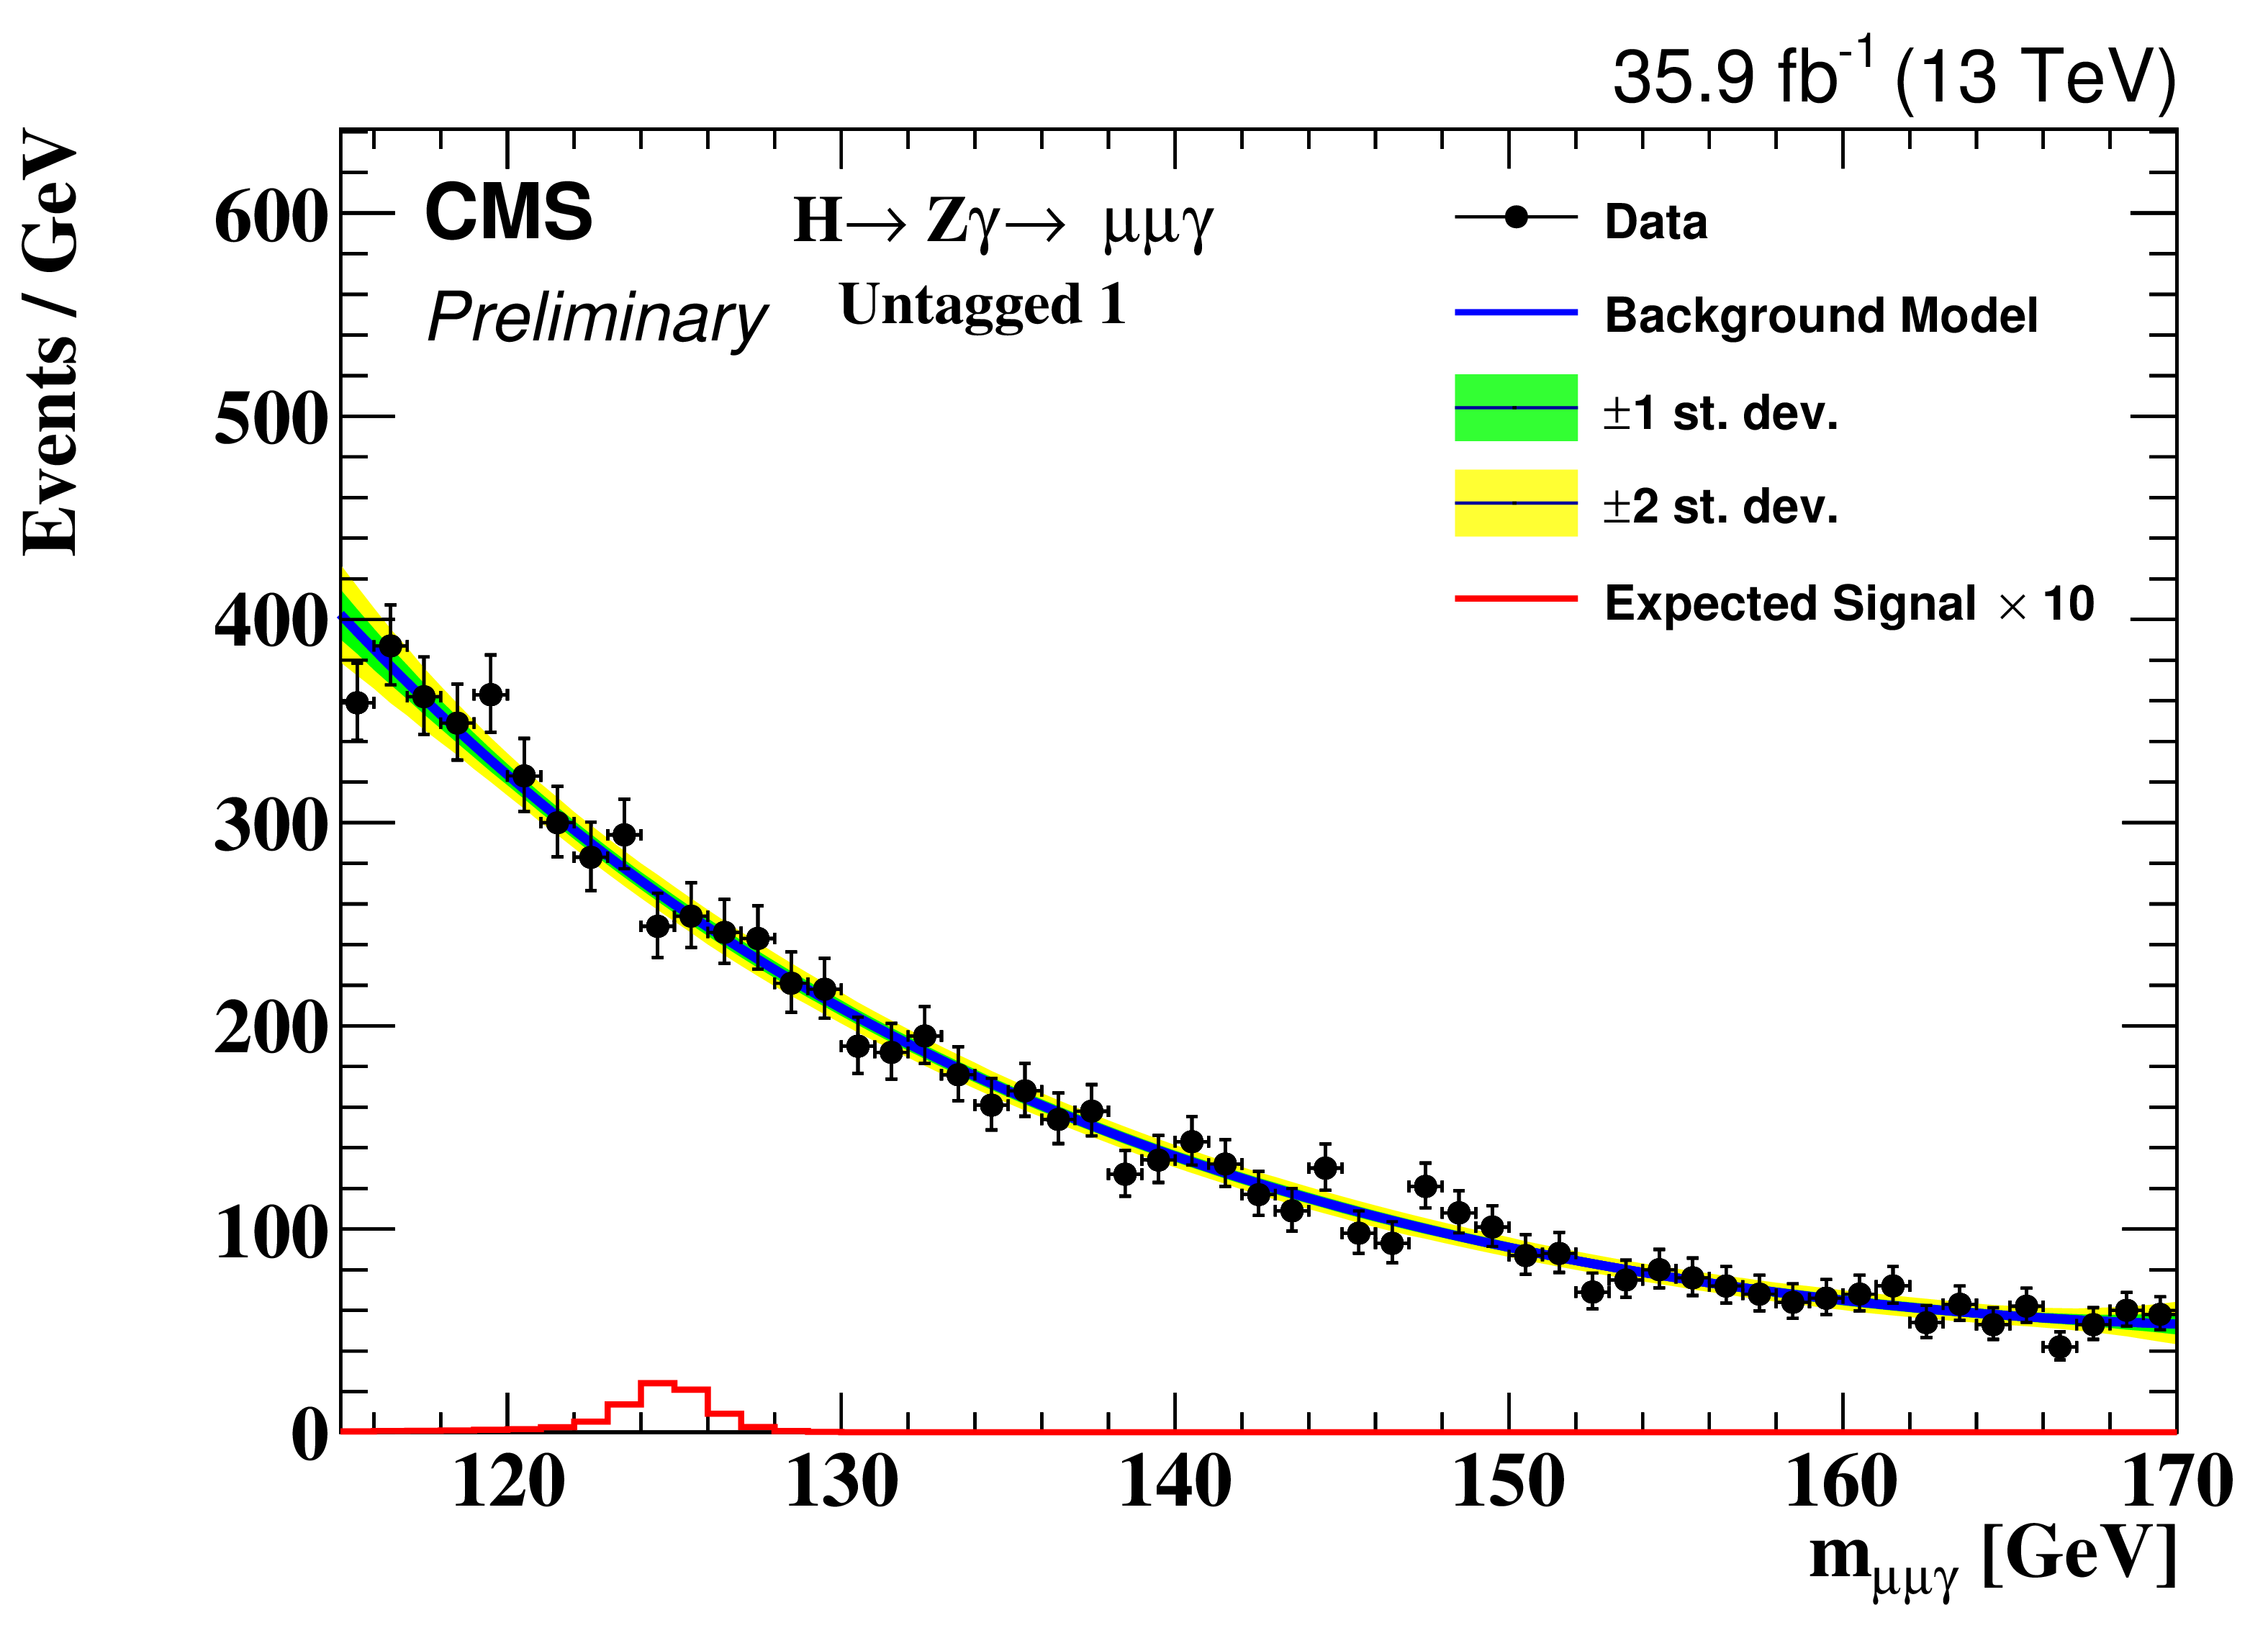
Figure 4-a:
Background model fit to the $m_{\mu \mu \gamma}$ distribution for untagged 1 tag for the $ {\mathrm {H}} \to {\mathrm {Z}}\gamma \to \mu \mu \gamma $ selection. The green and yellow bands represent the 68% and 95% uncertainties in the fit to the data. |
png pdf |
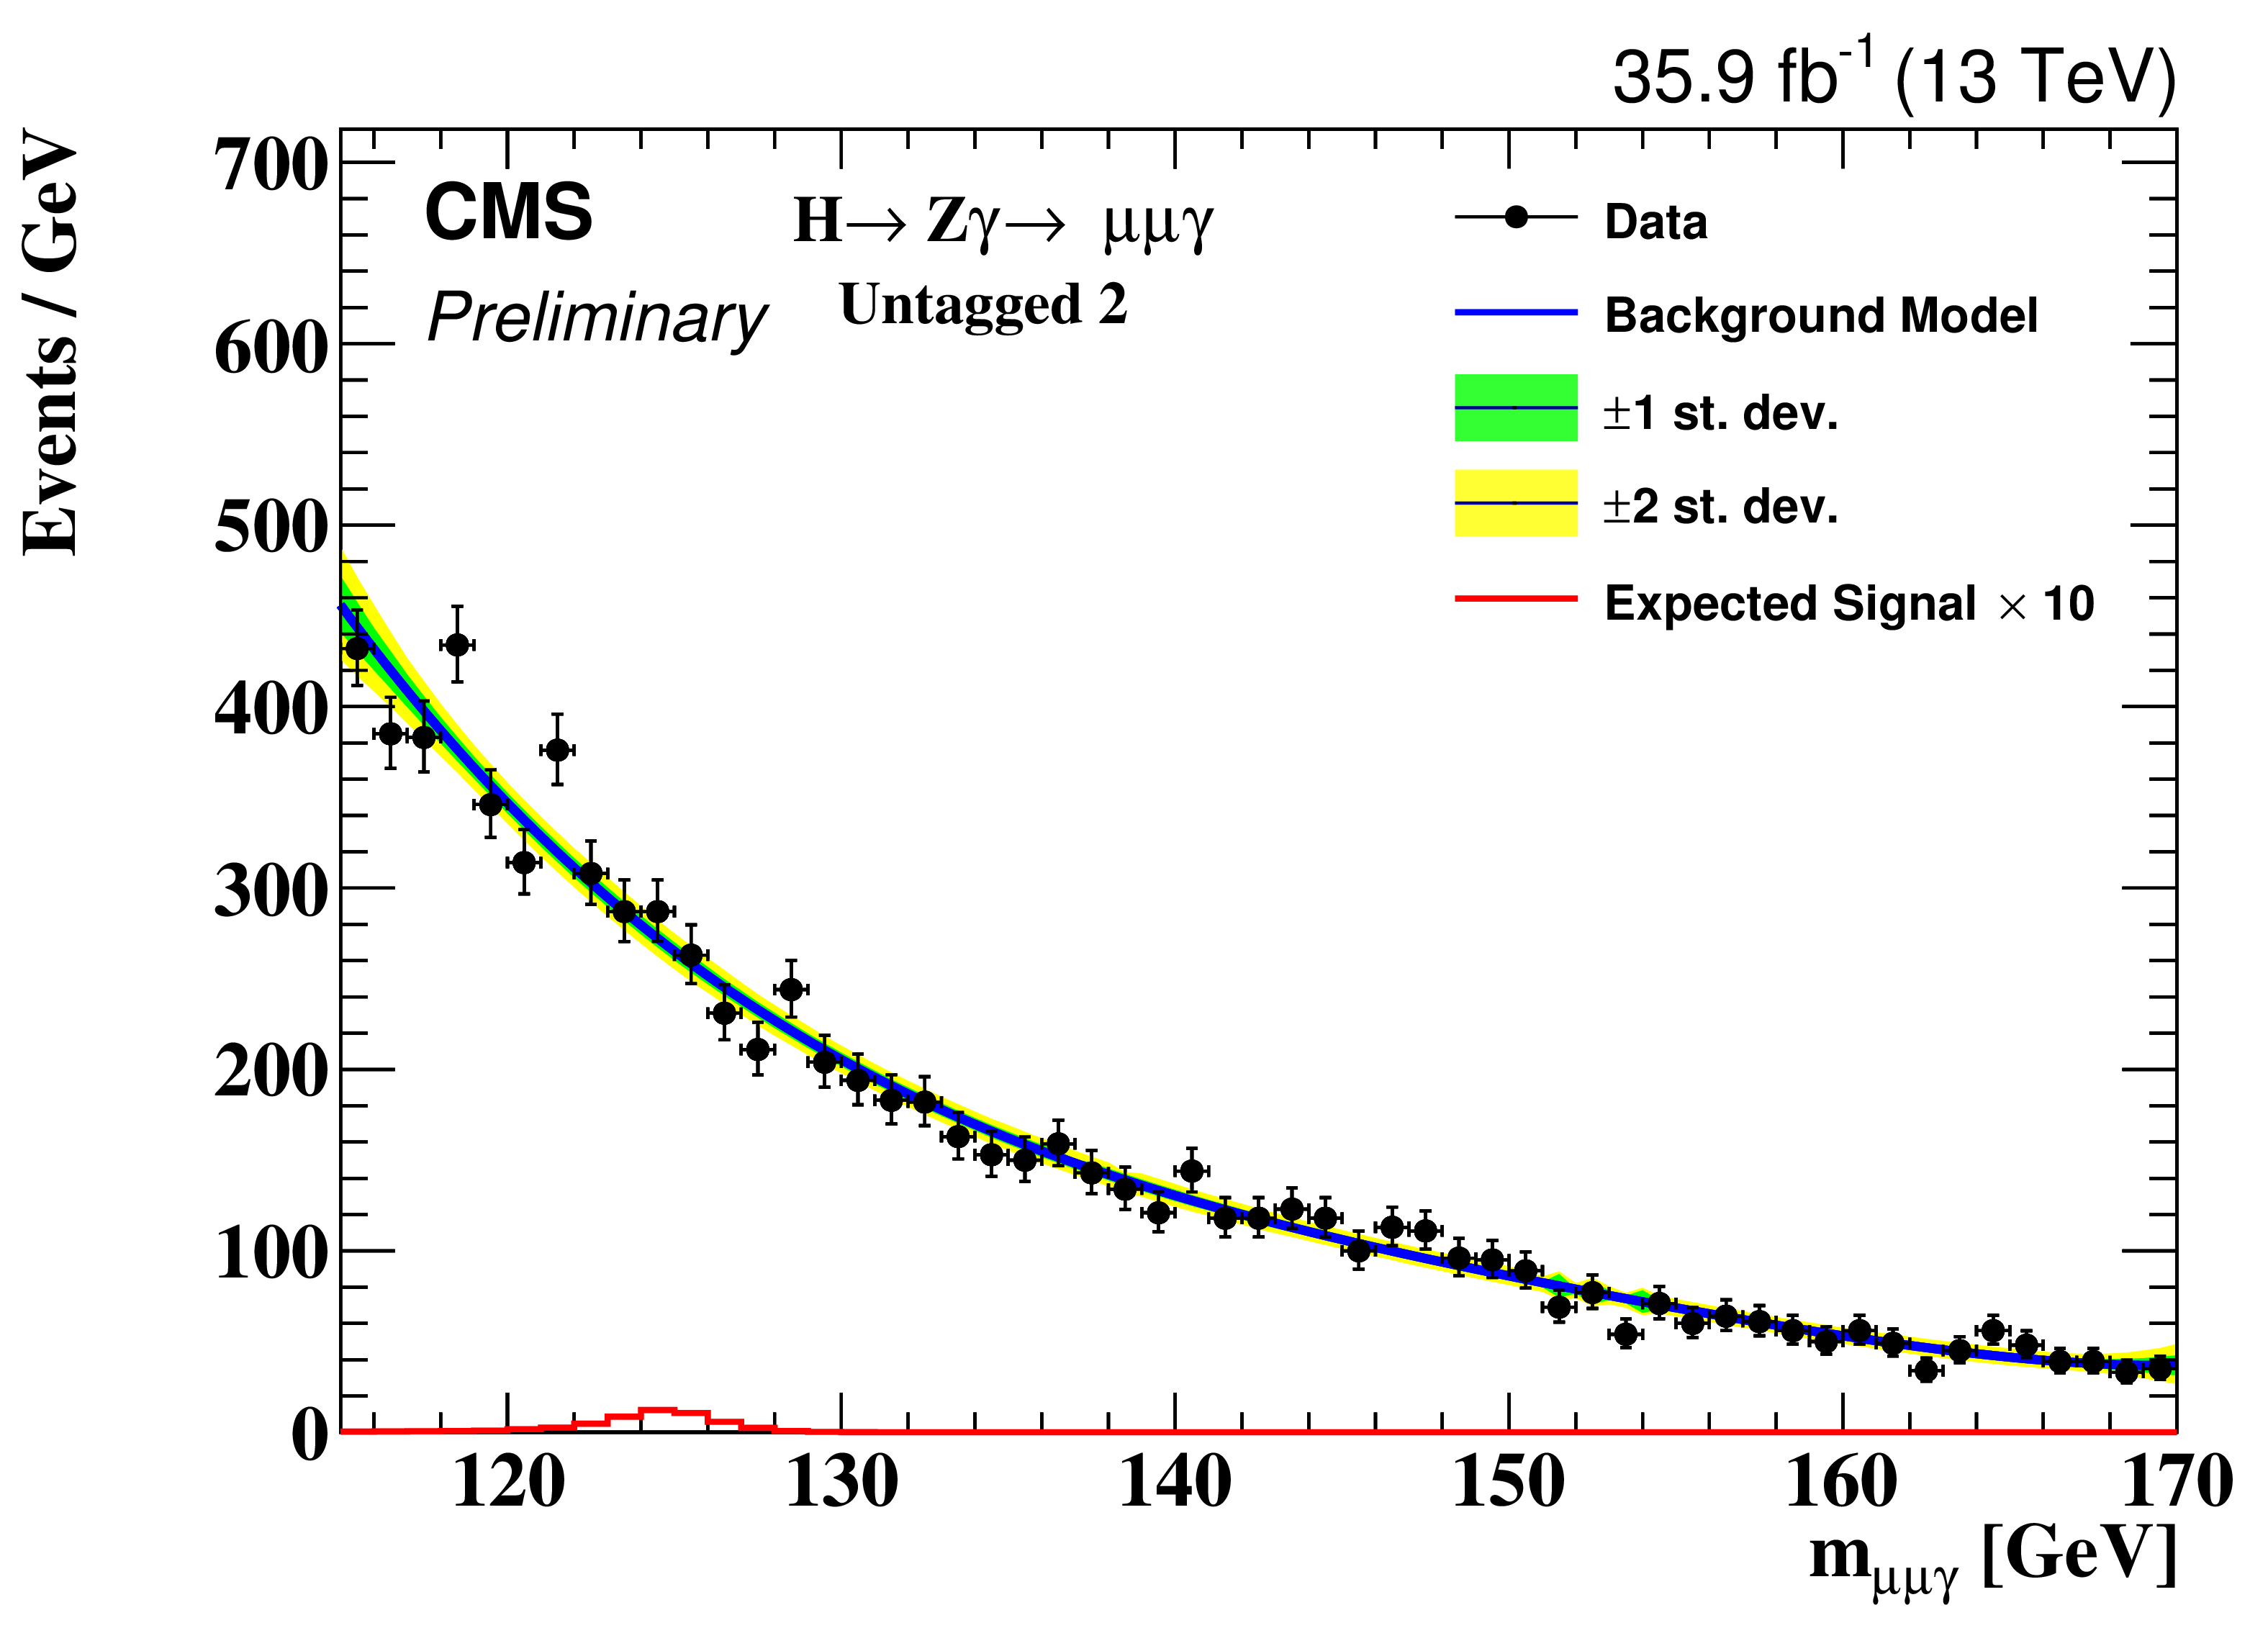
Figure 4-b:
Background model fit to the $m_{\mu \mu \gamma}$ distribution for untagged 2 tag for the $ {\mathrm {H}} \to {\mathrm {Z}}\gamma \to \mu \mu \gamma $ selection. The green and yellow bands represent the 68% and 95% uncertainties in the fit to the data. |
png pdf |
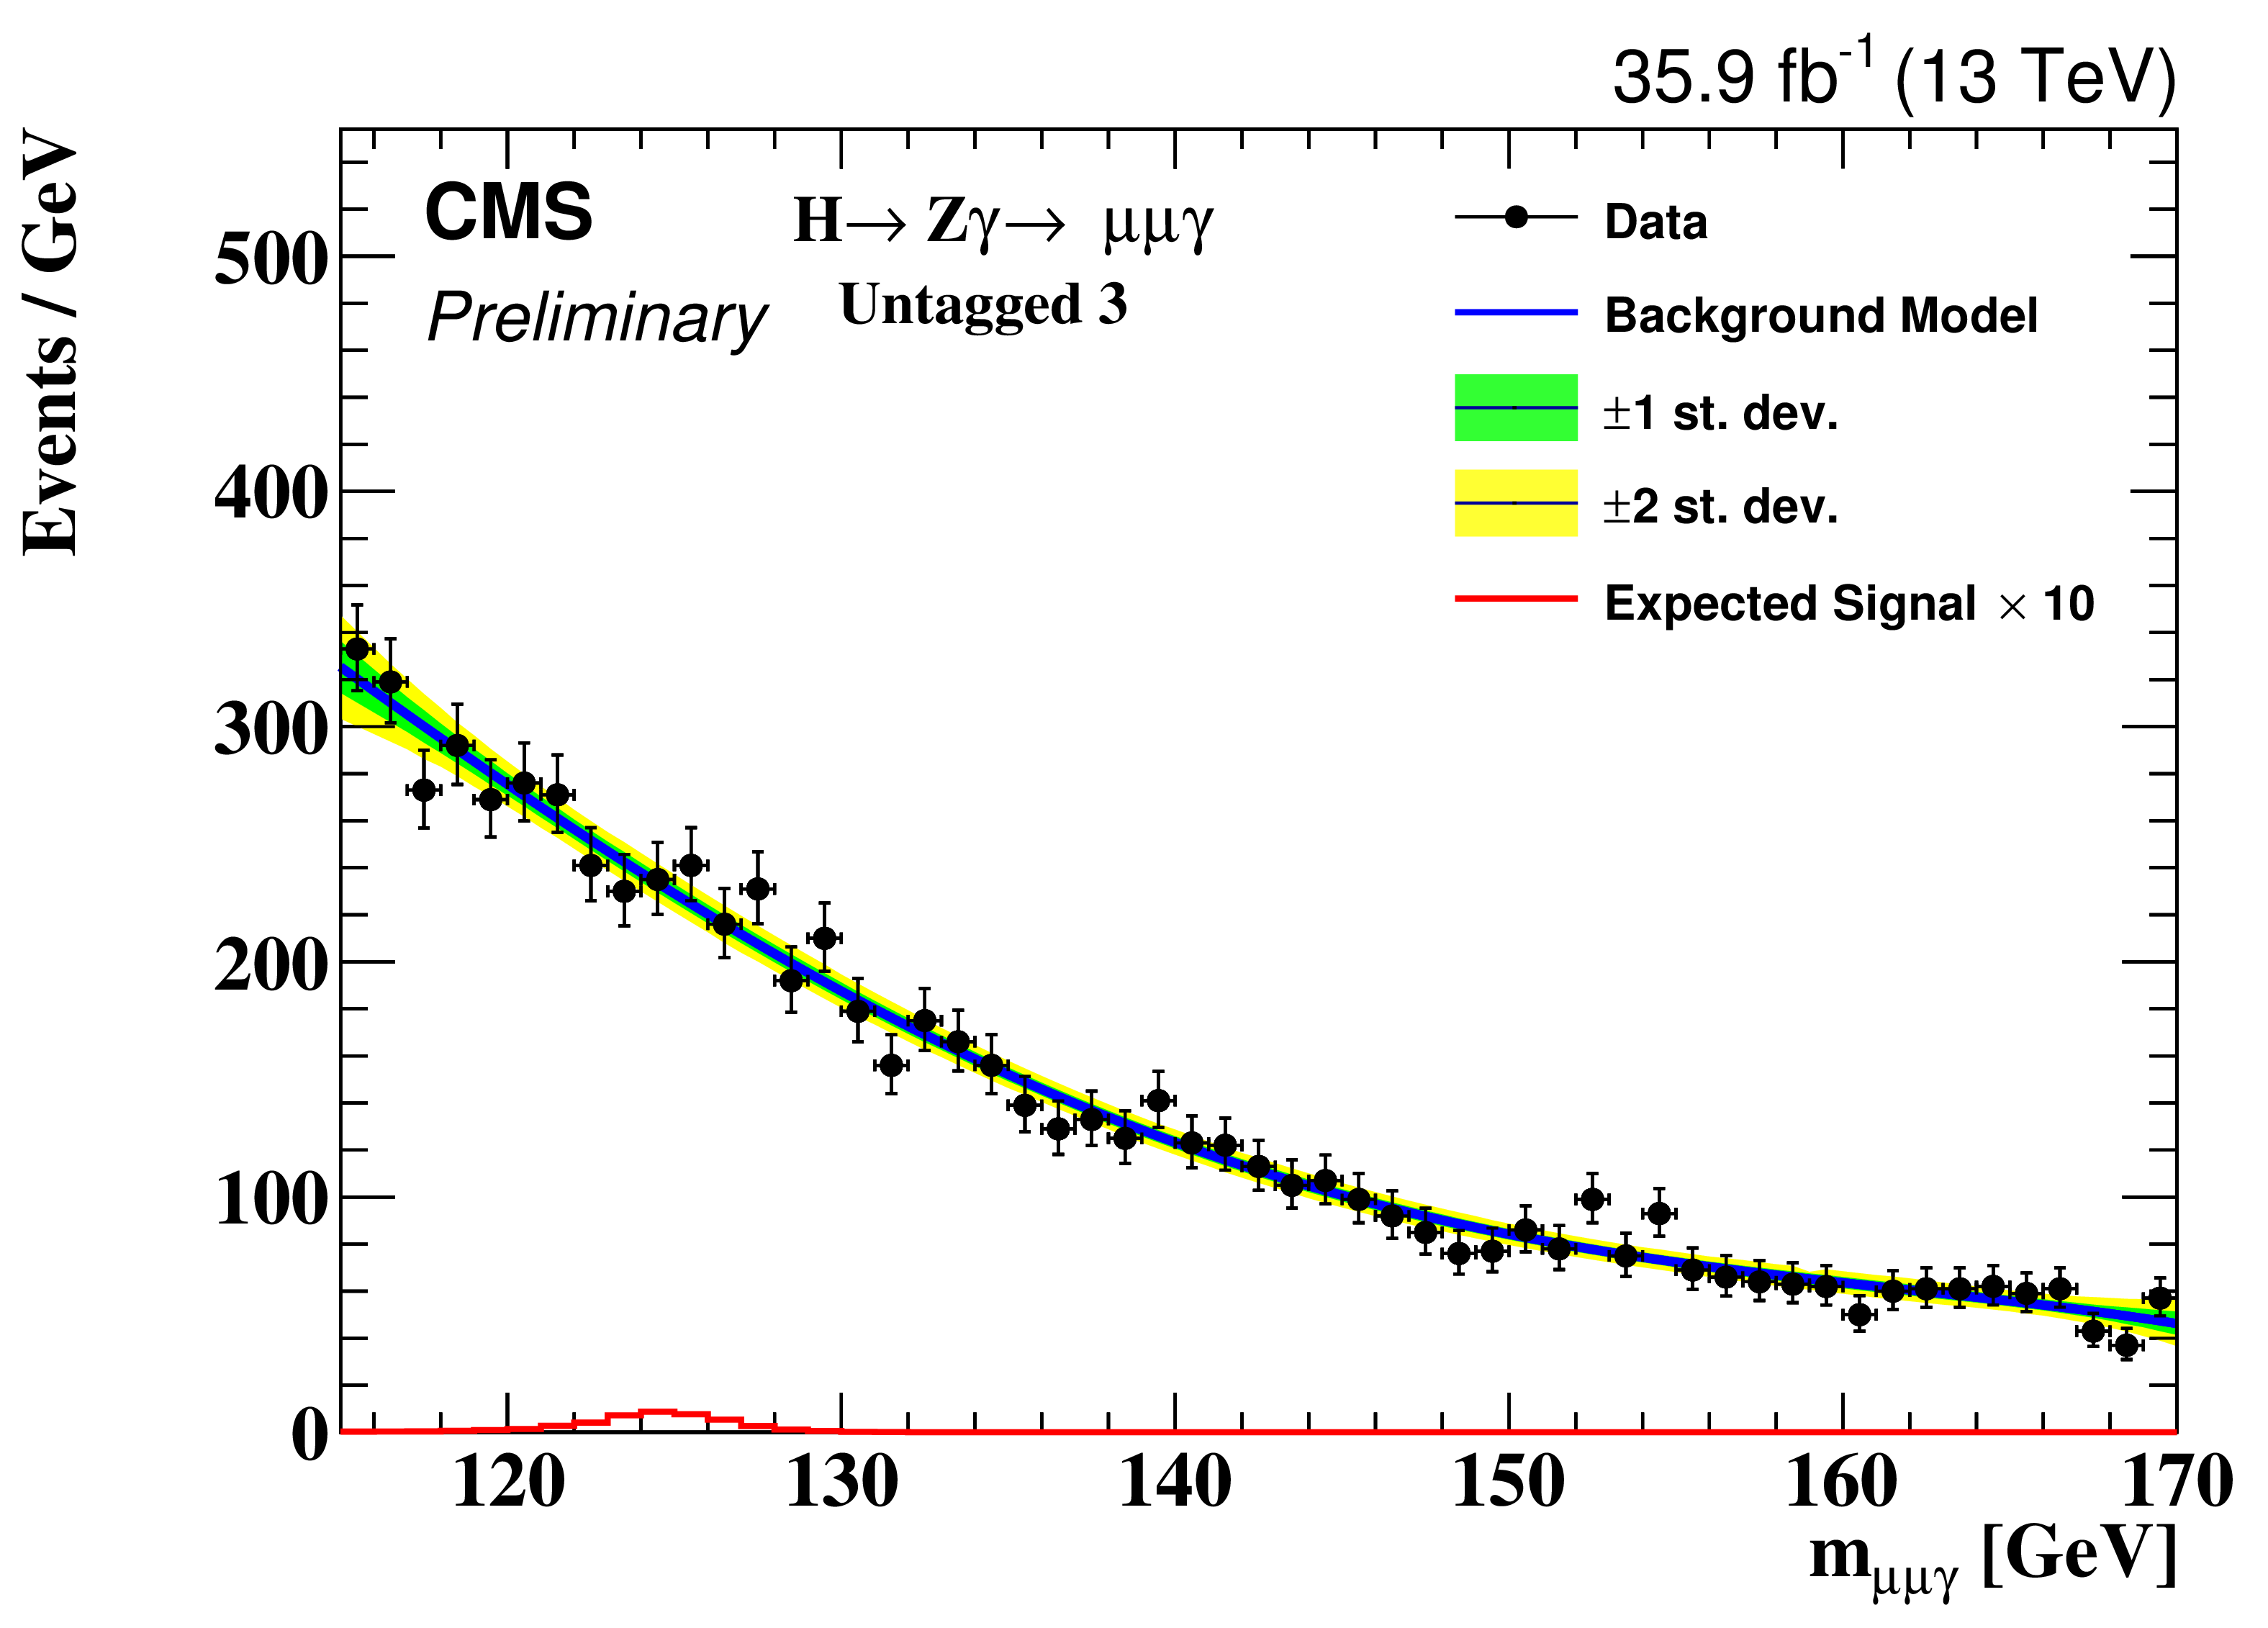
Figure 4-c:
Background model fit to the $m_{\mu \mu \gamma}$ distribution for untagged 3 tag for the $ {\mathrm {H}} \to {\mathrm {Z}}\gamma \to \mu \mu \gamma $ selection. The green and yellow bands represent the 68% and 95% uncertainties in the fit to the data. |
png pdf |
Figure 4-d:
Background model fit to the $m_{\mu \mu \gamma}$ distribution for untagged 4 tag for the $ {\mathrm {H}} \to {\mathrm {Z}}\gamma \to \mu \mu \gamma $ selection. The green and yellow bands represent the 68% and 95% uncertainties in the fit to the data. |
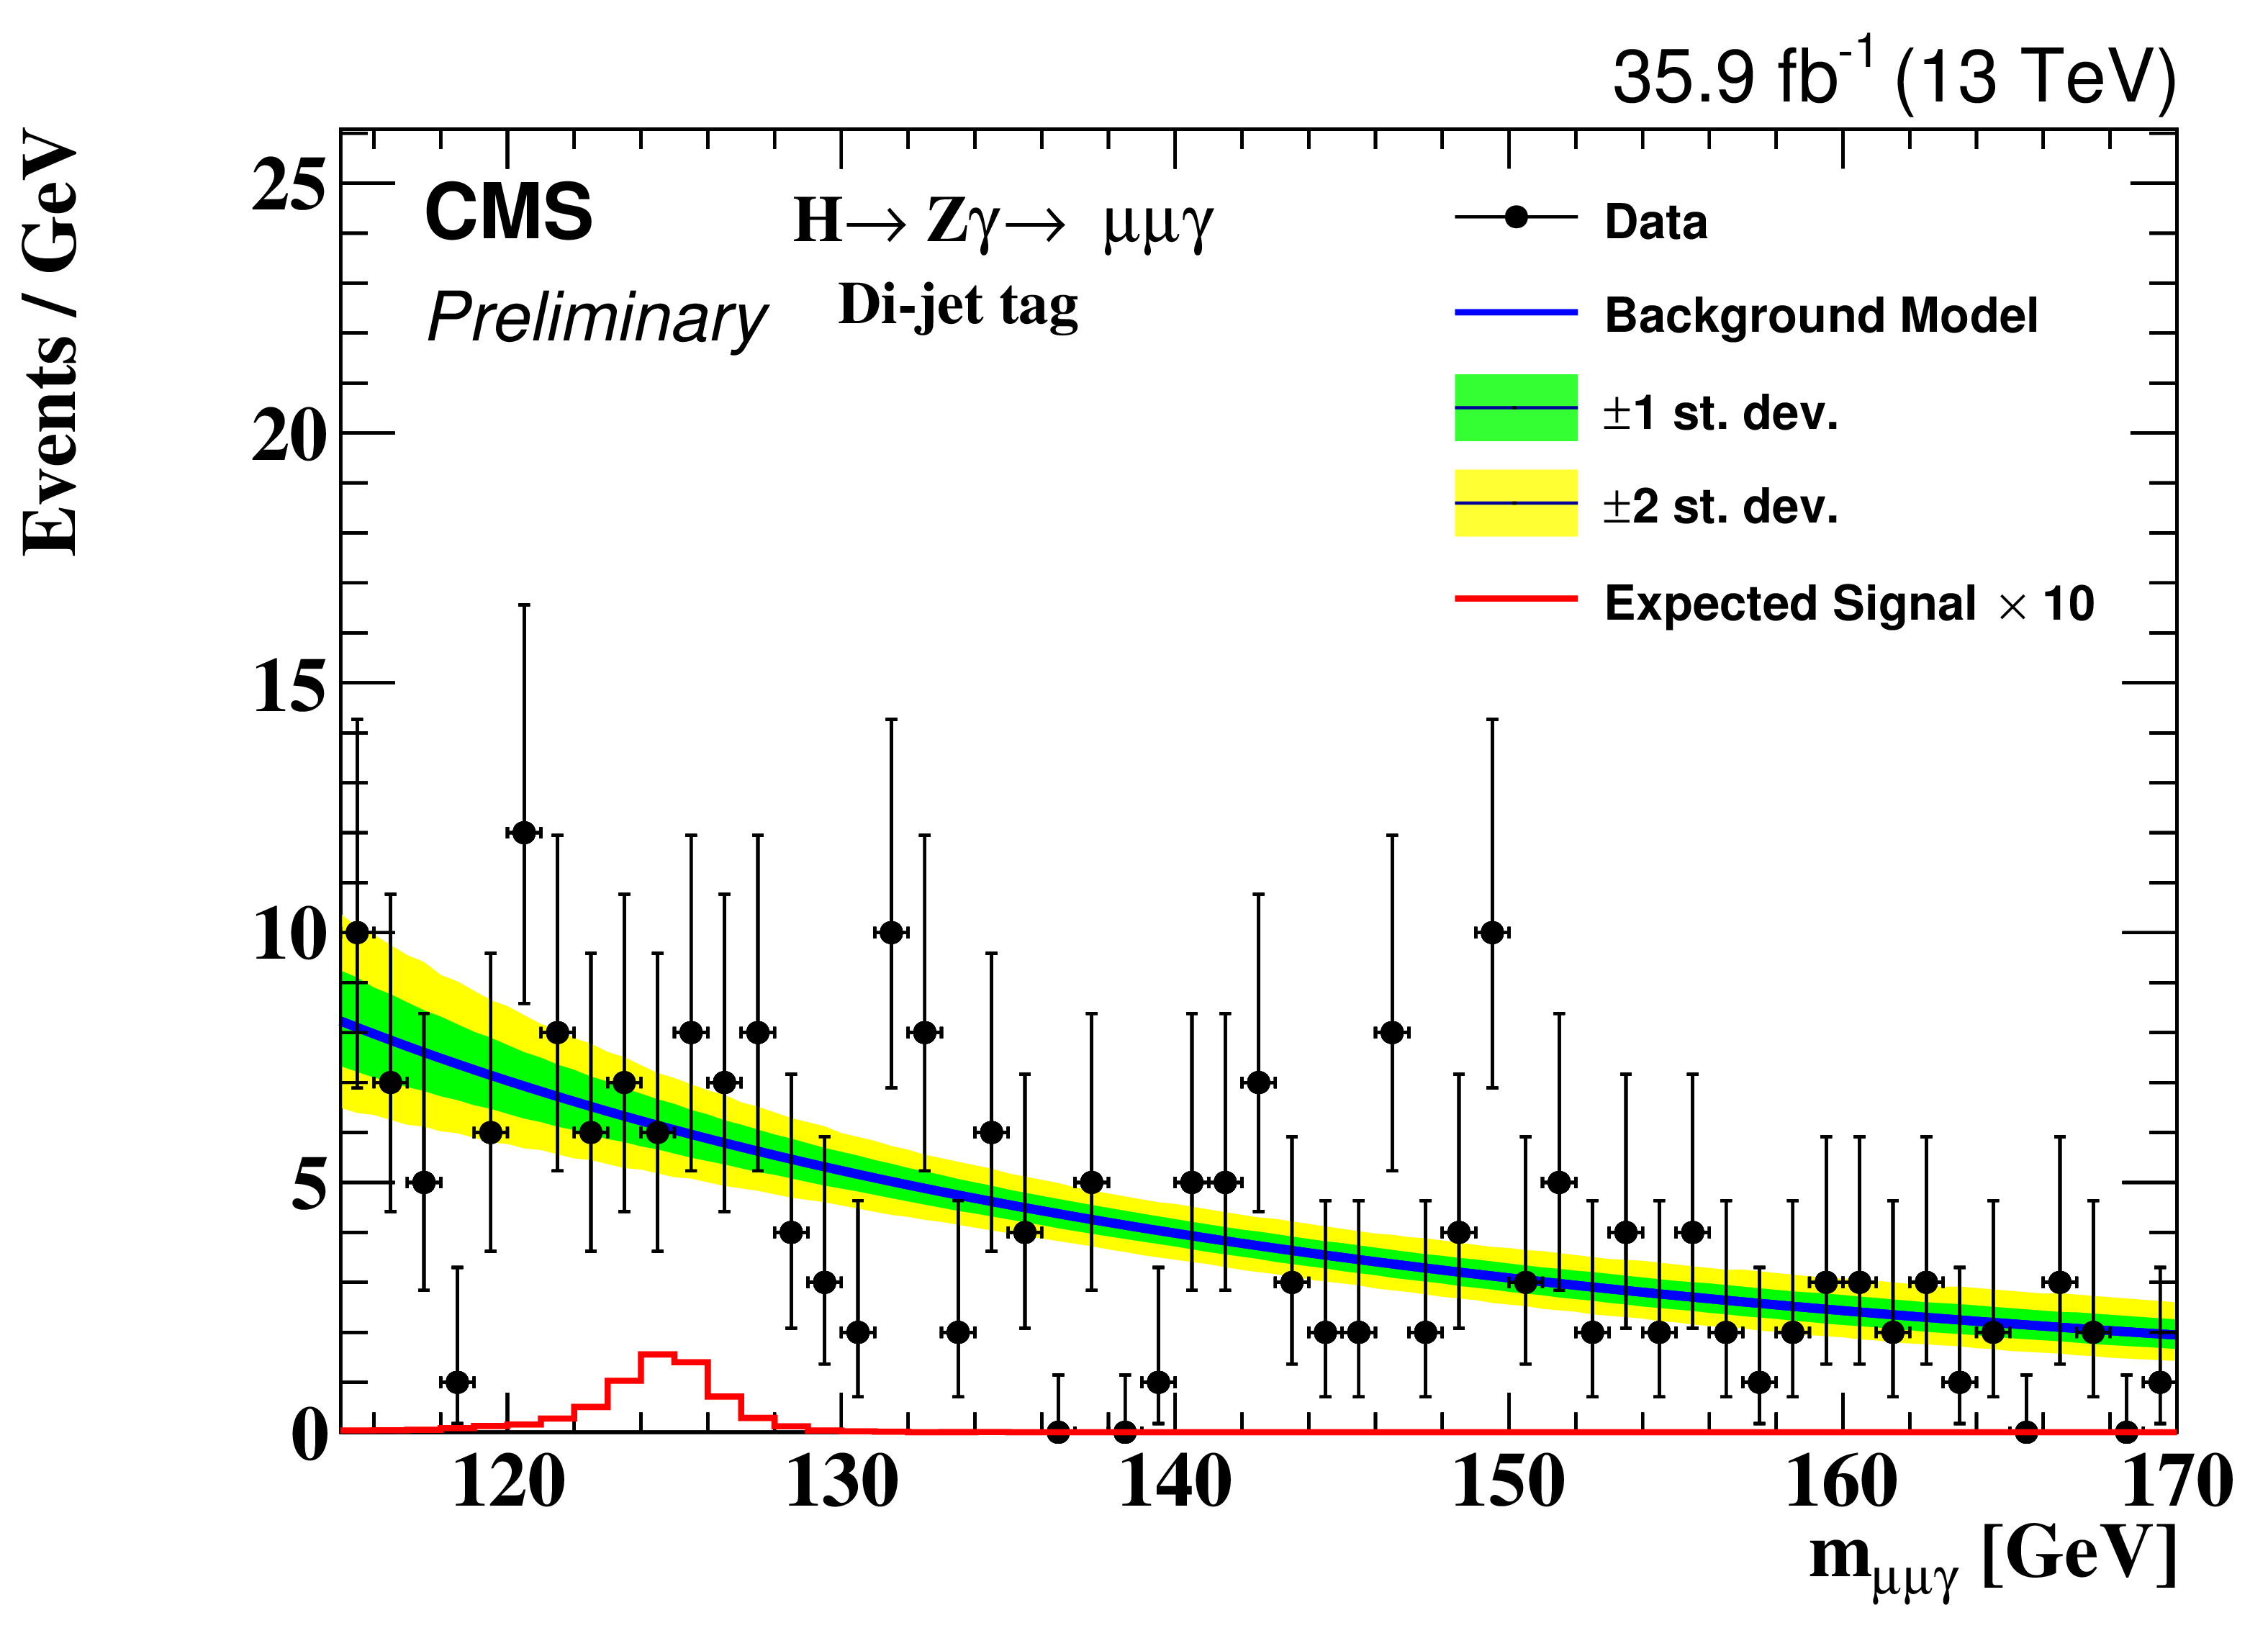
png pdf |
Figure 4-e:
Background model fit to the $m_{\mu \mu \gamma}$ distribution for di-jet tagged tag for the $ {\mathrm {H}} \to {\mathrm {Z}}\gamma \to \mu \mu \gamma $ selection. The green and yellow bands represent the 68% and 95% uncertainties in the fit to the data. |
png pdf |
Figure 4-f:
Background model fit to the $m_{\mu \mu \gamma}$ distribution for di-jet boosted tag for the $ {\mathrm {H}} \to {\mathrm {Z}}\gamma \to \mu \mu \gamma $ selection. The green and yellow bands represent the 68% and 95% uncertainties in the fit to the data. |
png pdf |
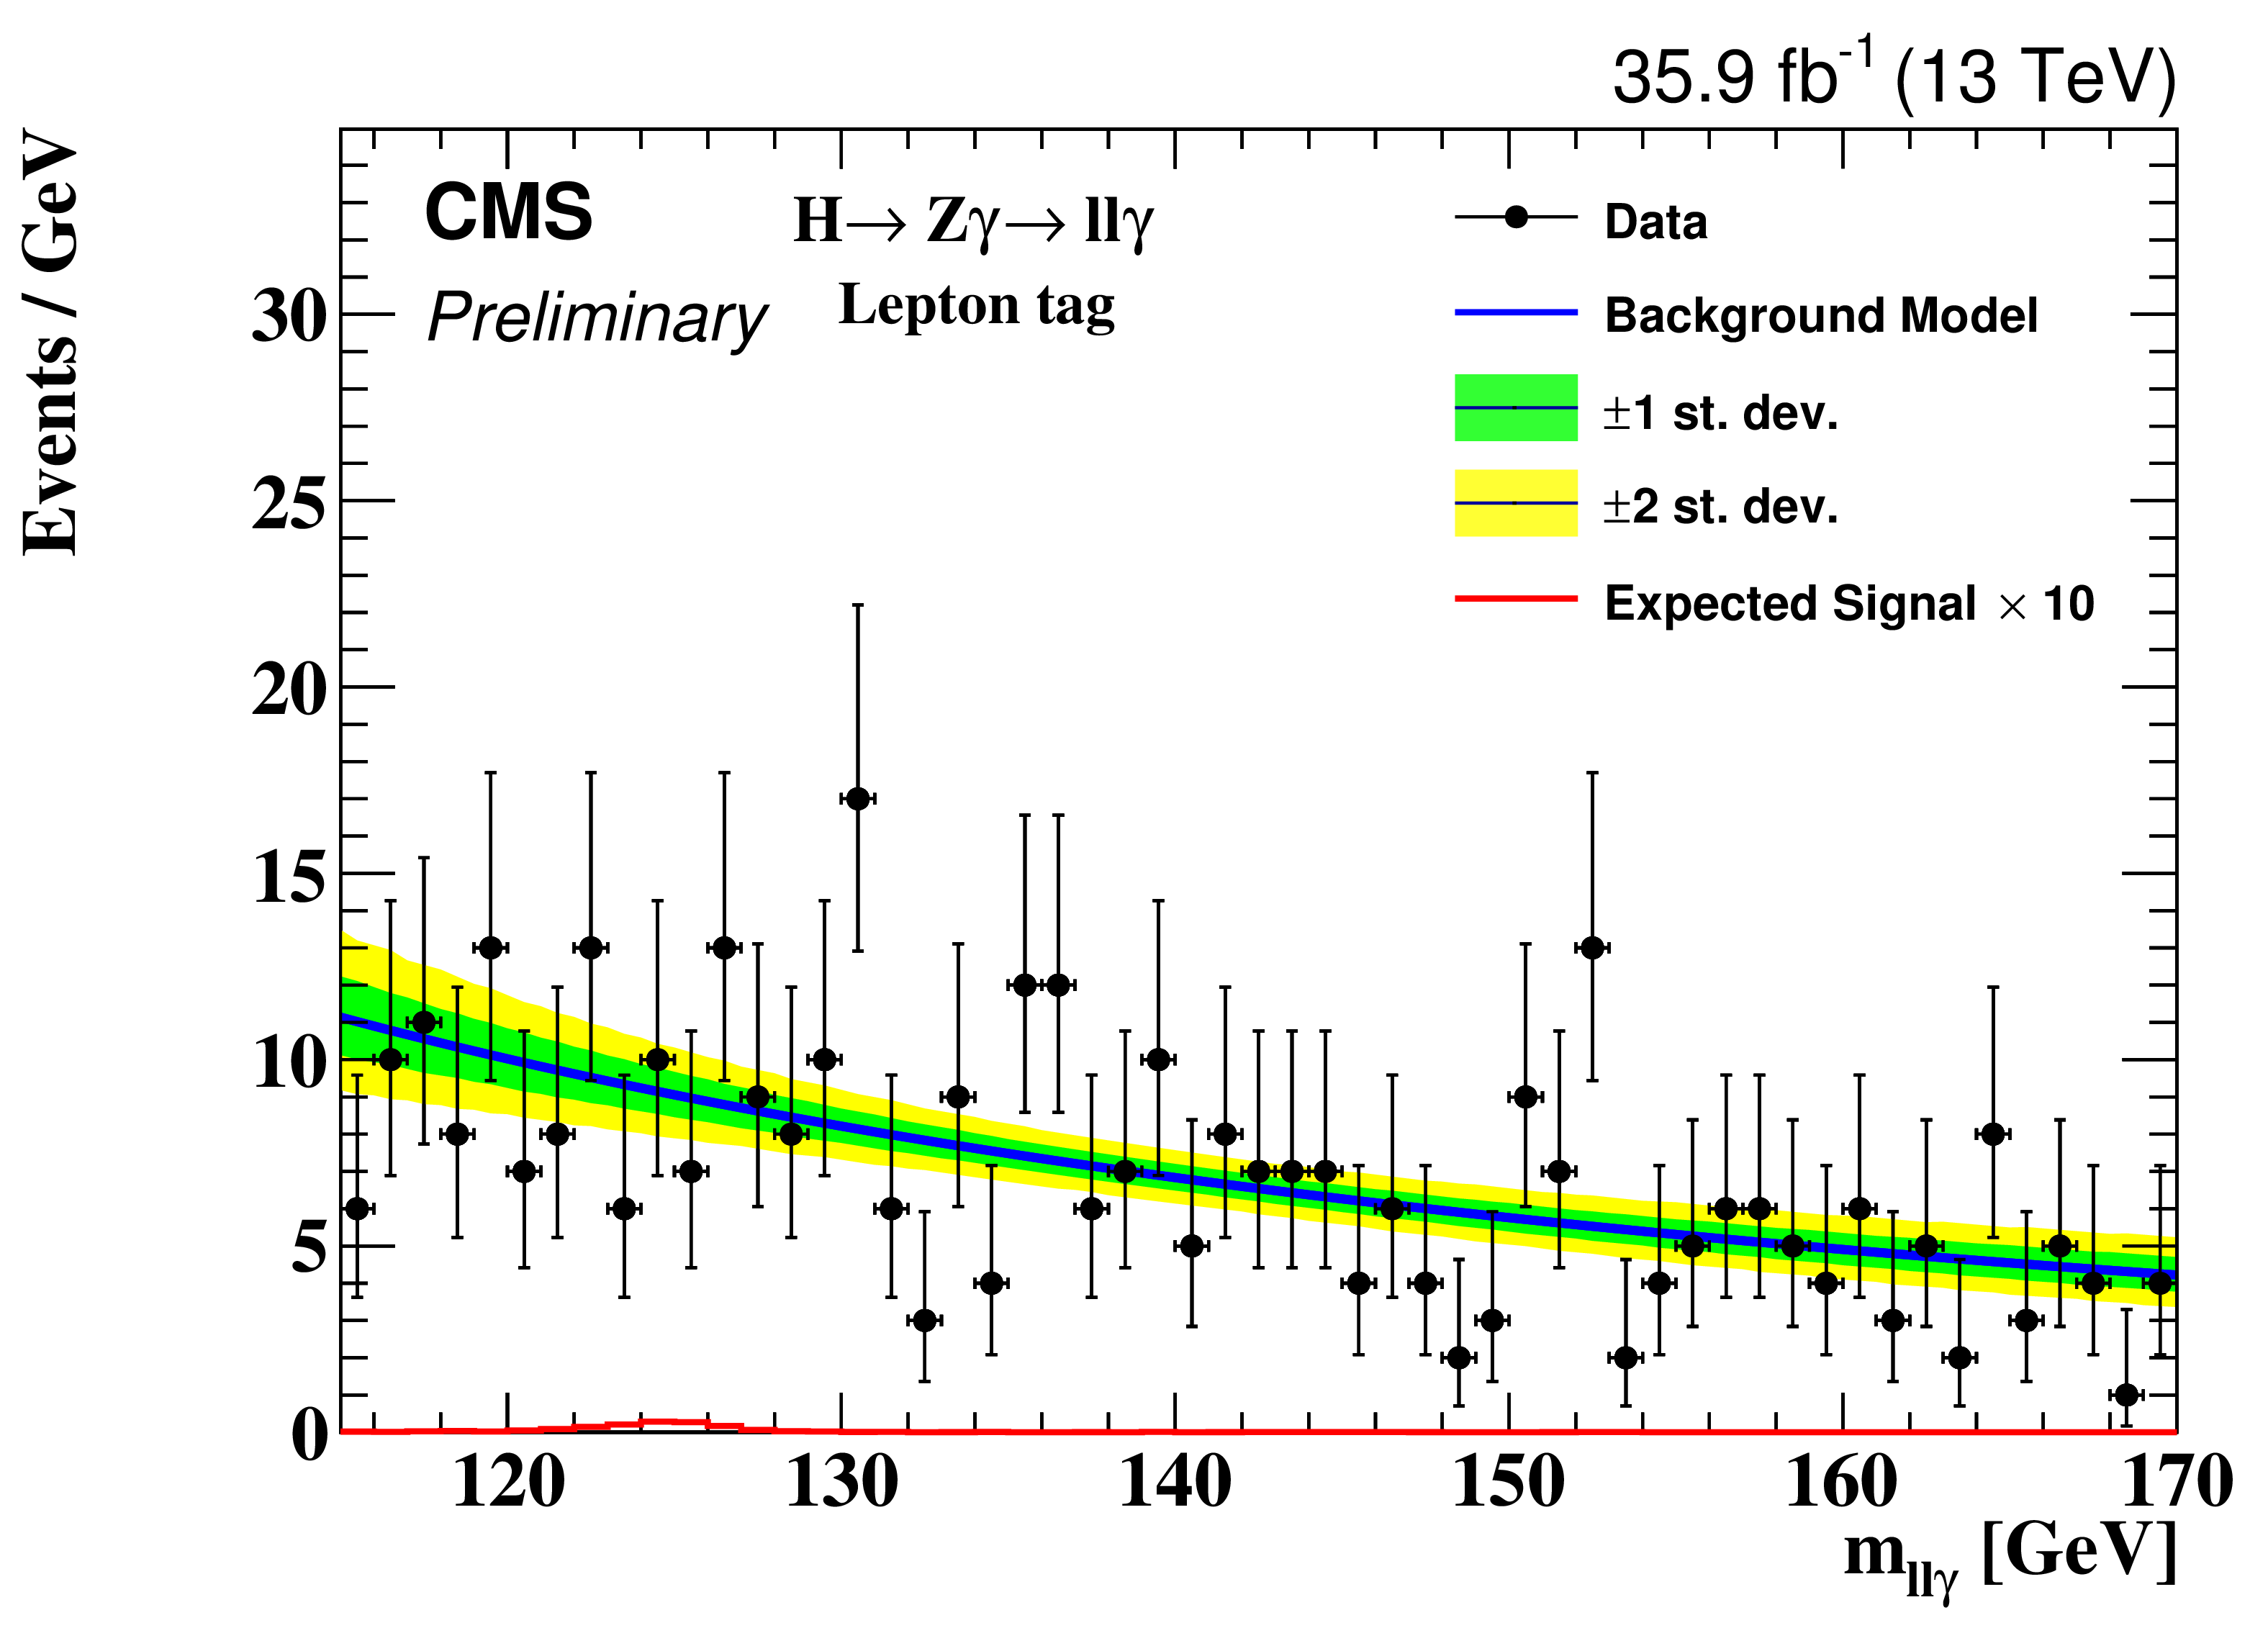
Figure 5:
Background model fit to the $m_{\ell \ell \gamma}$ distribution for $ {\mathrm {H}} \to {\mathrm {Z}}\gamma \to \ell \ell \gamma $ lepton tag category. The green and yellow bands represent the 68% and 95% uncertainties in the fit to the data. |
png pdf |
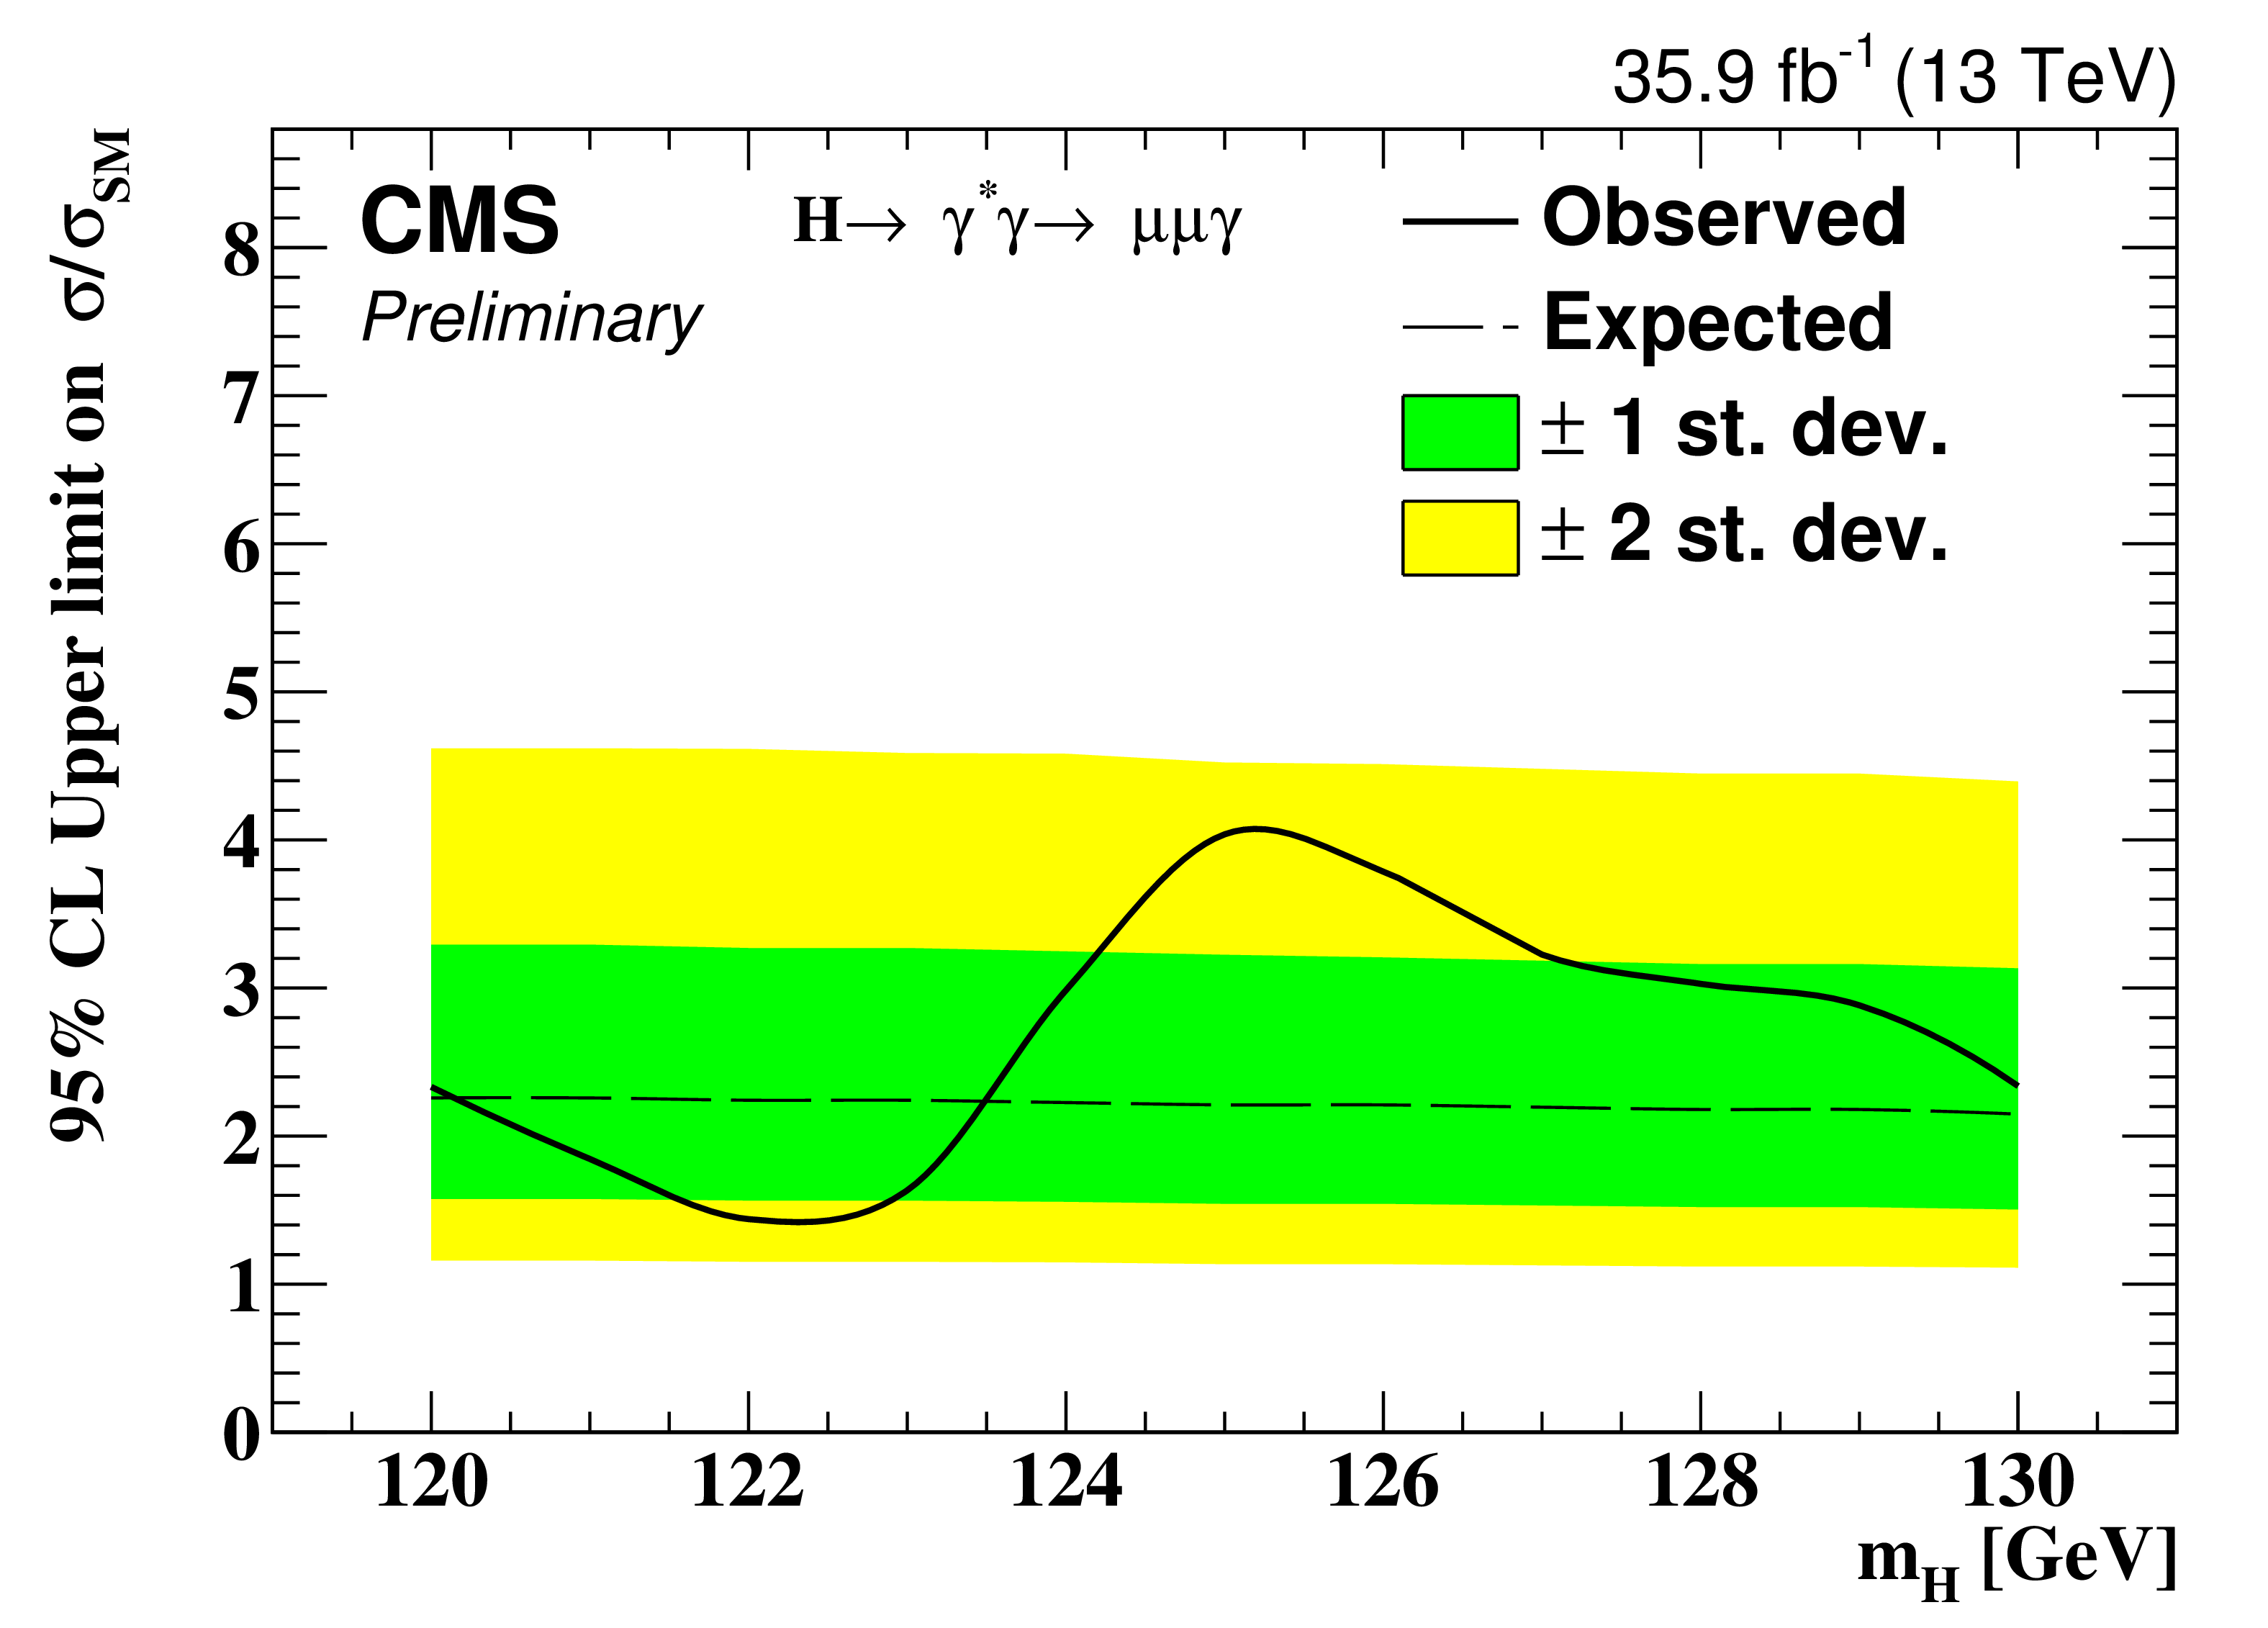
Figure 6:
Exclusion limit, at 95% confidence level, on the cross section of $ {\mathrm {H}} \to \gamma ^*\gamma \to \mu \mu \gamma $ as a function of the Higgs boson mass based on 35.9 fb$^{-1}$ of data taken at 13 TeV. |
png pdf |
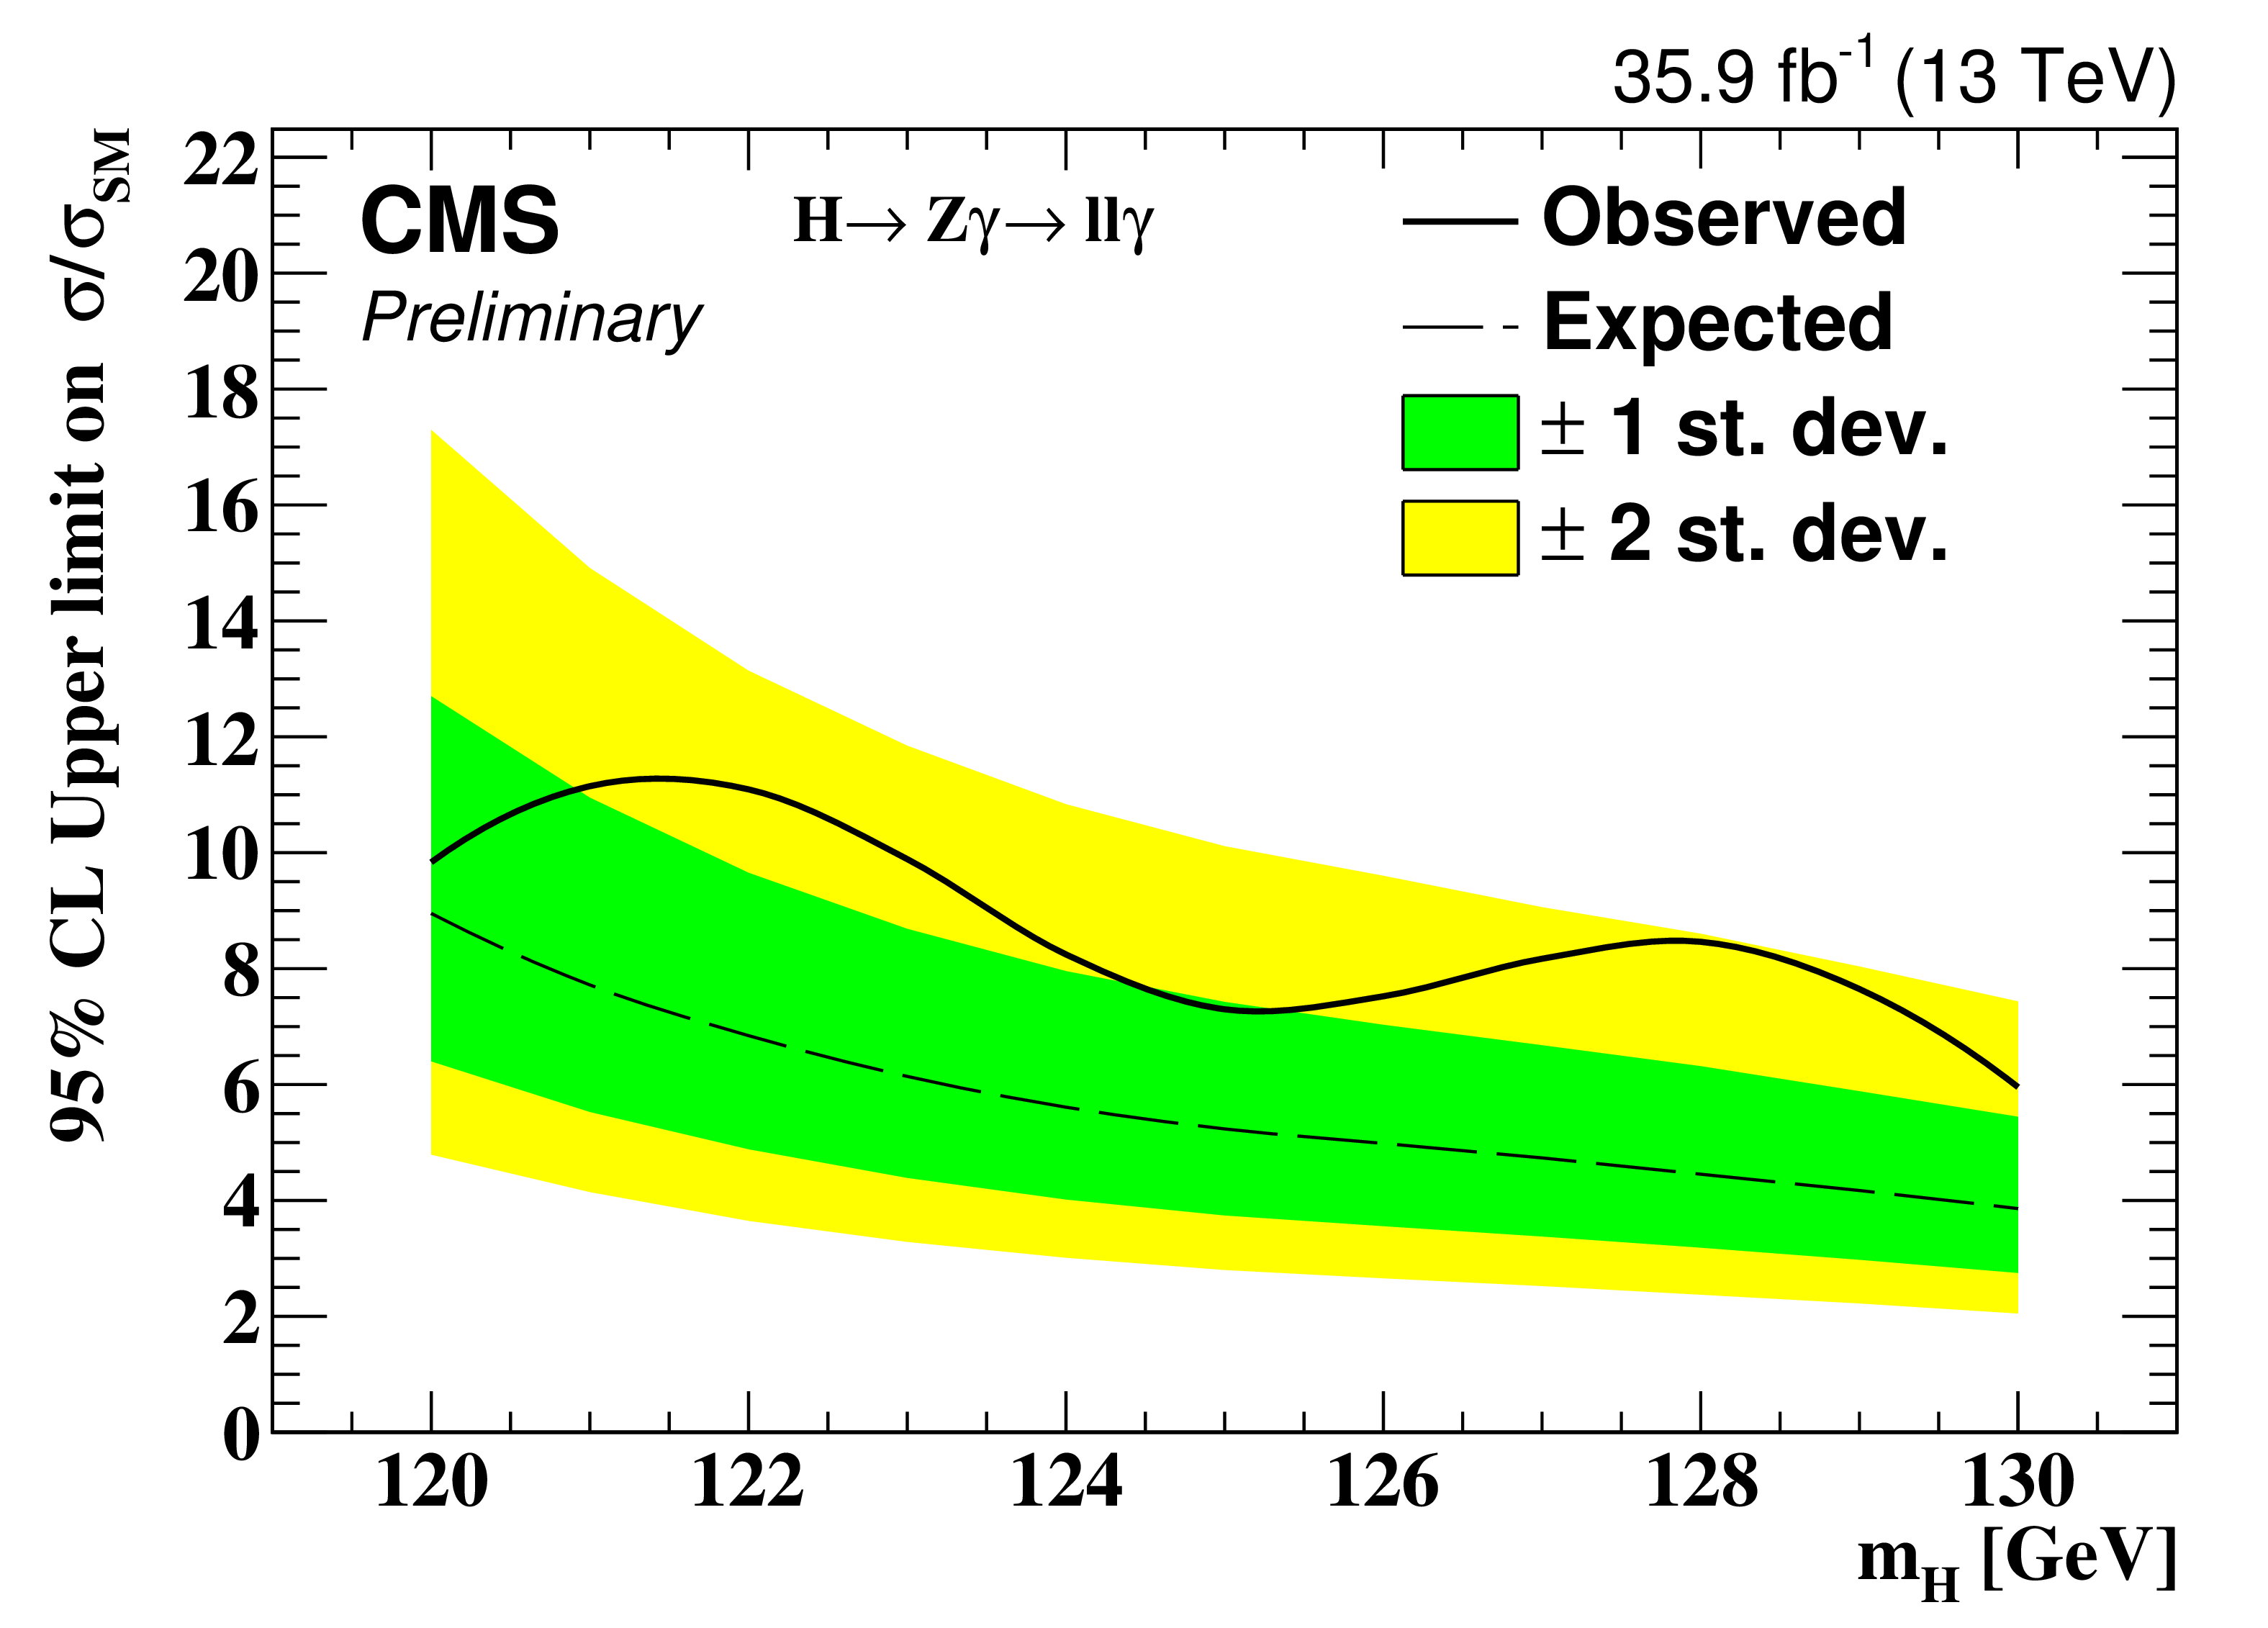
Figure 7:
Exclusion limit, at 95% confidence level, on the cross section of $ {\mathrm {H}} \rightarrow Z\gamma \rightarrow \ell \ell \gamma $ as a function of the Higgs boson mass based on 35.9 fb$^{-1}$ of data taken at 13 TeV. |
png pdf |
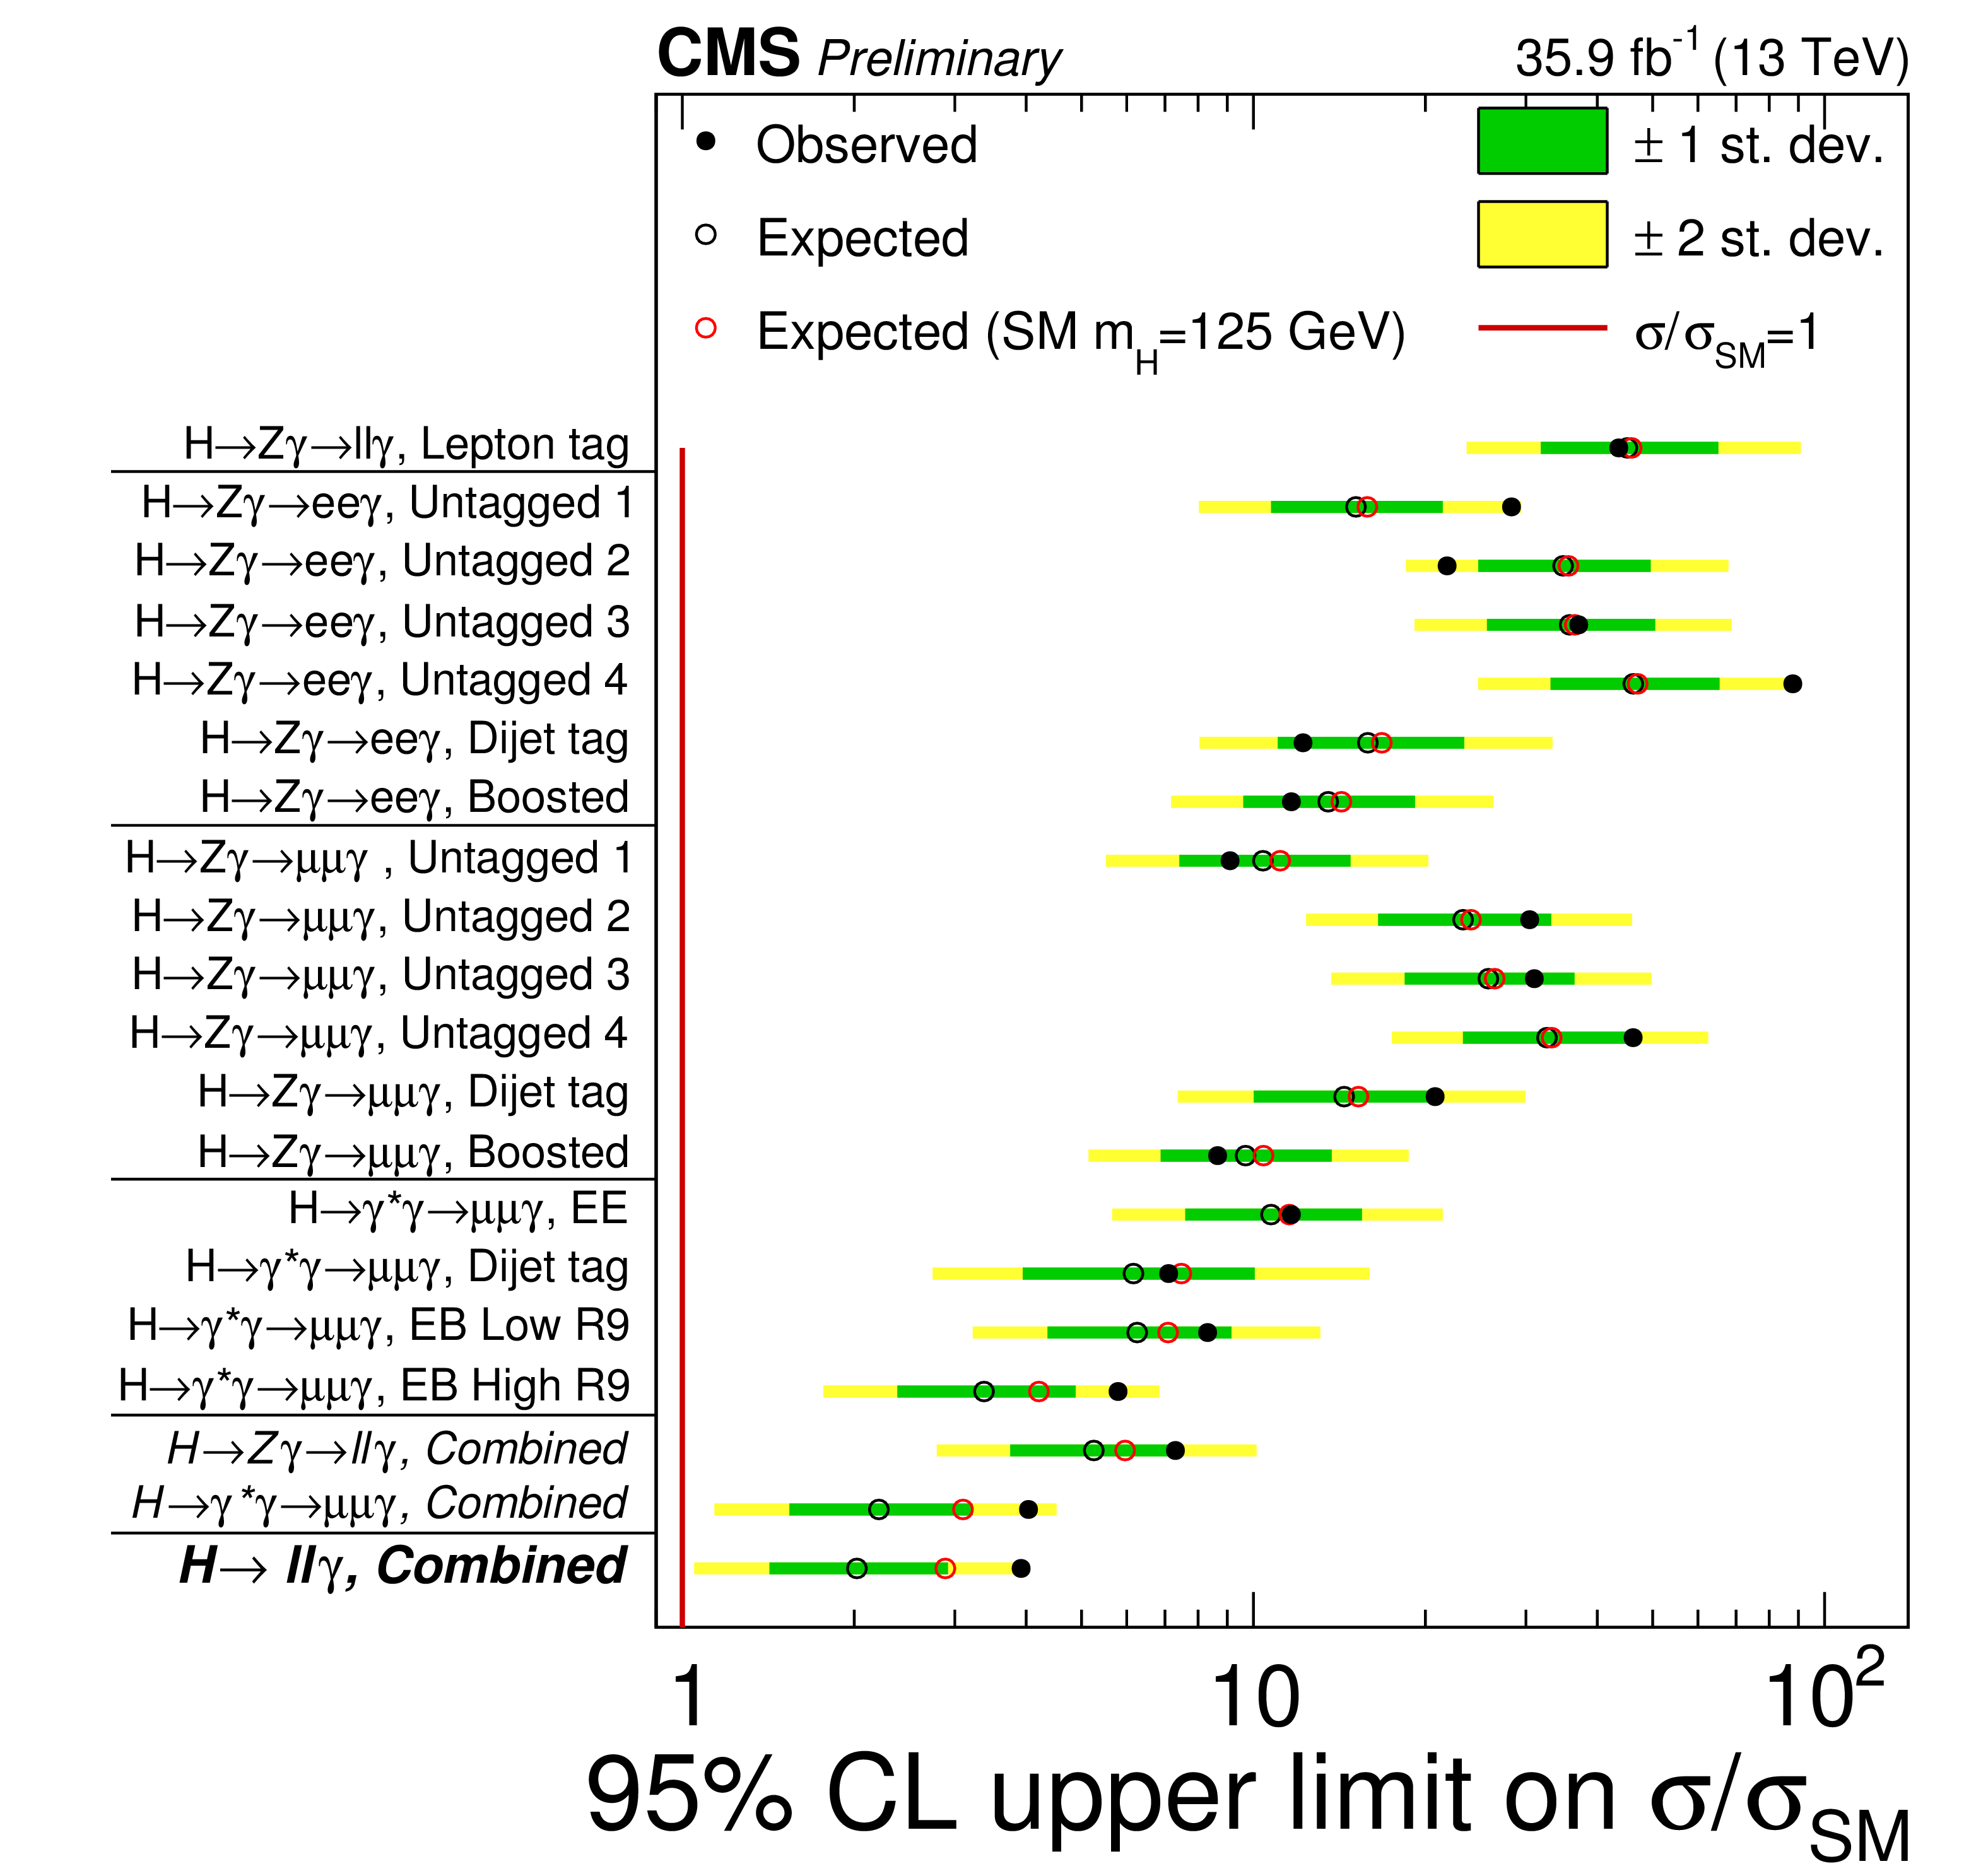
Figure 8:
Exclusion limit, at 95% confidence level, on the cross section of $ {\mathrm {H}} \rightarrow \ell \ell \gamma $ for a SM Higgs boson of $m_ {\mathrm {H}} = $ 125 GeV. The upper limits of each analysis category, as well as their combinations, are shown. Black full (empty) circles show the observed (expected) limit. Red circles show the expected upper limit assuming a SM Higgs boson decaying to $\ell \ell \gamma $ decay channel. |
| Tables | |
png pdf |
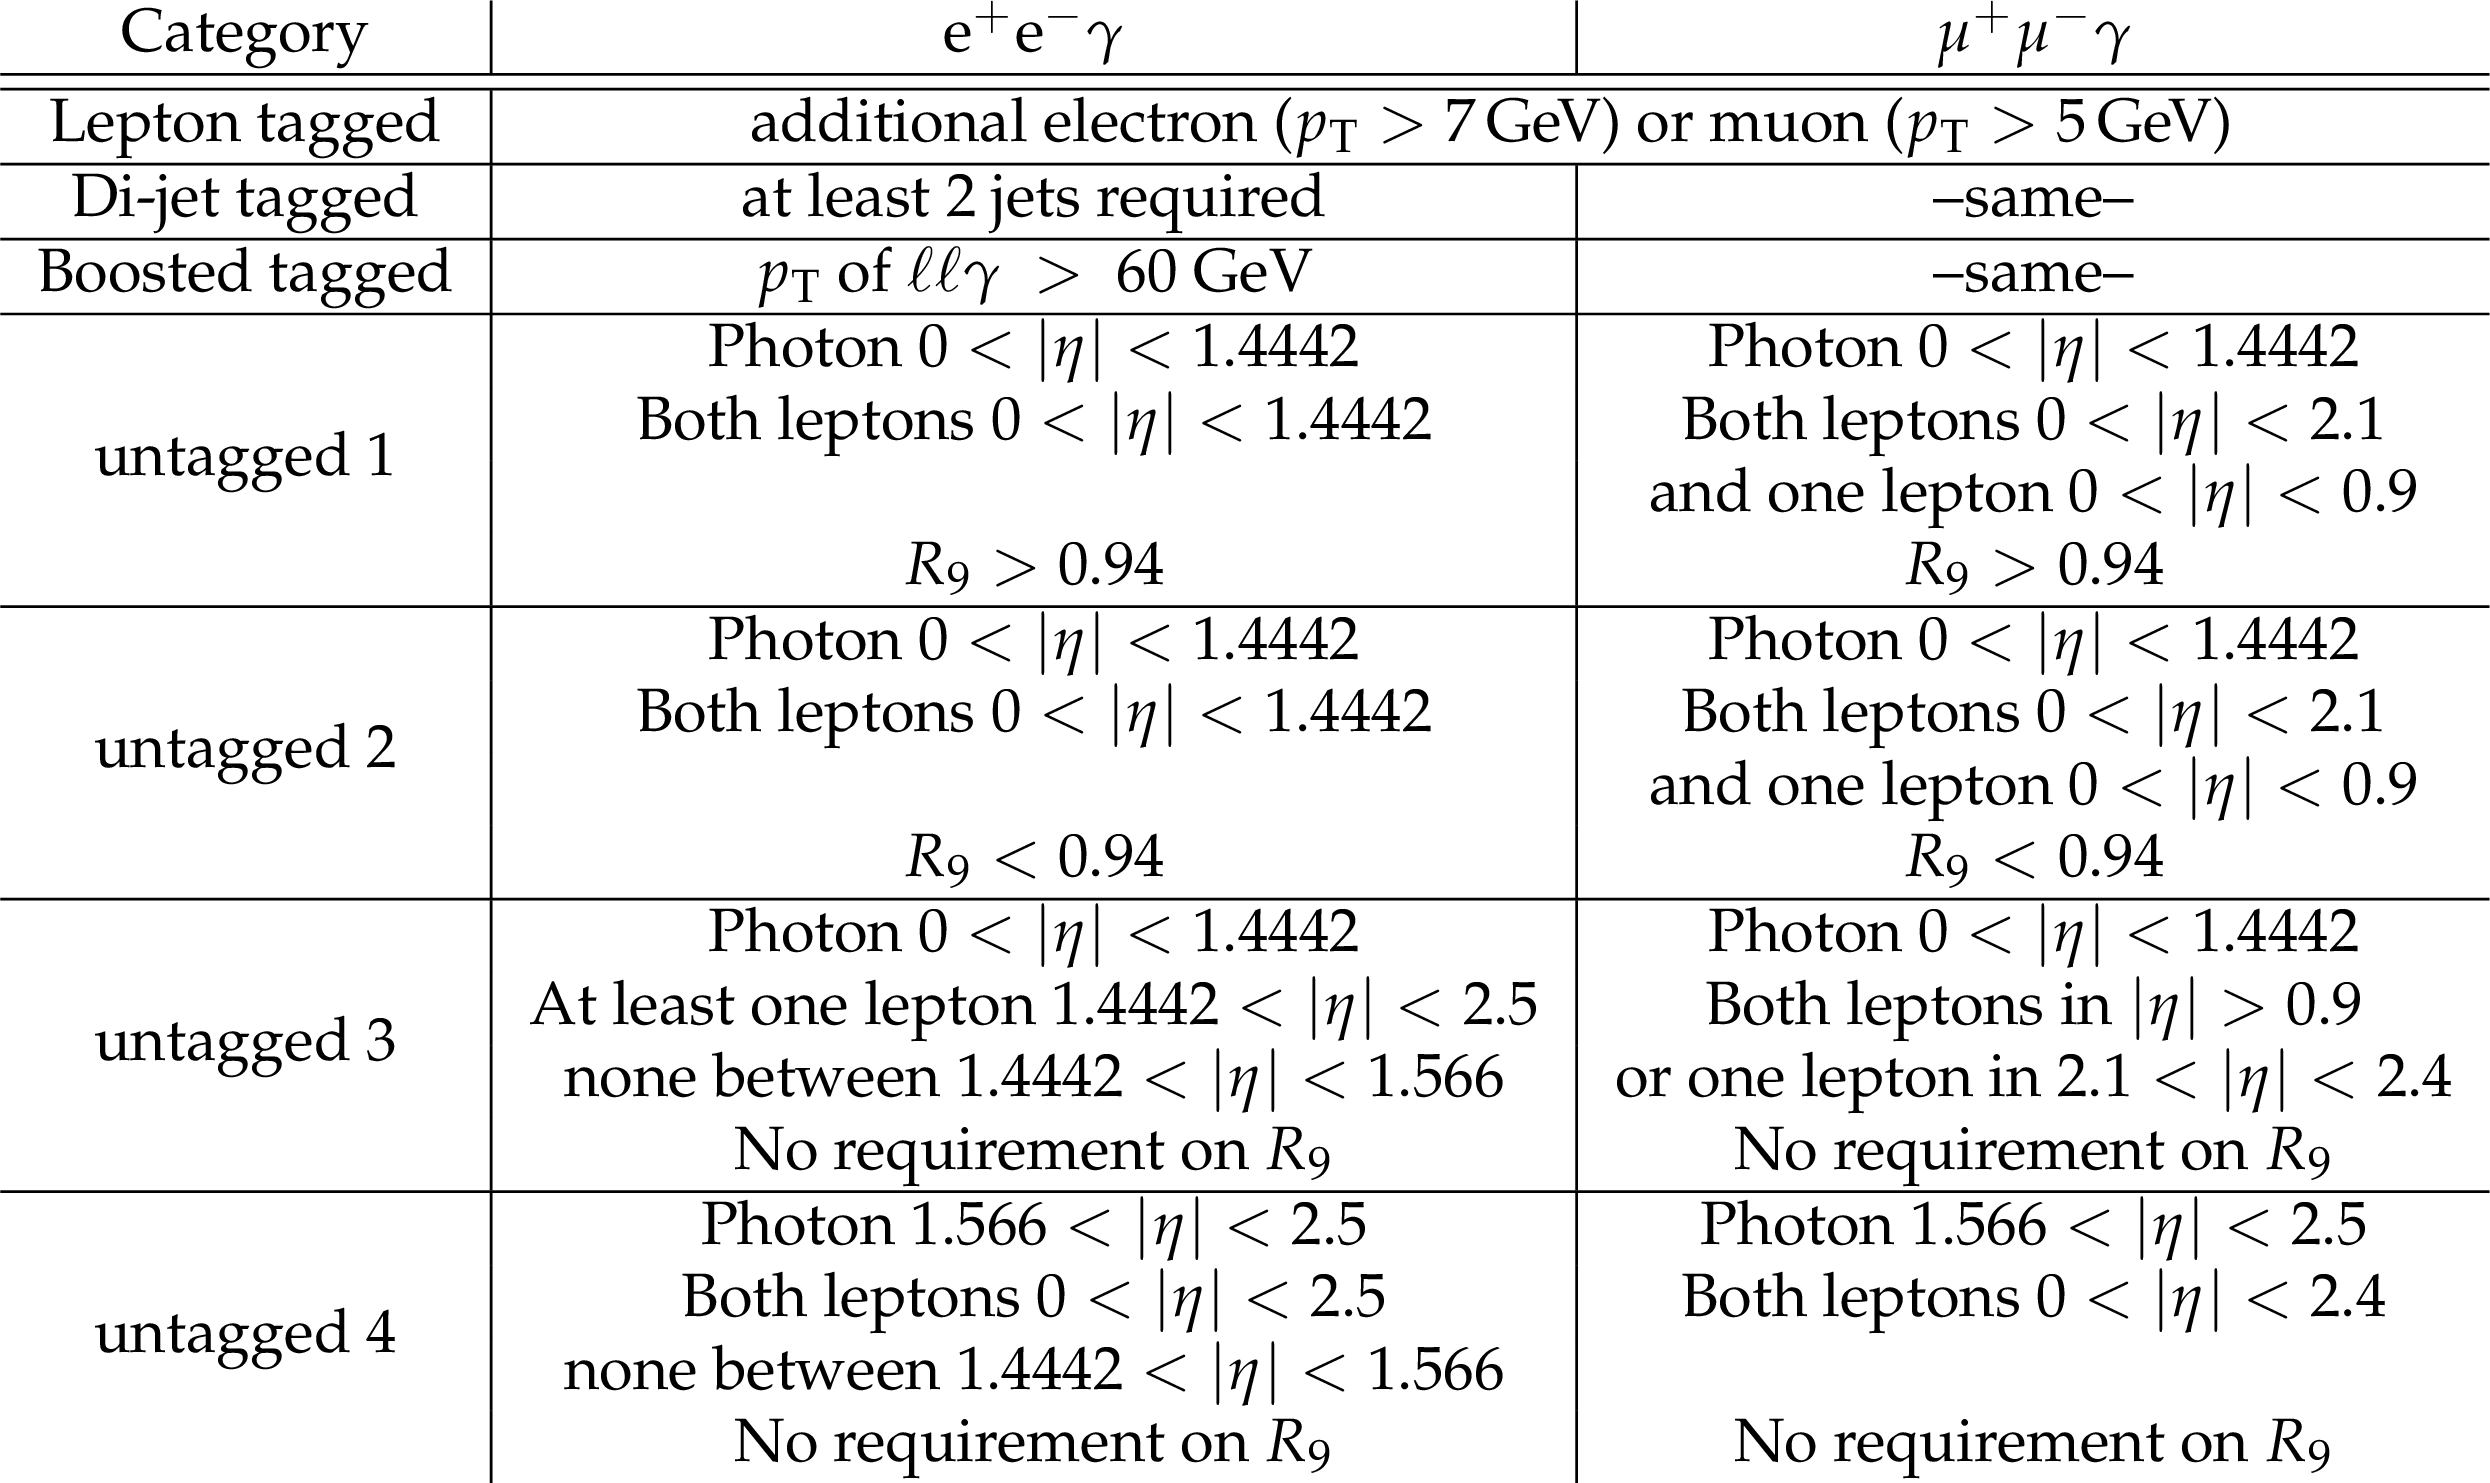
Table 1:
Categories in $ {\mathrm {H}} \to {\mathrm {Z}}\gamma \to \ell \ell \gamma $. |
png pdf |
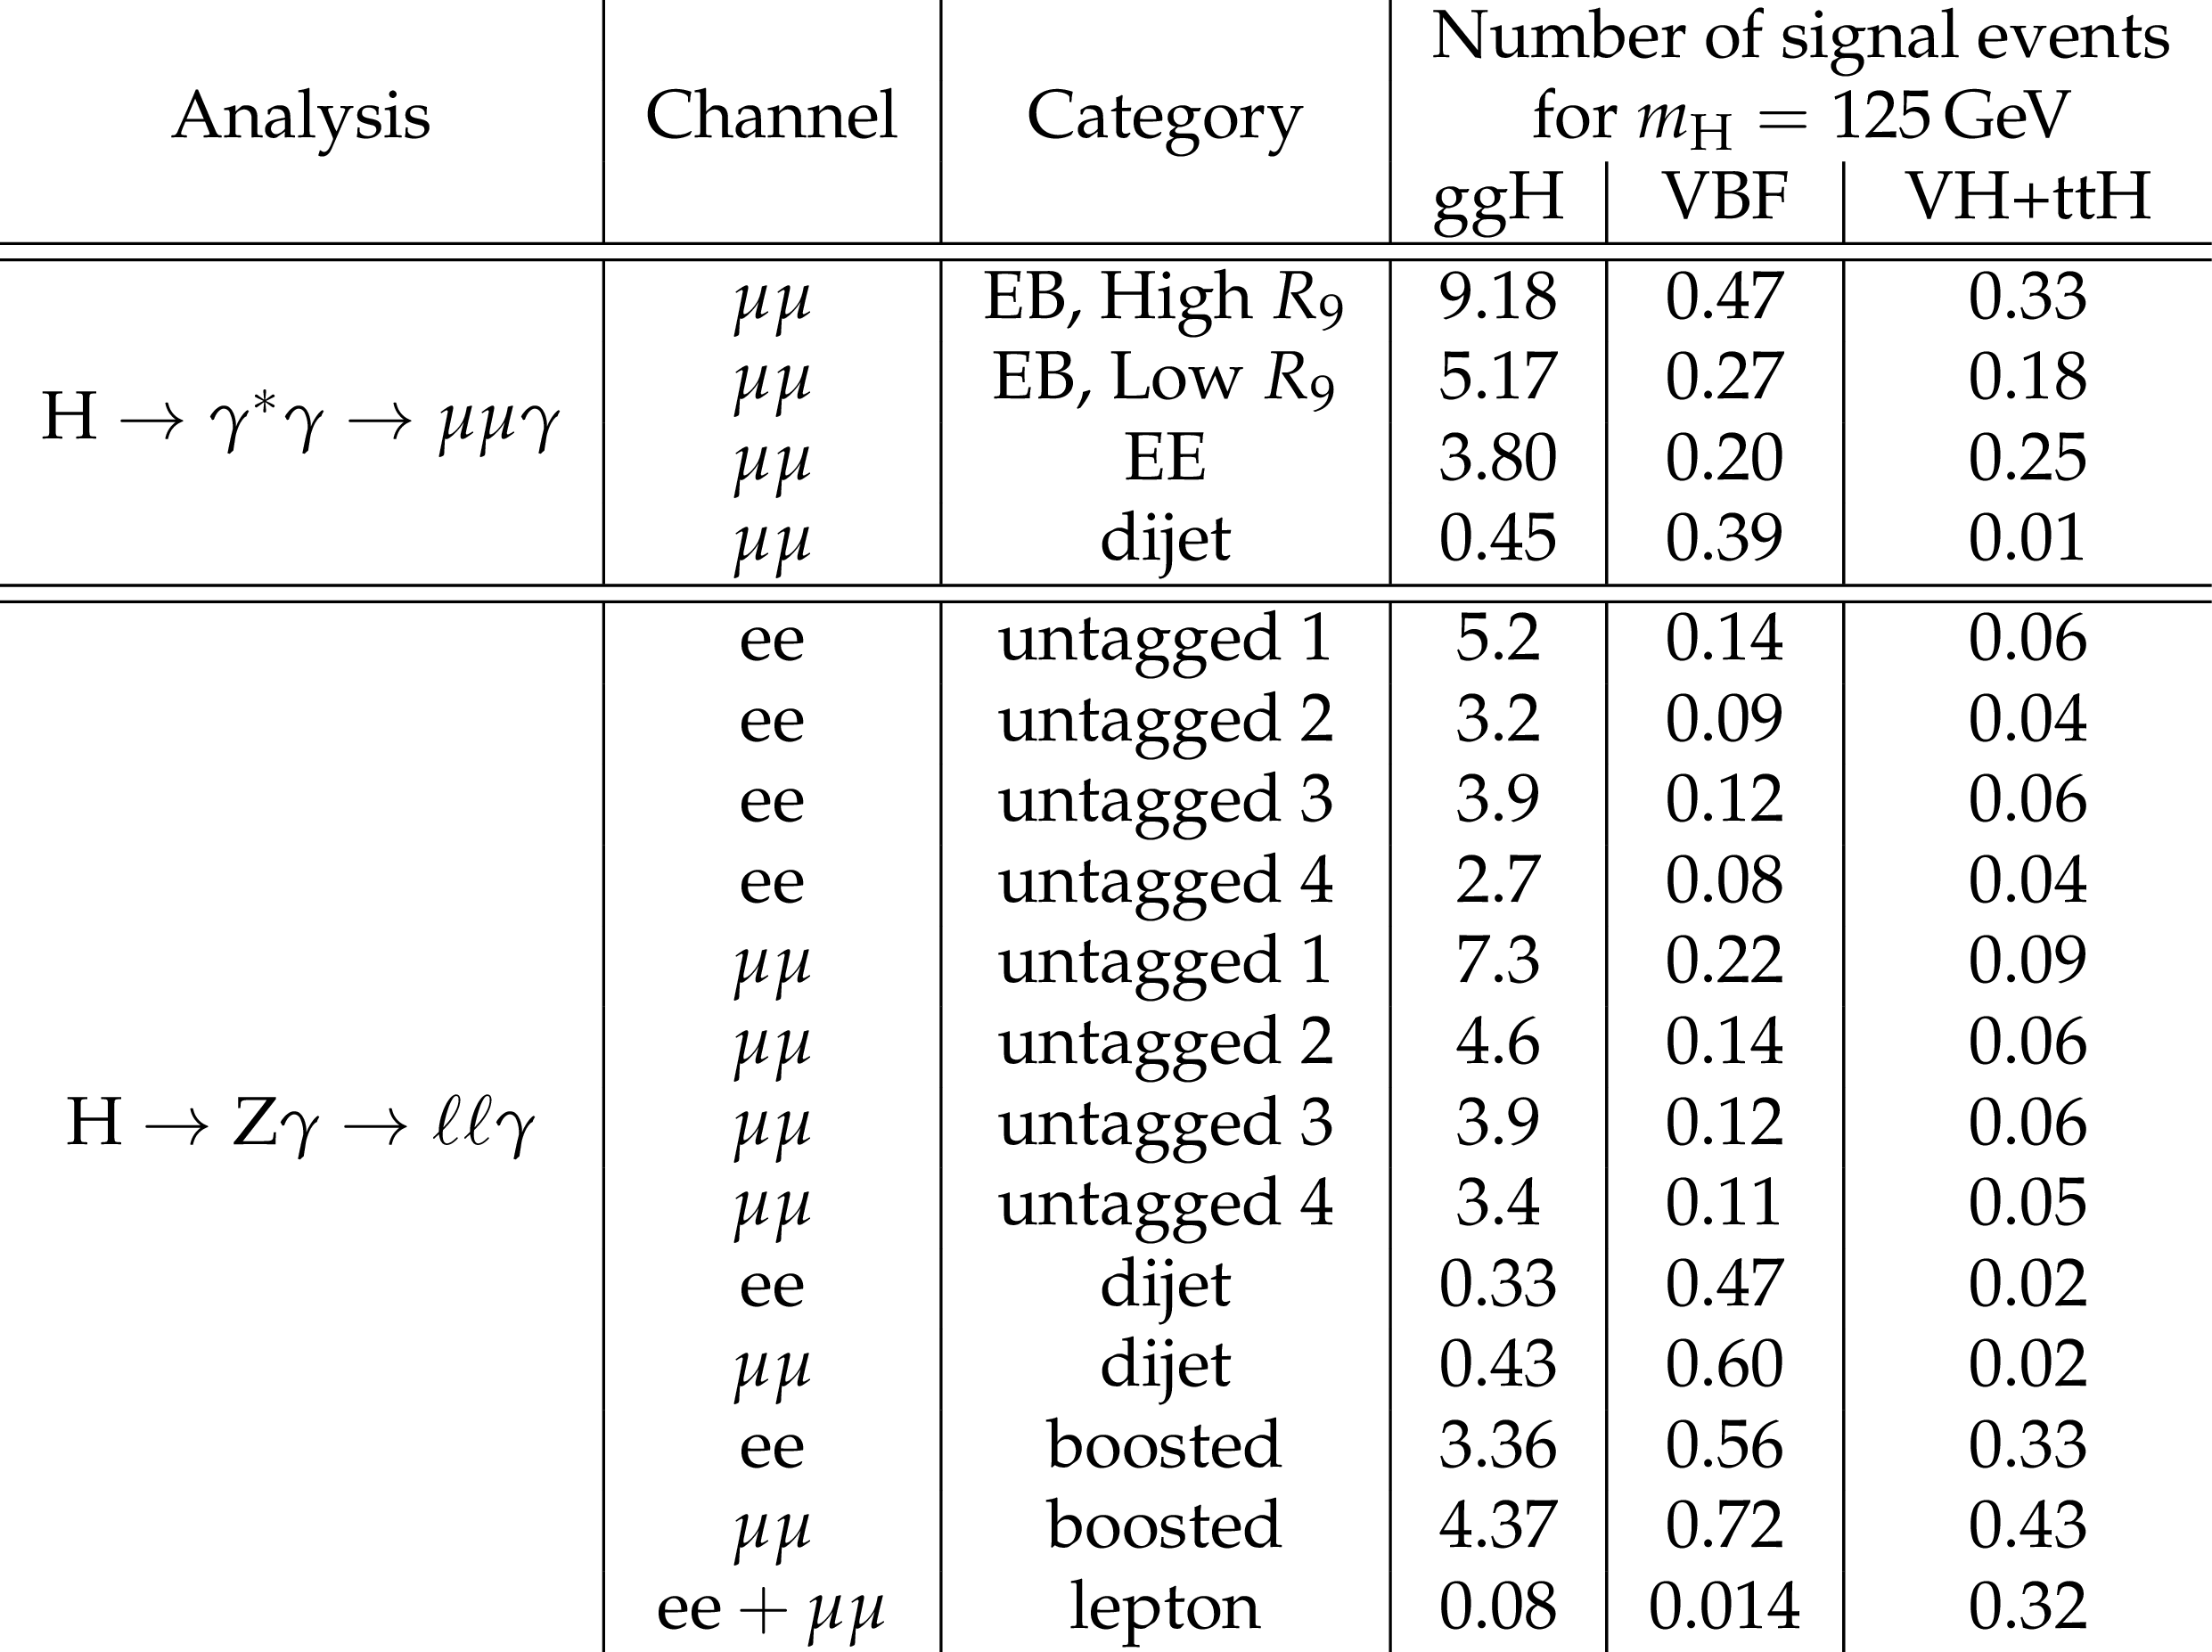
Table 2:
Expected signal yields for a 125 GeV SM Higgs boson for all the categories in $ {\mathrm {H}} \to \gamma ^*\gamma \to \mu \mu \gamma $ and $ {\mathrm {H}} \to {\mathrm {Z}}\gamma \to \ell \ell \gamma $, in the narrowest mass window around 125 GeV containing 68.3% of the expected signal distribution. |
png pdf |
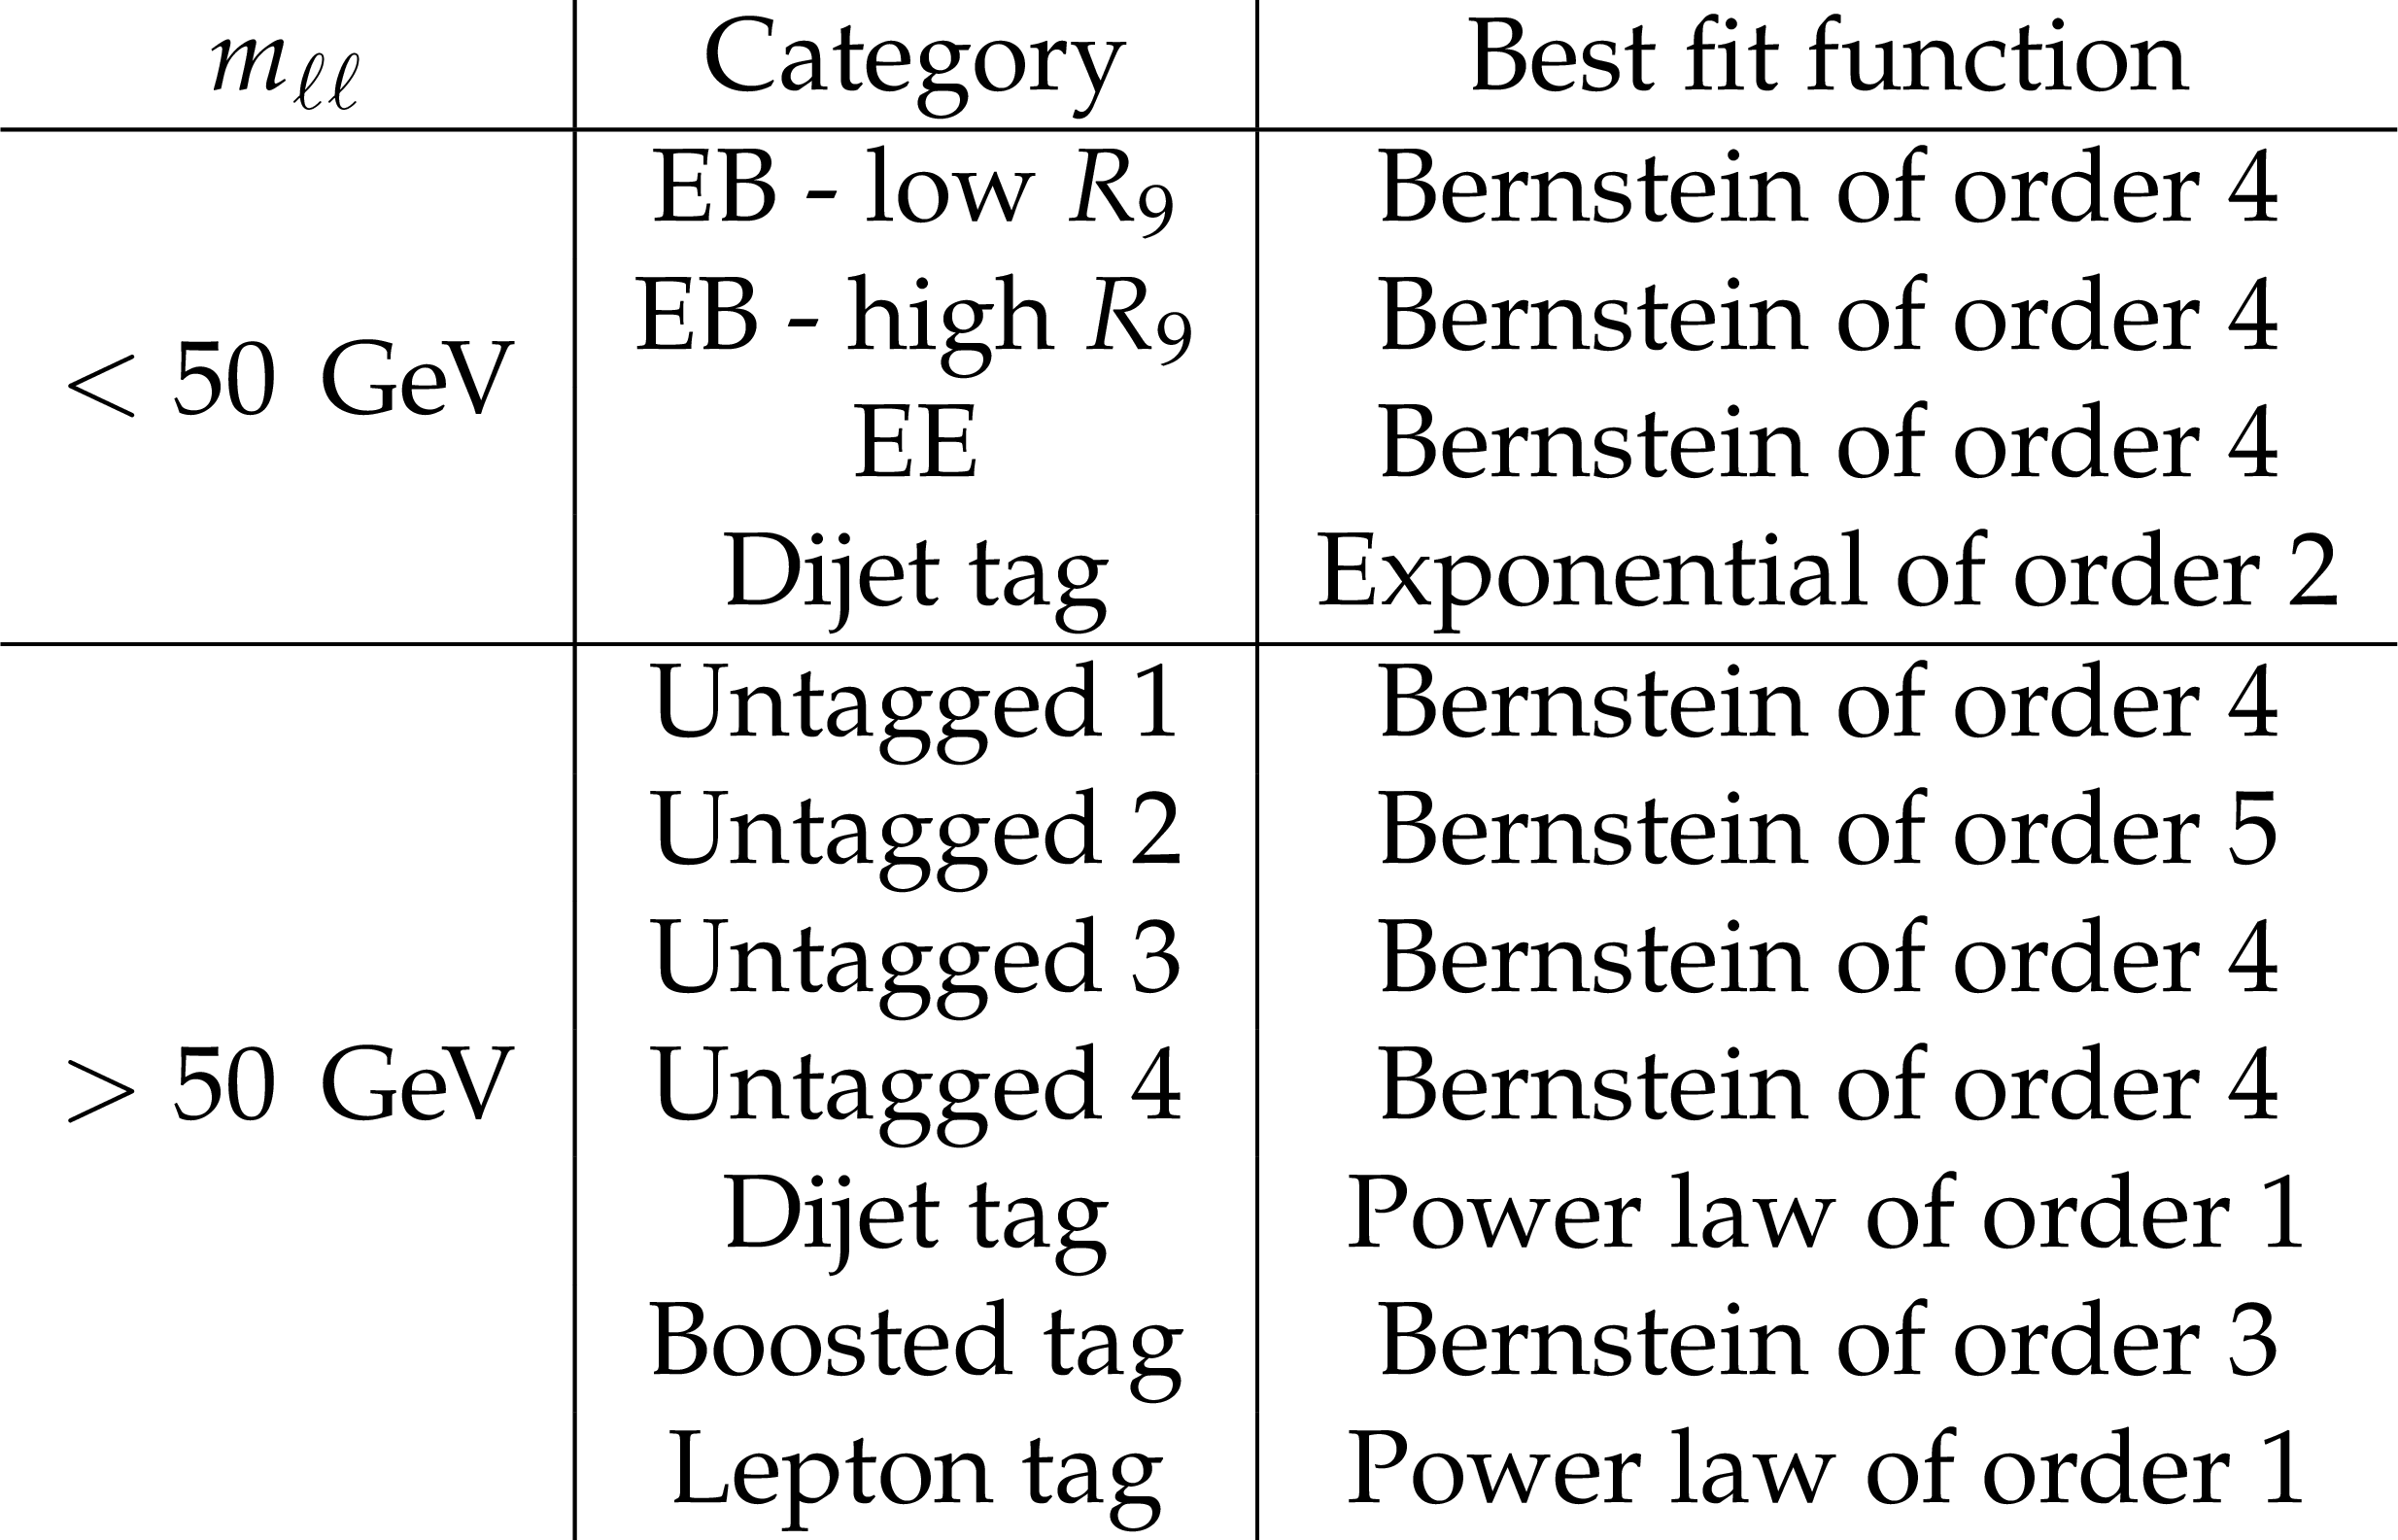
Table 3:
Fit function chosen as a result of the bias study used in the analysis. |
png pdf |
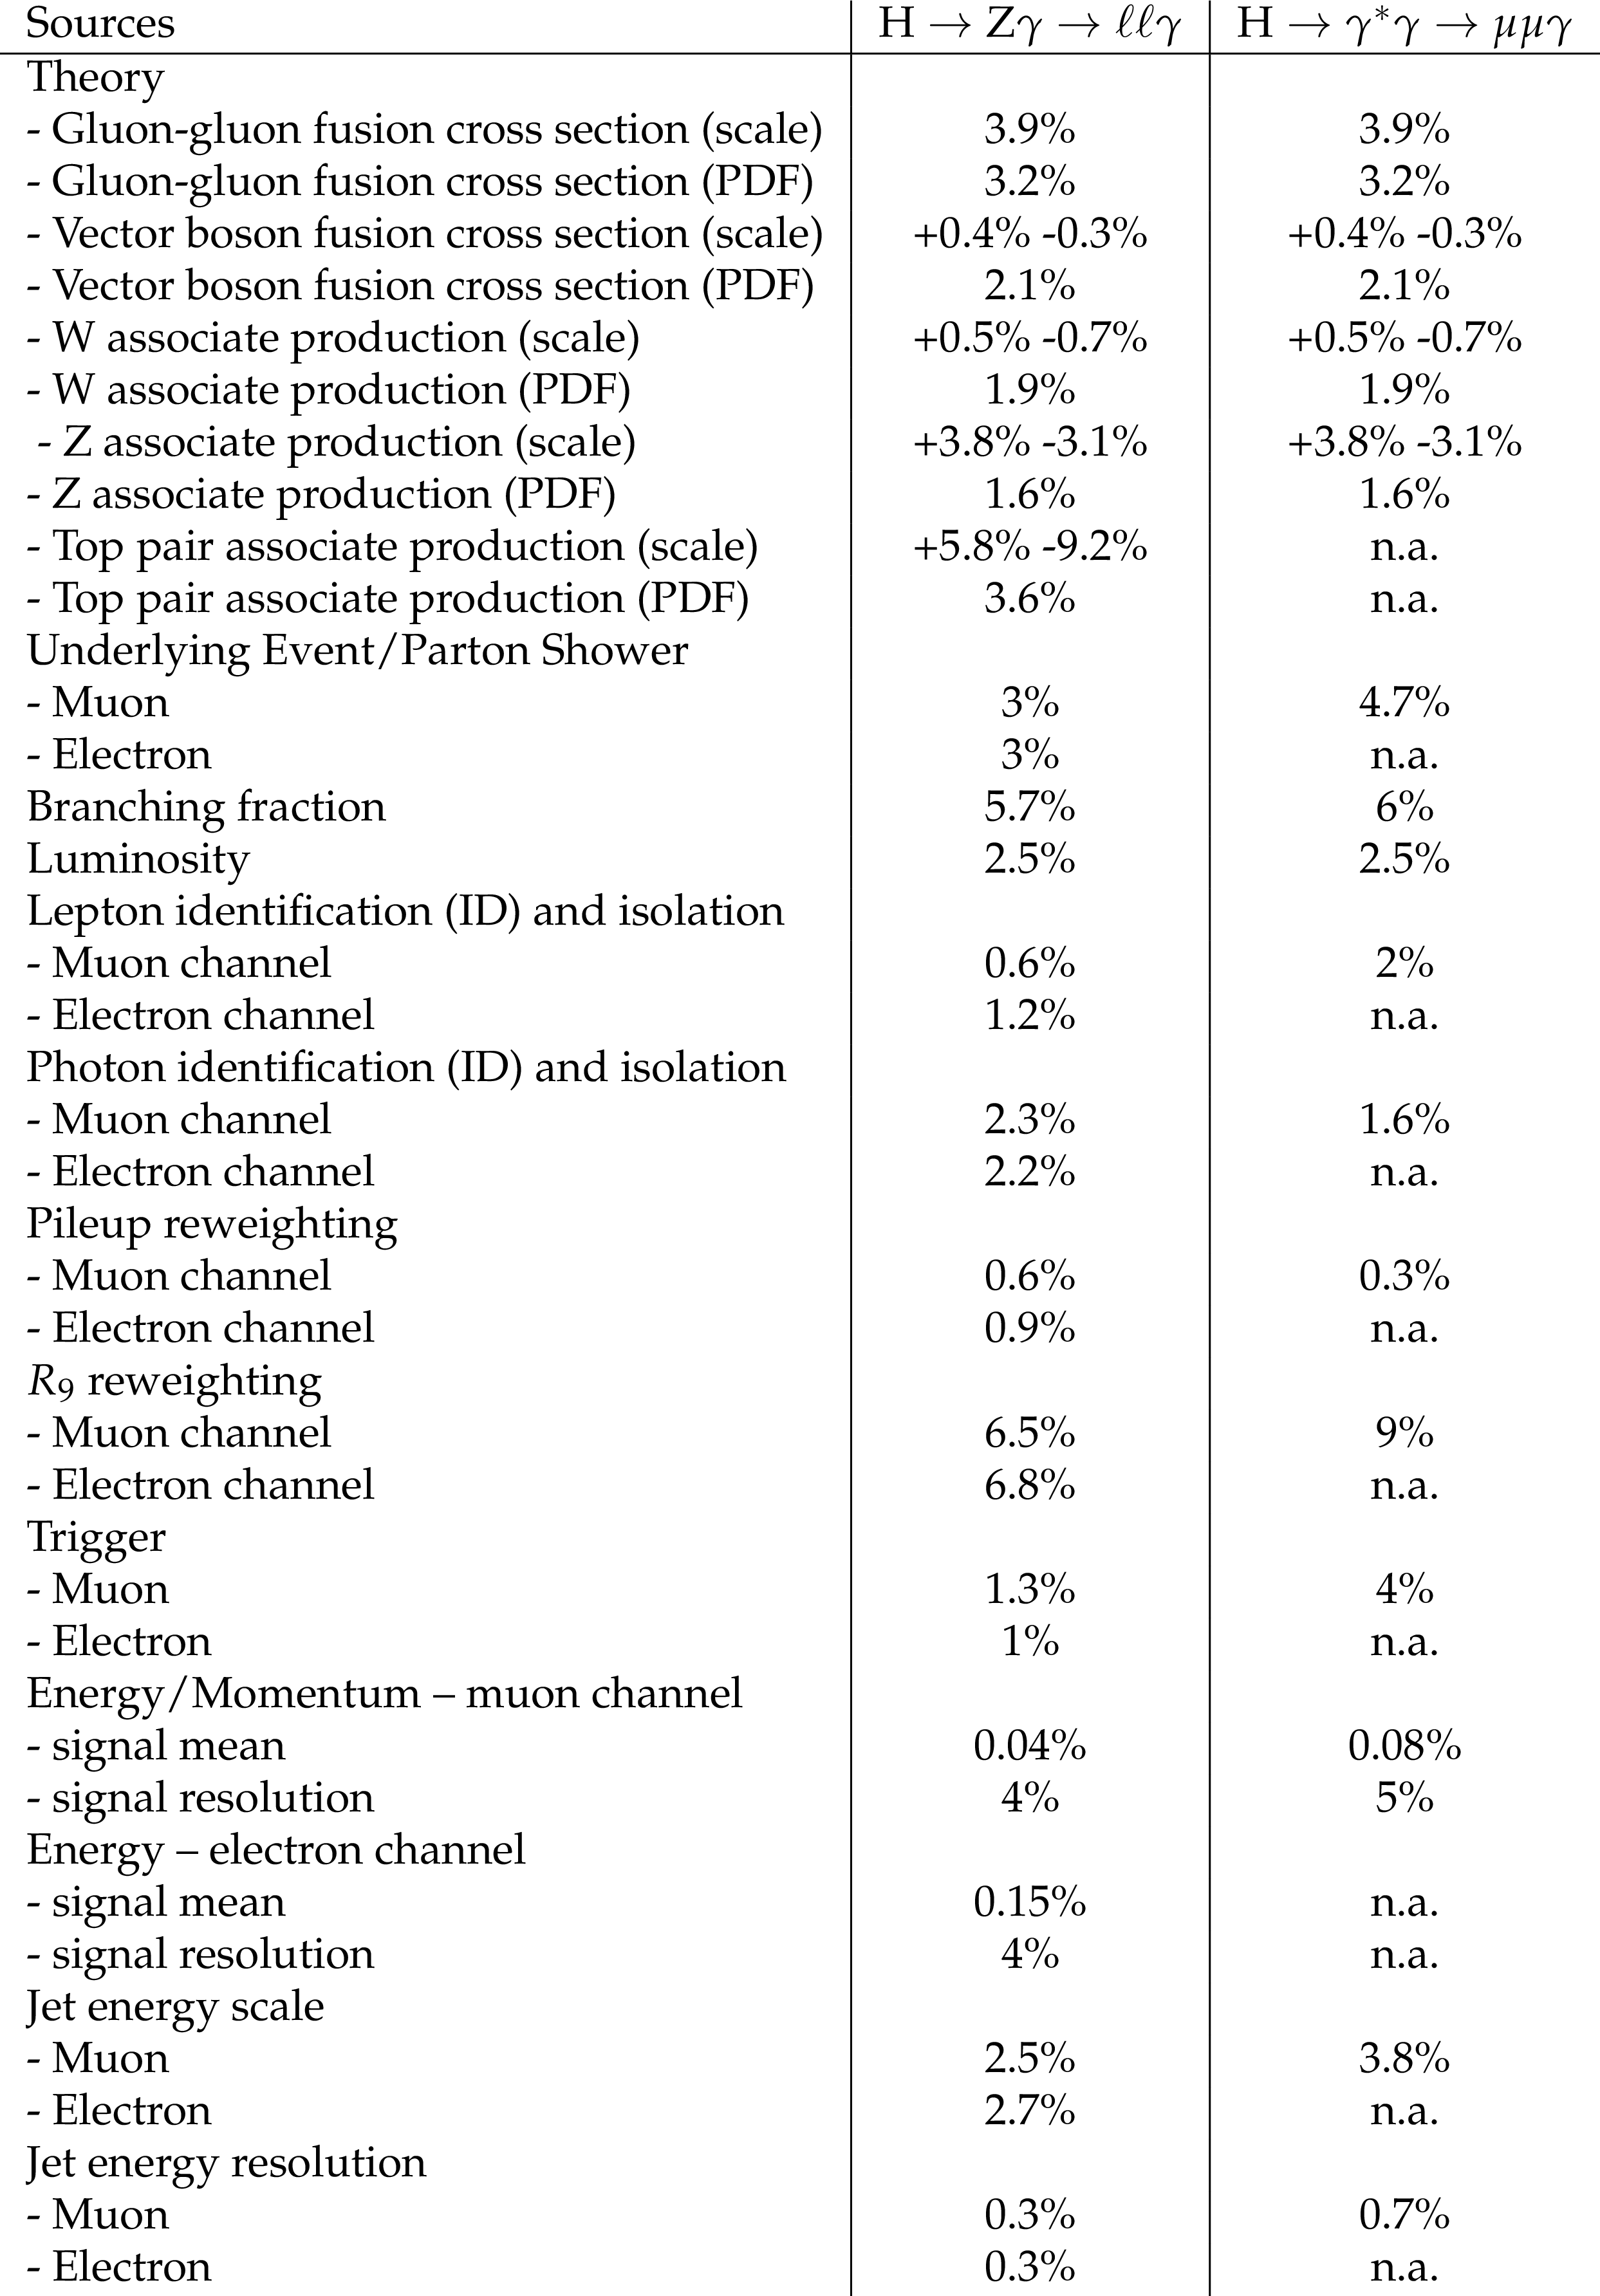
Table 4:
Sources of systematic uncertainties considered in the $ {\mathrm {H}} \to {\mathrm {Z}}\gamma \to \ell \ell \gamma $ and $ {\mathrm {H}} \to \gamma ^*\gamma \to \mu \mu \gamma $ analyses. The pre-fit values of the nuisance parameters are shown averaged over all the categories in the analysis in the second column which either affect the normalization of the simulated signal event yields or the mean and resolution of $m_{\ell \ell \gamma}$. |
| Summary |
| A search has been performed for a SM Higgs boson decaying into a dilepton and a photon. The analysis uses a dataset from proton-proton collisions at a center-of-mass energy of 13 TeV, corresponding to an integrated luminosity of 35.9 fb$^{-1}$. No significant excess has been found and the limits on the Higgs production cross section times the corresponding branching fractions at the LHC have been derived. The expected exclusion limits at 95% confidence level are around 2.3-2.1 (9-3) times the SM cross section in the $\mathrm{H}\to\gamma^*\gamma\to\mu\mu\gamma$ ($\mathrm{H}\to\mathrm{Z}\gamma\to\ell\ell\gamma$) channel in the mass range from 120 and 130 GeV, and the observed limit fluctuates between about 4 and 1.4 (11 and 6) times the SM cross section. Finally, the $\mathrm{H}\to\gamma^*\gamma\to\mu\mu\gamma$ and $\mathrm{H}\to\mathrm{Z}\gamma\to\ell\ell\gamma$ analyses have been combined for $m_\mathrm{H} = $ 125 GeV, obtaining an observed (expected) 95% upper limit of 3.9 (2.0) times the standard model cross section. |
| Additional Figures | |
png pdf |
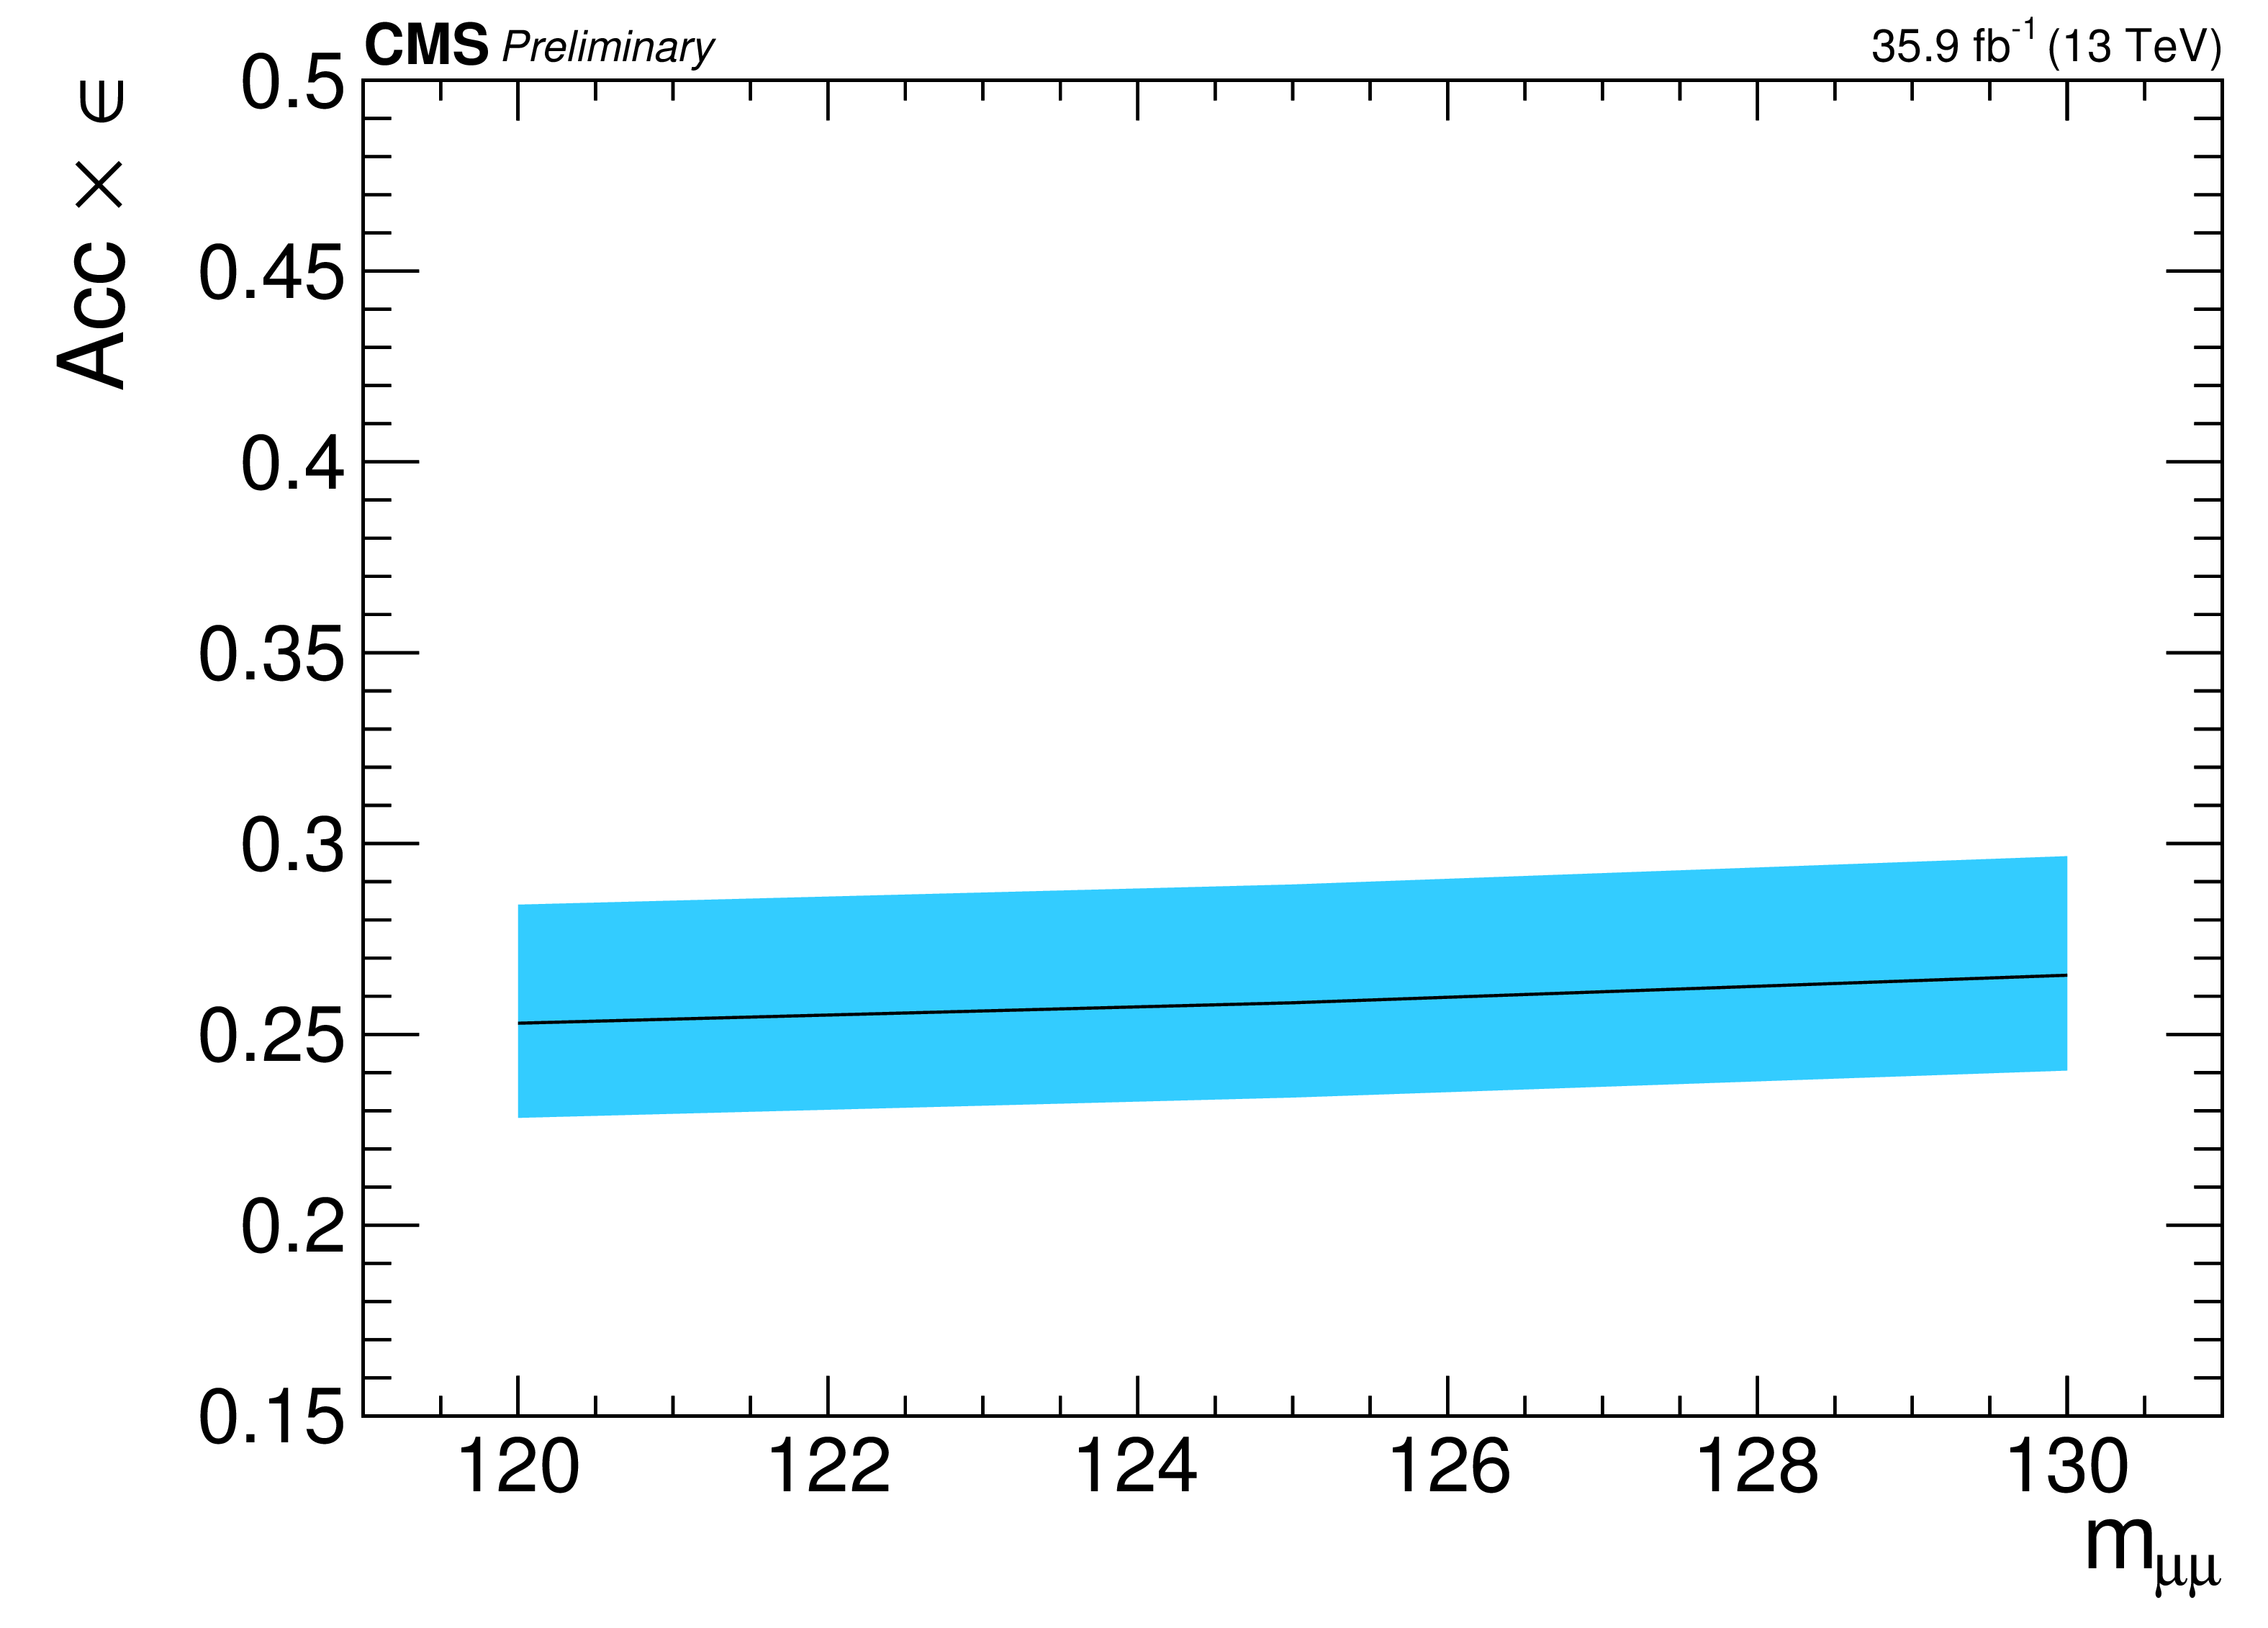
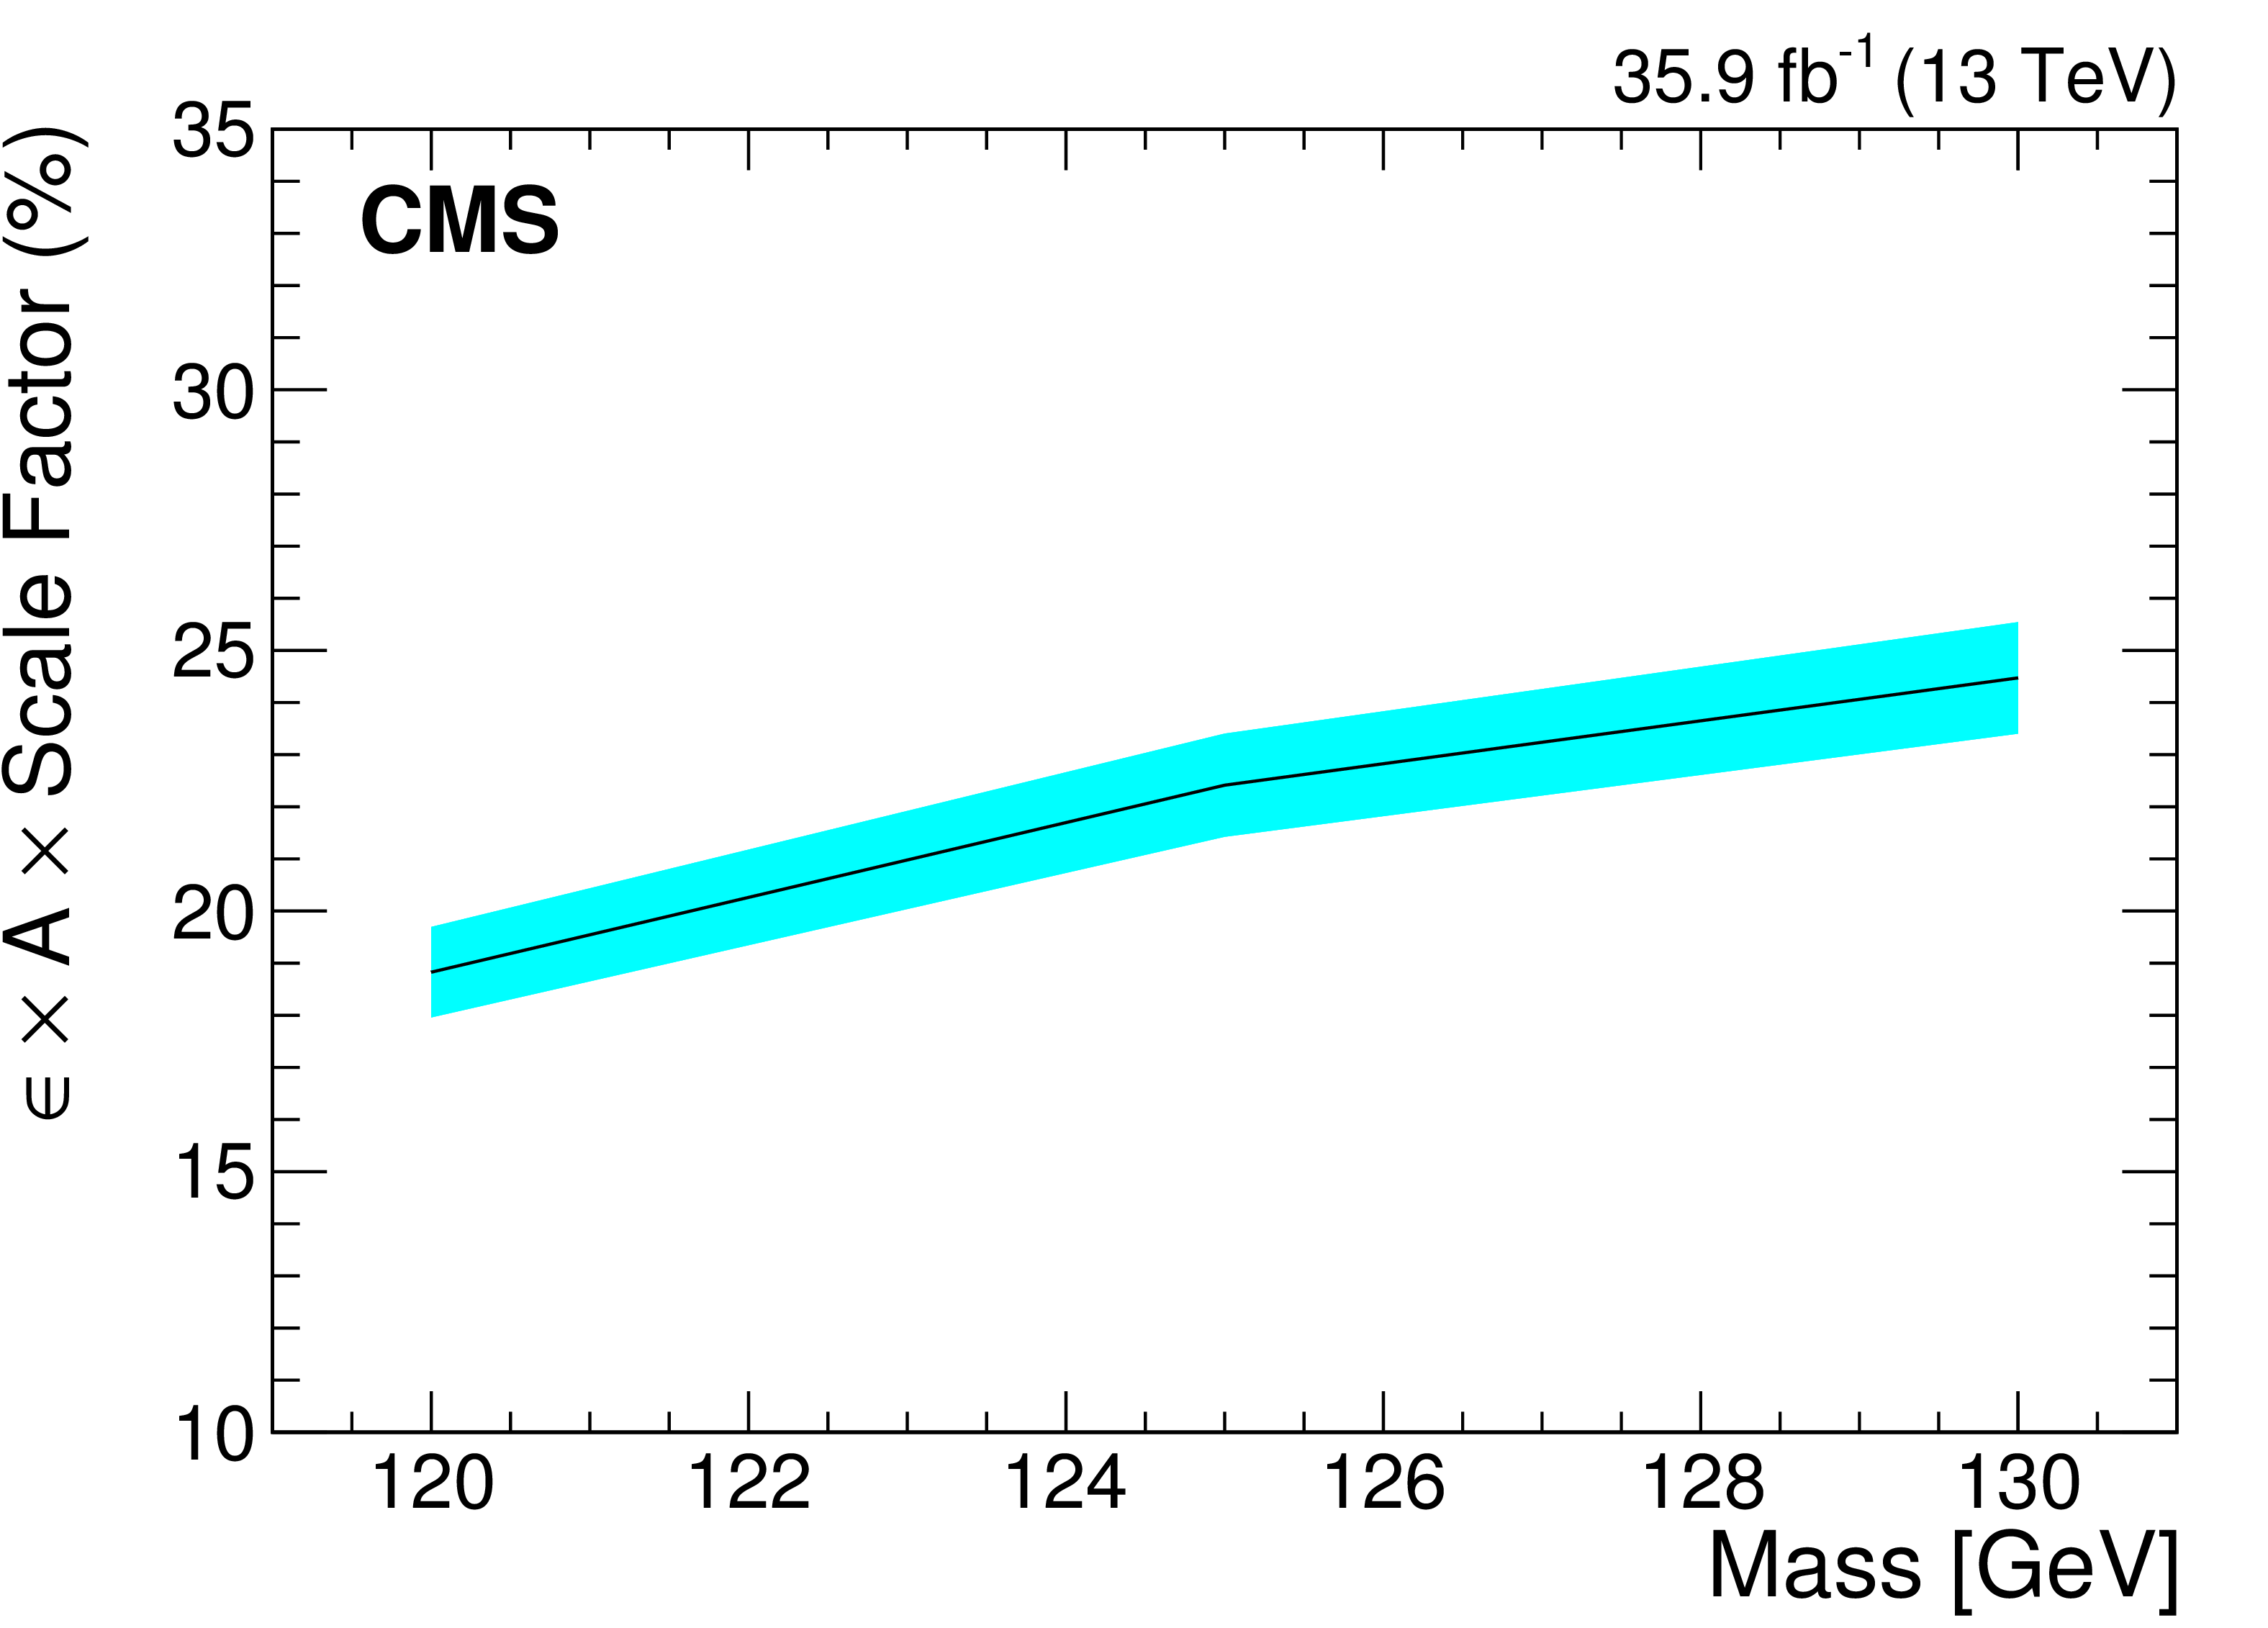
Additional Figure 1:
Final selection efficiency of the signal for $\mathrm{H} \rightarrow \gamma ^{*}\gamma \rightarrow \mu \mu \gamma $ for a $m_{\mathrm{H}}$ range from 120 GeV to 130 GeV. The error band is the $1-\sigma $ systematics uncertainty on the signal efficiency. This uncertainty includes uncertainty on lepton and photon identification scale factors (SFs), HLT SFs, pile-up reweighting and underlying event/parton shower. |
png pdf |
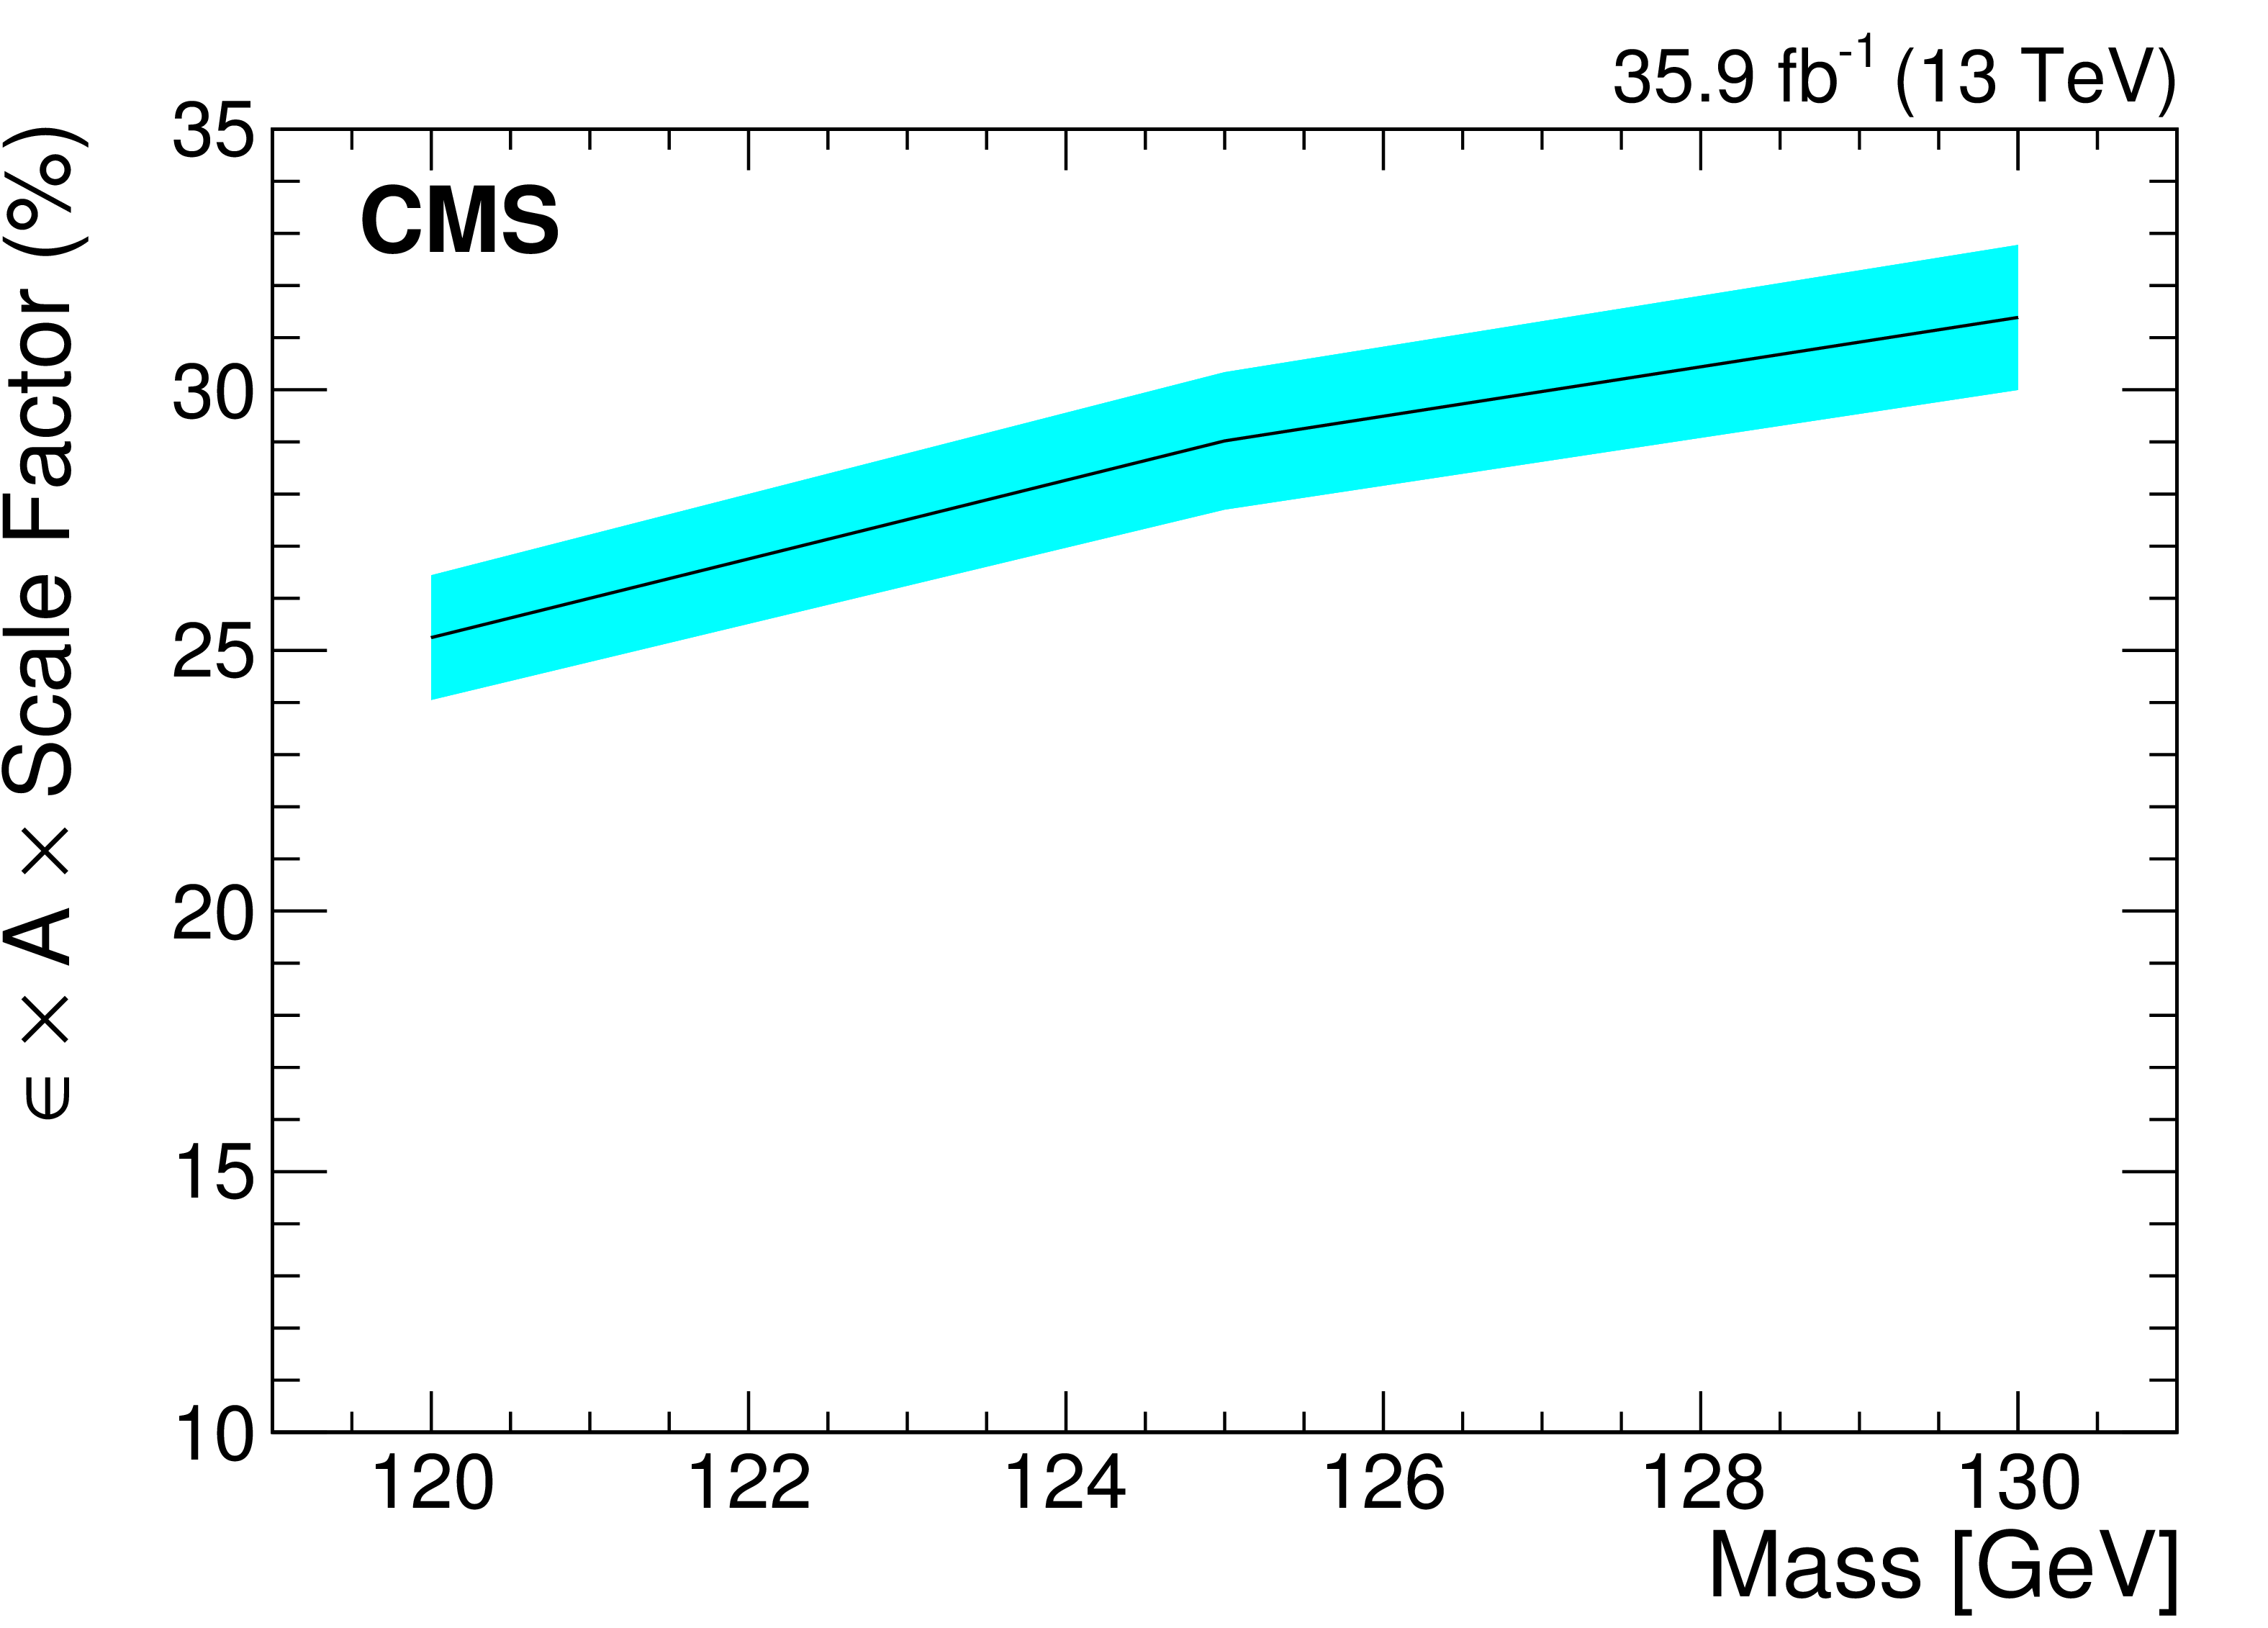
Additional Figure 2:
Final selection efficiency of the signal for $\mathrm{H} \rightarrow \mathrm{Z} \gamma \rightarrow \mathrm{e} \mathrm{e} \gamma $ for a $m_{\mathrm{H}}$ range from 120 GeV to 130 GeV. The error band is the $1-\sigma $ systematics uncertainty on the signal efficiency. This uncertainty includes uncertainty on lepton and photon identification scale factors (SFs), HLT SFs, pile-up reweighting and underlying event/parton shower. |
png pdf |
Additional Figure 3:
Final selection efficiency of the signal for $\mathrm{H} \rightarrow \mathrm{Z} \gamma \rightarrow \mu \mu \gamma $ for a $m_{\mathrm{H}}$ range from 120 GeV to 130 GeV. The error band is the $1-\sigma $ systematics uncertainty on the signal efficiency. This uncertainty includes uncertainty on lepton and photon identification scale factors (SFs), HLT SFs, pile-up reweighting and underlying event/parton shower. |
png pdf |
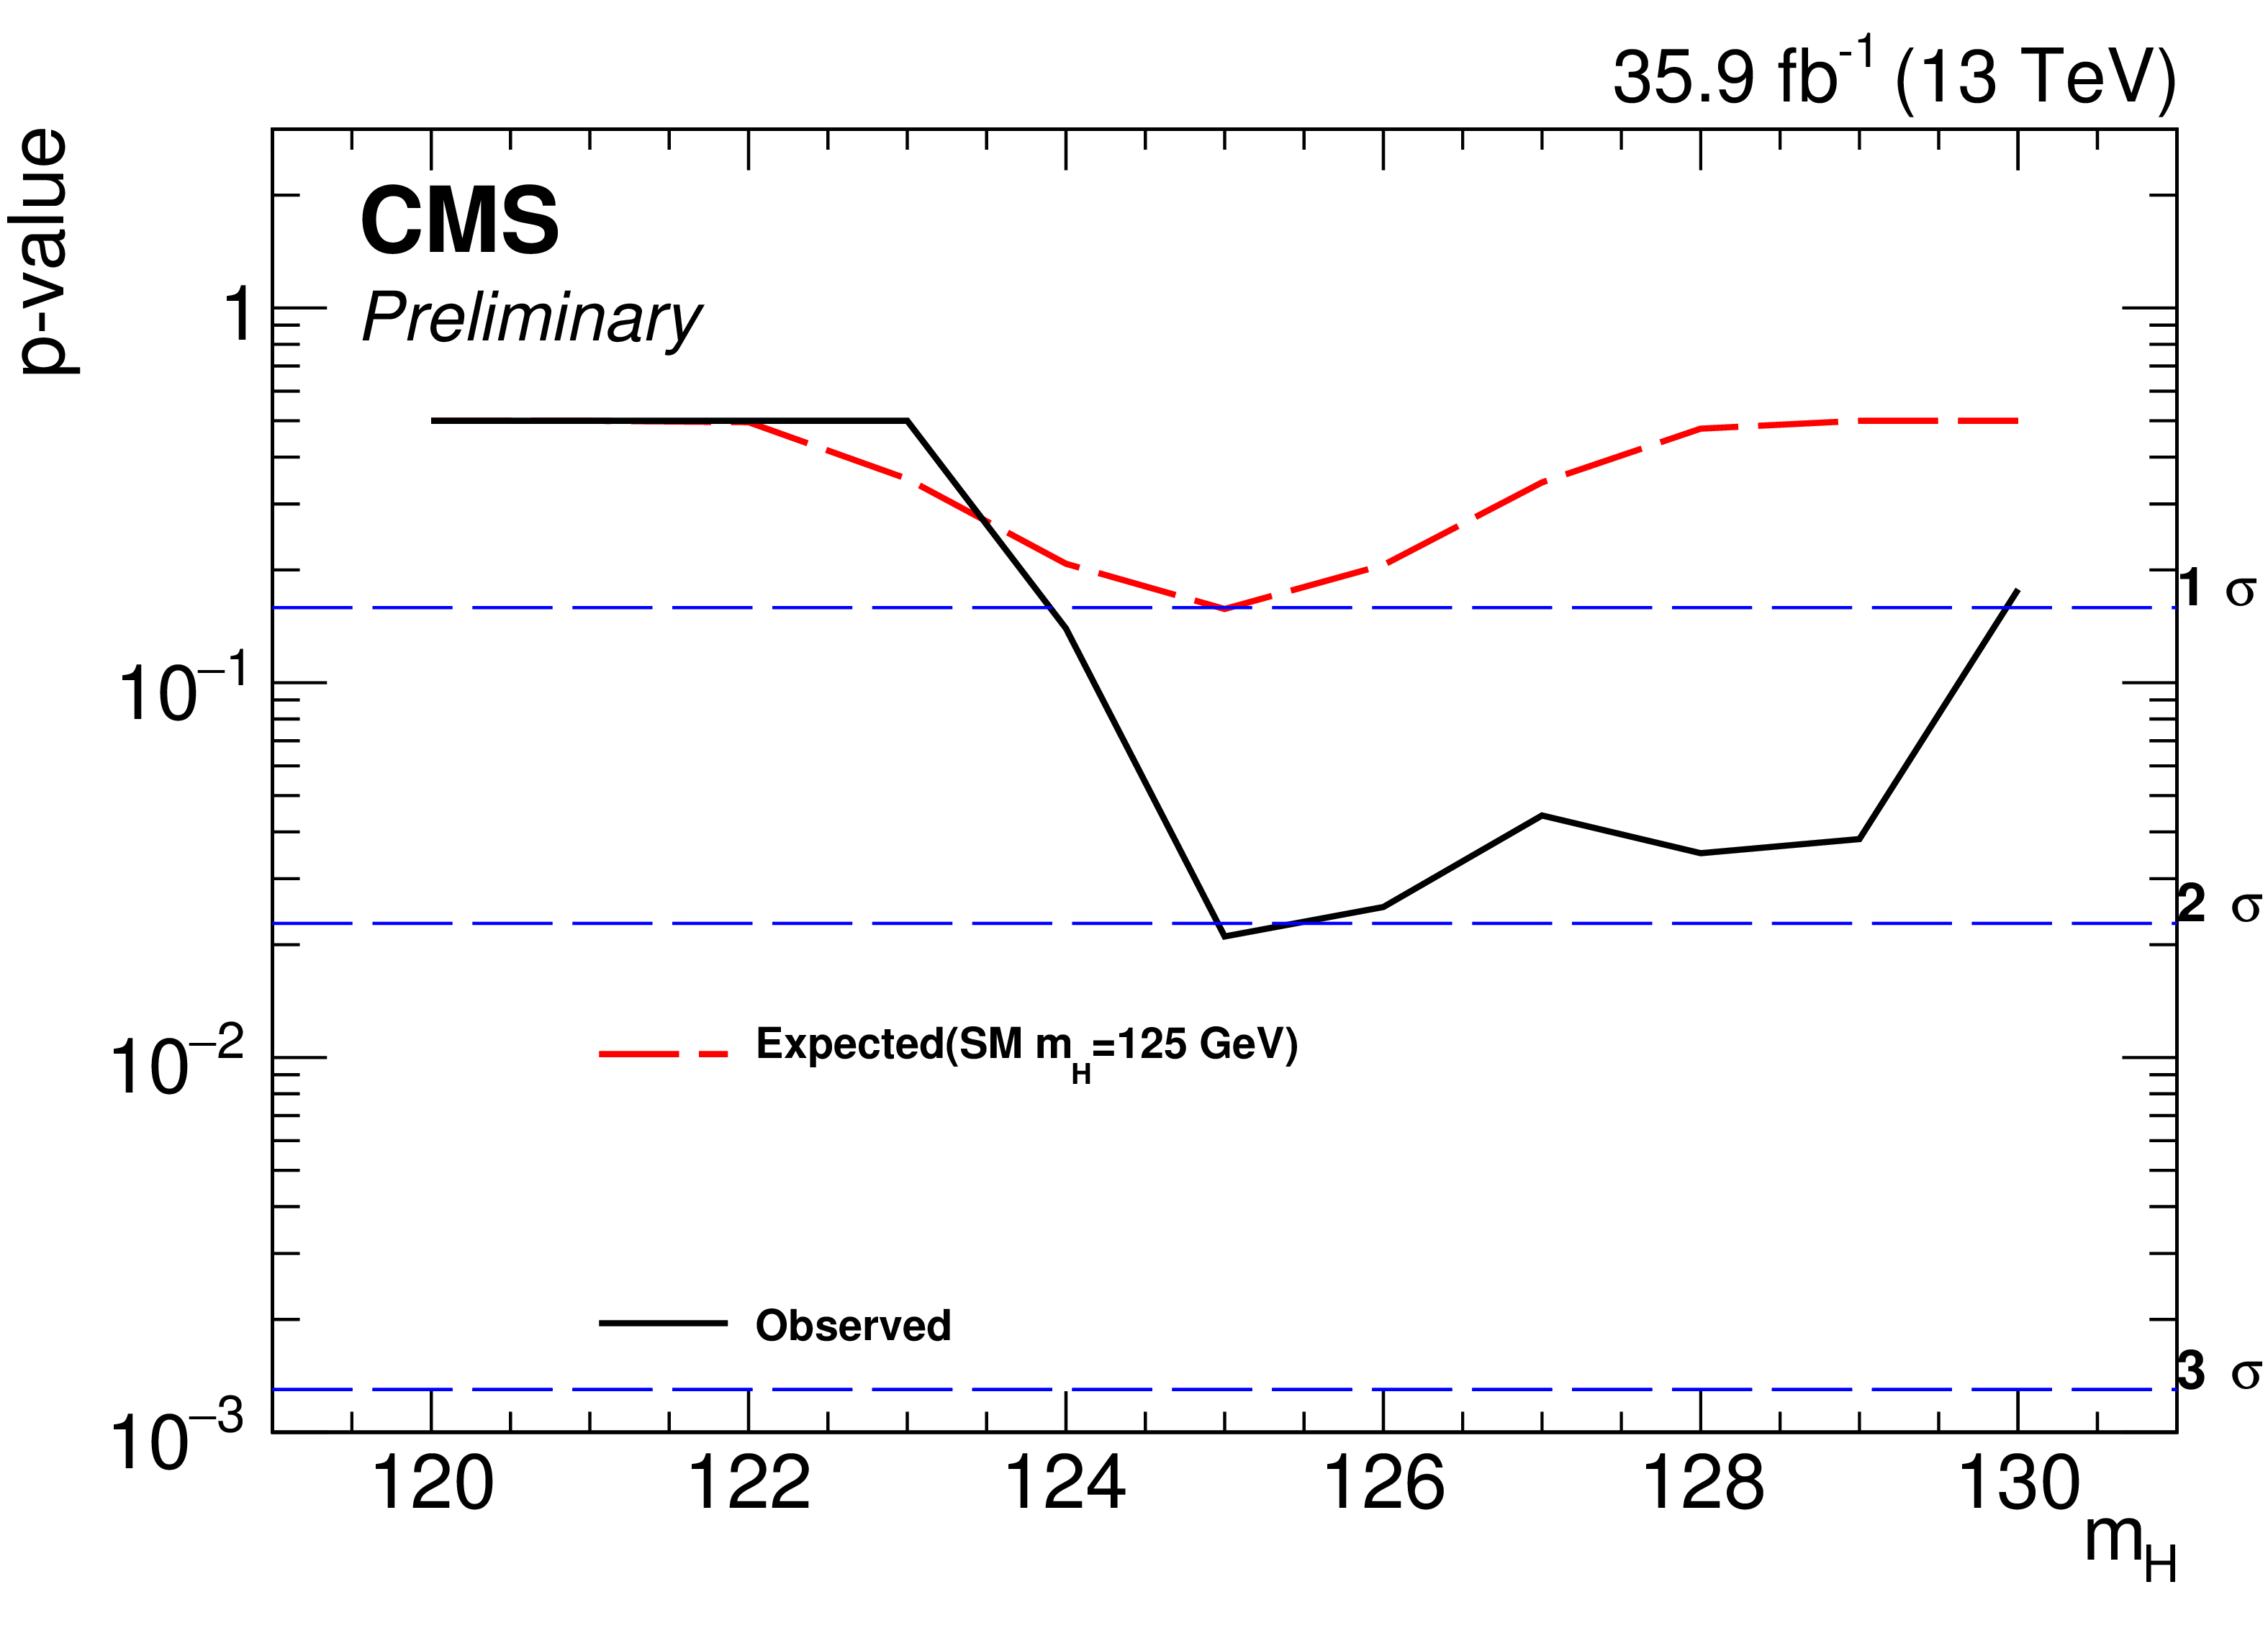
Additional Figure 4:
Combined p-value of the analyses, $\mathrm{H} \to \gamma ^*\gamma \to \mu \mu \gamma $ and $\mathrm{H} \to \mathrm{Z} \gamma \to \ell \ell \gamma $. The expected with signal injected at $m_{\mathrm{H}} = $ 125 GeV is shown in dotted red line. The black line shows the observed. |
| References | ||||
| 1 | A. Abbasabadi, D. Bowser-Chao, D. A. Dicus, and W. W. Repko | Radiative Higgs boson decays $ \mathrm{H}\to ff\gamma $ | PRD 55 (1997) 5647 | hep-ph/9611209 |
| 2 | Y. Sun, H. Chang, and D. Gao | Higgs decays to $ \gamma \ell^+\ell^- $ in the standard model | JHEP 05 (2013) 061 | 1303.2230 |
| 3 | L. B. Chen, C. F. Qiao, and R. L. Zhu | Reconstructing the 125 GeV SM Higgs boson through $ \ell\bar{\ell}\gamma $ | PLB 726 (2013) 306 | 1211.6058 |
| 4 | G. Passarino | Higgs boson production and decay: Dalitz sector | PLB 727 (2013) 424 | 1308.0422 |
| 5 | A. Korchin and V. Kovalchuk | Angular distribution and forward-backward asymmetry of the higgs-boson decay to photon and lepton pair | EPJC 74 (2014) | 1408.0342 |
| 6 | M. Bauer, M. Neubert, and A. Thamm | LHC as an Axion Factory: Probing an Axion Explanation for $ (g-2)_\mu $ with Exotic Higgs Decays | PRL 119 (2017) | 1704.08207 |
| 7 | LHC Higgs Cross Section Working Group Collaboration | Handbook of LHC Higgs Cross Sections: 4. Deciphering the Nature of the Higgs Sector | 1610.07922 | |
| 8 | J. M. Campbell and R. Ellis | MCFM for the Tevatron and the LHC | NPPS 205-206 (2010) 10 | 1007.3492 |
| 9 | D. A. Dicus and W. W. Repko | Calculation of the decay $ \mathrm{H} \to \mathrm{e}\bar{\mathrm{e}}\gamma $ | PRD 87 (2013) 077301 | 1302.2159 |
| 10 | D. A. Dicus and W. W. Repko | Dalitz decay $ \mathrm{H}\to f\bar{f}\gamma $ as a background for $ \mathrm{H}\to\gamma\gamma $ | PRD 89 (2014) 093013 | 1402.5317 |
| 11 | A. Firan and R. Stroynowski | Internal conversions in Higgs decays to two photons | PRD 76 (2007) 057301 | 0704.3987 |
| 12 | ATLAS Collaboration | Search for Higgs boson decays to a photon and a Z boson in pp collisions at $ \sqrt{s} = $ 7 and 8 TeV with the ATLAS detector | PLB 732 (2014) 8 | 1402.3051 |
| 13 | CMS Collaboration | Search for a Higgs boson decaying into a Z and a photon in pp collisions at $ \sqrt{s} = $ 7 and 8 TeV | PLB 726 (2013) 587 | CMS-HIG-13-006 1307.5515 |
| 14 | CMS Collaboration | Search for a Higgs boson decaying into $ \gamma^* \gamma \to \ell \ell \gamma $ with low dilepton mass in pp collisions at $ \sqrt s = $ 8 TeV | PLB 753 (2016) 341 | CMS-HIG-14-003 1507.03031 |
| 15 | CMS Collaboration | The CMS experiment at the CERN LHC | JINST 3 (2008) S08004 | CMS-00-001 |
| 16 | CMS Collaboration | Particle-flow reconstruction and global event description with the CMS detector | JINST 12 (2017) P10003 | CMS-PRF-14-001 1706.04965 |
| 17 | CMS Collaboration | Performance of photon reconstruction and identification with the CMS detector in proton-proton collisions at $ \sqrt{s} = $ 8 TeV | JINST 10 (2015) P08010 | CMS-EGM-14-001 1502.02702 |
| 18 | CMS Collaboration | Measurement of the Inclusive $ W $ and $ Z $ Production Cross Sections in $ pp $ Collisions at $ \sqrt{s}= $ 7 TeV | JHEP 10 (2011) 132 | CMS-EWK-10-005 1107.4789 |
| 19 | CMS Collaboration | Measurements of properties of the Higgs boson decaying into the four-lepton final state in pp collisions at $ \sqrt{s}= $ 13 TeV | JHEP 11 (2017) 047 | CMS-HIG-16-041 1706.09936 |
| 20 | M. Cacciari, G. P. Salam, and G. Soyez | FastJet User Manual | EPJC 72 (2012) 1896 | 1111.6097 |
| 21 | J. Alwall et al. | The automated computation of tree-level and next-to-leading order differential cross sections, and their matching to parton shower simulations | JHEP 07 (2014) 079 | 1405.0301 |
| 22 | P. Artoisenet et al. | A framework for Higgs characterisation | JHEP 11 (2013) 043 | 1306.6464 |
| 23 | P. de Aquino and K. Mawatari | Characterising a Higgs-like resonance at the LHC | in Proceedings, 1st Toyama International Workshop on Higgs as a Probe of New Physics 2013 (HPNP2013): Toyama, Japan, February 13-16, 2013 2013 | 1307.5607 |
| 24 | T. Sjostrand, S. Mrenna, and P. Z. Skands | A brief introduction to PYTHIA 8.1 | CPC 178 (2008) 852 | 0710.3820 |
| 25 | S. Alioli, P. Nason, C. Oleari, and E. Re | NLO Higgs boson production via gluon fusion matched with shower in POWHEG | JHEP 04 (2009) 002 | 0812.0578 |
| 26 | P. Nason and C. Oleari | NLO Higgs boson production via vector-boson fusion matched with shower in POWHEG | JHEP 02 (2010) 037 | 0911.5299 |
| 27 | NNPDF Collaboration | Parton distributions for the LHC Run II | JHEP 04 (2015) 040 | 1410.8849 |
| 28 | M. J. Oreglia | A study of the reactions $\psi' \to \gamma\gamma \psi$ | PhD thesis, Stanford University, 1980 SLAC Report SLAC-R-236, see Appendix D | |
| 29 | A. L. Read | Presentation of search results: The CL(s) technique | JPG28 (2002) 2693--2704 | |
| 30 | T. Junk | Confidence level computation for combining searches with small statistics | NIMA 434 (1999) 435 | hep-ex/9902006 |
| 31 | The ATLAS Collaboration, The CMS Collaboration, The LHC Higgs Combination Group Collaboration | Procedure for the LHC Higgs boson search combination in Summer 2011 | CMS-NOTE-2011-005 | |
| 32 | CMS Collaboration Collaboration | CMS Luminosity Measurements for the 2016 Data Taking Period | CMS-PAS-LUM-17-001, CERN, Geneva | |
| 33 | A. D. Martin, W. J. Stirling, R. S. Thorne, and G. Watt | Parton distributions for the LHC | EPJC 63 (2009) 189 | 0901.0002 |
| 34 | H. Lai et al. | New parton distributions for collider physics | PRD 82 (2010) 74024 | 1007.2241 |
| 35 | S. Alekhin et al. | The PDF4LHC Working Group Interim Report | 1101.0536 | |
| 36 | M. Botje et al. | The PDF4LHC Working Group Interim Recommendations | 1101.0538 | |
|
|
Compact Muon Solenoid LHC, CERN |
|

|

|

|

|

|