

Compact Muon Solenoid
LHC, CERN
| CMS-PAS-HIG-15-005 | ||
| First results on Higgs to $ \gamma \gamma $ at 13 TeV | ||
| CMS Collaboration | ||
| March 2016 | ||
|
Abstract:
The measurement of the Higgs boson production for the two photon decay channel with the first LHC Run 2 data is described. The analysis is performed using the dataset recorded by the CMS experiment at the LHC from pp collisions at centre-of-mass energy of 13 TeV corresponding to an integrated luminosity of 2.7 fb$^{-1}$. An event classification has been performed to maximize signal significance and to study specific Higgs boson production modes. The observed significance for the standard model (SM) Higgs boson is 1.7$\sigma$, where a significance of 2.7$\sigma$ is expected. The best-fit signal strength relative to the standard model prediction is 0.69$^{+0.47}_{-0.42}$. Additional measurements include the signal strength associated with different production mechanisms. The combination of ttH results with CMS data at 13 TeV is summarized at this url. | ||
| Links: CDS record (PDF) ; inSPIRE record ; CADI line (restricted) ; | ||
| Figures & Tables | Additional Figures | CMS Publications |
|---|
| Figures | |
png pdf |
Figure 1-a:
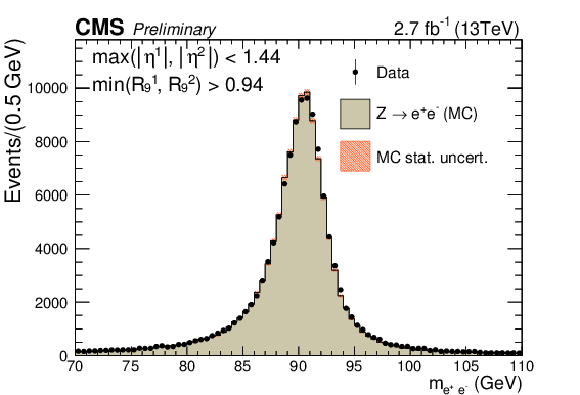
Comparison of the dielectron invariant mass distributions in data and simulation for $ \mathrm{ Z \rightarrow e^{+}e^{-} } $ events where electrons are reconstructed as photons. The events are split into categories according to the $\eta $ and $ {R_\mathrm {9}}$ of the electrons. The simulated distribution is normalized to the integral of the data distribution in the range 87 GeV $ < m_{ \mathrm{ e^{+}e^{-} } } <$ 93 GeV. |
png pdf |
Figure 1-b:
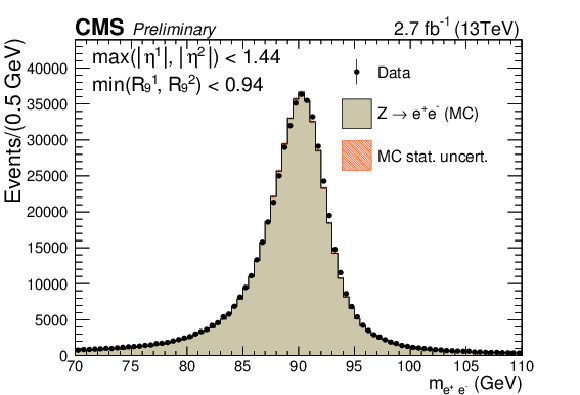
Comparison of the dielectron invariant mass distributions in data and simulation for $ \mathrm{ Z \rightarrow e^{+}e^{-} } $ events where electrons are reconstructed as photons. The events are split into categories according to the $\eta $ and $ {R_\mathrm {9}}$ of the electrons. The simulated distribution is normalized to the integral of the data distribution in the range 87 GeV $ < m_{ \mathrm{ e^{+}e^{-} } } <$ 93 GeV. |
png pdf |
Figure 1-c:
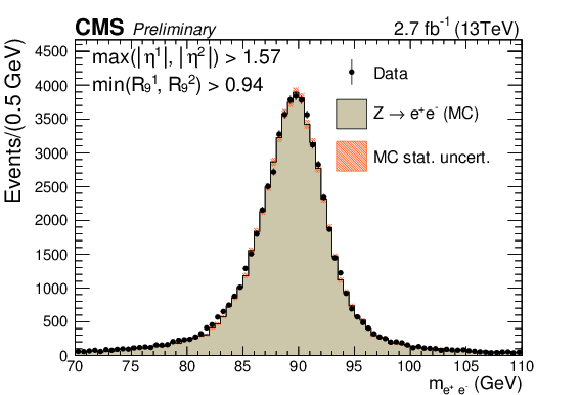
Comparison of the dielectron invariant mass distributions in data and simulation for $ \mathrm{ Z \rightarrow e^{+}e^{-} } $ events where electrons are reconstructed as photons. The events are split into categories according to the $\eta $ and $ {R_\mathrm {9}}$ of the electrons. The simulated distribution is normalized to the integral of the data distribution in the range 87 GeV $ < m_{ \mathrm{ e^{+}e^{-} } } <$ 93 GeV. |
png pdf |
Figure 1-d:
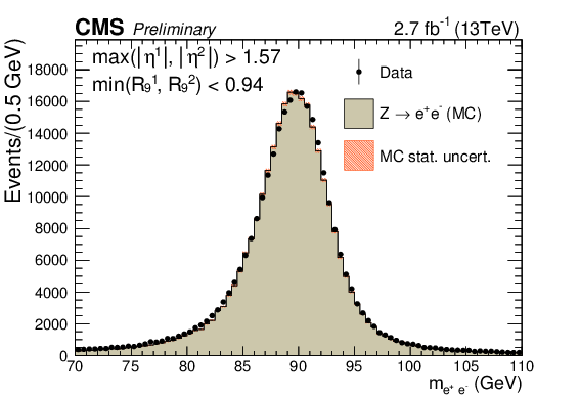
Comparison of the dielectron invariant mass distributions in data and simulation for $ \mathrm{ Z \rightarrow e^{+}e^{-} } $ events where electrons are reconstructed as photons. The events are split into categories according to the $\eta $ and $ {R_\mathrm {9}}$ of the electrons. The simulated distribution is normalized to the integral of the data distribution in the range 87 GeV $ < m_{ \mathrm{ e^{+}e^{-} } } <$ 93 GeV. |
png pdf |
Figure 2:
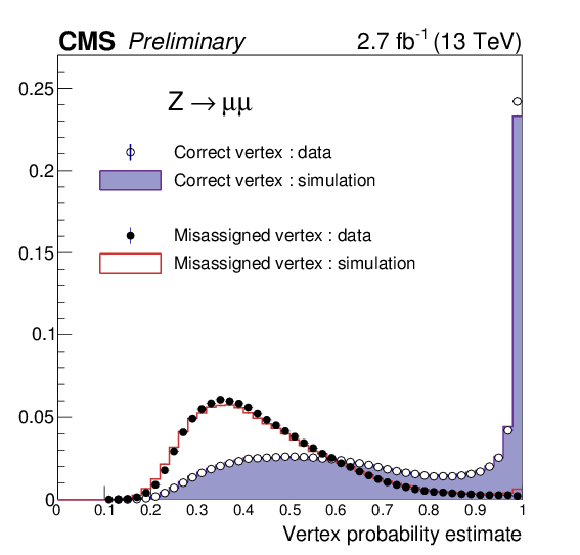
Normalized distributions of the per-event probability to assign the vertex within 1 cm of the true one in $ \mathrm{ Z \rightarrow \mu^{+}\mu^{-} } $ events, for correctly selected vertices in data (open black circles) and simulation (filled histogram) and for mis-assigned vertices in data (closed black circles) and simulation (open red histogram). |
png pdf |
Figure 3:
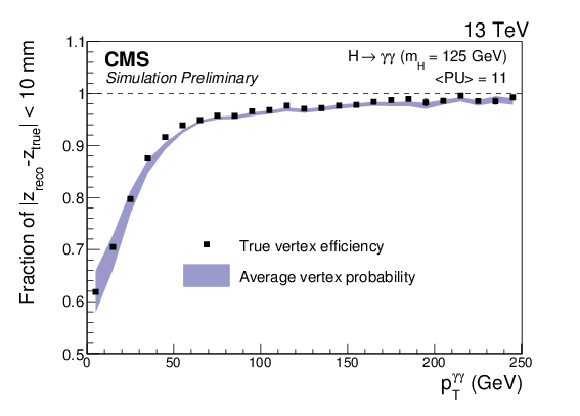
Comparison the true vertex identification efficiency and the average estimated vertex probability as a function of the reconstructed diphoton $ {p_{\mathrm {T}}} $ in simulated $ \mathrm{ H } \to \gamma \gamma $ events with $ {m_{\mathrm {H}} }=$ 125 GeV. Events are weighted according to the cross-sections of the different production modes and to match the pileup distribution in data. |
png pdf |
Figure 4-a:
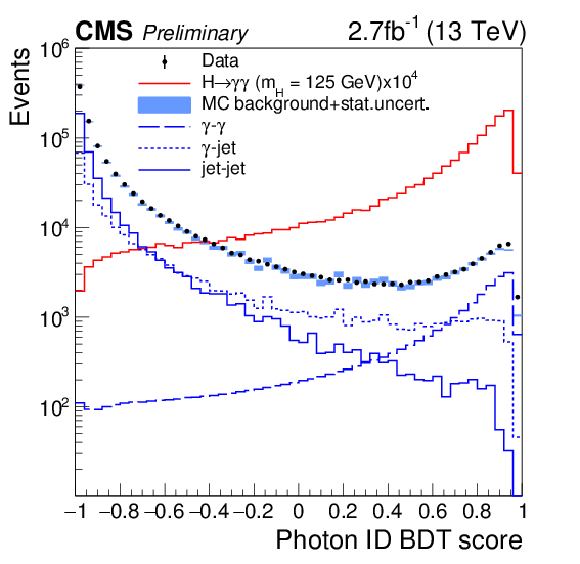
(a) Photon identification BDT score of the lower-scoring photon of diphoton pairs with an invariant mass in the range 100 $ < m_{\gamma \gamma } <$ 180 GeV, for events passing the preselection in the 13 TeV dataset (points), and for simulated background events (blue histogram). Histograms are also shown for different components of the simulated background, in which there are either two, one, or zero prompt candidate photons. The sum of all background distributions, generated at leading order, is scaled up to data. The red histogram corresponds to simulated Higgs boson signal events. (b) Photon identification BDT score for $ \mathrm{ Z \rightarrow e^{+}e^{-} } $ events in data and simulation, where the electrons are reconstructed as photons. The systematic uncertainty applied to the shape from simulation (hashed region) is also shown. |
png pdf |
Figure 4-b:
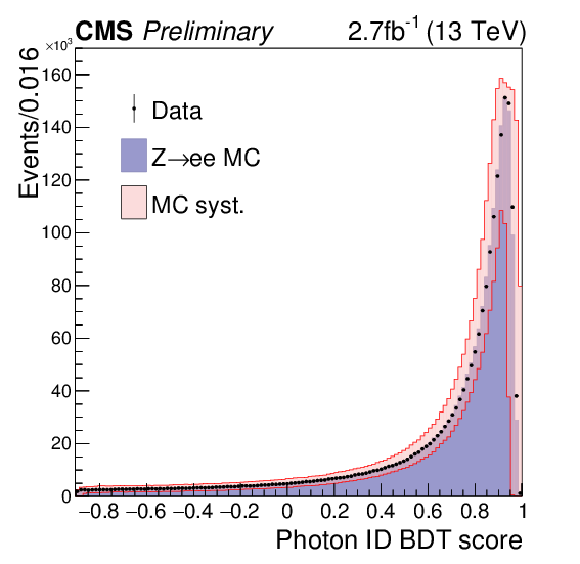
(a) Photon identification BDT score of the lower-scoring photon of diphoton pairs with an invariant mass in the range 100 $ < m_{\gamma \gamma } <$ 180 GeV, for events passing the preselection in the 13 TeV dataset (points), and for simulated background events (blue histogram). Histograms are also shown for different components of the simulated background, in which there are either two, one, or zero prompt candidate photons. The sum of all background distributions, generated at leading order, is scaled up to data. The red histogram corresponds to simulated Higgs boson signal events. (b) Photon identification BDT score for $ \mathrm{ Z \rightarrow e^{+}e^{-} } $ events in data and simulation, where the electrons are reconstructed as photons. The systematic uncertainty applied to the shape from simulation (hashed region) is also shown. |
png pdf |
Figure 5-a:
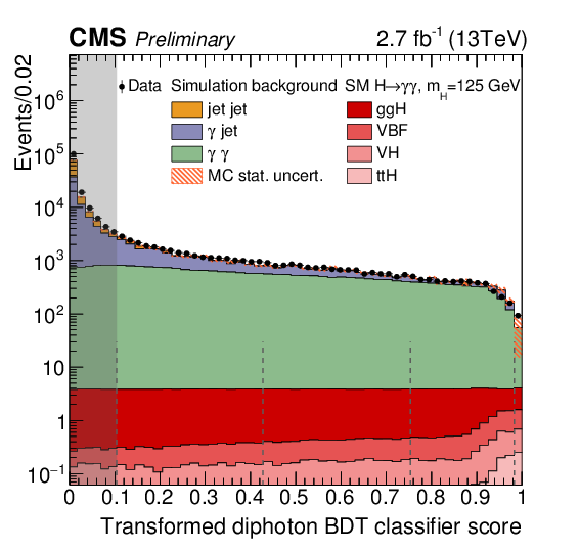
(a) BDT classifier score in data (black points) and simulation (stacked histograms) for events in the region 100 $< m_{\gamma \gamma } <$ 180 GeV. The simulated background events are scaled to data (using a factor 1.4 derived considering only the region with BDT score greater than 0.1) preserving the relative ratio of the single components. This normalization is not used anywhere else in the analysis. (b) BDT classifier score for $ \mathrm{ Z \rightarrow e^{+}e^{-} } $ events, where electrons are reconstructed as photons, in data (black points) and simulation (filled histogram). The hashed region represents the systematic uncertainty resulting from the combination of the uncertainties on the photon identification BDT and the photon energy resolution. The gray bands represent events rejected in the analysis. |
png pdf |
Figure 5-b:
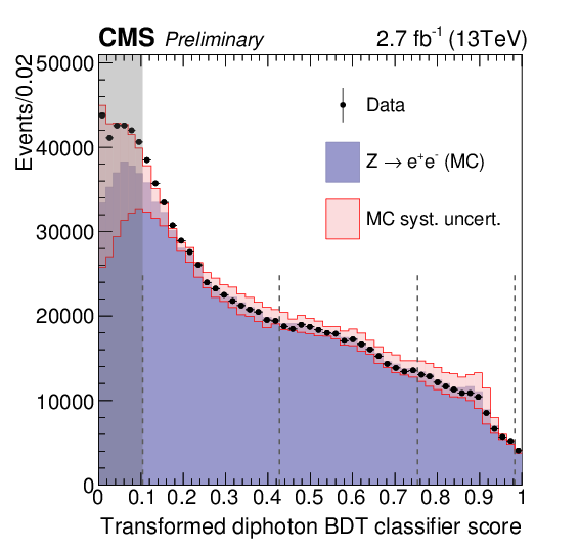
(a) BDT classifier score in data (black points) and simulation (stacked histograms) for events in the region 100 $< m_{\gamma \gamma } <$ 180 GeV. The simulated background events are scaled to data (using a factor 1.4 derived considering only the region with BDT score greater than 0.1) preserving the relative ratio of the single components. This normalization is not used anywhere else in the analysis. (b) BDT classifier score for $ \mathrm{ Z \rightarrow e^{+}e^{-} } $ events, where electrons are reconstructed as photons, in data (black points) and simulation (filled histogram). The hashed region represents the systematic uncertainty resulting from the combination of the uncertainties on the photon identification BDT and the photon energy resolution. The gray bands represent events rejected in the analysis. |
png pdf |
Figure 6-a:
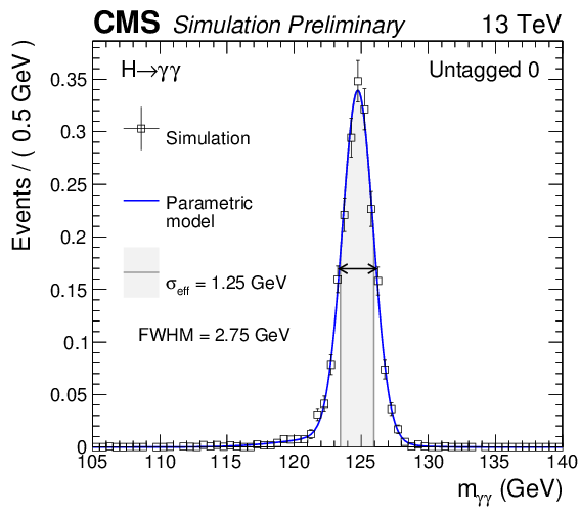
Parametrized signal shape for the best resolution category (a) and for all category combined together (b) for a simulated $ \mathrm{ H } \to \gamma \gamma $ signal sample with $ {m_{\mathrm {H}} }=$ 125 GeV. The black points represent weighted simulation events and the blue lines are the corresponding models. Also shown is the $\sigma _{ \text{eff} }$ value (half the width of the narrowest interval containing 68.3% of the invariant mass distribution), FWHM and the corresponding interval. |
png pdf |
Figure 6-b:
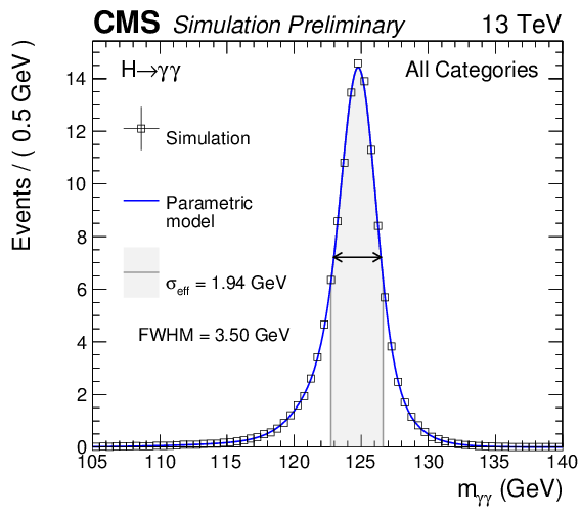
Parametrized signal shape for the best resolution category (a) and for all category combined together (b) for a simulated $ \mathrm{ H } \to \gamma \gamma $ signal sample with $ {m_{\mathrm {H}} }=$ 125 GeV. The black points represent weighted simulation events and the blue lines are the corresponding models. Also shown is the $\sigma _{ \text{eff} }$ value (half the width of the narrowest interval containing 68.3% of the invariant mass distribution), FWHM and the corresponding interval. |
png pdf |
Figure 7:
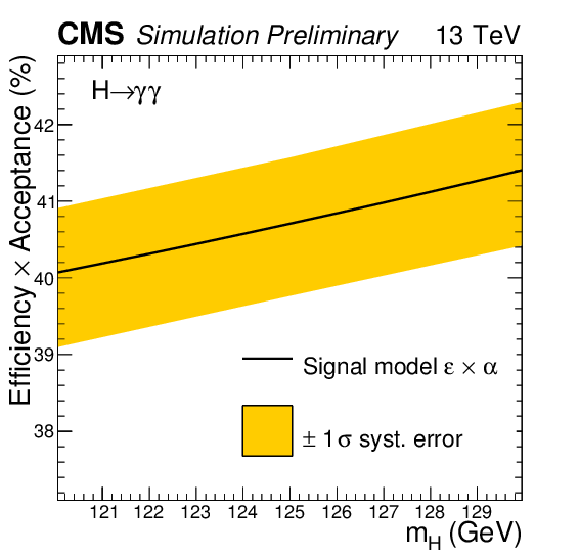
The efficiency$\times $acceptance of the signal model as a function of $ {m_{\mathrm {H}} }$ for all categories combined. |
png pdf |
Figure 8-a:
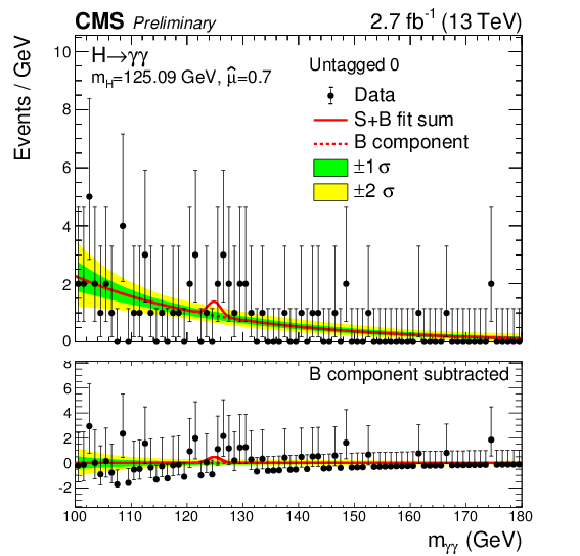
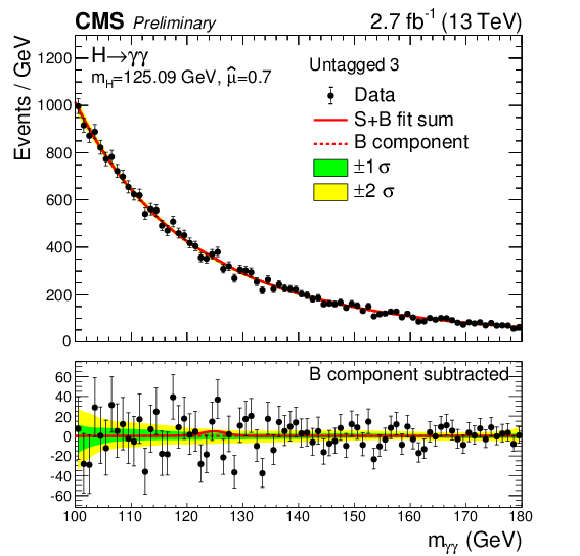
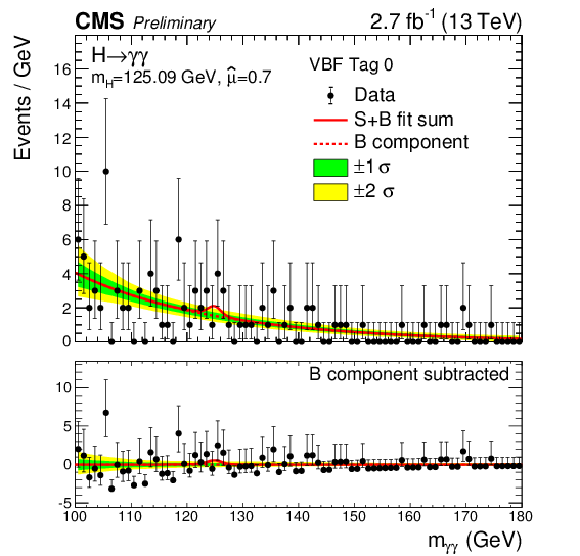
Data points (black) and S+B model fit (red) in the four untagged categories are shown. The 1$\sigma $ (green) and 2$\sigma $ bands (yellow) include the uncertainties of the fit. The Higgs boson mass is fixed in the fit to the Run1 measurement ($ {m_{\mathrm {H}} }=$ 125.09 GeV). The bottom plot shows the residuals after background subtraction. |
png pdf |
Figure 8-b:
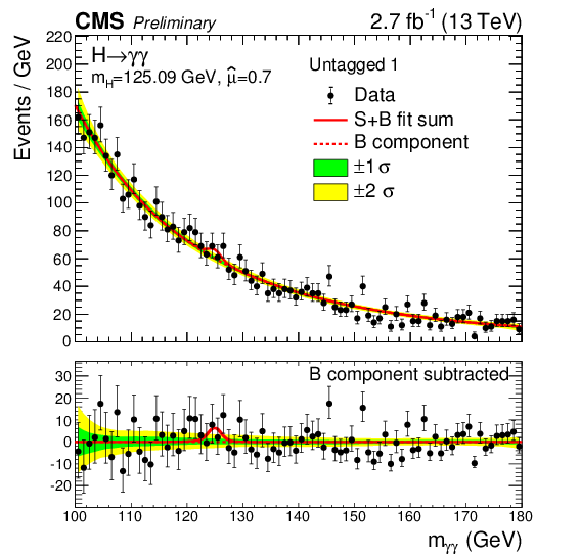
Data points (black) and S+B model fit (red) in the four untagged categories are shown. The 1$\sigma $ (green) and 2$\sigma $ bands (yellow) include the uncertainties of the fit. The Higgs boson mass is fixed in the fit to the Run1 measurement ($ {m_{\mathrm {H}} }=$ 125.09 GeV). The bottom plot shows the residuals after background subtraction. |
png pdf |
Figure 8-c:
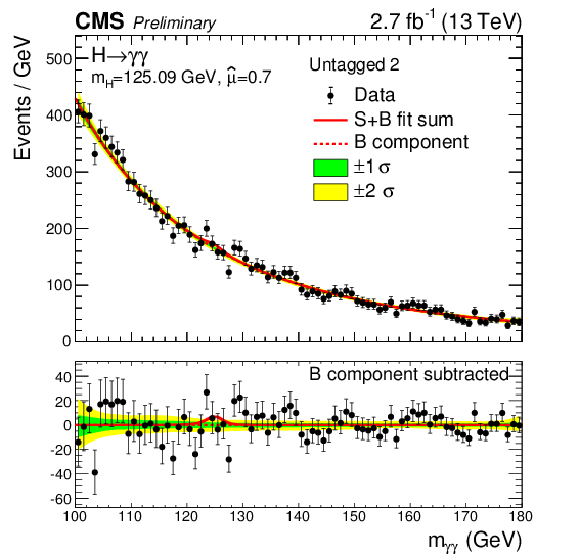
Data points (black) and S+B model fit (red) in the four untagged categories are shown. The 1$\sigma $ (green) and 2$\sigma $ bands (yellow) include the uncertainties of the fit. The Higgs boson mass is fixed in the fit to the Run1 measurement ($ {m_{\mathrm {H}} }=$ 125.09 GeV). The bottom plot shows the residuals after background subtraction. |
png pdf |
Figure 8-d:
Data points (black) and S+B model fit (red) in the four untagged categories are shown. The 1$\sigma $ (green) and 2$\sigma $ bands (yellow) include the uncertainties of the fit. The Higgs boson mass is fixed in the fit to the Run1 measurement ($ {m_{\mathrm {H}} }=$ 125.09 GeV). The bottom plot shows the residuals after background subtraction. |
png pdf |
Figure 9-a:
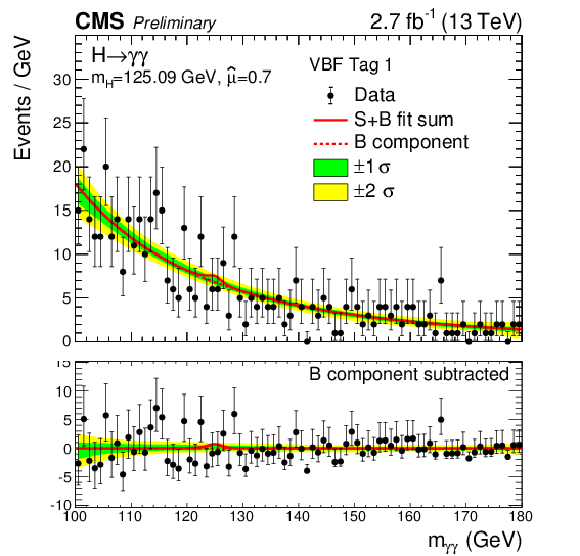
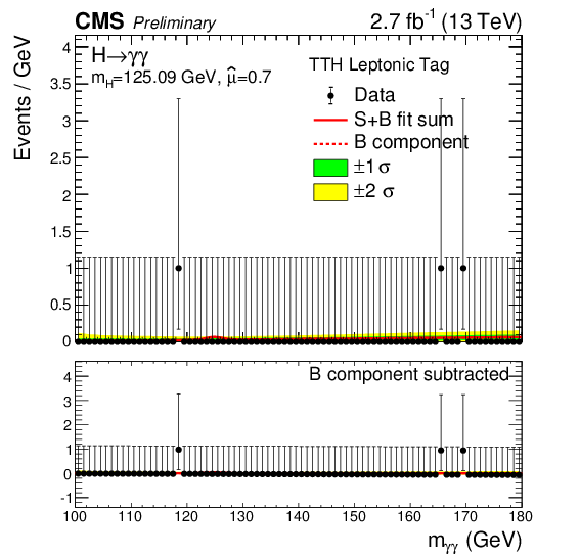
Data points (black) and S+B model fit (red) in VBF and $\mathrm{ t \bar{t} H }$ categories are shown. The 1$\sigma $ (green) and 2$\sigma $ bands (yellow) include the uncertainties of the fit. The Higgs boson mass is fixed in the fit to the Run1 measurement ($ {m_{\mathrm {H}} }=$ 125.09 GeV). The bottom plot shows the residuals after background subtraction. |
png pdf |
Figure 9-b:
Data points (black) and S+B model fit (red) in VBF and $\mathrm{ t \bar{t} H }$ categories are shown. The 1$\sigma $ (green) and 2$\sigma $ bands (yellow) include the uncertainties of the fit. The Higgs boson mass is fixed in the fit to the Run1 measurement ($ {m_{\mathrm {H}} }=$ 125.09 GeV). The bottom plot shows the residuals after background subtraction. |
png pdf |
Figure 9-c:
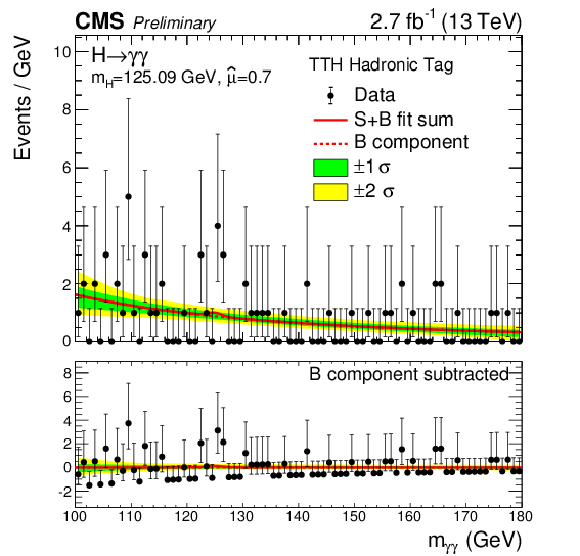
Data points (black) and S+B model fit (red) in VBF and $\mathrm{ t \bar{t} H }$ categories are shown. The 1$\sigma $ (green) and 2$\sigma $ bands (yellow) include the uncertainties of the fit. The Higgs boson mass is fixed in the fit to the Run1 measurement ($ {m_{\mathrm {H}} }=$ 125.09 GeV). The bottom plot shows the residuals after background subtraction. |
png pdf |
Figure 9-d:
Data points (black) and S+B model fit (red) in VBF and $\mathrm{ t \bar{t} H }$ categories are shown. The 1$\sigma $ (green) and 2$\sigma $ bands (yellow) include the uncertainties of the fit. The Higgs boson mass is fixed in the fit to the Run1 measurement ($ {m_{\mathrm {H}} }=$ 125.09 GeV). The bottom plot shows the residuals after background subtraction. |
png pdf |
Figure 10:
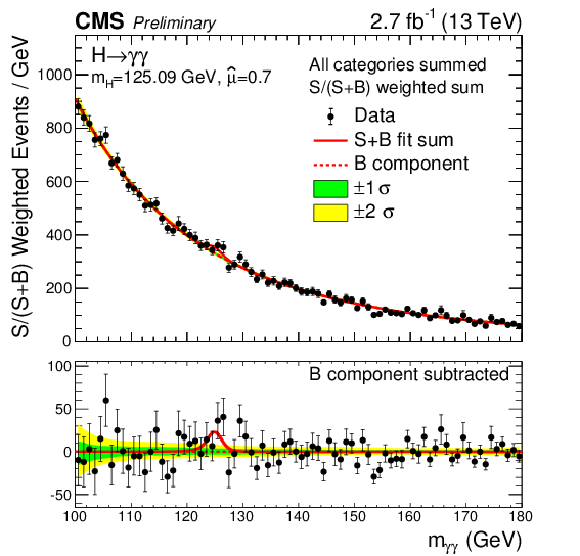
The diphoton mass spectrum weighted by the ratio S/(S + B) computed in a mass window corresponding to $\pm \sigma _{\text{eff}}$ in each event category. Data points (black) and S+B model fit (red) are shown. The 1$\sigma $ (green) and 2$\sigma $ bands (yellow) include the uncertainties of the fit. The Higgs boson mass is fixed in the fit to the Run1 measurement ($ {m_{\mathrm {H}} }=$ 125.09 GeV). The bottom plot shows the residuals after background subtraction. |
png pdf |
Figure 11:
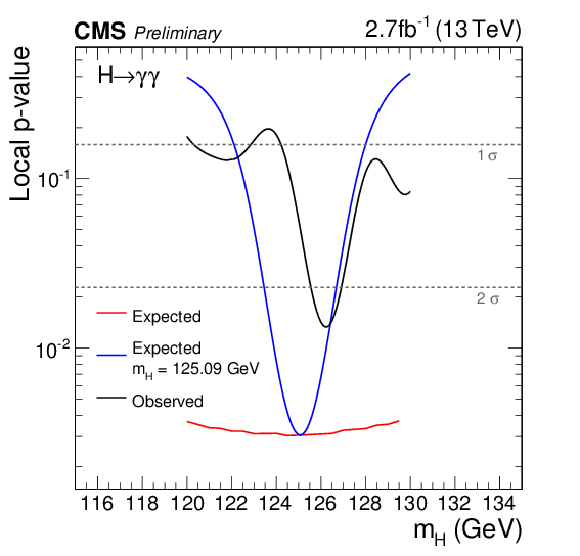
The observed p-value (black) is compared to the SM expectation across the fit range 120-130GeV. The expected p-value (red line) and the expected p-value for the specific mass point $ {m_{\mathrm {H}} }=$ 125.09 GeV (blue line), obtained by fitting the background model to an Asimov dataset together with fitting the sum of the signal and background models to the Asimov dataset with a SM Higgs boson signal injected are also shown. |
png pdf |
Figure 12:
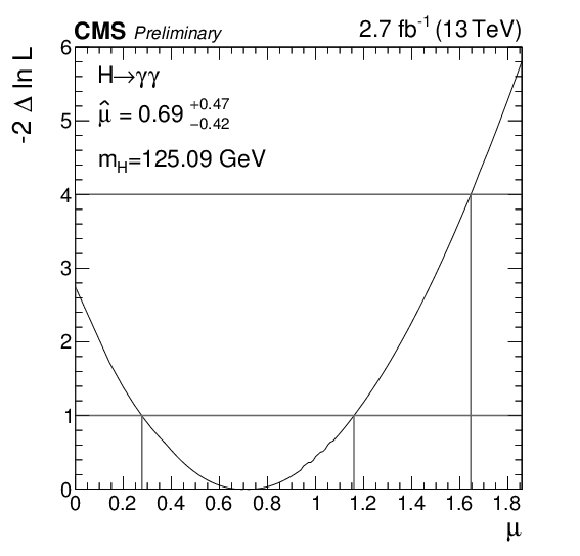
The likelihood scan for the signal strength modifier $\mu =\sigma /\sigma _{\text{SM}}$ where the value of the standard model Higgs boson mass is fixed to $ {m_{\mathrm {H}} }=$ 125.09 GeV. |
png pdf |
Figure 13:
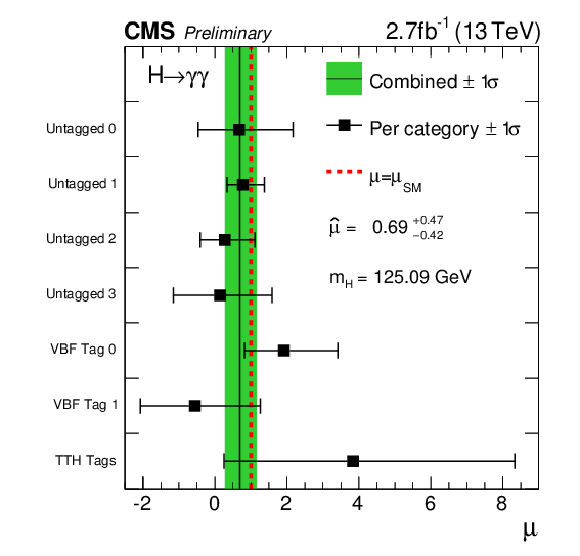
Signal strength modifiers measured in each category (black points) at the Run1 Higgs boson mass ($ {m_{\mathrm {H}} }=$ 125.09 GeV) compared to the overall signal strength (green band) and to the SM expectation (dashed red line). For illustration purposes in this plot TTHHadronic and TTHLeptonic categories are combined together. |
png pdf |
Figure 14:
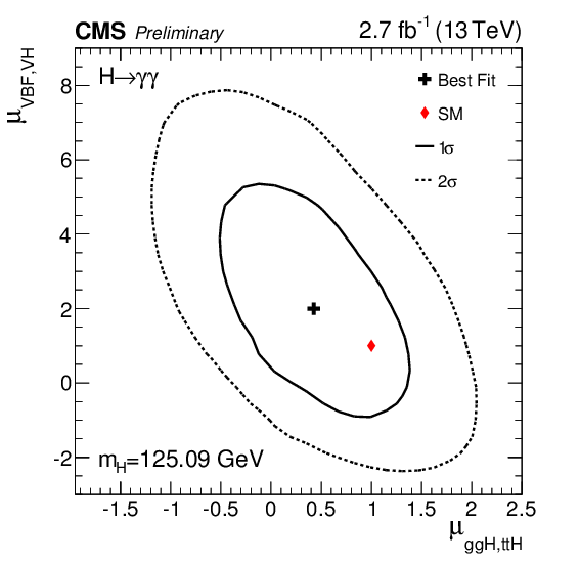
The 2-D best-fit (black cross) of the signal strength modifiers ($\mu =\sigma /\sigma _{\text{SM}}$) for fermionic (ggH, $\mathrm{ t \bar{t} H }$) and bosonic (VBF, ZH, WH) production modes compared to the SM expectations (red diamond). The Higgs boson mass is fixed to the Run1 measurement in the fit ($ {m_{\mathrm {H}} }=$ 125.09 GeV). The solid (dashed) line represents the 1$\sigma $ (2$\sigma $) confidence region. |
| Tables | |

png pdf |
Table 1:
Preselection requirements |

png pdf |
Table 2:
Photon preselection efficiencies measured in four photon categories, obtained with a tag and probe technique using $ \mathrm{ Z \rightarrow e^{+}e^{-} } $ events after applying all requirements except the electron veto. |

png pdf |
Table 3:
The expected number of signal events per category and the percentage breakdown per production mode in that category. The $\sigma _{ \text{eff} }$, computed as the smallest interval containing 68.3% of the invariant mass distribution, and $\sigma _{\text{ HM } }$, computed as the width of the distribution at half of its highest point divided by 2.35 are also shown as an estimate of the $m_{\gamma \gamma }$ resolution in that category. The expected number of background events per GeV around 125 GeV is also listed. |
| Additional Figures | |
png pdf |
Additional Figure 1-a:
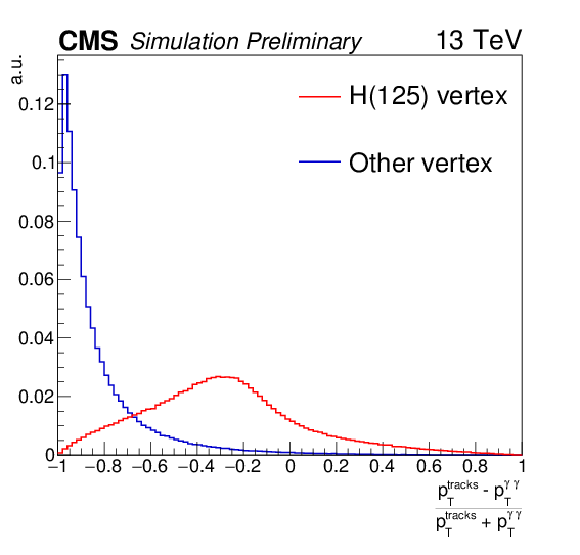
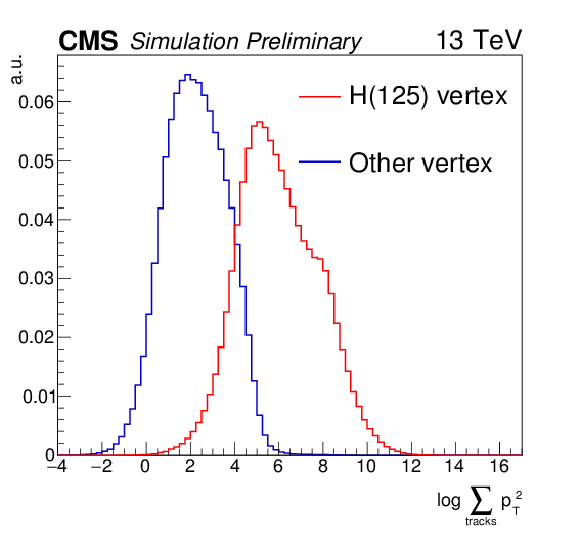
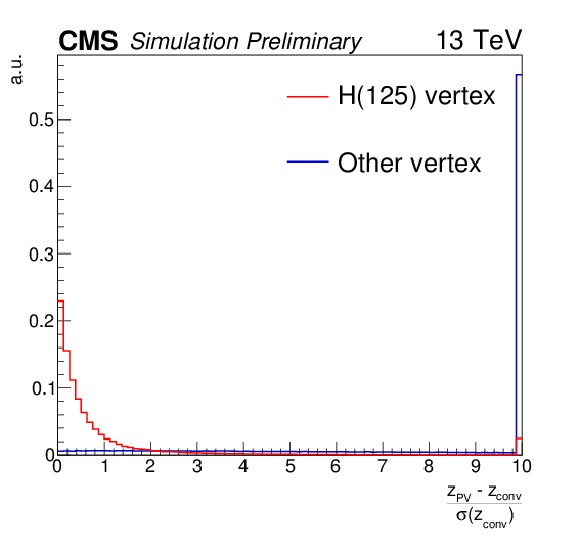
Distribution of the inputs used in the vertex identification BDT: $ {p_{\mathrm {T}}} $ asymmetry $(|\sum_i\vec{p}^{i}_{T}| - p^{\gamma \gamma }_{T}) / (|\sum_i\vec{p}^{i}_{T}| + p^{\gamma \gamma }_{T})$ (a), $ {p_{\mathrm {T}}} $ balance -$\sum_i (\vec{p}^{i}_{T}\cdot {\vec{p}^{\gamma \gamma }_{T}} / {|\vec{p}^{\gamma \gamma }_{T}|})$ (b), $\sum_i |\vec{p}^{i}_{T}|^{2}$ (c), pull to conversion $z_{\text{PV}} - z_{\text{conv}} /\sigma (z_{\text{conv}})$ (d) for $ \mathrm{H} \rightarrow \gamma \gamma $ simulated signal with $ {m_{\mathrm {H}} }= $ 125 GeV. The distributions are shown for the reconstructed vertex matched to the Higgs MC true vertex (red histogram) and for other vertices (blue histogram). |
png pdf |
Additional Figure 1-b:
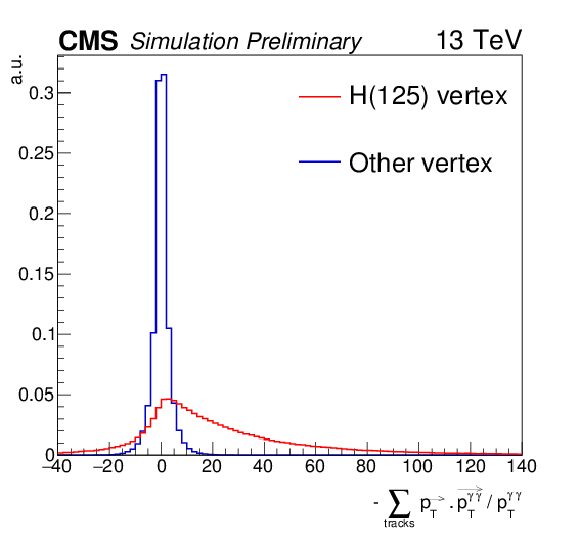
Distribution of the inputs used in the vertex identification BDT: $ {p_{\mathrm {T}}} $ asymmetry $(|\sum_i\vec{p}^{i}_{T}| - p^{\gamma \gamma }_{T}) / (|\sum_i\vec{p}^{i}_{T}| + p^{\gamma \gamma }_{T})$ (a), $ {p_{\mathrm {T}}} $ balance -$\sum_i (\vec{p}^{i}_{T}\cdot {\vec{p}^{\gamma \gamma }_{T}} / {|\vec{p}^{\gamma \gamma }_{T}|})$ (b), $\sum_i |\vec{p}^{i}_{T}|^{2}$ (c), pull to conversion $z_{\text{PV}} - z_{\text{conv}} /\sigma (z_{\text{conv}})$ (d) for $ \mathrm{H} \rightarrow \gamma \gamma $ simulated signal with $ {m_{\mathrm {H}} }= $ 125 GeV. The distributions are shown for the reconstructed vertex matched to the Higgs MC true vertex (red histogram) and for other vertices (blue histogram). |
png pdf |
Additional Figure 1-c:
Distribution of the inputs used in the vertex identification BDT: $ {p_{\mathrm {T}}} $ asymmetry $(|\sum_i\vec{p}^{i}_{T}| - p^{\gamma \gamma }_{T}) / (|\sum_i\vec{p}^{i}_{T}| + p^{\gamma \gamma }_{T})$ (a), $ {p_{\mathrm {T}}} $ balance -$\sum_i (\vec{p}^{i}_{T}\cdot {\vec{p}^{\gamma \gamma }_{T}} / {|\vec{p}^{\gamma \gamma }_{T}|})$ (b), $\sum_i |\vec{p}^{i}_{T}|^{2}$ (c), pull to conversion $z_{\text{PV}} - z_{\text{conv}} /\sigma (z_{\text{conv}})$ (d) for $ \mathrm{H} \rightarrow \gamma \gamma $ simulated signal with $ {m_{\mathrm {H}} }= $ 125 GeV. The distributions are shown for the reconstructed vertex matched to the Higgs MC true vertex (red histogram) and for other vertices (blue histogram). |
png pdf |
Additional Figure 1-d:
Distribution of the inputs used in the vertex identification BDT: $ {p_{\mathrm {T}}} $ asymmetry $(|\sum_i\vec{p}^{i}_{T}| - p^{\gamma \gamma }_{T}) / (|\sum_i\vec{p}^{i}_{T}| + p^{\gamma \gamma }_{T})$ (a), $ {p_{\mathrm {T}}} $ balance -$\sum_i (\vec{p}^{i}_{T}\cdot {\vec{p}^{\gamma \gamma }_{T}} / {|\vec{p}^{\gamma \gamma }_{T}|})$ (b), $\sum_i |\vec{p}^{i}_{T}|^{2}$ (c), pull to conversion $z_{\text{PV}} - z_{\text{conv}} /\sigma (z_{\text{conv}})$ (d) for $ \mathrm{H} \rightarrow \gamma \gamma $ simulated signal with $ {m_{\mathrm {H}} }= $ 125 GeV. The distributions are shown for the reconstructed vertex matched to the Higgs MC true vertex (red histogram) and for other vertices (blue histogram). |
png pdf |
Additional Figure 2-a:
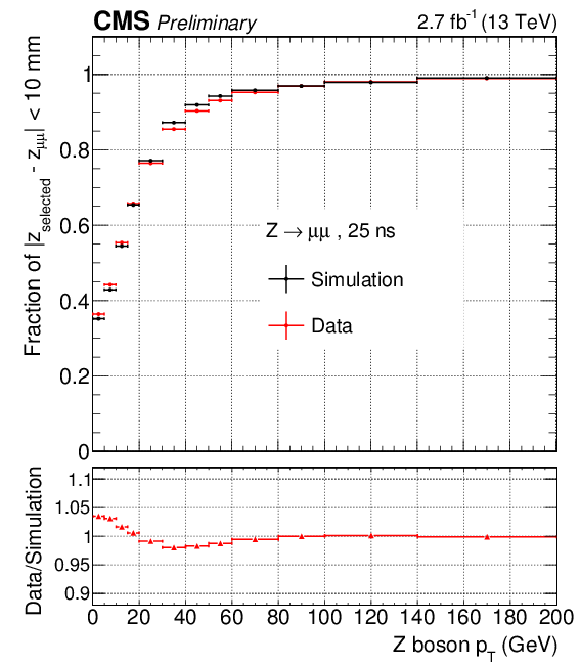
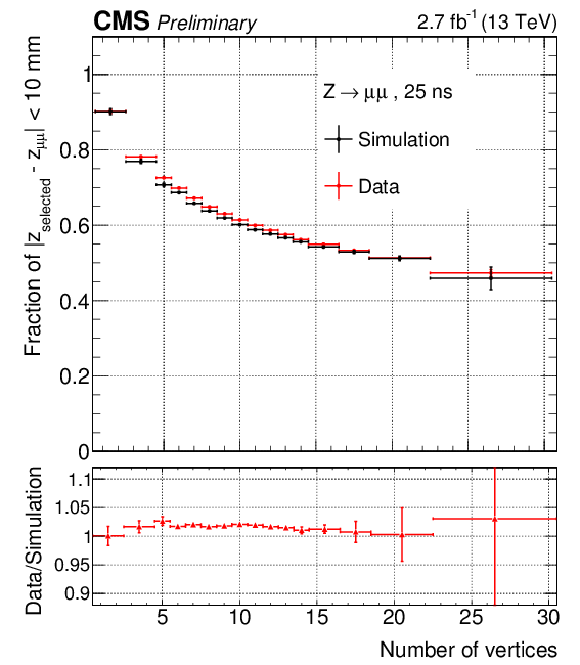
Fraction of $ \mathrm{Z} \to \mu ^{+}\mu ^{-}$ events for which the vertex has been correctly assigned by the $\mathrm{H} \rightarrow \gamma \gamma $ identification algorithm, as a function of the transverse momentum of the dimuon system (a) and of the number of reconstructed vertices (b) for data (red) and MC simulated events (black) at 13 TeV, and their ratio. The muon tracks have been ignored during the vertex reconstruction process to mimic a diphoton system. The vertex is considered as correctly identified if its z coordinate lies within 10 mm of the z coordinate of the vertex tagged by the muon tracks. |
png pdf |
Additional Figure 2-b:
Fraction of $ \mathrm{Z} \to \mu ^{+}\mu ^{-}$ events for which the vertex has been correctly assigned by the $\mathrm{H} \rightarrow \gamma \gamma $ identification algorithm, as a function of the transverse momentum of the dimuon system (a) and of the number of reconstructed vertices (b) for data (red) and MC simulated events (black) at 13 TeV, and their ratio. The muon tracks have been ignored during the vertex reconstruction process to mimic a diphoton system. The vertex is considered as correctly identified if its z coordinate lies within 10 mm of the z coordinate of the vertex tagged by the muon tracks. |
png pdf |
Additional Figure 3-a:
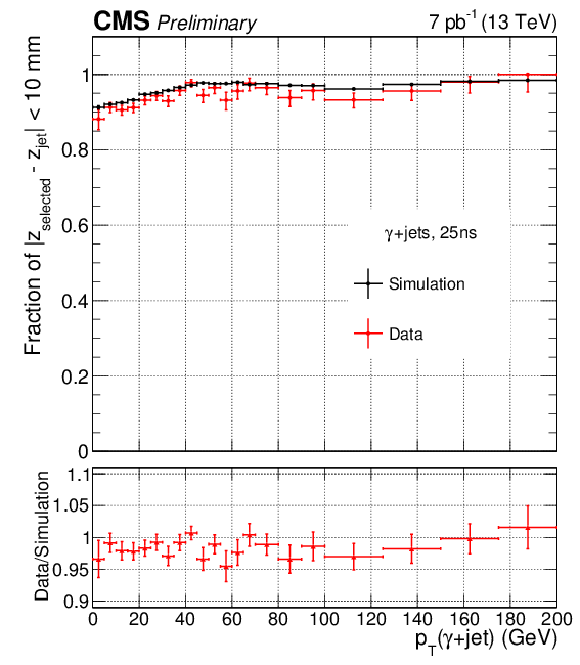
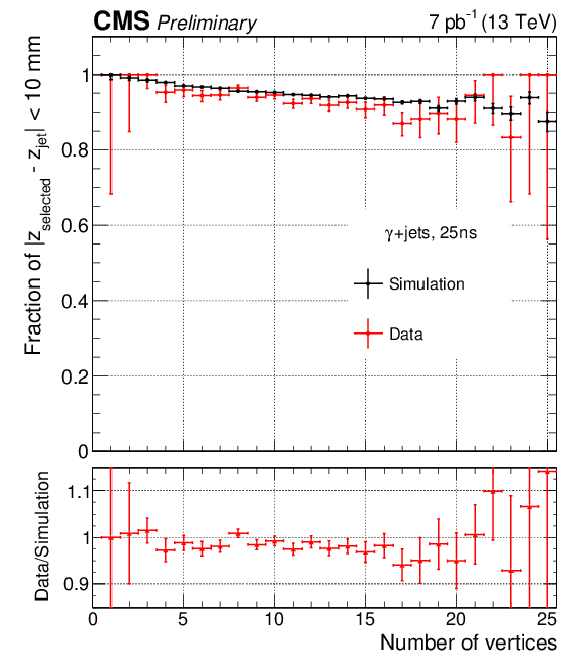
Fraction of $ \gamma $+jet events with a converted photon for which the vertex has been correctly assigned by the $\mathrm{H} \rightarrow \gamma \gamma $ identification algorithm, as a function of the transverse momentum of the photon-plus-jet system (a) and of the number of reconstructed vertices (b). Data are shown in red and simulation in black in the top panels and their ratio is shown in the bottom panels. The tracks associated with the jet have been ignored during the vertex identification process to mimic a diphoton system. The vertex is considered as correctly identified if its z coordinate lies within 10mm of the z coordinate of the vertex tagged by the jet. |
png pdf |
Additional Figure 3-b:
Fraction of $ \gamma $+jet events with a converted photon for which the vertex has been correctly assigned by the $\mathrm{H} \rightarrow \gamma \gamma $ identification algorithm, as a function of the transverse momentum of the photon-plus-jet system (a) and of the number of reconstructed vertices (b). Data are shown in red and simulation in black in the top panels and their ratio is shown in the bottom panels. The tracks associated with the jet have been ignored during the vertex identification process to mimic a diphoton system. The vertex is considered as correctly identified if its z coordinate lies within 10mm of the z coordinate of the vertex tagged by the jet. |
png pdf |
Additional Figure 4:
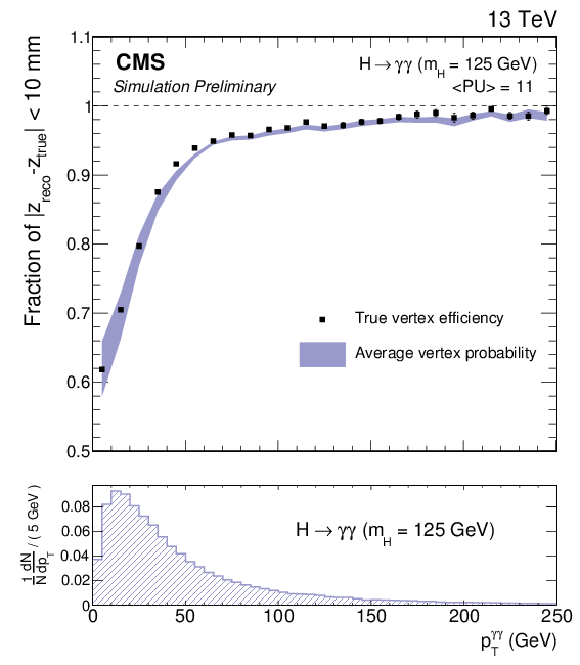
Comparison of the true vertex identification efficiency and the average estimated vertex probability as a function of the reconstructed diphoton $ {p_{\mathrm {T}}} $ for a simulated $\mathrm{H} \to \gamma \gamma $ sample with $ {m_{\mathrm {H}} }=$ 125 GeV. All production modes are included. Events are weighted taking into account the cross-sections of different production modes and to match the pileup distribution in data. In the bottom panel the diphoton $ {p_{\mathrm {T}}} $ distribution is also shown. |
png pdf |
Additional Figure 5:
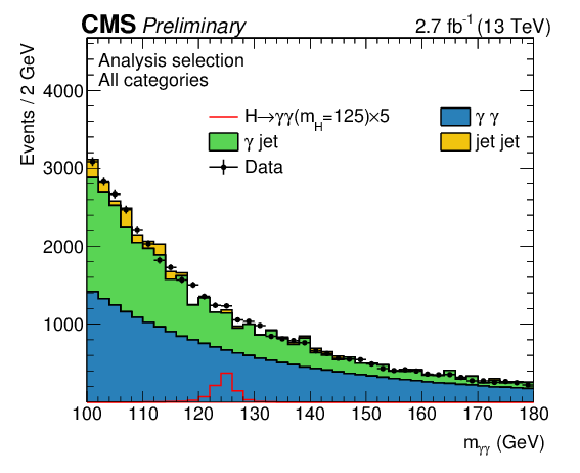
Diphoton invariant mass distribution for events passing the selection of the analysis, for data and simulation. Backgrounds are represented by the filled histograms, while signal for a Higgs boson with a mass of 125 GeV (scaled by a factor of 5) is shown by the red line. The main contributions to the MC statistical uncertainty (not shown in the plot) come from $ \gamma $+jet and jet-jet components. |
png pdf |
Additional Figure 6-a:
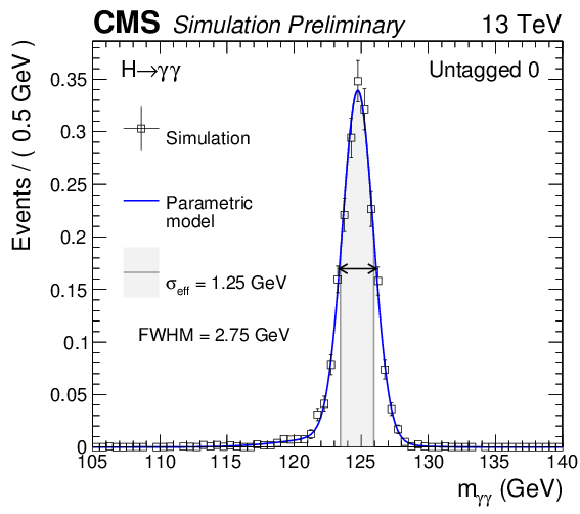
Parametrized signal shape for the four untagged categories for Higgs boson signal simulated with $ {m_{\mathrm {H}} }=$ 125 GeV. The black points represent weighted simulation events and the blue lines are the corresponding models. Also shown are the $\sigma _{\text{eff}}$ value (half the width of the narrowest interval containing 68.3% of the invariant mass distribution), FWHM, and the corresponding intervals. |
png pdf |
Additional Figure 6-b:
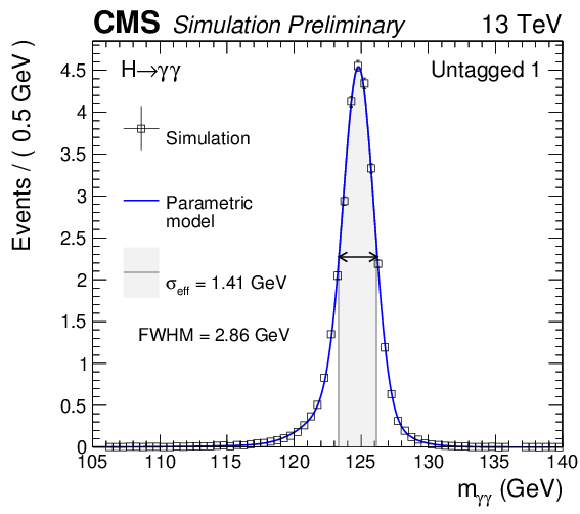
Parametrized signal shape for the four untagged categories for Higgs boson signal simulated with $ {m_{\mathrm {H}} }=$ 125 GeV. The black points represent weighted simulation events and the blue lines are the corresponding models. Also shown are the $\sigma _{\text{eff}}$ value (half the width of the narrowest interval containing 68.3% of the invariant mass distribution), FWHM, and the corresponding intervals. |
png pdf |
Additional Figure 6-c:
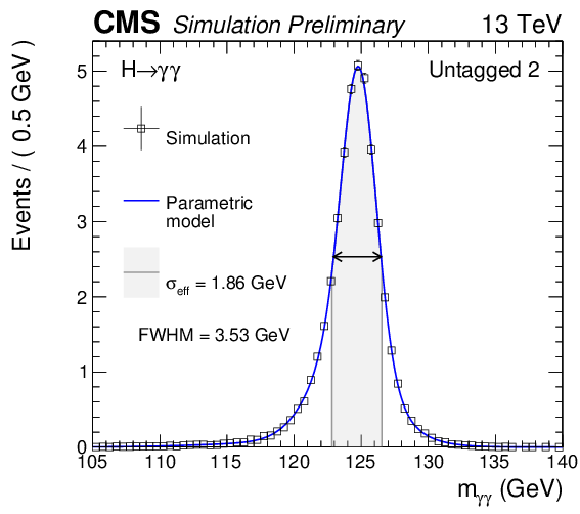
Parametrized signal shape for the four untagged categories for Higgs boson signal simulated with $ {m_{\mathrm {H}} }=$ 125 GeV. The black points represent weighted simulation events and the blue lines are the corresponding models. Also shown are the $\sigma _{\text{eff}}$ value (half the width of the narrowest interval containing 68.3% of the invariant mass distribution), FWHM, and the corresponding intervals. |
png pdf |
Additional Figure 6-d:
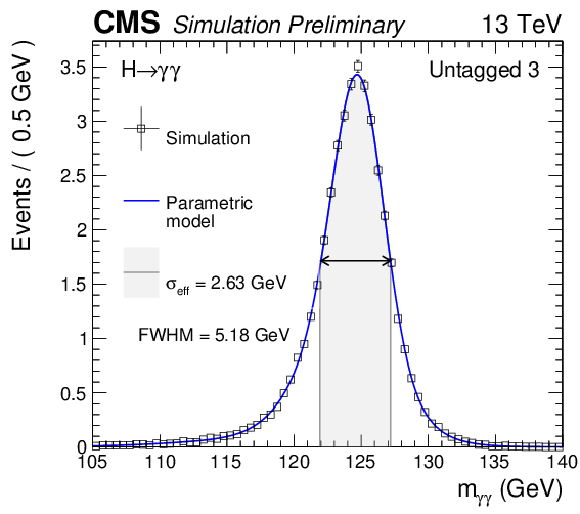
Parametrized signal shape for the four untagged categories for Higgs boson signal simulated with $ {m_{\mathrm {H}} }=$ 125 GeV. The black points represent weighted simulation events and the blue lines are the corresponding models. Also shown are the $\sigma _{\text{eff}}$ value (half the width of the narrowest interval containing 68.3% of the invariant mass distribution), FWHM, and the corresponding intervals. |
png pdf |
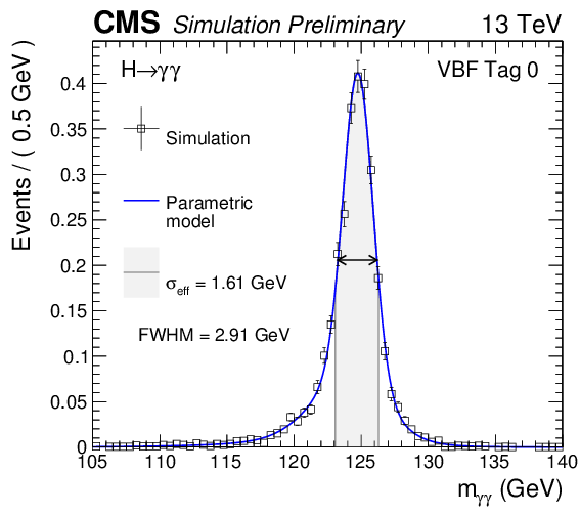
Additional Figure 7-a:
Parametrized signal shape for the VBFTag0 (a), VBFTag1 (b), TTHHadronicTag (c) and TTHLeptonicTag (d) categories for Higgs boson signal simulated with $ {m_{\mathrm {H}} }=$ 125 GeV. The black points represent weighted simulation events and the blue lines are the corresponding models. Also shown is the $\sigma _{\text{eff}}$ value (half the width of the narrowest interval containing 68.3% of the invariant mass distribution), FWHM, and the corresponding intervals. |
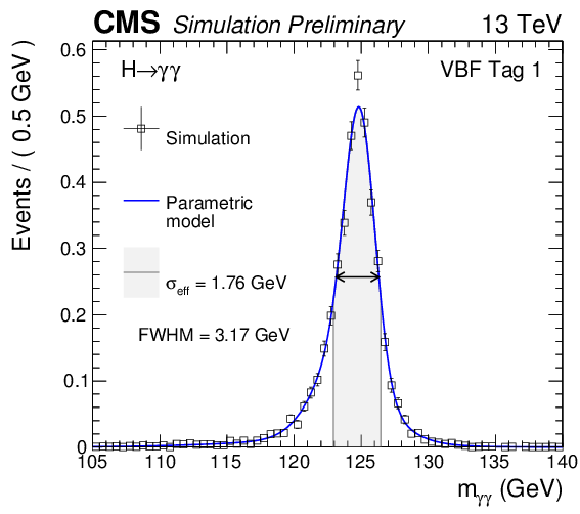
png pdf |
Additional Figure 7-b:
Parametrized signal shape for the VBFTag0 (a), VBFTag1 (b), TTHHadronicTag (c) and TTHLeptonicTag (d) categories for Higgs boson signal simulated with $ {m_{\mathrm {H}} }=$ 125 GeV. The black points represent weighted simulation events and the blue lines are the corresponding models. Also shown is the $\sigma _{\text{eff}}$ value (half the width of the narrowest interval containing 68.3% of the invariant mass distribution), FWHM, and the corresponding intervals. |
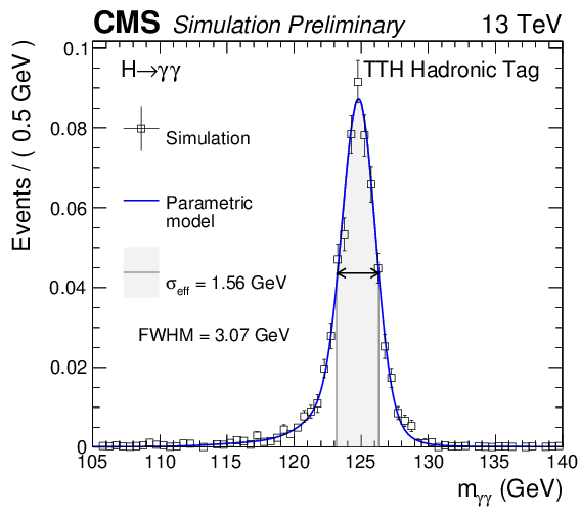
png pdf |
Additional Figure 7-c:
Parametrized signal shape for the VBFTag0 (a), VBFTag1 (b), TTHHadronicTag (c) and TTHLeptonicTag (d) categories for Higgs boson signal simulated with $ {m_{\mathrm {H}} }=$ 125 GeV. The black points represent weighted simulation events and the blue lines are the corresponding models. Also shown is the $\sigma _{\text{eff}}$ value (half the width of the narrowest interval containing 68.3% of the invariant mass distribution), FWHM, and the corresponding intervals. |
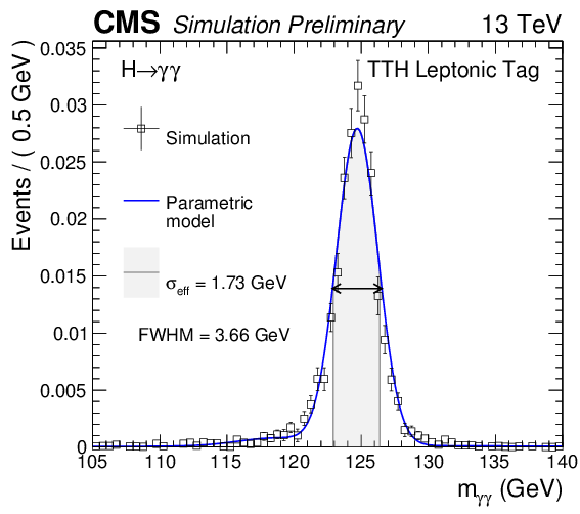
png pdf |
Additional Figure 7-d:
Parametrized signal shape for the VBFTag0 (a), VBFTag1 (b), TTHHadronicTag (c) and TTHLeptonicTag (d) categories for Higgs boson signal simulated with $ {m_{\mathrm {H}} }=$ 125 GeV. The black points represent weighted simulation events and the blue lines are the corresponding models. Also shown is the $\sigma _{\text{eff}}$ value (half the width of the narrowest interval containing 68.3% of the invariant mass distribution), FWHM, and the corresponding intervals. |
png pdf |
Additional Figure 8:
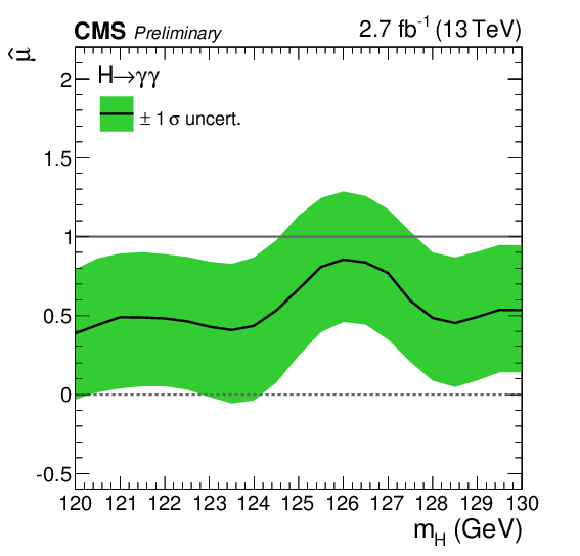
Best-fit signal strength, $\hat{\mu }$, shown as a function of the mass hypothesis, $ {m_{\mathrm {H}} }$. |

|
Compact Muon Solenoid LHC, CERN |

|

|

|

|

|

|