

Compact Muon Solenoid
LHC, CERN
| CMS-PAS-FTR-18-001 | ||
| Searches for light higgsino-like charginos and neutralinos at the HL-LHC with the Phase-2 CMS detector | ||
| CMS Collaboration | ||
| November 2018 | ||
| Abstract: A search for the pair production of light higgsino-like charginos $\tilde{\chi}_{1}^{\pm}$ and neutralinos $\tilde{\chi}^{0}_{2}$ is presented, based on a simulation of 3000 fb$^{-1}$ of proton-proton collision data produced by the HL-LHC at a center-of-mass energy of 14 TeV. The Phase-2 CMS detector is simulated using Delphes. The $\tilde{\chi}_{1}^{\pm}$ and $\tilde{\chi}^{0}_{2}$ are assumed to be mass-degenerate, to be pair-produced ($\tilde{\chi}_{1}^{\pm}\tilde{\chi}^{0}_{2}$, $\tilde{\chi}^{0}_{2}\tilde{\chi}^{0}_{1}$), and to decay into the lightest stable superymmetric particle $\tilde{\chi}^{0}_{1}$ via off-shell W and Z bosons. The $\tilde{\chi}^{0}_{1}$ is also assumed to be higgsino-like. Candidate signal events are required to have two same-flavor, opposite-charge, low transverse momentum leptons (electrons or muons), one jet, and significant missing transverse momentum. | ||
| Links: CDS record (PDF) ; inSPIRE record ; CADI line (restricted) ; | ||
| Figures & Tables | Summary | Additional Figures | References | CMS Publications |
|---|
| Figures | |
png pdf |
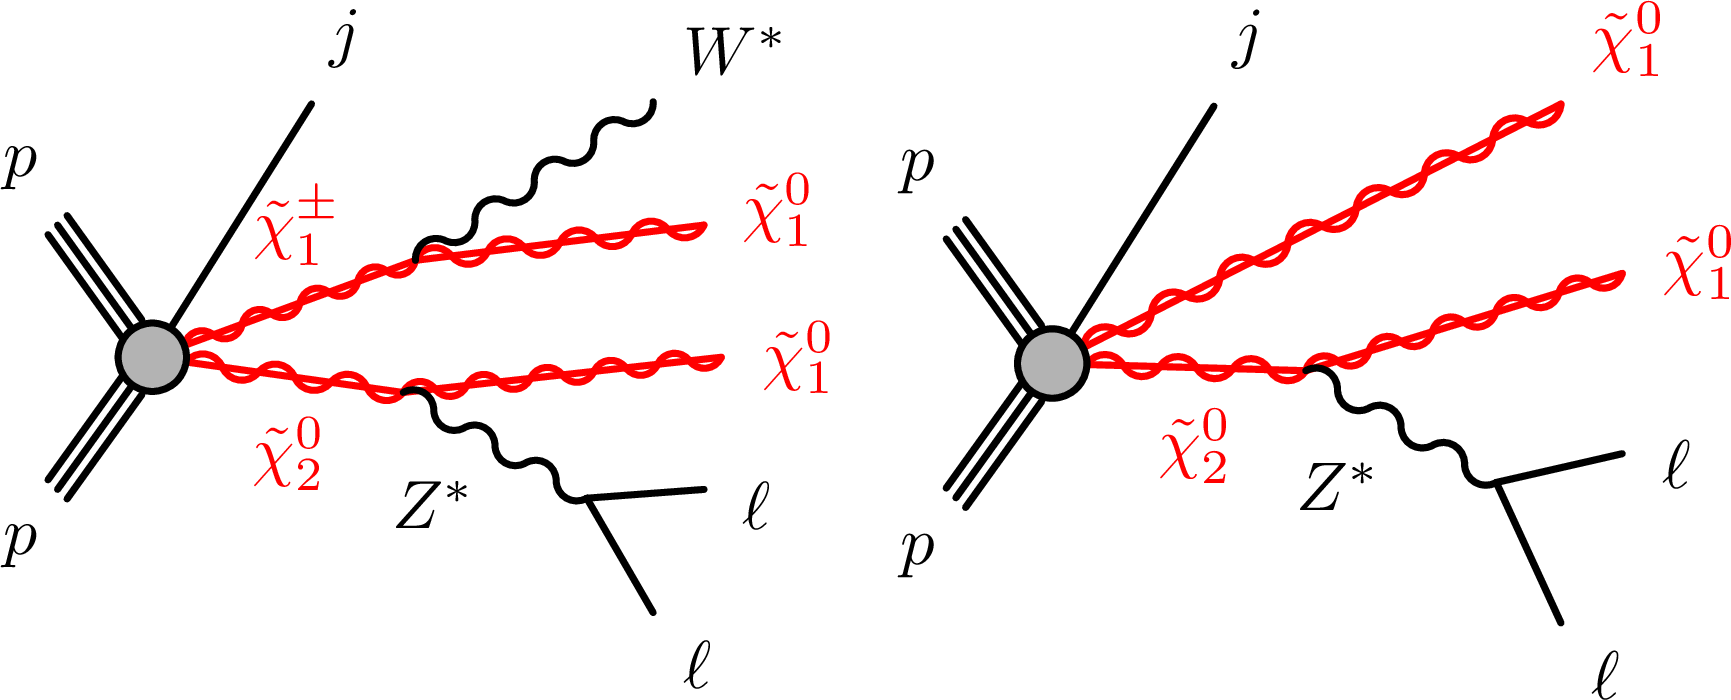
Figure 1:
Example Feynman diagrams for $ {\tilde{\chi}_{1}^{\pm}} {\tilde{\chi}^{0}_{2}} $ (left) and $ {\tilde{\chi}^{0}_{2}} {\tilde{\chi}^{0}_{1}} $ (right) $s$-channel pair production, followed by the leptonic decay of the $ {\tilde{\chi}^{0}_{2}} $. |
png pdf |
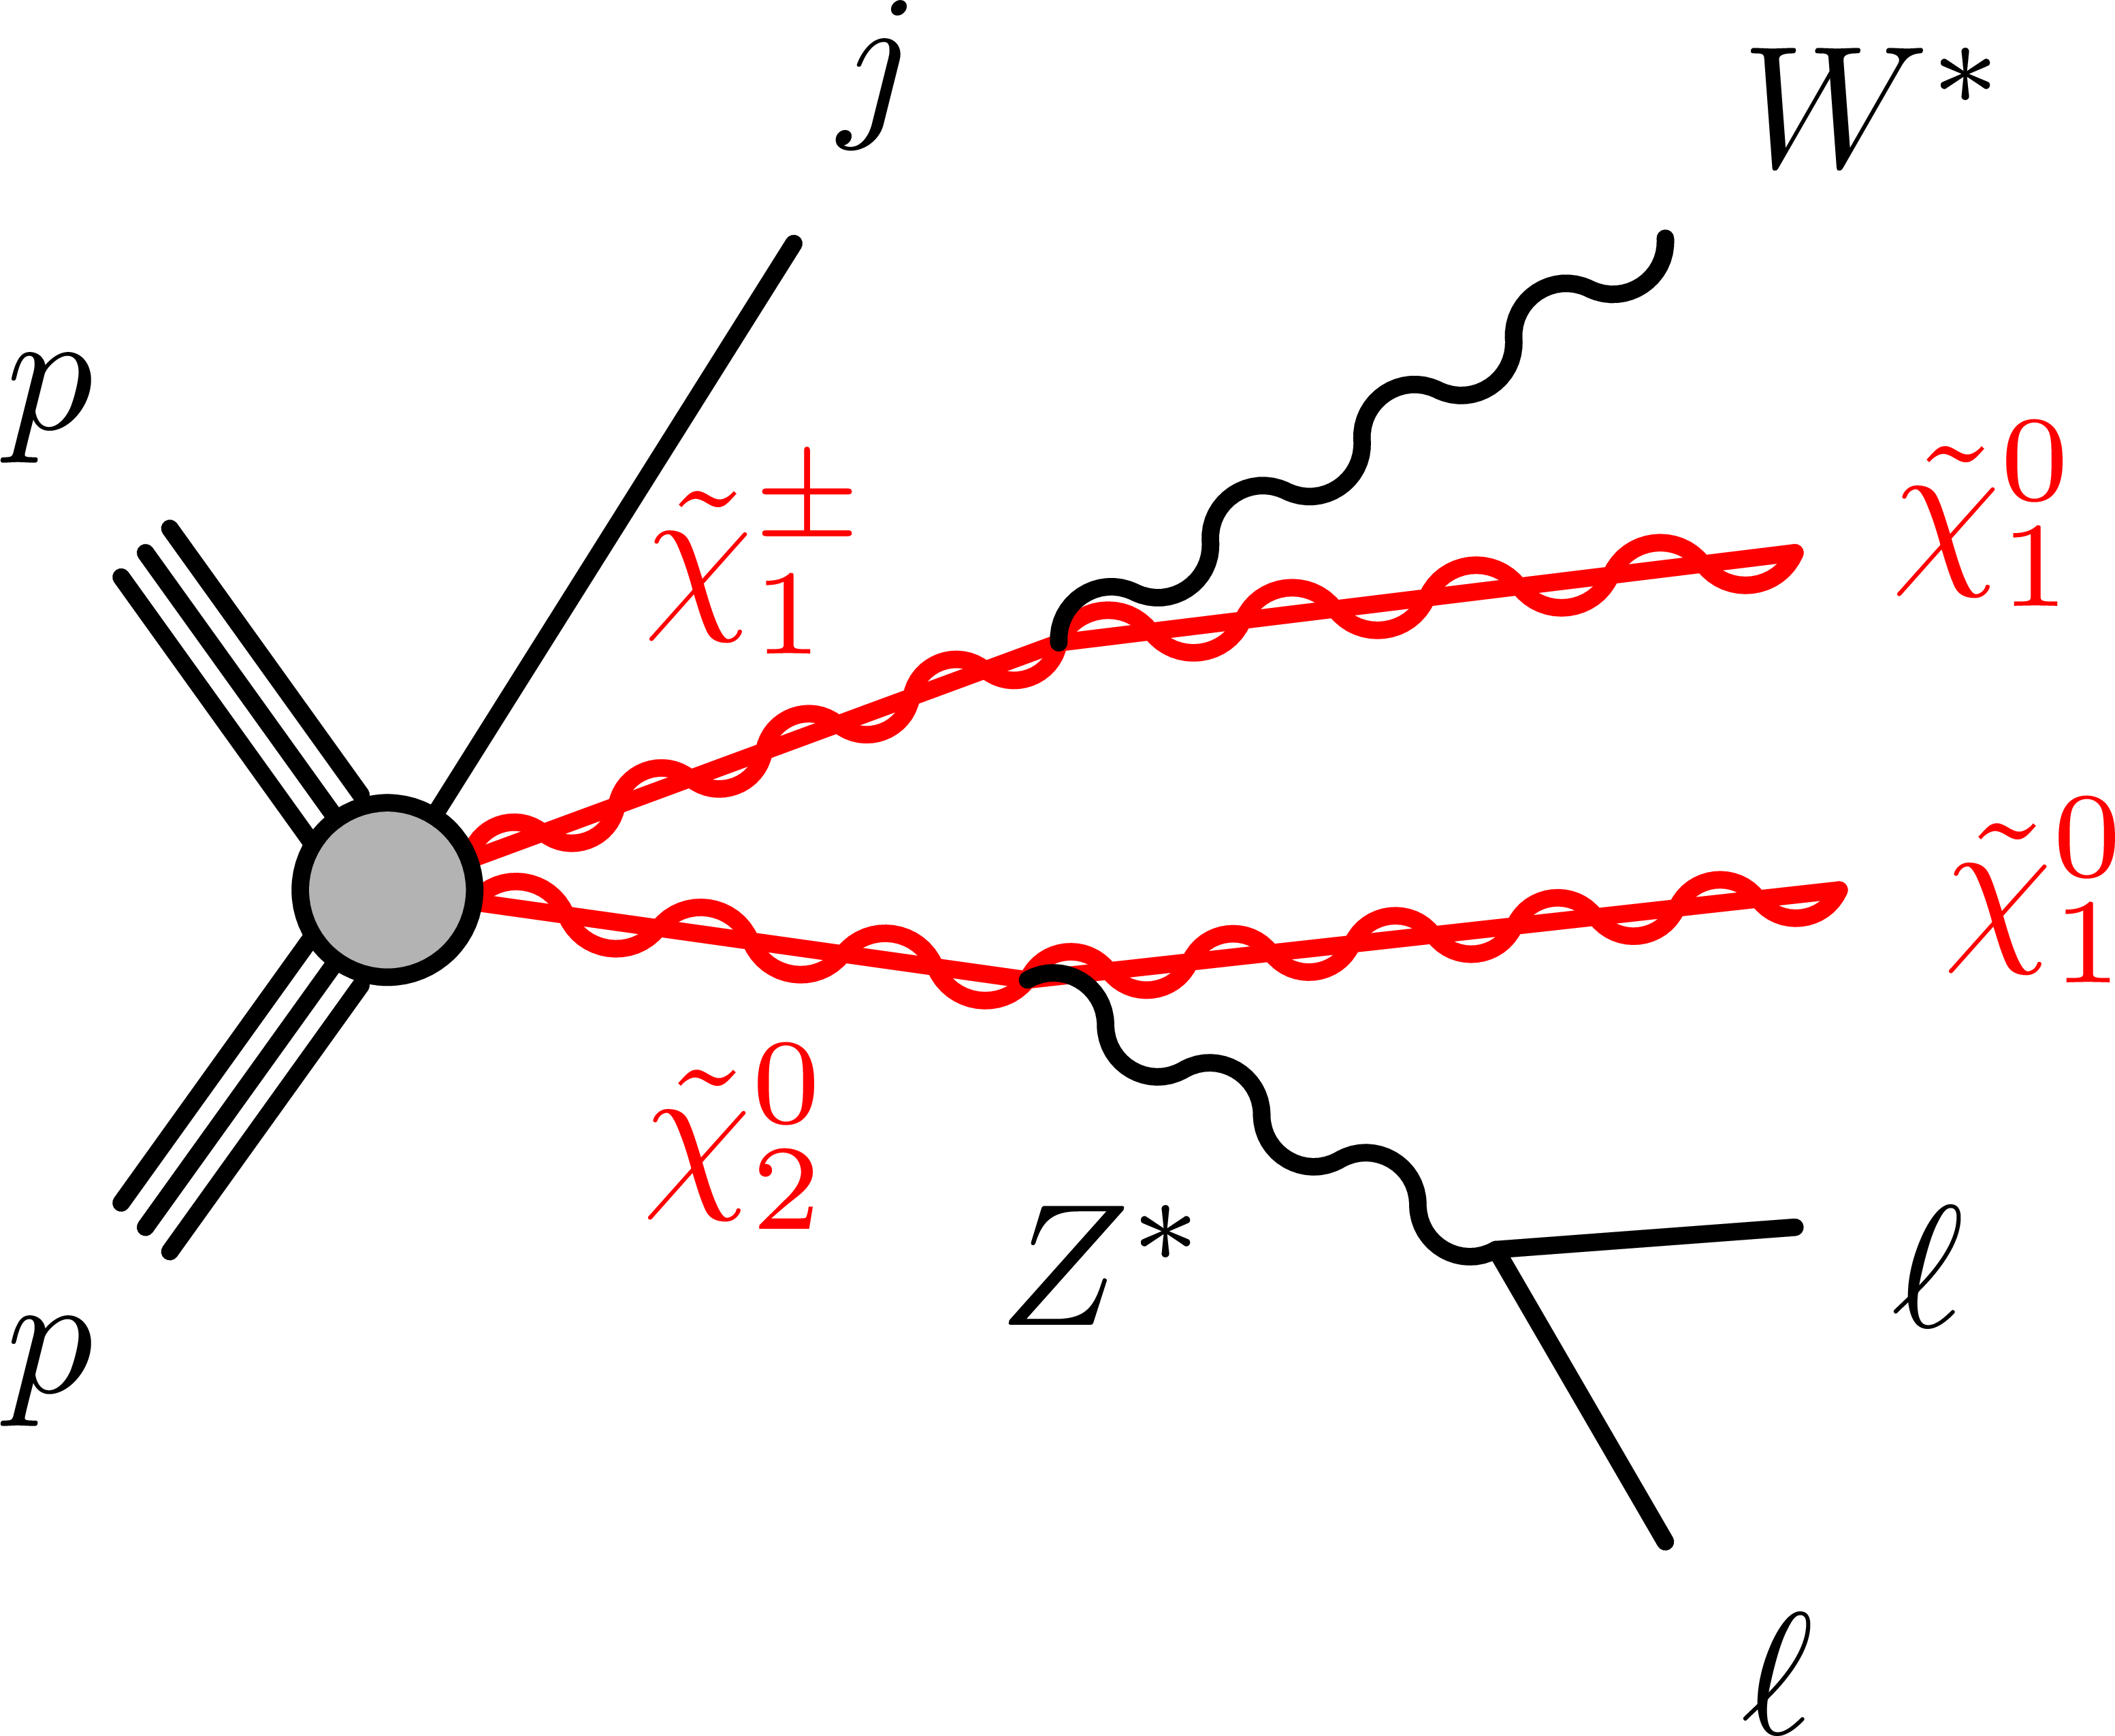
Figure 1-a:
Example Feynman diagram for $ {\tilde{\chi}_{1}^{\pm}} {\tilde{\chi}^{0}_{2}} $ $s$-channel pair production, followed by the leptonic decay of the $ {\tilde{\chi}^{0}_{2}} $. |
png pdf |
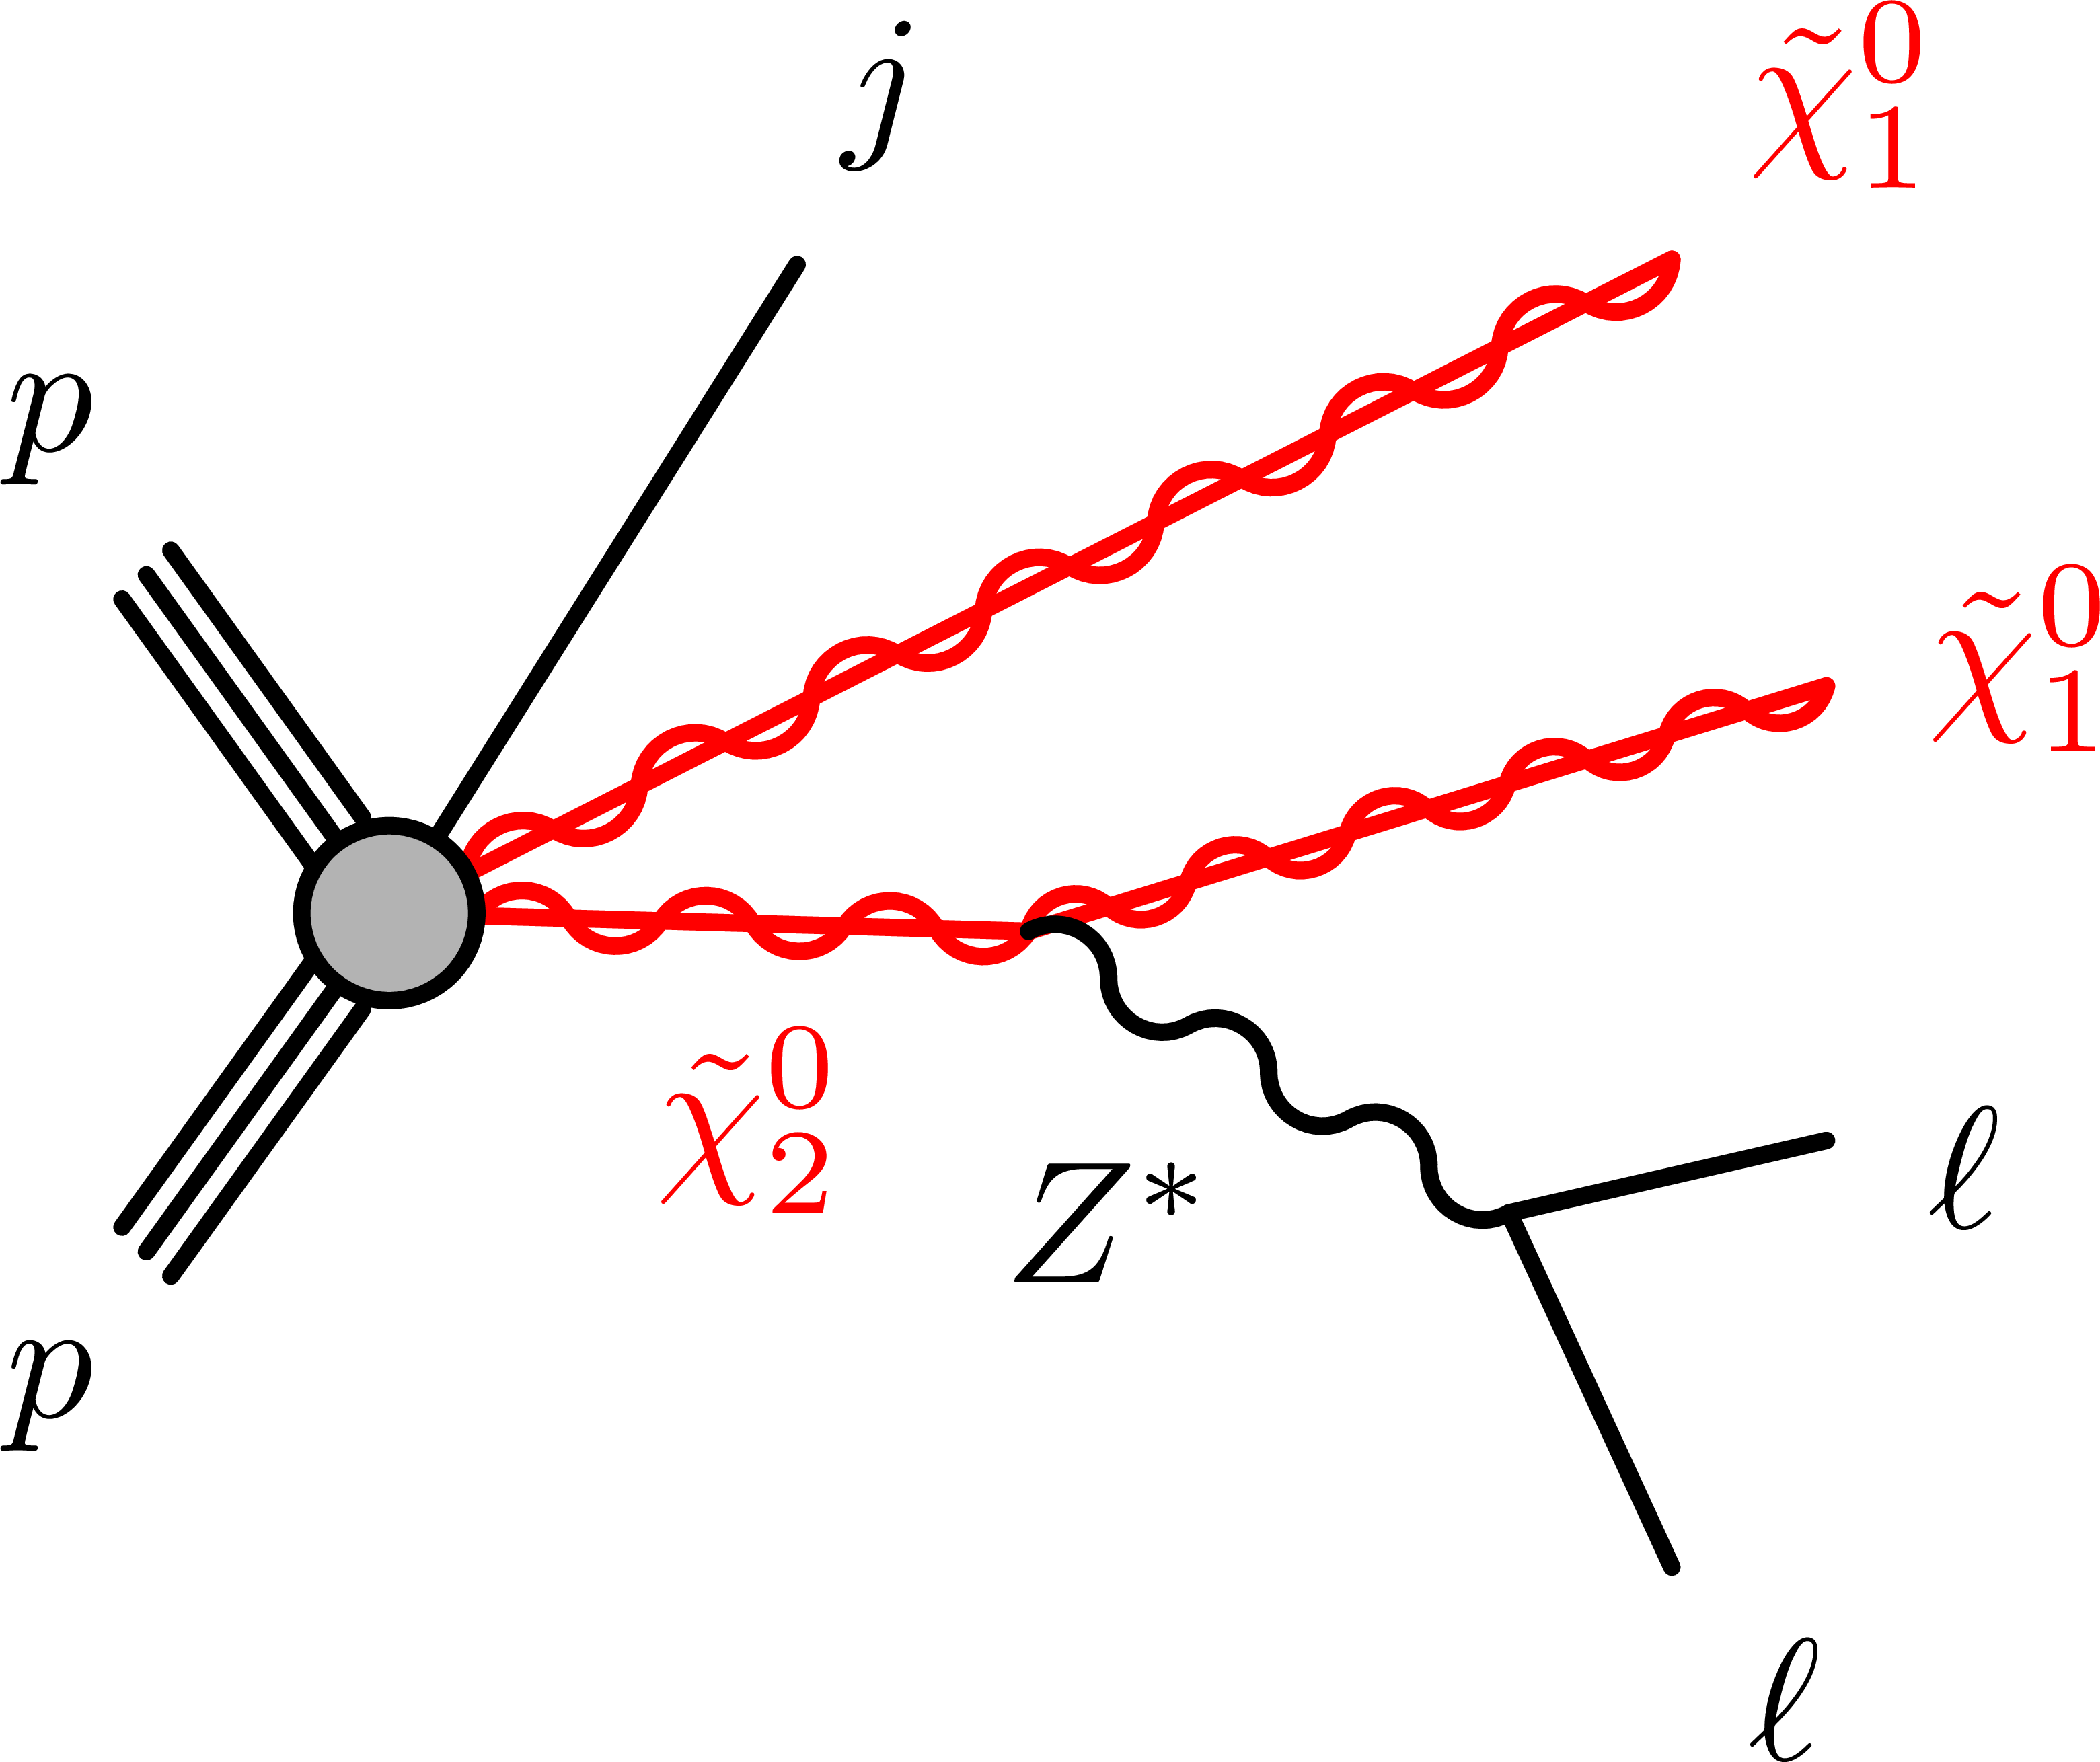
Figure 1-b:
Example Feynman diagram for $ {\tilde{\chi}^{0}_{2}} {\tilde{\chi}^{0}_{1}} $ $s$-channel pair production, followed by the leptonic decay of the $ {\tilde{\chi}^{0}_{2}} $. |
png pdf |
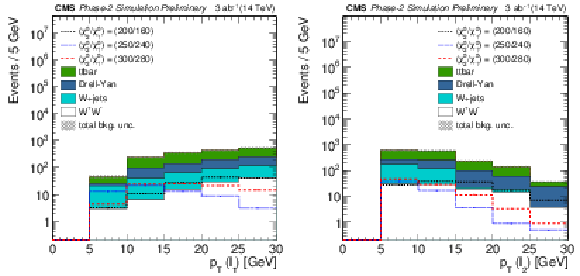
Figure 2:
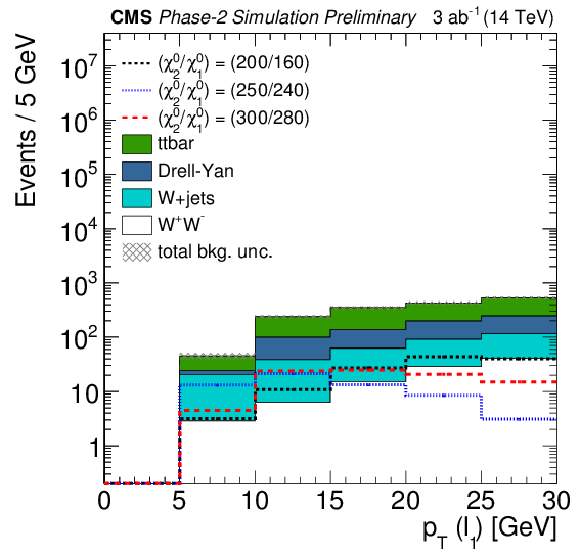
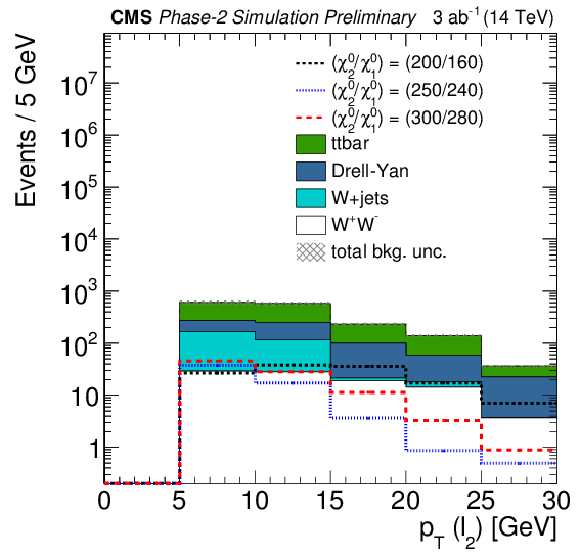
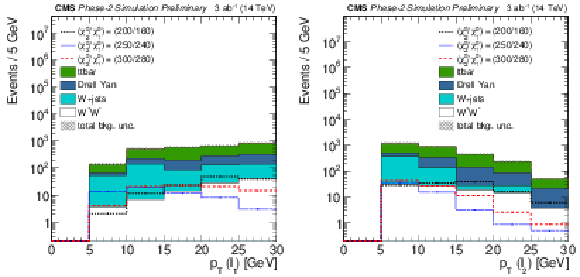
Distributions of the candidate lepton with the highest ${p_{\mathrm {T}}}$ (left) and the second-highest ${p_{\mathrm {T}}}$ (right) for background and signal events in the baseline signal region. Three selected ${{\tilde{\chi}_{1}^{\pm}} {\tilde{\chi}^{0}_{2}} + {\tilde{\chi}^{0}_{2}} {\tilde{\chi}^{0}_{1}}}$ signal models are shown, where the first number corresponds to the mass of the $ {\tilde{\chi}^{0}_{2}} $ (and $ {\tilde{\chi}_{1}^{\pm}} $) and the second one to the mass of the ${\tilde{\chi}^{0}_{1}}$. The uncertainty band represents systematical uncertainties. |
png pdf |
Figure 2-a:
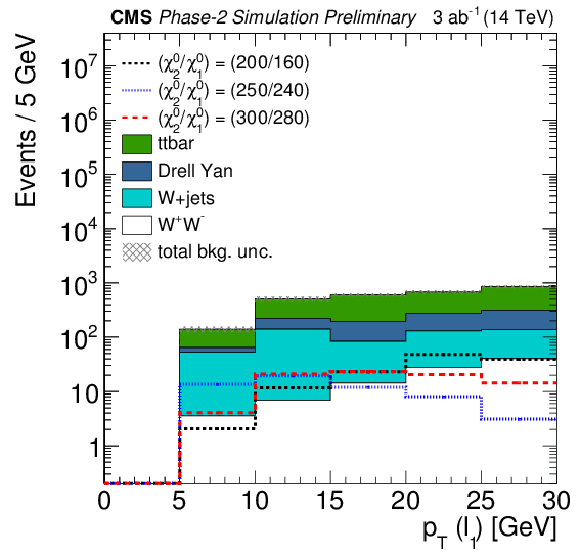
Distributions of the candidate lepton with the highest ${p_{\mathrm {T}}}$ for background and signal events in the baseline signal region. Three selected ${{\tilde{\chi}_{1}^{\pm}} {\tilde{\chi}^{0}_{2}} + {\tilde{\chi}^{0}_{2}} {\tilde{\chi}^{0}_{1}}}$ signal models are shown, where the first number corresponds to the mass of the $ {\tilde{\chi}^{0}_{2}} $ (and $ {\tilde{\chi}_{1}^{\pm}} $) and the second one to the mass of the ${\tilde{\chi}^{0}_{1}}$. The uncertainty band represents systematical uncertainties. |
png pdf |
Figure 2-b:
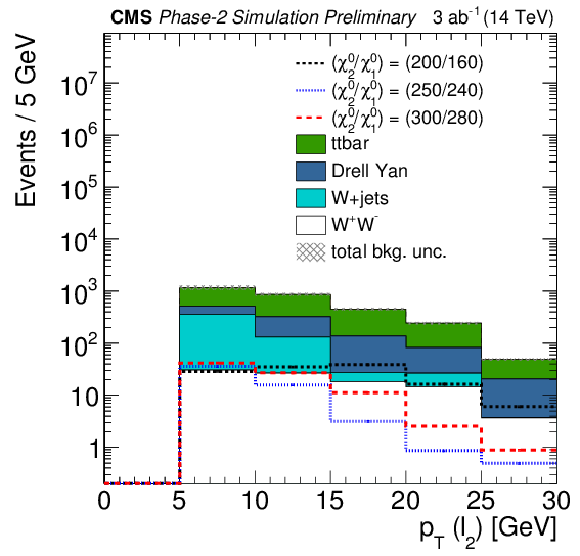
Distributions of the candidate lepton with the second-highest ${p_{\mathrm {T}}}$ for background and signal events in the baseline signal region. Three selected ${{\tilde{\chi}_{1}^{\pm}} {\tilde{\chi}^{0}_{2}} + {\tilde{\chi}^{0}_{2}} {\tilde{\chi}^{0}_{1}}}$ signal models are shown, where the first number corresponds to the mass of the $ {\tilde{\chi}^{0}_{2}} $ (and $ {\tilde{\chi}_{1}^{\pm}} $) and the second one to the mass of the ${\tilde{\chi}^{0}_{1}}$. The uncertainty band represents systematical uncertainties. |
png pdf |
Figure 3:
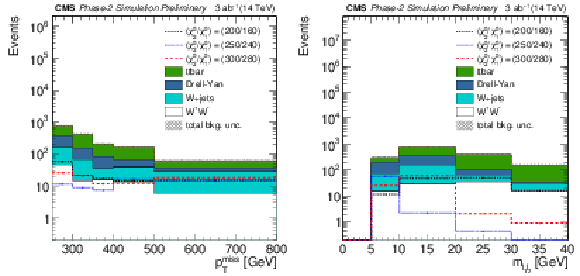
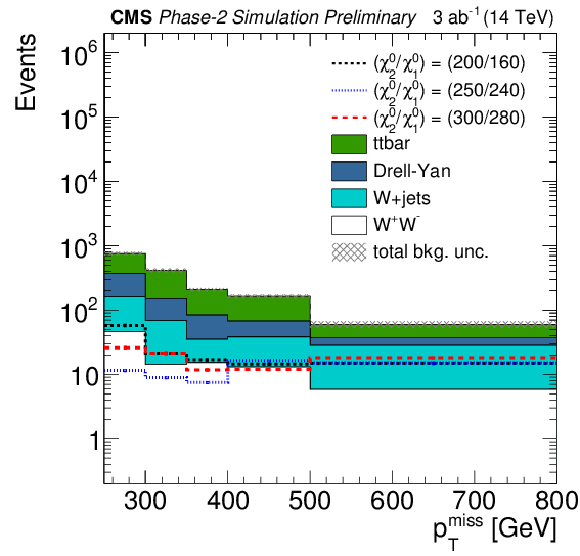
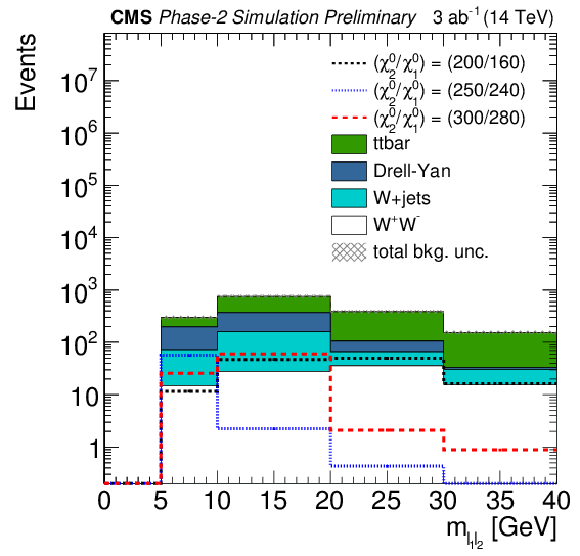
Distributions of the $ {{p_{\mathrm {T}}} ^\text {miss}} $ (left) and ${m_{\ell _1, \ell _2}}$ (right) for background and signal events in the baseline signal region. Three selected ${{\tilde{\chi}_{1}^{\pm}} {\tilde{\chi}^{0}_{2}} + {\tilde{\chi}^{0}_{2}} {\tilde{\chi}^{0}_{1}}}$ signal models are shown, where the first number corresponds to the mass of $ {\tilde{\chi}^{0}_{2}} $ (and $ {\tilde{\chi}_{1}^{\pm}} $) and the second one to the mass of $ {\tilde{\chi}^{0}_{1}} $. The uncertainty band represents systematical uncertainties. |
png pdf |
Figure 3-a:
Distributions of the $ {{p_{\mathrm {T}}} ^\text {miss}} $ for background and signal events in the baseline signal region. Three selected ${{\tilde{\chi}_{1}^{\pm}} {\tilde{\chi}^{0}_{2}} + {\tilde{\chi}^{0}_{2}} {\tilde{\chi}^{0}_{1}}}$ signal models are shown, where the first number corresponds to the mass of $ {\tilde{\chi}^{0}_{2}} $ (and $ {\tilde{\chi}_{1}^{\pm}} $) and the second one to the mass of $ {\tilde{\chi}^{0}_{1}} $. The uncertainty band represents systematical uncertainties. |
png pdf |
Figure 3-b:
Distributions of the ${m_{\ell _1, \ell _2}}$ for background and signal events in the baseline signal region. Three selected ${{\tilde{\chi}_{1}^{\pm}} {\tilde{\chi}^{0}_{2}} + {\tilde{\chi}^{0}_{2}} {\tilde{\chi}^{0}_{1}}}$ signal models are shown, where the first number corresponds to the mass of $ {\tilde{\chi}^{0}_{2}} $ (and $ {\tilde{\chi}_{1}^{\pm}} $) and the second one to the mass of $ {\tilde{\chi}^{0}_{1}} $. The uncertainty band represents systematical uncertainties. |
png pdf |
Figure 4:
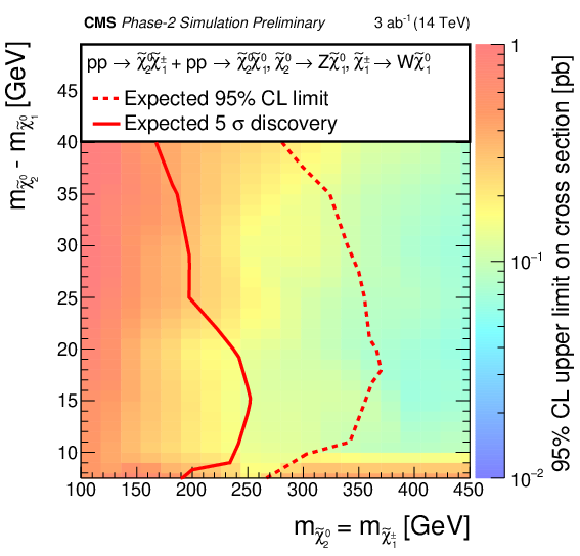
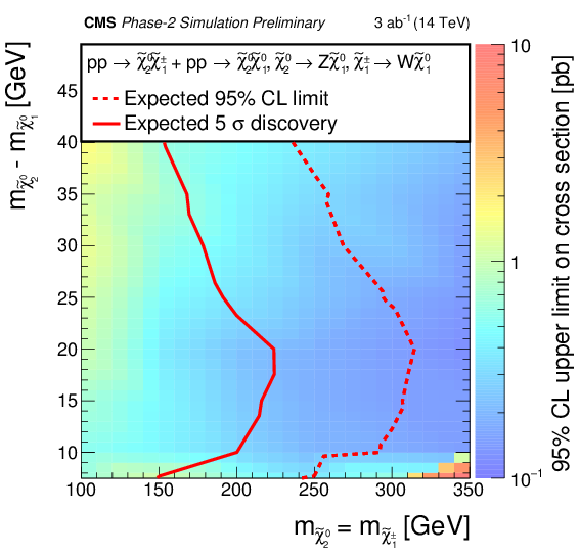
The $5\sigma $ discovery contours and expected 95% CL exclusion contours for the combined $ {\tilde{\chi}_{1}^{\pm}} {\tilde{\chi}^{0}_{2}} $ and $ {\tilde{\chi}^{0}_{2}} {\tilde{\chi}^{0}_{1}} $ production. Results are presented for $\Delta M({\tilde{\chi}^{0}_{2}}, {\tilde{\chi}^{0}_{1}}) > $ 7.5 GeV. |
| Tables | |
png pdf |
Table 1:
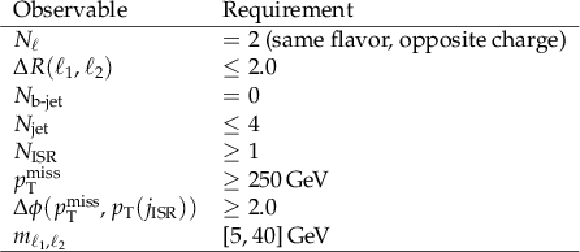
Definition of the baseline signal region. In the table below, $ {N_{\ell}} $ is the number of lepton candidates; $ {\Delta R(\ell _1,\ell _2)} $ is the angular separation between the two candidate leptons in the $\phi, \eta $ space; $ {N_{\text {b-jet}}} $ is the number of b jets; $ {N_{\text {jet}}} $ is the number of candidate jets (including any ISR jet reconstructed in the event); $ {N_{\text {ISR}}} $ is the number of ISR jets; $ {\Delta \phi ({{p_{\mathrm {T}}} ^\text {miss}} , {p_{\text {T}}({j_{\text {ISR}}})})} $ is the azimuthal distance between the $ {{p_{\mathrm {T}}} ^\text {miss}} $ vector and the ${j_{\text {ISR}}} {p_{\mathrm {T}}}$ vector; and $ {m_{\ell _1, \ell _2}}$ is the invariant mass of the two candidate leptons. |
png pdf |
Table 2:
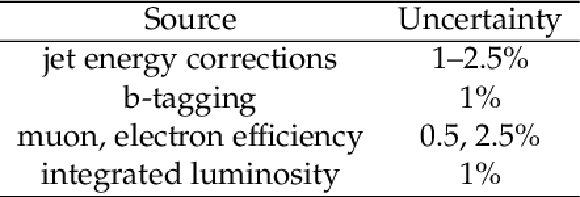
Summary of the experimental systematic uncertainties assumed in the prediction of the yields for processes with prompt leptons. |
png pdf |
Table 3:
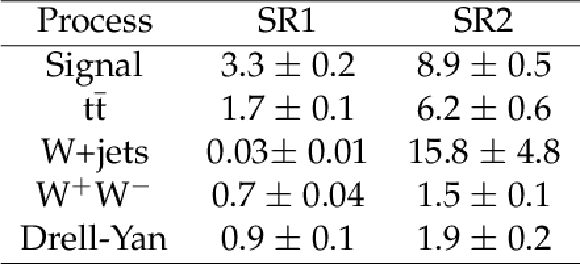
Signal and background yields in two representative event categories. SR1 is defined by ${{p_{\mathrm {T}}} ^\text {miss}} > $ 500 GeV, $ {m_{\ell _1, \ell _2}} $ in [10, 20] GeV, and $ {p_{\text {T}}({\ell _2})} $ in [13, 21] GeV. SR2 is defined by ${{p_{\mathrm {T}}} ^\text {miss}} > $ 500 GeV, ${m_{\ell _1, \ell _2}}$ in [10, 20] GeV, and ${p_{\text {T}}({\ell _2})}$ in [5, 13] GeV. The signal model considered here has $m_{{\tilde{\chi}_{1}^{\pm}}}=m_{{\tilde{\chi}^{0}_{2}}} = $ 300 GeV and $ m_{{\tilde{\chi}^{0}_{1}}} = $ 280 GeV. Only systematic uncertainties are given. |
| Summary |
| A search for the pair production of light higgsino-like charginos $ {\tilde{\chi}_{1}^{\pm}} $ and neutralinos $ {\tilde{\chi}^{0}_{2}}$ (${\tilde{\chi}_{1}^{\pm}} {\tilde{\chi}^{0}_{2}} $, $ {\tilde{\chi}^{0}_{2}} {\tilde{\chi}^{0}_{1}} $) is presented using 3000 fb$^{-1}$ of simulated proton-proton collision data produced by the HL-LHC at 14 TeV. The $ {\tilde{\chi}_{1}^{\pm}} $ and $ {\tilde{\chi}^{0}_{2}} $ particles are assumed to be mass-degenerate, to be pair-produced, and to decay into the lightest stable superymmetric particle $ {\tilde{\chi}^{0}_{1}} $ via off-shell W and Z bosons. The $ {\tilde{\chi}^{0}_{1}} $ is also assumed to be higgsino-like. Higgsino-like mass-degenerate $ {\tilde{\chi}_{1}^{\pm}} $ and $ {\tilde{\chi}^{0}_{2}} $ particles with masses up to 250 GeV can be discovered for a mass difference of 15 GeV relative to the lightest neutralino $ {\tilde{\chi}^{0}_{1}} $. For this mass splitting, $ {\tilde{\chi}_{1}^{\pm}} $ and $ {\tilde{\chi}^{0}_{2}} $ with masses up to 360 GeV can be excluded at 95% confidence level. |
| Additional Figures | |
png pdf |
Additional Figure 1:
Distributions of the candidate lepton with the highest ${p_{\mathrm {T}}}$ (left) and the second-highest ${p_{\mathrm {T}}}$ (right) for background and signal events in the baseline signal region. Three selected ${{\tilde{\chi}_{1}^{\pm}} {} {\tilde{\chi}^{0}_{2}} + {\tilde{\chi}^{0}_{2}} {} {\tilde{\chi}^{0}_{1}}}$ signal models are shown, where the first number corresponds to the mass of the ${\tilde{\chi}^{0}_{2}}$ (and ${\tilde{\chi}_{1}^{\pm}}$) and the second one to the mass of the ${\tilde{\chi}^{0}_{1}}$. The uncertainty band represents systematical uncertainties. The ${{p_{\mathrm {T}}} ^\text {miss}}$ is formed here as negative vector sum of the transverse momenta of all objects in the event. |
png pdf |
Additional Figure 1-a:
Distributions of the candidate lepton with highest ${p_{\mathrm {T}}}$ for background and signal events in the baseline signal region. Three selected ${{\tilde{\chi}_{1}^{\pm}} {} {\tilde{\chi}^{0}_{2}} + {\tilde{\chi}^{0}_{2}} {} {\tilde{\chi}^{0}_{1}}}$ signal models are shown, where the first number corresponds to the mass of the ${\tilde{\chi}^{0}_{2}}$ (and ${\tilde{\chi}_{1}^{\pm}}$) and the second one to the mass of the ${\tilde{\chi}^{0}_{1}}$. The uncertainty band represents systematical uncertainties. The ${{p_{\mathrm {T}}} ^\text {miss}}$ is formed here as negative vector sum of the transverse momenta of all objects in the event. |
png pdf |
Additional Figure 1-b:
Distributions of the candidate lepton with second-highest ${p_{\mathrm {T}}}$ for background and signal events in the baseline signal region. Three selected ${{\tilde{\chi}_{1}^{\pm}} {} {\tilde{\chi}^{0}_{2}} + {\tilde{\chi}^{0}_{2}} {} {\tilde{\chi}^{0}_{1}}}$ signal models are shown, where the first number corresponds to the mass of the ${\tilde{\chi}^{0}_{2}}$ (and ${\tilde{\chi}_{1}^{\pm}}$) and the second one to the mass of the ${\tilde{\chi}^{0}_{1}}$. The uncertainty band represents systematical uncertainties. The ${{p_{\mathrm {T}}} ^\text {miss}}$ is formed here as negative vector sum of the transverse momenta of all objects in the event. |
png pdf |
Additional Figure 2:
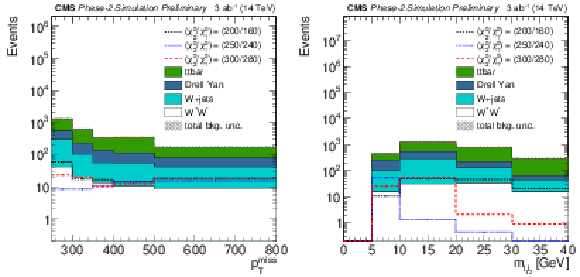
Distributions of the ${{p_{\mathrm {T}}} ^\text {miss}}$ (left) and ${m_{\ell _1, \ell _2}}$ (right) for background and signal events in the baseline signal region. Three selected ${{\tilde{\chi}_{1}^{\pm}} {} {\tilde{\chi}^{0}_{2}} + {\tilde{\chi}^{0}_{2}} {} {\tilde{\chi}^{0}_{1}}}$ signal models are shown, where the first number corresponds to the mass of ${\tilde{\chi}^{0}_{2}}$ (and ${\tilde{\chi}_{1}^{\pm}}$) and the second one to the mass of ${\tilde{\chi}^{0}_{1}}$. The uncertainty band represents systematical uncertainties. The ${{p_{\mathrm {T}}} ^\text {miss}}$ is formed here as negative vector sum of the transverse momenta of all objects in the event. |
png pdf |
Additional Figure 2-a:
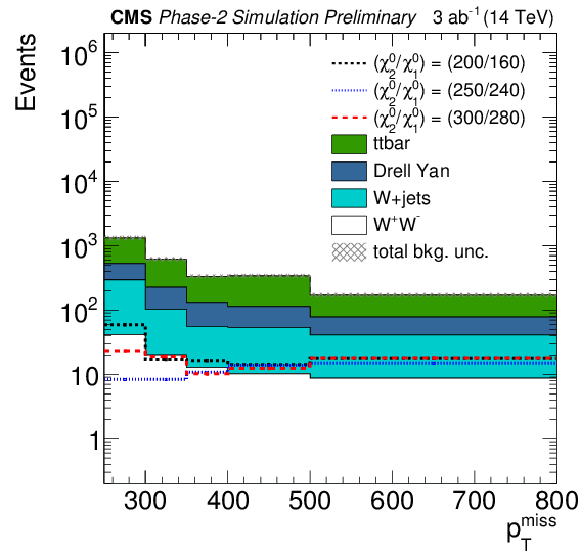
Distributions of ${{p_{\mathrm {T}}} ^\text {miss}}$ or background and signal events in the baseline signal region. Three selected ${{\tilde{\chi}_{1}^{\pm}} {} {\tilde{\chi}^{0}_{2}} + {\tilde{\chi}^{0}_{2}} {} {\tilde{\chi}^{0}_{1}}}$ signal models are shown, where the first number corresponds to the mass of ${\tilde{\chi}^{0}_{2}}$ (and ${\tilde{\chi}_{1}^{\pm}}$) and the second one to the mass of ${\tilde{\chi}^{0}_{1}}$. The uncertainty band represents systematical uncertainties. The ${{p_{\mathrm {T}}} ^\text {miss}}$ is formed here as negative vector sum of the transverse momenta of all objects in the event. |
png pdf |
Additional Figure 2-b:
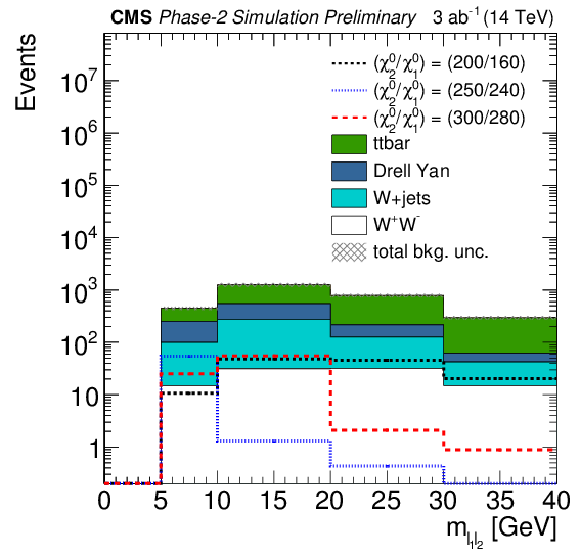
Distributions of ${m_{\ell _1, \ell _2}}$ for background and signal events in the baseline signal region. Three selected ${{\tilde{\chi}_{1}^{\pm}} {} {\tilde{\chi}^{0}_{2}} + {\tilde{\chi}^{0}_{2}} {} {\tilde{\chi}^{0}_{1}}}$ signal models are shown, where the first number corresponds to the mass of ${\tilde{\chi}^{0}_{2}}$ (and ${\tilde{\chi}_{1}^{\pm}}$) and the second one to the mass of ${\tilde{\chi}^{0}_{1}}$. The uncertainty band represents systematical uncertainties. The ${{p_{\mathrm {T}}} ^\text {miss}}$ is formed here as negative vector sum of the transverse momenta of all objects in the event. |
png pdf |
Additional Figure 3:
The 5$\sigma $ discovery contours and expected 95% CL exclusion contours for the combined ${\tilde{\chi}_{1}^{\pm}} {\tilde{\chi}^{0}_{2}}$ and ${\tilde{\chi}^{0}_{2}} {\tilde{\chi}^{0}_{1}}$ production. The missing transverse momentum ${{p_{\mathrm {T}}} ^\text {miss}}$ here is defined as the negative vector sum of the transverse momentum of all candidate objects in the event (candidate electrons, candidate muons and candidate jets as defined in the main body of the document). |
png pdf |
Additional Figure 4:
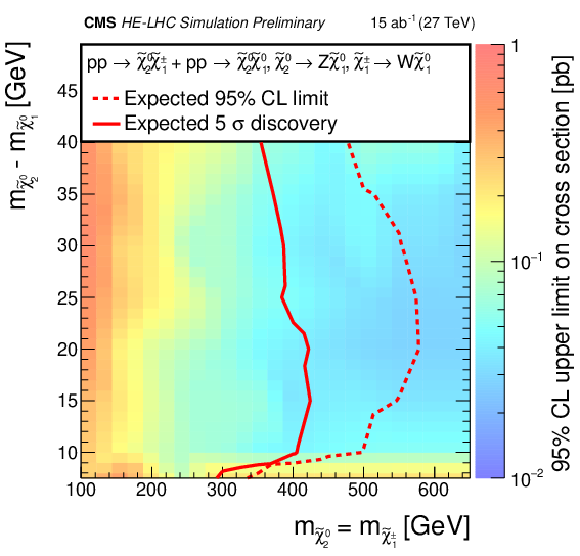
Projection of the HL-LHC 5$\sigma $ discovery contours and expected 95% CL exclusion contours for the combined ${\tilde{\chi}_{1}^{\pm}} {\tilde{\chi}^{0}_{2}}$ and ${\tilde{\chi}^{0}_{2}} {\tilde{\chi}^{0}_{1}}$ production for a center-of-mass energy of 27 TeV and an integrated luminosity of 15 ab$^{-1}$ (HE-LHC). Except for the cross sections and the integrated luminosity, the HL-LHC analysis was not modified. Results are presented for $\Delta M({\tilde{\chi}^{0}_{2}}, {\tilde{\chi}^{0}_{1}}) > $ 7.5 GeV. |
| References | ||||
| 1 | J. Wess and B. Zumino | Supergauge transformations in four dimensions | NPB (1974) 39 | |
| 2 | H. P. Nilles | Supersymmetry, supergravity and particle physics | PR 110 (1984) 1 | |
| 3 | H. E. Haber and G. L. Kane | The search for supersymmetry: Probing physics beyond the standard model | PR 117 (1985) 75 | |
| 4 | R. Barbieri, S. Ferrara, and C. A. Savoy | Gauge models with spontaneously broken local supersymmetry | NPB (1982) 343 | |
| 5 | S. Dawson, E. Eichten, and C. Quigg | Search for supersymmetric particles in hadron-hadron collisions | Nucl. Rev. D 31 (1985) 1581 | |
| 6 | P. Fayet | Supersymmetry and weak, electromagnetic and strong interactions | PLB 64 (1976) 159 | |
| 7 | ATLAS Collaboration | Search for electroweak production of supersymmetric states in scenarios with compressed mass spectra at $ \sqrt{s} = $ 13 TeV with the ATLAS detector | PRD 97 (2018) 052010 | 1712.08119 |
| 8 | CMS Collaboration | Search for new physics in events with two low momentum opposite-sign leptons and missing transverse energy at $ \sqrt{s}= $ 13 TeV | PLB 782 (2018) 440 | CMS-SUS-16-048 1801.01846 |
| 9 | ALEPH Collaboration | Search for charginos nearly mass degenerate with the lightest neutralino in e$ ^+ $e$ ^- $ collisions at center-of-mass energies up to 209 GeV | PLB 533 (2002) 223 | 0203020 |
| 10 | DELPHI Collaboration | Searches for supersymmetric particles in e$ ^+ $e$ ^- $ collisions up to 208 GeV and interpretation of the results within the MSSM | EPJC 31 (2003) 421 | 0311019 |
| 11 | D. Alves et al. | Simplified Models for LHC New Physics Searches | JPG 39 (2012) 421 | 1105.2838 |
| 12 | B. Fuks, M. Klasen, D. R. Lamprea, and M. Rothering | Gaugino production in proton-proton collisions at a center-of-mass energy of 8 TeV | JHEP 10 (2012) 081 | 1207.2159 |
| 13 | B. Fuks, M. Klasen, D. R. Lamprea, and M. Rothering | Precision predictions for electroweak superpartner production at hadron colliders with RESUMMINO | EPJC 73 (2013) 2480 | 1304.0790 |
| 14 | J. Alwall et al. | The automated computation of tree-level and next-to-leading order differential cross sections, and their matching to parton shower simulations | JHEP 07 (2014) 079 | 1405.0301 |
| 15 | J. Alwall et al. | Comparative study of various algorithms for the merging of parton showers and matrix elements in hadronic collisions | EPJC 53 (2008) 473 | 0706.2569 |
| 16 | T. Sjostrand et al. | An introduction to PYTHIA 8.2 | CPC 191 (2015) 159 | 1410.3012 |
| 17 | R. Frederix and S. Frixione | Merging meets matching in MC@NLO | JHEP 12 (2012) 61 | 1209.6215 |
| 18 | T. Gehrmann et al. | $ W^+W^- $ Production at Hadron Colliders in NNLO QCD | PRL 113 (2014) 212001 | 1408.5243 |
| 19 | NNPDF Collaboration | Parton distributions for the LHC Run II | JHEP 04 (2015) 040 | 1410.8849 |
| 20 | A. Avetisyan et al. | Methods and Results for Standard Model Event Generation at 14 TeV, 33 TeV and 100 TeV Proton Colliders: A Snowmass Whitepaper | 1308.1636 | |
| 21 | CMS Collaboration | The CMS Experiment at the CERN LHC | JINST 3 (2008) S08004 | CMS-00-001 |
| 22 | G. Apollinari et al. | High-Luminosity Large Hadron Collider (HL-LHC) : Preliminary Design Report | ||
| 23 | CMS Collaboration | Technical Proposal for the Phase-II Upgrade of the Compact Muon Solenoid | CMS-PAS-TDR-15-002 | CMS-PAS-TDR-15-002 |
| 24 | CMS Collaboration | The Phase-2 Upgrade of the CMS Tracker | CDS | |
| 25 | CMS Collaboration | The Phase-2 Upgrade of the CMS Barrel Calorimeter | CDS | |
| 26 | CMS Collaboration | The Phase-2 Upgrade of the CMS Endcap Calorimeter | CDS | |
| 27 | CMS Collaboration | The Phase-2 Upgrade of the CMS Muon Detectors | CDS | |
| 28 | CMS Collaboration | CMS Phase-2 Object Performance | ||
| 29 | DELPHES 3 Collaboration | DELPHES 3, A modular framework for fast simulation of a generic collider experiment | JHEP 02 (2014) 057 | 1307.6346 |
| 30 | GEANT4 Collaboration | GEANT4: A Simulation toolkit | NIMA 506 (2003) 250 | |
| 31 | J. Allison et al. | Geant4 developments and applications | IEEE Trans. Nucl. Sci. 53 (2006) 270 | |
| 32 | CMS Collaboration | Particle-flow reconstruction and global event description with the CMS detector | JINST 12 (2017) P10003 | CMS-PRF-14-001 1706.04965 |
| 33 | D. Bertolini, P. Harris, M. Low, and N. Tran | Pileup Per Particle Identification | JHEP 59 (2014) 1410 | 1407.6013 |
| 34 | M. Cacciari, G. P. Salam, and G. Soyez | The anti-$ k_t $ jet clustering algorithm | JHEP 04 (2008) 063 | 0802.1189 |
| 35 | M. Cacciari, G. P. Salam, and G. Soyez | FastJet user manual | EPJC 72 (2012) 1896 | 1111.6097 |
| 36 | CMS Collaboration | Identification of heavy-flavour jets with the CMS detector in pp collisions at 13 TeV | JINST 13 (2018) P05011 | CMS-BTV-16-002 1712.07158 |
| 37 | CMS Collaboration | The Phase-2 Upgrade of the CMS L1 Trigger Interim Technical Design Report | CDS | |
| 38 | G. Cowan, K. Cranmer, E. Gross, and O. Vitells | Asymptotic formulae for likelihood-based tests of new physics | EPJC 73 (2013) 2501 | 1007.1727 |
| 39 | T. Junk | Confidence level computation for combining searches with small statistics | Nucl. Instr. Meth. A 434 (1999) 435 | |
| 40 | A. L. Read | Presentation of search results: the CLs technique | JPG 28 (2002) 2693 | |

|
Compact Muon Solenoid LHC, CERN |

|

|

|

|

|

|