

Compact Muon Solenoid
LHC, CERN
| CMS-PAS-EXO-17-030 | ||
| Search for pair-produced three-jet resonances in proton-proton collisions at $\sqrt{s}= $ 13 TeV | ||
| CMS Collaboration | ||
| July 2018 | ||
| Abstract: A search for three-jet hadronic resonance production in pp collisions at a center-of-mass energy of 13 TeV has been conducted by the CMS Collaboration at the LHC with a data sample corresponding to an integrated luminosity of 35.9 fb$^{-1}$. This resonance search in events with high jet multiplicity is largely model independent, although an R-parity-violating supersymmetric model of gluino pair production which results in a six-jet final state is used to optimize the event selection. The search is optimized separately for four mass ranges from 200 GeV to 2000 GeV, with significant improvements in sensitivity compared to previous analyses, especially at low masses. Good agreement is observed between data and expected standard model and $\mathrm{t\bar{t}}$ backgrounds. The resulting upper limits on pair-produced three-jet resonances are the most stringent to date. | ||
|
Links:
CDS record (PDF) ;
inSPIRE record ;
CADI line (restricted) ;
These preliminary results are superseded in this paper, PRD 99 (2019) 012010. The superseded preliminary plots can be found here. |
||
| Figures | |
png pdf |
Figure 1:
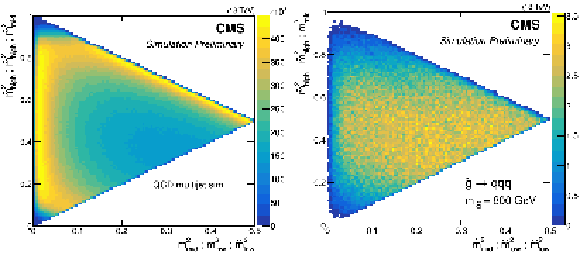
Pair masses within the triplet as described in Eq. 1 plotted $\hat{m}(3,2)^2_{high}$ vs. $\hat{m}(3,2)^2_{low}$, $\hat{m}(3,2)^2_{high}$ vs. $\hat{m}(3,2)^2_{mid}$ and $\hat{m}(3,2)^2_{mid}$ vs. $\hat{m}(3,2)^2_{low}$. QCD triplets (left) cluster at the edge, while triplets from signal events ($m_{\tilde{g}} = $ 800 GeV, right) fill the center. |
png |
Figure 1-a:
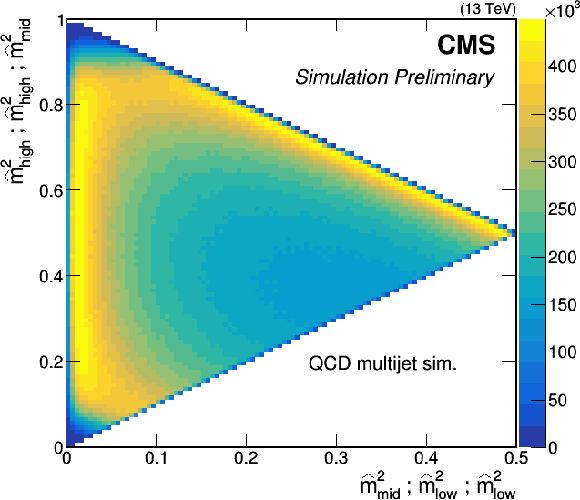
Pair masses within the triplet as described in Eq. 1 plotted $\hat{m}(3,2)^2_{high}$ vs. $\hat{m}(3,2)^2_{low}$, $\hat{m}(3,2)^2_{high}$ vs. $\hat{m}(3,2)^2_{mid}$ and $\hat{m}(3,2)^2_{mid}$ vs. $\hat{m}(3,2)^2_{low}$. QCD triplets (left) cluster at the edge, while triplets from signal events ($m_{\tilde{g}} = $ 800 GeV, right) fill the center. |
png |
Figure 1-b:
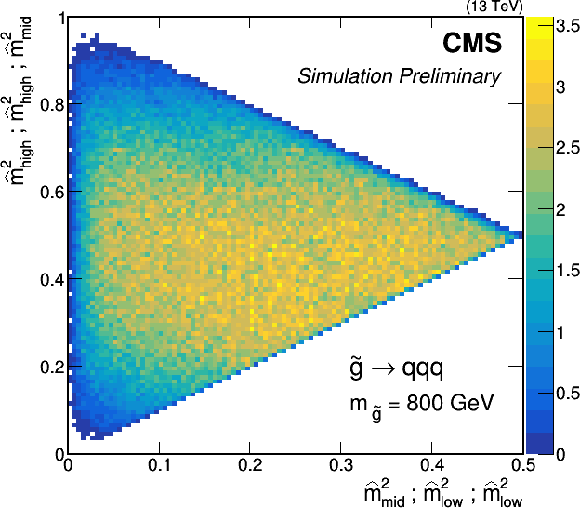
Pair masses within the triplet as described in Eq. 1 plotted $\hat{m}(3,2)^2_{high}$ vs. $\hat{m}(3,2)^2_{low}$, $\hat{m}(3,2)^2_{high}$ vs. $\hat{m}(3,2)^2_{mid}$ and $\hat{m}(3,2)^2_{mid}$ vs. $\hat{m}(3,2)^2_{low}$. QCD triplets (left) cluster at the edge, while triplets from signal events ($m_{\tilde{g}} = $ 800 GeV, right) fill the center. |
png pdf |
Figure 2:
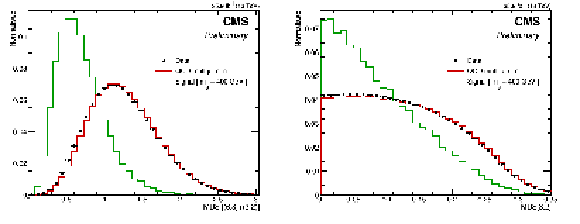
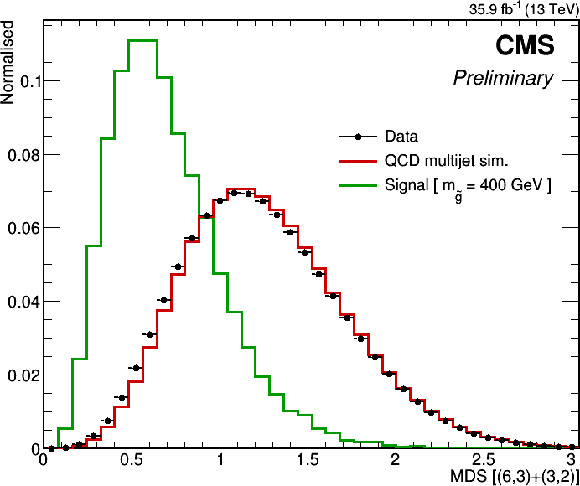
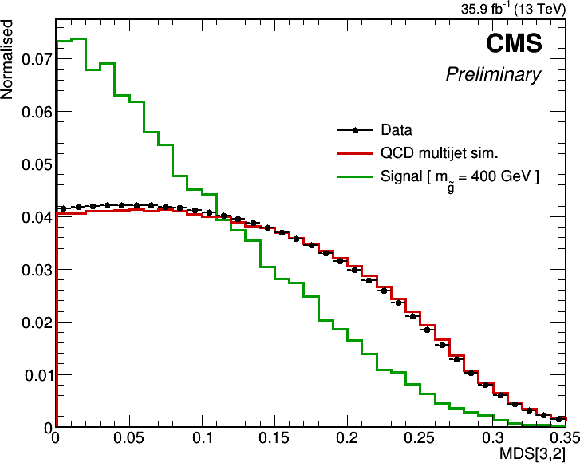
On left, MDS[(6,3)+(3,2)] as described in Eq. xxxxx, for signal (RPV gluino of mass 400 GeV) and QCD triplets. On right, MDS[3,2] variable as described in Eq. 2 for signal (RPV gluino of mass 400 GeV) and QCD triplets. The distributions are made after nominal selection criteria. |
png |
Figure 2-a:
On left, MDS[(6,3)+(3,2)] as described in Eq. xxxxx, for signal (RPV gluino of mass 400 GeV) and QCD triplets. On right, MDS[3,2] variable as described in Eq. 2 for signal (RPV gluino of mass 400 GeV) and QCD triplets. The distributions are made after nominal selection criteria. |
png |
Figure 2-b:
On left, MDS[(6,3)+(3,2)] as described in Eq. xxxxx, for signal (RPV gluino of mass 400 GeV) and QCD triplets. On right, MDS[3,2] variable as described in Eq. 2 for signal (RPV gluino of mass 400 GeV) and QCD triplets. The distributions are made after nominal selection criteria. |

png pdf |
Figure 3:
The triplet invariant mass versus the triplet scalar ${p_{\mathrm {T}}}$ for a gluino of mass 400 GeV decaying to jets. The filled color represents correctly reconstructed signal triplets, while the contour lines and gray scatter points represent wrongly combined triplets. The red line illustrates the $\Delta $ cut; triplets to the right of the line pass the selection criterion. |

png pdf |
Figure 4:
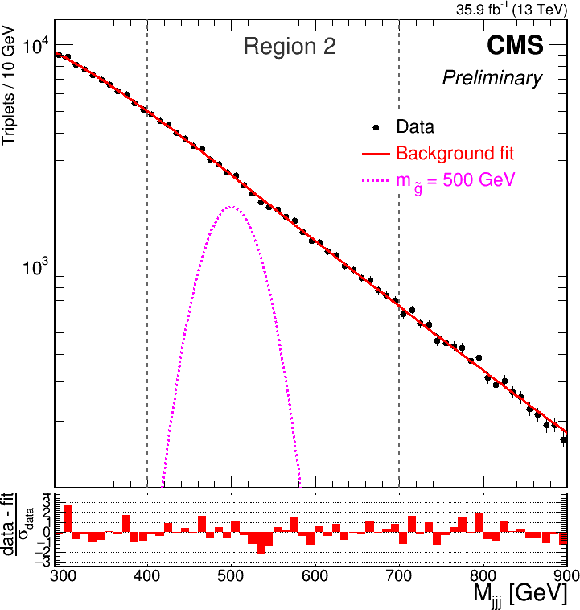
Mass distributions and background-only fits for the first two mass regions. Region 1 (left) is fit to the blackbody-like function described in Eq. 7 as well as ${{\mathrm {t}\overline {\mathrm {t}}}}$ simulation, while the Region 2 (right) are fit to the four parameter function from Eq. 8. The vertical gray lines indicate the mass regions. The gluino signal normalized to the cross section expected from [29] is shown in orange. |

png |
Figure 4-a:
Mass distributions and background-only fits for the first two mass regions. Region 1 (left) is fit to the blackbody-like function described in Eq. 7 as well as ${{\mathrm {t}\overline {\mathrm {t}}}}$ simulation, while the Region 2 (right) are fit to the four parameter function from Eq. 8. The vertical gray lines indicate the mass regions. The gluino signal normalized to the cross section expected from [29] is shown in orange. |
png |
Figure 4-b:
Mass distributions and background-only fits for the first two mass regions. Region 1 (left) is fit to the blackbody-like function described in Eq. 7 as well as ${{\mathrm {t}\overline {\mathrm {t}}}}$ simulation, while the Region 2 (right) are fit to the four parameter function from Eq. 8. The vertical gray lines indicate the mass regions. The gluino signal normalized to the cross section expected from [29] is shown in orange. |
png pdf |
Figure 5:
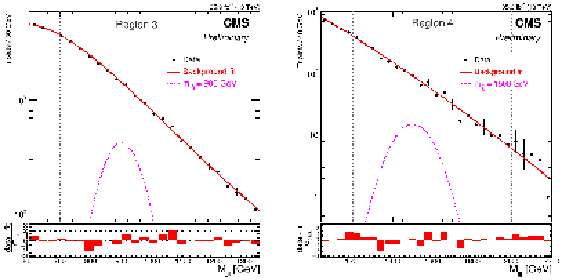
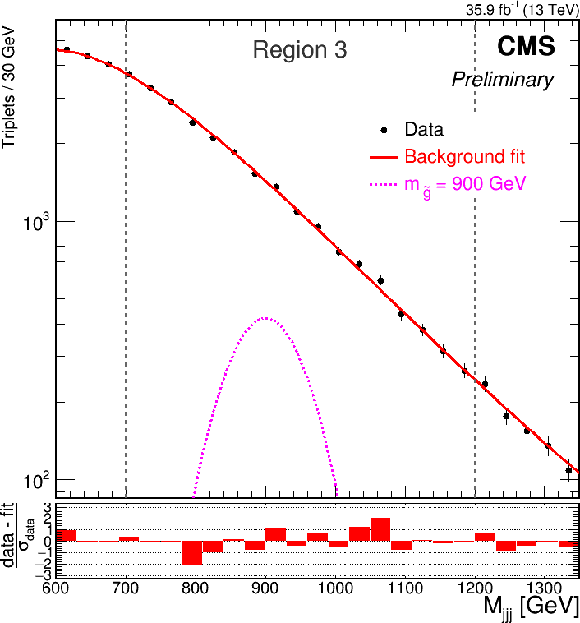
Mass distributions and background-only fits for the last two mass regions. Region 3 (left) is fit to the four parameter function from Eq. 8, while the Region 4 (right) is fit to three parameter function from Eq 8 with $p_3=$ 0. The vertical gray lines indicate the mass regions. The gluino signal normalized to the cross section expected from [29] is shown in orange. |
png |
Figure 5-a:
Mass distributions and background-only fits for the last two mass regions. Region 3 (left) is fit to the four parameter function from Eq. 8, while the Region 4 (right) is fit to three parameter function from Eq 8 with $p_3=$ 0. The vertical gray lines indicate the mass regions. The gluino signal normalized to the cross section expected from [29] is shown in orange. |

png |
Figure 5-b:
Mass distributions and background-only fits for the last two mass regions. Region 3 (left) is fit to the four parameter function from Eq. 8, while the Region 4 (right) is fit to three parameter function from Eq 8 with $p_3=$ 0. The vertical gray lines indicate the mass regions. The gluino signal normalized to the cross section expected from [29] is shown in orange. |

png pdf |
Figure 6:
Observed and expected frequentist CLs cross section limits are calculated in the asymptotic approximation. The solid red line shows the predictions for the gluino pair productions from [29]. The band around theory curve describes the uncertainties from parton distribution function and scale choices. The gray vertical lines indicate the boundaries between the mass regions. |
| Tables | |

png pdf |
Table caption text:
|
png pdf |
Table 2:
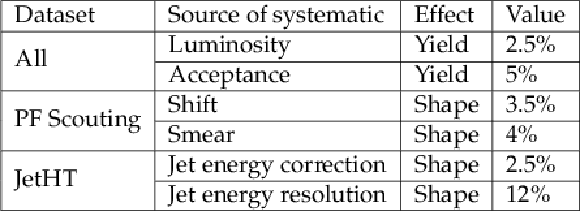
Summary of the systematic uncertainties. For the shape uncertainties, the value represents the percentage difference in the nominal value of the systematic uncertainty. These systematic uncertainties are applied to the signal. |
| Summary |
| We have performed an inclusive search for pair-produced three jet resonances. The proton-proton collision data used for this analysis was collected with the CMS detector in 2016 with a center of mass energy of $\sqrt{s}=$ 13 TeV, corresponding to an integrated luminosity of 35.9 fb$^{-1}$. We explore the mass range from 200 GeV to 2000 GeV in four separate mass regions. Our observations show agreement with standard model expectations. The result is interpreted within the framework of RPV SUSY, where pair-produced gluinos decay to a six quark final state. We exclude gluino masses below 1500 GeV at 95% confidence level. Analysis based on data with multijet events reconstructed at the trigger level allowed us extend our reach to masses as low as 200 GeV. Improved analysis techniques led to enhanced sensitivity and allowed us to set the most stringent limits on RPV gluino pair production. |
| References | ||||
| 1 | E. Farhi and L. Susskind | Grand unified theory with heavy color | PRD 20 (1979) 3404 | |
| 2 | W. Marciano | Exotic new quarks and dynamical symmetry breaking | PRD 21 (1980) 2425 | |
| 3 | P. Frampton and S. L. Glashow | Unifiable chiral color with natural glashow-iliopoulos-maiani mechanism | PRL 58 (1987) 2168 | |
| 4 | P. Frampton and S. L. Glashow | Chiral color: An alternative to the standard model | PLB 190 (1987) 157 | |
| 5 | R. Chivukula, M. Golden, and E. Simmons | Six jet signals of highly colored fermions | PLB 257 (1991) 403 | |
| 6 | R. Chivukula, M. Golden, and E. Simmons | Multi-jet physics at hadron colliders | NPB 363 (1991) 83 | |
| 7 | R. Essig | PhD thesis | ||
| 8 | CDF Collaboration | First Search for Multijet Resonances in $ \sqrt{s} = 1.96 TeV p\bar{p} $ Collisions | PRL 107 (2011) 042001 | 1105.2815 |
| 9 | CMS Collaboration | Search for three-jet resonances in pp collisions at $ \sqrt{s}= $ 7 TeV | PLB 718 (2012) 329--347 | CMS-EXO-11-060 1208.2931 |
| 10 | CMS Collaboration | Searches for light- and heavy-flavour three-jet resonances in pp collisions at $ \sqrt{s} = $ 8 TeV | PLB730 (2014) 193--214 | CMS-EXO-12-049 1311.1799 |
| 11 | ATLAS Collaboration | Search for pair production of massive particles decaying into three quarks with the ATLAS detector in $ \sqrt{s}=7 TeV pp $ collisions at the LHC | JHEP 12 (2012) 086 | 1210.4813 |
| 12 | ATLAS Collaboration | Search for massive supersymmetric particles decaying to many jets using the ATLAS detector in $ pp $ collisions at $ \sqrt{s} = $ 8 TeV | PRD91 (2015), no. 11, 112016 | 1502.05686 |
| 13 | CMS Collaboration | Cms luminosity based on pixel cluster counting - summer 2012 update | CDS | |
| 14 | CMS Collaboration | The CMS experiment at the CERN LHC | JINST 3 (2008) S08004 | CMS-00-001 |
| 15 | CMS Collaboration | Particle-flow reconstruction and global event description with the cms detector | JINST 12 (2017) P10003 | CMS-PRF-14-001 1706.04965 |
| 16 | M. Cacciari, G. P. Salam, and G. Soyez | The anti-$ k_t $ jet clustering algorithm | JHEP 04 (2008) 063 | 0802.1189 |
| 17 | M. Cacciari, G. P. Salam, and G. Soyez | FastJet user manual | EPJC 72 (2012) 1896 | 1111.6097 |
| 18 | CMS Collaboration | The CMS trigger system | JINST 12 (2017) P01020 | CMS-TRG-12-001 1609.02366 |
| 19 | J. Alwall et al. | MadGraph/MadEvent v4: The new web generation | JHEP 09 (2007) 028 | 0706.2334 |
| 20 | T. Sjöstrand et al. | An Introduction to PYTHIA 8.2 | CPC 191 (2015) 159--177 | 1410.3012 |
| 21 | GEANT 4 Collaboration | Geant4 -- a simulation toolkit | NIMA 506 (2003) 250 | |
| 22 | CMS Collaboration | Tracking and primary vertex results in first 7 TeV collisions | CDS | |
| 23 | CMS Collaboration | Search for three-jet resonances in pp collisions at $ \sqrt{s}= $ 7 TeV | PRL 107 (2011) 101801 | CMS-EXO-11-001 1107.3084 |
| 24 | R. H. Dalitz | Decay of tau mesons of known charge | PR94 (1954) 1046--1051 | |
| 25 | S. Alioli, S.-O. Moch, and P. Uwer | Hadronic top-quark pair-production with one jet and parton showering | JHEP 01 (2012) 137 | 1110.5251 |
| 26 | P. Nason | A New method for combining NLO QCD with shower Monte Carlo algorithms | JHEP 11 (2004) 040 | hep-ph/0409146 |
| 27 | S. Frixione, P. Nason, and C. Oleari | Matching NLO QCD computations with Parton Shower simulations: the POWHEG method | JHEP 11 (2007) 070 | 0709.2092 |
| 28 | S. Alioli, P. Nason, C. Oleari, and E. Re | A general framework for implementing NLO calculations in shower Monte Carlo programs: the POWHEG BOX | JHEP 06 (2010) 043 | 1002.2581 |
| 29 | C. Borschensky et al. | Squark and gluino production cross sections in pp collisions at $ \sqrt{s} = $ 13, 14, 33 and 100 TeV | EPJC74 (2014), no. 12 | 1407.5066 |
| 30 | T. Junk | Confidence level computation for combining searches with small statistics | NIMA 434 (1999) 435 | hep-ex/9902006 |
| 31 | A. L. Read | Presentation of search results: the $ CL_{S} $ technique | JPG 28 (2002) 2693 | |
| 32 | G. Cowan, K. Cranmer, E. Gross, and O. Vitells | Asymptotic formulae for likelihood-based tests of new physics | EPJC 71 (2011), no. 2, 1--19 | |
| 33 | L. Moneta et al. | The RooStats Project | in 13$^\textth$ International Workshop on Advanced Computing and Analysis Techniques in Physics Research (ACAT2010) SISSA, 2010 PoS(ACAT2010)057 | 1009.1003 |

|
Compact Muon Solenoid LHC, CERN |

|

|

|

|

|

|