

Compact Muon Solenoid
LHC, CERN
| CMS-PAS-EXO-17-009 | ||
| Search for pair production of first generation scalar leptoquarks at $\sqrt{s}= $ 13 TeV | ||
| CMS Collaboration | ||
| July 2018 | ||
| Abstract: A search for the pair production of first generation scalar leptoquarks is performed using proton-proton collision data recorded at 13 TeV center-of-mass energy with the CMS detector at the CERN LHC. The data correspond to an integrated luminosity of 35.9 fb$^{-1}$. The leptoquarks are assumed to decay to either an electron or a neutrino and a quark with branching fraction $\beta$ and $ 1-\beta $, respectively. The final states arising from these decays comprise two electrons, or one electron and large missing transverse momentum, and two quarks that are detected as hadronic jets. First generation scalar leptoquarks with masses below 1435 (1180) TeV are excluded for $\beta = $ 1.0 (0.5). These are the most stringent limits on the production of first generation scalar leptoquarks to date. The data are also interpreted to set exclusion limits in the context of a long-lived R-parity violating supersymmetry model having equivalent final states. | ||
|
Links:
CDS record (PDF) ;
inSPIRE record ;
CADI line (restricted) ;
These preliminary results are superseded in this paper, PRD 99 (2019) 052002. The superseded preliminary plots can be found here. |
||
| Figures | |
png pdf |
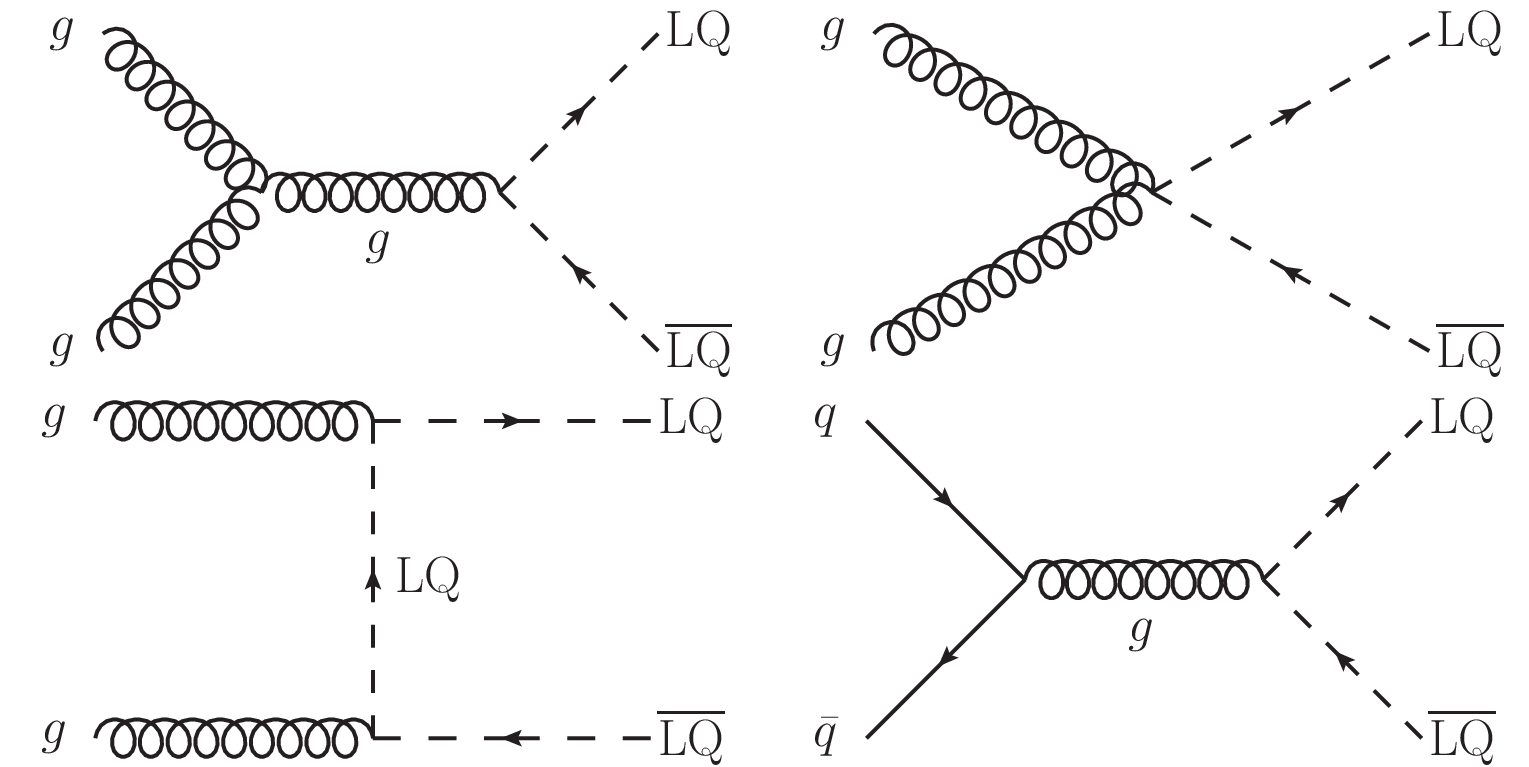
Figure 1:
Feynman diagrams for the dominant scalar leptoquark pair production channels at the LHC. |
png pdf |
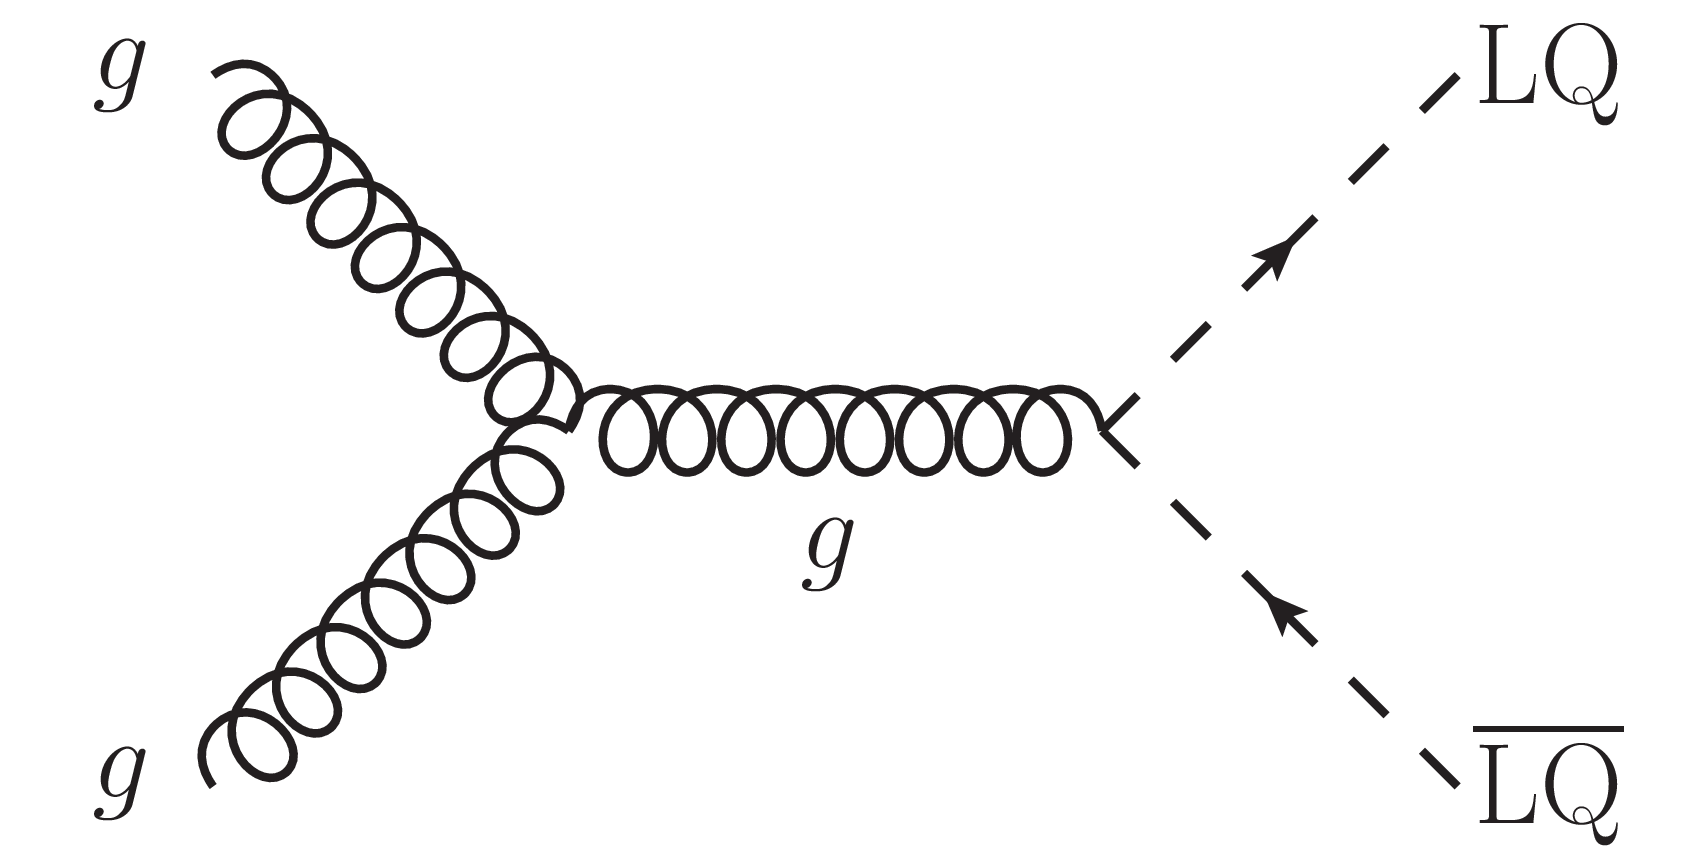
Figure 1-a:
Feynman diagrams for the dominant scalar leptoquark pair production channels at the LHC. |
png pdf |
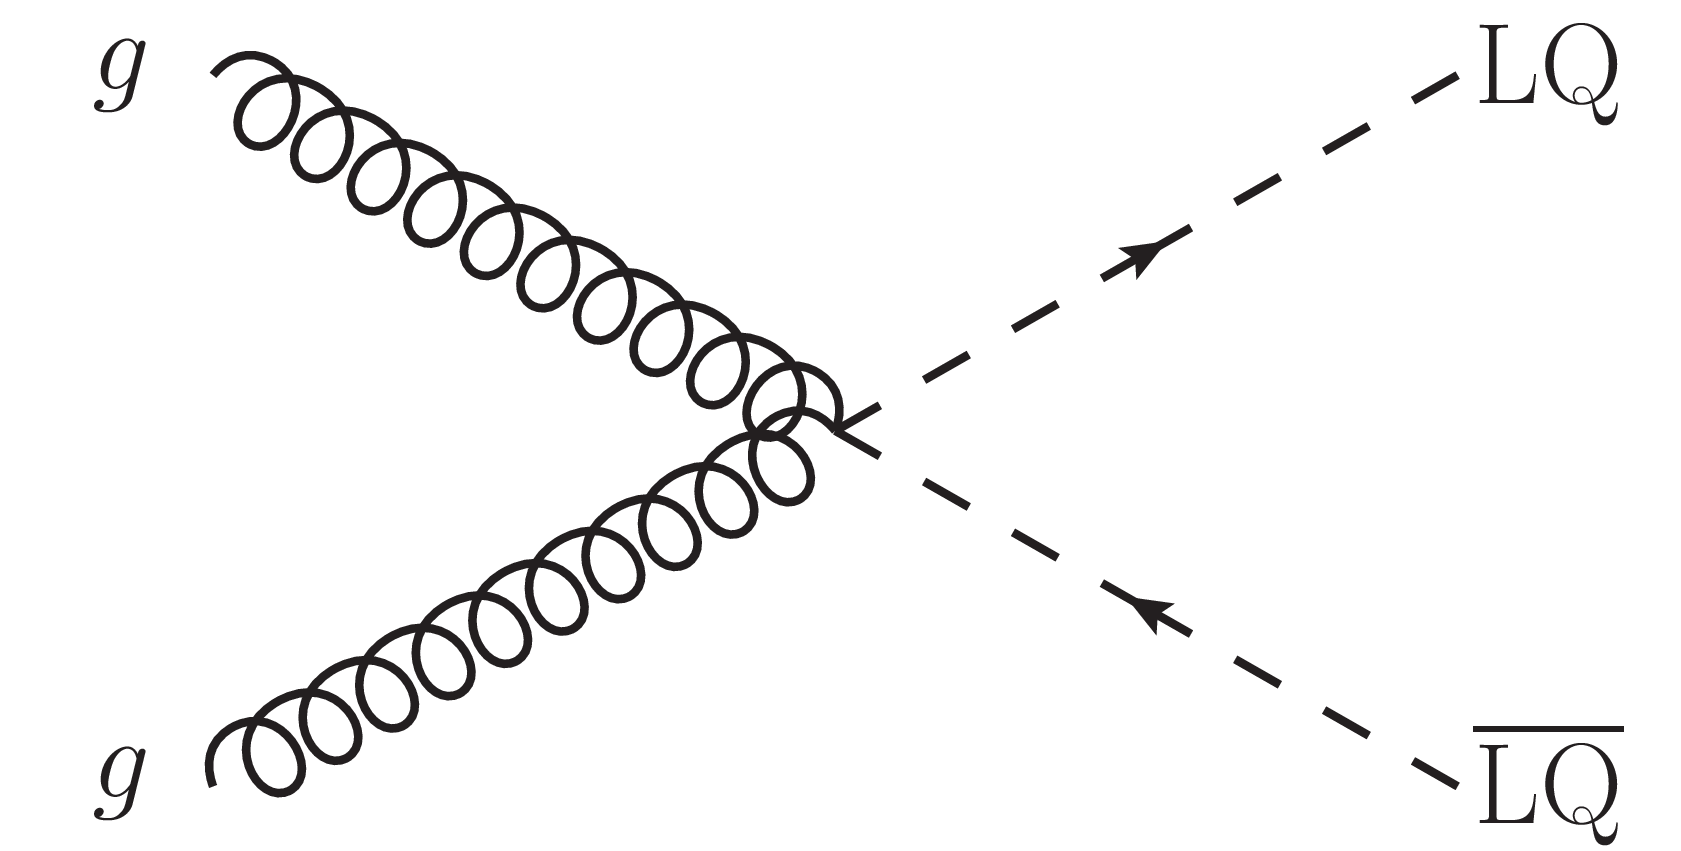
Figure 1-b:
Feynman diagrams for the dominant scalar leptoquark pair production channels at the LHC. |
png pdf |
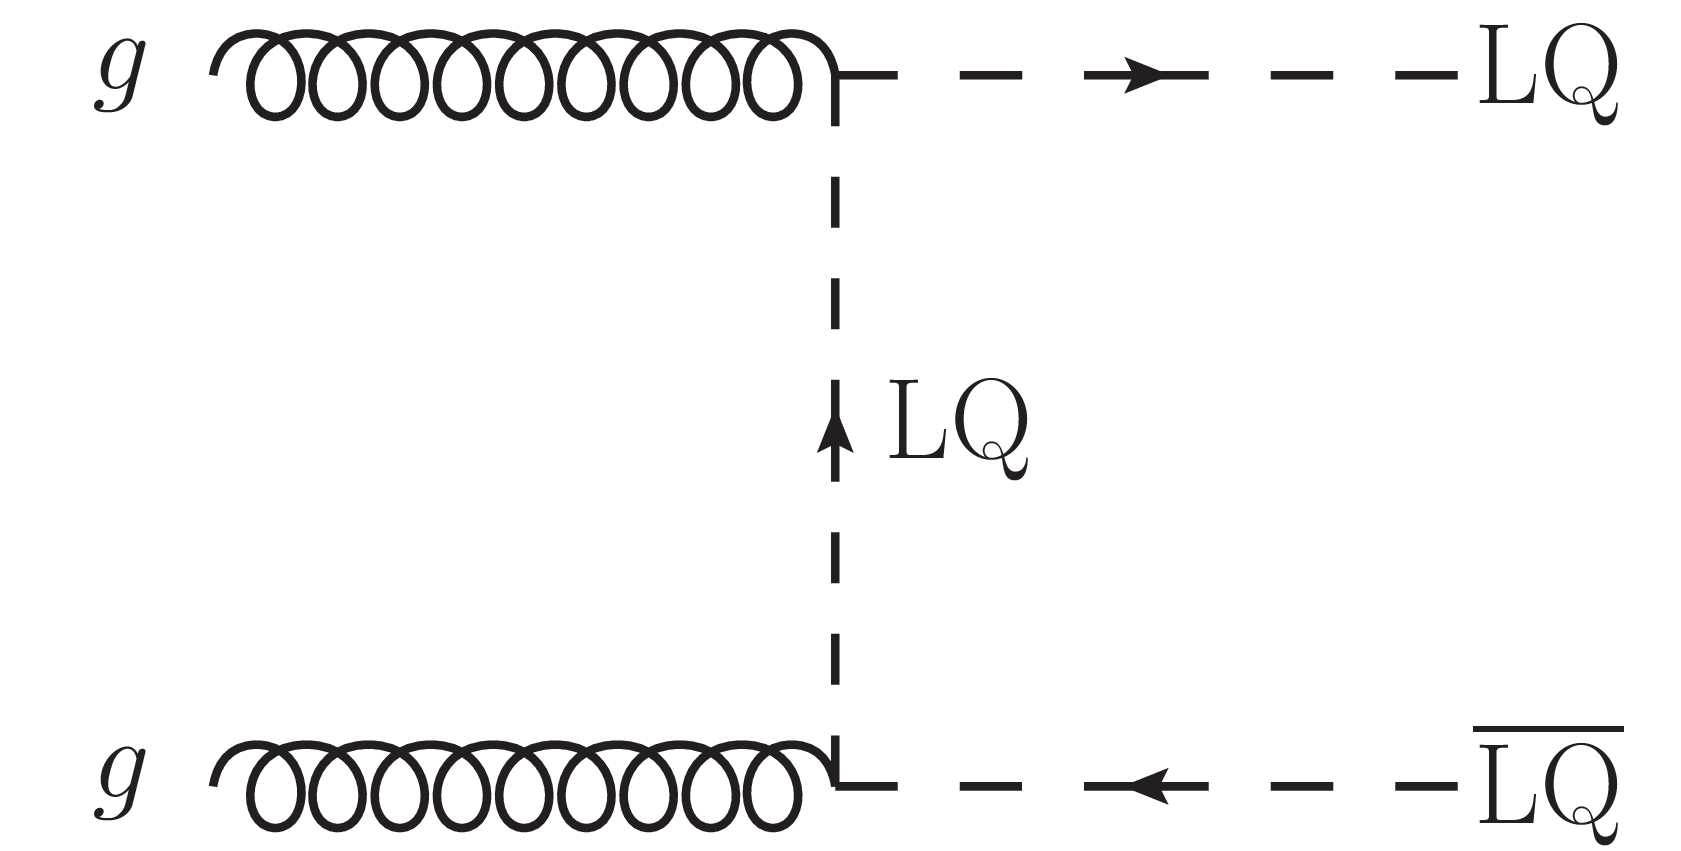
Figure 1-c:
Feynman diagrams for the dominant scalar leptoquark pair production channels at the LHC. |
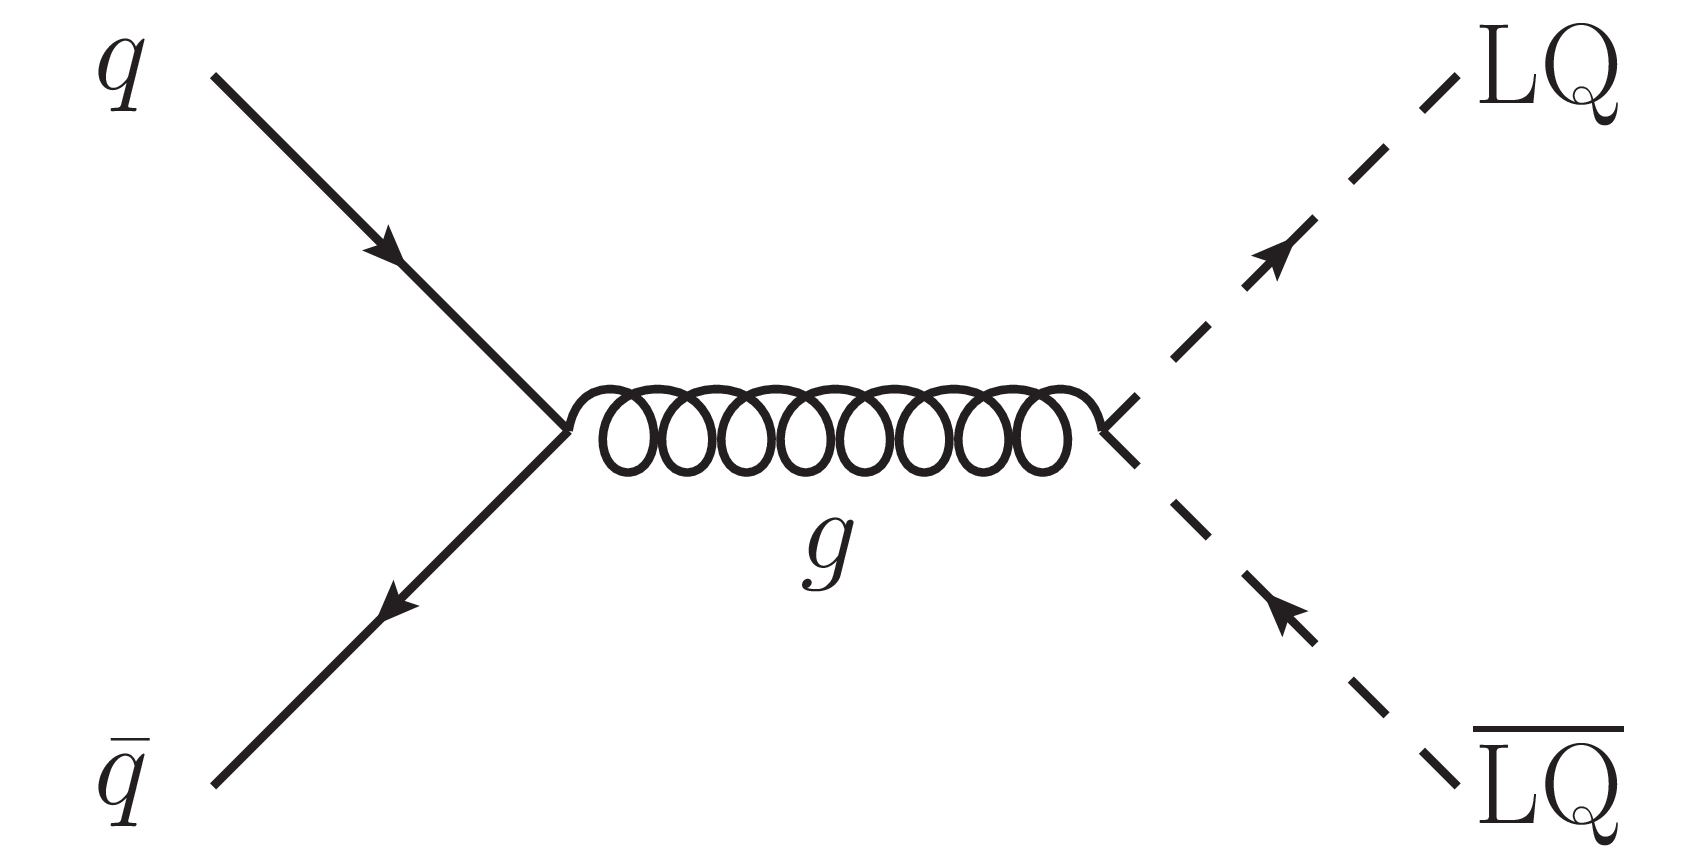
png pdf |
Figure 1-d:
Feynman diagrams for the dominant scalar leptoquark pair production channels at the LHC. |
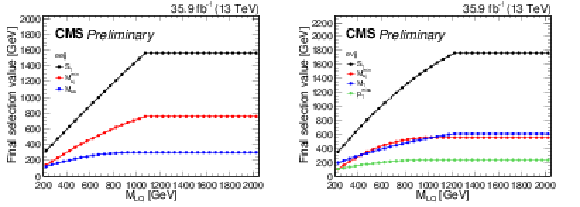
png pdf |
Figure 2:
Final selection thresholds for the $ {{\mathrm {e}} {\mathrm {e}}\text {jj}} $ (left) and $ {{\mathrm {e}} {\nu}\text {jj}} $ (right) channels as a function of LQ mass. |
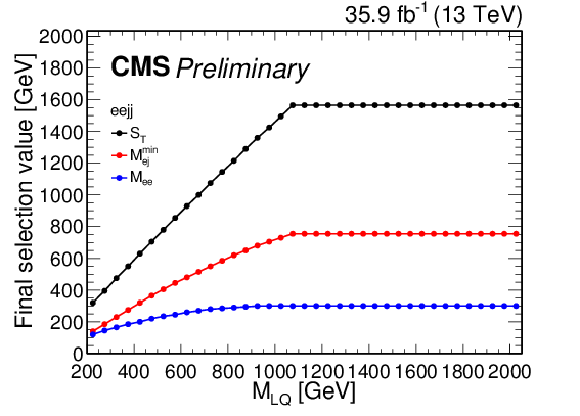
png pdf |
Figure 2-a:
Final selection thresholds for the $ {{\mathrm {e}} {\mathrm {e}}\text {jj}} $ (left) and $ {{\mathrm {e}} {\nu}\text {jj}} $ (right) channels as a function of LQ mass. |
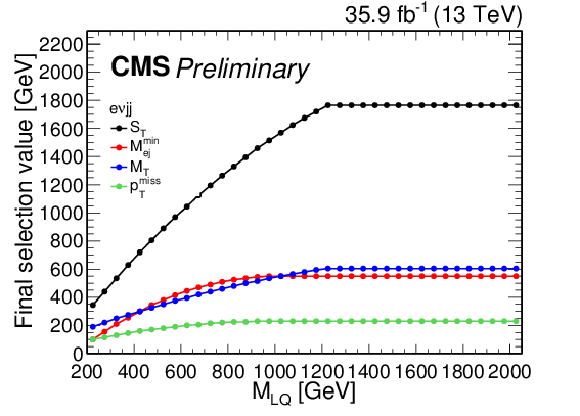
png pdf |
Figure 2-b:
Final selection thresholds for the $ {{\mathrm {e}} {\mathrm {e}}\text {jj}} $ (left) and $ {{\mathrm {e}} {\nu}\text {jj}} $ (right) channels as a function of LQ mass. |
png pdf |
Figure 3:
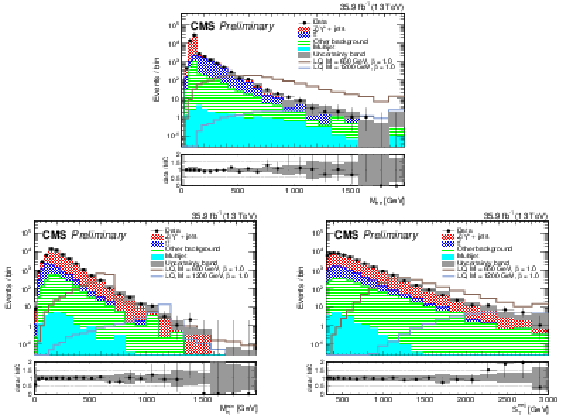
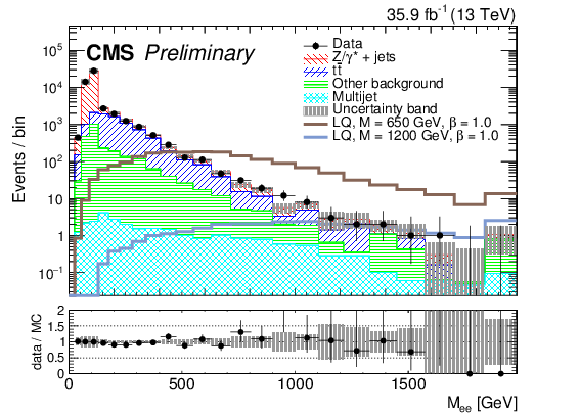
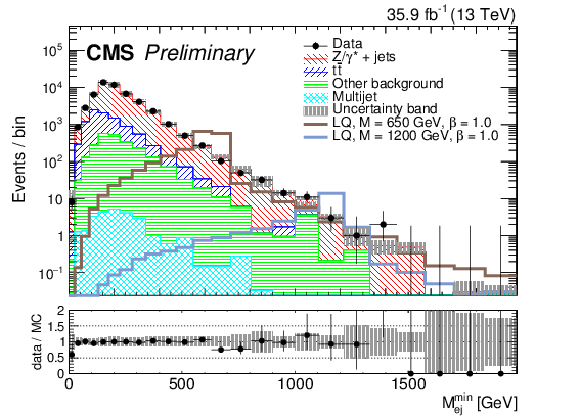
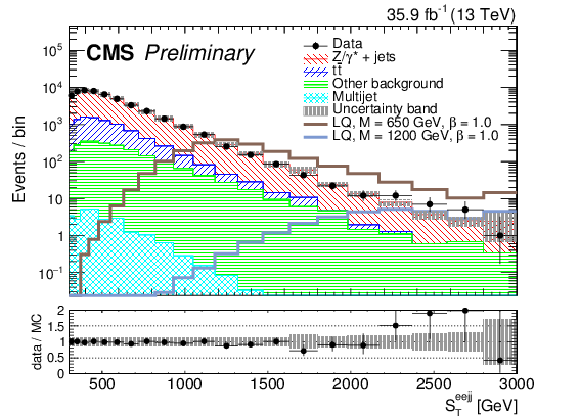
Data and background comparison for events passing initial selection requirements for the ${{\mathrm {e}} {\mathrm {e}}\text {jj}}$ channel, shown for the variables used for final selection optimization: ${\text M_{{\mathrm {e}} {\mathrm {e}}}}$ (top), ${{\text M}_{{\mathrm {e}}\text {j}}^\mathrm {min}}$ (bottom left), and ${{\text S}_{\mathrm {T}}}$ (bottom right). The last bin includes all events beyond the upper x-axis boundary. |
png pdf |
Figure 3-a:
Data and background comparison for events passing initial selection requirements for the ${{\mathrm {e}} {\mathrm {e}}\text {jj}}$ channel, shown for the variables used for final selection optimization: ${\text M_{{\mathrm {e}} {\mathrm {e}}}}$ (top), ${{\text M}_{{\mathrm {e}}\text {j}}^\mathrm {min}}$ (bottom left), and ${{\text S}_{\mathrm {T}}}$ (bottom right). The last bin includes all events beyond the upper x-axis boundary. |
png pdf |
Figure 3-b:
Data and background comparison for events passing initial selection requirements for the ${{\mathrm {e}} {\mathrm {e}}\text {jj}}$ channel, shown for the variables used for final selection optimization: ${\text M_{{\mathrm {e}} {\mathrm {e}}}}$ (top), ${{\text M}_{{\mathrm {e}}\text {j}}^\mathrm {min}}$ (bottom left), and ${{\text S}_{\mathrm {T}}}$ (bottom right). The last bin includes all events beyond the upper x-axis boundary. |
png pdf |
Figure 3-c:
Data and background comparison for events passing initial selection requirements for the ${{\mathrm {e}} {\mathrm {e}}\text {jj}}$ channel, shown for the variables used for final selection optimization: ${\text M_{{\mathrm {e}} {\mathrm {e}}}}$ (top), ${{\text M}_{{\mathrm {e}}\text {j}}^\mathrm {min}}$ (bottom left), and ${{\text S}_{\mathrm {T}}}$ (bottom right). The last bin includes all events beyond the upper x-axis boundary. |
png pdf |
Figure 4:
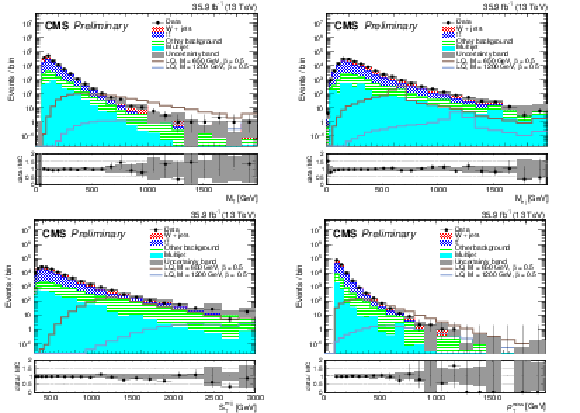
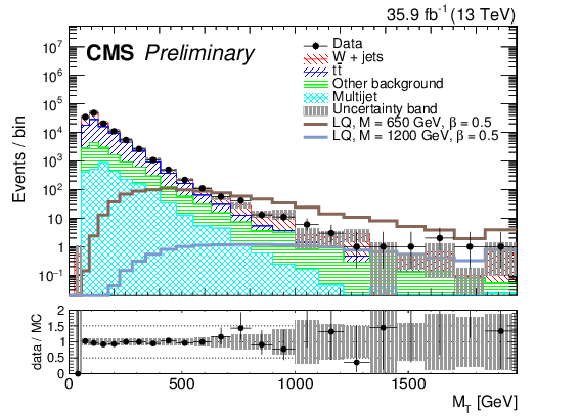
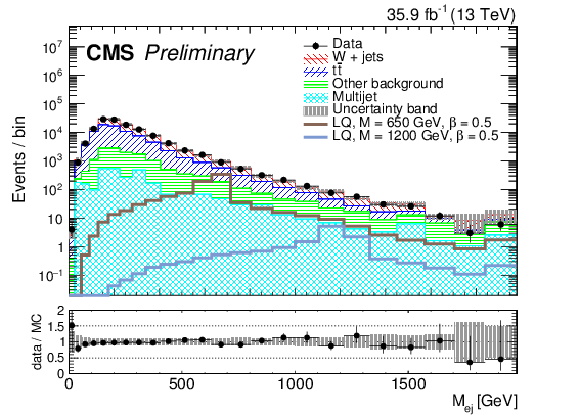
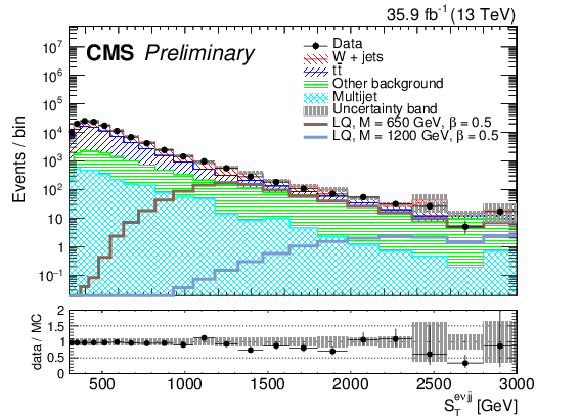
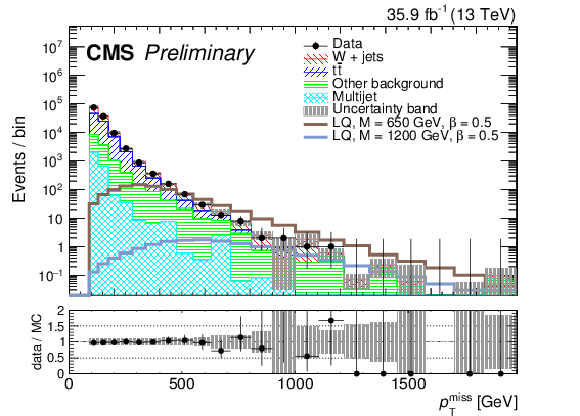
Data and background for events passing initial selection requirements in the ${{\mathrm {e}} {\nu}\text {jj}}$ channel, shown for the variables used for final selection optimization: ${{\text M}_{\mathrm {T}}}$ (top right), ${{\text M}_{{\mathrm {e}}\text {j}}}$ (top left), ${{\text S}_{\mathrm {T}}}$ (bottom left), and ${{p_{\mathrm {T}}} ^\text {miss}}$ (bottom right). The last bin includes all events beyond the upper x-axis boundary. |
png pdf |
Figure 4-a:
Data and background for events passing initial selection requirements in the ${{\mathrm {e}} {\nu}\text {jj}}$ channel, shown for the variables used for final selection optimization: ${{\text M}_{\mathrm {T}}}$ (top right), ${{\text M}_{{\mathrm {e}}\text {j}}}$ (top left), ${{\text S}_{\mathrm {T}}}$ (bottom left), and ${{p_{\mathrm {T}}} ^\text {miss}}$ (bottom right). The last bin includes all events beyond the upper x-axis boundary. |
png pdf |
Figure 4-b:
Data and background for events passing initial selection requirements in the ${{\mathrm {e}} {\nu}\text {jj}}$ channel, shown for the variables used for final selection optimization: ${{\text M}_{\mathrm {T}}}$ (top right), ${{\text M}_{{\mathrm {e}}\text {j}}}$ (top left), ${{\text S}_{\mathrm {T}}}$ (bottom left), and ${{p_{\mathrm {T}}} ^\text {miss}}$ (bottom right). The last bin includes all events beyond the upper x-axis boundary. |
png pdf |
Figure 4-c:
Data and background for events passing initial selection requirements in the ${{\mathrm {e}} {\nu}\text {jj}}$ channel, shown for the variables used for final selection optimization: ${{\text M}_{\mathrm {T}}}$ (top right), ${{\text M}_{{\mathrm {e}}\text {j}}}$ (top left), ${{\text S}_{\mathrm {T}}}$ (bottom left), and ${{p_{\mathrm {T}}} ^\text {miss}}$ (bottom right). The last bin includes all events beyond the upper x-axis boundary. |
png pdf |
Figure 4-d:
Data and background for events passing initial selection requirements in the ${{\mathrm {e}} {\nu}\text {jj}}$ channel, shown for the variables used for final selection optimization: ${{\text M}_{\mathrm {T}}}$ (top right), ${{\text M}_{{\mathrm {e}}\text {j}}}$ (top left), ${{\text S}_{\mathrm {T}}}$ (bottom left), and ${{p_{\mathrm {T}}} ^\text {miss}}$ (bottom right). The last bin includes all events beyond the upper x-axis boundary. |
png pdf |
Figure 5:
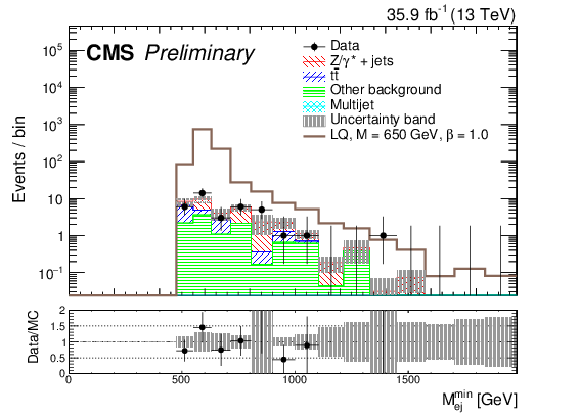
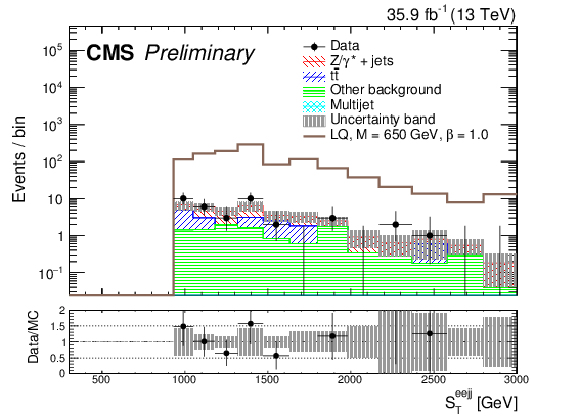
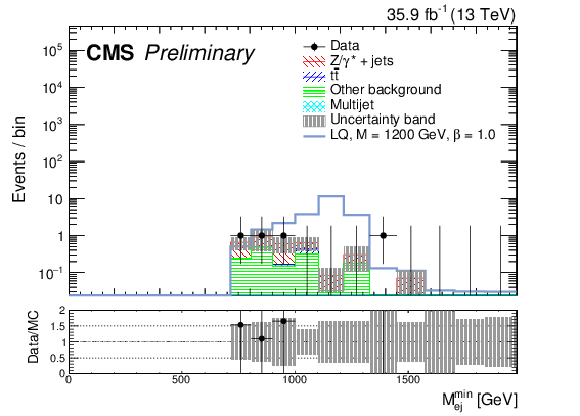
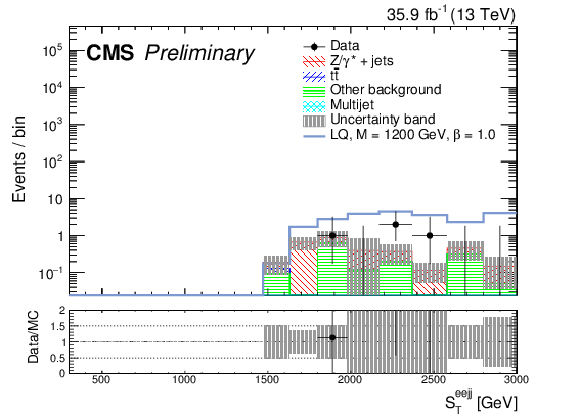
The ${{\text M}_{{\mathrm {e}}\text {j}}^\mathrm {min}}$ (left) and ${{\text S}_{\mathrm {T}}}$ (right) distributions for events passing the $ {{\mathrm {e}} {\mathrm {e}}\text {jj}} $ final selection for leptoquarks of mass 650 GeV (top) and 1200 GeV (bottom). The predicted signal model distributions are shown, along with major backgrounds, and "other background'' which consists of the sum of the W+jets, diboson, single top quark, and photon+jets contributions. The dark shaded region indicates the statistical and systematic uncertainty on the total predicted background. The last bin includes all events beyond the upper x-axis boundary. |
png pdf |
Figure 5-a:
The ${{\text M}_{{\mathrm {e}}\text {j}}^\mathrm {min}}$ (left) and ${{\text S}_{\mathrm {T}}}$ (right) distributions for events passing the $ {{\mathrm {e}} {\mathrm {e}}\text {jj}} $ final selection for leptoquarks of mass 650 GeV (top) and 1200 GeV (bottom). The predicted signal model distributions are shown, along with major backgrounds, and "other background'' which consists of the sum of the W+jets, diboson, single top quark, and photon+jets contributions. The dark shaded region indicates the statistical and systematic uncertainty on the total predicted background. The last bin includes all events beyond the upper x-axis boundary. |
png pdf |
Figure 5-b:
The ${{\text M}_{{\mathrm {e}}\text {j}}^\mathrm {min}}$ (left) and ${{\text S}_{\mathrm {T}}}$ (right) distributions for events passing the $ {{\mathrm {e}} {\mathrm {e}}\text {jj}} $ final selection for leptoquarks of mass 650 GeV (top) and 1200 GeV (bottom). The predicted signal model distributions are shown, along with major backgrounds, and "other background'' which consists of the sum of the W+jets, diboson, single top quark, and photon+jets contributions. The dark shaded region indicates the statistical and systematic uncertainty on the total predicted background. The last bin includes all events beyond the upper x-axis boundary. |
png pdf |
Figure 5-c:
The ${{\text M}_{{\mathrm {e}}\text {j}}^\mathrm {min}}$ (left) and ${{\text S}_{\mathrm {T}}}$ (right) distributions for events passing the $ {{\mathrm {e}} {\mathrm {e}}\text {jj}} $ final selection for leptoquarks of mass 650 GeV (top) and 1200 GeV (bottom). The predicted signal model distributions are shown, along with major backgrounds, and "other background'' which consists of the sum of the W+jets, diboson, single top quark, and photon+jets contributions. The dark shaded region indicates the statistical and systematic uncertainty on the total predicted background. The last bin includes all events beyond the upper x-axis boundary. |
png pdf |
Figure 5-d:
The ${{\text M}_{{\mathrm {e}}\text {j}}^\mathrm {min}}$ (left) and ${{\text S}_{\mathrm {T}}}$ (right) distributions for events passing the $ {{\mathrm {e}} {\mathrm {e}}\text {jj}} $ final selection for leptoquarks of mass 650 GeV (top) and 1200 GeV (bottom). The predicted signal model distributions are shown, along with major backgrounds, and "other background'' which consists of the sum of the W+jets, diboson, single top quark, and photon+jets contributions. The dark shaded region indicates the statistical and systematic uncertainty on the total predicted background. The last bin includes all events beyond the upper x-axis boundary. |
png pdf |
Figure 6:
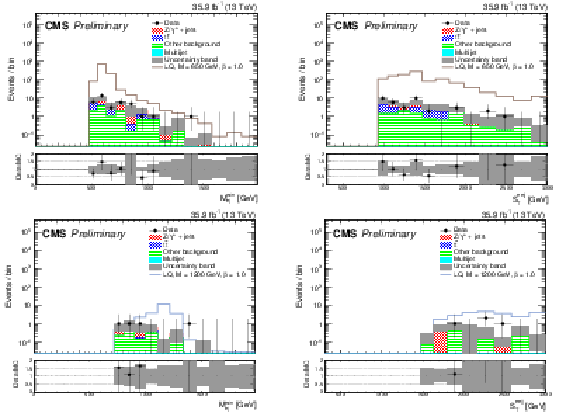
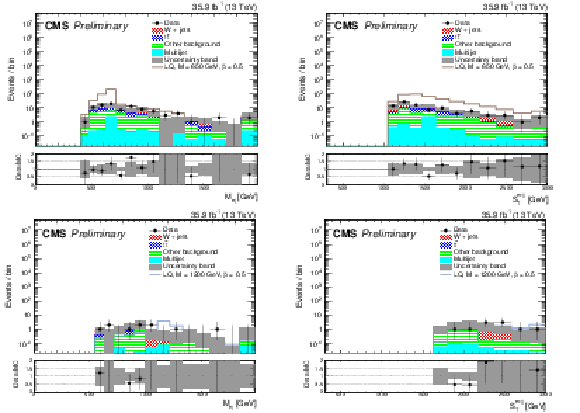
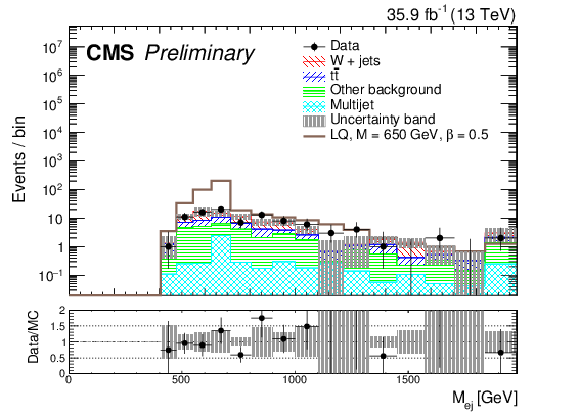
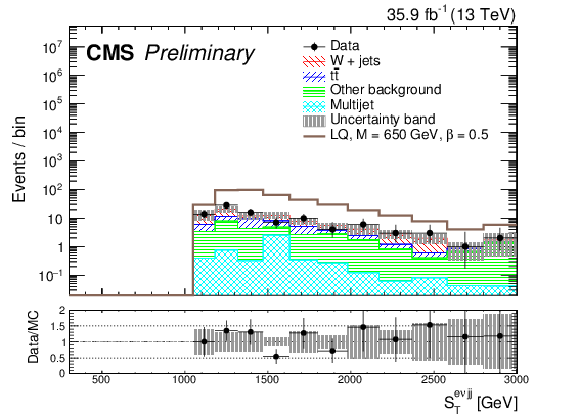
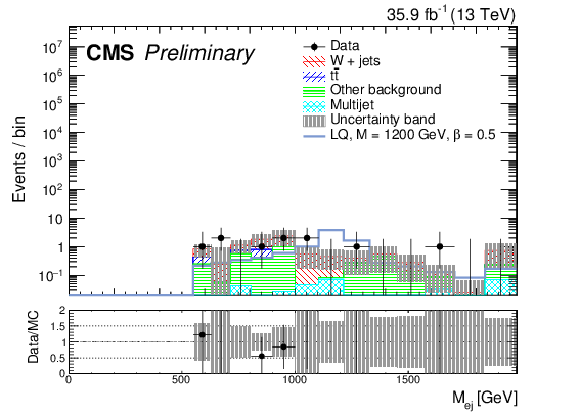
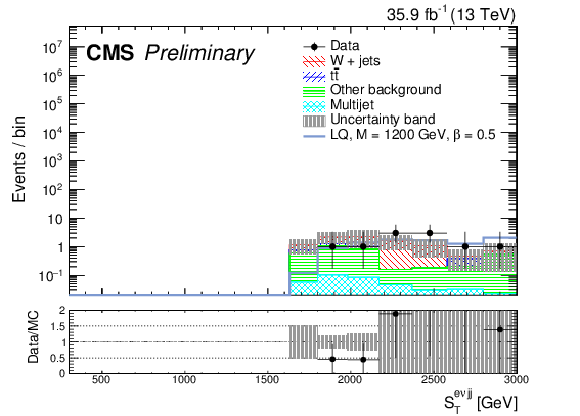
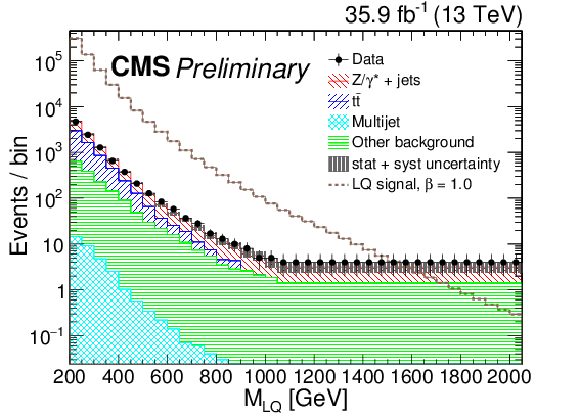
The ${{\text M}_{{\mathrm {e}}\text {j}}}$ (left), and ${{\text S}_{\mathrm {T}}}$ (right) distributions for events passing the $ {{\mathrm {e}} {\nu}\text {jj}} $ final selection for leptoquarks of mass 650 GeV (top) and 1200 GeV (bottom). The predicted signal model distributions are shown, along with major backgrounds, and "other background'' which consists of the sum of the Z/$\gamma$+jets, diboson, single top quark, and photon+jets backgrounds. The dark shaded region indicates the statistical and systematic uncertainty on the total predicted background. The last bin includes all events beyond the upper x-axis boundary. |
png pdf |
Figure 6-a:
The ${{\text M}_{{\mathrm {e}}\text {j}}}$ (left), and ${{\text S}_{\mathrm {T}}}$ (right) distributions for events passing the $ {{\mathrm {e}} {\nu}\text {jj}} $ final selection for leptoquarks of mass 650 GeV (top) and 1200 GeV (bottom). The predicted signal model distributions are shown, along with major backgrounds, and "other background'' which consists of the sum of the Z/$\gamma$+jets, diboson, single top quark, and photon+jets backgrounds. The dark shaded region indicates the statistical and systematic uncertainty on the total predicted background. The last bin includes all events beyond the upper x-axis boundary. |
png pdf |
Figure 6-b:
The ${{\text M}_{{\mathrm {e}}\text {j}}}$ (left), and ${{\text S}_{\mathrm {T}}}$ (right) distributions for events passing the $ {{\mathrm {e}} {\nu}\text {jj}} $ final selection for leptoquarks of mass 650 GeV (top) and 1200 GeV (bottom). The predicted signal model distributions are shown, along with major backgrounds, and "other background'' which consists of the sum of the Z/$\gamma$+jets, diboson, single top quark, and photon+jets backgrounds. The dark shaded region indicates the statistical and systematic uncertainty on the total predicted background. The last bin includes all events beyond the upper x-axis boundary. |
png pdf |
Figure 6-c:
The ${{\text M}_{{\mathrm {e}}\text {j}}}$ (left), and ${{\text S}_{\mathrm {T}}}$ (right) distributions for events passing the $ {{\mathrm {e}} {\nu}\text {jj}} $ final selection for leptoquarks of mass 650 GeV (top) and 1200 GeV (bottom). The predicted signal model distributions are shown, along with major backgrounds, and "other background'' which consists of the sum of the Z/$\gamma$+jets, diboson, single top quark, and photon+jets backgrounds. The dark shaded region indicates the statistical and systematic uncertainty on the total predicted background. The last bin includes all events beyond the upper x-axis boundary. |
png pdf |
Figure 6-d:
The ${{\text M}_{{\mathrm {e}}\text {j}}}$ (left), and ${{\text S}_{\mathrm {T}}}$ (right) distributions for events passing the $ {{\mathrm {e}} {\nu}\text {jj}} $ final selection for leptoquarks of mass 650 GeV (top) and 1200 GeV (bottom). The predicted signal model distributions are shown, along with major backgrounds, and "other background'' which consists of the sum of the Z/$\gamma$+jets, diboson, single top quark, and photon+jets backgrounds. The dark shaded region indicates the statistical and systematic uncertainty on the total predicted background. The last bin includes all events beyond the upper x-axis boundary. |
png pdf |
Figure 7:
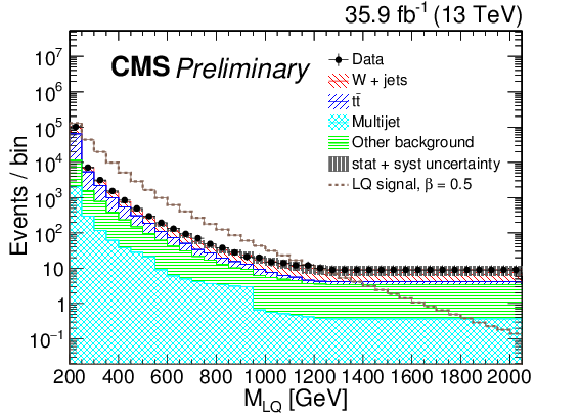
Data, background, and expected signal yields after applying the final $ {{\mathrm {e}} {\mathrm {e}}\text {jj}} $ selection criteria as a function of LQ mass. 'Other background' includes diboson, single top quark, and W+jets. The bins are correlated, because events selected for higher LQ searches are a subset of those selected for lower mass searches. |
png pdf |
Figure 8:
Data, background, and signal yields after applying the final $ {{\mathrm {e}} {\nu}\text {jj}} $ selection criteria as a function of LQ mass. 'Other background' includes diboson, single top quark, and Z/$\gamma$+jets. The bins are correlated, because events selected for higher LQ searches are a subset of those selected for lower mass searches. |
png pdf |
Figure 9:
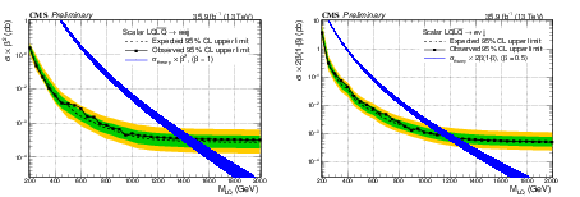
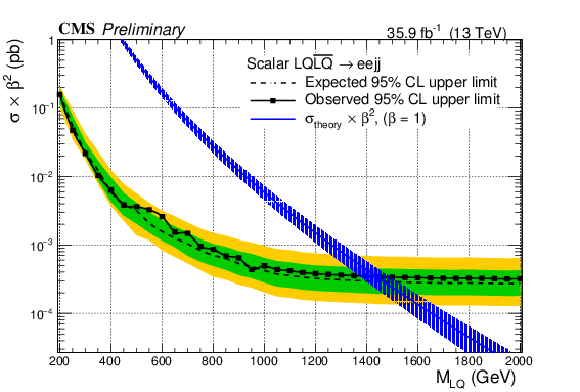
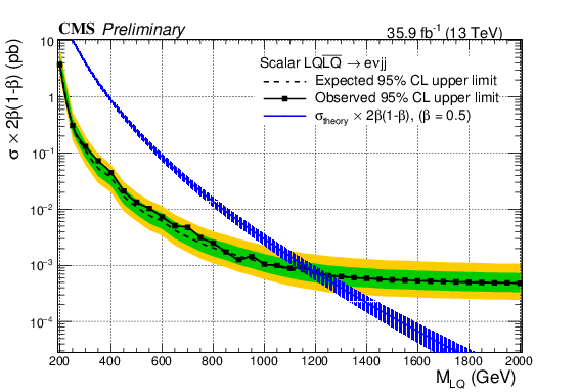
Observed upper limits for scalar leptoquark pair-production cross section times $\beta ^2$ (left plot) and $\beta (1-\beta)$ (right plot) at the 95% confidence level obtained with the $ {{\mathrm {e}} {\mathrm {e}}\text {jj}} $ (left plot) and $ {{\mathrm {e}} {\nu}\text {jj}} $ (right plot) analysis. The median (dashed line), 1$\sigma $ (inner band), and 2$\sigma $ (outer band) expected limits are also shown. |
png pdf |
Figure 9-a:
Observed upper limits for scalar leptoquark pair-production cross section times $\beta ^2$ (left plot) and $\beta (1-\beta)$ (right plot) at the 95% confidence level obtained with the $ {{\mathrm {e}} {\mathrm {e}}\text {jj}} $ (left plot) and $ {{\mathrm {e}} {\nu}\text {jj}} $ (right plot) analysis. The median (dashed line), 1$\sigma $ (inner band), and 2$\sigma $ (outer band) expected limits are also shown. |
png pdf |
Figure 9-b:
Observed upper limits for scalar leptoquark pair-production cross section times $\beta ^2$ (left plot) and $\beta (1-\beta)$ (right plot) at the 95% confidence level obtained with the $ {{\mathrm {e}} {\mathrm {e}}\text {jj}} $ (left plot) and $ {{\mathrm {e}} {\nu}\text {jj}} $ (right plot) analysis. The median (dashed line), 1$\sigma $ (inner band), and 2$\sigma $ (outer band) expected limits are also shown. |
png pdf |
Figure 10:
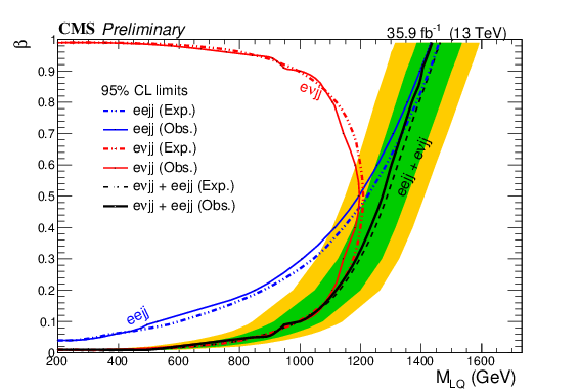
Expected and observed exclusion limits at 95% CL for pair production of first generation scalar leptoquarks shown in the $\beta $ versus $ {{\text M}_{\text {LQ}}} $ plane for the individual $ {{\mathrm {e}} {\mathrm {e}}\text {jj}} $ and $ {{\mathrm {e}} {\nu}\text {jj}} $ channels and their combination. The inner and outer uncertainty bands represent the 68% and 95% confidence intervals on the expected limits. |
png pdf |
Figure 11:
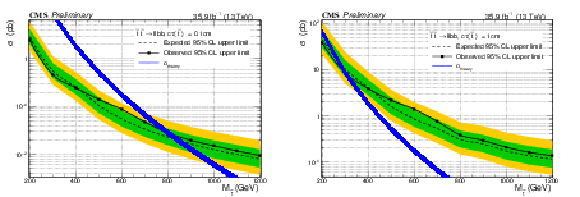
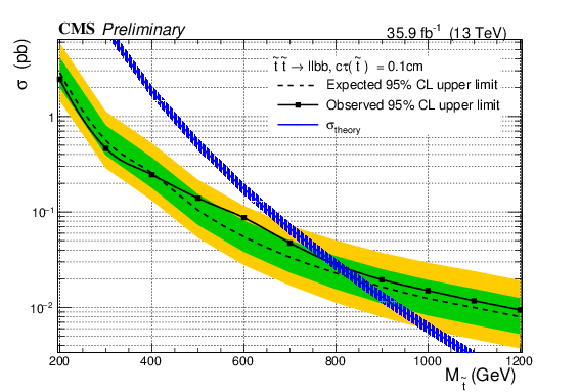
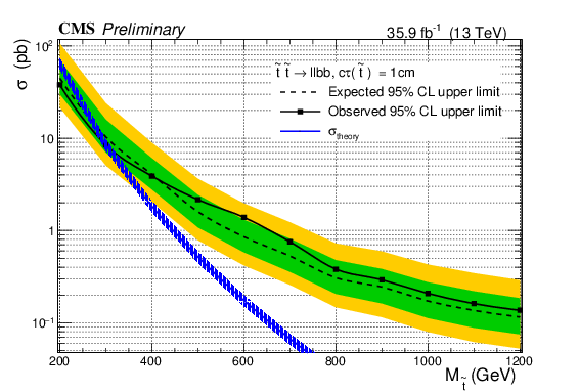
Expected and observed upper limits at 95% CL on the long-lived RPV SUSY $ \mathrm{ t \bar{t} } $ pair production cross section as a function of $ \mathrm{ t \bar{t} } $ mass for $c\tau =$ 0.1 cm (left) and 1 cm (right). The expected limits represent the median values while the uncertainty bands are the 68% and 95% confidence intervals. |
png pdf |
Figure 11-a:
Expected and observed upper limits at 95% CL on the long-lived RPV SUSY $ \mathrm{ t \bar{t} } $ pair production cross section as a function of $ \mathrm{ t \bar{t} } $ mass for $c\tau =$ 0.1 cm (left) and 1 cm (right). The expected limits represent the median values while the uncertainty bands are the 68% and 95% confidence intervals. |
png pdf |
Figure 11-b:
Expected and observed upper limits at 95% CL on the long-lived RPV SUSY $ \mathrm{ t \bar{t} } $ pair production cross section as a function of $ \mathrm{ t \bar{t} } $ mass for $c\tau =$ 0.1 cm (left) and 1 cm (right). The expected limits represent the median values while the uncertainty bands are the 68% and 95% confidence intervals. |
png pdf |
Figure 12:
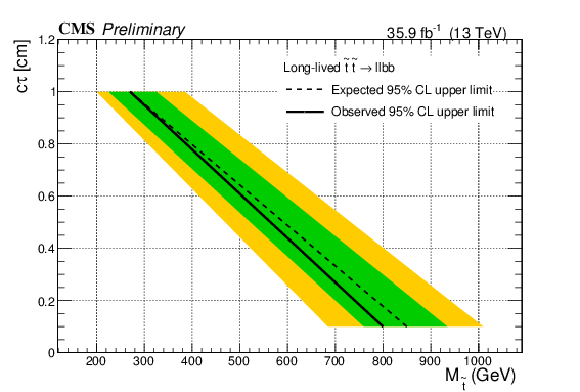
Expected and observed upper limits at 95% CL on the long-lived RPV SUSY $\tilde{ \mathrm{t} }$ pair production cross section as a function of $\tilde{ \mathrm{t} }$ mass (x-axis) and lifetime (y-axis). The expected limits and uncertainty bands represent the median expected limits and the 68% and 95% confidence intervals. |
| Tables | |
png pdf |
Table 1:
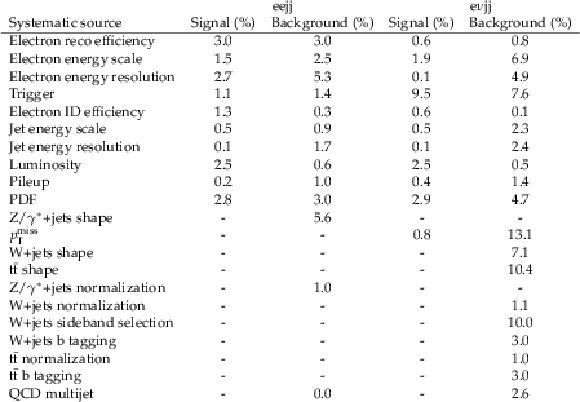
Systematic uncertainties for the ${{\mathrm {e}} {\mathrm {e}}\text {jj}}$ and ${{\mathrm {e}} {\nu}\text {jj}}$ channels. The values shown are calculated for the selections used in the $M_{\text LQ}= $ 1000 GeV search hypothesis and reflect the variations in event yields due to each source. |
png pdf |
Table 2:
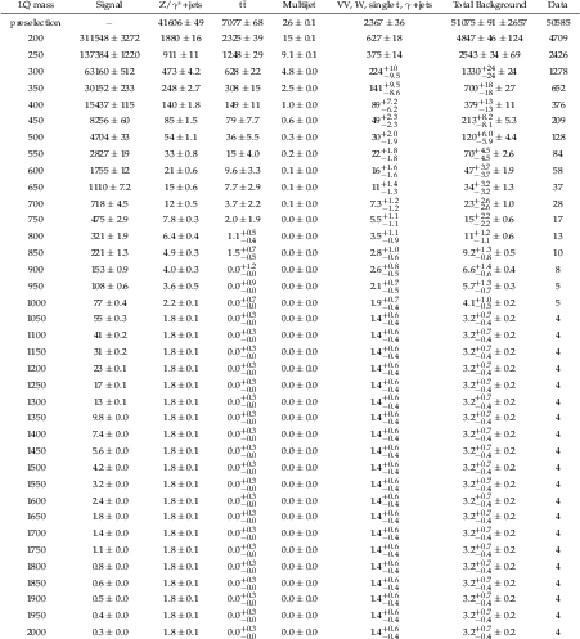
Event yields after the optimized $ {{\mathrm {e}} {\mathrm {e}}\text {jj}} $ selections. Uncertainties are statistical except for the total background, where both statistical and systematic uncertainties are shown. LQ masses are in GeV. |
png pdf |
Table 3:
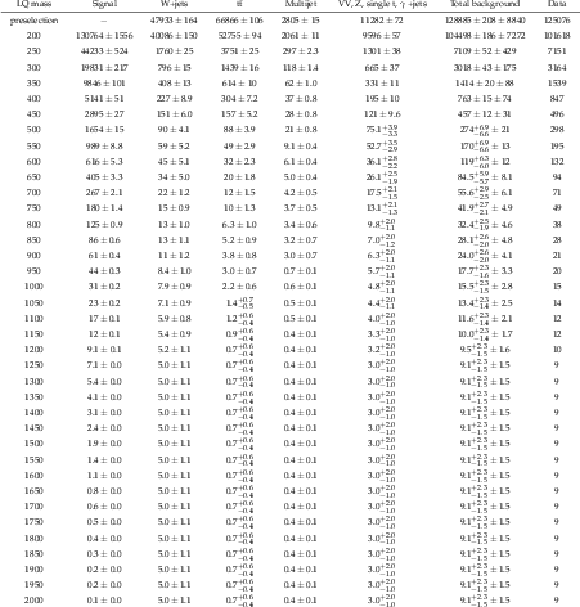
Event yields after the optimized $ {{\mathrm {e}} {\nu}\text {jj}} $ selections. Uncertainties are statistical except for the total background, where both statistical and systematic uncertainties are shown. LQ masses are in GeV. |
| Summary |
| A search has been performed for pair-produced first generation scalar leptoquarks in final states consisting of two high-momentum electrons and two jets, as well as one electron, large missing transverse momentum and two jets. The data sample used in the study corresponds to an integrated luminosity of 35.9 fb$^{-1}$ recorded by the CMS experiment at $\sqrt{s}=13$ TeV. The data are found to be in agreement with SM background expectations and a 95% confidence level lower limit is set on the scalar leptoquark mass at 1435 (1196) GeV for $\beta= $ 1.0 (0.5), where $\beta$ is the branching fraction of the leptoquark decay to an electron and a quark. These constitute the most stringent limits on first generation scalar leptoquark production to date. The data are also interpreted in the context of a long-lived R-parity violating supersymmetry model, where the squarks can decay into leptoquark-like final states. Top squarks with lifetime $c\tau = $ 0.1 (1.0) cm are excluded for masses below 800 (270) GeV. |
| References | ||||
| 1 | H. Georgi and S. Glashow | Unity of All Elementary-Particle Forces | PRL 32 (1974) 438 | |
| 2 | H. Murayama and T. Yanagida | A viable SU(5) GUT with light leptoquark bosons | MPLA 7 (1992) 147 | |
| 3 | H. Fritzsch and P. Minkowski | United Interactions of Leptons and Hadrons | Annals Phys. 93 (1975) 193 | |
| 4 | G. Senjanovi\'c and A. Sokorac | Light Leptoquarks in SO(10) | Z. Phys. C 20 (1983) 255 | |
| 5 | P. H. Frampton and B.-H. Lee | SU(15) Grand Unification | PRL 64 (1990) 619 | |
| 6 | P. H. Frampton and T. W. Kephart | Higgs sector and proton decay in su(15) grand unification | PRD 42 (1990) 3892 | |
| 7 | J. C. Pati and A. Salam | Unified Lepton-Hadron Symmetry and a Gauge Theory of the Basic Interactions | PRD 8 (1973) 1240 | |
| 8 | J. C. Pati and A. Salam | Lepton number as the fourth color | PRD 10 (1974) 275 | |
| 9 | S. Dimopoulos and L. Susskind | Mass without scalars | NPB 155 (1979) 237 | |
| 10 | S. Dimopoulos | Technicoloured signatures | NPB 168 (1980) 69 | |
| 11 | E. Eichten and K. Lane | Dynamical breaking of weak interaction symmetries | PLB 90 (1980) 85 | |
| 12 | J. L. Hewett and T. G. Rizzo | Low-energy phenomenology of superstring-inspired E$ _{6} $ models | PR 183 (1989) 193--381 | |
| 13 | B. Schrempp and F. Schrempp | Light leptoquarks | PLB 153 (1985) 101 | |
| 14 | W. Buchmuller, R. Ruckl, and D. Wyler | Leptoquarks in lepton-quark collisions | PLB 191 (1987) 442 | |
| 15 | W. Buchmuller and D. Wyler | Constraints on SU(5)-type leptoquarks | PLB 177 (1986) 377 | |
| 16 | O. Shanker | $ \pi\ell $2, $ \mathrm{K}\ell $3, and $ \mathrm{K}^0 $-$ \overline{\mathrm{K}}^0 $ constraints on leptoquarks and supersymmetric particles | NPB 204 (1982) 375 | |
| 17 | BaBar Collaboration | Evidence for an Excess of $ \bar{B} \to D^{(*)} \tau^{-}\bar{\nu}_{\tau} $ Decays | PRL 109 (2012) 101802 | 1205.5442 |
| 18 | Belle Collaboration | Measurement of the branching ratio of $ \bar{B} \to D^{(\ast)} \tau^- \bar{\nu}_\tau $ relative to $ \bar{B} \to D^{(\ast)} \ell^- \bar{\nu}_\ell $ decays with hadronic tagging at Belle | PRD 92 (2015) 072014 | 1507.03233 |
| 19 | LHCb Collaboration | Measurement of the ratio of branching fractions $ \mathcal{B}(\bar{B}^0 \to D^{*+}\tau^{-}\bar{\nu}_{\tau})/\mathcal{B}(\bar{B}^0 \to D^{*+}\mu^{-}\bar{\nu}_{\mu}) $ | PRL 115 (2015) 111803 | 1506.08614 |
| 20 | Belle Collaboration | Measurement of the branching ratio of $ \bar{B}^0 \rightarrow D^{*+} \tau^- \bar{\nu}_{\tau} $ relative to $ \bar{B}^0 \rightarrow D^{*+} \ell^- \bar{\nu}_{\ell} $ decays with a semileptonic tagging method | PRD 94 (2016) 072007 | 1607.07923 |
| 21 | LHCb Collaboration | Measurement of the Ratio of Branching Fractions $ \mathcal{B}(B_c^+ \to J/\psi\tau^+\nu_\tau) $/$ \mathcal{B}(B_c^+ \to J/\psi\mu^+\nu_\mu) $ | PRL 120 (2018) 121801 | 1711.05623 |
| 22 | LHCb Collaboration | Measurement of Form-Factor-Independent Observables in the Decay $ B^{0} \to K^{*0} \mu^+ \mu^- $ | PRL 111 (2013) 191801 | 1308.1707 |
| 23 | LHCb Collaboration | Angular analysis of the $ B^{0} \to K^{*0} \mu^{+} \mu^{-} $ decay using 3 fb$ ^{-1} $ of integrated luminosity | JHEP 02 (2016) 104 | 1512.04442 |
| 24 | Belle Collaboration | Lepton-Flavor-Dependent Angular Analysis of $ B\to K^\ast \ell^+\ell^- $ | PRL 118 (2017) 111801 | 1612.05014 |
| 25 | I. Dor\vsner et al. | Physics of leptoquarks in precision experiments and at particle colliders | PR 641 (2016) 1--68 | 1603.04993 |
| 26 | OPAL Collaboration | Search for pair-produced leptoquarks in $ e^{+}e^{-} $ interactions at $ \sqrt{s}\simeq $ 189-209 GeV | EPJC 31 (2003) 281--305 | hep-ex/0305053 |
| 27 | ZEUS Collaboration | Search for resonance decays to lepton+jet at DESY HERA and limits on leptoquarks | PRD 68 (2003) 052004 | hep-ex/0304008 |
| 28 | H1 Collaboration | Search for first generation leptoquarks in $ ep $ collisions at HERA | PLB 704 (2011) 388--396 | 1107.3716 |
| 29 | CDF Collaboration | Search for first-generation scalar leptoquarks in $ p\bar{p} $ collisions at $ \sqrt{s} = $ 1.96 TeV | PRD 72 (2005) 051107 | hep-ex/0506074 |
| 30 | D0 Collaboration | Search for pair production of first-generation leptoquarks in $ p\bar{p} $ collisions at $ \sqrt{s} = $ 1.96 TeV | PLB 681 (2009) 224--232 | 0907.1048 |
| 31 | ATLAS Collaboration | Search for scalar leptoquarks in pp collisions at $ \sqrt{s} = $ 13 TeV with the ATLAS experiment | New J. Phys. 18 (2016) 093016 | 1605.06035 |
| 32 | CMS Collaboration | Search for pair-production of first generation scalar leptoquarks in pp collisions at $ \sqrt{s}= $ 13 ~TeV with $ 2.6 \mathrm{fb}^{-1} $ | CMS-PAS-EXO-16-043 | CMS-PAS-EXO-16-043 |
| 33 | M. Kramer, T. Plehn, M. Spira, and P. M. Zerwas | Pair production of scalar leptoquarks at the CERN LHC | PRD 71 (2005) 057503 | hep-ph/0411038 |
| 34 | CMS Collaboration | The CMS experiment at the CERN LHC | JINST 3 (2008) S08004 | CMS-00-001 |
| 35 | T. Sjostrand, S. Mrenna, and P. Skands | PYTHIA 6.4 physics and manual | JHEP 05 (2006) 026 | hep-ph/0603175 |
| 36 | T. Sjostrand, S. Mrenna, and P. Z. Skands | A Brief Introduction to PYTHIA 8.1 | CPC 178 (2008) 852--867 | 0710.3820 |
| 37 | R. D. Ball et al. | Parton distributions with LHC data | NPB 867 (2013) 244--289 | 1207.1303 |
| 38 | M. Kramer, T. Plehn, M. Spira, and P. M. Zerwas | Pair Production of Scalar Leptoquarks at the Fermilab Tevatron | PRL 79 (1997) 341 | hep-ph/9704322 |
| 39 | J. Pumplin et al. | New Generation of Parton Distributions with Uncertainties from Global QCD Analysis | JHEP 07 (2002) 012 | |
| 40 | H. K. Dreiner | An introduction to explicit $ R $-parity violation | Pramana 51 (1998) 123 | |
| 41 | J. Alwall et al. | The automated computation of tree-level and next-to-leading order differential cross sections, and their matching to parton shower simulations | JHEP 07 (2014) 079 | 1405.0301 |
| 42 | R. Frederix and S. Frixione | Merging meets matching in MC@NLO | JHEP 12 (2012) 061 | 1209.6215 |
| 43 | S. Alioli, P. Nason, C. Oleari, and E. Re | A general framework for implementing NLO calculations in shower Monte Carlo programs: the POWHEG BOX | JHEP 06 (2010) 043 | 1002.2581 |
| 44 | S. Frixione, P. Nason, and G. Ridolfi | A Positive-weight next-to-leading-order Monte Carlo for heavy flavour hadroproduction | JHEP 09 (2007) 126 | 0707.3088 |
| 45 | S. Alioli, P. Nason, C. Oleari, and E. Re | NLO single-top production matched with shower in POWHEG: s- and t-channel contributions | JHEP 09 (2009) 111 | 0907.4076 |
| 46 | J. Alwall et al. | Comparative study of various algorithms for the merging of parton showers and matrix elements in hadronic collisions | EPJC53 (2008) 473--500 | 0706.2569 |
| 47 | NNPDF Collaboration | Parton distributions for the LHC Run II | JHEP 04 (2015) 040 | 1410.8849 |
| 48 | R. Gavin, Y. Li, F. Petriello, and S. Quackenbush | FEWZ 2.0: A code for hadronic Z production at next-to-next-to-leading order | CPC 182 (2011) 2388--2403 | 1011.3540 |
| 49 | J. Campbell, R. K. Ellis, and F. Tramontano | Single top-quark production and decay at next-to-leading order | PRD 70 (2004) 094012 | hep-ph/0408158 |
| 50 | J. Campbell and F. Tramontano | Next-to-leading order corrections to $ Wt $ production and decay | NPB 726 (2005) 109 | hep-ph/0506289 |
| 51 | J. M. Campbell, R. Frederix, F. Maltoni, and F. Tramontano | Next-to-Leading-Order Predictions for $ t $-Channel Single-Top Production at Hadron Colliders | PRL 102 (2009) 182003 | 0903.0005 |
| 52 | J. M. Campbell, R. K. Ellis, and C. Williams | Vector boson pair production at the LHC | JHEP 07 (2011) 018 | 1105.0020 |
| 53 | M. Czakon, P. Fiedler, and A. Mitov | Total Top-Quark Pair-Production Cross Section at Hadron Colliders through O($ \alpha_S^4 $) | PRL 110 (2013) 252004 | 1303.6254 |
| 54 | M. Czakon, M. L. Mangano, A. Mitov, and J. Rojo | Constraints on the gluon pdf from top quark pair production at hadron colliders | JHEP 07 (2013) 167 | 1303.7215 |
| 55 | CMS Collaboration | Event generator tunes obtained from underlying event and multiparton scattering measurements | EPJC 76 (2016) 155 | CMS-GEN-14-001 1512.00815 |
| 56 | GEANT4 Collaboration | GEANT4: a simulation toolkit | NIMA 506 (2003) 250--303 | |
| 57 | J. Allison et al. | Geant4 Developments and Applications | IEEE Trans. Nucl. Sci. 53 (2006) 270 | |
| 58 | CMS Collaboration | Particle-flow reconstruction and global event description with the CMS detector | JINST 12 (2017) P10003 | CMS-PRF-14-001 1706.04965 |
| 59 | M. Cacciari, G. P. Salam, and G. Soyez | The anti-$ k_t $ jet clustering algorithm | JHEP 04 (2008) 063 | 0802.1189 |
| 60 | M. Cacciari, G. P. Salam, and G. Soyez | FastJet user manual | EPJC 72 (2012) 1896 | 1111.6097 |
| 61 | CMS Collaboration | Jet energy scale and resolution in the CMS experiment in pp collisions at 8 TeV | JINST 12 (2017) P02014 | CMS-JME-13-004 1607.03663 |
| 62 | CMS Collaboration | Performance of electron reconstruction and selection with the CMS detector in proton-proton collisions at $ \sqrt{s} = $ 8 TeV | JINST 10 (2015) P06005 | CMS-EGM-13-001 1502.02701 |
| 63 | CMS Collaboration | Performance of the CMS muon detector and muon reconstruction with proton-proton collisions at $ \sqrt{s}= $ 13 TeV | JINST 13 (2018), no. 06, P06015 | CMS-MUO-16-001 1804.04528 |
| 64 | CMS Collaboration | Identification of heavy-flavour jets with the CMS detector in pp collisions at 13 TeV | JINST 13 (2018), no. 05, P05011 | CMS-BTV-16-002 1712.07158 |
| 65 | G. Punzi | Sensitivity of searches for new signals and its optimization | eConf C030908 (2003) MODT002, %%[,79(2003)]%% | physics/0308063 |
| 66 | CMS Collaboration | Generic Tag and Probe Tool for Measuring Efficiency at CMS with Early Data | CMS Physics Analysis Note: AN-2009/111 (2009) | |
| 67 | CMS Collaboration | Performance of photon reconstruction and identification with the CMS detector in proton-proton collisions at $ \sqrt{s} = $ 8 TeV | JINST 10 (2015) P08010 | CMS-EGM-14-001 1502.02702 |
| 68 | CMS Collaboration | CMS Luminosity Measurements for the 2016 Data Taking Period | CMS-PAS-LUM-17-001 | CMS-PAS-LUM-17-001 |
| 69 | J. Butterworth et al. | PDF4LHC recommendations for LHC Run II | JPG 43 (2016) 023001 | 1510.03865 |
| 70 | G. Cowan, K. Cranmer, E. Gross, and O. Vitells | Asymptotic formulae for likelihood-based tests of new physics | EPJC 71 (2011) 1554 | 1007.1727 |
| 71 | T. Junk | Confidence level computation for combining searches with small statistics | NIMA434 (1999) 435--443 | hep-ex/9902006 |
| 72 | A. L. Read | Presentation of search results: the $ CL_s $ technique | JPG 28 (2002) 2693--2704 | |
| 73 | ATLAS and CMS Collaborations, and LHC Higgs Combination Group | Procedure for the LHC Higgs boson search combination in Summer 2011 | CMS NOTE-2011/005, ATL-PHYS-PUB-2011-11 | |
| 74 | P. W. Graham, D. E. Kaplan, S. Rajendran, and P. Saraswat | Displaced Supersymmetry | JHEP 07 (2012) 149 | 1204.6038 |
| 75 | W. Beenakker et al. | Stop production at hadron colliders | NPB515 (1998) 3--14 | hep-ph/9710451 |
| 76 | W. Beenakker et al. | Supersymmetric top and bottom squark production at hadron colliders | JHEP 08 (2010) 098 | 1006.4771 |
| 77 | W. Beenakker et al. | Squark and Gluino Hadroproduction | Int. J. Mod. Phys. A26 (2011) 2637--2664 | 1105.1110 |

|
Compact Muon Solenoid LHC, CERN |

|

|

|

|

|

|