

Compact Muon Solenoid
LHC, CERN
| CMS-PAS-BPH-22-007 | ||
| Measurement of double-differential and total charm-production cross sections at 7 TeV | ||
| CMS Collaboration | ||
| 23 July 2024 | ||
| Abstract: The production cross section of D$ ^{*\pm} $ mesons in proton-proton collisions is measured at a center-of-mass energy of 7 TeV with the CMS detector. Special low-$ p_T $ tracking and low-pileup data are used, corresponding to an integrated luminosity of 3.0 nb$^{-1}$. A double-differential cross-section measurement is performed covering D$ ^{*\pm} $ transverse momentum $ p_{\rm T} $ down to 1 GeV and a rapidity range of $ |y| < $ 2.5. The total charm-quark pair cross section, $ \sigma_{{\rm c\bar c},{\rm tot}}$(7 TeV) $ = $ 9.39 $ ^{+1.35}_{-1.49} $ mb is extracted from the D$ ^{*\pm} $-meson cross section. For this purpose, the results are combined with published measurements by the LHCb Collaboration covering rapidities larger than 2.5, and then extrapolated to the full kinematical phase space by means of a new data-driven procedure that includes a complete treatment of charm-fragmentation nonuniversality. This combination probes the largest phase space for charm production ever explored at LHC, resulting in the smallest extrapolation factor, which minimizes the impact of theoretical uncertainties. The resulting cross sections are compared to NLO+NLL and NNLO-QCD predictions and to the results from other experiments. | ||
| Links: CDS record (PDF) ; CADI line (restricted) ; | ||
| Figures & Tables | Summary | Additional Figures | References | CMS Publications |
|---|
| Figures | |
png pdf |
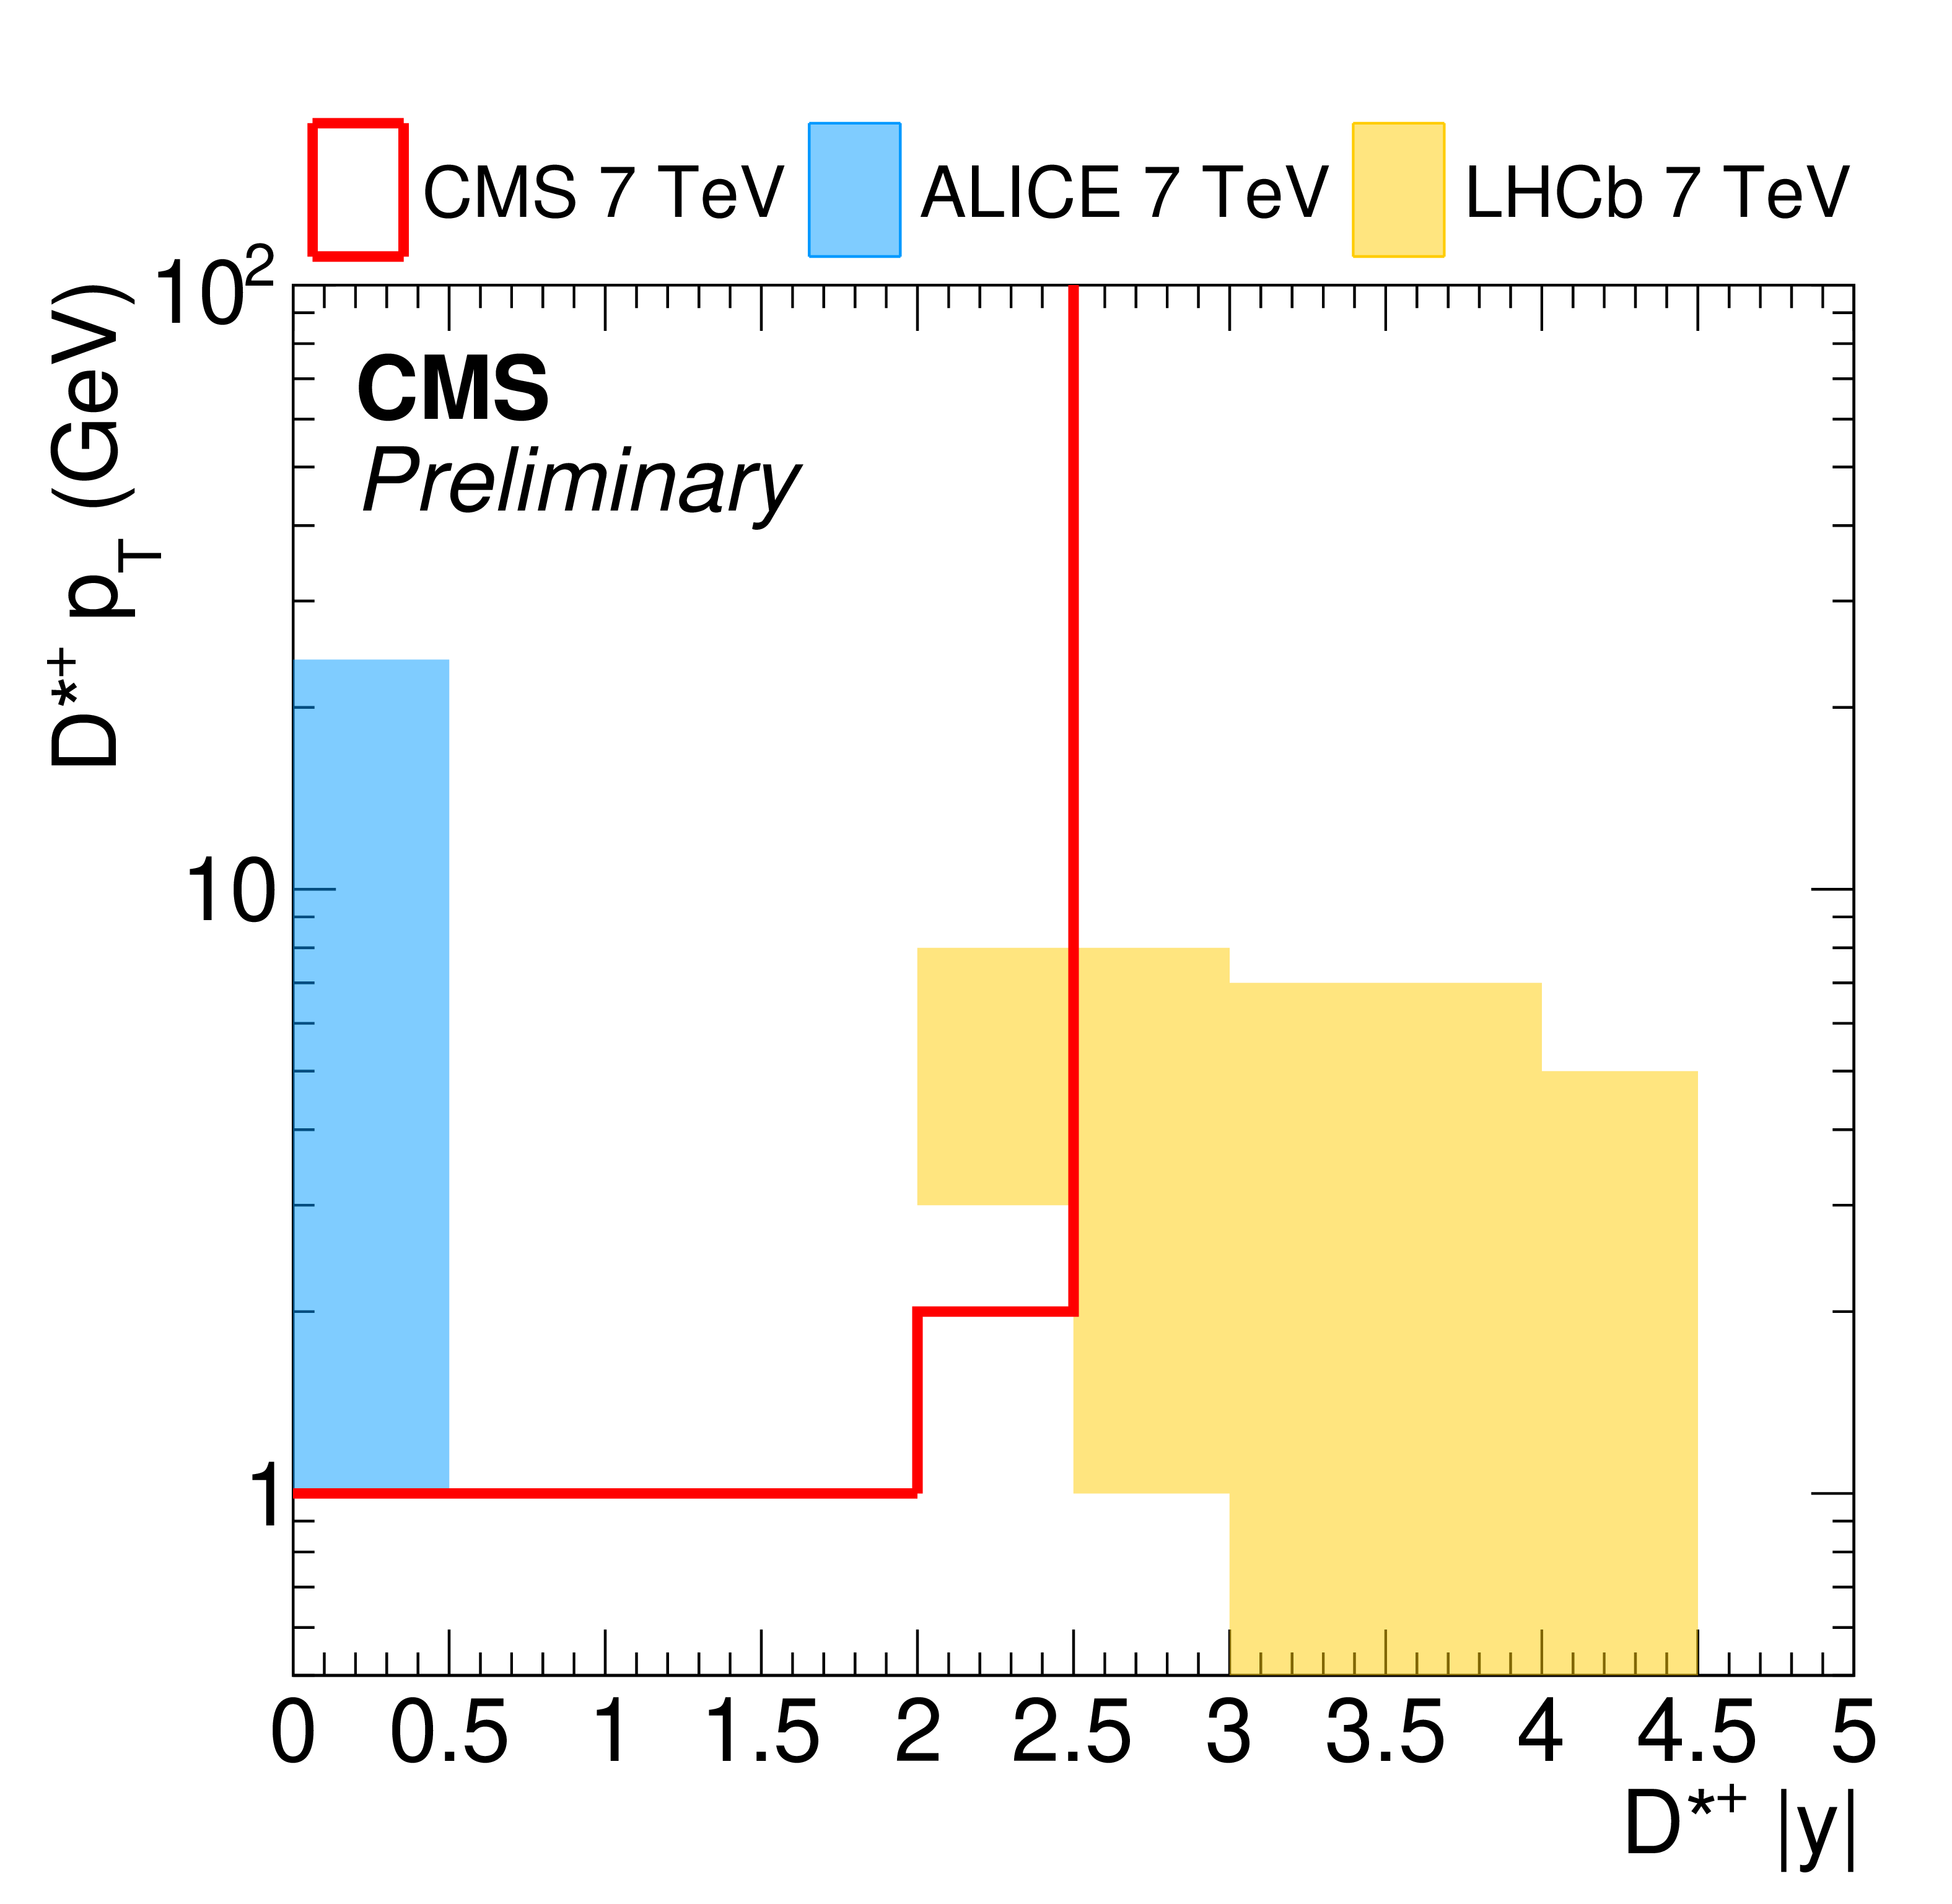
Figure 1:
Actual phase space in transverse momentum $ p_T $ and rapidity $ |y| $ for prompt-$ \mathrm{D}^{*} $ production cross sections covered by ALICE [8,9,10], LHCb [14], and CMS (this analysis) at 7 TeV. The measurements in the overlapping regions between CMS and ALICE, as well as CMS and LHCb, are compared in order to demonstrate consistency. The combination of the CMS and LHCb measurements covers most of the phase space and is used in the total charm cross-section determination. The measurement is extrapolated for the small remaining uncovered regions. |

png pdf |
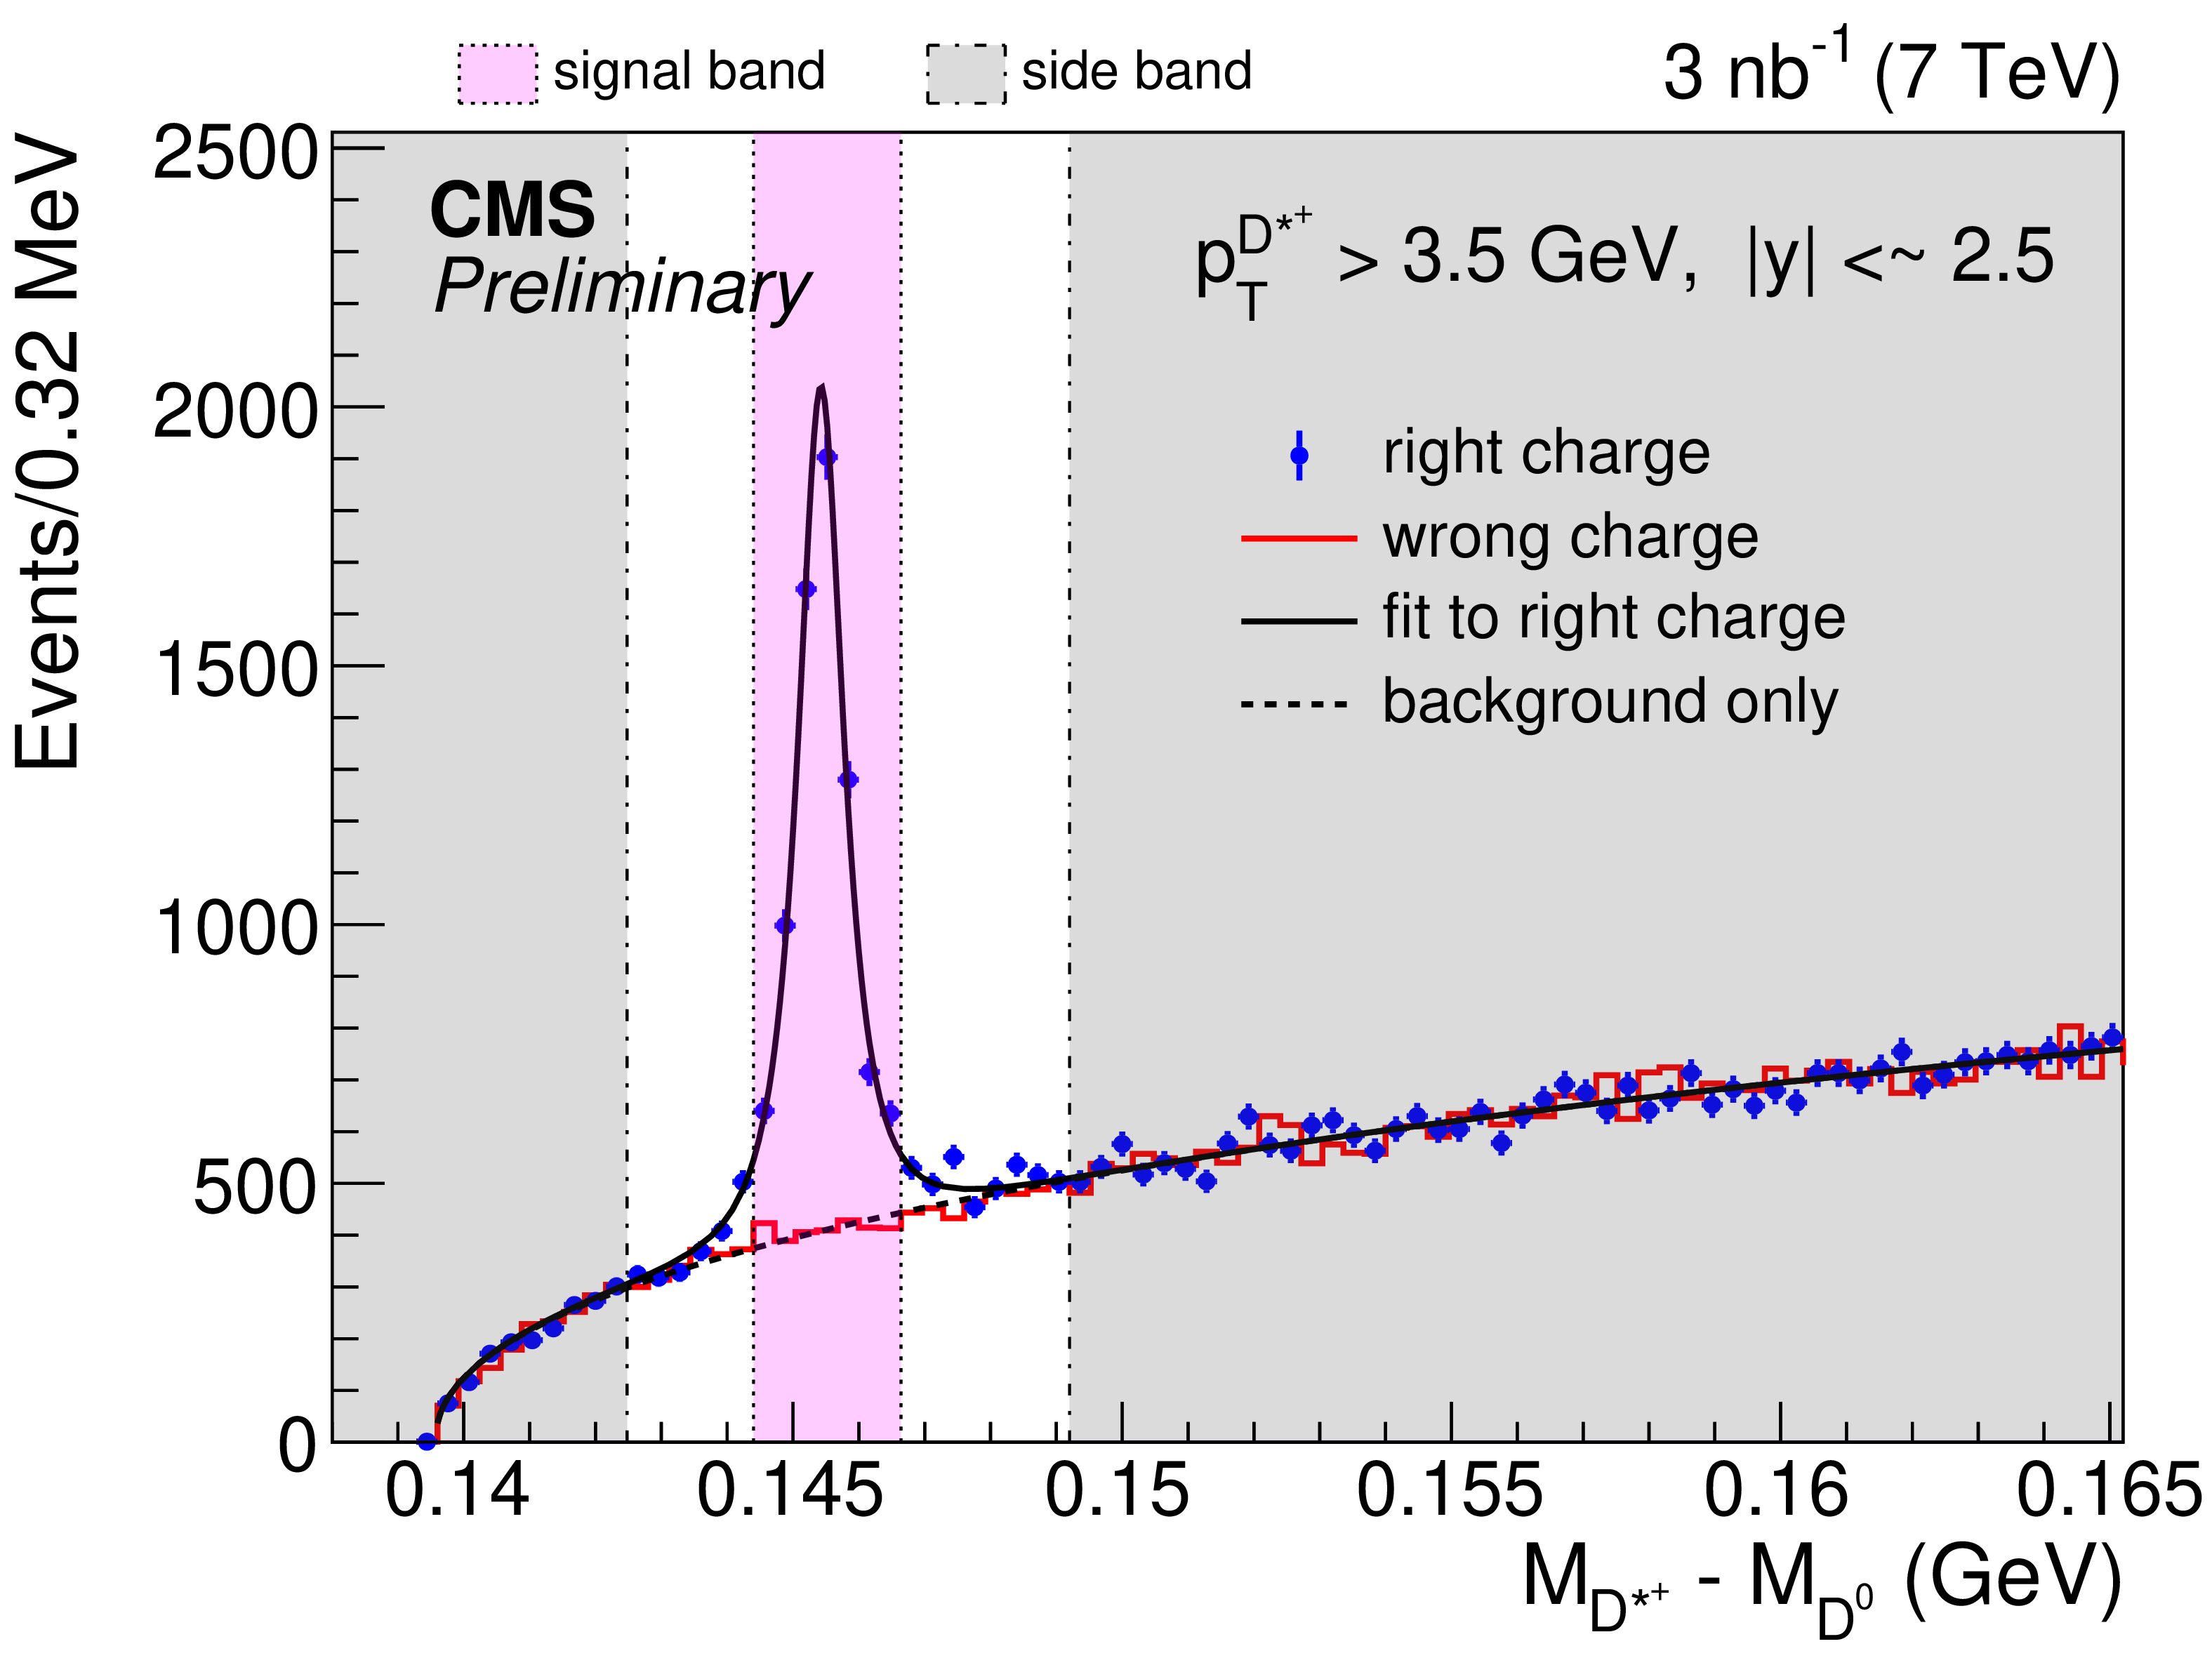
Figure 2:
$ \Delta M = M_{{\rm D}^{*+}} - M_{{\rm D}^0} $ distributions in data for the lower (higher) $ p_{\mathrm{T}} $ category on the left (right). Shown are the right-charge data (blue points) and the wrong-charge data (red histograms), normalized to the right-charge data in the gray shaded side band regions. Corresponding fits (solid lines) are also shown to guide the eye. The ``background only'' dashed line refers to the background-only part of the full right-charge fit. The mass region used for the final signal extraction is indicated by the pink band. |

png pdf |
Figure 2-a:
$ \Delta M = M_{{\rm D}^{*+}} - M_{{\rm D}^0} $ distributions in data for the lower (higher) $ p_{\mathrm{T}} $ category on the left (right). Shown are the right-charge data (blue points) and the wrong-charge data (red histograms), normalized to the right-charge data in the gray shaded side band regions. Corresponding fits (solid lines) are also shown to guide the eye. The ``background only'' dashed line refers to the background-only part of the full right-charge fit. The mass region used for the final signal extraction is indicated by the pink band. |
png pdf |
Figure 2-b:
$ \Delta M = M_{{\rm D}^{*+}} - M_{{\rm D}^0} $ distributions in data for the lower (higher) $ p_{\mathrm{T}} $ category on the left (right). Shown are the right-charge data (blue points) and the wrong-charge data (red histograms), normalized to the right-charge data in the gray shaded side band regions. Corresponding fits (solid lines) are also shown to guide the eye. The ``background only'' dashed line refers to the background-only part of the full right-charge fit. The mass region used for the final signal extraction is indicated by the pink band. |
png pdf |
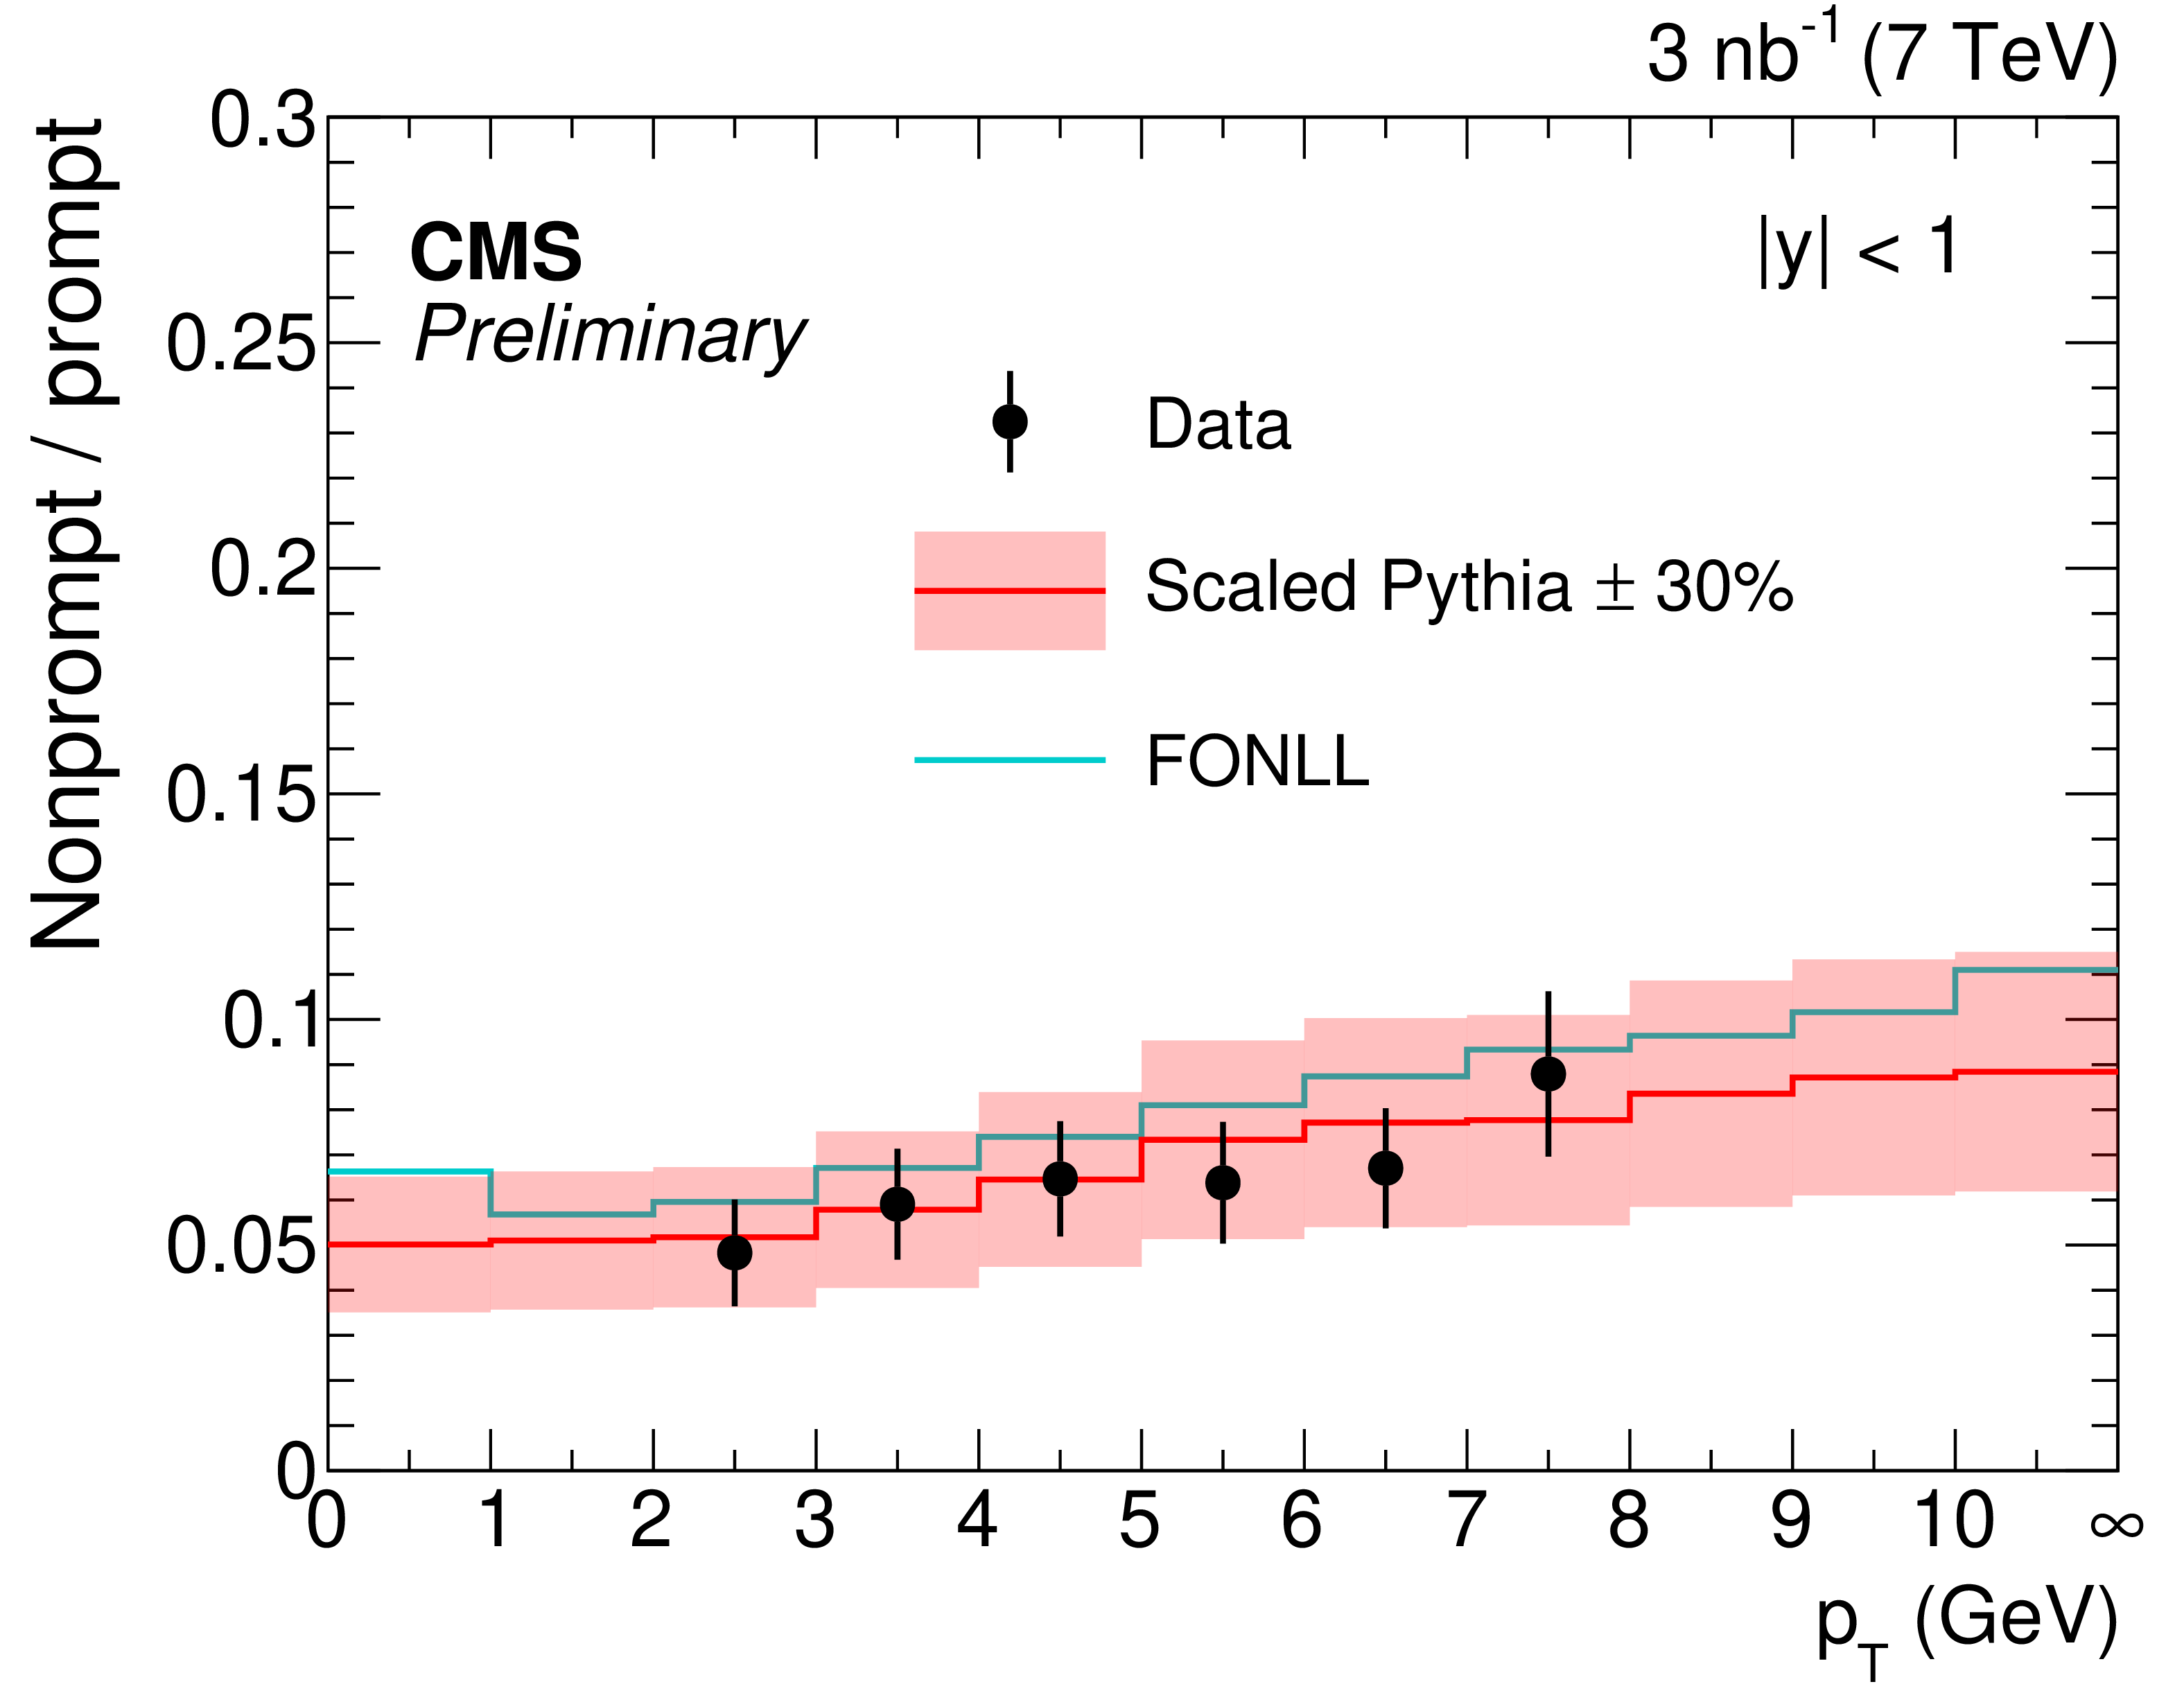
Figure 3:
The ratio of nonprompt to prompt $ \mathrm{D}^{*} $-meson cross sections. With the assigned uncertainty of 30%, the PYTHIA prediction after correction describes well the ratio of the nonprompt 5 TeV CMS measurement [25], converted to 7 TeV, to the prompt 7 TeV measurement (this work). The central FONLL prediction is only shown as a consistency check and not used. |

png pdf |
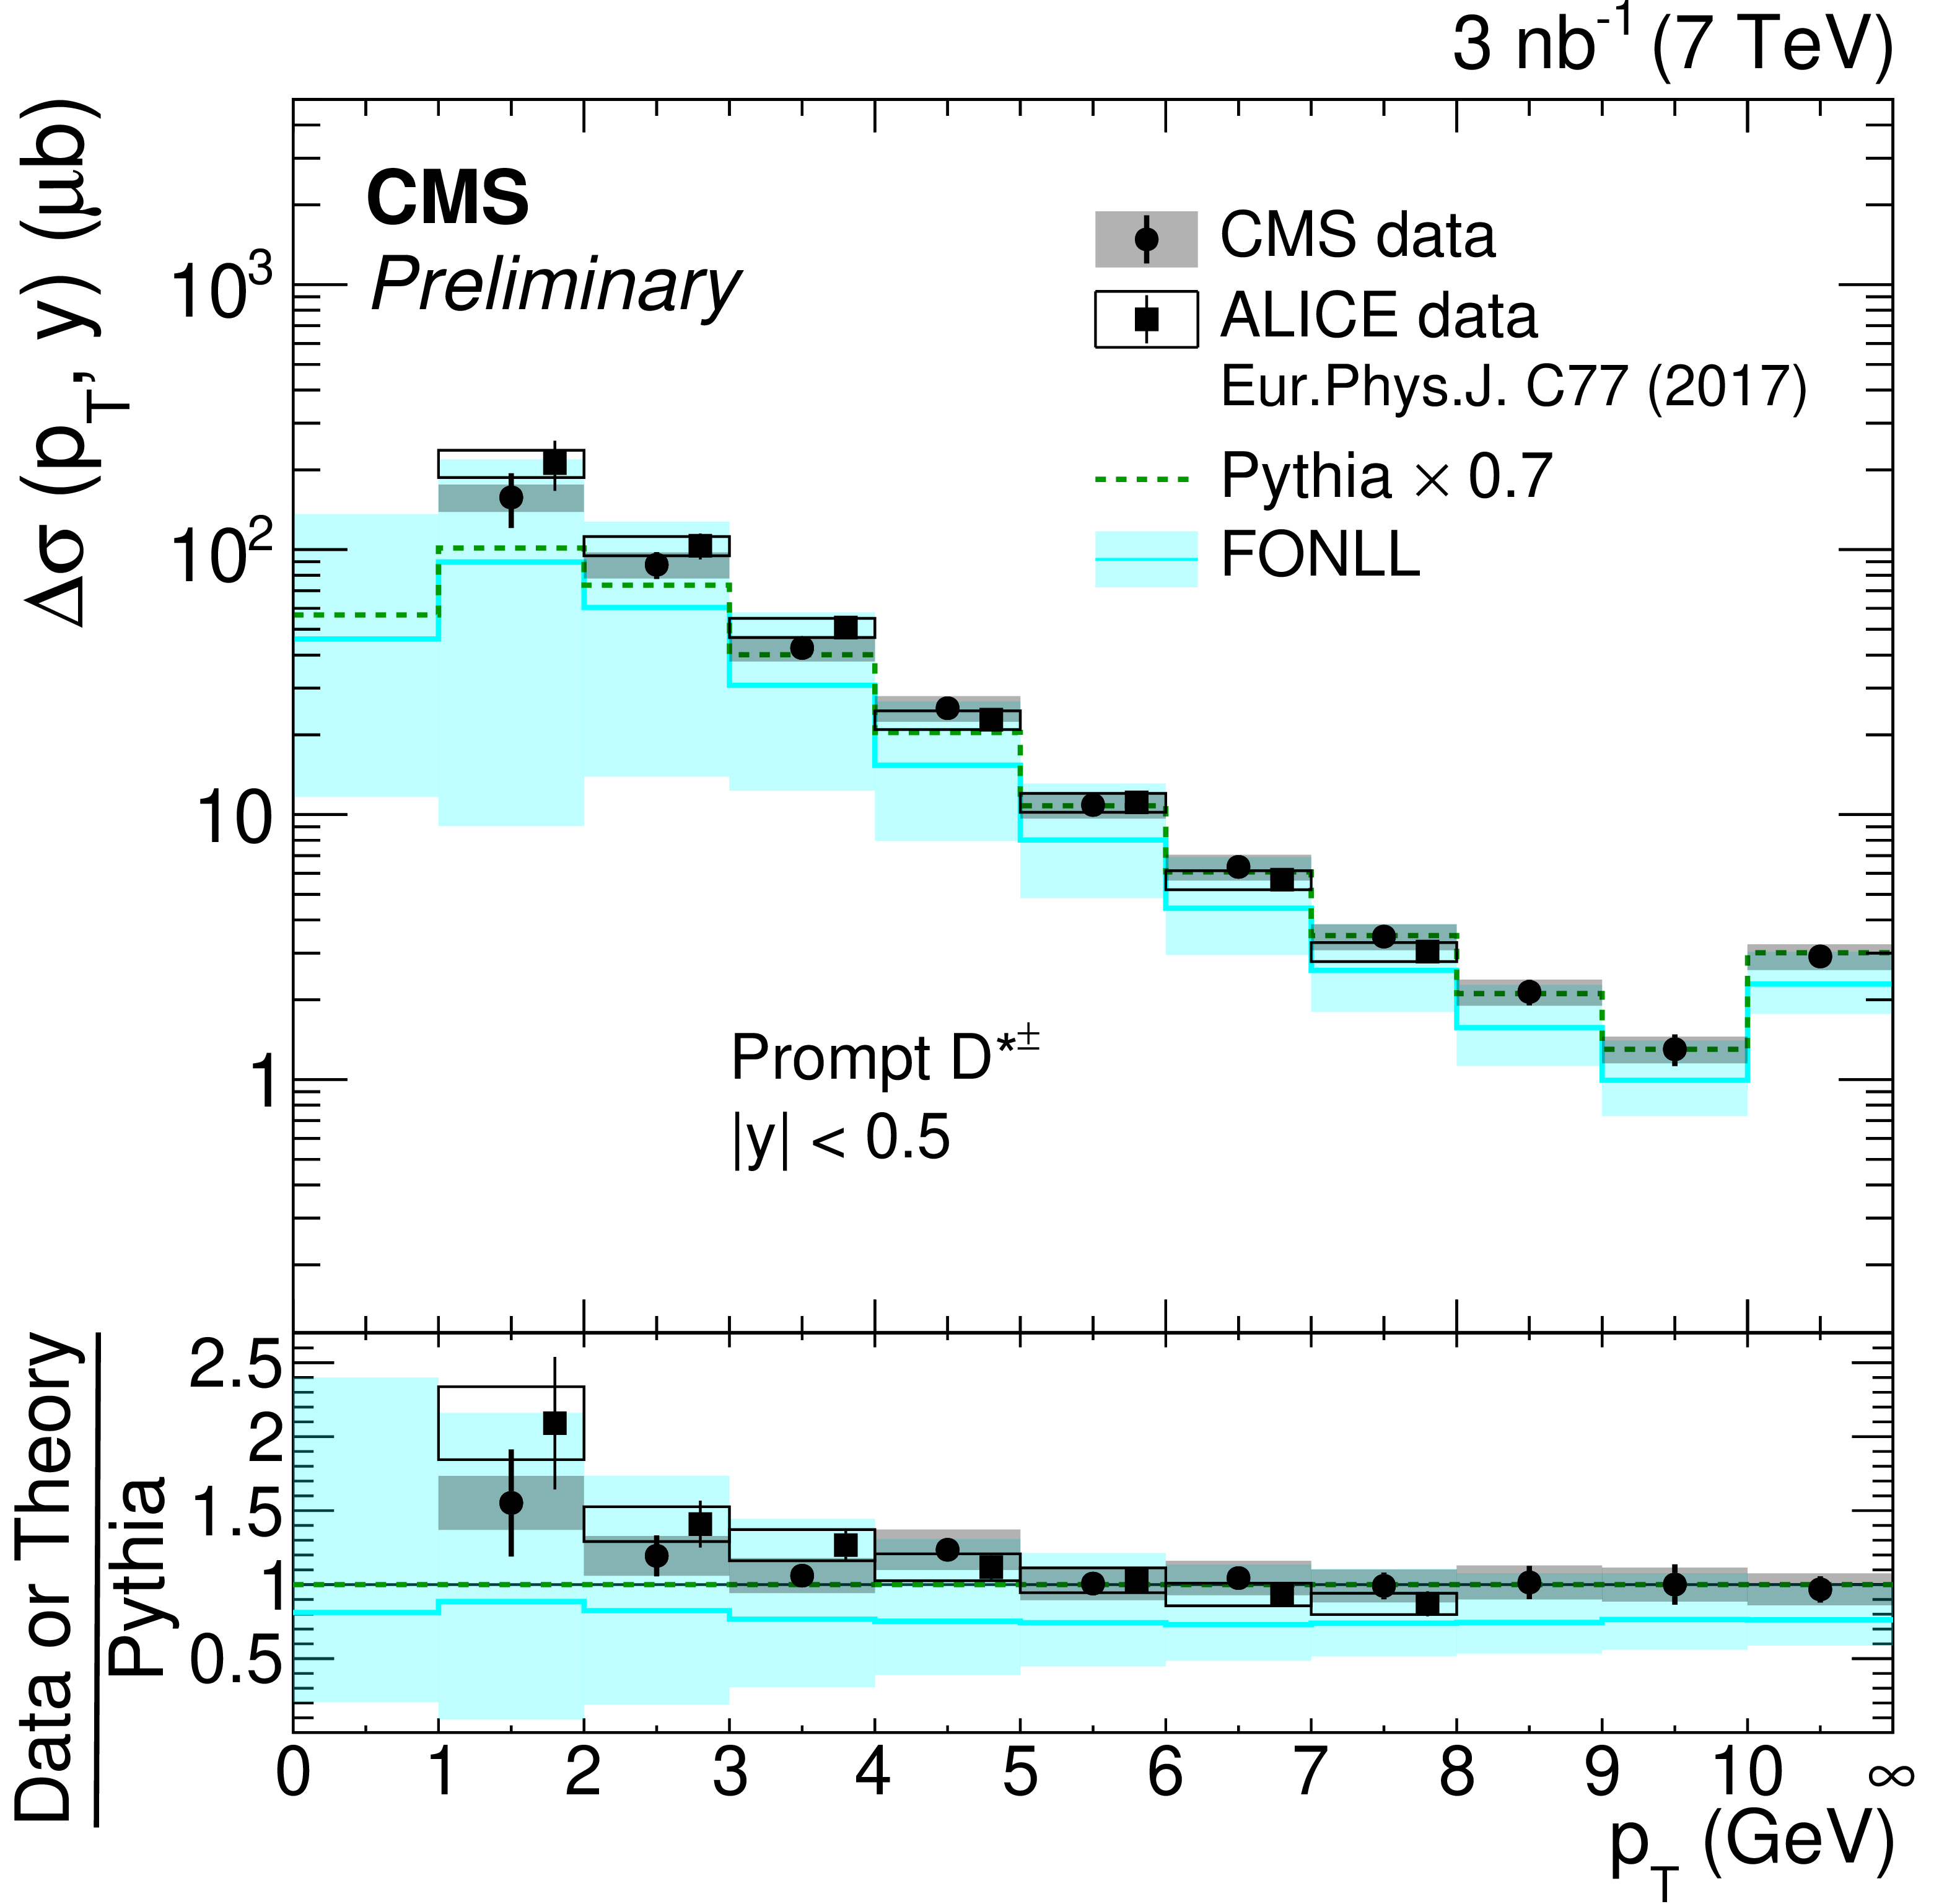
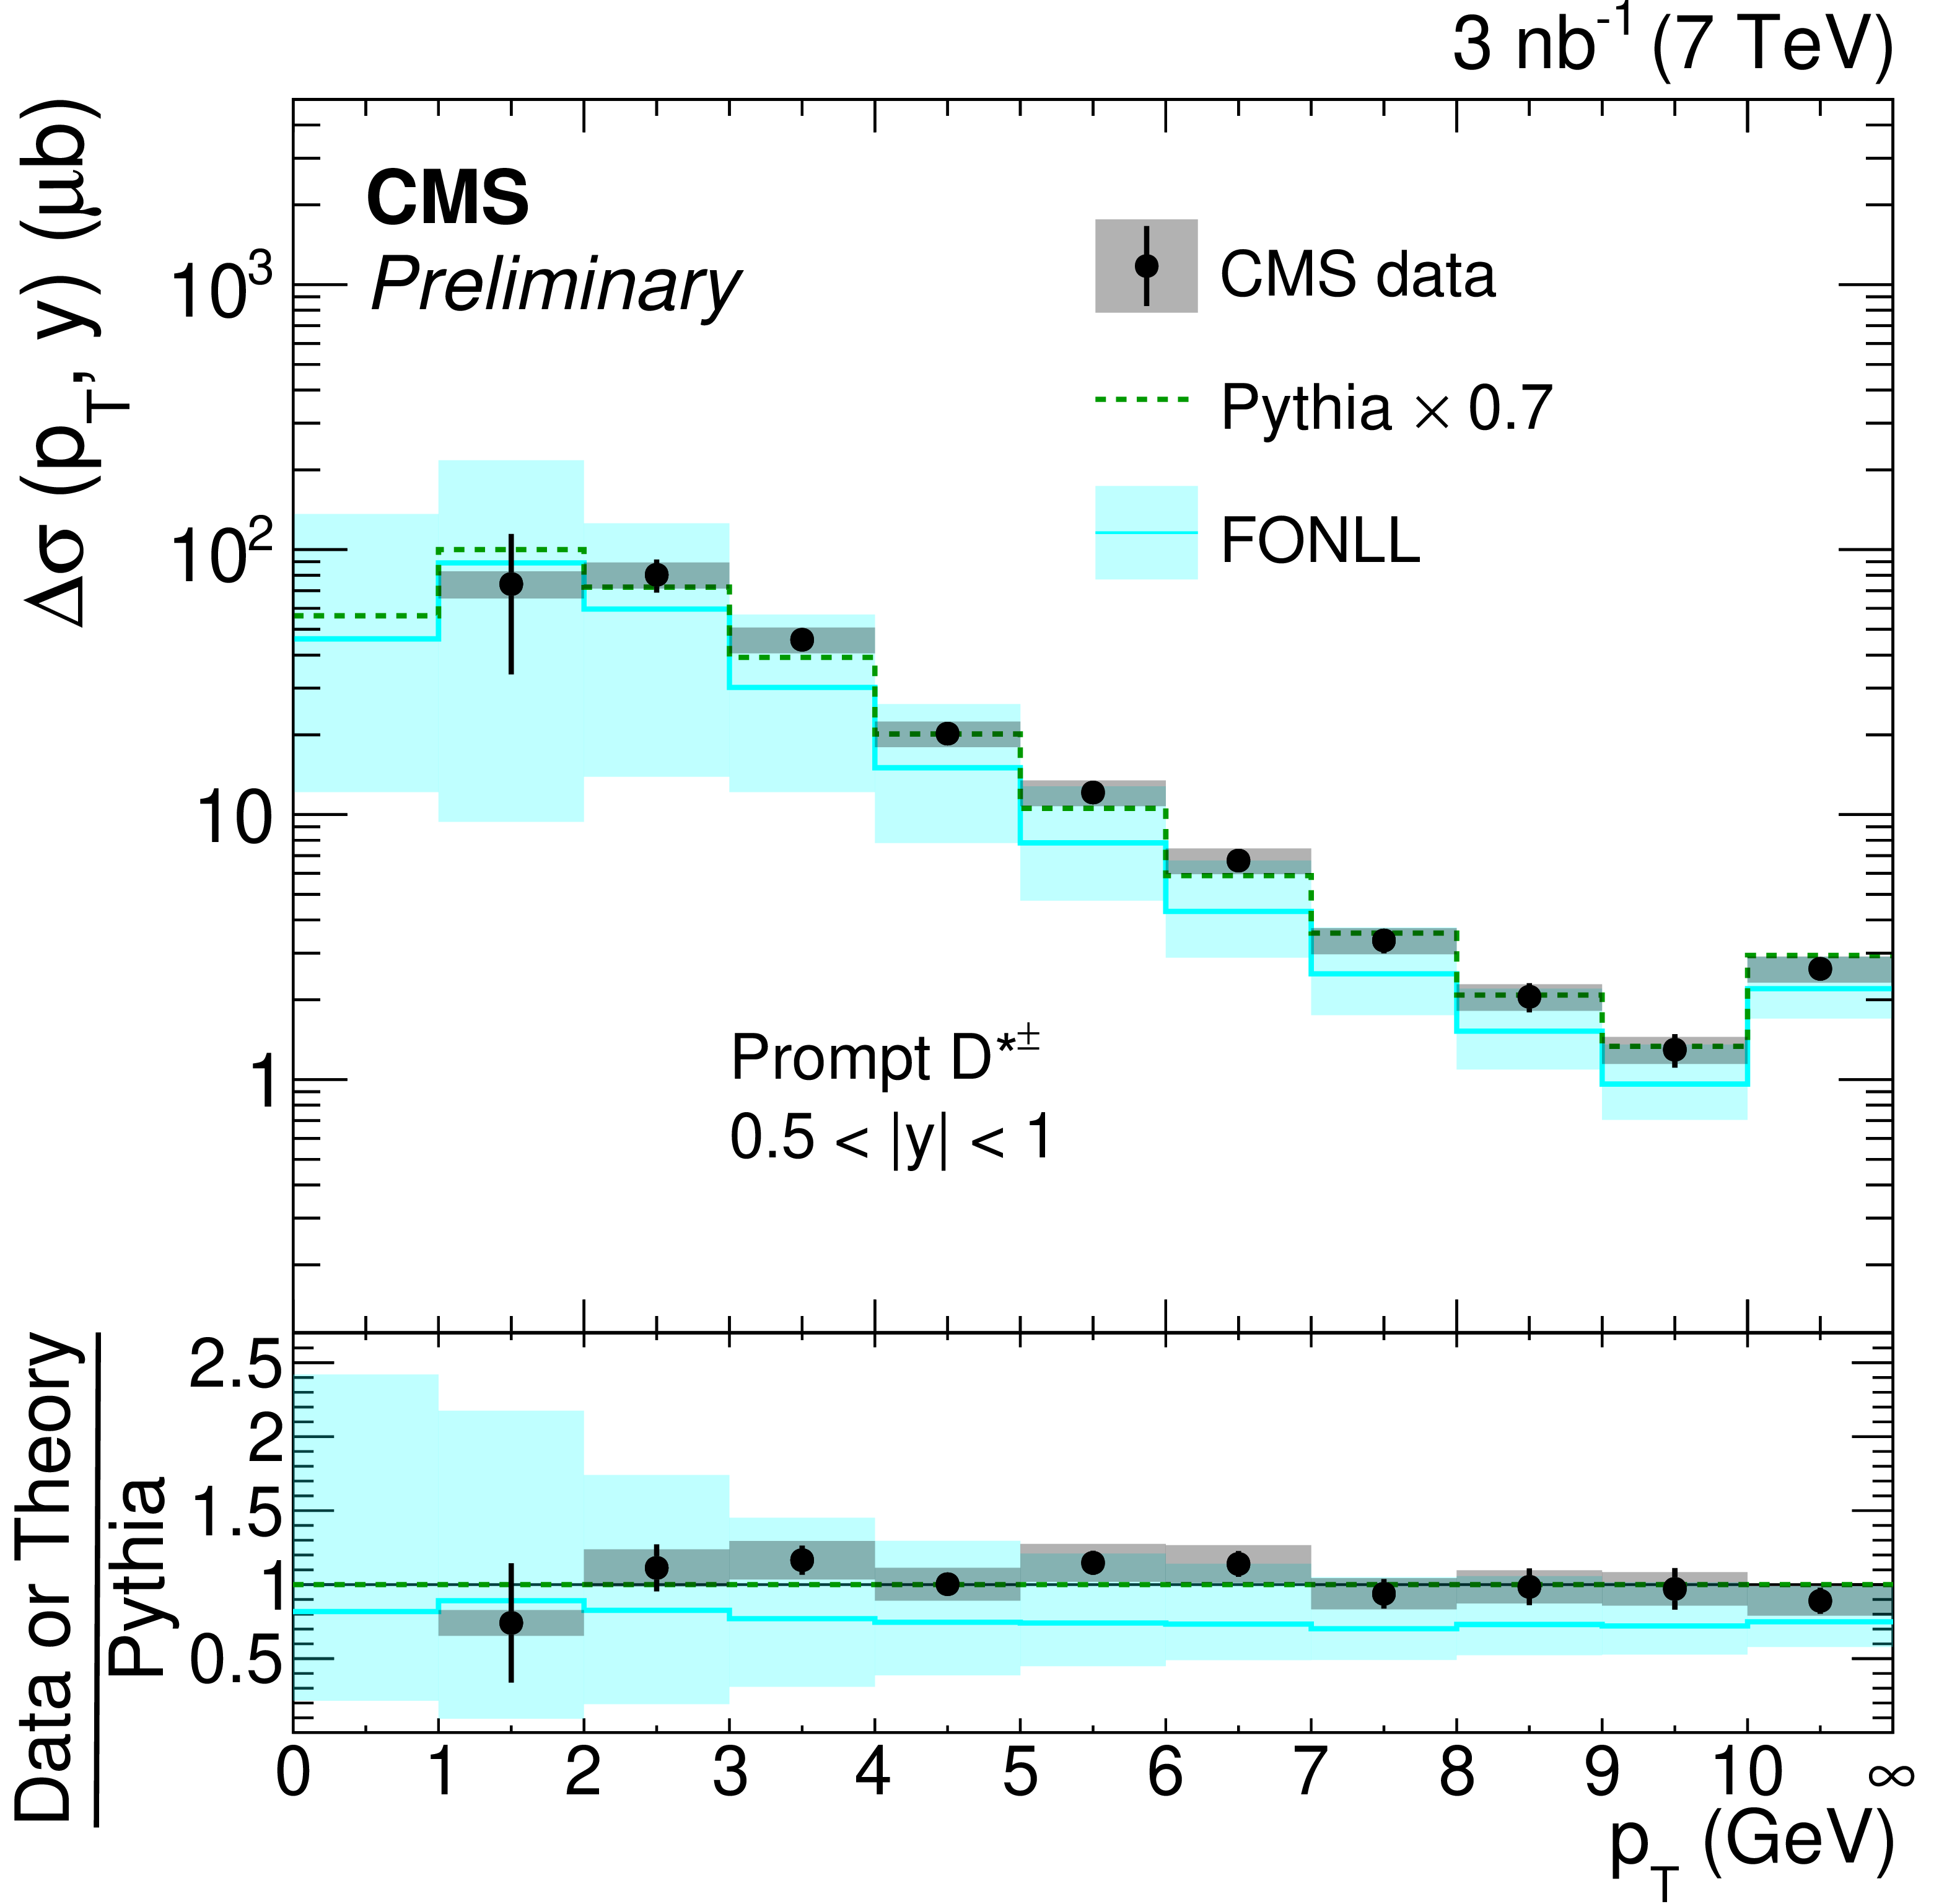
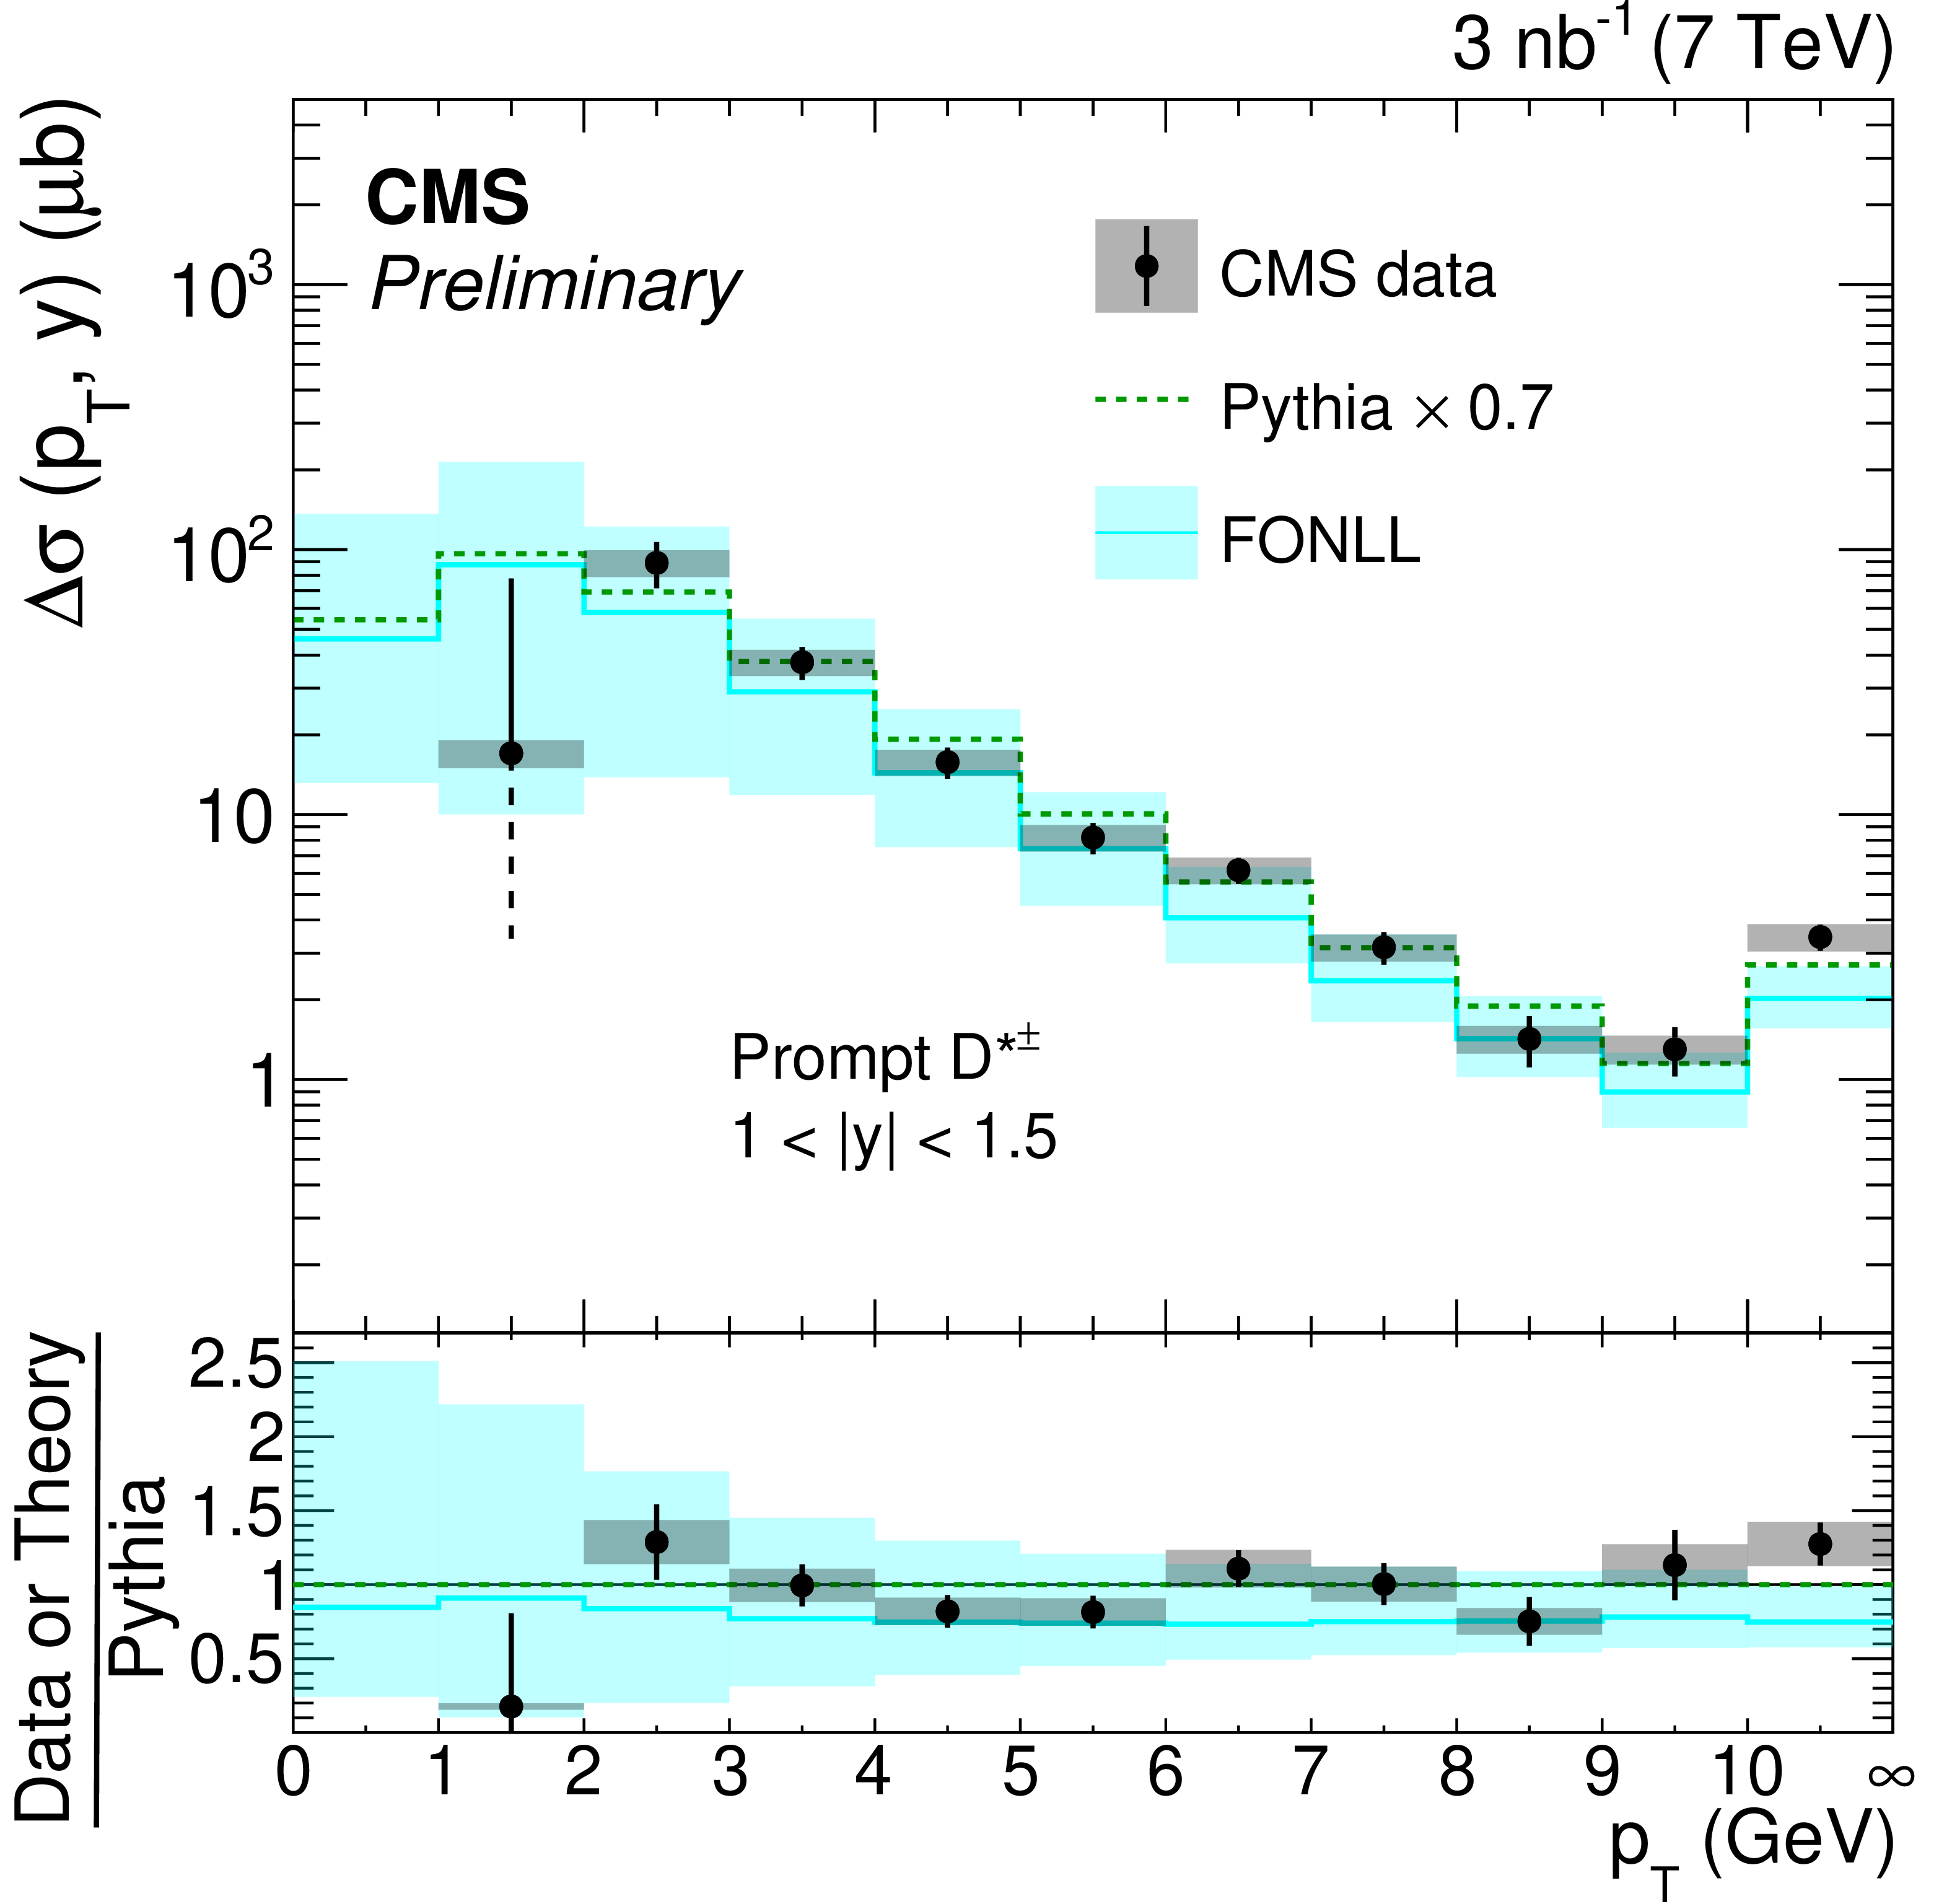
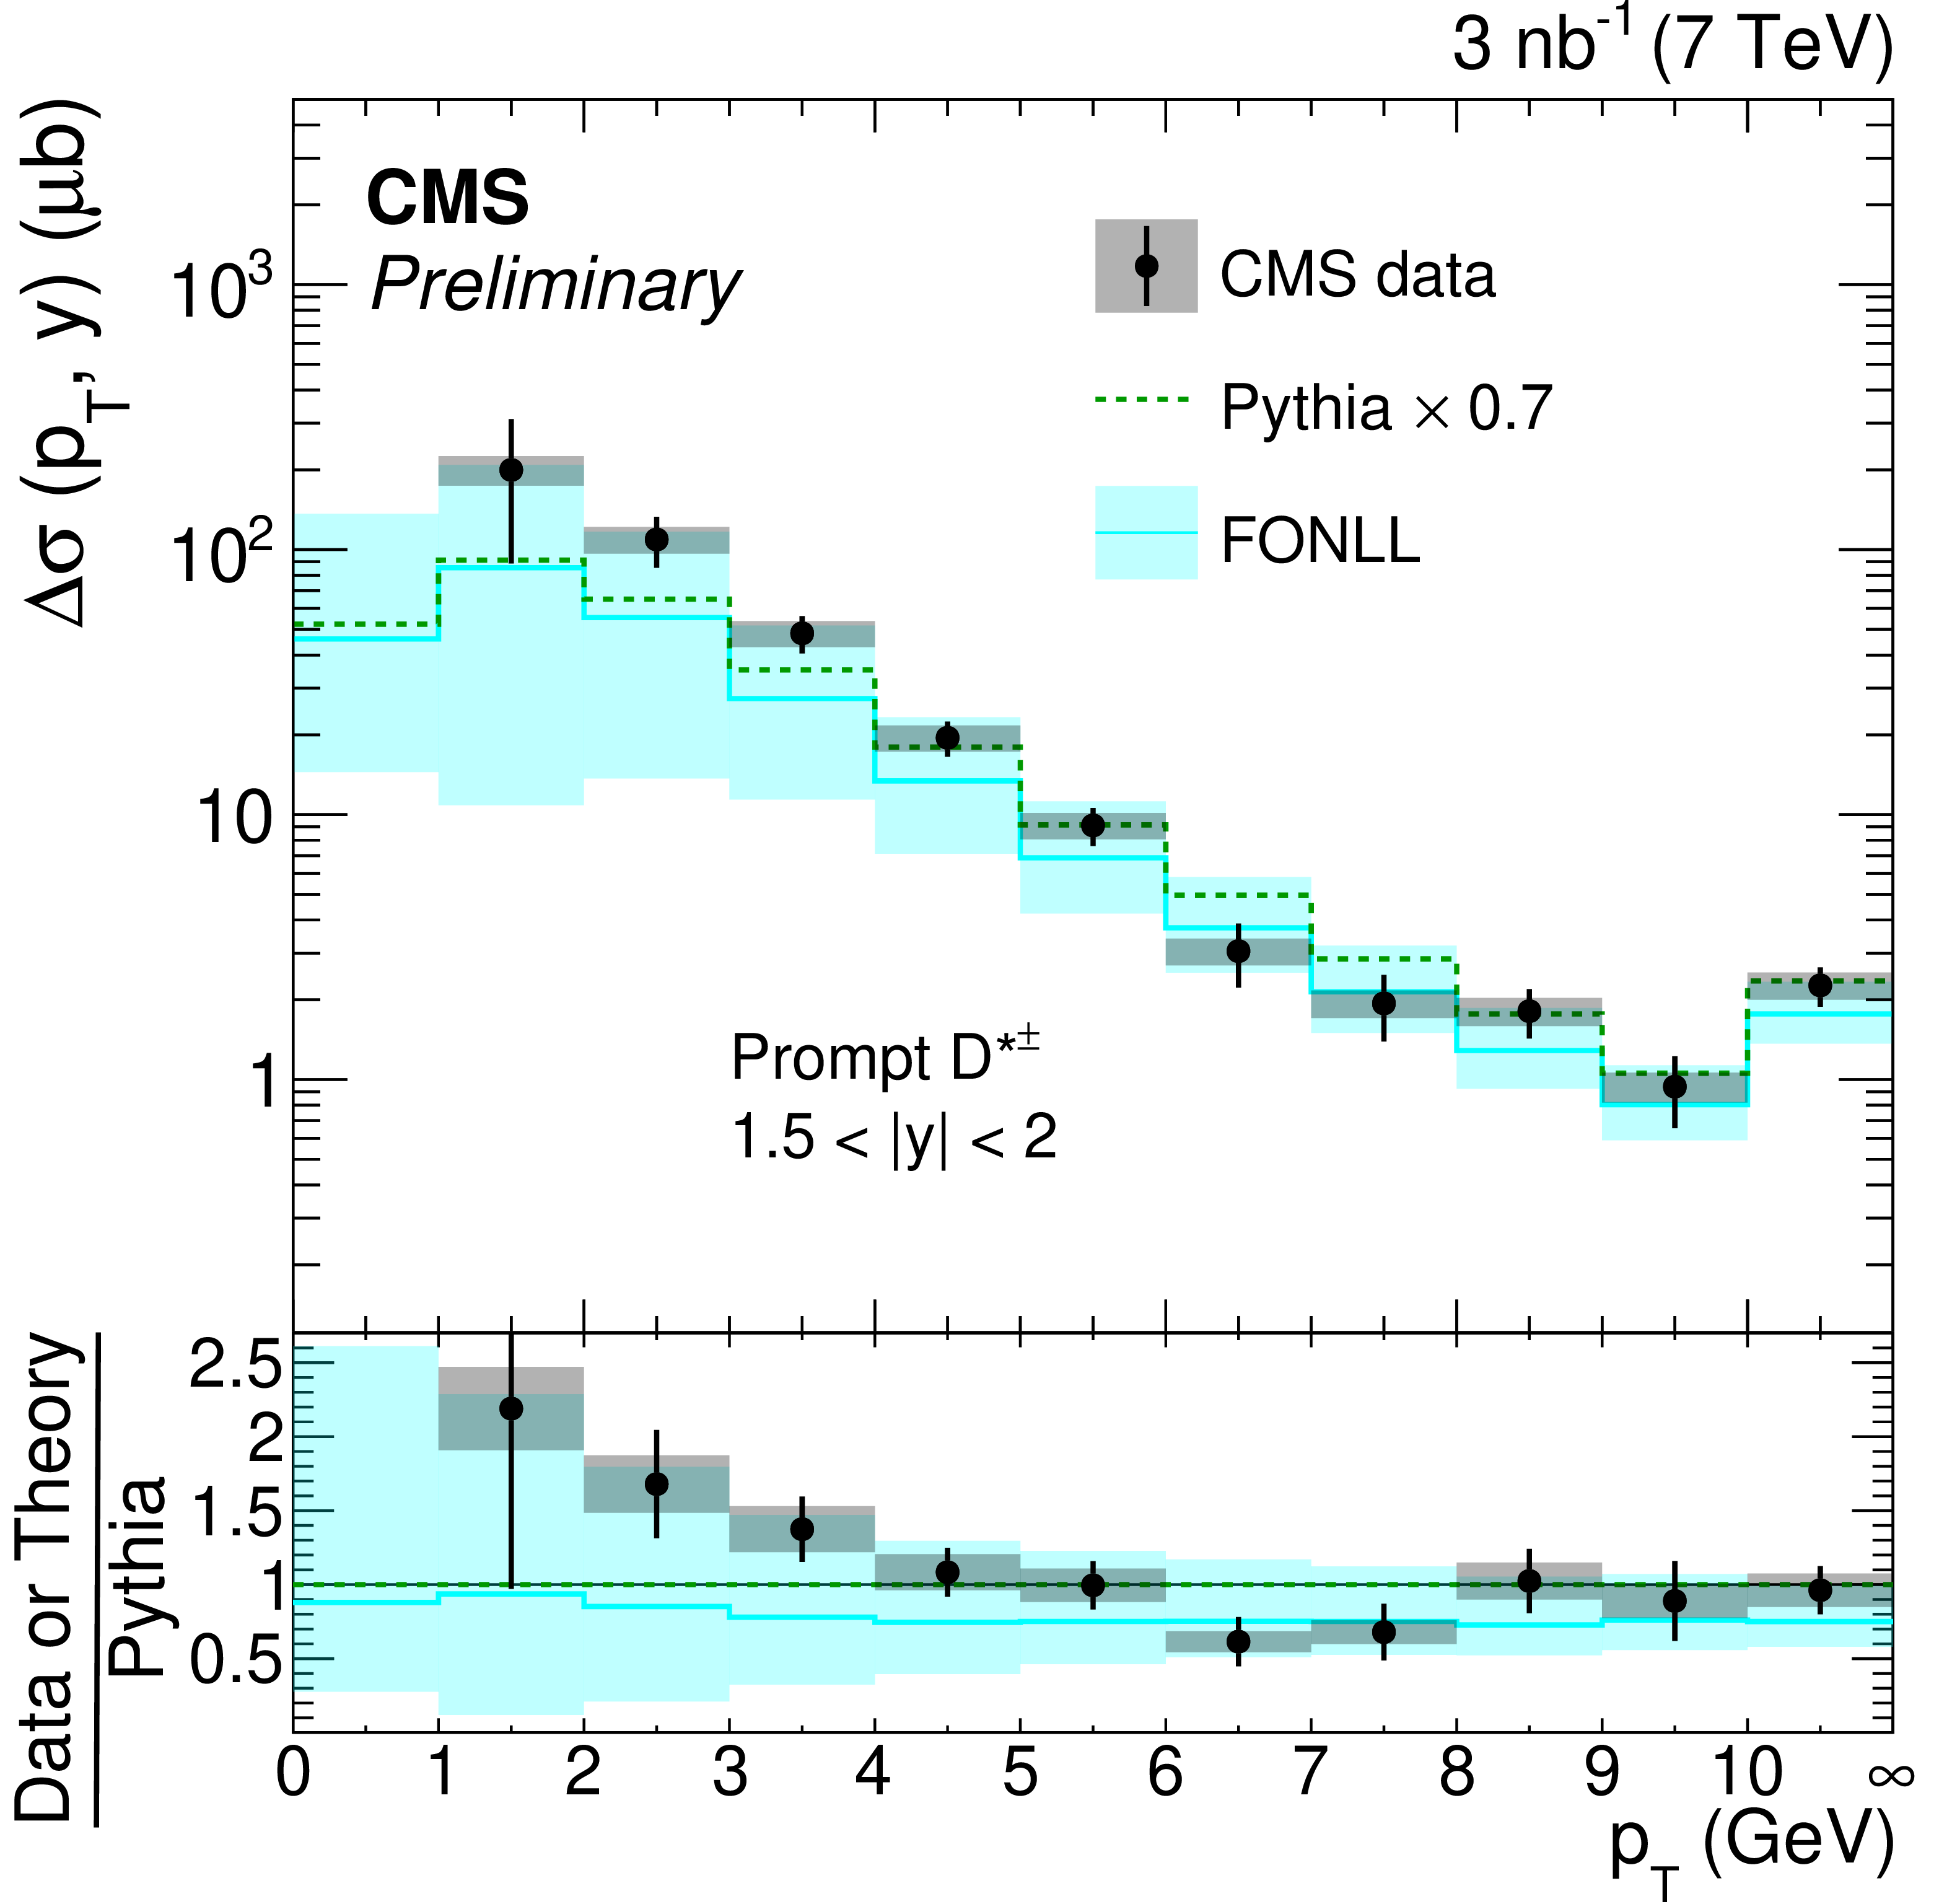
Figure 4:
Double-differential prompt-$ \mathrm{D}^{*} $ cross section as a function of $ p_{\mathrm{T}} $ in $ |y| $ bins for data (points) and predictions (lines). The last bin in each panel is the overflow bin. Statistical (vertical bars) and systematic uncertainties (boxes) are shown separately. Lower vertical bars that would extend to log(zero) (long-dashed) have been truncated for clarity. The points from ALICE and LHCb have been slightly offset horizontally for clarity. The bottom panels show the ratios to the PYTHIA predictions in linear scale. |
png pdf |
Figure 4-a:
Double-differential prompt-$ \mathrm{D}^{*} $ cross section as a function of $ p_{\mathrm{T}} $ in $ |y| $ bins for data (points) and predictions (lines). The last bin in each panel is the overflow bin. Statistical (vertical bars) and systematic uncertainties (boxes) are shown separately. Lower vertical bars that would extend to log(zero) (long-dashed) have been truncated for clarity. The points from ALICE and LHCb have been slightly offset horizontally for clarity. The bottom panels show the ratios to the PYTHIA predictions in linear scale. |
png pdf |
Figure 4-b:
Double-differential prompt-$ \mathrm{D}^{*} $ cross section as a function of $ p_{\mathrm{T}} $ in $ |y| $ bins for data (points) and predictions (lines). The last bin in each panel is the overflow bin. Statistical (vertical bars) and systematic uncertainties (boxes) are shown separately. Lower vertical bars that would extend to log(zero) (long-dashed) have been truncated for clarity. The points from ALICE and LHCb have been slightly offset horizontally for clarity. The bottom panels show the ratios to the PYTHIA predictions in linear scale. |
png pdf |
Figure 4-c:
Double-differential prompt-$ \mathrm{D}^{*} $ cross section as a function of $ p_{\mathrm{T}} $ in $ |y| $ bins for data (points) and predictions (lines). The last bin in each panel is the overflow bin. Statistical (vertical bars) and systematic uncertainties (boxes) are shown separately. Lower vertical bars that would extend to log(zero) (long-dashed) have been truncated for clarity. The points from ALICE and LHCb have been slightly offset horizontally for clarity. The bottom panels show the ratios to the PYTHIA predictions in linear scale. |
png pdf |
Figure 4-d:
Double-differential prompt-$ \mathrm{D}^{*} $ cross section as a function of $ p_{\mathrm{T}} $ in $ |y| $ bins for data (points) and predictions (lines). The last bin in each panel is the overflow bin. Statistical (vertical bars) and systematic uncertainties (boxes) are shown separately. Lower vertical bars that would extend to log(zero) (long-dashed) have been truncated for clarity. The points from ALICE and LHCb have been slightly offset horizontally for clarity. The bottom panels show the ratios to the PYTHIA predictions in linear scale. |

png pdf |
Figure 4-e:
Double-differential prompt-$ \mathrm{D}^{*} $ cross section as a function of $ p_{\mathrm{T}} $ in $ |y| $ bins for data (points) and predictions (lines). The last bin in each panel is the overflow bin. Statistical (vertical bars) and systematic uncertainties (boxes) are shown separately. Lower vertical bars that would extend to log(zero) (long-dashed) have been truncated for clarity. The points from ALICE and LHCb have been slightly offset horizontally for clarity. The bottom panels show the ratios to the PYTHIA predictions in linear scale. |
png pdf |
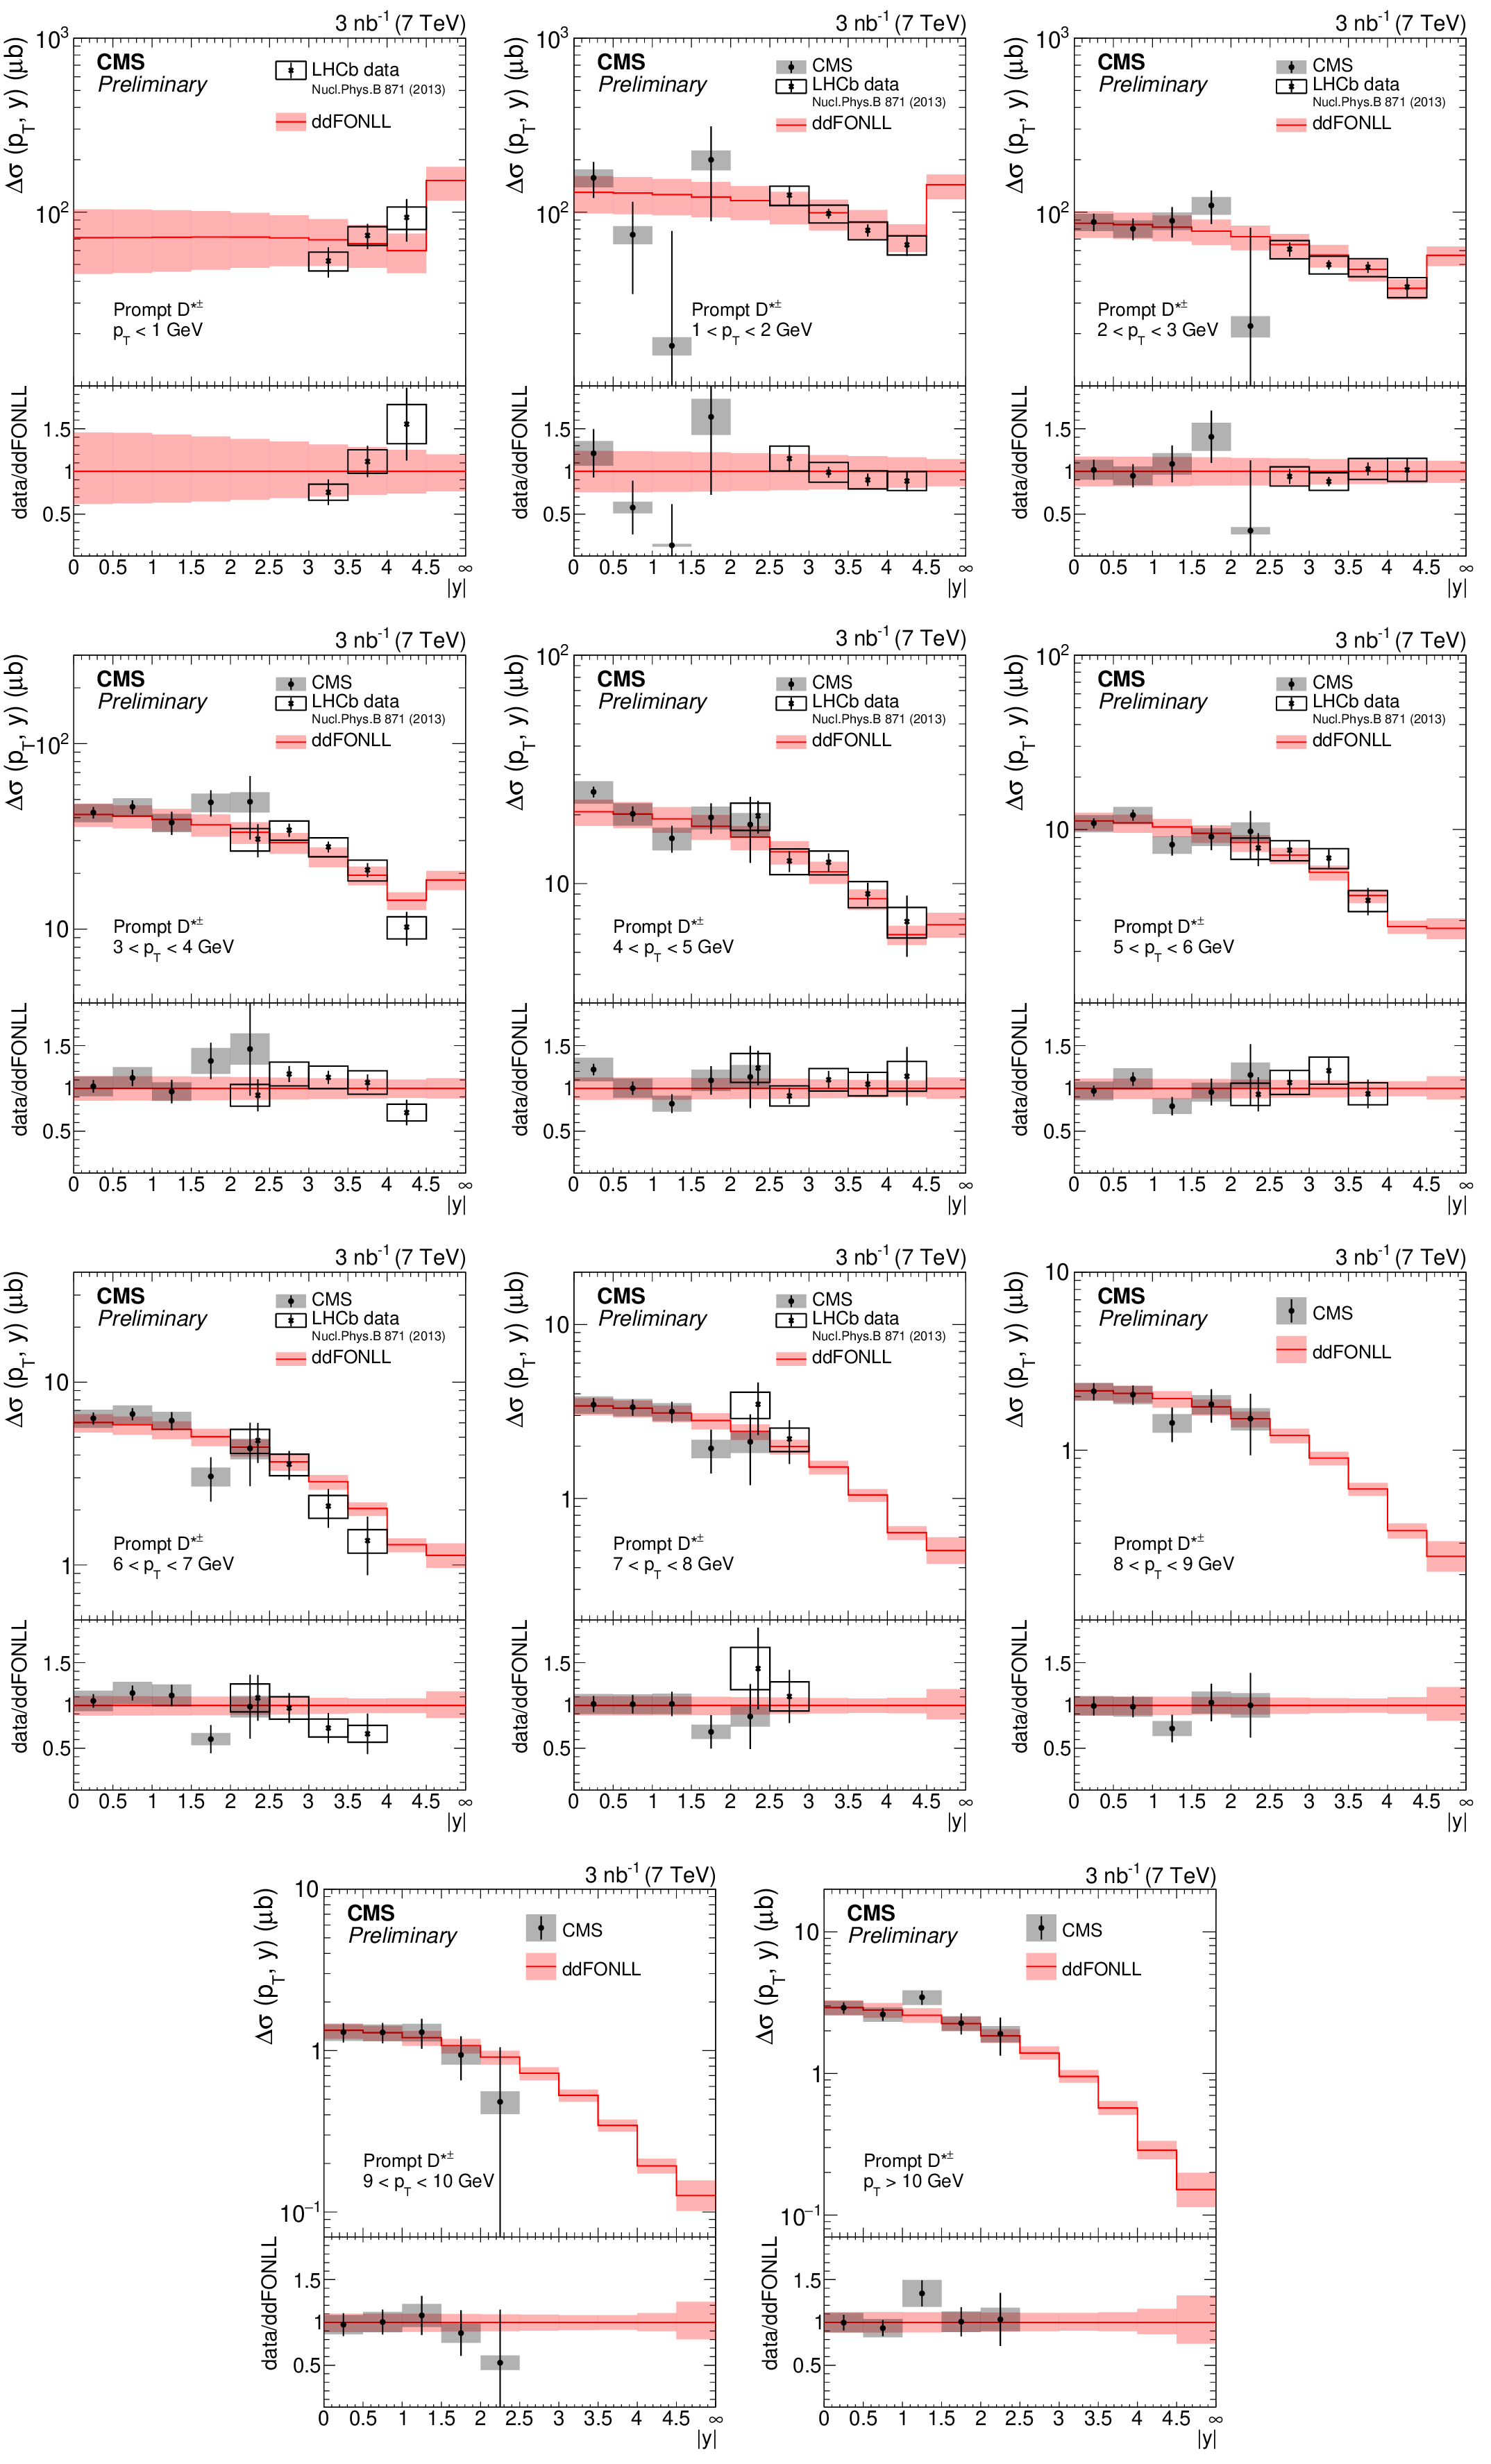
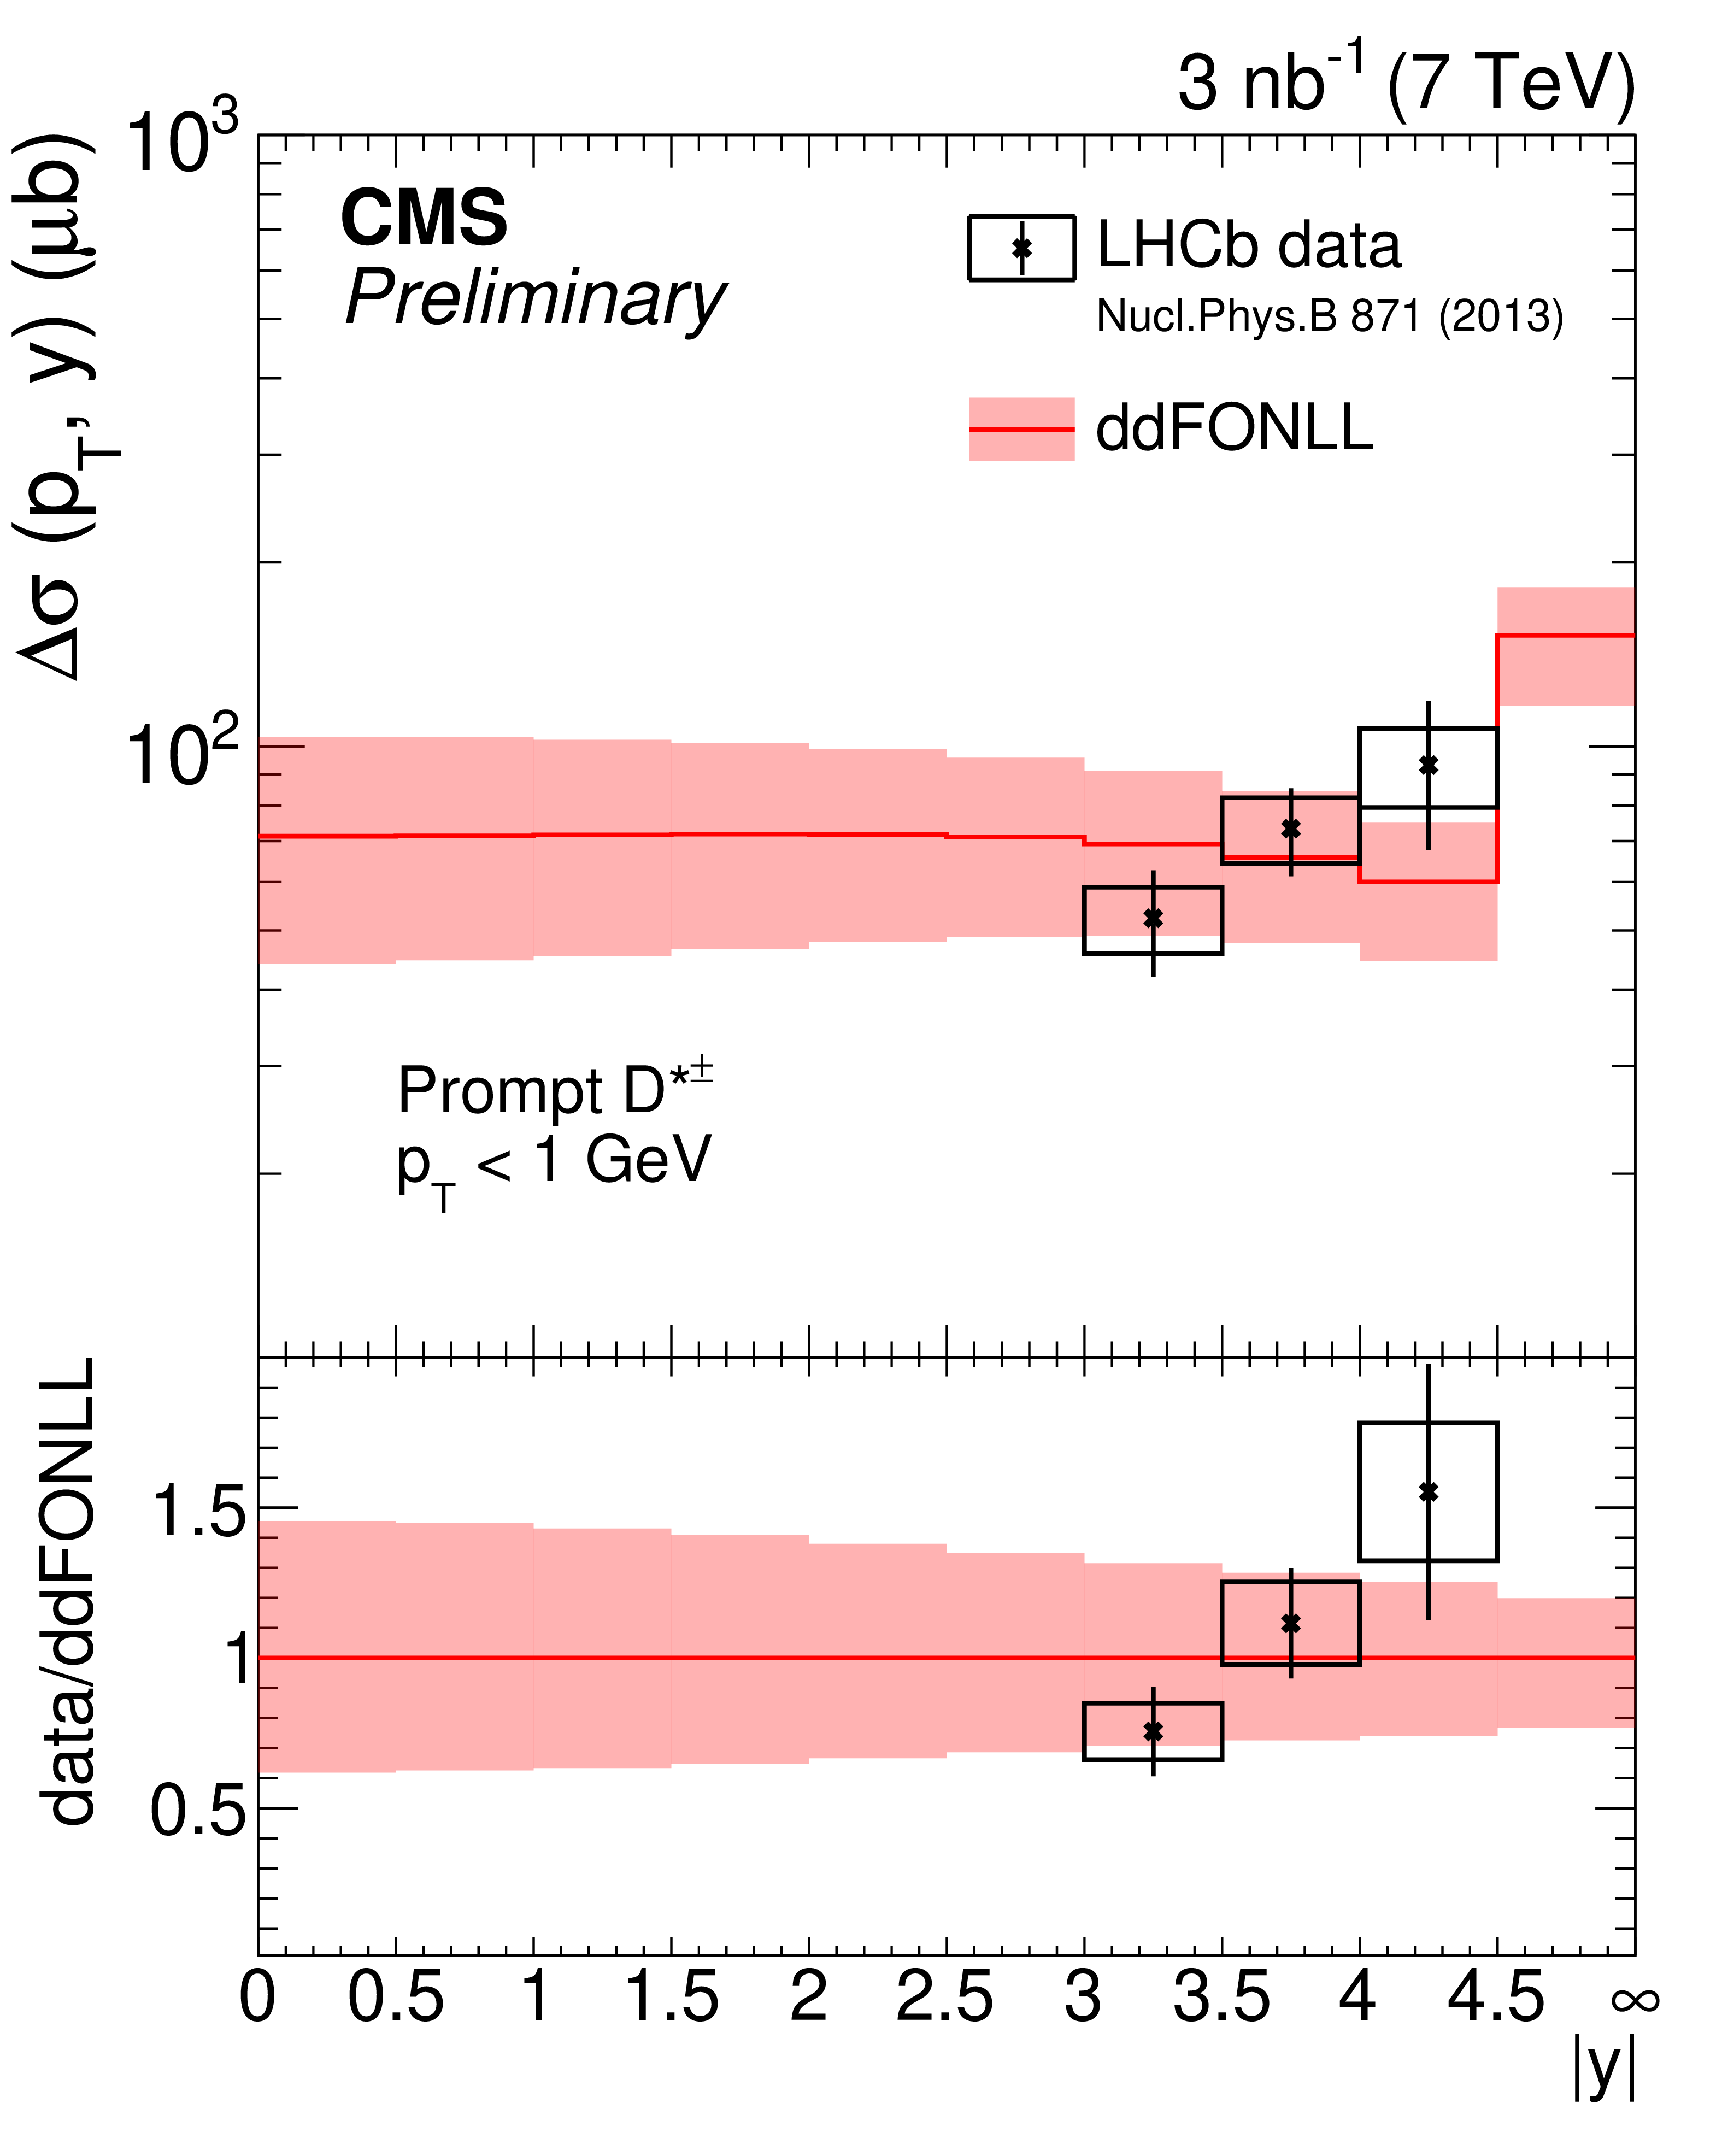
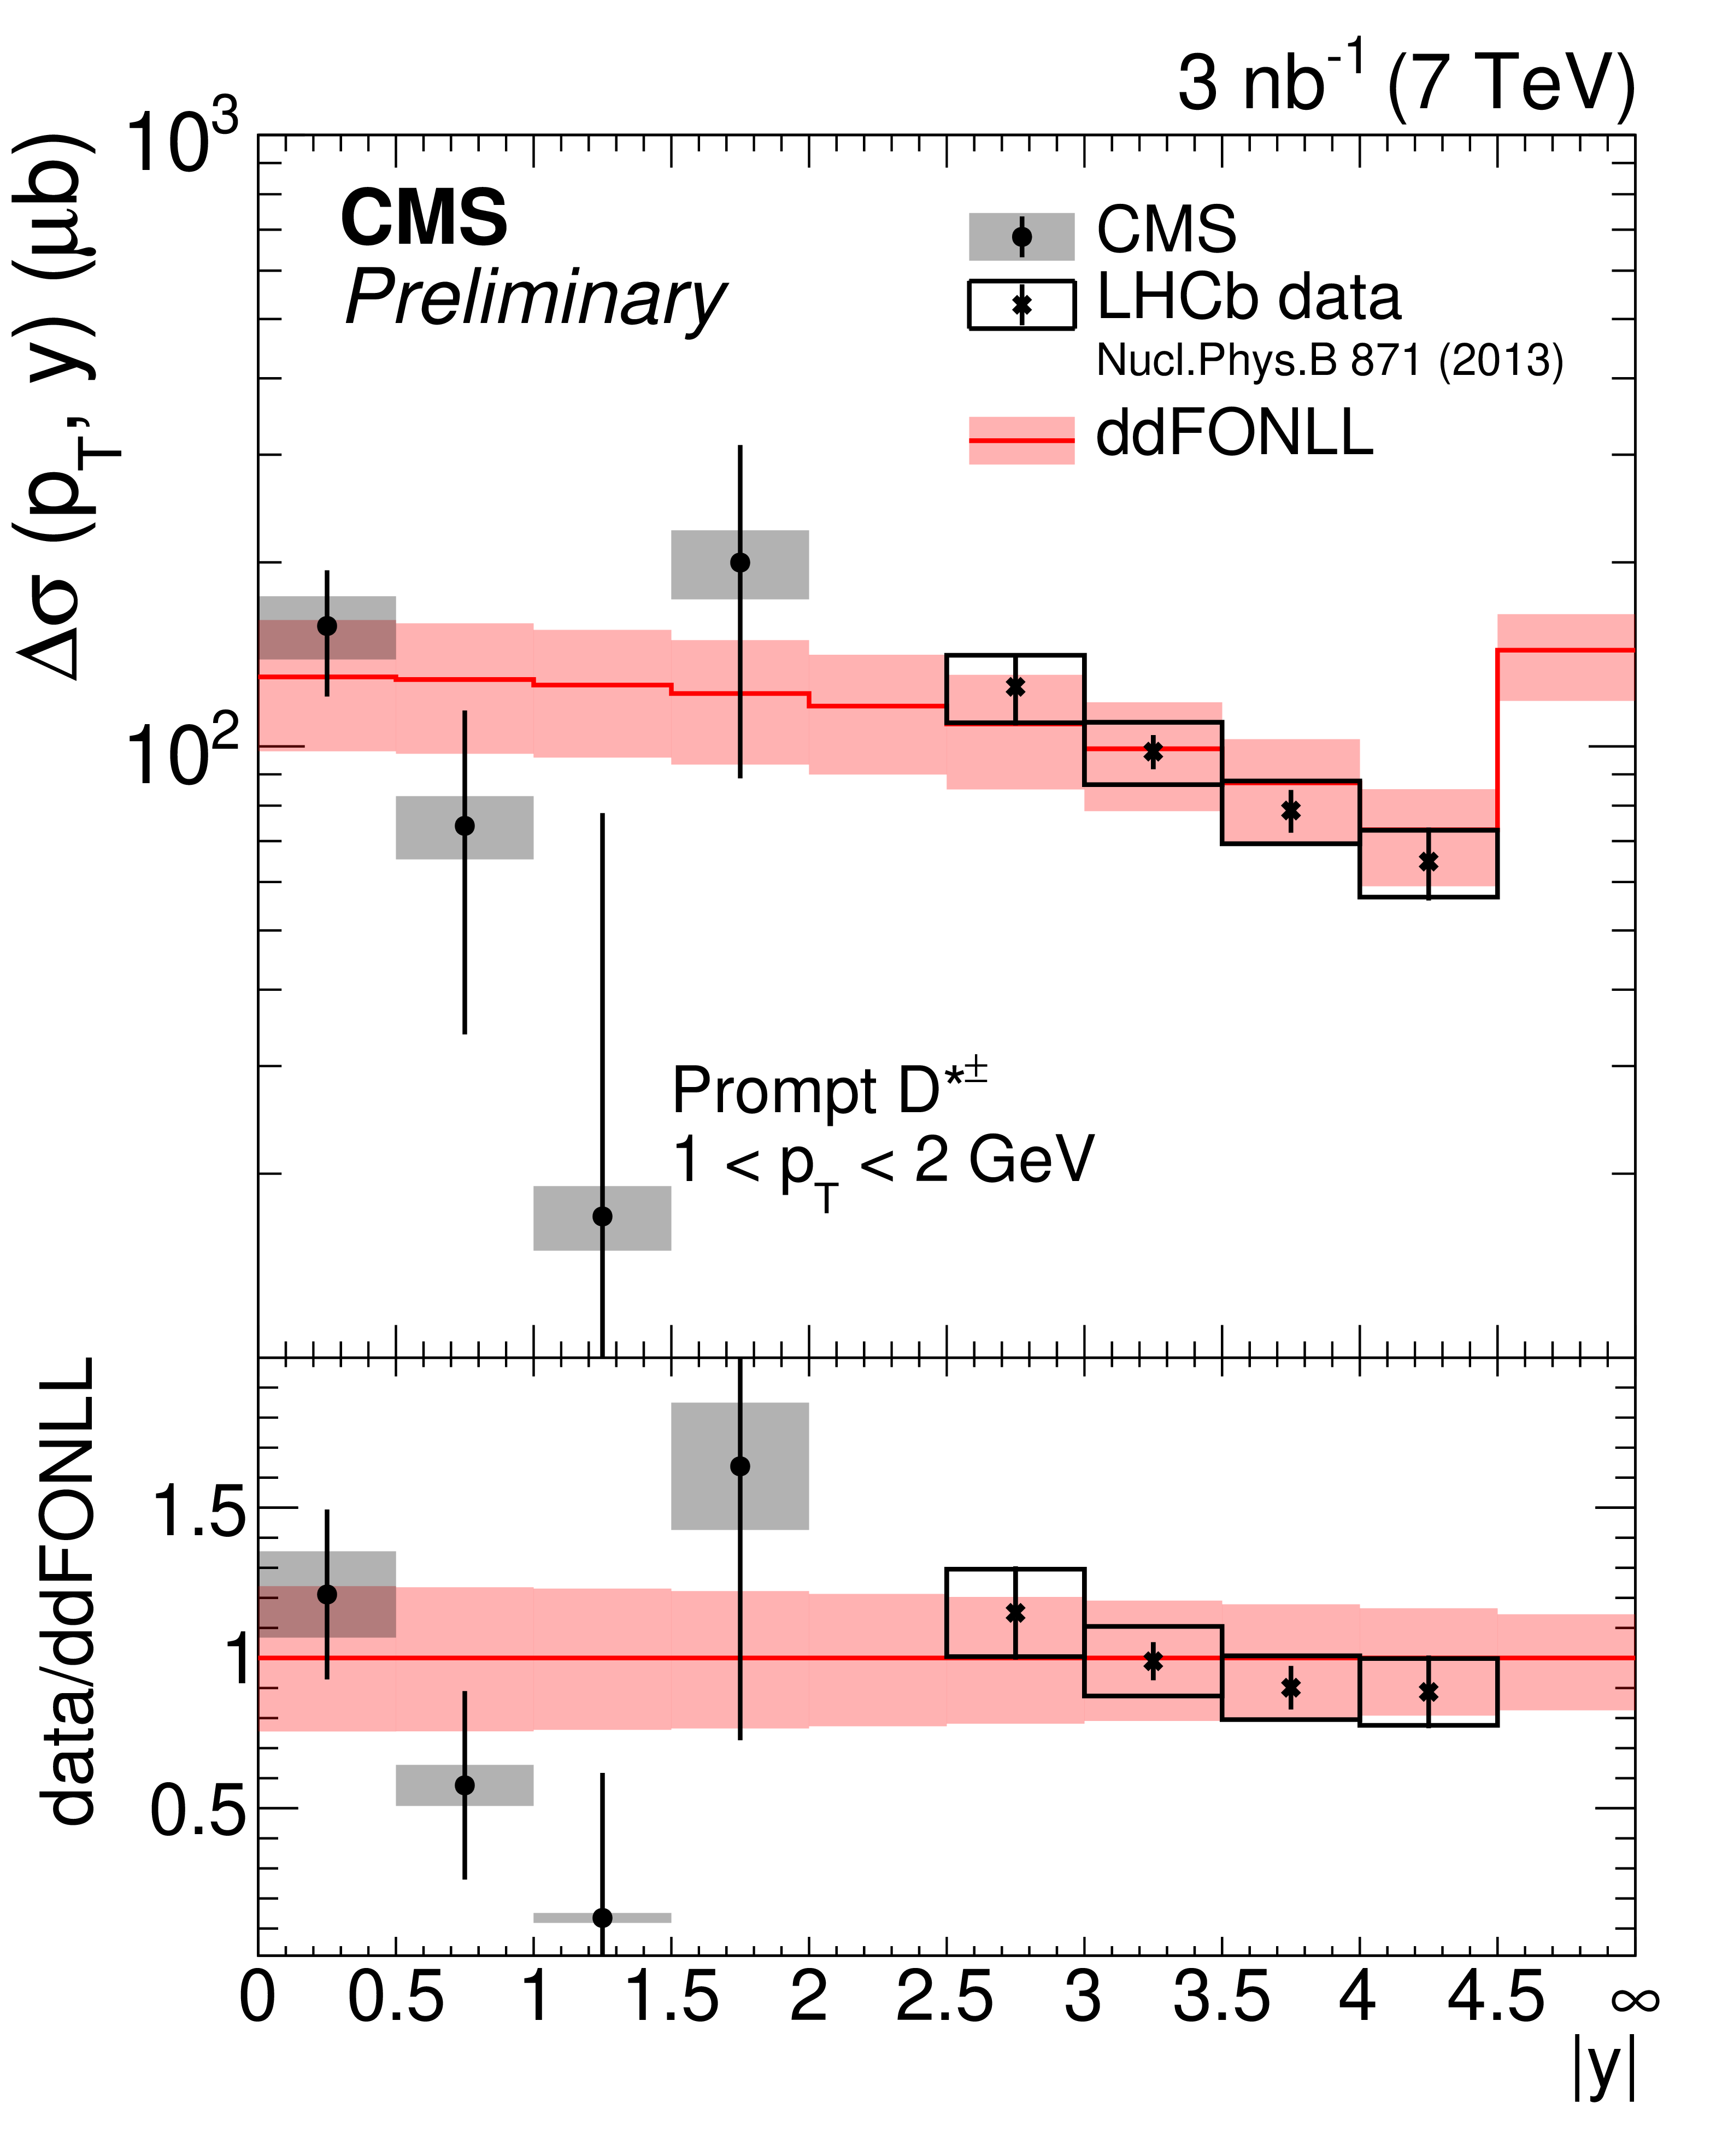
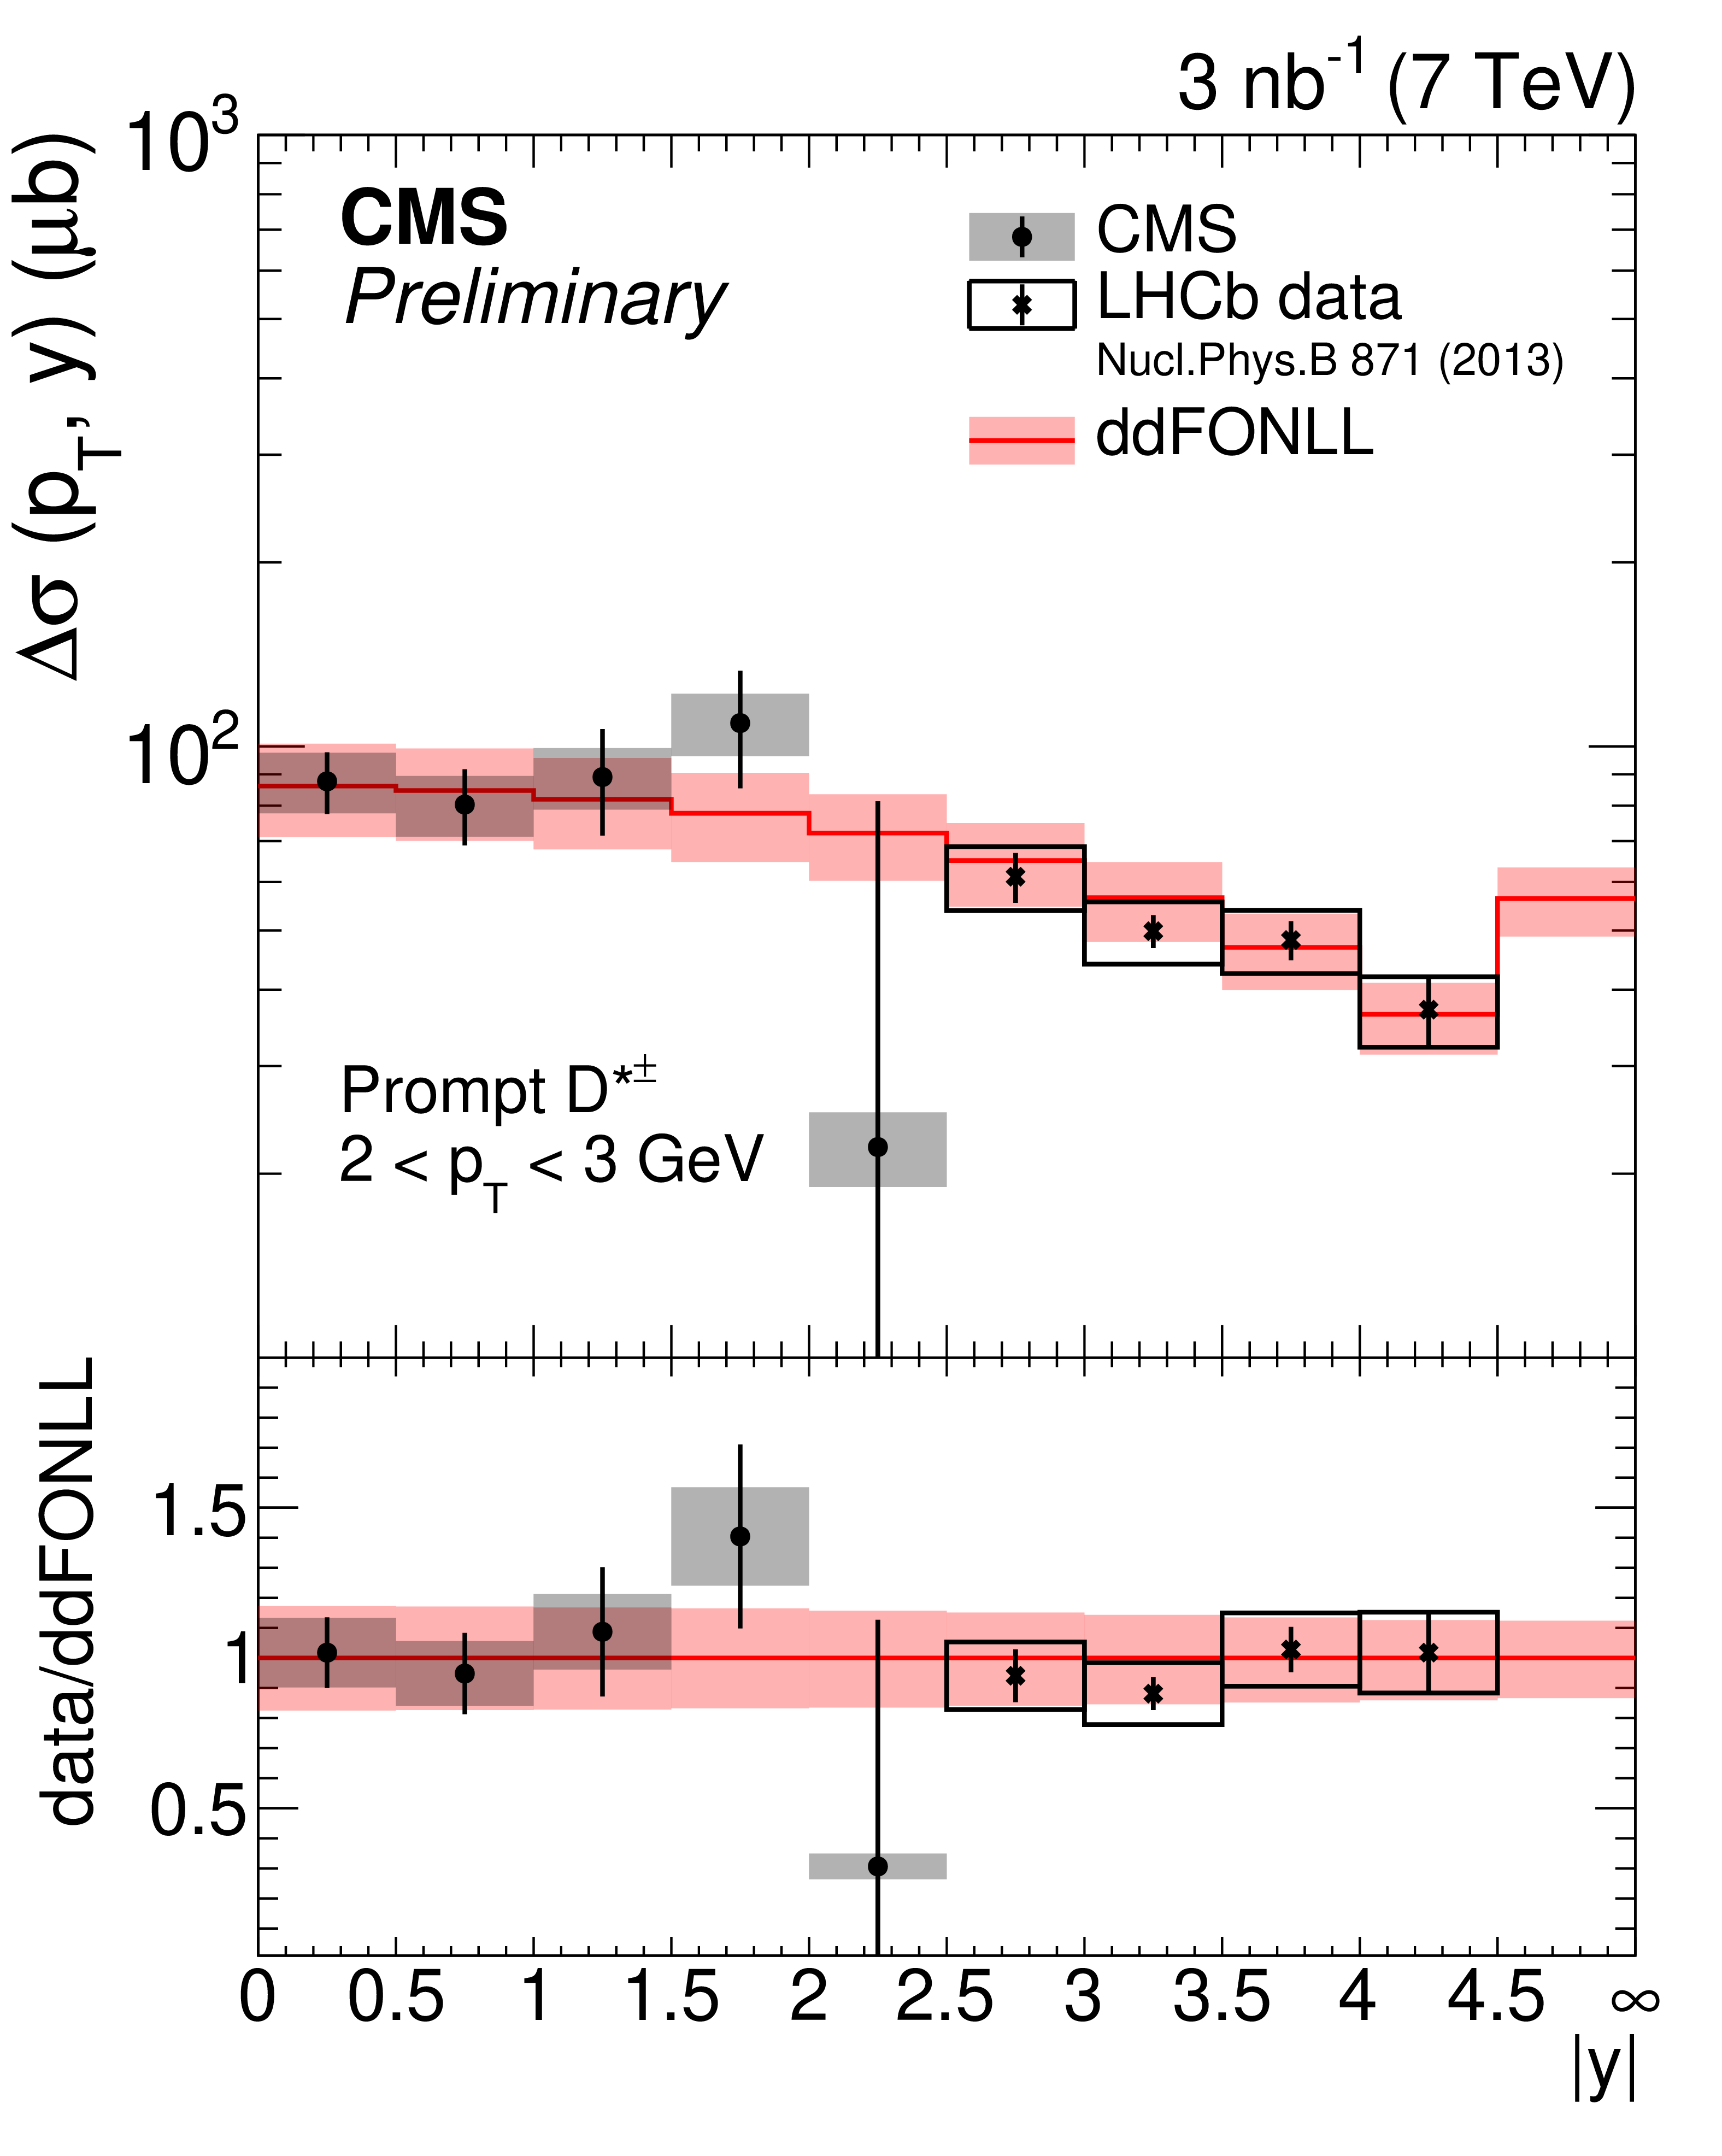
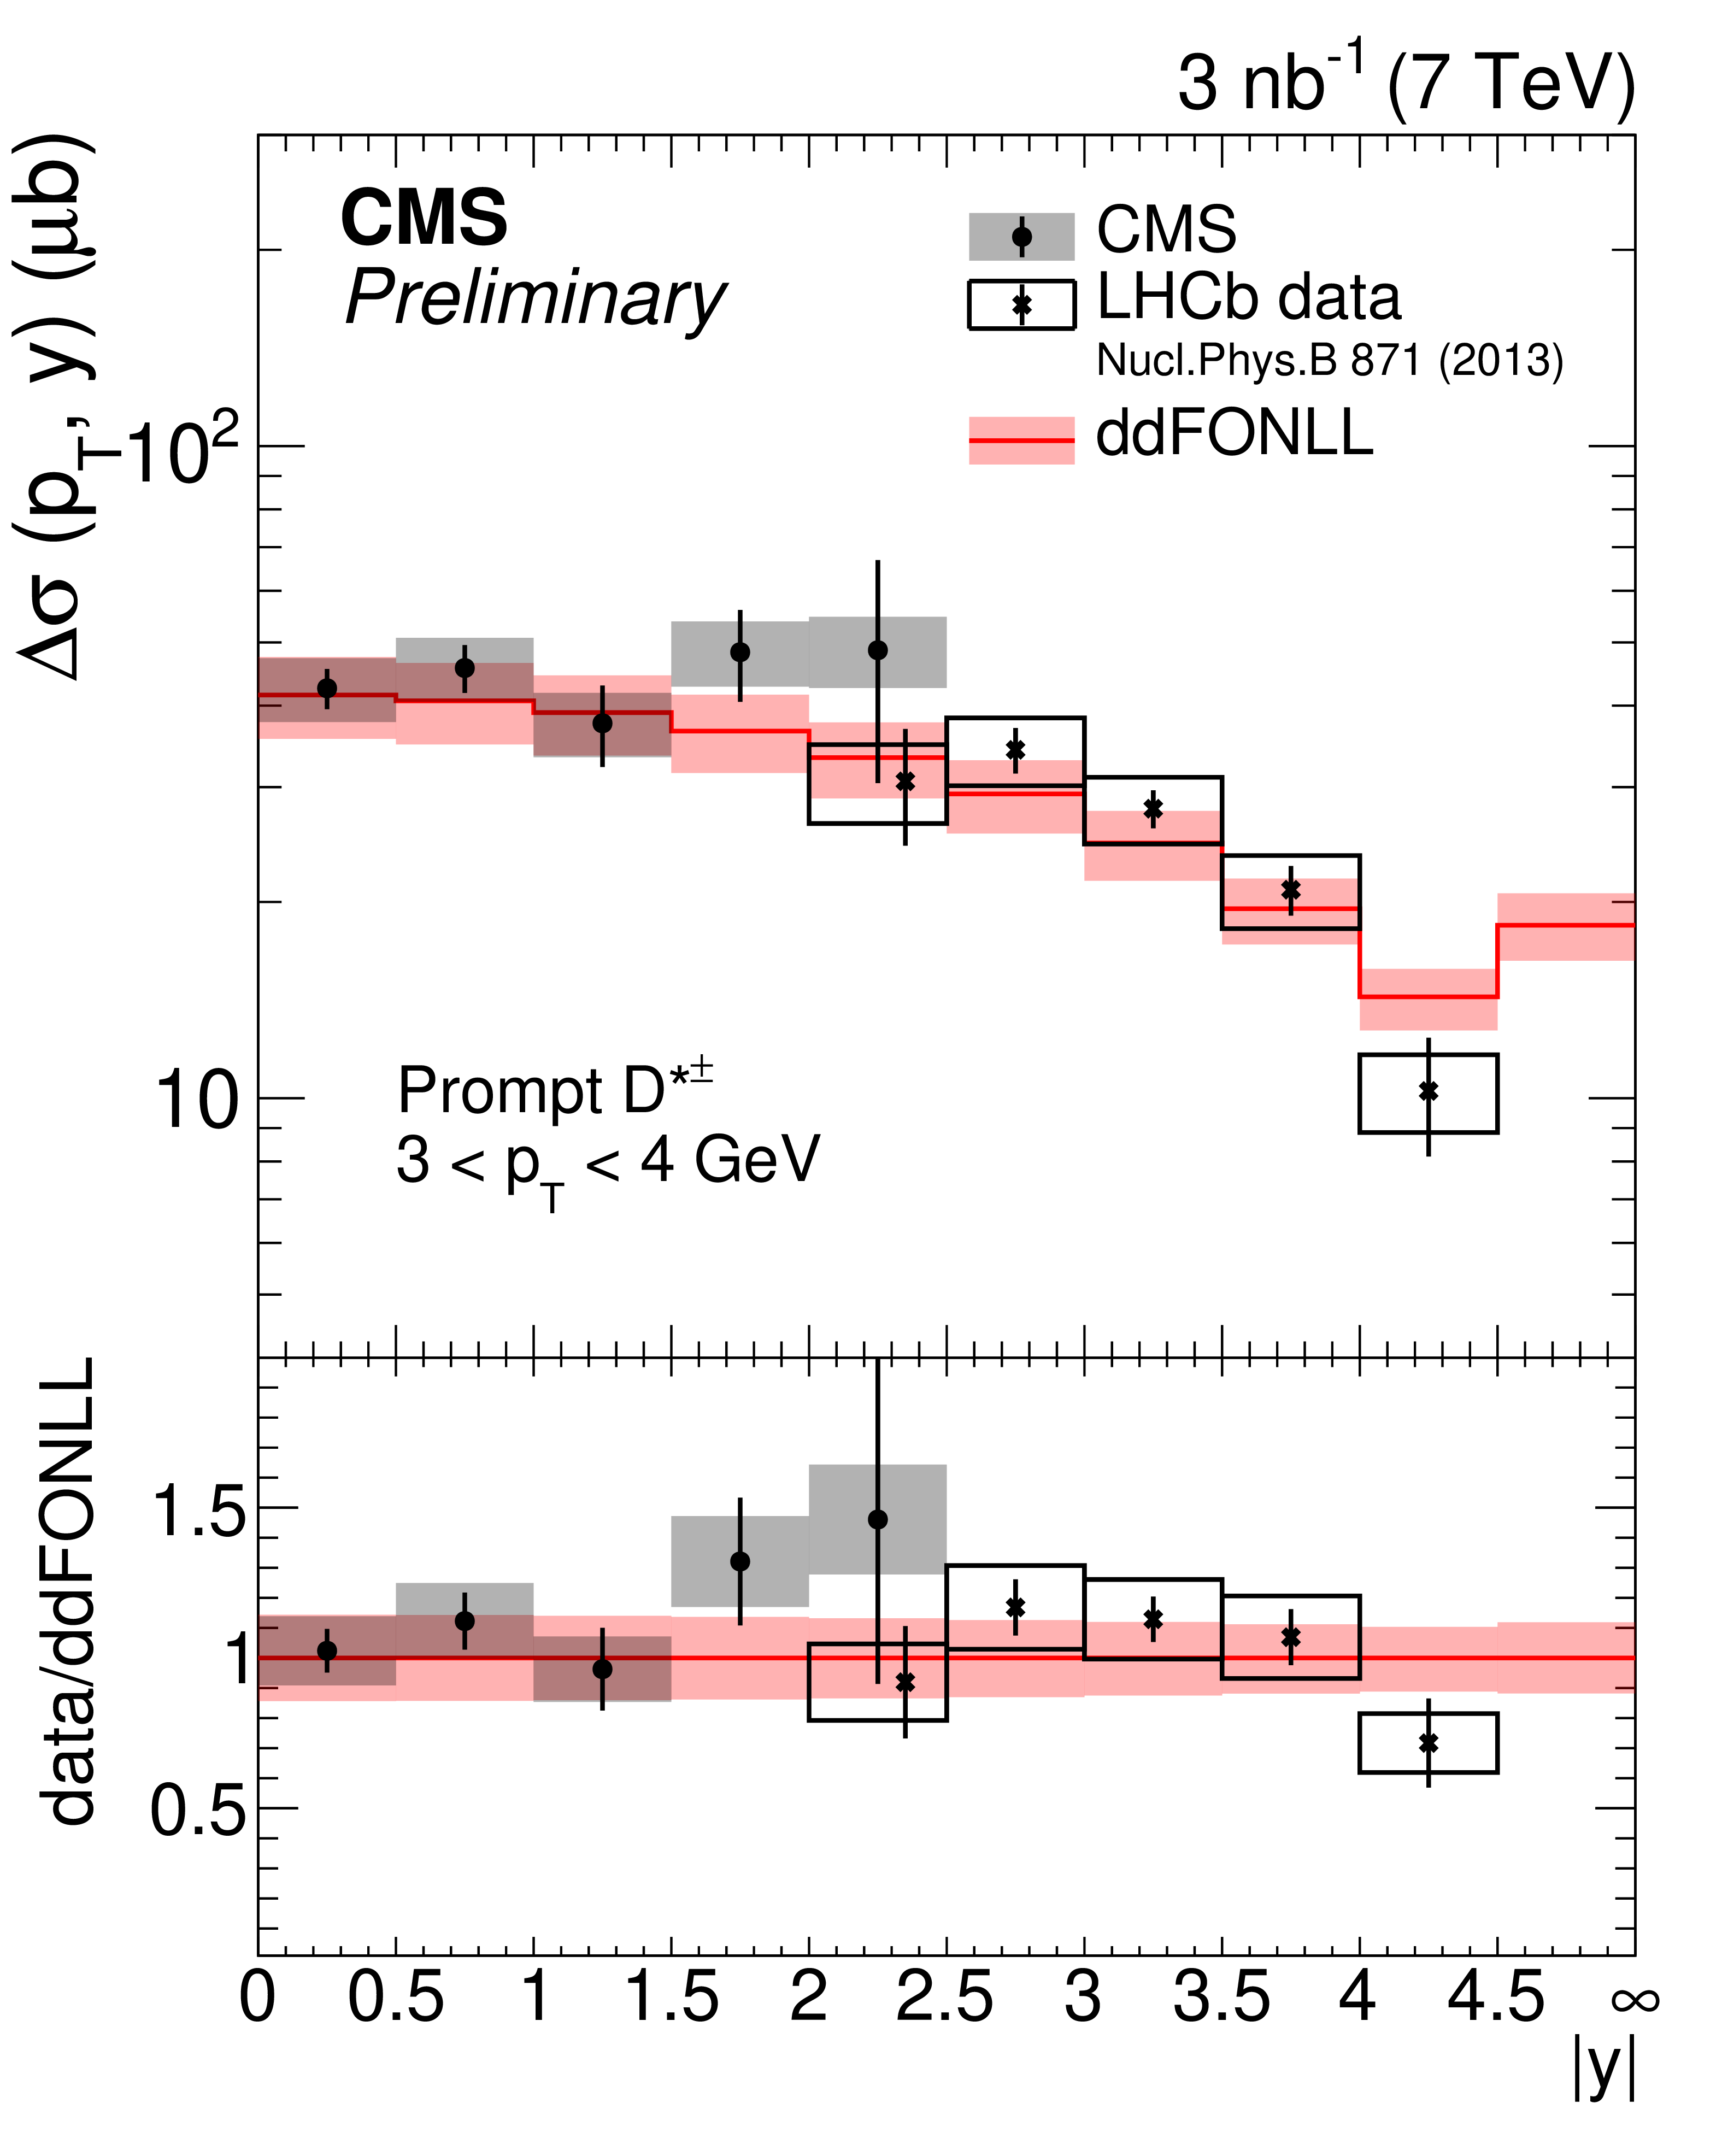
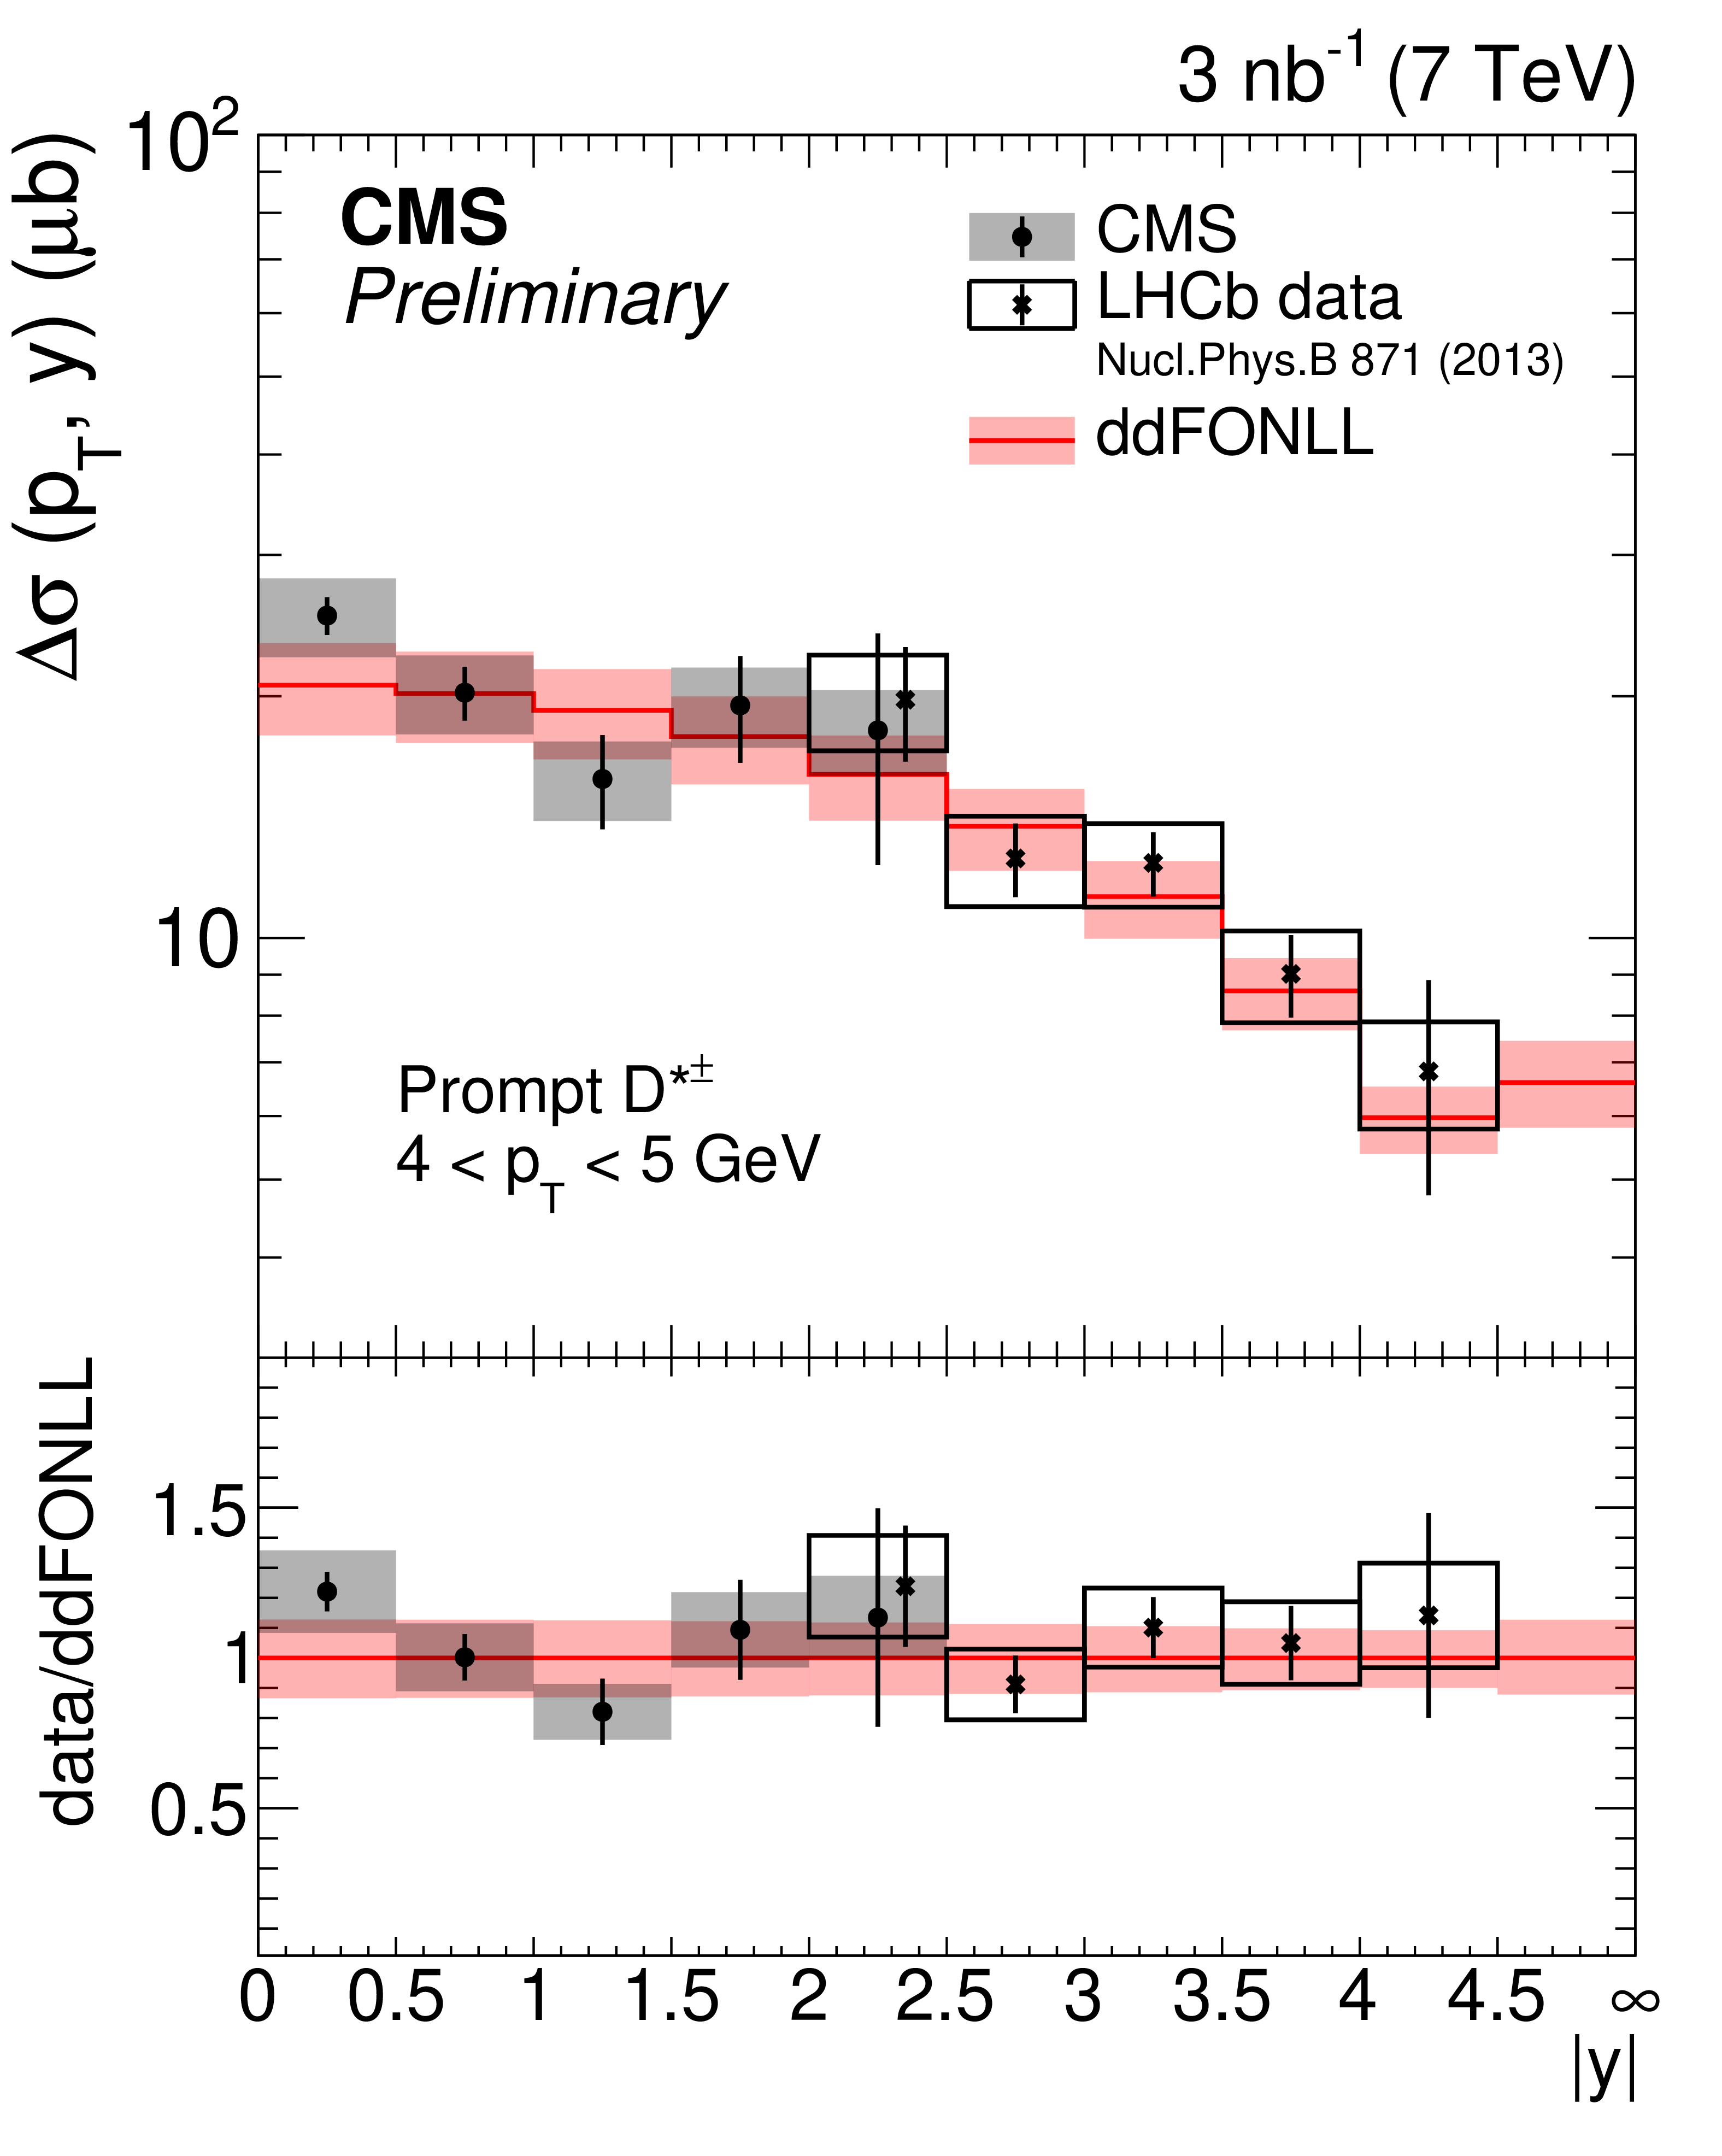
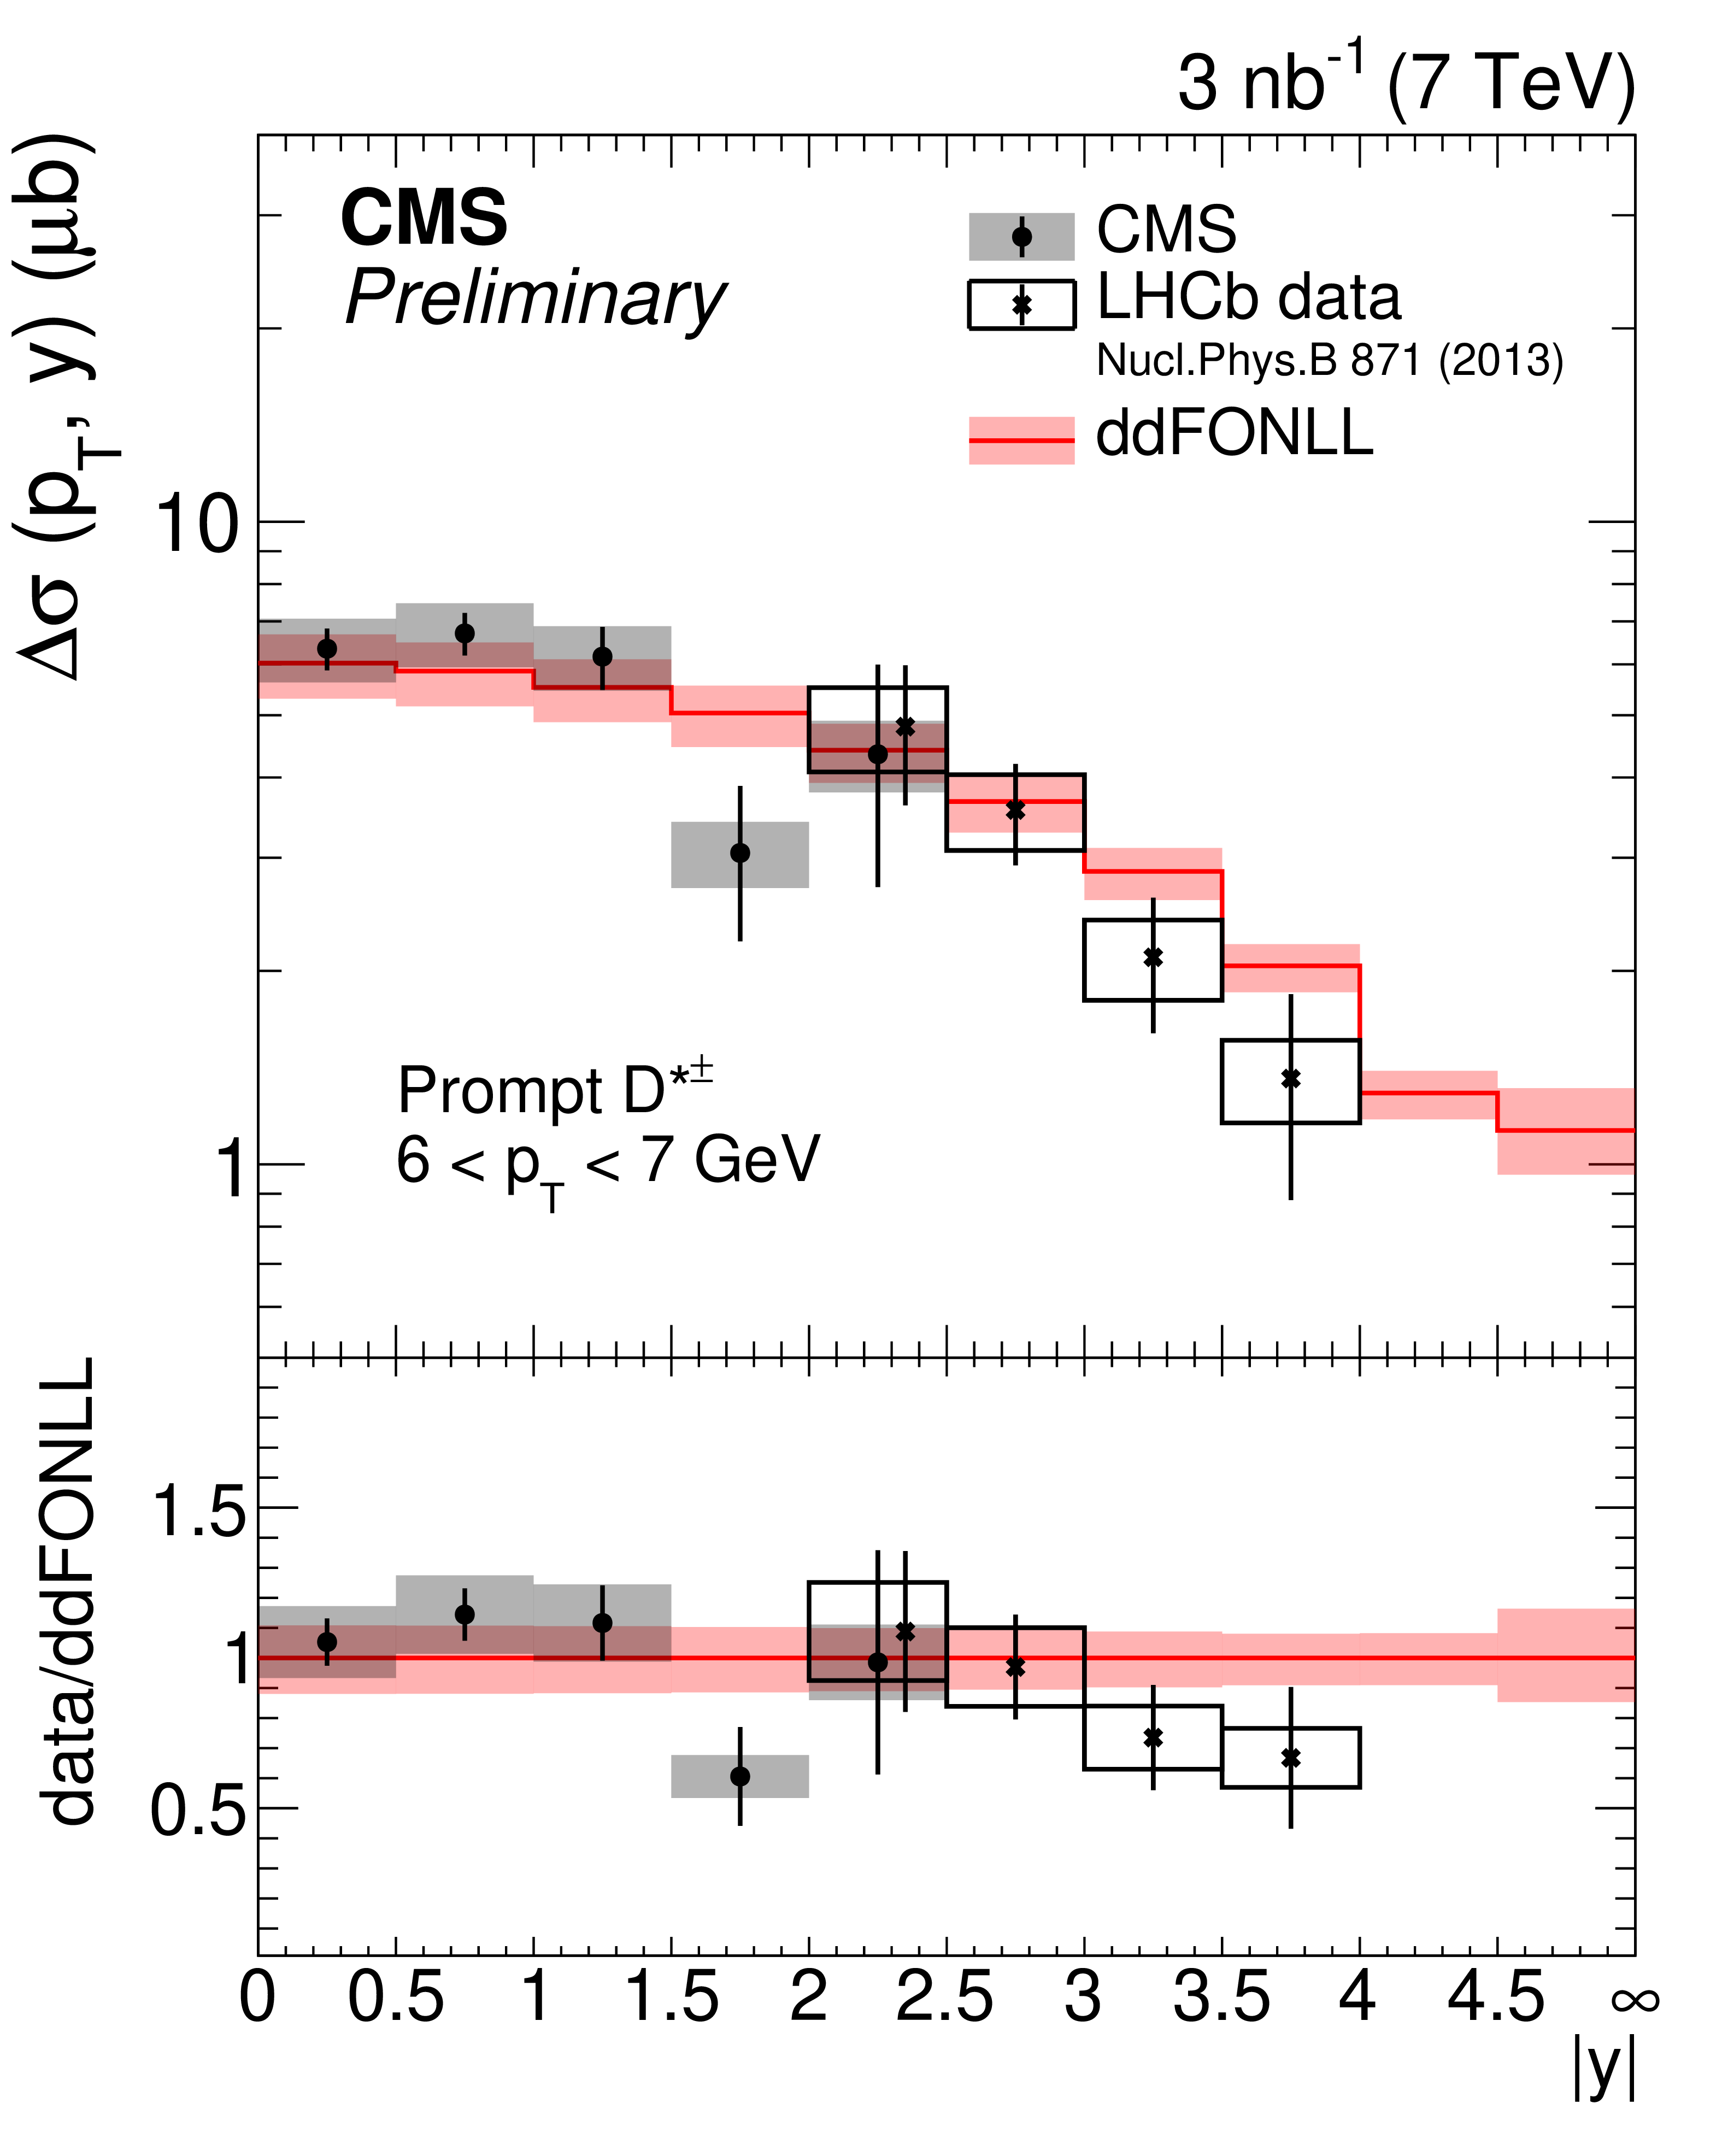
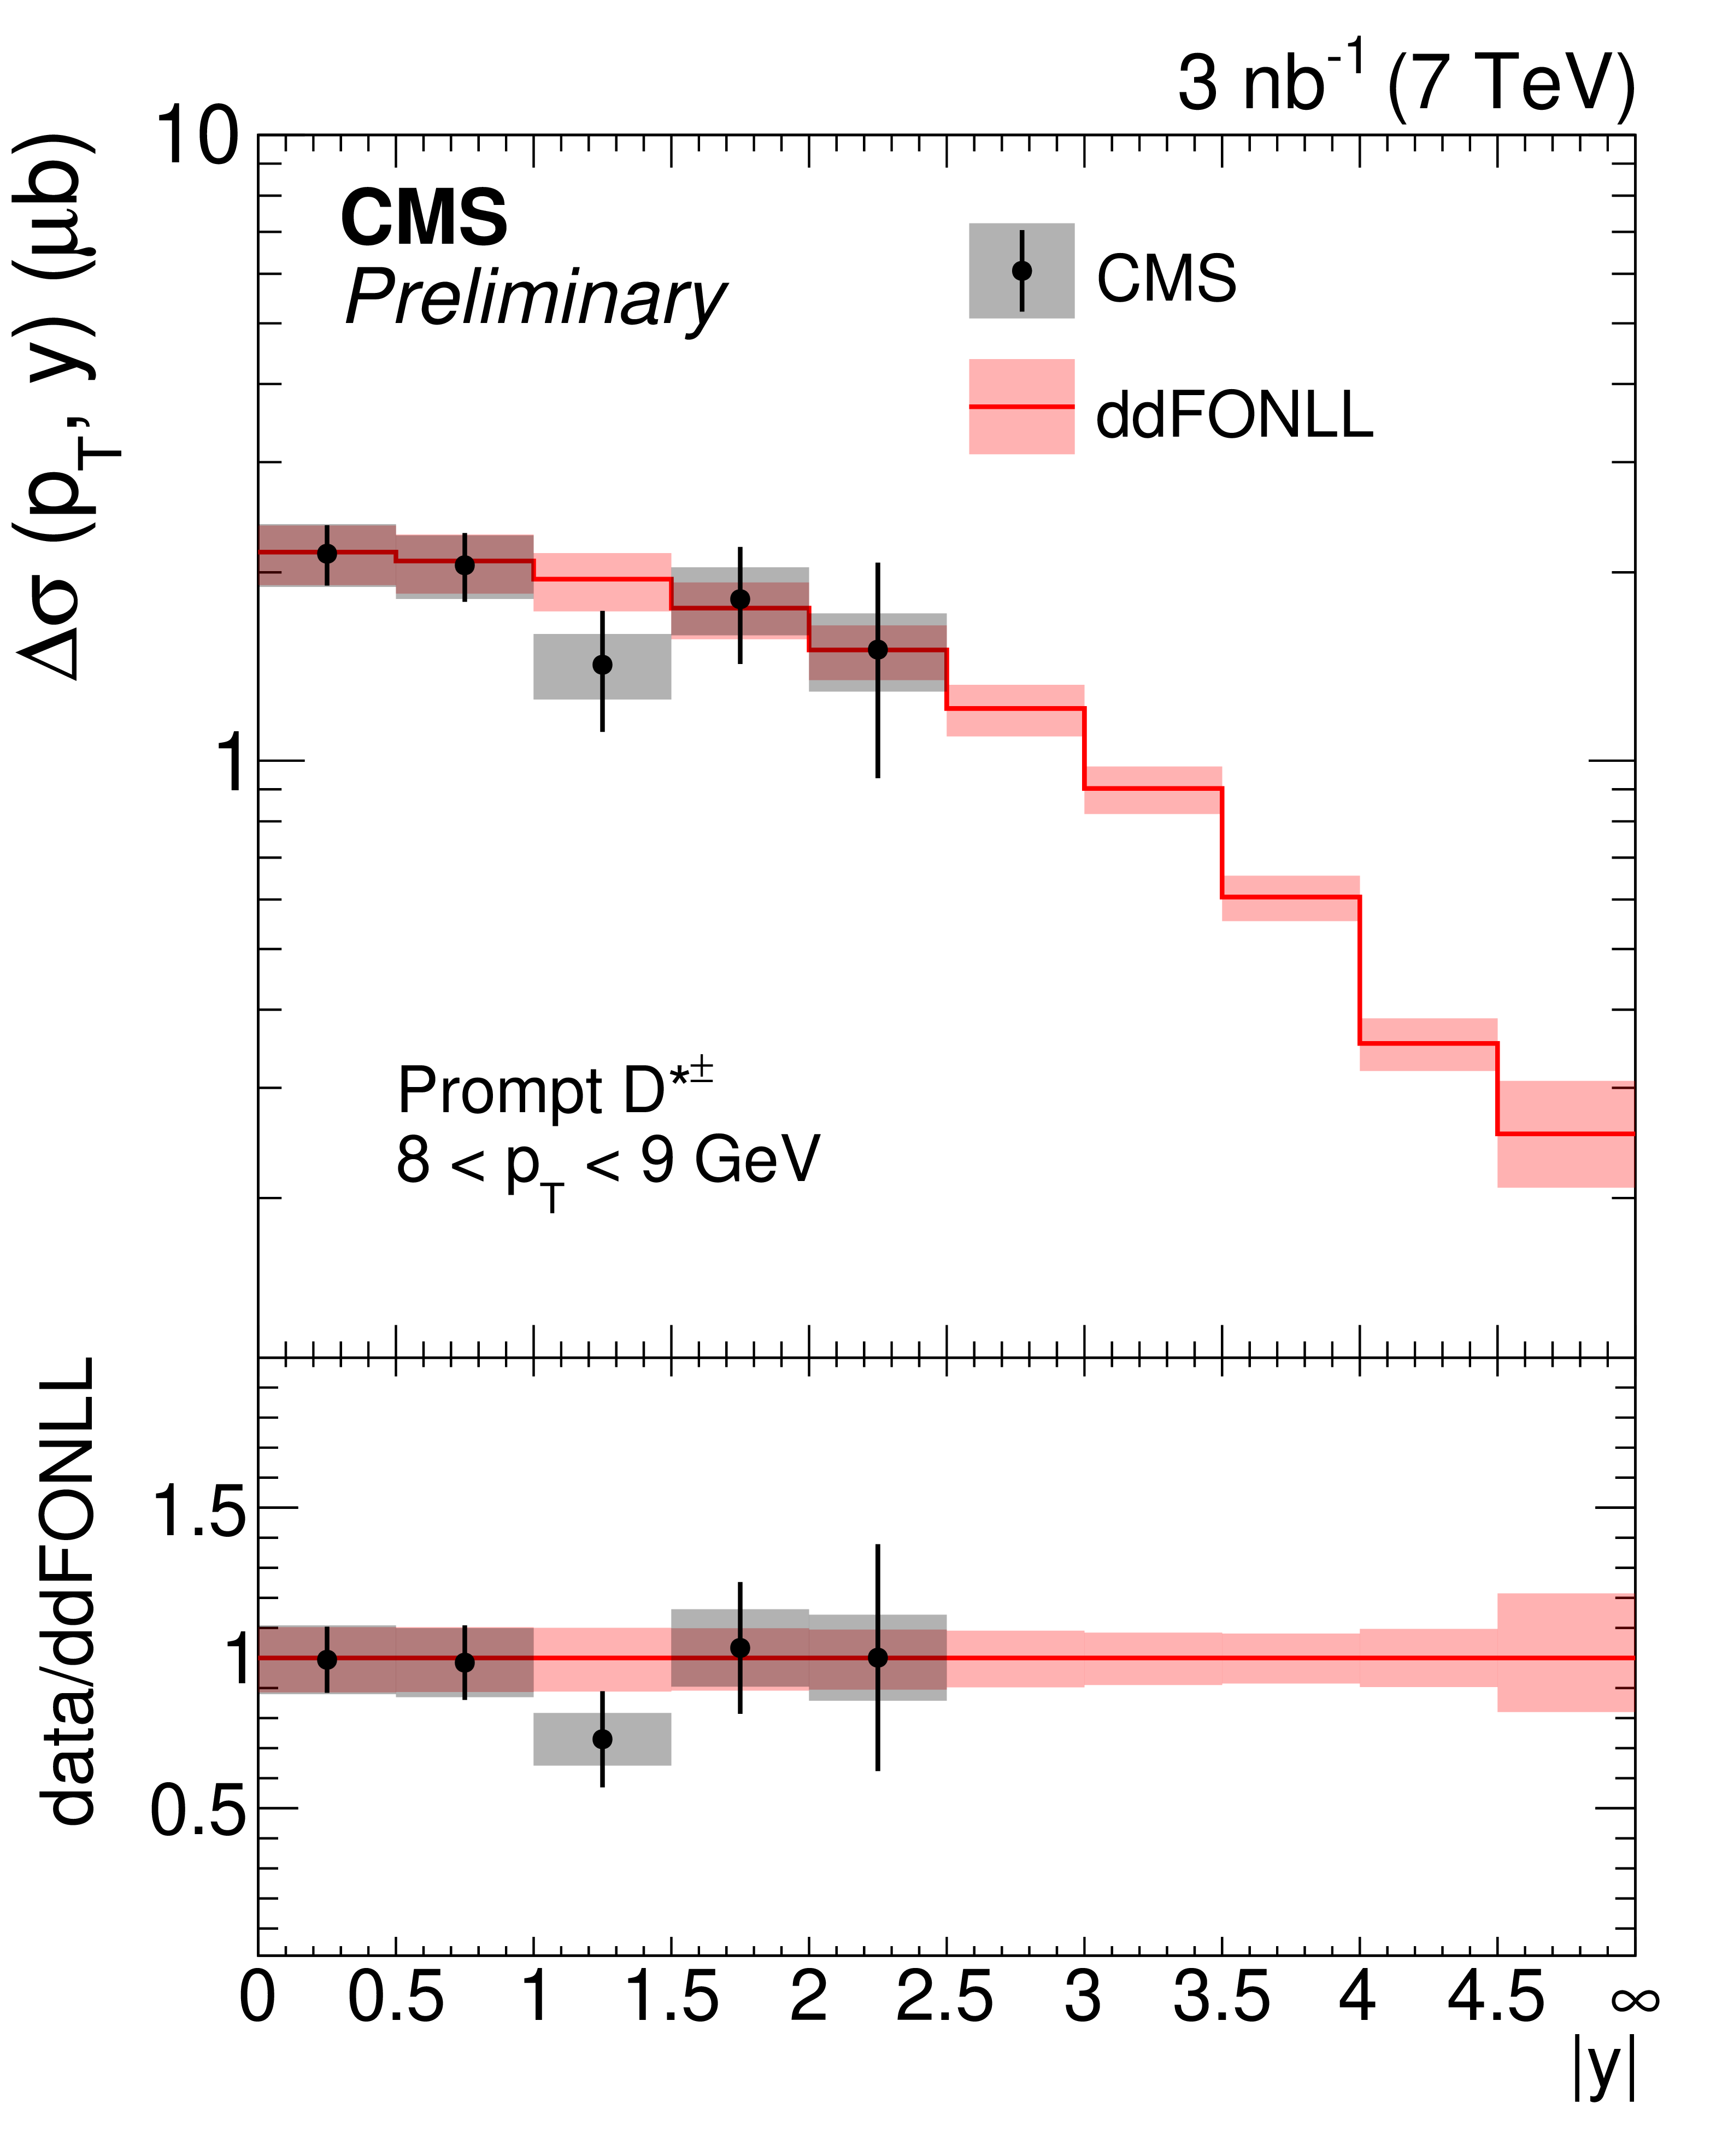
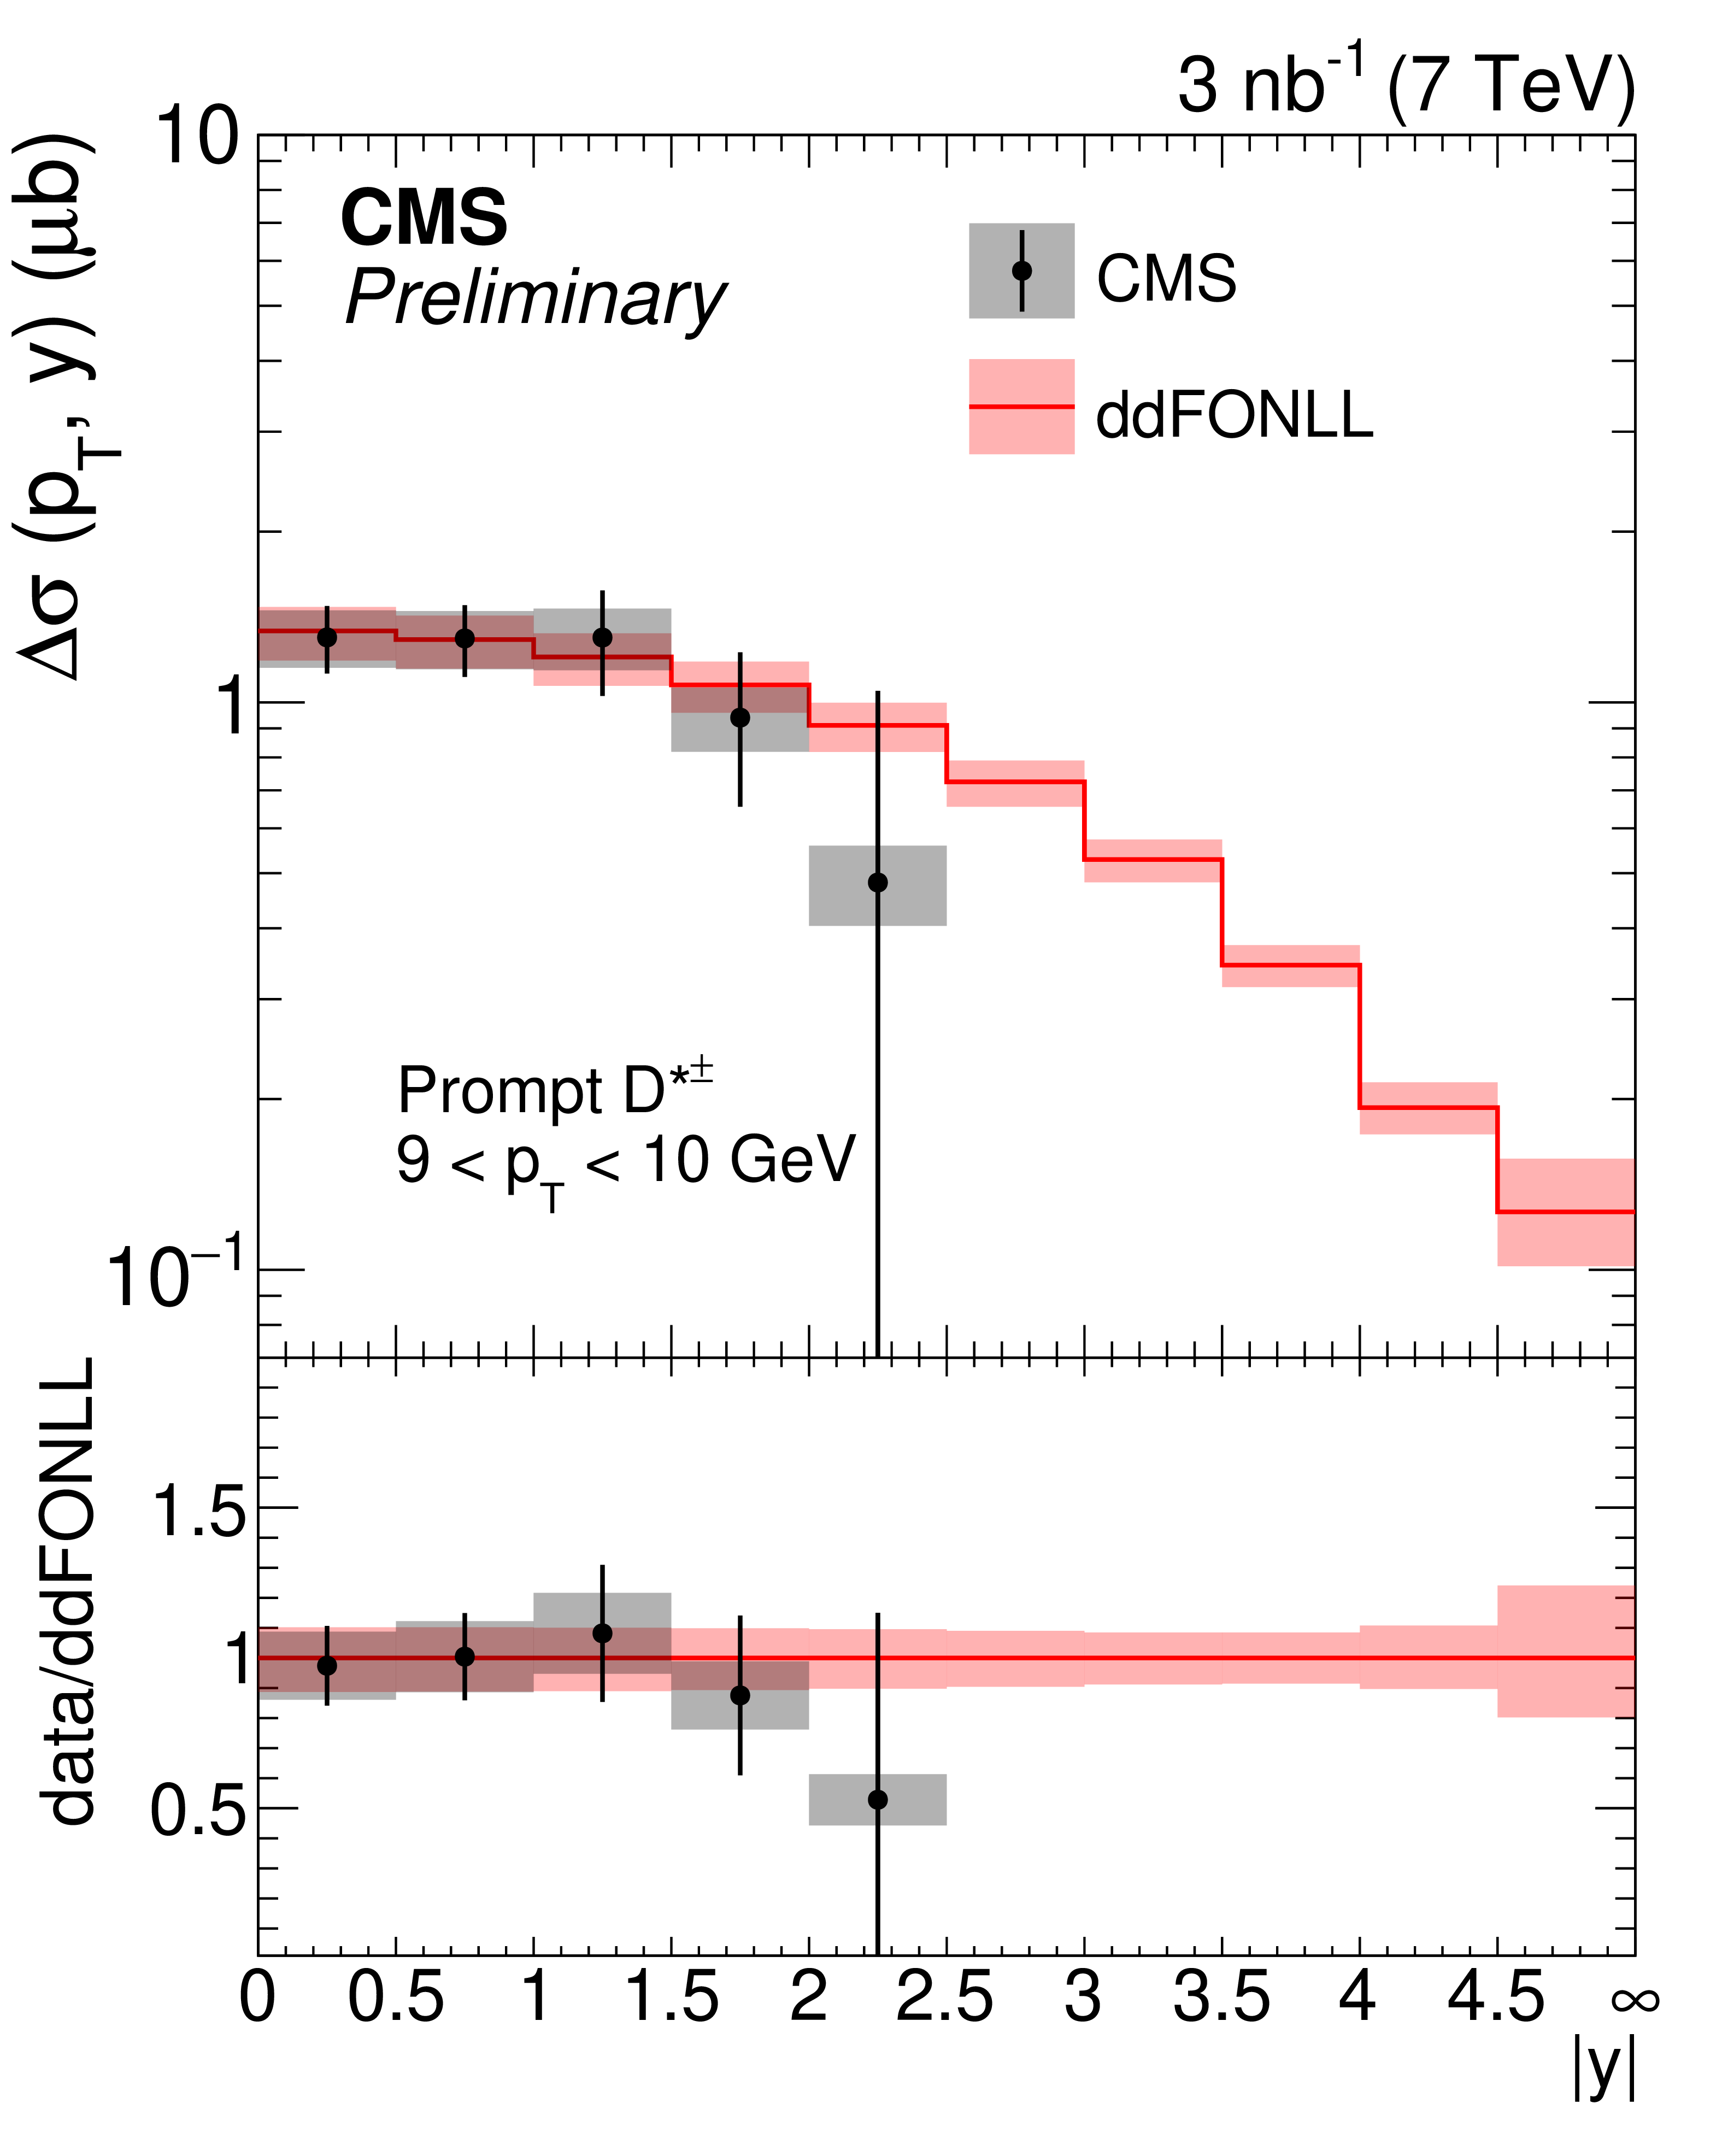
Figure 5:
$ \mathrm{D}^{*+}+\mathrm{D}^{*-} $ cross sections as a function $ |y| $ in bins of $ p_{\mathrm{T}} $. The symbols for the data are the same as in Fig. 4. The red bands are the data driven FONLL (ddFONLL), which describe the data (black points/grey boxes) well in the full phase space. The total uncertainty in the band includes the PDF uncertanties [47], the uncertainty in $ \tilde f $, as well as the $ \chi^2 $ scan uncertainties in the QCD parameters. The LHCb data are the double-differential version of those in Table 6. |
png pdf |
Figure 5-a:
$ \mathrm{D}^{*+}+\mathrm{D}^{*-} $ cross sections as a function $ |y| $ in bins of $ p_{\mathrm{T}} $. The symbols for the data are the same as in Fig. 4. The red bands are the data driven FONLL (ddFONLL), which describe the data (black points/grey boxes) well in the full phase space. The total uncertainty in the band includes the PDF uncertanties [47], the uncertainty in $ \tilde f $, as well as the $ \chi^2 $ scan uncertainties in the QCD parameters. The LHCb data are the double-differential version of those in Table 6. |
png pdf |
Figure 5-b:
$ \mathrm{D}^{*+}+\mathrm{D}^{*-} $ cross sections as a function $ |y| $ in bins of $ p_{\mathrm{T}} $. The symbols for the data are the same as in Fig. 4. The red bands are the data driven FONLL (ddFONLL), which describe the data (black points/grey boxes) well in the full phase space. The total uncertainty in the band includes the PDF uncertanties [47], the uncertainty in $ \tilde f $, as well as the $ \chi^2 $ scan uncertainties in the QCD parameters. The LHCb data are the double-differential version of those in Table 6. |
png pdf |
Figure 5-c:
$ \mathrm{D}^{*+}+\mathrm{D}^{*-} $ cross sections as a function $ |y| $ in bins of $ p_{\mathrm{T}} $. The symbols for the data are the same as in Fig. 4. The red bands are the data driven FONLL (ddFONLL), which describe the data (black points/grey boxes) well in the full phase space. The total uncertainty in the band includes the PDF uncertanties [47], the uncertainty in $ \tilde f $, as well as the $ \chi^2 $ scan uncertainties in the QCD parameters. The LHCb data are the double-differential version of those in Table 6. |
png pdf |
Figure 5-d:
$ \mathrm{D}^{*+}+\mathrm{D}^{*-} $ cross sections as a function $ |y| $ in bins of $ p_{\mathrm{T}} $. The symbols for the data are the same as in Fig. 4. The red bands are the data driven FONLL (ddFONLL), which describe the data (black points/grey boxes) well in the full phase space. The total uncertainty in the band includes the PDF uncertanties [47], the uncertainty in $ \tilde f $, as well as the $ \chi^2 $ scan uncertainties in the QCD parameters. The LHCb data are the double-differential version of those in Table 6. |
png pdf |
Figure 5-e:
$ \mathrm{D}^{*+}+\mathrm{D}^{*-} $ cross sections as a function $ |y| $ in bins of $ p_{\mathrm{T}} $. The symbols for the data are the same as in Fig. 4. The red bands are the data driven FONLL (ddFONLL), which describe the data (black points/grey boxes) well in the full phase space. The total uncertainty in the band includes the PDF uncertanties [47], the uncertainty in $ \tilde f $, as well as the $ \chi^2 $ scan uncertainties in the QCD parameters. The LHCb data are the double-differential version of those in Table 6. |

png pdf |
Figure 5-f:
$ \mathrm{D}^{*+}+\mathrm{D}^{*-} $ cross sections as a function $ |y| $ in bins of $ p_{\mathrm{T}} $. The symbols for the data are the same as in Fig. 4. The red bands are the data driven FONLL (ddFONLL), which describe the data (black points/grey boxes) well in the full phase space. The total uncertainty in the band includes the PDF uncertanties [47], the uncertainty in $ \tilde f $, as well as the $ \chi^2 $ scan uncertainties in the QCD parameters. The LHCb data are the double-differential version of those in Table 6. |
png pdf |
Figure 5-g:
$ \mathrm{D}^{*+}+\mathrm{D}^{*-} $ cross sections as a function $ |y| $ in bins of $ p_{\mathrm{T}} $. The symbols for the data are the same as in Fig. 4. The red bands are the data driven FONLL (ddFONLL), which describe the data (black points/grey boxes) well in the full phase space. The total uncertainty in the band includes the PDF uncertanties [47], the uncertainty in $ \tilde f $, as well as the $ \chi^2 $ scan uncertainties in the QCD parameters. The LHCb data are the double-differential version of those in Table 6. |

png pdf |
Figure 5-h:
$ \mathrm{D}^{*+}+\mathrm{D}^{*-} $ cross sections as a function $ |y| $ in bins of $ p_{\mathrm{T}} $. The symbols for the data are the same as in Fig. 4. The red bands are the data driven FONLL (ddFONLL), which describe the data (black points/grey boxes) well in the full phase space. The total uncertainty in the band includes the PDF uncertanties [47], the uncertainty in $ \tilde f $, as well as the $ \chi^2 $ scan uncertainties in the QCD parameters. The LHCb data are the double-differential version of those in Table 6. |
png pdf |
Figure 5-i:
$ \mathrm{D}^{*+}+\mathrm{D}^{*-} $ cross sections as a function $ |y| $ in bins of $ p_{\mathrm{T}} $. The symbols for the data are the same as in Fig. 4. The red bands are the data driven FONLL (ddFONLL), which describe the data (black points/grey boxes) well in the full phase space. The total uncertainty in the band includes the PDF uncertanties [47], the uncertainty in $ \tilde f $, as well as the $ \chi^2 $ scan uncertainties in the QCD parameters. The LHCb data are the double-differential version of those in Table 6. |
png pdf |
Figure 5-j:
$ \mathrm{D}^{*+}+\mathrm{D}^{*-} $ cross sections as a function $ |y| $ in bins of $ p_{\mathrm{T}} $. The symbols for the data are the same as in Fig. 4. The red bands are the data driven FONLL (ddFONLL), which describe the data (black points/grey boxes) well in the full phase space. The total uncertainty in the band includes the PDF uncertanties [47], the uncertainty in $ \tilde f $, as well as the $ \chi^2 $ scan uncertainties in the QCD parameters. The LHCb data are the double-differential version of those in Table 6. |

png pdf |
Figure 5-k:
$ \mathrm{D}^{*+}+\mathrm{D}^{*-} $ cross sections as a function $ |y| $ in bins of $ p_{\mathrm{T}} $. The symbols for the data are the same as in Fig. 4. The red bands are the data driven FONLL (ddFONLL), which describe the data (black points/grey boxes) well in the full phase space. The total uncertainty in the band includes the PDF uncertanties [47], the uncertainty in $ \tilde f $, as well as the $ \chi^2 $ scan uncertainties in the QCD parameters. The LHCb data are the double-differential version of those in Table 6. |
png pdf |
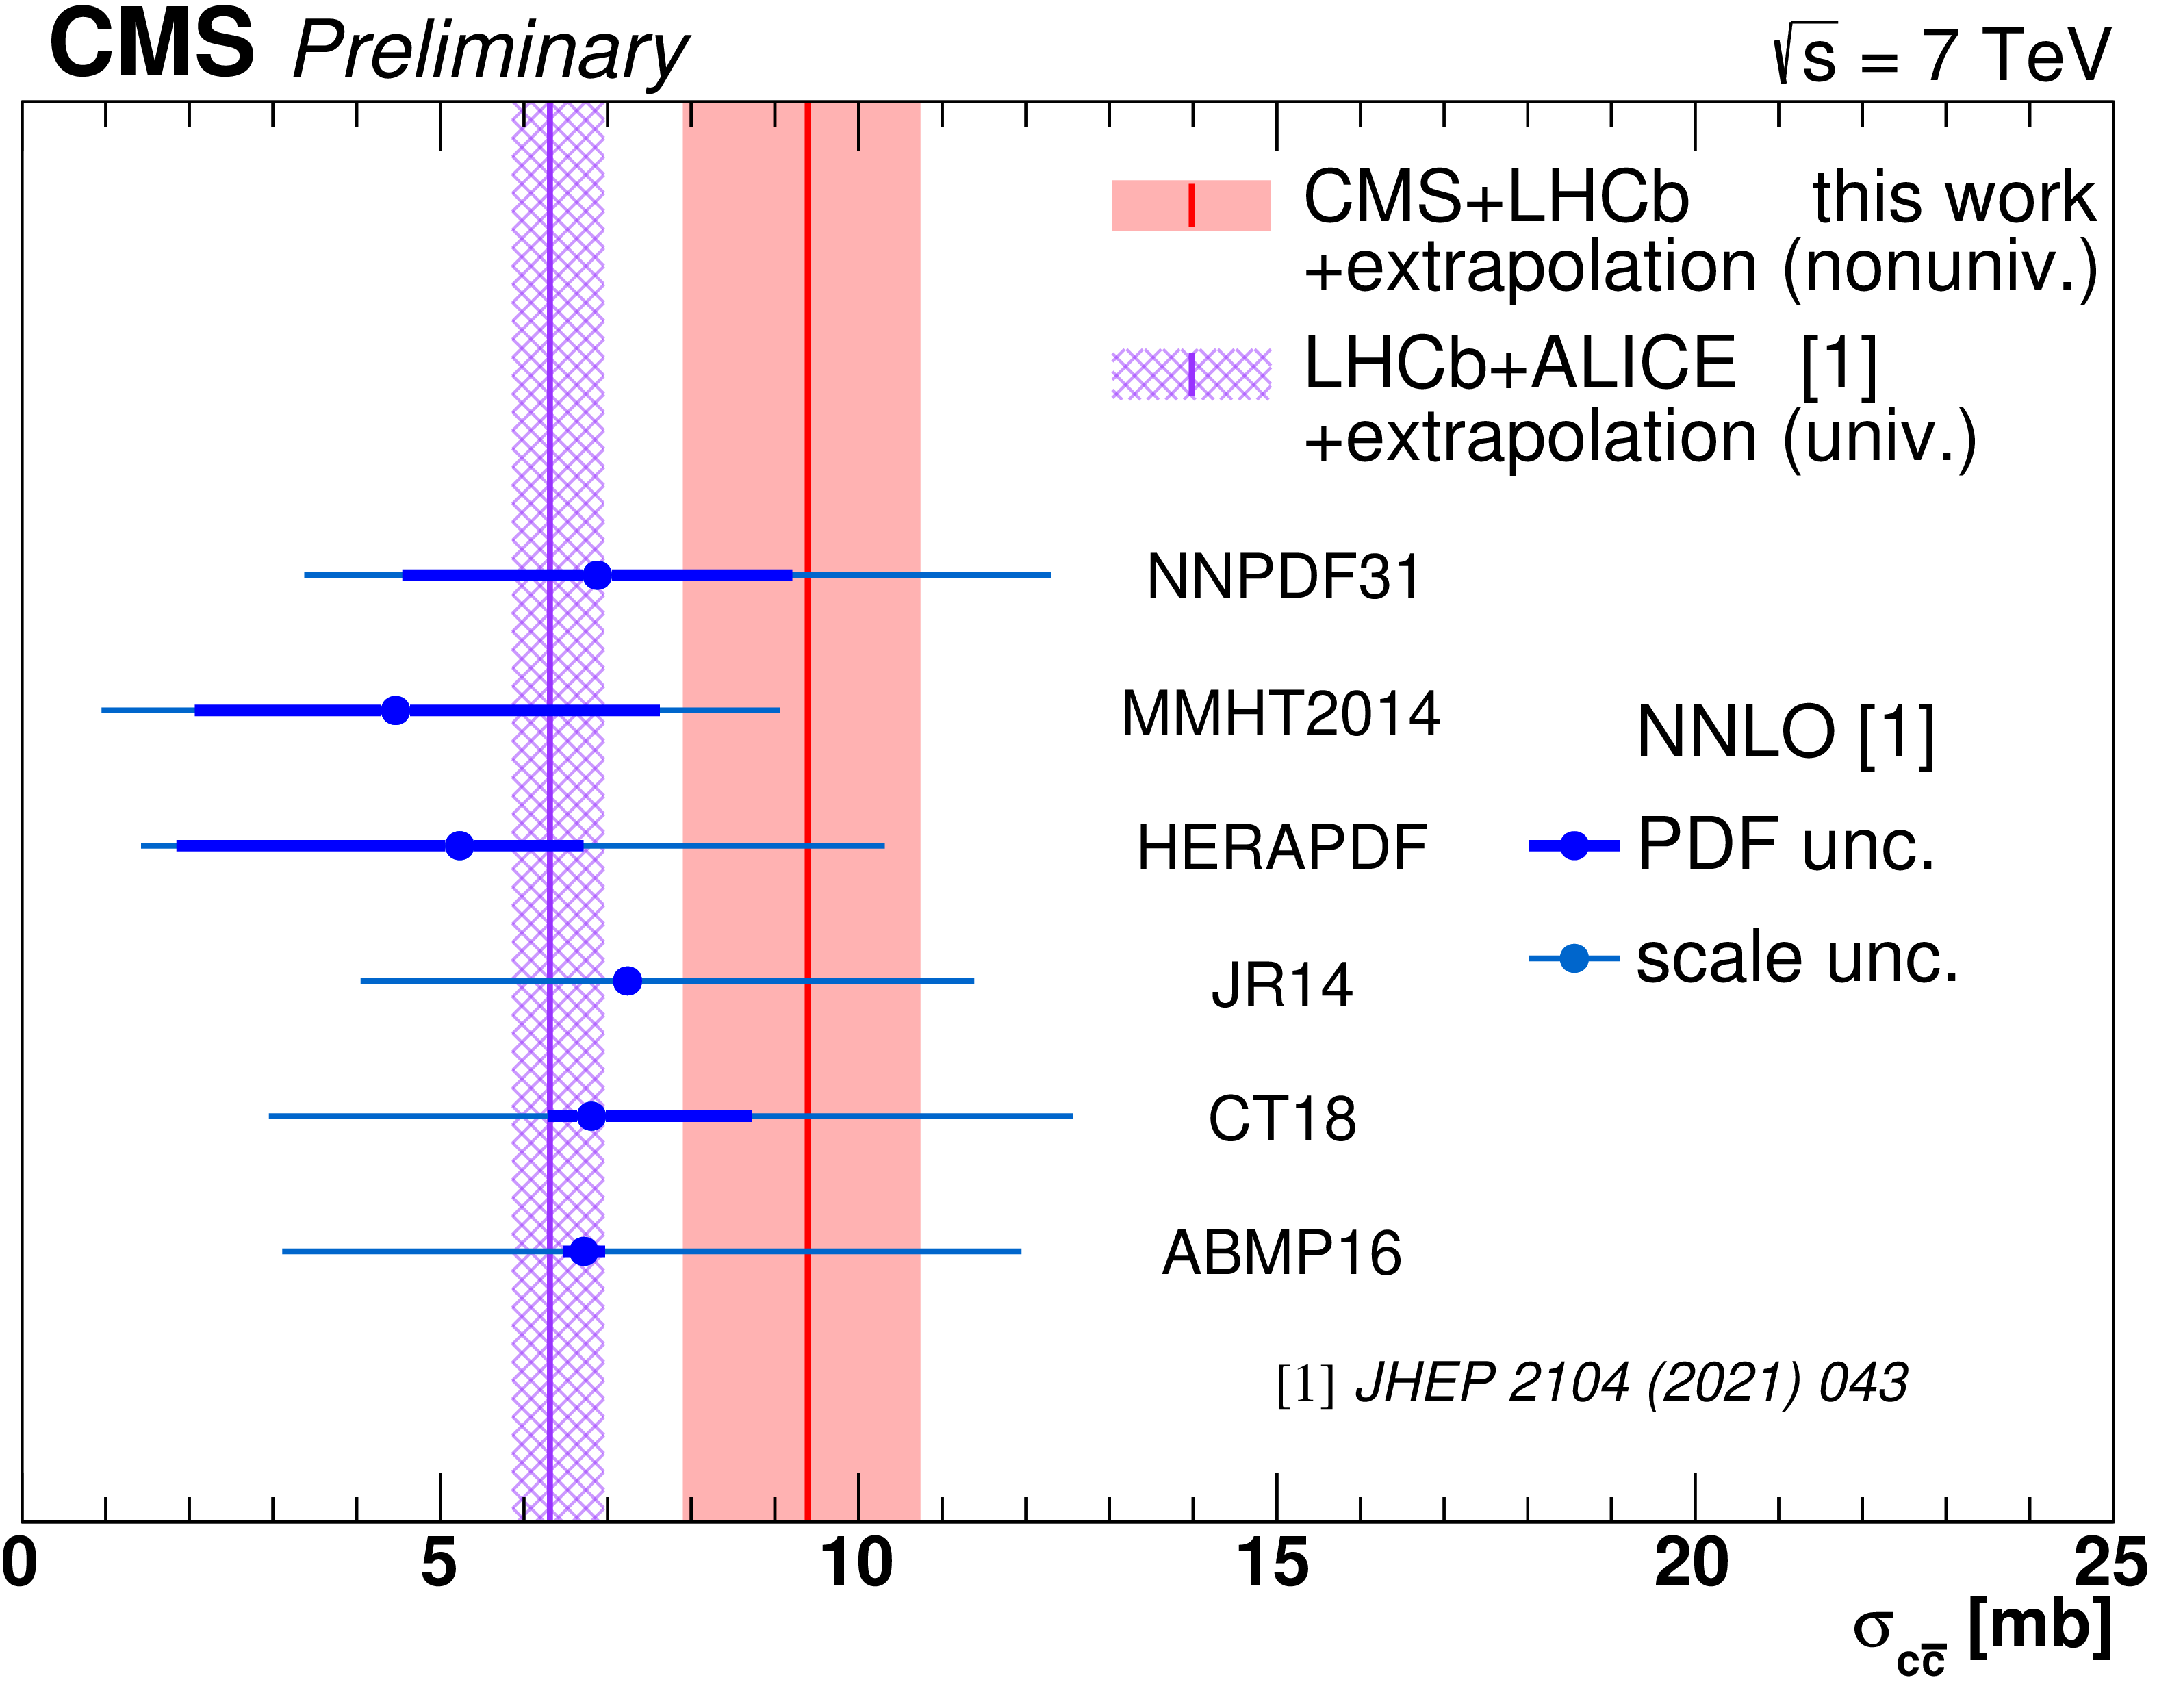
Figure 6:
The measured total charm-quark pair cross section at 7 TeV (bands) is compared with NNLO-QCD theory for different PDF sets, as indicated in the legend (points with uncertainties, from scale variations at NNLO and PDFs, shown separately). The figure is adapted from Ref. [20] and the result from this work was added with its total uncertainty (red band). The violet band is the result obtained with extrapolation of LHCb [14] and ALICE [10] data based on fragmentation universality [20], which is superseded by the result of this work, with smaller extrapolation from CMS (this work) + LHCb [14] data and full nonuniversality treatment. |
| Tables | |
png pdf |
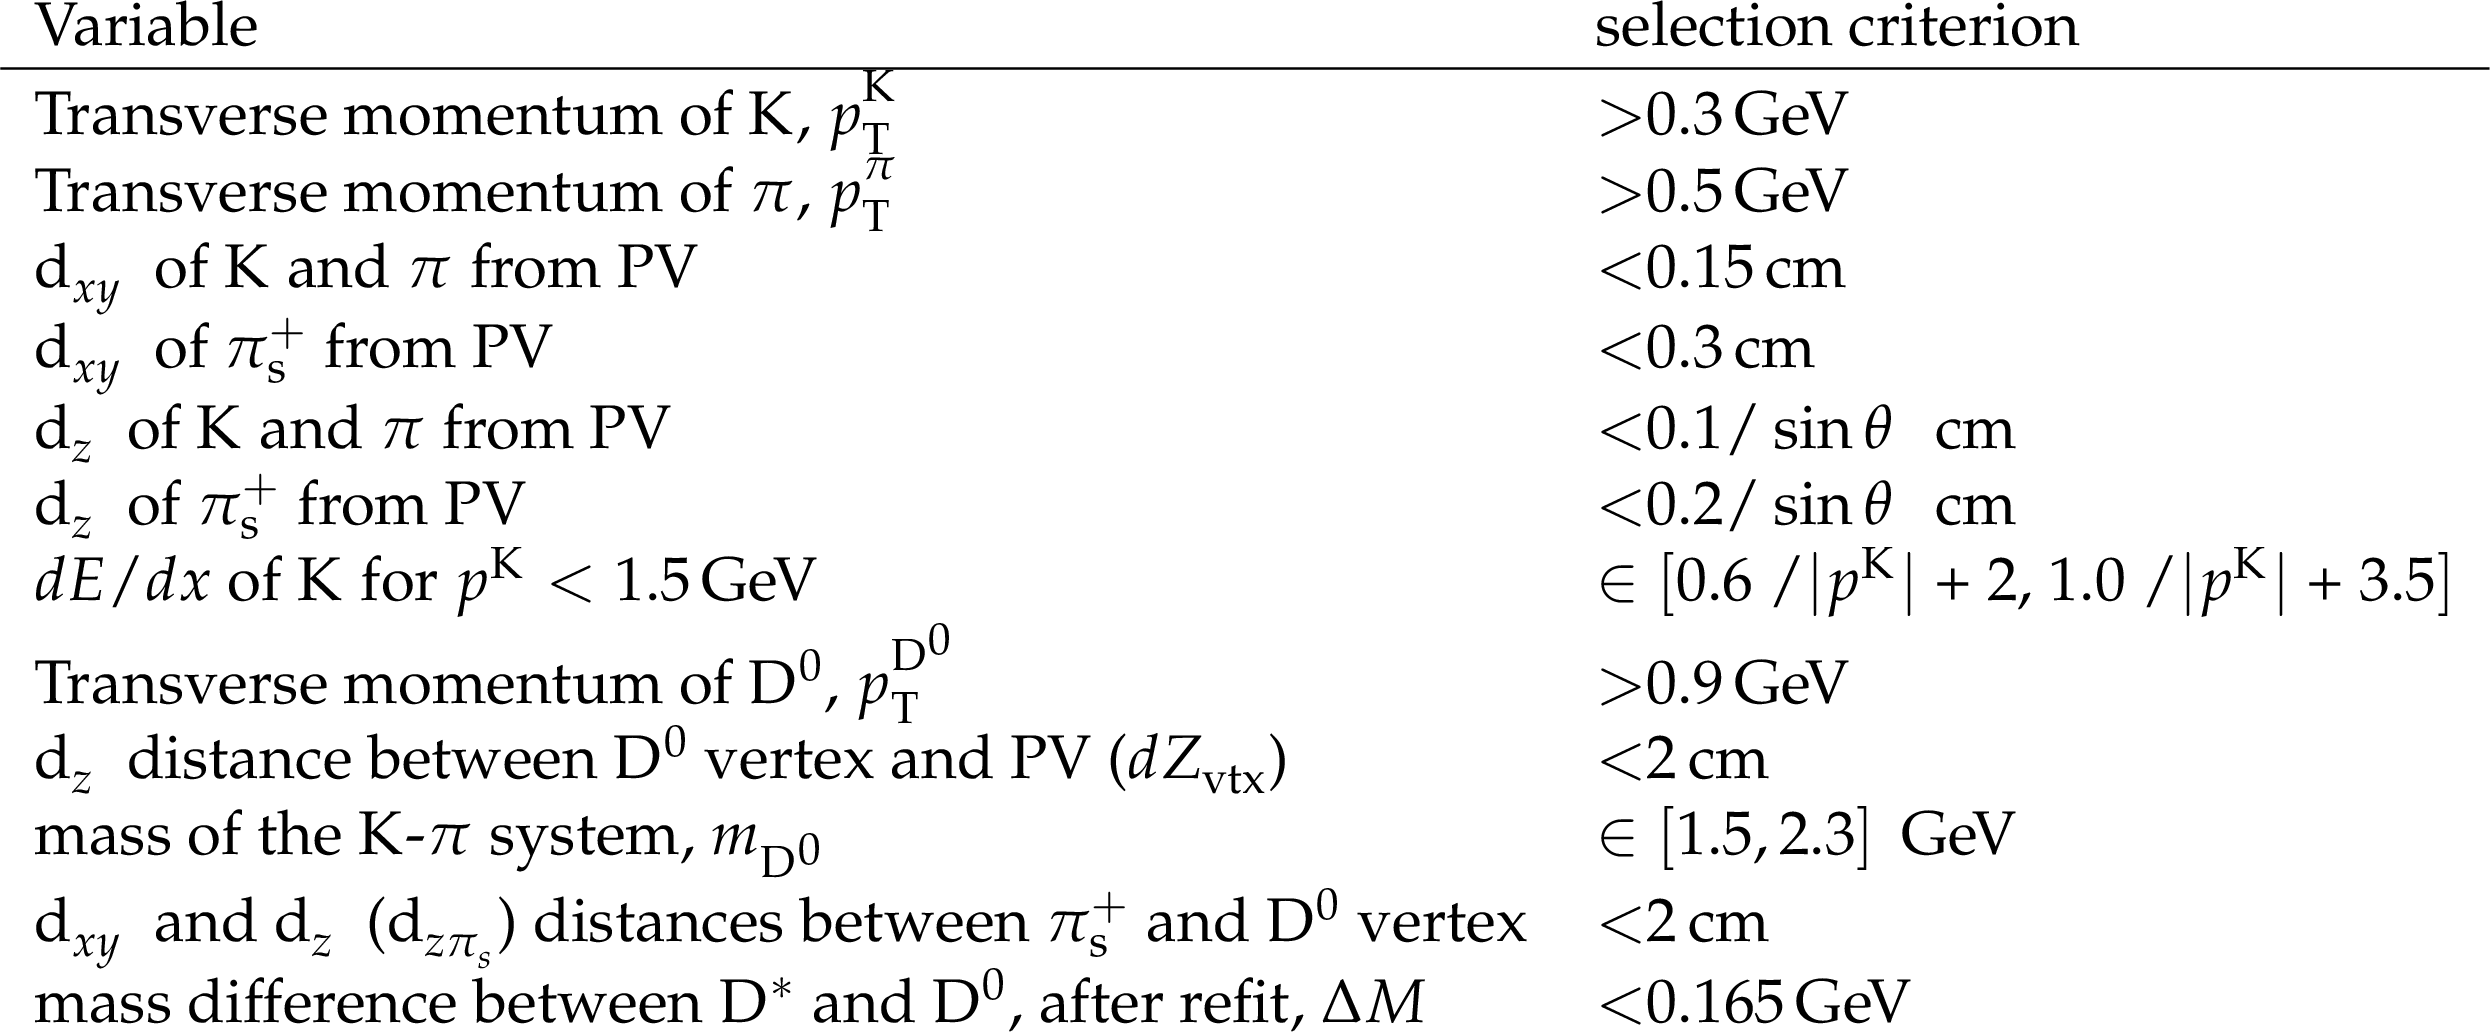
Table 1:
$ \mathrm{D}^{*} $ preselection. |

png pdf |
Table 2:
Additional $ \mathrm{D}^{*} $ candidate selection for each $ p_{\mathrm{T}} $ range category. |
png pdf |
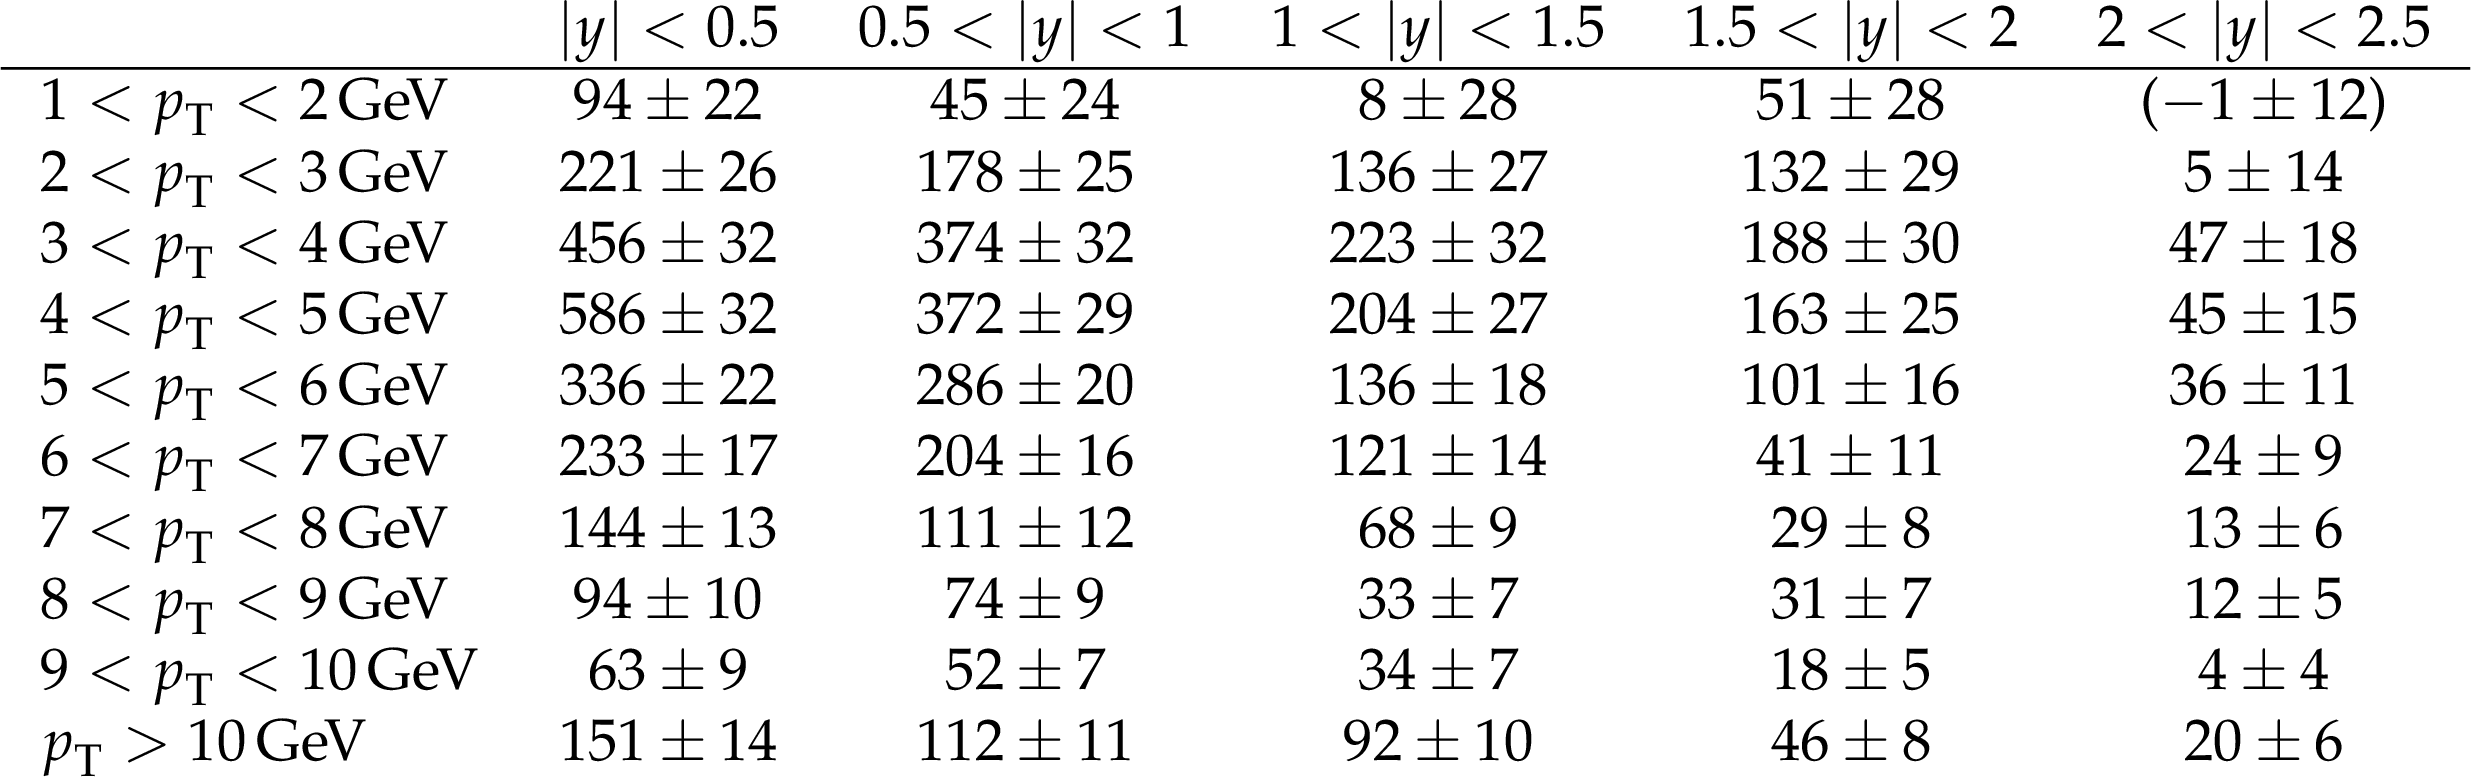
Table 3:
Number of extracted $ \mathrm{D}^{*} $-signal events at reconstruction level for each phase-space bin. The majority of the phase-space bins exhibit a significant signal yield, except for a few regions in the highest $ |y| $ or lowest $ p_{\mathrm{T}} $ bins, where the signal efficiency is decreasing while the background is rising, as expected. Only statistical uncertainties are reported here. Low-significance bins are kept, because phase-space coverage is crucial for the total cross-section extraction. The value in parentheses corresponds to the only bin in which the expected event yield essentially vanishes: that bin is then excluded from further processing. |
png pdf |
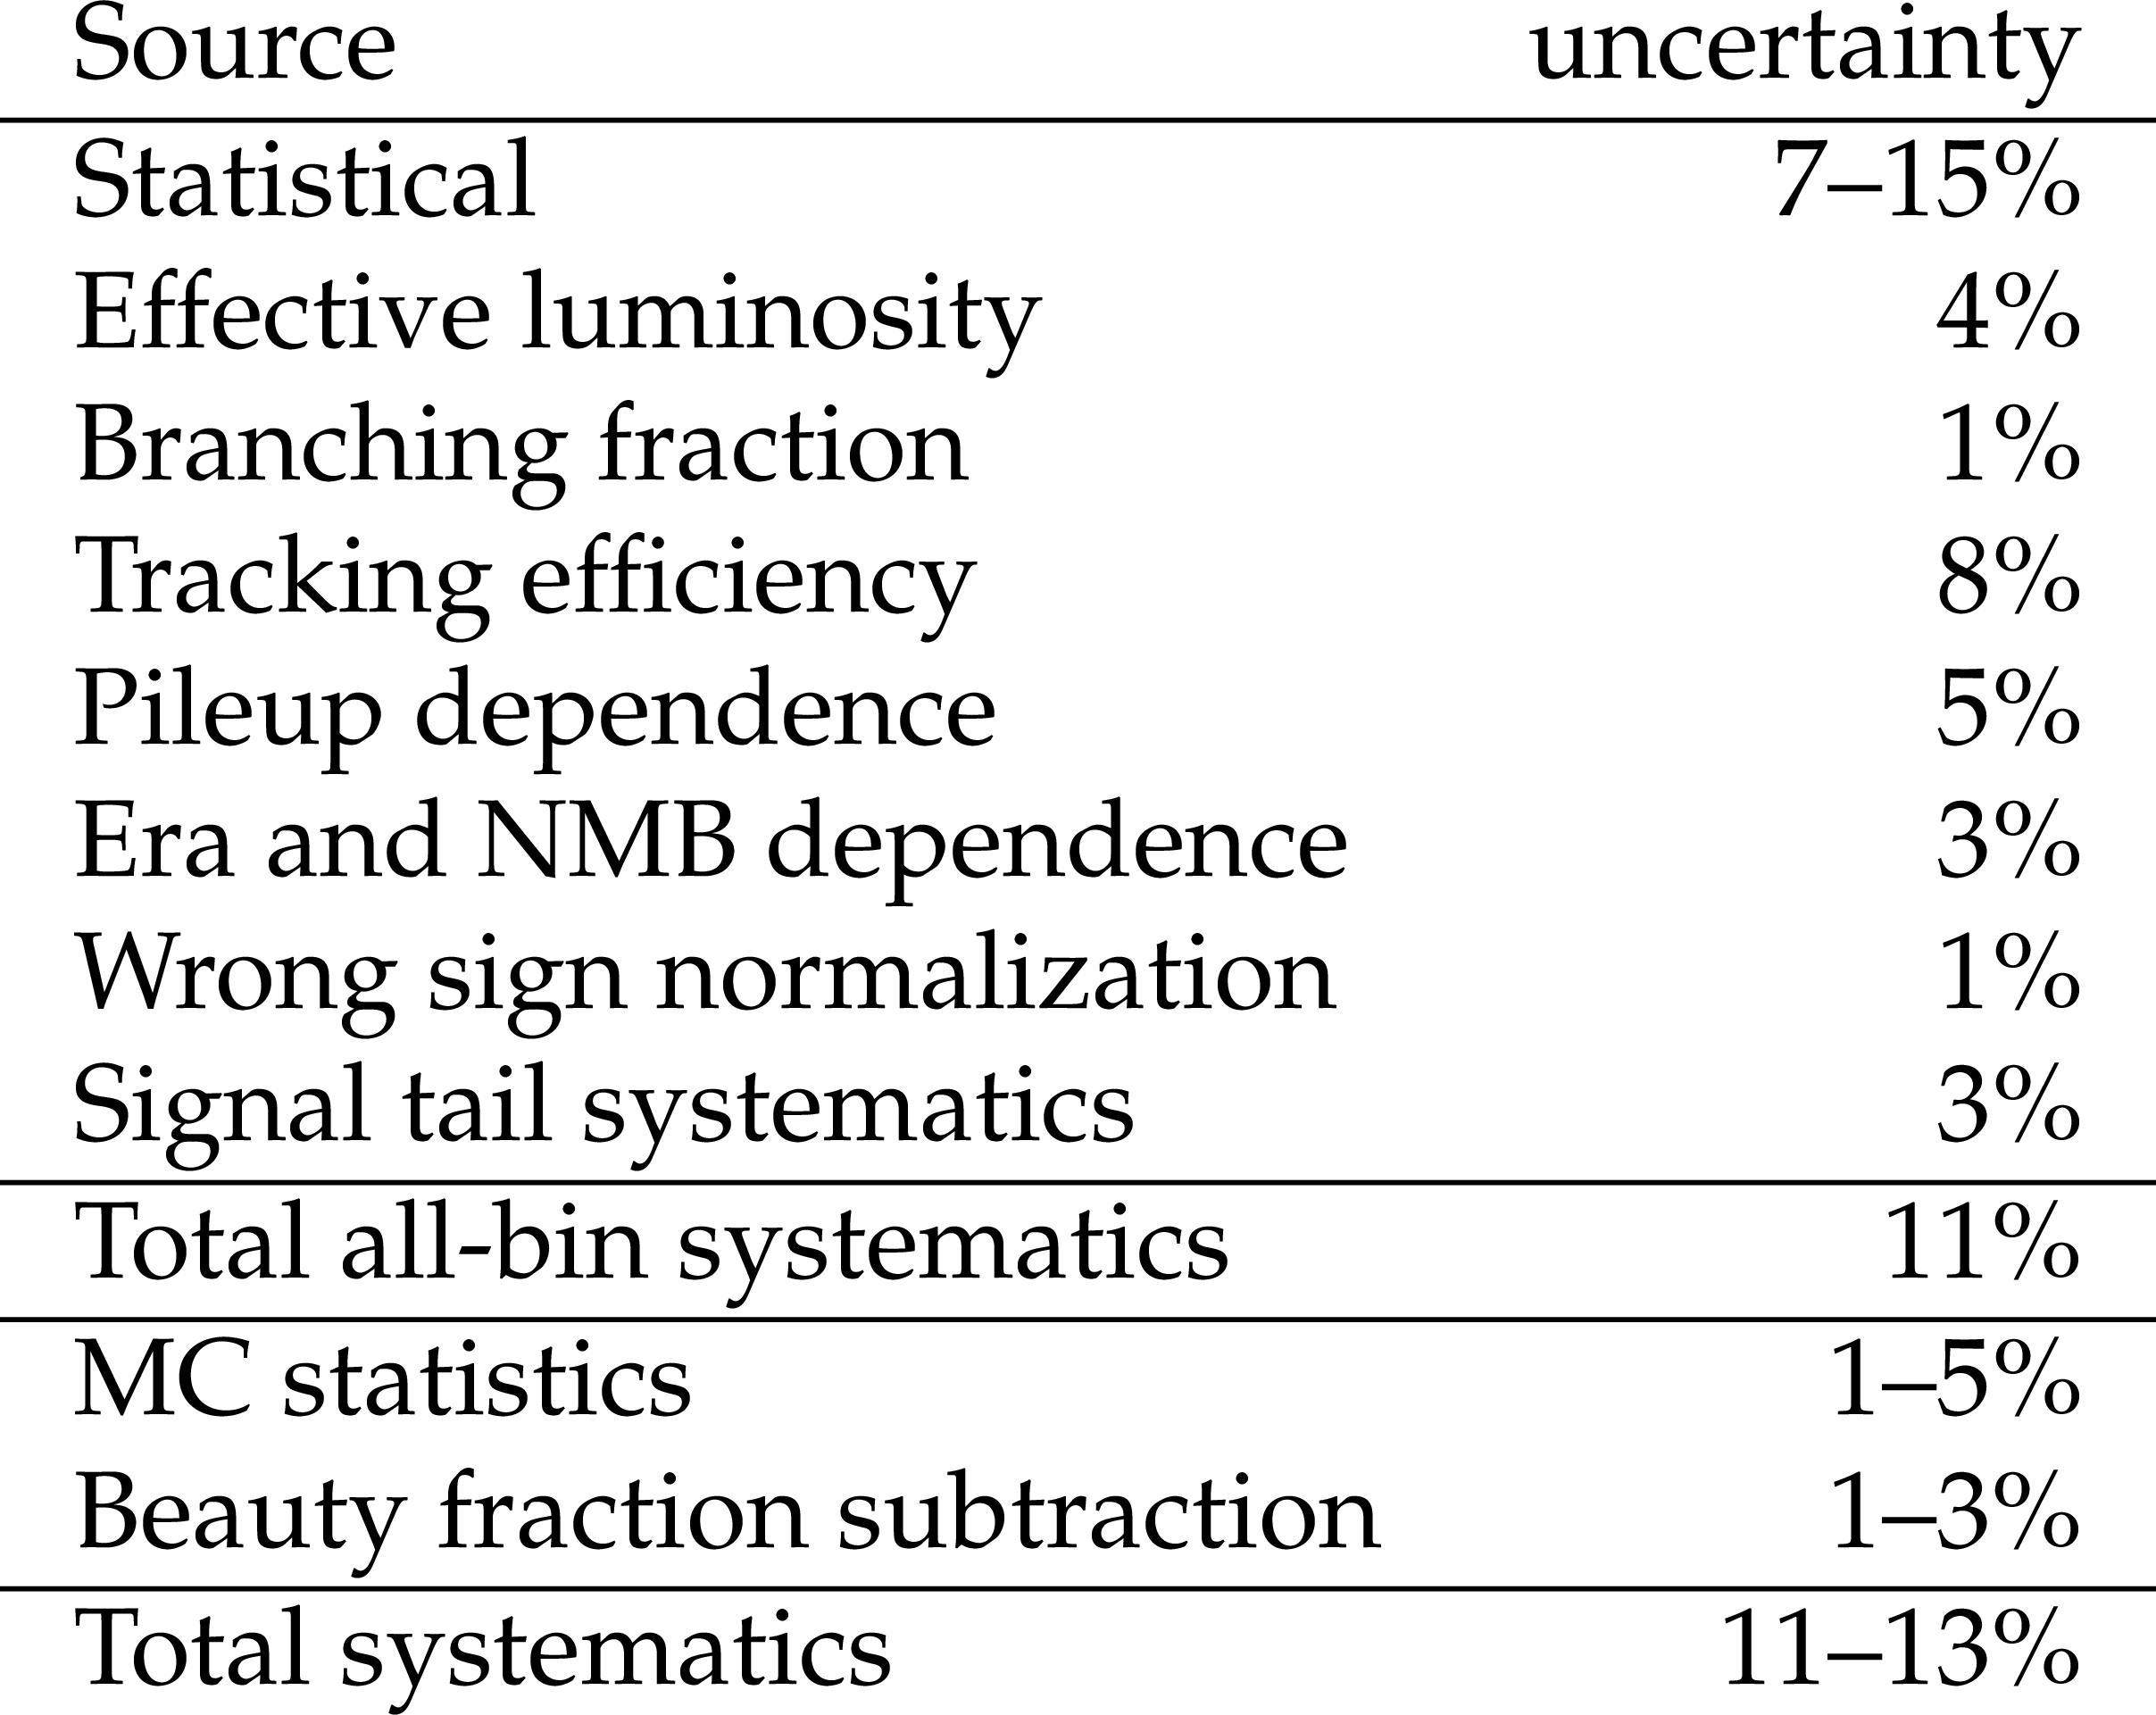
Table 4:
Summary of systematic uncertainties. A single number refers to the same number applied to all bins. A range indicates typical values for well-measured bins. |
png pdf |
Table 5:
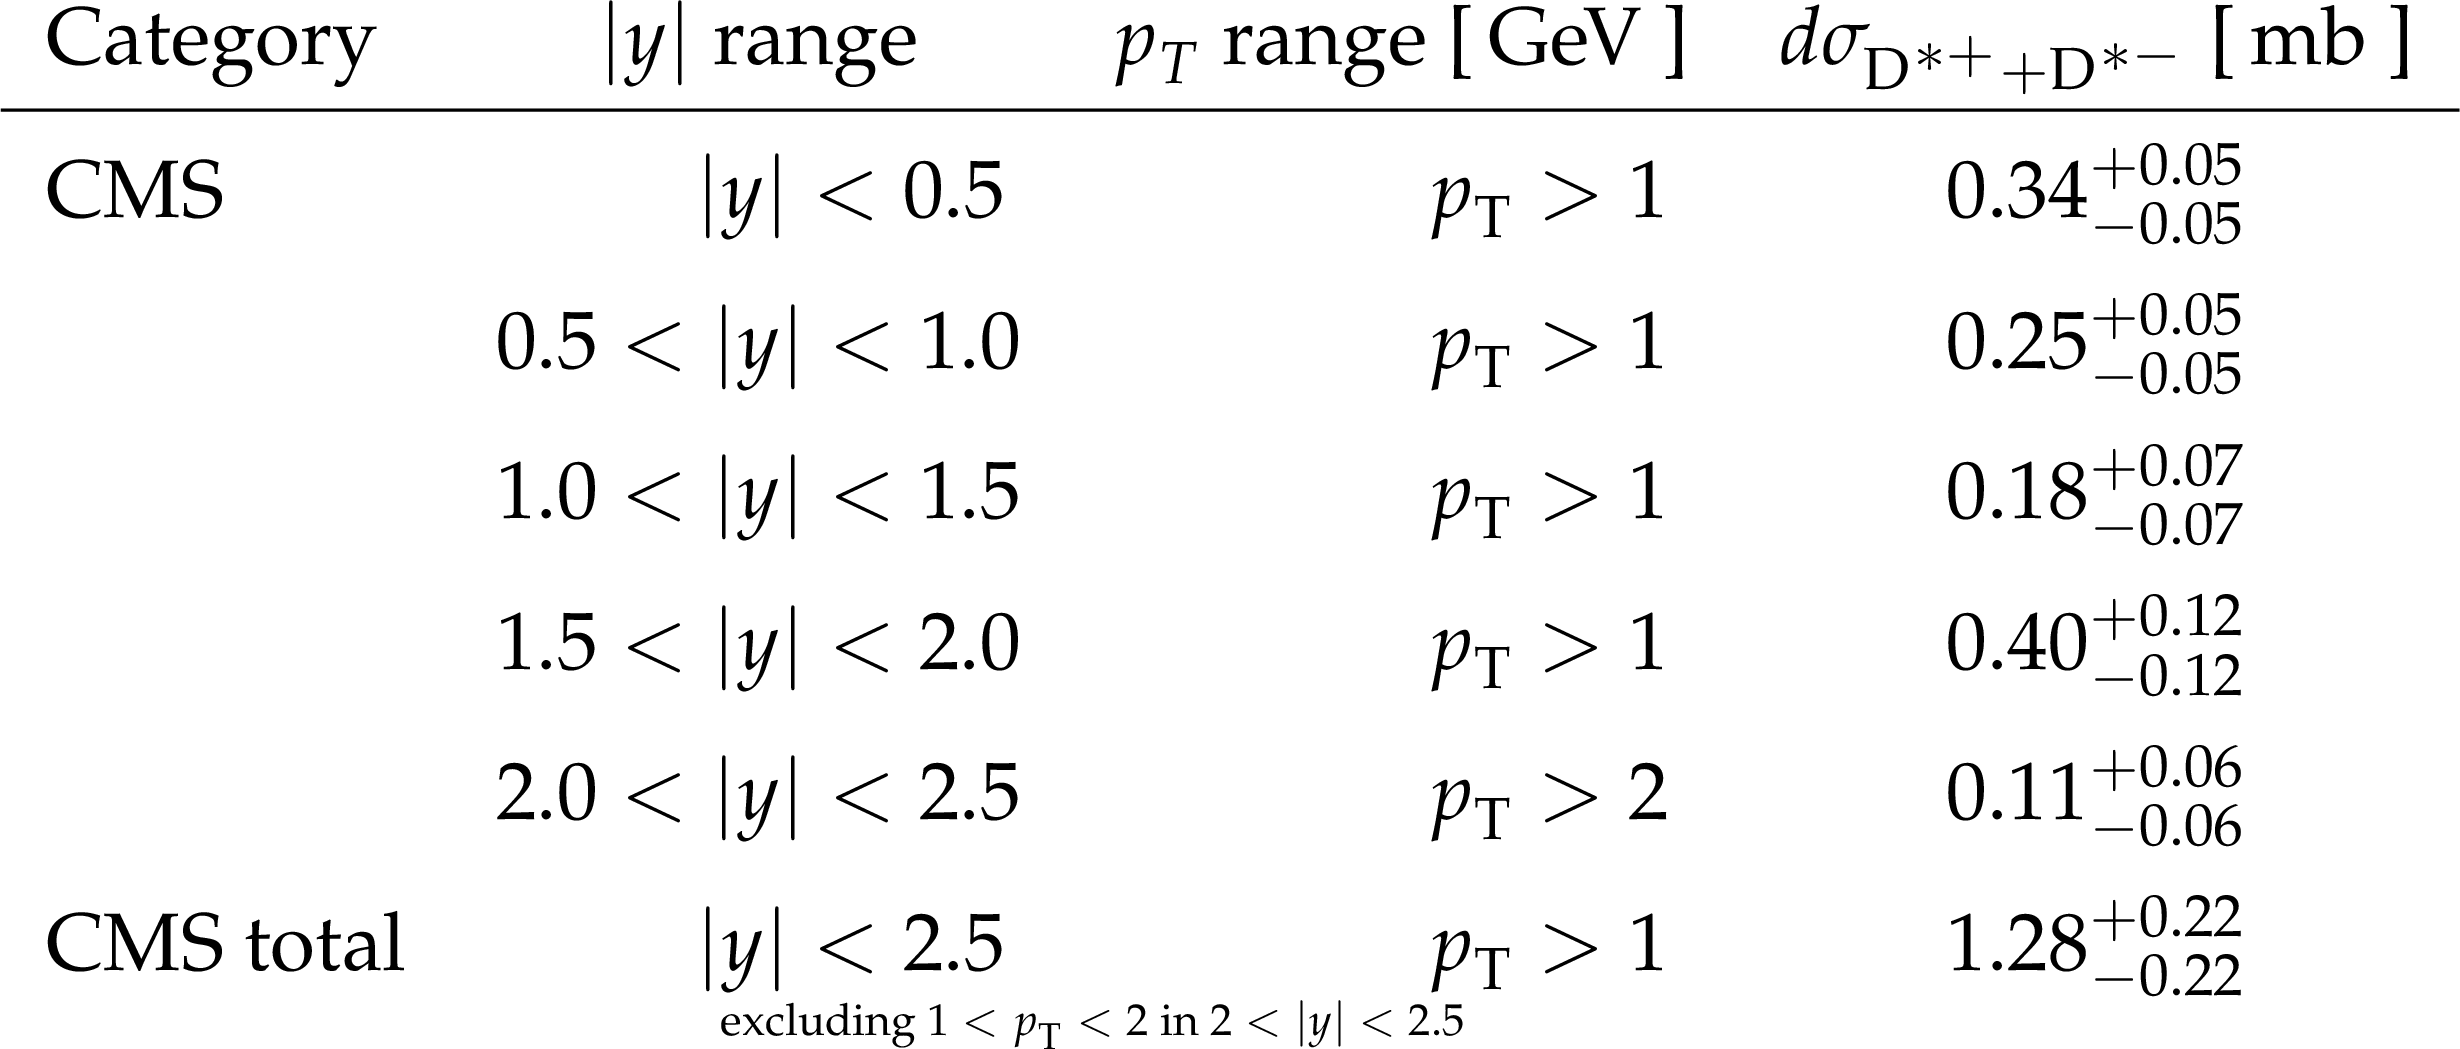
The $ \mathrm{D}^{*+}+\mathrm{D}^{*-} $ cross sections measured in this work. The last column of each row shows the fiducial cross section in the kinematical ranges listed, integrated over $ p_{\mathrm{T}} $. |

png pdf |
Table 6:
The $ \mathrm{D}^{*+}+\mathrm{D}^{*-} $ cross sections measured from LHCb [14]. The last column of each row shows the fiducial cross section in the kinematical ranges listed, integrated over $ p_{\mathrm{T}} $. The LHCb measurements, originally for positive rapidity only, have been symmetrized in $ y $. The row in parentheses is excluded from the LHCb total used here because it overlaps with the CMS measurements. |
| Summary |
|
Double-differential cross sections for the production of prompt D$ ^* $ mesons in pp collisions at 7 TeV were measured in the kinematical range of transverse momentum $ p_{\mathrm{T}} > $ 1 GeV and rapidity $ |y| < $ 2.5, from data with an effective luminosity of 3.0 mb$^{-1}$, taken in 2010. These data include events from zero-bias (beam crossing) and minimum-bias (minimal detector signal) triggers, as well as `next-to-minimum-bias' collisions obtained from pileup collisions in events from other triggers, thereby using pileup as a physics resource. Access to the lowest transverse momenta is facilitated by the special low-$ p_{\mathrm{T}} $ tracking applied to the 2010 data reconstruction. All the input data sets used are also available in the form of CMS Open Data. Good agreement with NLO+NLL (FONLL) QCD predictions still relying on charm-fragmentation universality is observed for the D$ ^* $ cross section, with the measurements preferring the upper edge of the theory band. This confirms the trend also found in previous measurements in different regions of phase space, e.g., the CMS single differential measurements at 13 and 5 TeV. The charm-nonuniversality effects for $ \mathrm{D}^{*} $ mesons (in contrast to charm baryons) can thus be concluded to be smaller than the very large NLO-QCD scale uncertainties for perturbative higher-order QCD corrections. The measured double-differential cross sections are in agreement and competitive with the ones obtained by ALICE in the rapidity range $ |y| < $ 0.5, and by LHCb in the rapidity range 2 $ < |y| < $ 2.5. The region 0.5 $ < |y| < $ 2.0 is covered double-differentially for the first time, and was never measured at all at 7 TeV for $ p_{\mathrm{T}} < $ 3.5 GeV. From CMS measurements only, the integrated fiducial cross section for $ {\mathrm{D}^{\ast}(2010)^{\pm}} $ production with $ p_{\mathrm{T}} > $ 1 GeV and $ |y| < $ 2.5, excluding the region $ p_{\mathrm{T}} < $ 2 GeV and $ |y| > $ 2, was determined to be $ \sigma_{\text{CMS}} = $ 1.28 $ \pm $ 0.22 mb. The almost full phase-space coverage for charm production of this measurement, when taken in conjunction with the published measurements by LHCb, allows an extrapolation to the total cross section for charm-pair production at 7 TeV using a data-constrained effective theory, with relatively small theoretical extrapolation uncertainty. This is important, e.g., for the comparison to available NNLO-QCD predictions, which do not depend on fragmentation for this quantity. The related extrapolation factor of only 1.4 is the smallest ever achieved for a total charm-pair cross-section measurement at the LHC. Following Ref. [21] this is done accounting for the latest experimental results on charm-fragmentation nonuniversality, including full coverage of the related uncertainties. It is the first such result at 7 TeV, therefore superseding all previous 7 TeV total charm-pair cross-section determinations. In particular, the data-constrained effective theory (ddFONLL) used for the extrapolation is also able to successfully describe charm-baryon production (as measured elsewhere) with the same parameters, within uncertainties. The cross section obtained, |
| Additional Figures | |
png pdf |
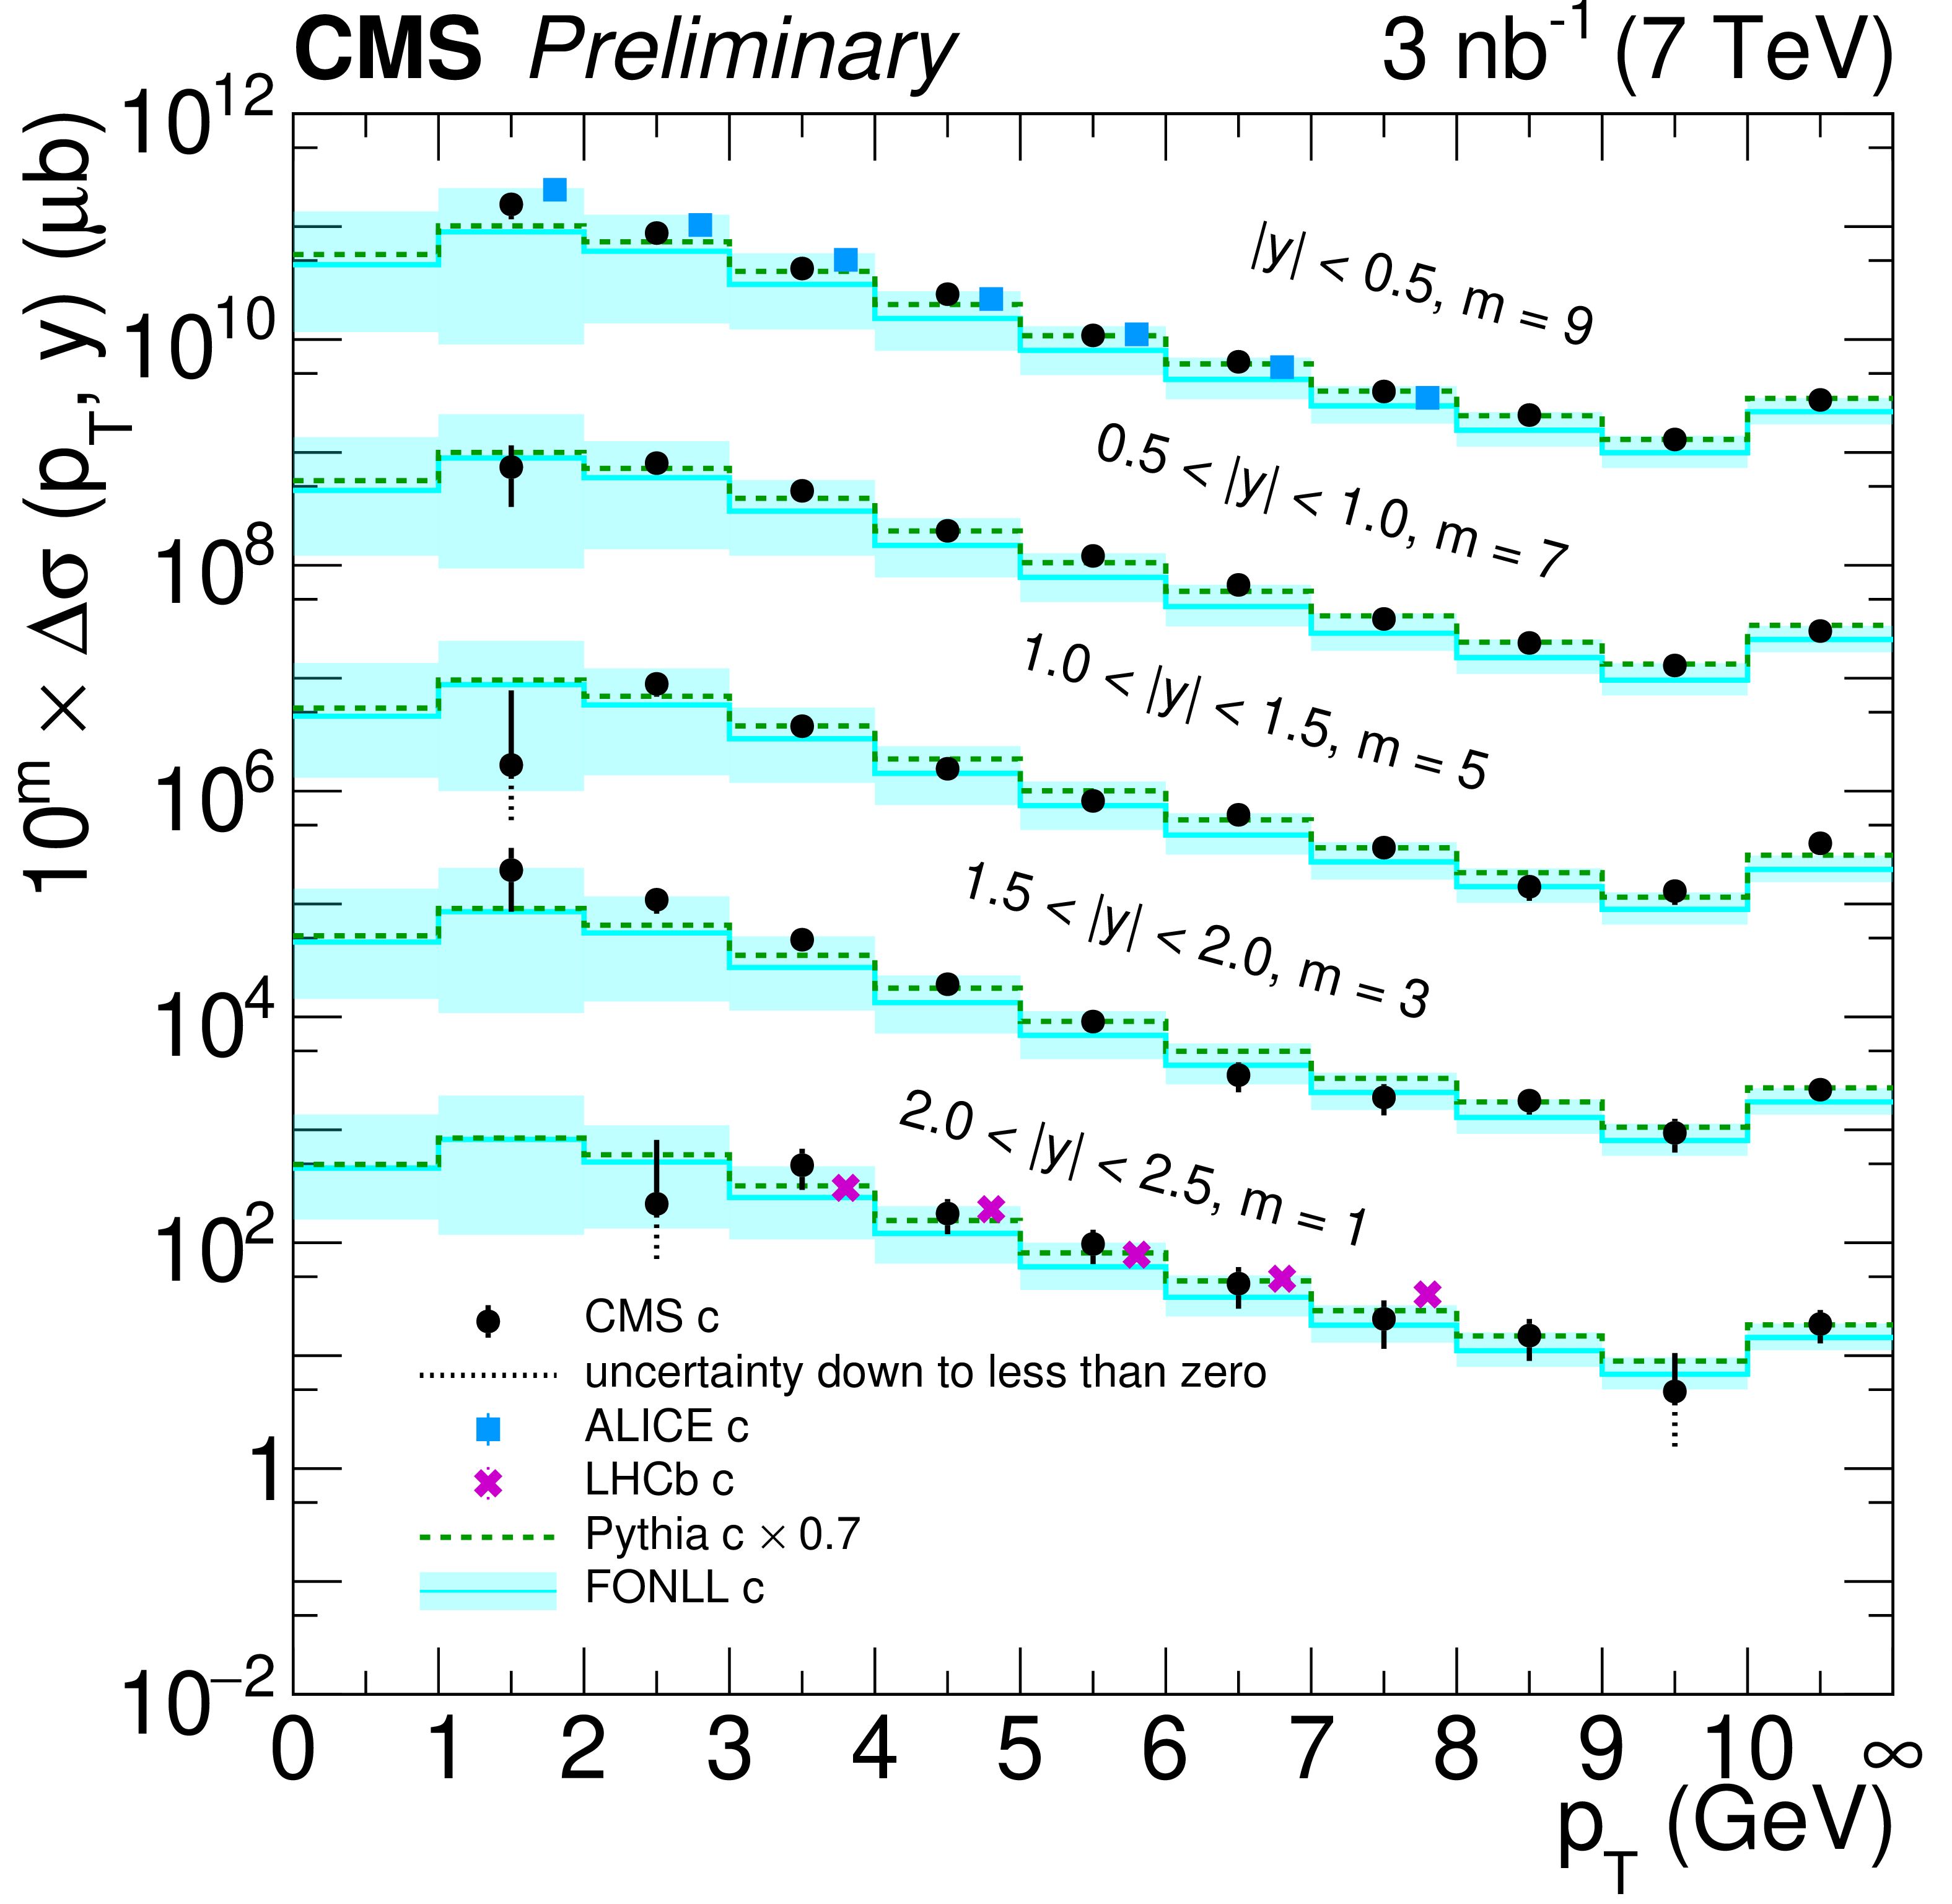
Additional Figure 1:
Double-differential prompt-$ \mathrm{D}^{*} $ cross section as a function of $ p_{\mathrm{T}} $ in $ |y| $ bins. The last bin is the overflow bin. m refers to the power (offset) indicated on the vertical axis label. Vertical bars indicate statistical and systematic uncertainties added in quadrature. Lower vertical bars that would extend to log(zero) (short-dashed) have been truncated for clarity. The points from ALICE and LHCb have been slightly offset horizontally for clarity. |
| References | ||||
| 1 | A. Accardi et al. | A critical appraisal and evaluation of modern PDFs | EPJC 76 (2016) 471 | 1603.08906 |
| 2 | M. Cacciari et al. | Theoretical predictions for charm and bottom production at the LHC | JHEP 10 (2012) 137 | 1205.6344 |
| 3 | M. L. Mangano, P. Nason, and G. Ridolfi | Heavy quark correlations in hadron collisions at next-to-leading order | NPB 373 (1992) 295 | |
| 4 | ALICE Collaboration | Measurement of charm production at central rapidity in proton-proton collisions at $ \sqrt{s}= $ 2.76 TeV | JHEP 07 (2012) 191 | 1205.4007 |
| 5 | ALICE Collaboration | Measurement of $ {{\mathrm{D}}^0} $, $ {{\mathrm{D}}^+} $, $ {{\mathrm{D}}^{*+}} $ and $ {{\mathrm{D}}^+_{\mathrm{s}}} $ production in pp collisions at $ \sqrt{s}= $ 5.02 TeV with ALICE | EPJC 79 (2019) 388 | 1901.07979 |
| 6 | ALICE Collaboration | $ \Lambda^+_{\rm c} $ production in pp and in p-Pb collisions at $ \sqrt {\smash [b]{s_{_{\mathrm {NN}}}}}= $ 5.02 TeV | Phys. Rev. C 104 (2021) 054905 | 2011.06079 |
| 7 | ALICE Collaboration | Measurement of beauty and charm production in pp collisions at $ \sqrt{s} = $ 5.02 TeV via non-prompt and prompt D mesons | JHEP 05 (2021) 220 | 2102.13601 |
| 8 | ALICE Collaboration | Measurement of charm production at central rapidity in proton-proton collisions at $ \sqrt{s} = $ 7 TeV | JHEP 01 (2012) 128 | 1111.1553 |
| 9 | ALICE Collaboration | D-meson production in p-Pb collisions at $ \sqrt{s_{\rm NN}}= $ 5.02 TeV and in pp collisions at $ \sqrt{s}= $ 7 TeV | Phys. Rev. C 94 (2016) 054908 | 1605.07569 |
| 10 | ALICE Collaboration | Measurement of D-meson production at mid-rapidity in pp collisions at $ \sqrt{s}= $ 7 TeV | EPJC 77 (2017) 550 | 1702.00766 |
| 11 | ALICE Collaboration | Measurement of prompt D$ ^{0} $, $ \Lambda_{c}^{+} $, and $ \Sigma_{c}^{0,++} $(2455) production in proton-proton collisions at $ \sqrt{s} = $ 13 TeV | PRL 128 (2022) 012001 | 2106.08278 |
| 12 | ALICE Collaboration | First measurement of $ \Lambda_{\rm c}^+ $ production down to $ p_{\mathrm{T}}= $ 0 in pp and p-Pb collisions at $ \sqrt {\smash [b]{s_{_{\mathrm {NN}}}}}= $ 5.02 TeV | Phys. Rev. C 107 (2023) 064901 | 2211.14032 |
| 13 | LHCb Collaboration | Measurements of prompt charm production cross-sections in pp collisions at $ \sqrt{s}= $ 5 TeV | JHEP 06 (2017) 147 | 1610.02230 |
| 14 | LHCb Collaboration | Prompt charm production in pp collisions at $ \sqrt{s}= $ 7 TeV | NPB 871 (2013) 1 | 1302.2864 |
| 15 | LHCb Collaboration | Measurements of prompt charm production cross-sections in pp collisions at $ \sqrt{s}= $ 13 TeV | JHEP 03 (2016) 159 | 1510.01707 |
| 16 | ATLAS Collaboration | Measurement of D$ ^{*\pm} $, D$ ^\pm $ and D$ _{\rm s}^\pm $ meson production cross sections in pp collisions at $ \sqrt{s}= $ 7 TeV with the ATLAS detector | NPB 907 (2016) 717 | 1512.02913 |
| 17 | CMS Collaboration | Nuclear modification factor of D$ ^0 $ mesons in PbPb collisions at $ \sqrt {\smash [b]{s_{_{\mathrm {NN}}}}} = $ 5.02 TeV | PLB 782 (2018) 474 | CMS-HIN-16-001 1708.04962 |
| 18 | CMS Collaboration | Study of charm hadronization with prompt $ \Lambda^+_\mathrm{c} $ baryons in proton-proton and lead-lead collisions at $ \sqrt {\smash [b]{s_{_{\mathrm {NN}}}}} = $ 5.02 TeV | JHEP 01 (2024) 128 | CMS-HIN-21-004 2307.11186 |
| 19 | CMS Collaboration | Measurement of prompt open-charm production cross sections in proton-proton collisions at $ \sqrt{s} = $ 13 TeV | JHEP 11 (2021) 225 | CMS-BPH-18-003 2107.01476 |
| 20 | M. V. Garzelli, L. Kemmler, S. Moch, and O. Zenaiev | Heavy-flavor hadro-production with heavy-quark masses renormalized in the $ {\overline{\rm MS}} $, MSR and on-shell schemes | JHEP 04 (2021) 043 | 2009.07763 |
| 21 | Y. Yang and A. Geiser | A novel phenomenological approach to total charm cross section measurements at the LHC | in Proceedings of EPS, PoS EPS-HEP 367, 2024 | 2311.07523 |
| 22 | ALICE Collaboration | Charm-quark fragmentation fractions and production cross section at midrapidity in pp collisions at the LHC | PRD 105 (2022) L011103 | 2105.06335 |
| 23 | ALICE Collaboration | $ \Lambda^+_{\rm c} $ production and baryon-to-meson ratios in pp and p-Pb collisions at $ \sqrt {\smash [b]{s_{_{\mathrm {NN}}}}}= $ 5.02 TeV at the LHC | PRL 127 (2021) 202301 | 2011.06078 |
| 24 | CMS Collaboration | Production of $ \Lambda_\mathrm{c}^+ $ baryons in proton-proton and lead-lead collisions at $ \sqrt {\smash [b]{s_{_{\mathrm {NN}}}}}= $ 5.02 TeV | PLB 803 (2020) 135328 | CMS-HIN-18-009 1906.03322 |
| 25 | CMS Collaboration | Studies of beauty suppression via nonprompt D$ ^0 $ mesons in Pb-Pb collisions at $ Q^2 = $ 4 GeV$^2 $ | PRL 123 (2019) 022001 | CMS-HIN-16-016 1810.11102 |
| 26 | Particle Data Group Collaboration | Review of Particle Physics | PTEP 2020 (2020) 083C01 | |
| 27 | CMS Collaboration | Description and performance of track and primary-vertex reconstruction with the CMS tracker | JINST 9 (2014) P10009 | CMS-TRK-11-001 1405.6569 |
| 28 | CMS Collaboration | The CMS trigger system | JINST 12 (2017) P01020 | CMS-TRG-12-001 1609.02366 |
| 29 | CMS Collaboration | The CMS Experiment at the CERN LHC | JINST 3 (2008) S08004 | |
| 30 | CMS Collaboration | ZeroBias primary dataset in RECO format from the 0.9 TeV and 7 TeV Commissioning runs of 2010 | CERN Open Data Portal, 2019 | |
| 31 | CMS Collaboration | ZeroBias primary dataset in AOD format from RunA of 2010 | CERN Open Data Portal, 2019 | |
| 32 | CMS Collaboration | MinimumBias primary dataset in RECO format from the 7 TeV Commissioning run of 2010 | CERN Open Data Portal, 2019 | |
| 33 | CMS Collaboration | MinimumBias primary dataset in AOD format from RunA of 2010 | CERN Open Data Portal, 2019 | |
| 34 | CMS Collaboration | MinimumBias primary dataset in AOD format from RunB of 2010 | CERN Open Data Portal, 2019 | |
| 35 | CMS Collaboration | MuOnia primary dataset in AOD format from RunA of 2010 | CERN Open Data Portal, 2019 | |
| 36 | CMS Collaboration | MuOnia primary dataset in AOD format from RunB of 2010 | CERN Open Data Portal, 2019 | |
| 37 | CMS Collaboration | Mu primary dataset in AOD format from RunA of 2010 | CERN Open Data Portal, 2019 | |
| 38 | CMS Collaboration | Mu primary dataset in AOD format from RunB of 2010 | CERN Open Data Portal, 2019 | |
| 39 | CMS Collaboration | MuMonitor primary dataset in AOD format from RunA of 2010 | CERN Open Data Portal, 2019 | |
| 40 | CMS Collaboration | MuMonitor primary dataset in AOD format from RunB of 2010 | CERN Open Data Portal, 2019 | |
| 41 | CMS Collaboration | EG primary dataset in AOD format from RunA of 2010 | CERN Open Data Portal, 2019 | |
| 42 | CMS Collaboration | Electron primary dataset in AOD format from RunB of 2010 | CERN Open Data Portal, 2019 | |
| 43 | CMS Collaboration | EGMonitor primary dataset in AOD format from RunA of 2010 | CERN Open Data Portal, 2019 | |
| 44 | CMS Collaboration | EGMonitor primary dataset in AOD format from RunB of 2010 | CERN Open Data Portal, 2019 | |
| 45 | CMS Collaboration | Public CMS Open Data information | link | |
| 46 | CMS Collaboration | Measurement of the underlying event activity at the lhc with $ \sqrt{s}= $ 7 TeV and comparison with $ \sqrt{s} = $ 0.9 TeV | JHEP 09 (2011) 109 | CMS-QCD-10-010 1107.0330 |
| 47 | CMS Collaboration | Charged particle transverse momentum spectra in pp collisions at $ \sqrt{s} = $ 0.9 and 7 TeV | JHEP 08 (2011) 086 | CMS-QCD-10-008 1104.3547 |
| 48 | CMS Collaboration | Study of the inclusive production of charged pions, kaons, and protons in pp collisions at $ \sqrt{s}= $ 0.9, 2.76, and 7 TeV | EPJC 72 (2012) 2164 | CMS-FSQ-12-014 1207.4724 |
| 49 | CMS Collaboration | Study of the underlying event at forward rapidity in pp collisions at $ \sqrt{s} = $ 0.9, 2.76, and 7 TeV | JHEP 04 (2013) 072 | CMS-FWD-11-003 1302.2394 |
| 50 | T. Sjöstrand, S. Mrenna and P. Z. Skands | PYTHIA 6.4 physics and manual | JHEP 05 (2006) 026 | hep-ph/0603175 |
| 51 | CMS Collaboration | Measurement of the underlying event activity in proton-proton collisions at 900 GeV | technical report, 2010 | |
| 52 | GEANT4 Collaboration | GEANT4 --- A simulation toolkit | NIM A 506 (2003) 250 | |
| 53 | A. Abdesselam et al. | Measurement of the D$ ^{\ast-} $ polarization in the decay B$ ^0 \to {\rm D}^{\ast -}\tau^+\nu_{\tau} $ | Belle Collaboration, in 10th International Workshop on the CKM Unitarity Triangle. 3, 2019 | 1903.03102 |
| 54 | ALICE Collaboration | First measurement of prompt and non-prompt $ D^{*+} $ vector meson spin alignment in pp collisions at $ \sqrt{s} = $ 13 TeV | PLB 846 (2023) 137920 | 2212.06588 |
| 55 | LHCb Collaboration | Measurement of the $ D^* $ longitudinal polarization in $ B^0 \rightarrow D^{*-}\tau^+\nu_\tau $ decays | 2311.05224 | |
| 56 | CMS Collaboration | Tracking and primary vertex results in first 7 TeV collisions | technical report, 2010 | |
| 57 | O. Behnke, A. Geiser, and M. Lisovyi | Charm, beauty and top at HERA | Prog. Part. Nucl. Phys. 84 (2015) 1 | 1506.07519 |
| 58 | N. L. Johnson | Systems of Frequency Curves Generated by Methods of Translation. | Biometrika 36 (1949) 149 | |
| 59 | N. L. Johnson | BIVARIATE DISTRIBUTIONS BASED ON SIMPLE TRANSLATION SYSTEMS | Biometrika 36 (1949) 297 | |
| 60 | CMS Collaboration | CMS luminosity information, for 2010 CMS open data | link | |
| 61 | P. M. Nadolsky et al. | Implications of CTEQ global analysis for collider observables | PRD 78 (2008) 013004 | 0802.0007 |
| 62 | L. Gladilin | Fragmentation fractions of c and b quarks into charmed hadrons at LEP | EPJC 75 (2015) 19 | 1404.3888 |
| 63 | A. Geiser, Y. Yang, S. Moch, and O. Zenaiev | Charm total cross sections with nonuniversal fragmentation treatment | in contribution to the QCD session of the 58th Rencontres de Moriond, 2024 | 2406.03581 |
| 64 | C. Bierlich et al. | Open charm production cross section from combined LHC experiments in pp collisions at $ \sqrt{s} = $ 5.02 TeV | Eur. Phys. J. Plus 139 (2024) 593 | 2311.11426 |
| 65 | V. G. Kartvelishvili et al. | On the fragmentation functions of heavy quarks into hadrons | PLB 78 (1978) 615 | |
|
|
Compact Muon Solenoid LHC, CERN |
|

|

|

|

|

|