

Compact Muon Solenoid
LHC, CERN
| CMS-PAS-TOP-16-005 | ||
| Measurement of the top quark pair production cross section using $\mathrm{e} \mu$ events in proton-proton collisions at $\sqrt{s}=$ 13 TeV with the CMS detector | ||
| CMS Collaboration | ||
| March 2016 | ||
| Abstract: The top-antitop quark ($ \mathrm{ t \bar{t} } $) production cross section in proton-proton collisions at $\sqrt{s} =$ 13 TeV is measured by the CMS experiment at the CERN LHC using data corresponding to an integrated luminosity of 2.2 fb$^{-1}$. The measurement is performed by analyzing events with one electron and one muon and at least two jets, one of which is required to be identified as a b-jet. The measured cross section is $\sigma_{{\rm t}{\bar{\rm t}}} =$ 793 $\pm$ 8 (stat) $\pm$ 38 (syst) $\pm$ 21 (lumi) pb, in agreement with the expectations from the standard model. | ||
|
Links:
CDS record (PDF) ;
CADI line (restricted) ;
These preliminary results are superseded in this paper, EPJC 77 (2017) 172. The superseded preliminary plots can be found here. |
||
| Figures | |
png pdf |
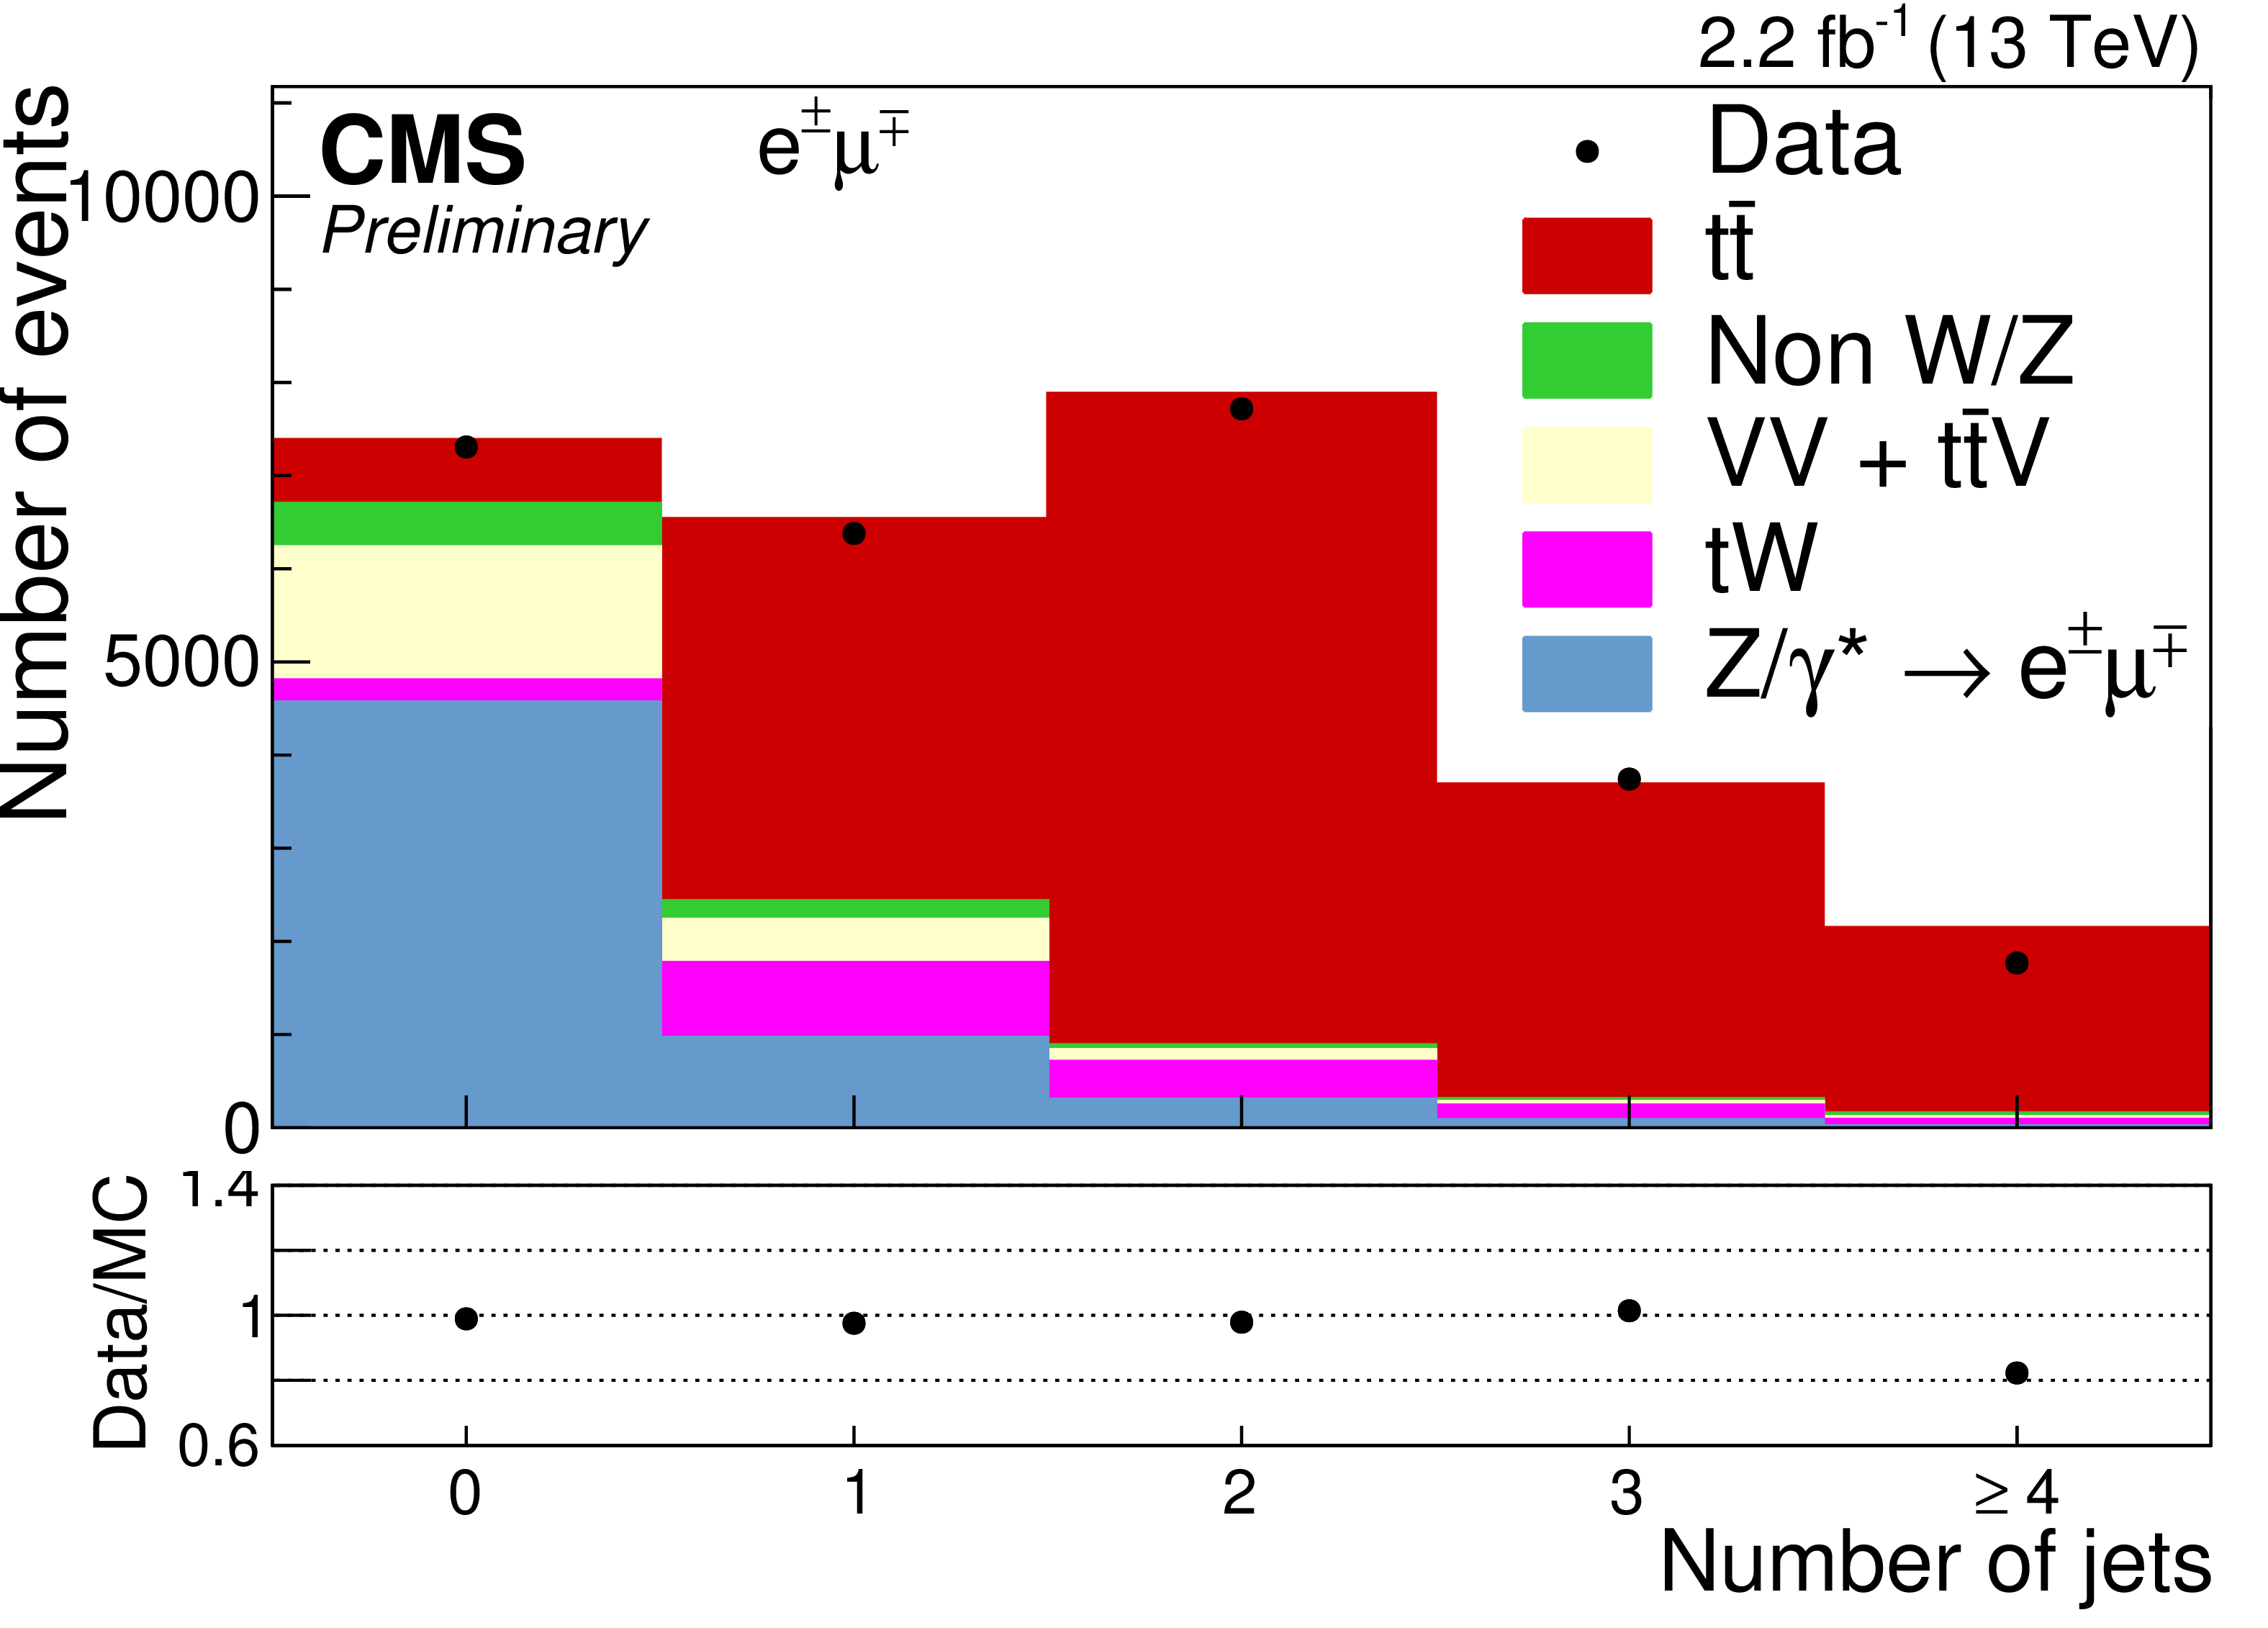
Figure 1:
Distribution of the jet multiplicity in events passing the dilepton selection criteria. The expected distributions for $ {\mathrm{ t \bar{t} } } $ signal and individual backgrounds are shown after data-driven corrections are applied; the last bin contains the overflow events. The ratio of data to the sum of the expected yields is given at the bottom of the figure. Error bars (not visible in the figure) indicate statistical uncertainties only. |
png pdf |
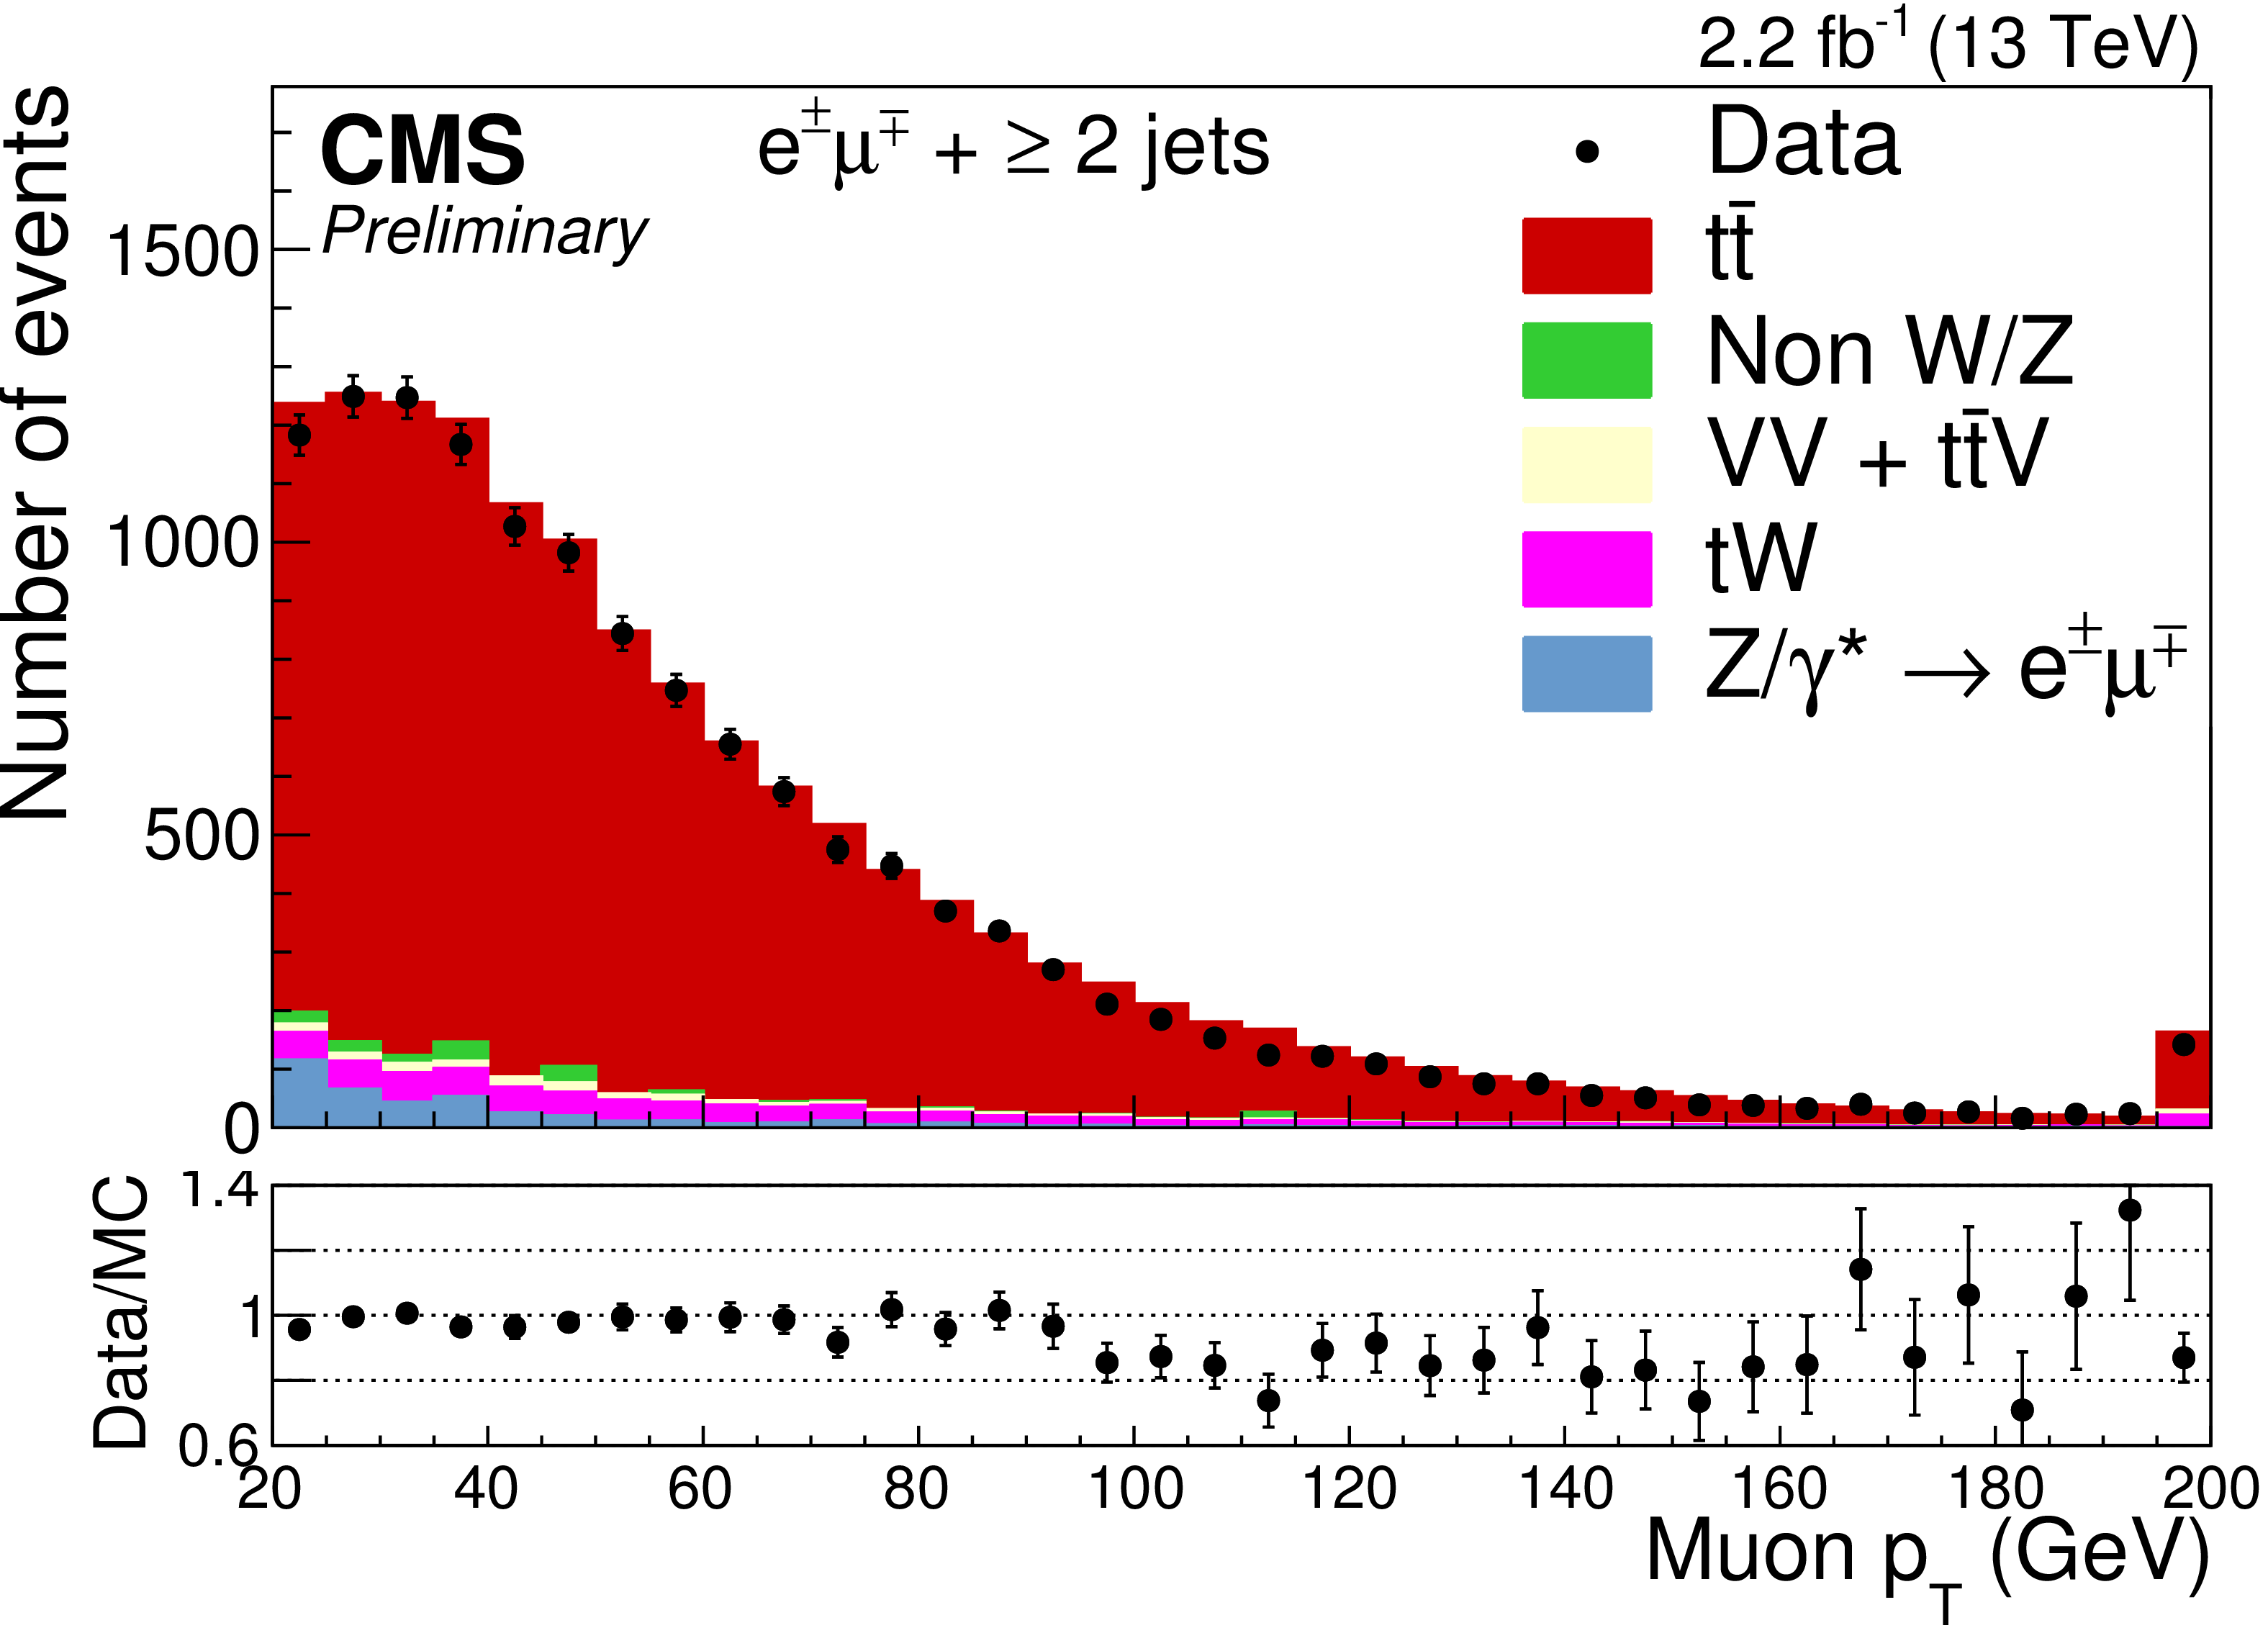
Figure 2-a:
The distributions of (a) $ {p_{\mathrm {T}}} $ and (b) $\eta $ of the muon, and (c) $ {p_{\mathrm {T}}} $ and (d) $\eta $ of the electron after the selection of jets and before the $ \mathrm{ b } $ tagging requirement. The expected distributions for $ {\mathrm{ t \bar{t} } } $ signal and individual backgrounds are shown after data-driven corrections are applied; for the left plots (a,c) the last bin contains the overflow events. The ratios of data to the sum of the expected yields are given at the bottom of each panel. Error bars indicate statistical uncertainties only. |
png pdf |
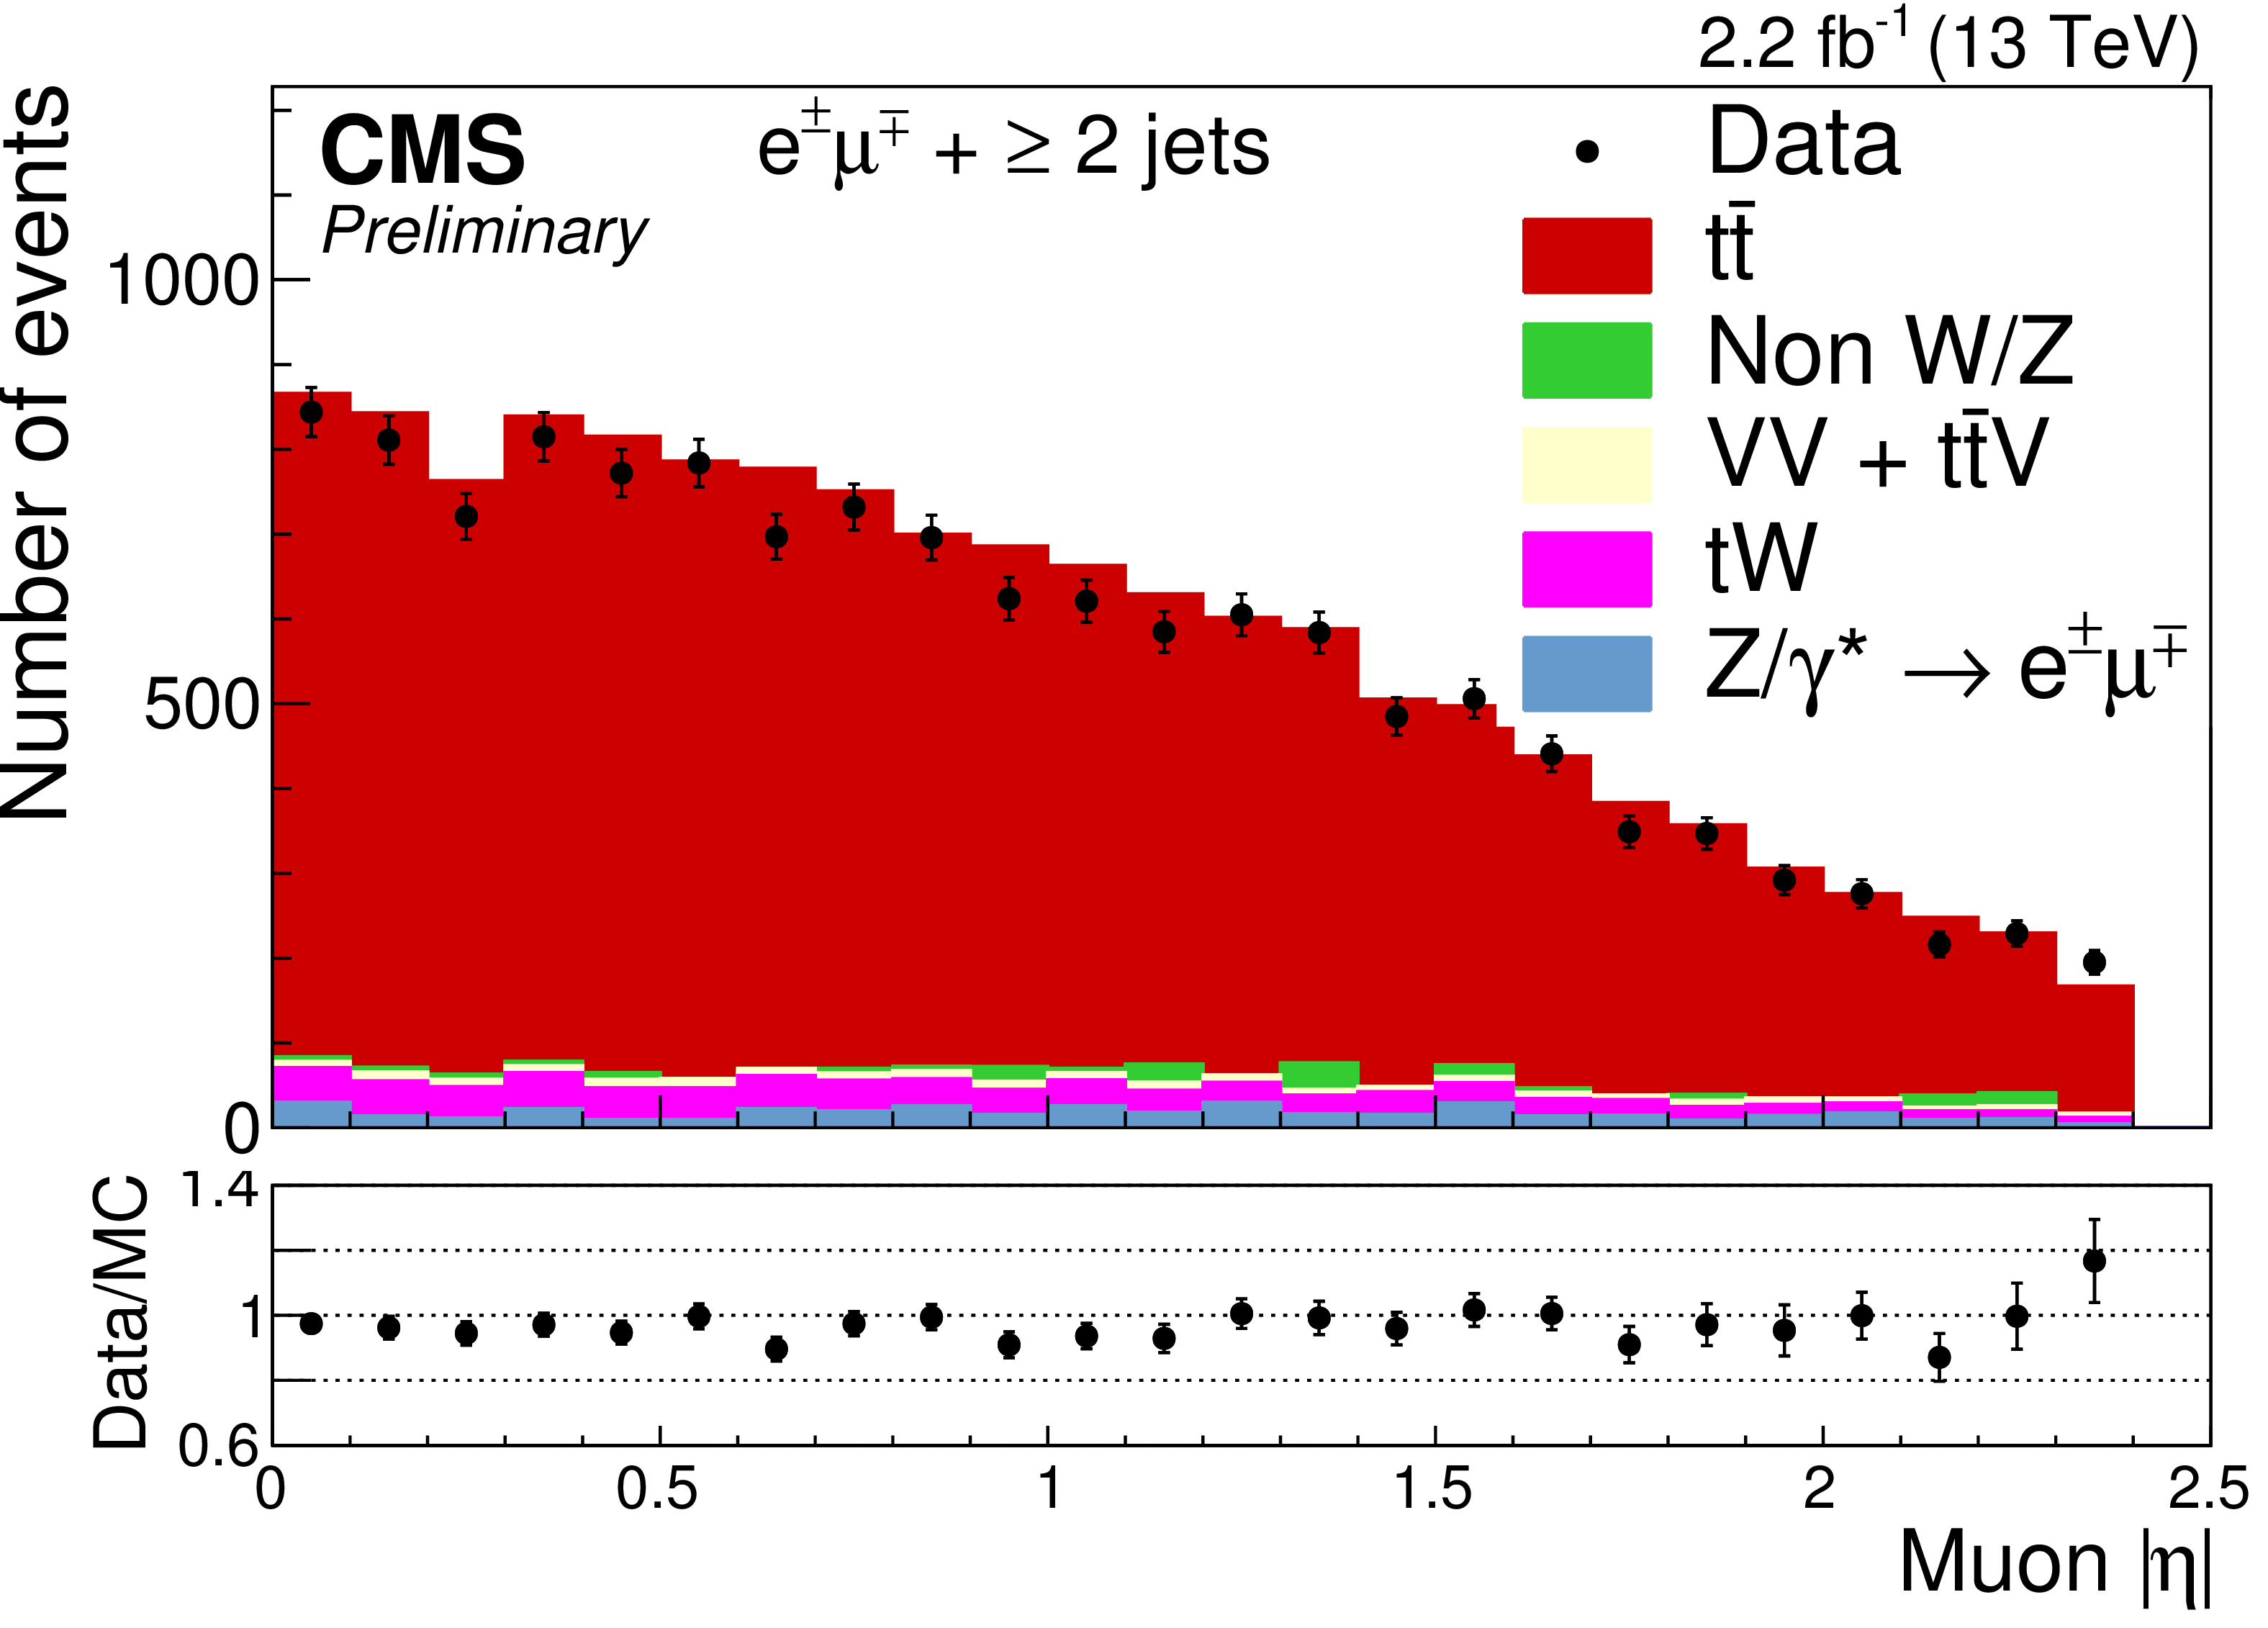
Figure 2-b:
The distributions of (a) $ {p_{\mathrm {T}}} $ and (b) $\eta $ of the muon, and (c) $ {p_{\mathrm {T}}} $ and (d) $\eta $ of the electron after the selection of jets and before the $ \mathrm{ b } $ tagging requirement. The expected distributions for $ {\mathrm{ t \bar{t} } } $ signal and individual backgrounds are shown after data-driven corrections are applied; for the left plots (a,c) the last bin contains the overflow events. The ratios of data to the sum of the expected yields are given at the bottom of each panel. Error bars indicate statistical uncertainties only. |

png pdf |
Figure 2-c:
The distributions of (a) $ {p_{\mathrm {T}}} $ and (b) $\eta $ of the muon, and (c) $ {p_{\mathrm {T}}} $ and (d) $\eta $ of the electron after the selection of jets and before the $ \mathrm{ b } $ tagging requirement. The expected distributions for $ {\mathrm{ t \bar{t} } } $ signal and individual backgrounds are shown after data-driven corrections are applied; for the left plots (a,c) the last bin contains the overflow events. The ratios of data to the sum of the expected yields are given at the bottom of each panel. Error bars indicate statistical uncertainties only. |
png pdf |
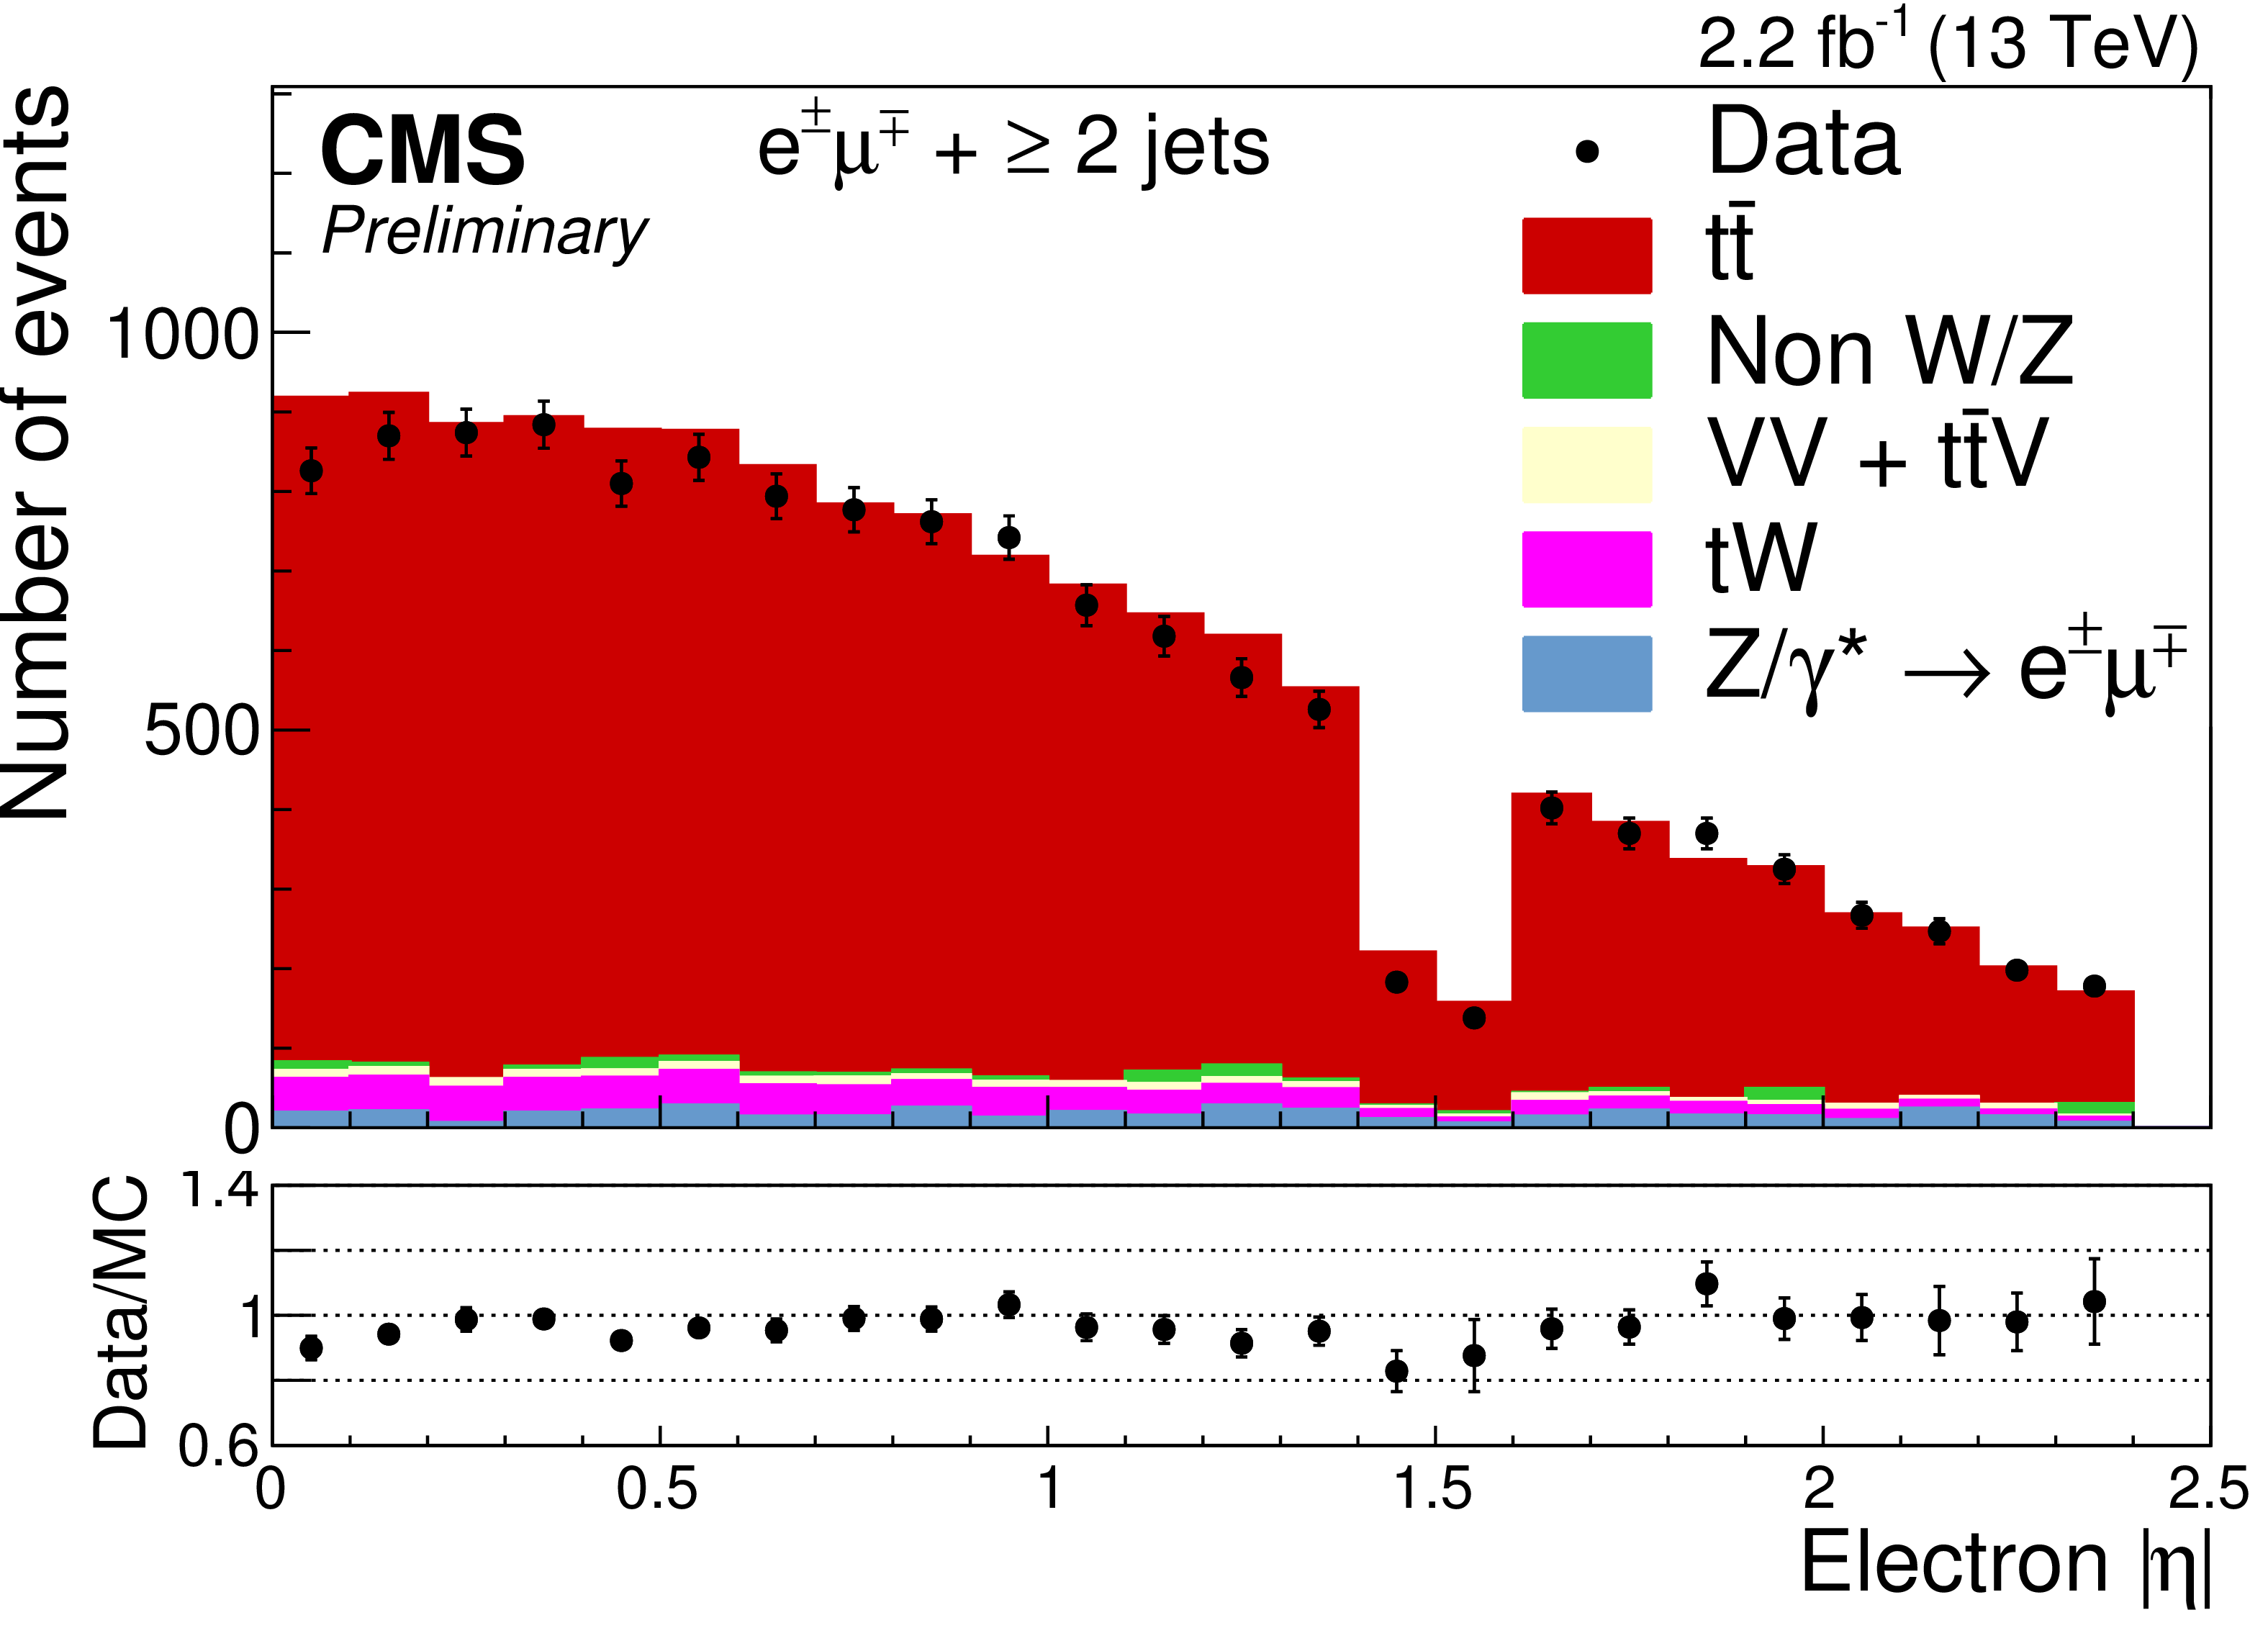
Figure 2-d:
The distributions of (a) $ {p_{\mathrm {T}}} $ and (b) $\eta $ of the muon, and (c) $ {p_{\mathrm {T}}} $ and (d) $\eta $ of the electron after the selection of jets and before the $ \mathrm{ b } $ tagging requirement. The expected distributions for $ {\mathrm{ t \bar{t} } } $ signal and individual backgrounds are shown after data-driven corrections are applied; for the left plots (a,c) the last bin contains the overflow events. The ratios of data to the sum of the expected yields are given at the bottom of each panel. Error bars indicate statistical uncertainties only. |

png pdf |
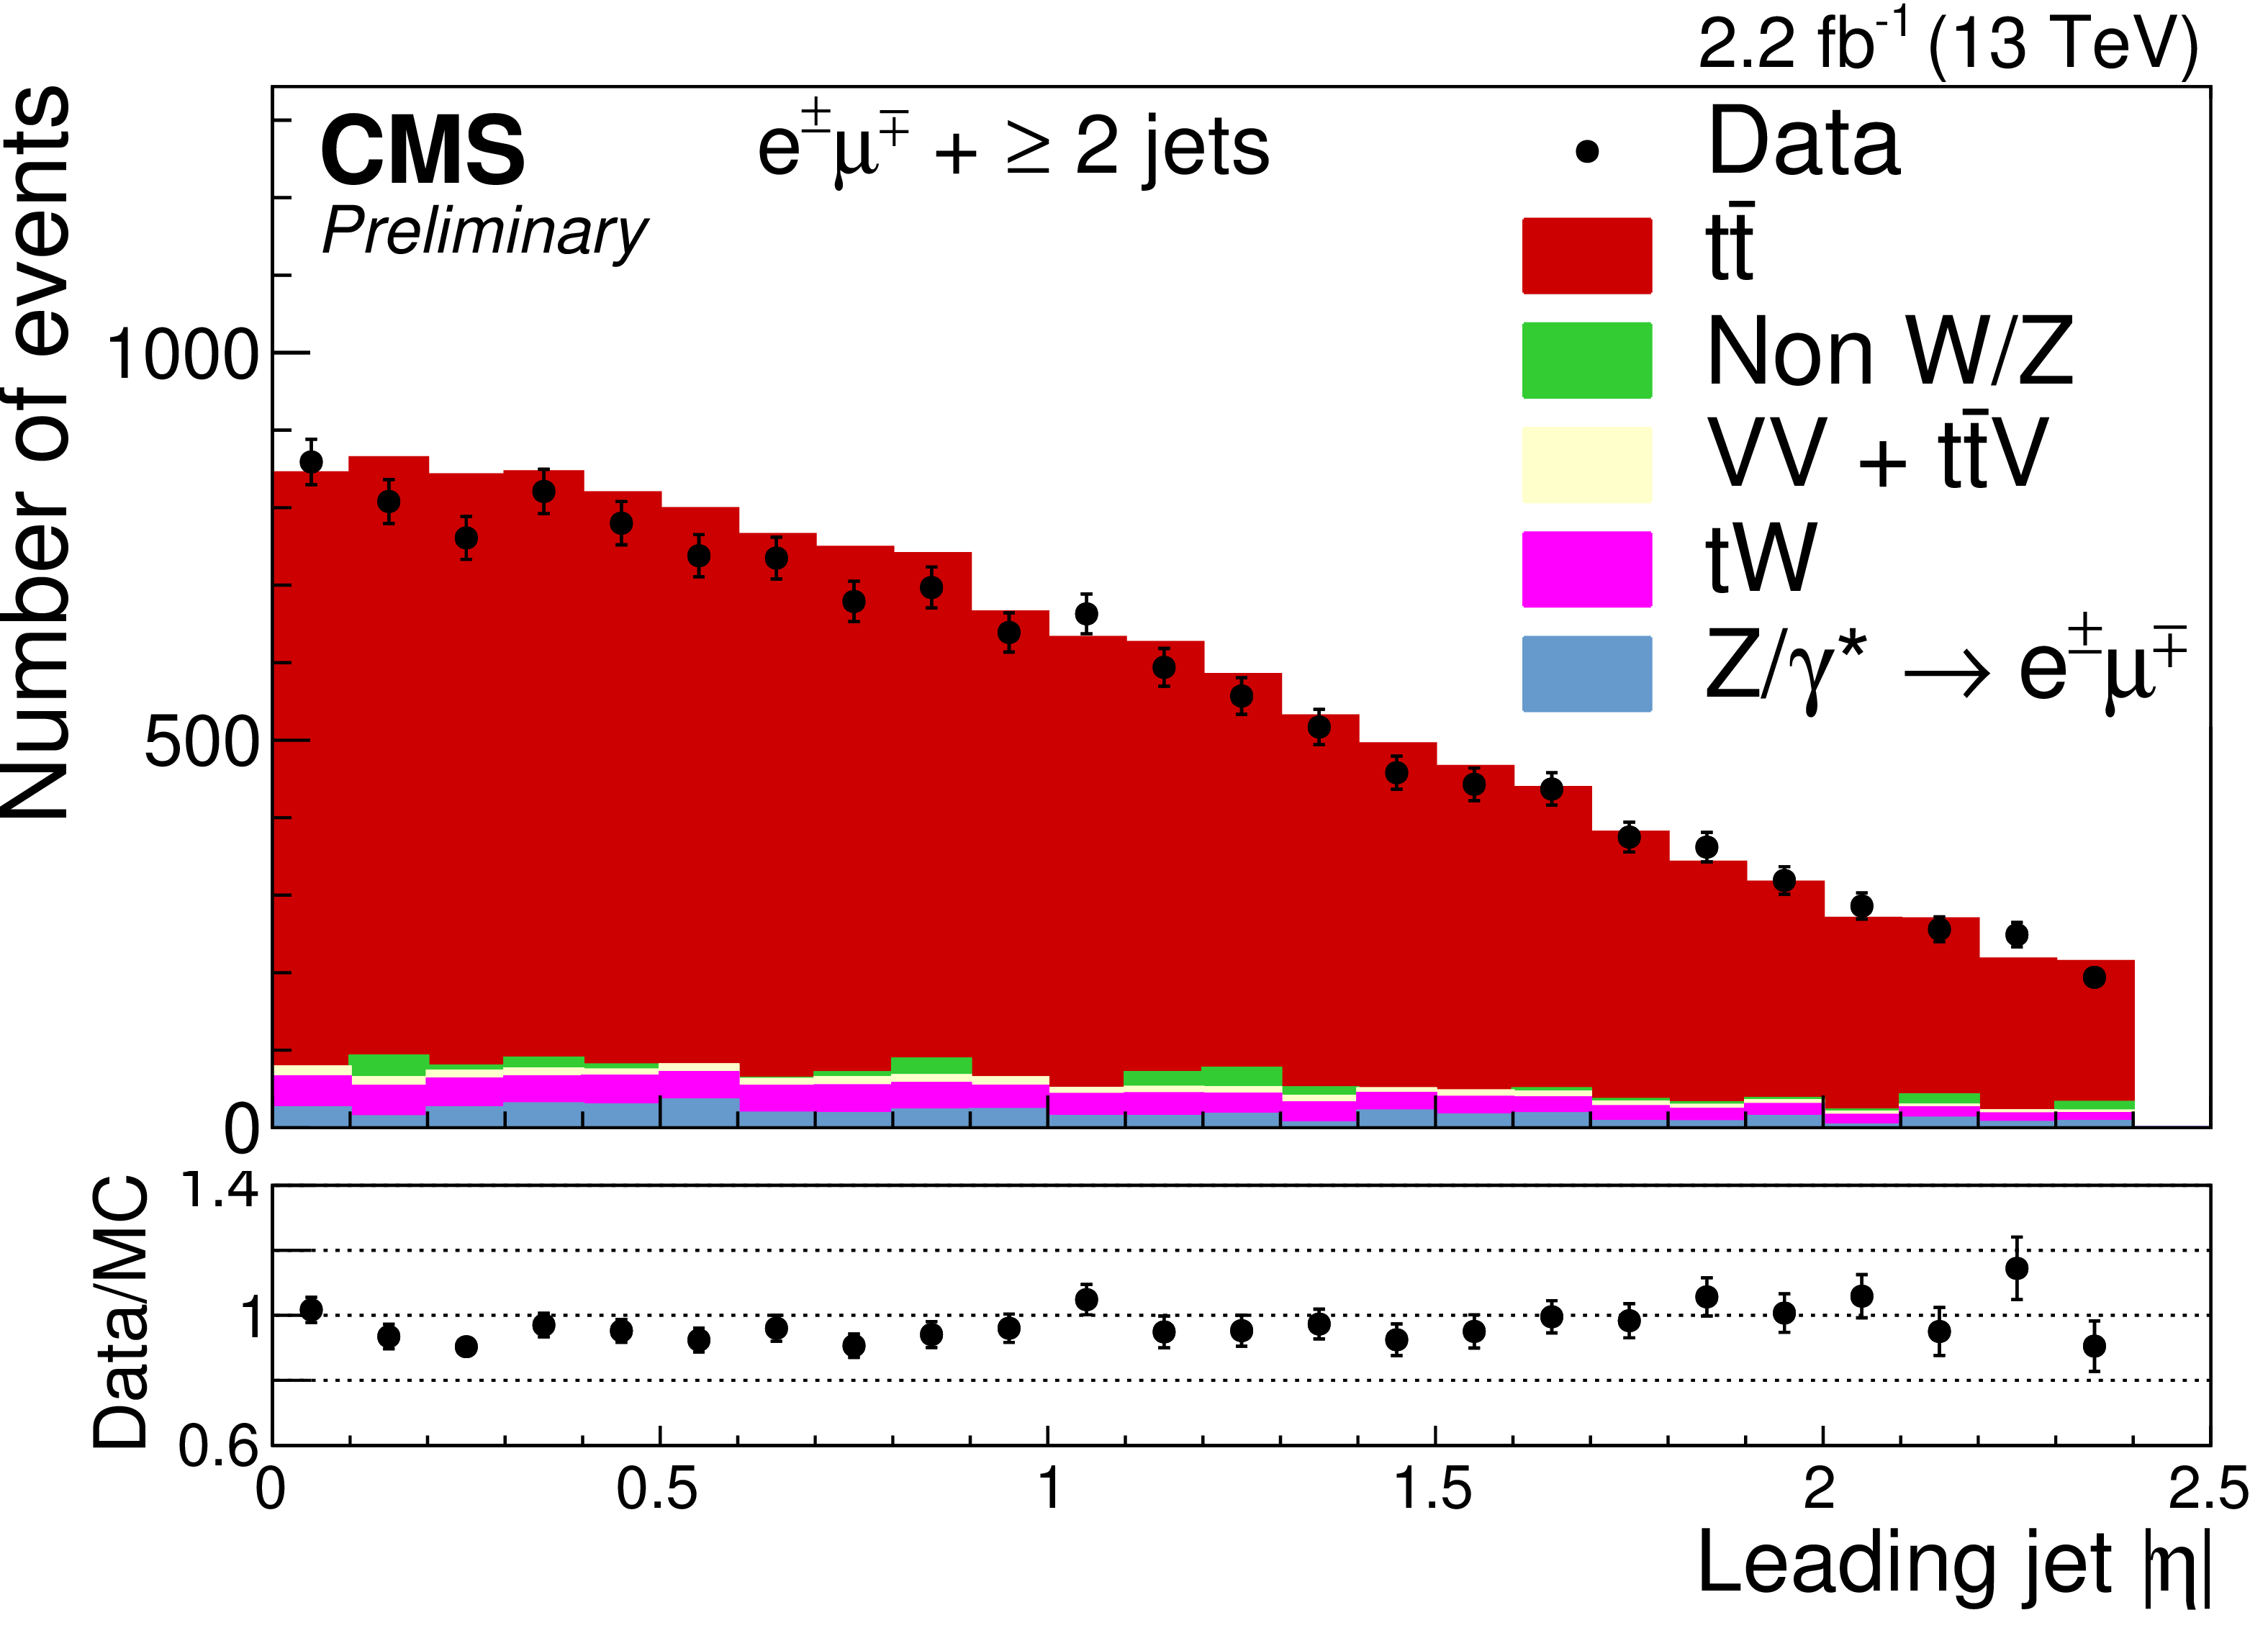
Figure 3-a:
The distributions of (a) $ {p_{\mathrm {T}}} $ and (b) $\eta $ for the highest-$ {p_{\mathrm {T}}} $ jet, (c) $ {p_{\mathrm {T}}} $ and (d) $\eta $ for the second highest-$ {p_{\mathrm {T}}} $ jet, (e) $H_T$ and (f) b-tag jet multiplicity after the jets selection and before the $ \mathrm{ b } $ tagging requirement. The expected distributions for $ {\mathrm{ t \bar{t} } } $ signal and individual backgrounds are shown after data-driven corrections are applied; the last bin contains the overflow events. The ratios of data to the sum of the expected yields are given at the bottom of each panel. Error bars indicate statistical uncertainties only. |
png pdf |
Figure 3-b:
The distributions of (a) $ {p_{\mathrm {T}}} $ and (b) $\eta $ for the highest-$ {p_{\mathrm {T}}} $ jet, (c) $ {p_{\mathrm {T}}} $ and (d) $\eta $ for the second highest-$ {p_{\mathrm {T}}} $ jet, (e) $H_T$ and (f) b-tag jet multiplicity after the jets selection and before the $ \mathrm{ b } $ tagging requirement. The expected distributions for $ {\mathrm{ t \bar{t} } } $ signal and individual backgrounds are shown after data-driven corrections are applied; the last bin contains the overflow events. The ratios of data to the sum of the expected yields are given at the bottom of each panel. Error bars indicate statistical uncertainties only. |
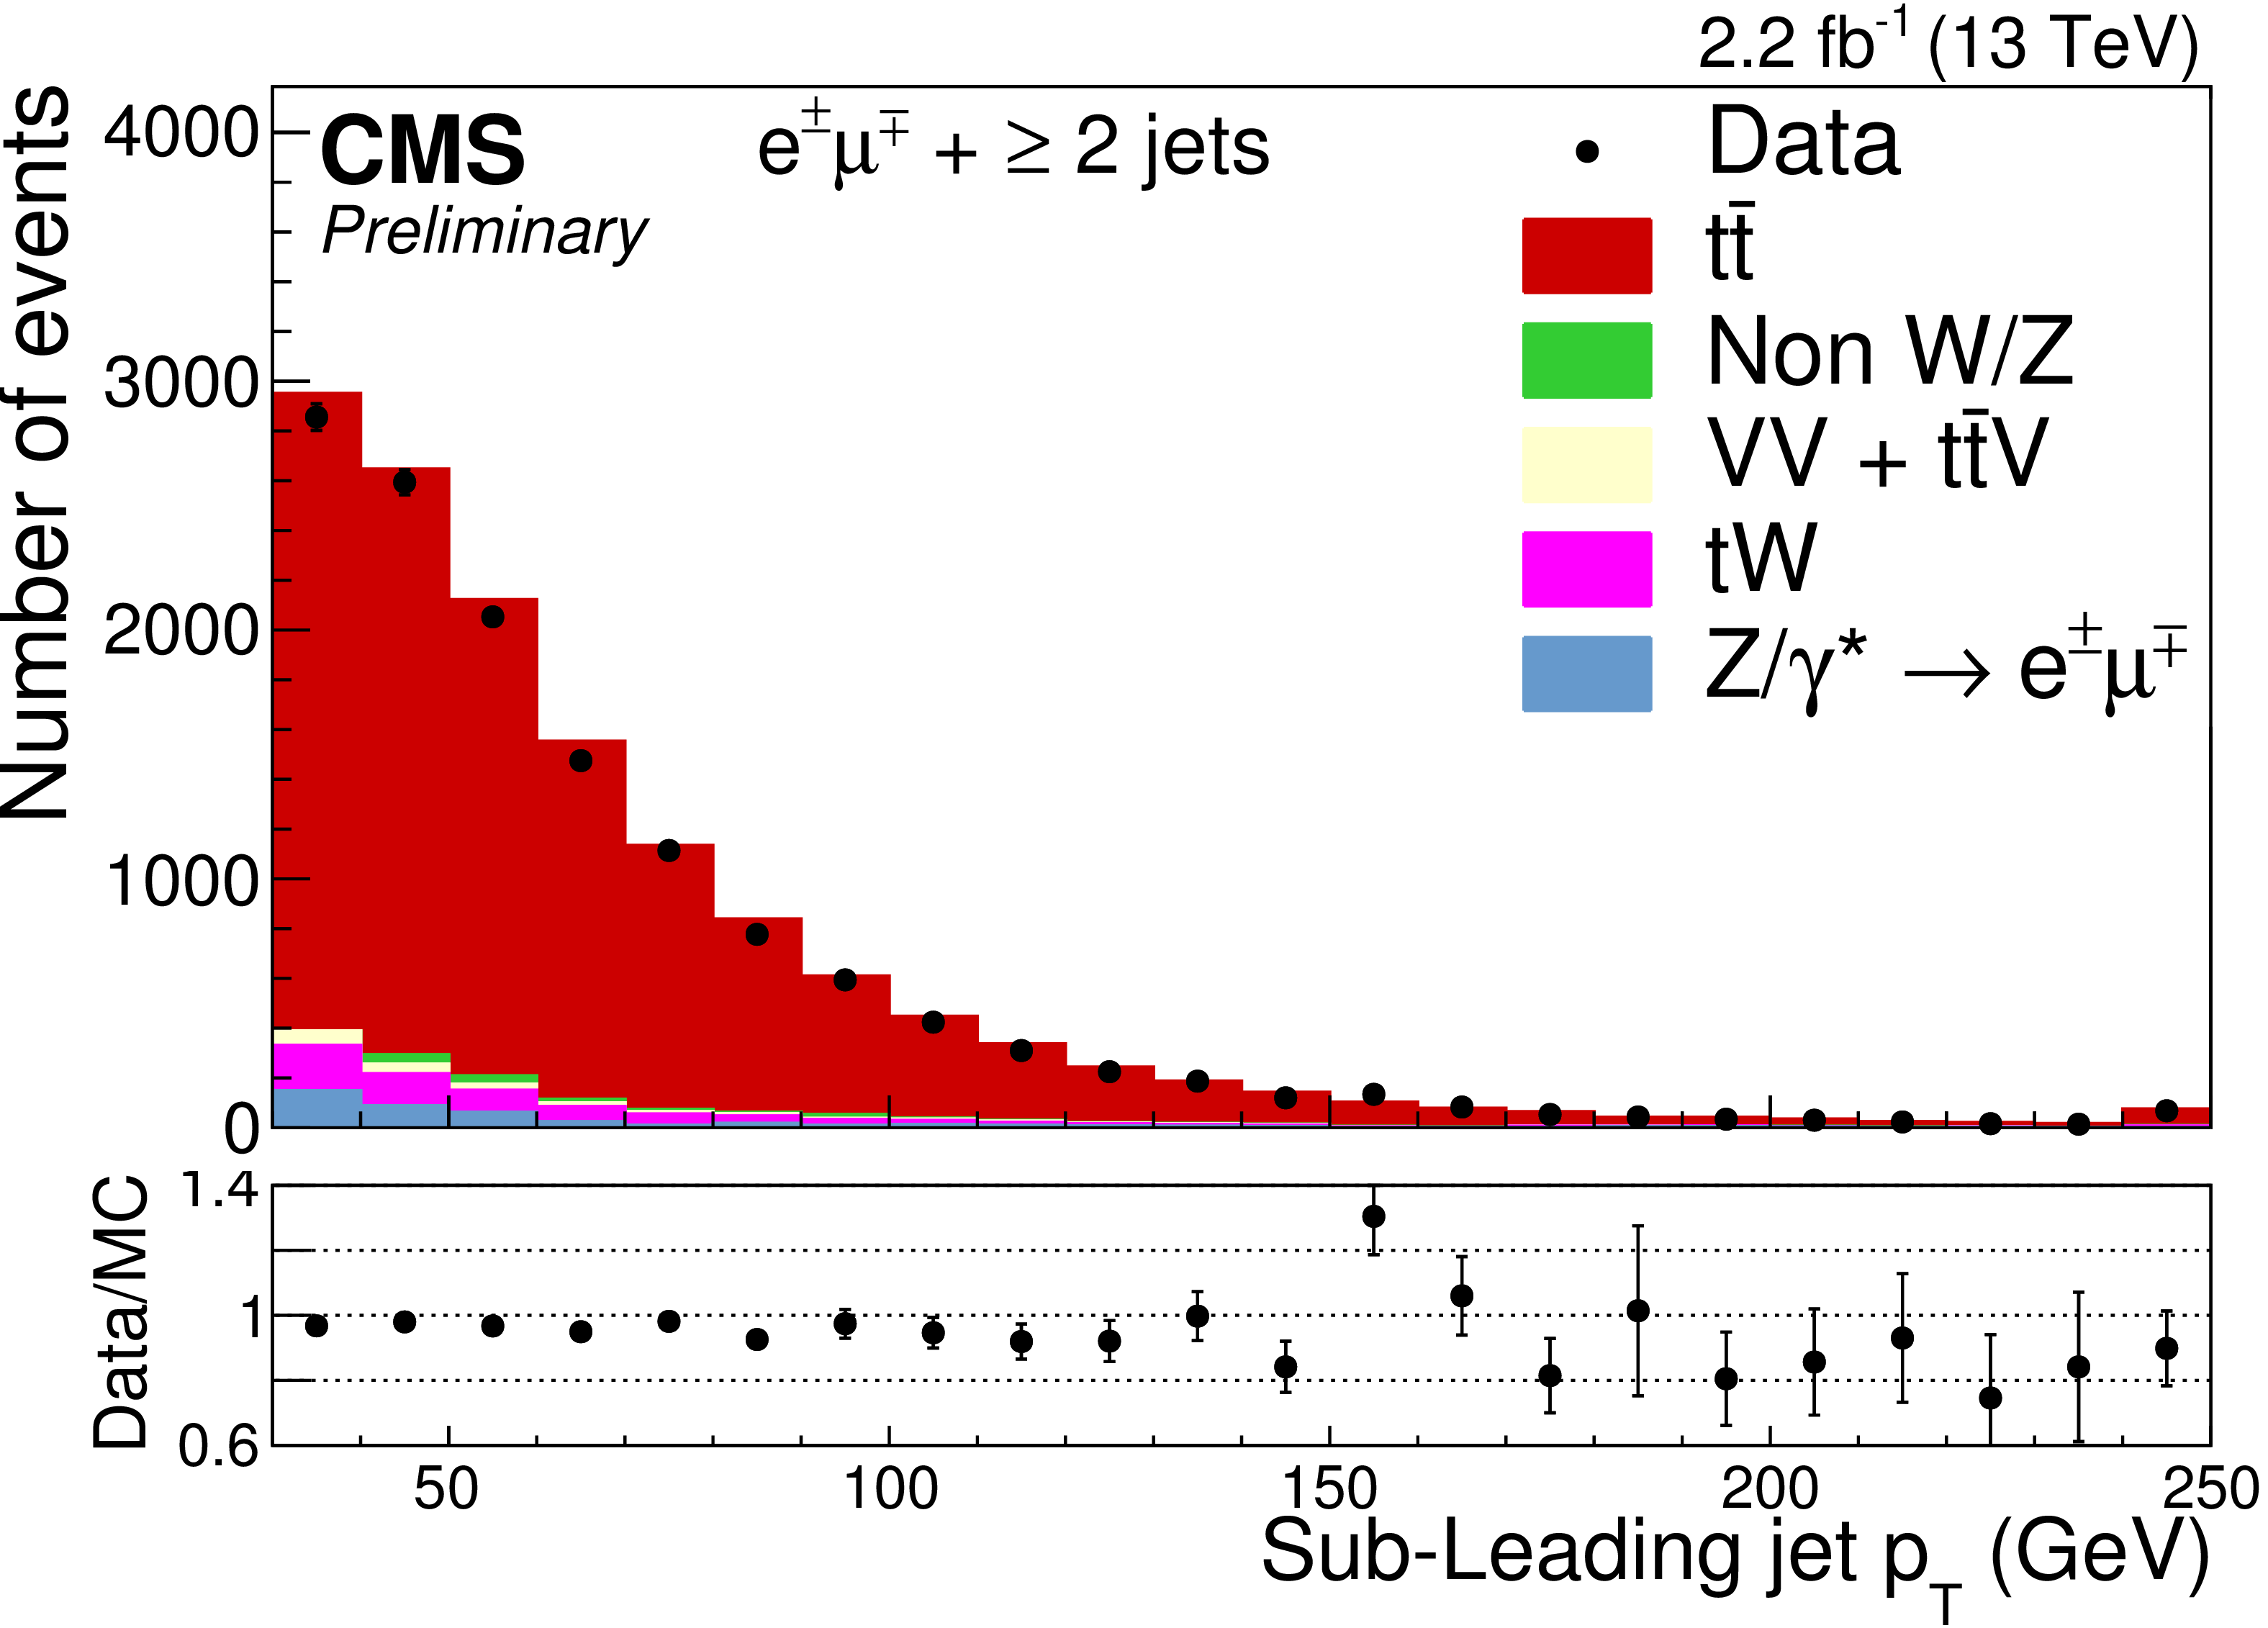
png pdf |
Figure 3-c:
The distributions of (a) $ {p_{\mathrm {T}}} $ and (b) $\eta $ for the highest-$ {p_{\mathrm {T}}} $ jet, (c) $ {p_{\mathrm {T}}} $ and (d) $\eta $ for the second highest-$ {p_{\mathrm {T}}} $ jet, (e) $H_T$ and (f) b-tag jet multiplicity after the jets selection and before the $ \mathrm{ b } $ tagging requirement. The expected distributions for $ {\mathrm{ t \bar{t} } } $ signal and individual backgrounds are shown after data-driven corrections are applied; the last bin contains the overflow events. The ratios of data to the sum of the expected yields are given at the bottom of each panel. Error bars indicate statistical uncertainties only. |

png pdf |
Figure 3-d:
The distributions of (a) $ {p_{\mathrm {T}}} $ and (b) $\eta $ for the highest-$ {p_{\mathrm {T}}} $ jet, (c) $ {p_{\mathrm {T}}} $ and (d) $\eta $ for the second highest-$ {p_{\mathrm {T}}} $ jet, (e) $H_T$ and (f) b-tag jet multiplicity after the jets selection and before the $ \mathrm{ b } $ tagging requirement. The expected distributions for $ {\mathrm{ t \bar{t} } } $ signal and individual backgrounds are shown after data-driven corrections are applied; the last bin contains the overflow events. The ratios of data to the sum of the expected yields are given at the bottom of each panel. Error bars indicate statistical uncertainties only. |
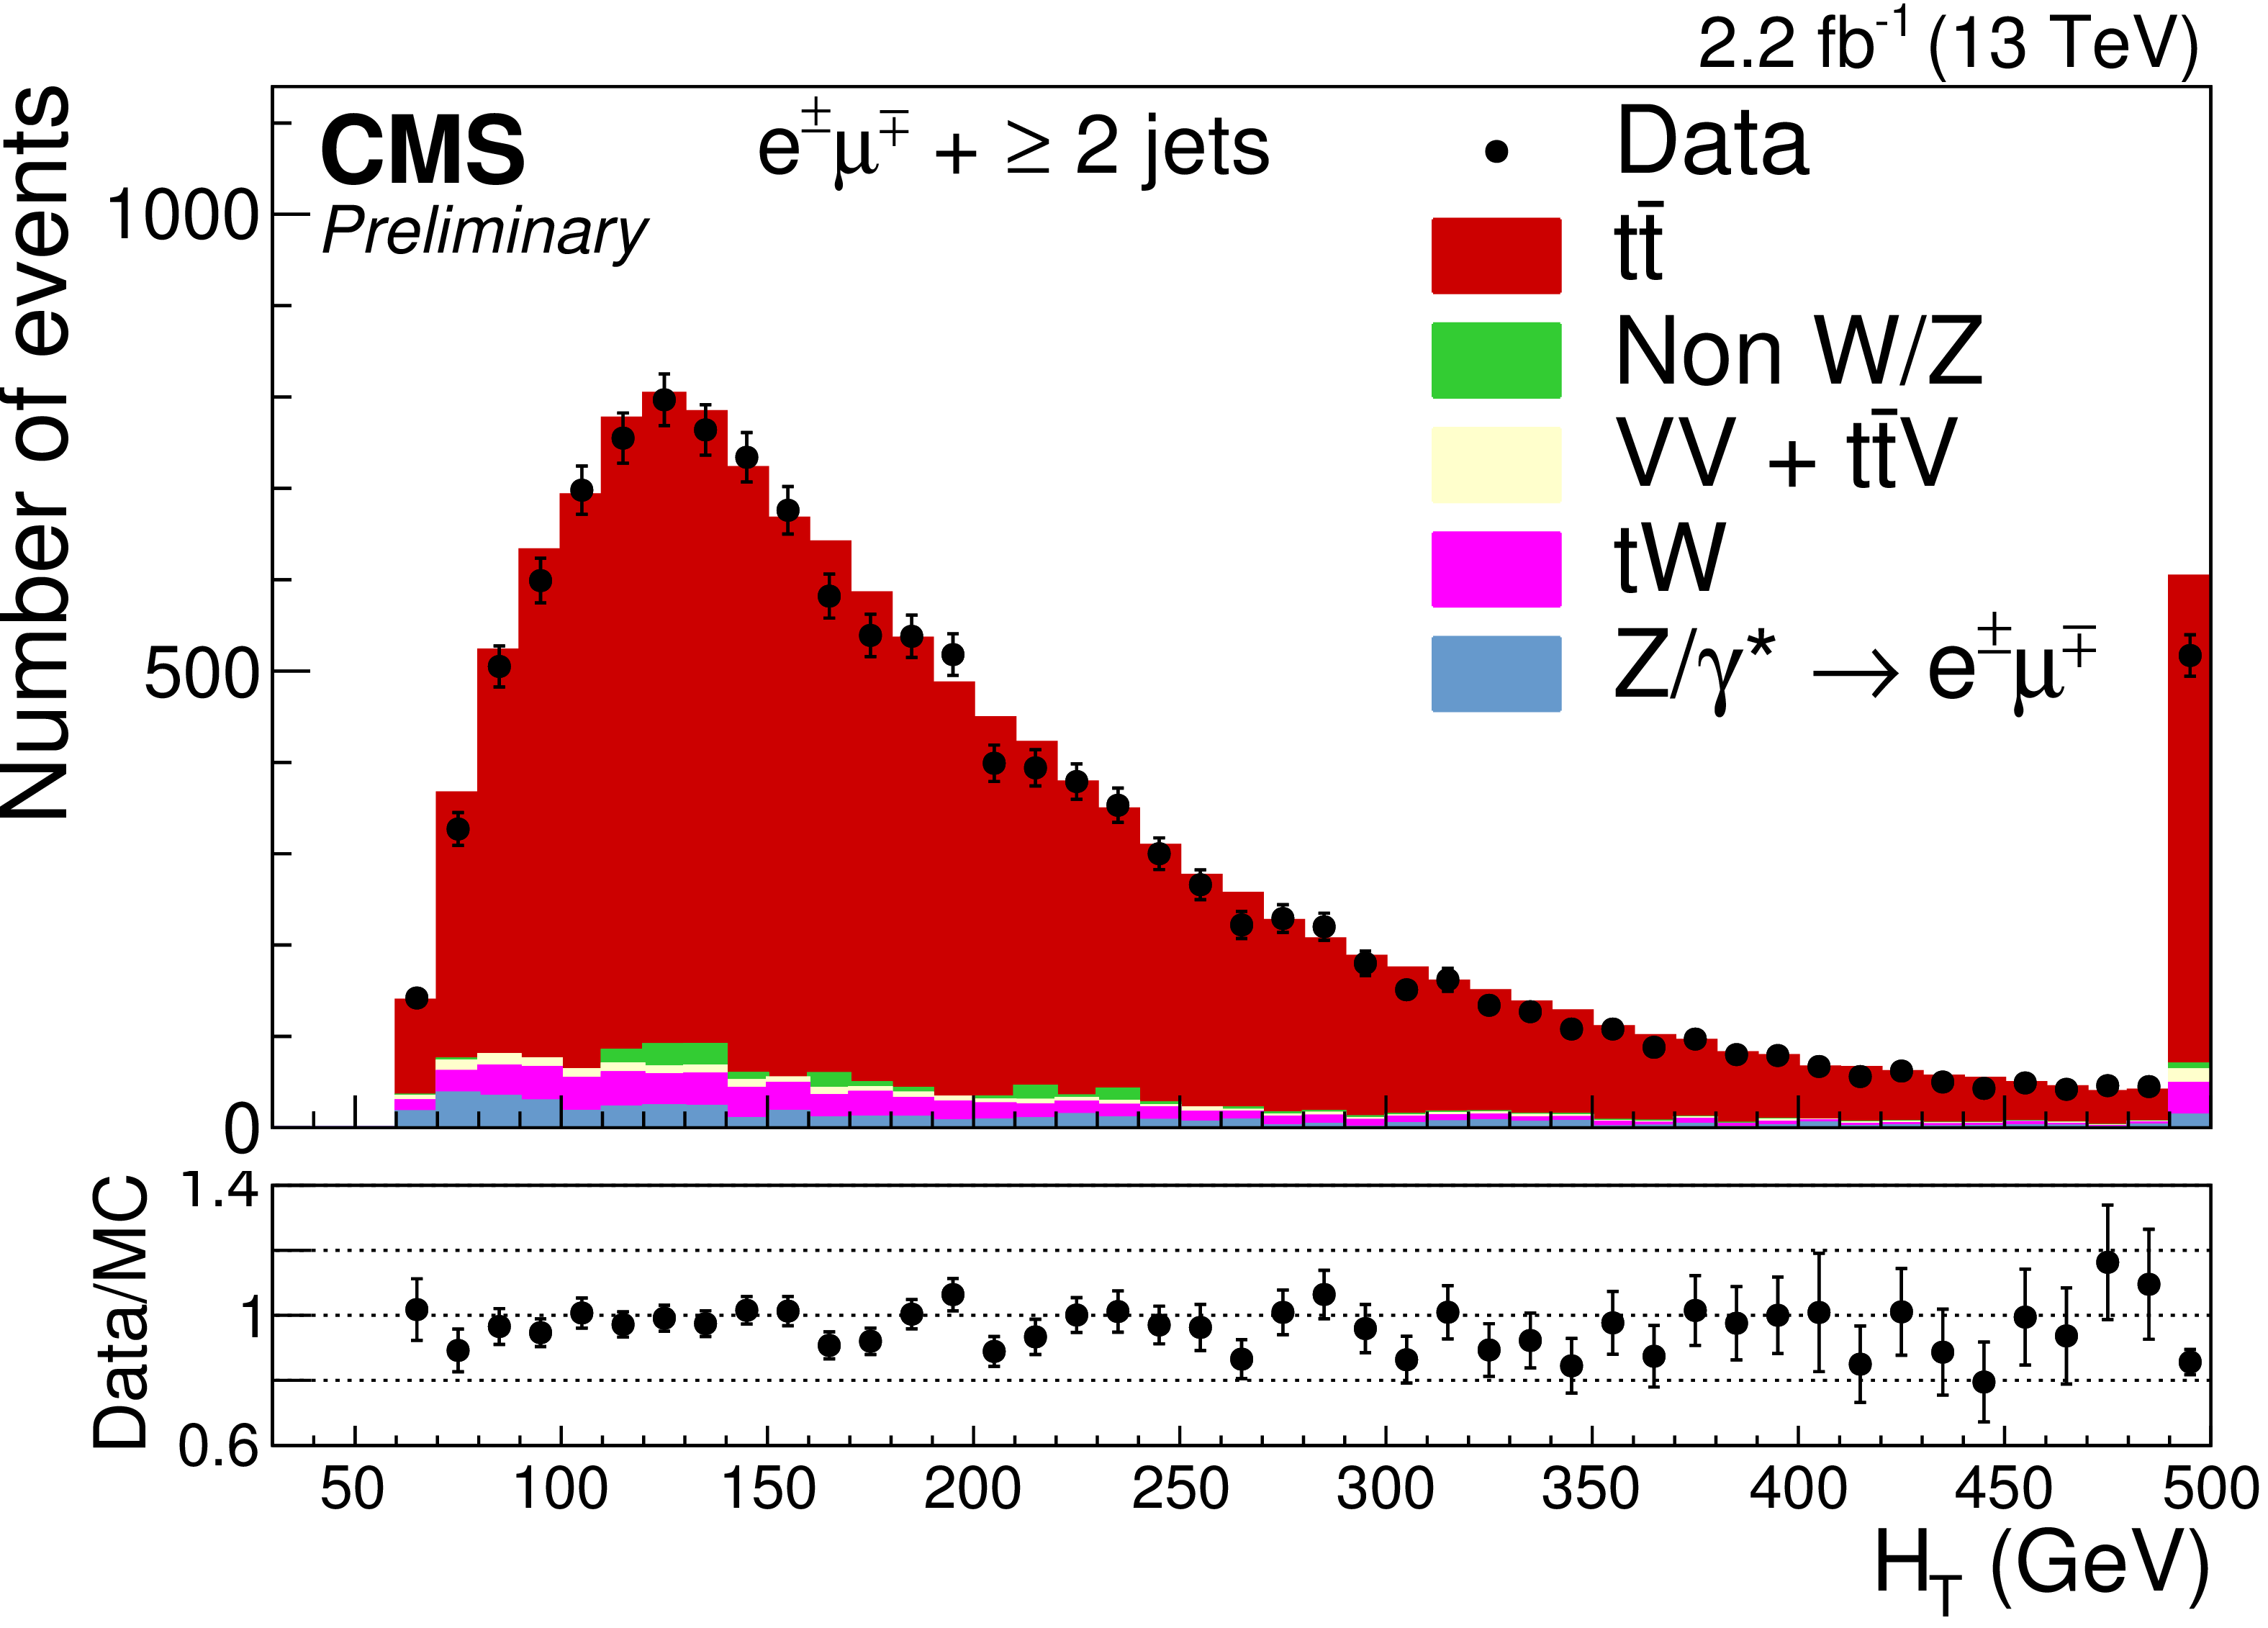
png pdf |
Figure 3-e:
The distributions of (a) $ {p_{\mathrm {T}}} $ and (b) $\eta $ for the highest-$ {p_{\mathrm {T}}} $ jet, (c) $ {p_{\mathrm {T}}} $ and (d) $\eta $ for the second highest-$ {p_{\mathrm {T}}} $ jet, (e) $H_T$ and (f) b-tag jet multiplicity after the jets selection and before the $ \mathrm{ b } $ tagging requirement. The expected distributions for $ {\mathrm{ t \bar{t} } } $ signal and individual backgrounds are shown after data-driven corrections are applied; the last bin contains the overflow events. The ratios of data to the sum of the expected yields are given at the bottom of each panel. Error bars indicate statistical uncertainties only. |
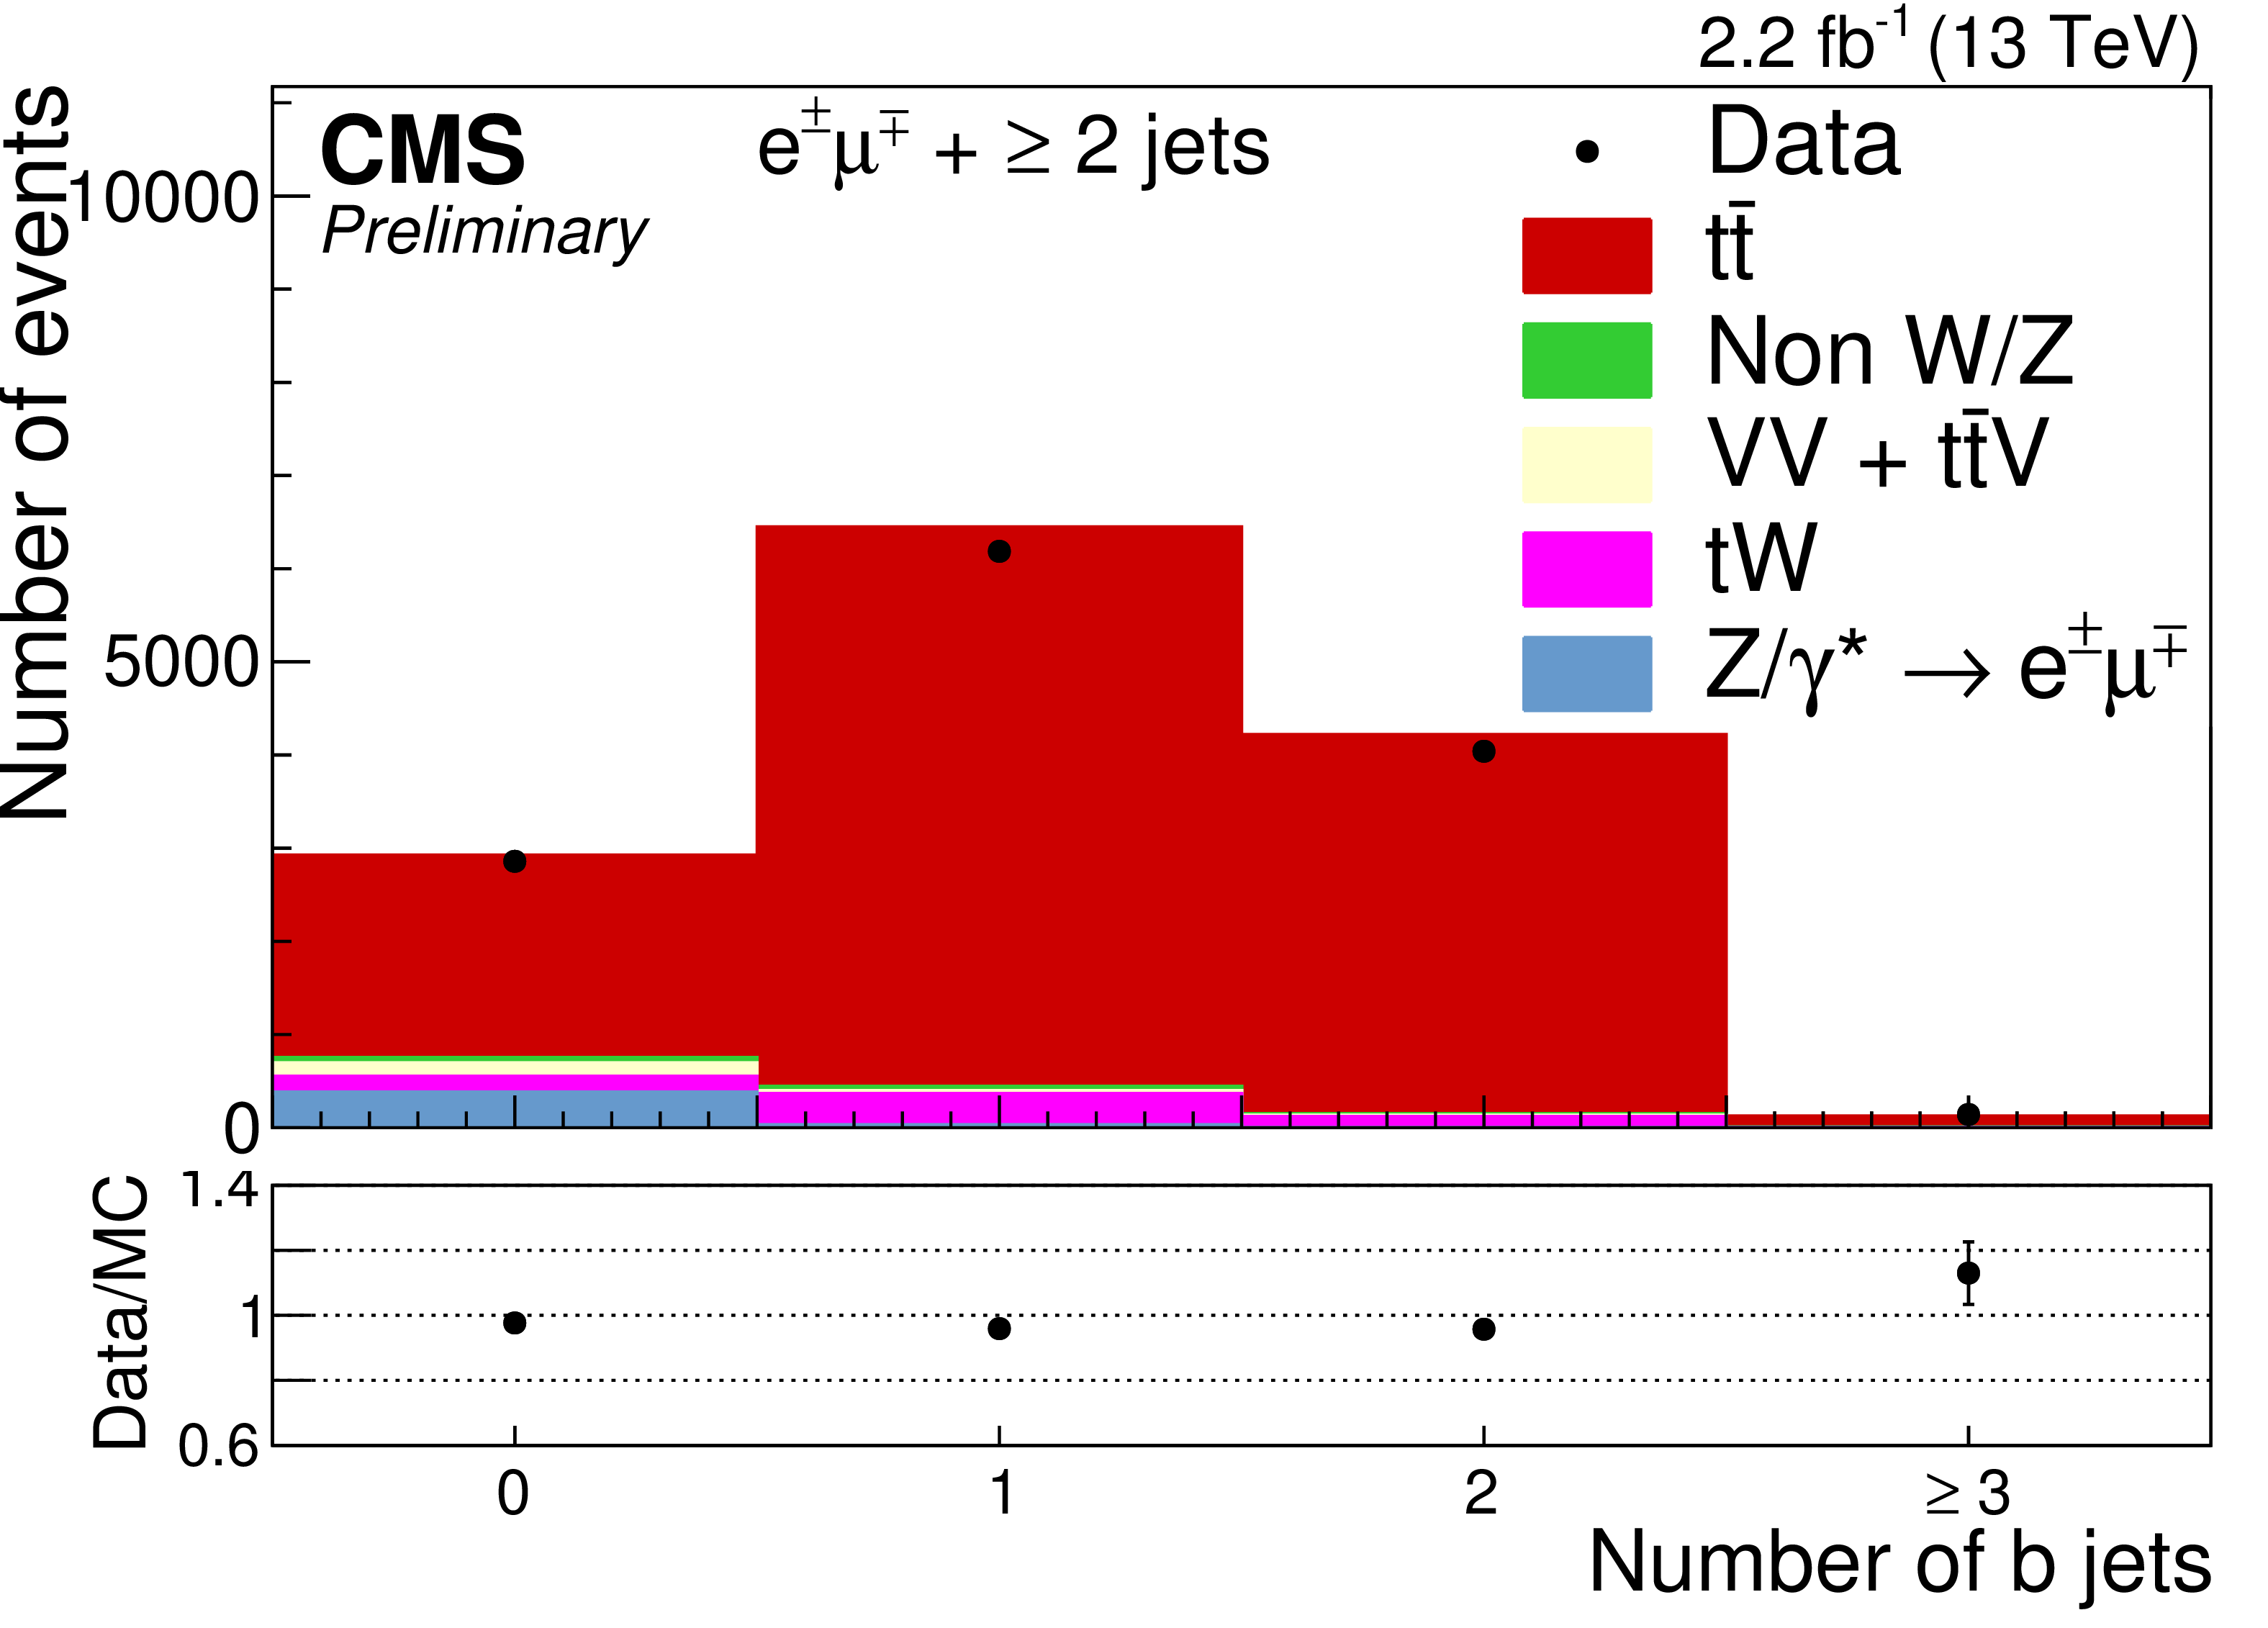
png pdf |
Figure 3-f:
The distributions of (a) $ {p_{\mathrm {T}}} $ and (b) $\eta $ for the highest-$ {p_{\mathrm {T}}} $ jet, (c) $ {p_{\mathrm {T}}} $ and (d) $\eta $ for the second highest-$ {p_{\mathrm {T}}} $ jet, (e) $H_T$ and (f) b-tag jet multiplicity after the jets selection and before the $ \mathrm{ b } $ tagging requirement. The expected distributions for $ {\mathrm{ t \bar{t} } } $ signal and individual backgrounds are shown after data-driven corrections are applied; the last bin contains the overflow events. The ratios of data to the sum of the expected yields are given at the bottom of each panel. Error bars indicate statistical uncertainties only. |
| Tables | |

png |
Table 1:
Summary of the individual contributions to the systematic uncertainty on the $\sigma _{ {\mathrm{ t \bar{t} } } }$ measurement. The uncertainties are given in pb and as relative uncertainties. The statistical uncertainty and the total uncertainty on the result are also given. |
png |
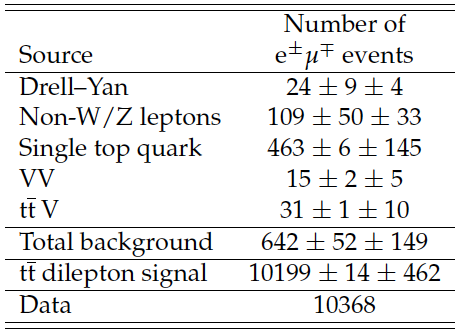
Table 2:
Number of dilepton events obtained after applying the full selection. The results are given for the individual sources of background, $ {\mathrm{ t \bar{t} } } $ signal with a top quark mass of 172.5 GeV and $\sigma _{ {\mathrm{ t \bar{t} } } } =$ 832 $^{+40}_{-46}$ pb, and data. The uncertainties correspond to the statistical and systematic components. |
|
|
Compact Muon Solenoid LHC, CERN |
|

|

|

|

|

|