

Compact Muon Solenoid
LHC, CERN
| CMS-PAS-TOP-16-001 | ||
| Search for CP violation in top-pair events with lepton+jets channel at $ \sqrt{s} =$ 8TeV | ||
| CMS Collaboration | ||
| March 2016 | ||
| Abstract: We present the first measurement at the LHC of CP-violation asymmetries in $ \mathrm{ t \bar{t} }$ events based on the T-odd triple product correlations. The analyzed data are collected by the CMS experiment from pp collisions at a center-of-mass energy $\sqrt{s} =$ 8 TeV and correspond to an integrated luminosity of 19.7 fb$^{-1}$. The T-odd observables are measured using the linearly independent four-momentum vectors associated with the top quark production and decay. The measured asymmetries show no evidence for CP-violation effects in $ \mathrm{ t \bar{t} }$ events, in agreement with the standard model prediction. | ||
|
Links:
CDS record (PDF) ;
CADI line (restricted) ;
These preliminary results are superseded in this paper, JHEP 03 (2017) 101. The superseded preliminary plots can be found here. |
||
| Figures | |

png pdf |
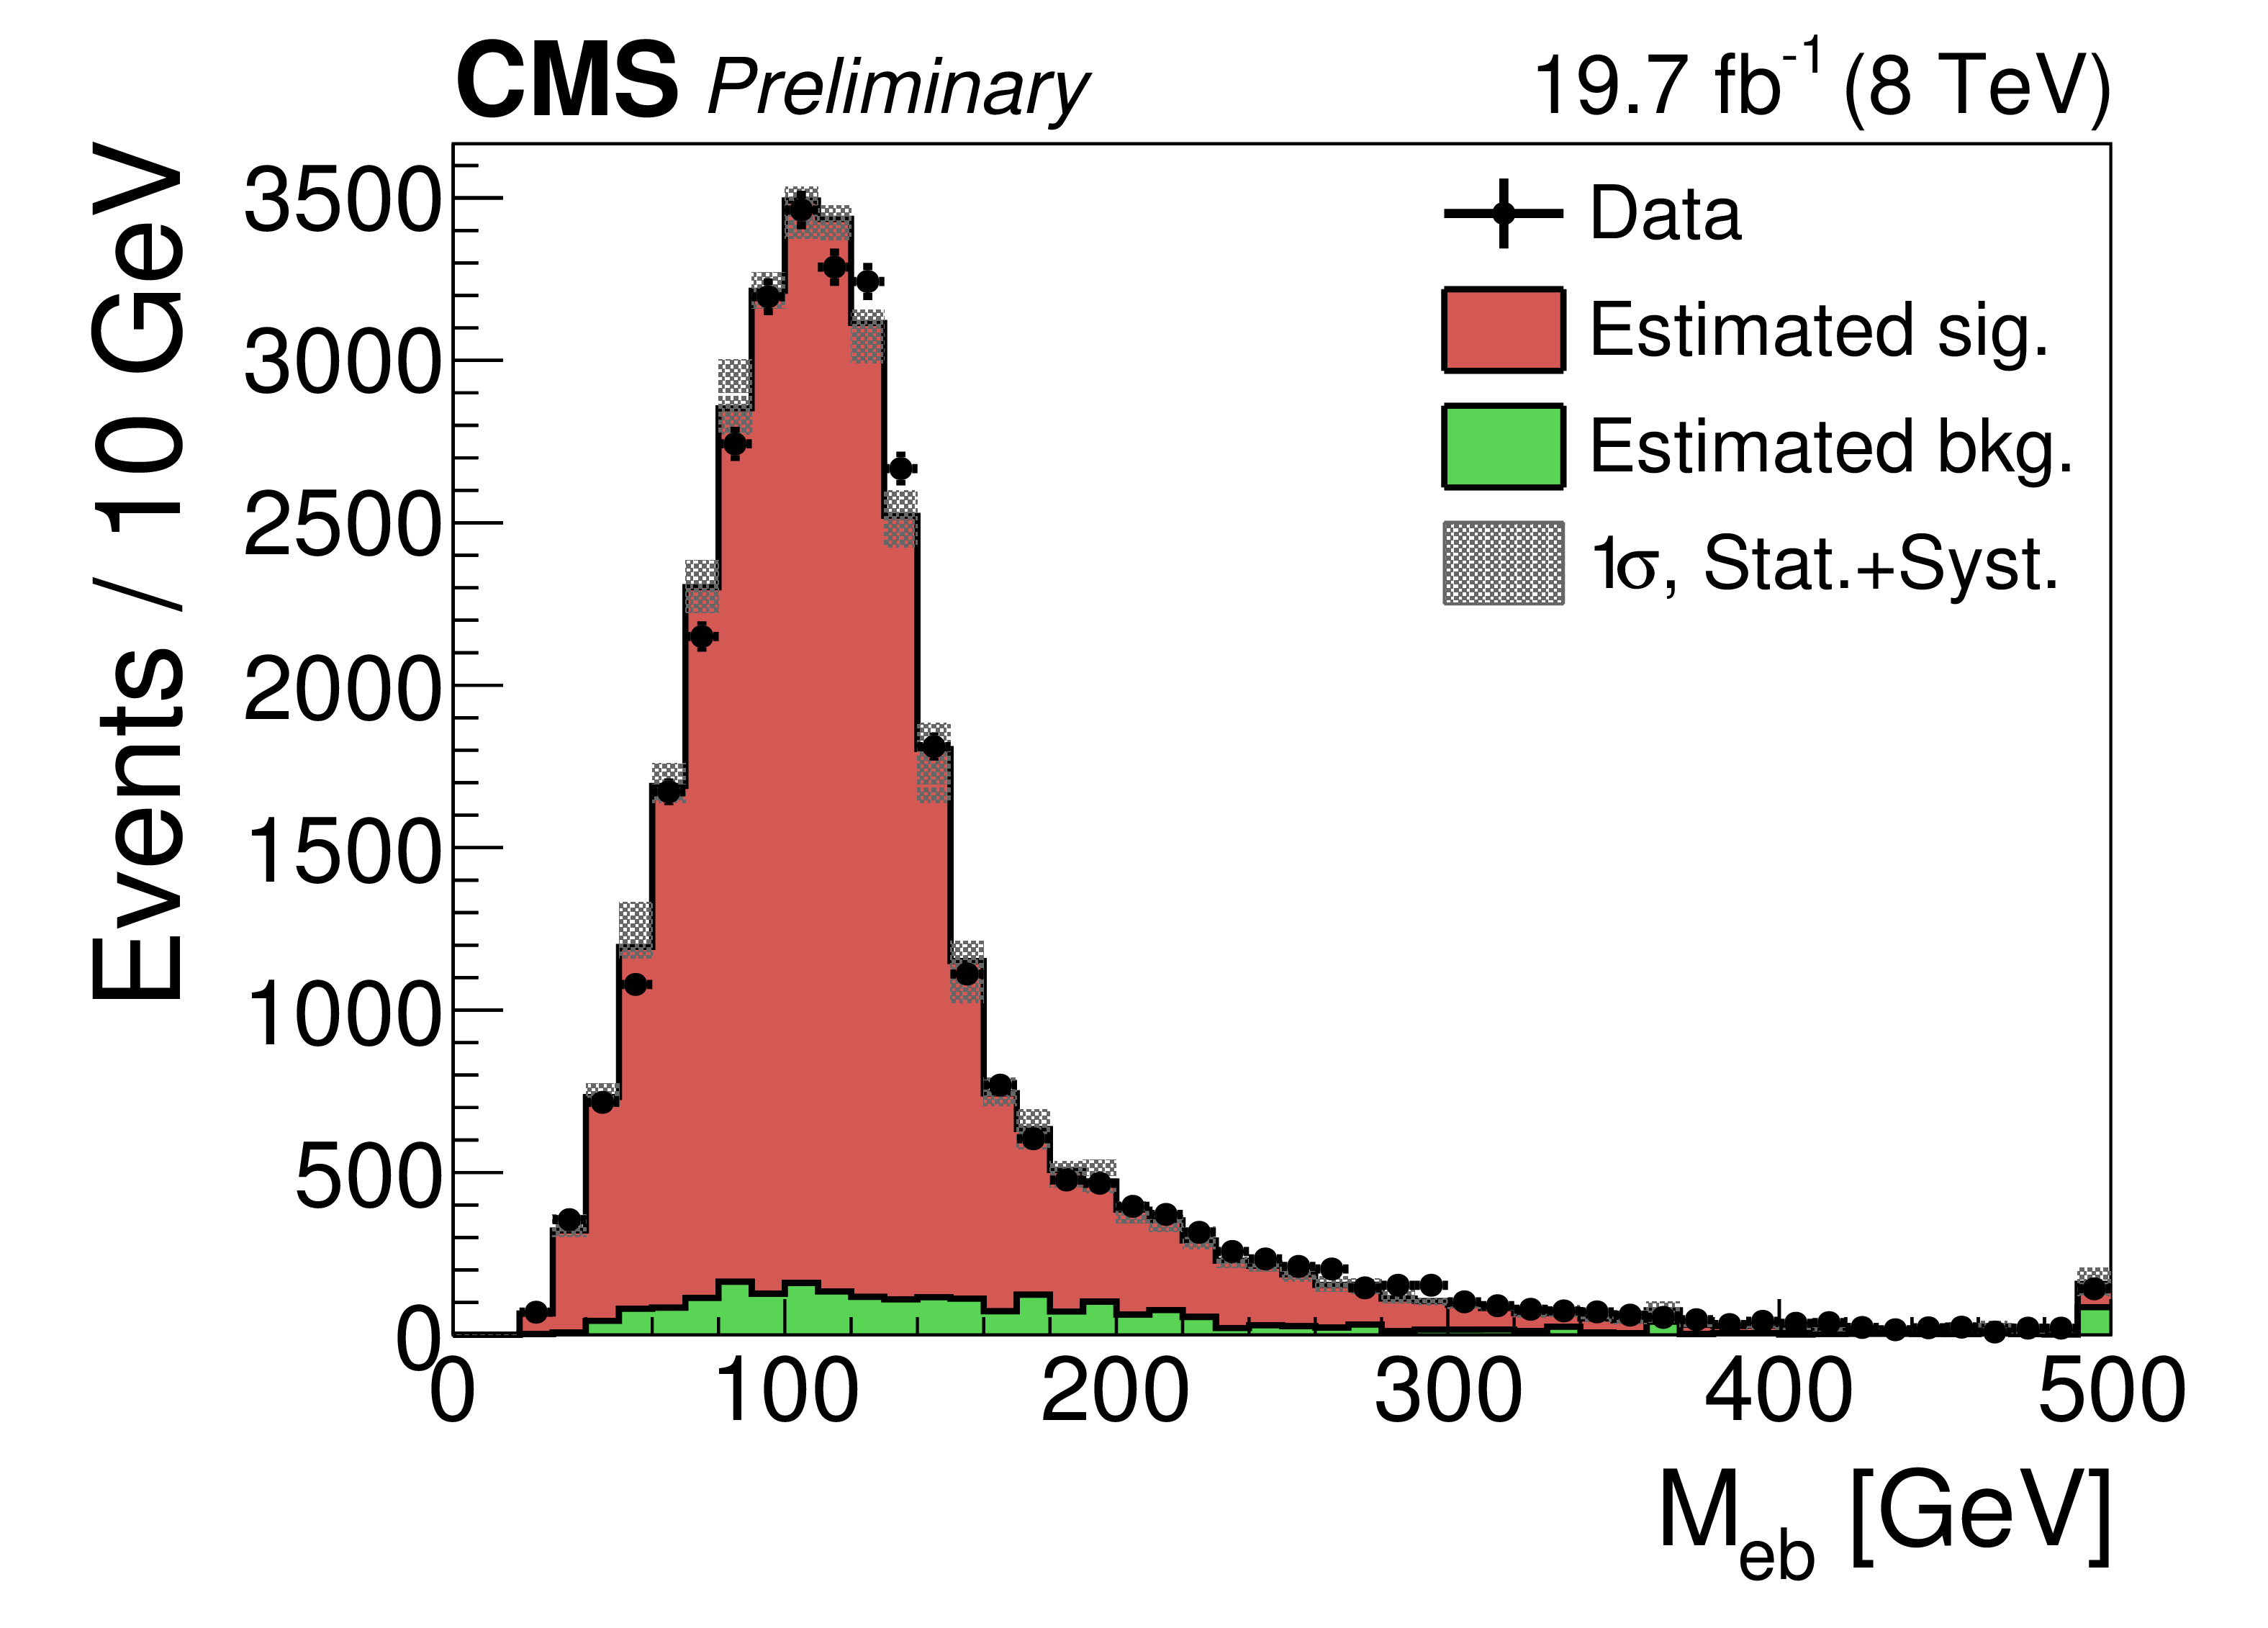
Figure 1-a:
Kinematic distributions for two different channels in the signal region after passing all event selections and applied corrections (including top $ {p_{\mathrm {T}}} $-reweighting). (a) and (b) are the invariant mass of the hadronic top candidate. (c) and (d) are the invariant mass of the lepton and b-jets associated to the leptonic top candidate. (a) and (c) are for the electron channel. (b) and (d) are for the muon channel. |

png pdf |
Figure 1-b:
Kinematic distributions for two different channels in the signal region after passing all event selections and applied corrections (including top $ {p_{\mathrm {T}}} $-reweighting). (a) and (b) are the invariant mass of the hadronic top candidate. (c) and (d) are the invariant mass of the lepton and b-jets associated to the leptonic top candidate. (a) and (c) are for the electron channel. (b) and (d) are for the muon channel. |
png pdf |
Figure 1-c:
Kinematic distributions for two different channels in the signal region after passing all event selections and applied corrections (including top $ {p_{\mathrm {T}}} $-reweighting). (a) and (b) are the invariant mass of the hadronic top candidate. (c) and (d) are the invariant mass of the lepton and b-jets associated to the leptonic top candidate. (a) and (c) are for the electron channel. (b) and (d) are for the muon channel. |

png pdf |
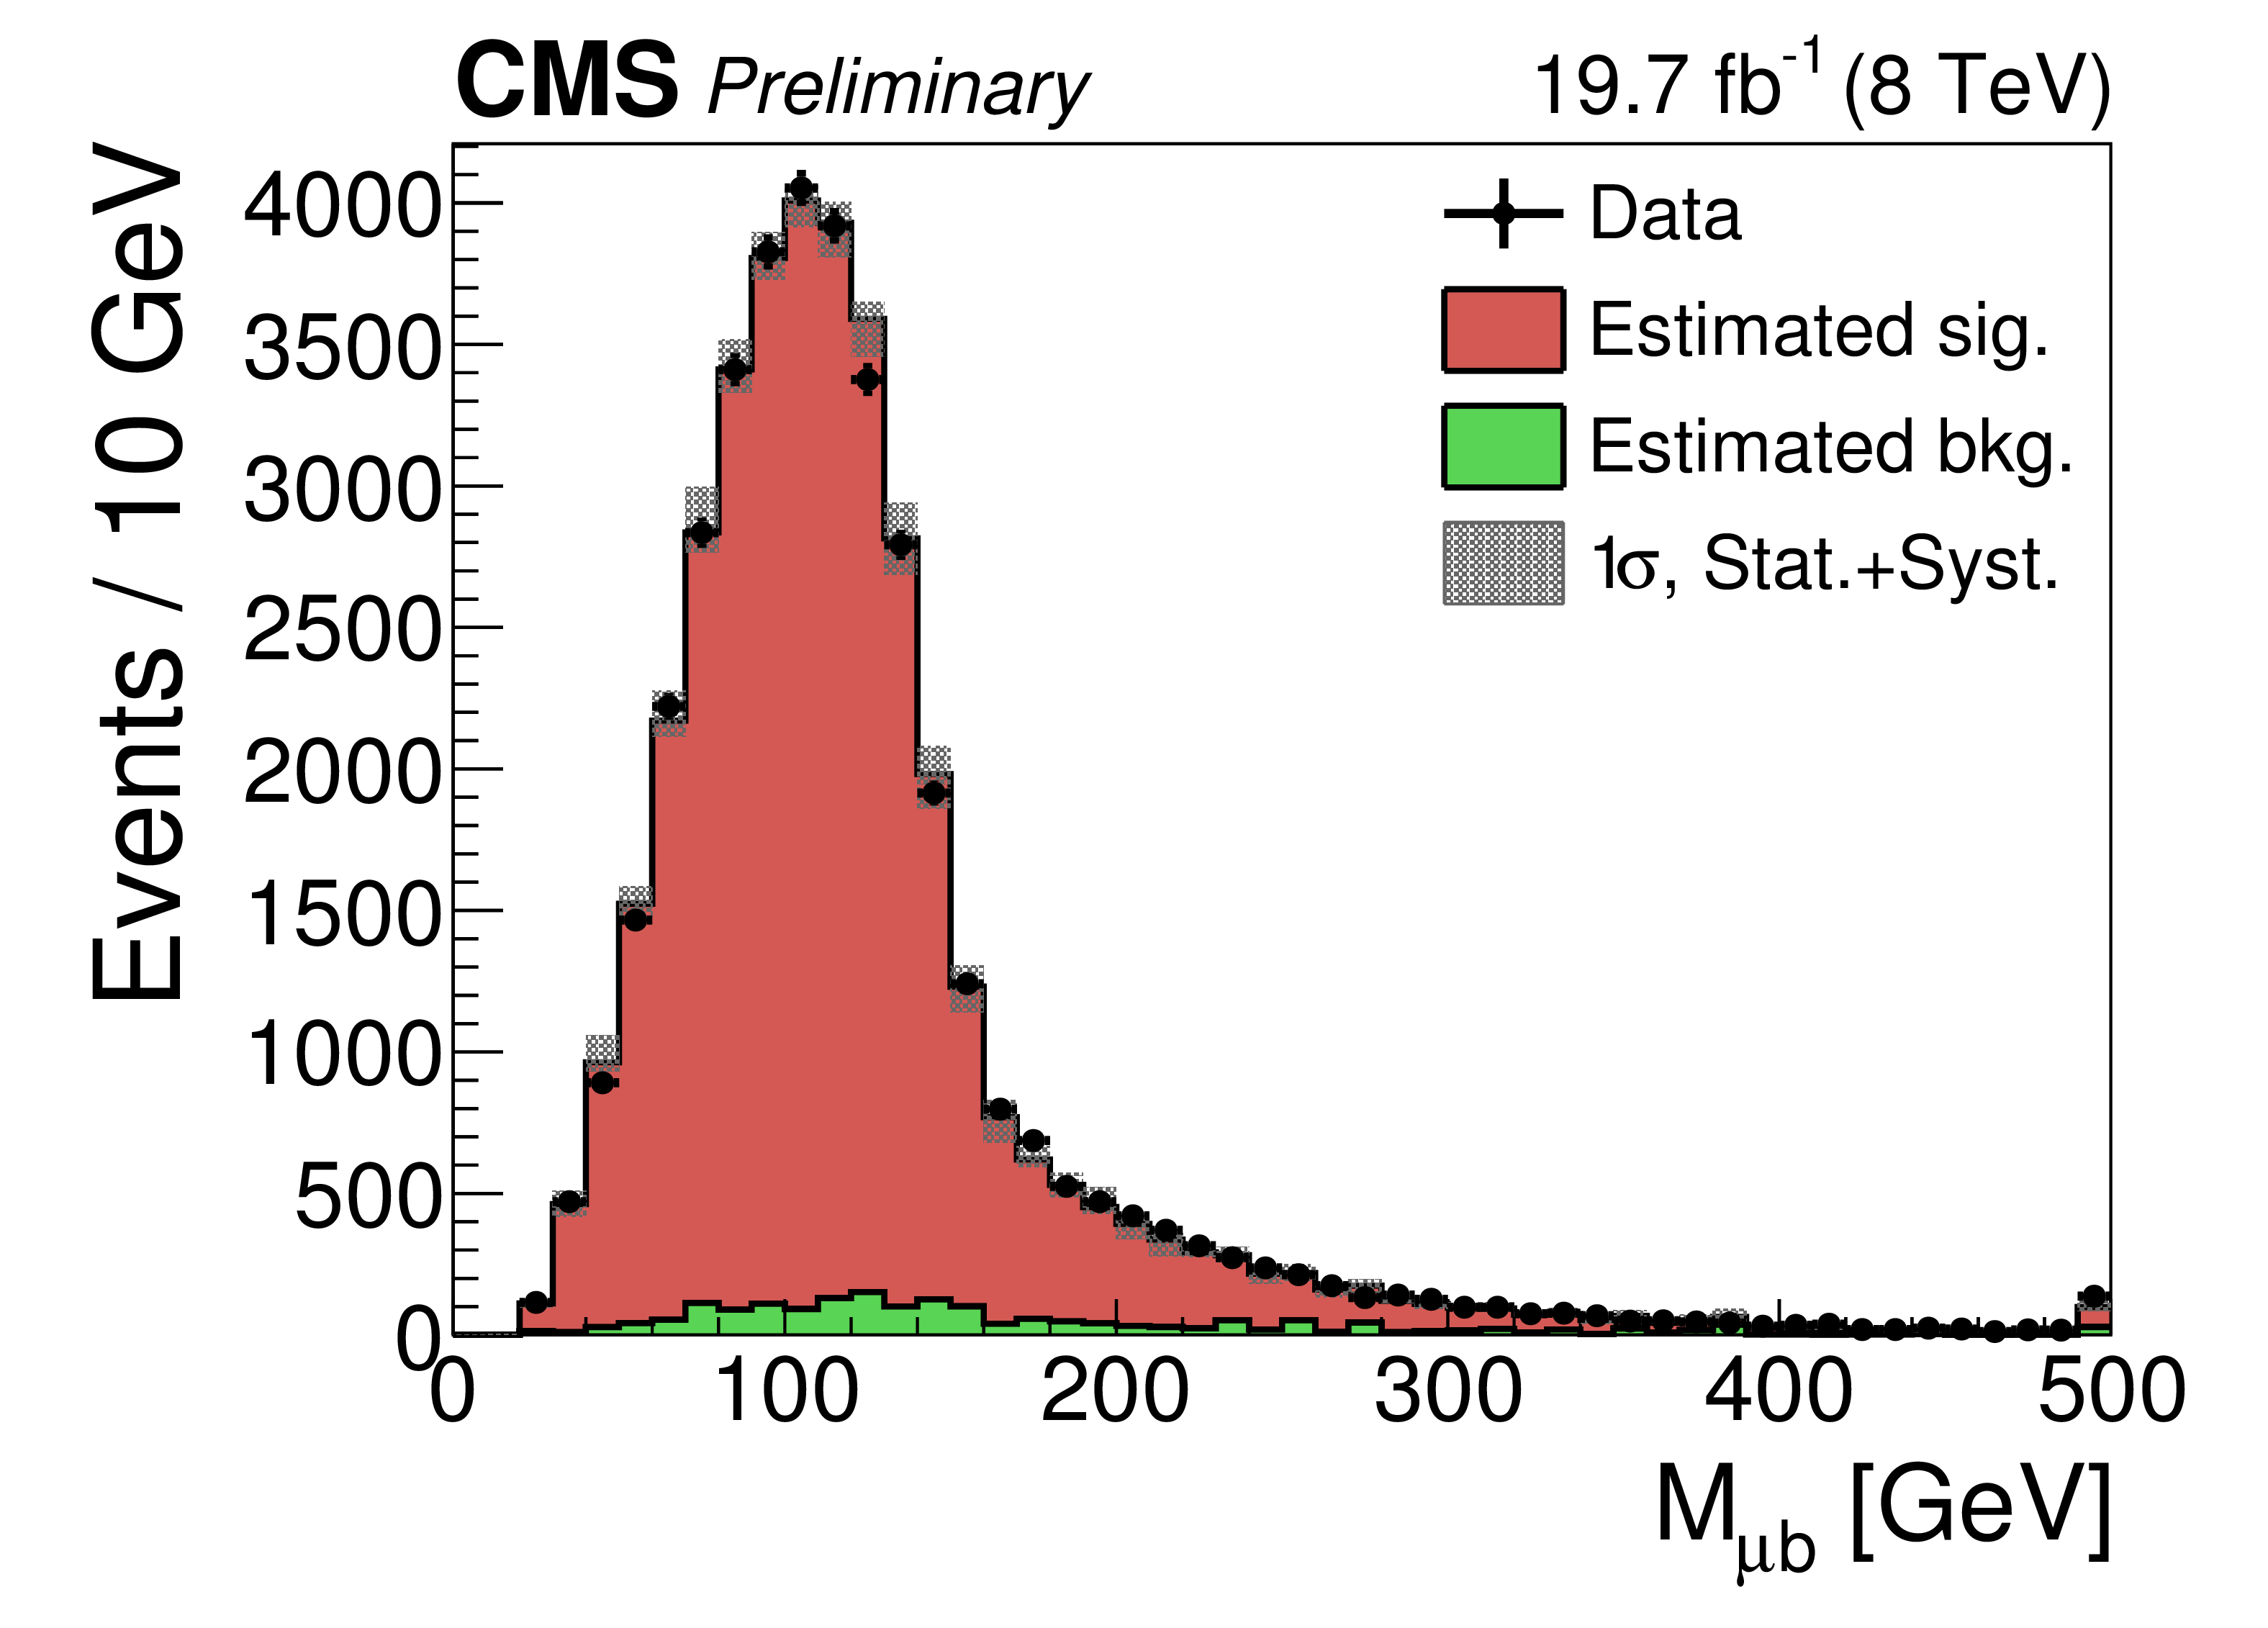
Figure 1-d:
Kinematic distributions for two different channels in the signal region after passing all event selections and applied corrections (including top $ {p_{\mathrm {T}}} $-reweighting). (a) and (b) are the invariant mass of the hadronic top candidate. (c) and (d) are the invariant mass of the lepton and b-jets associated to the leptonic top candidate. (a) and (c) are for the electron channel. (b) and (d) are for the muon channel. |
png pdf |
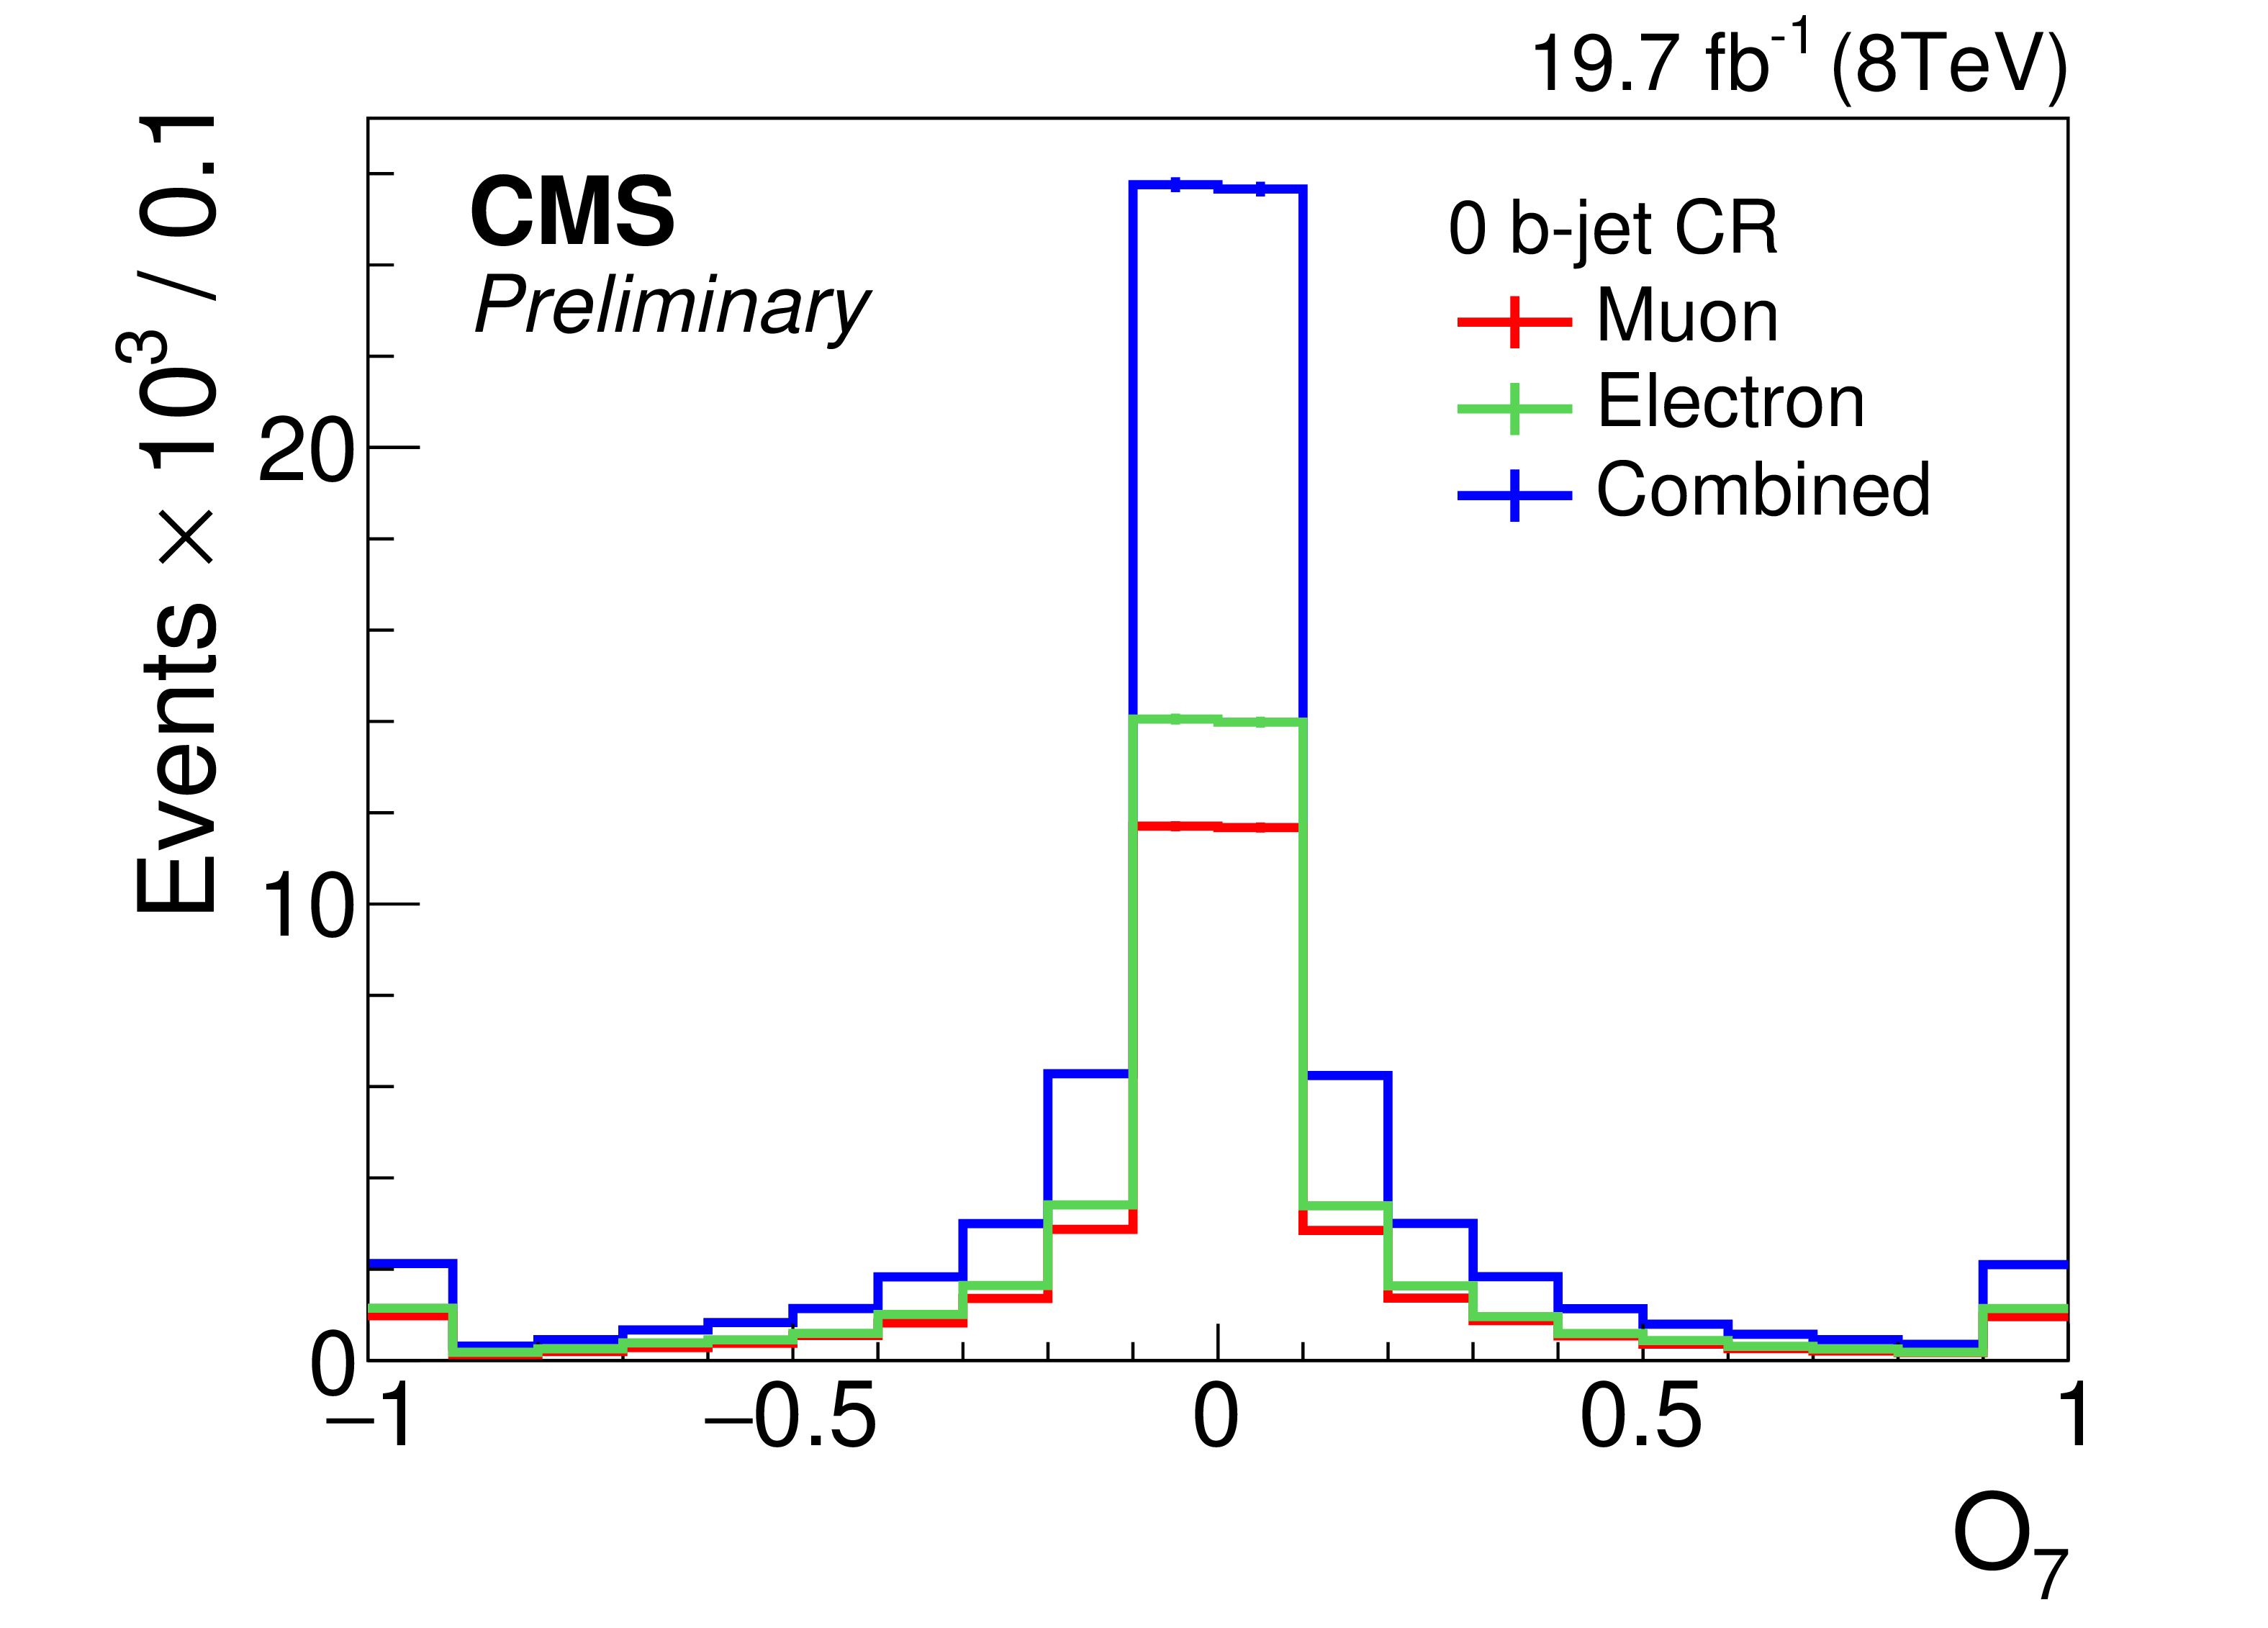
Figure 2-a:
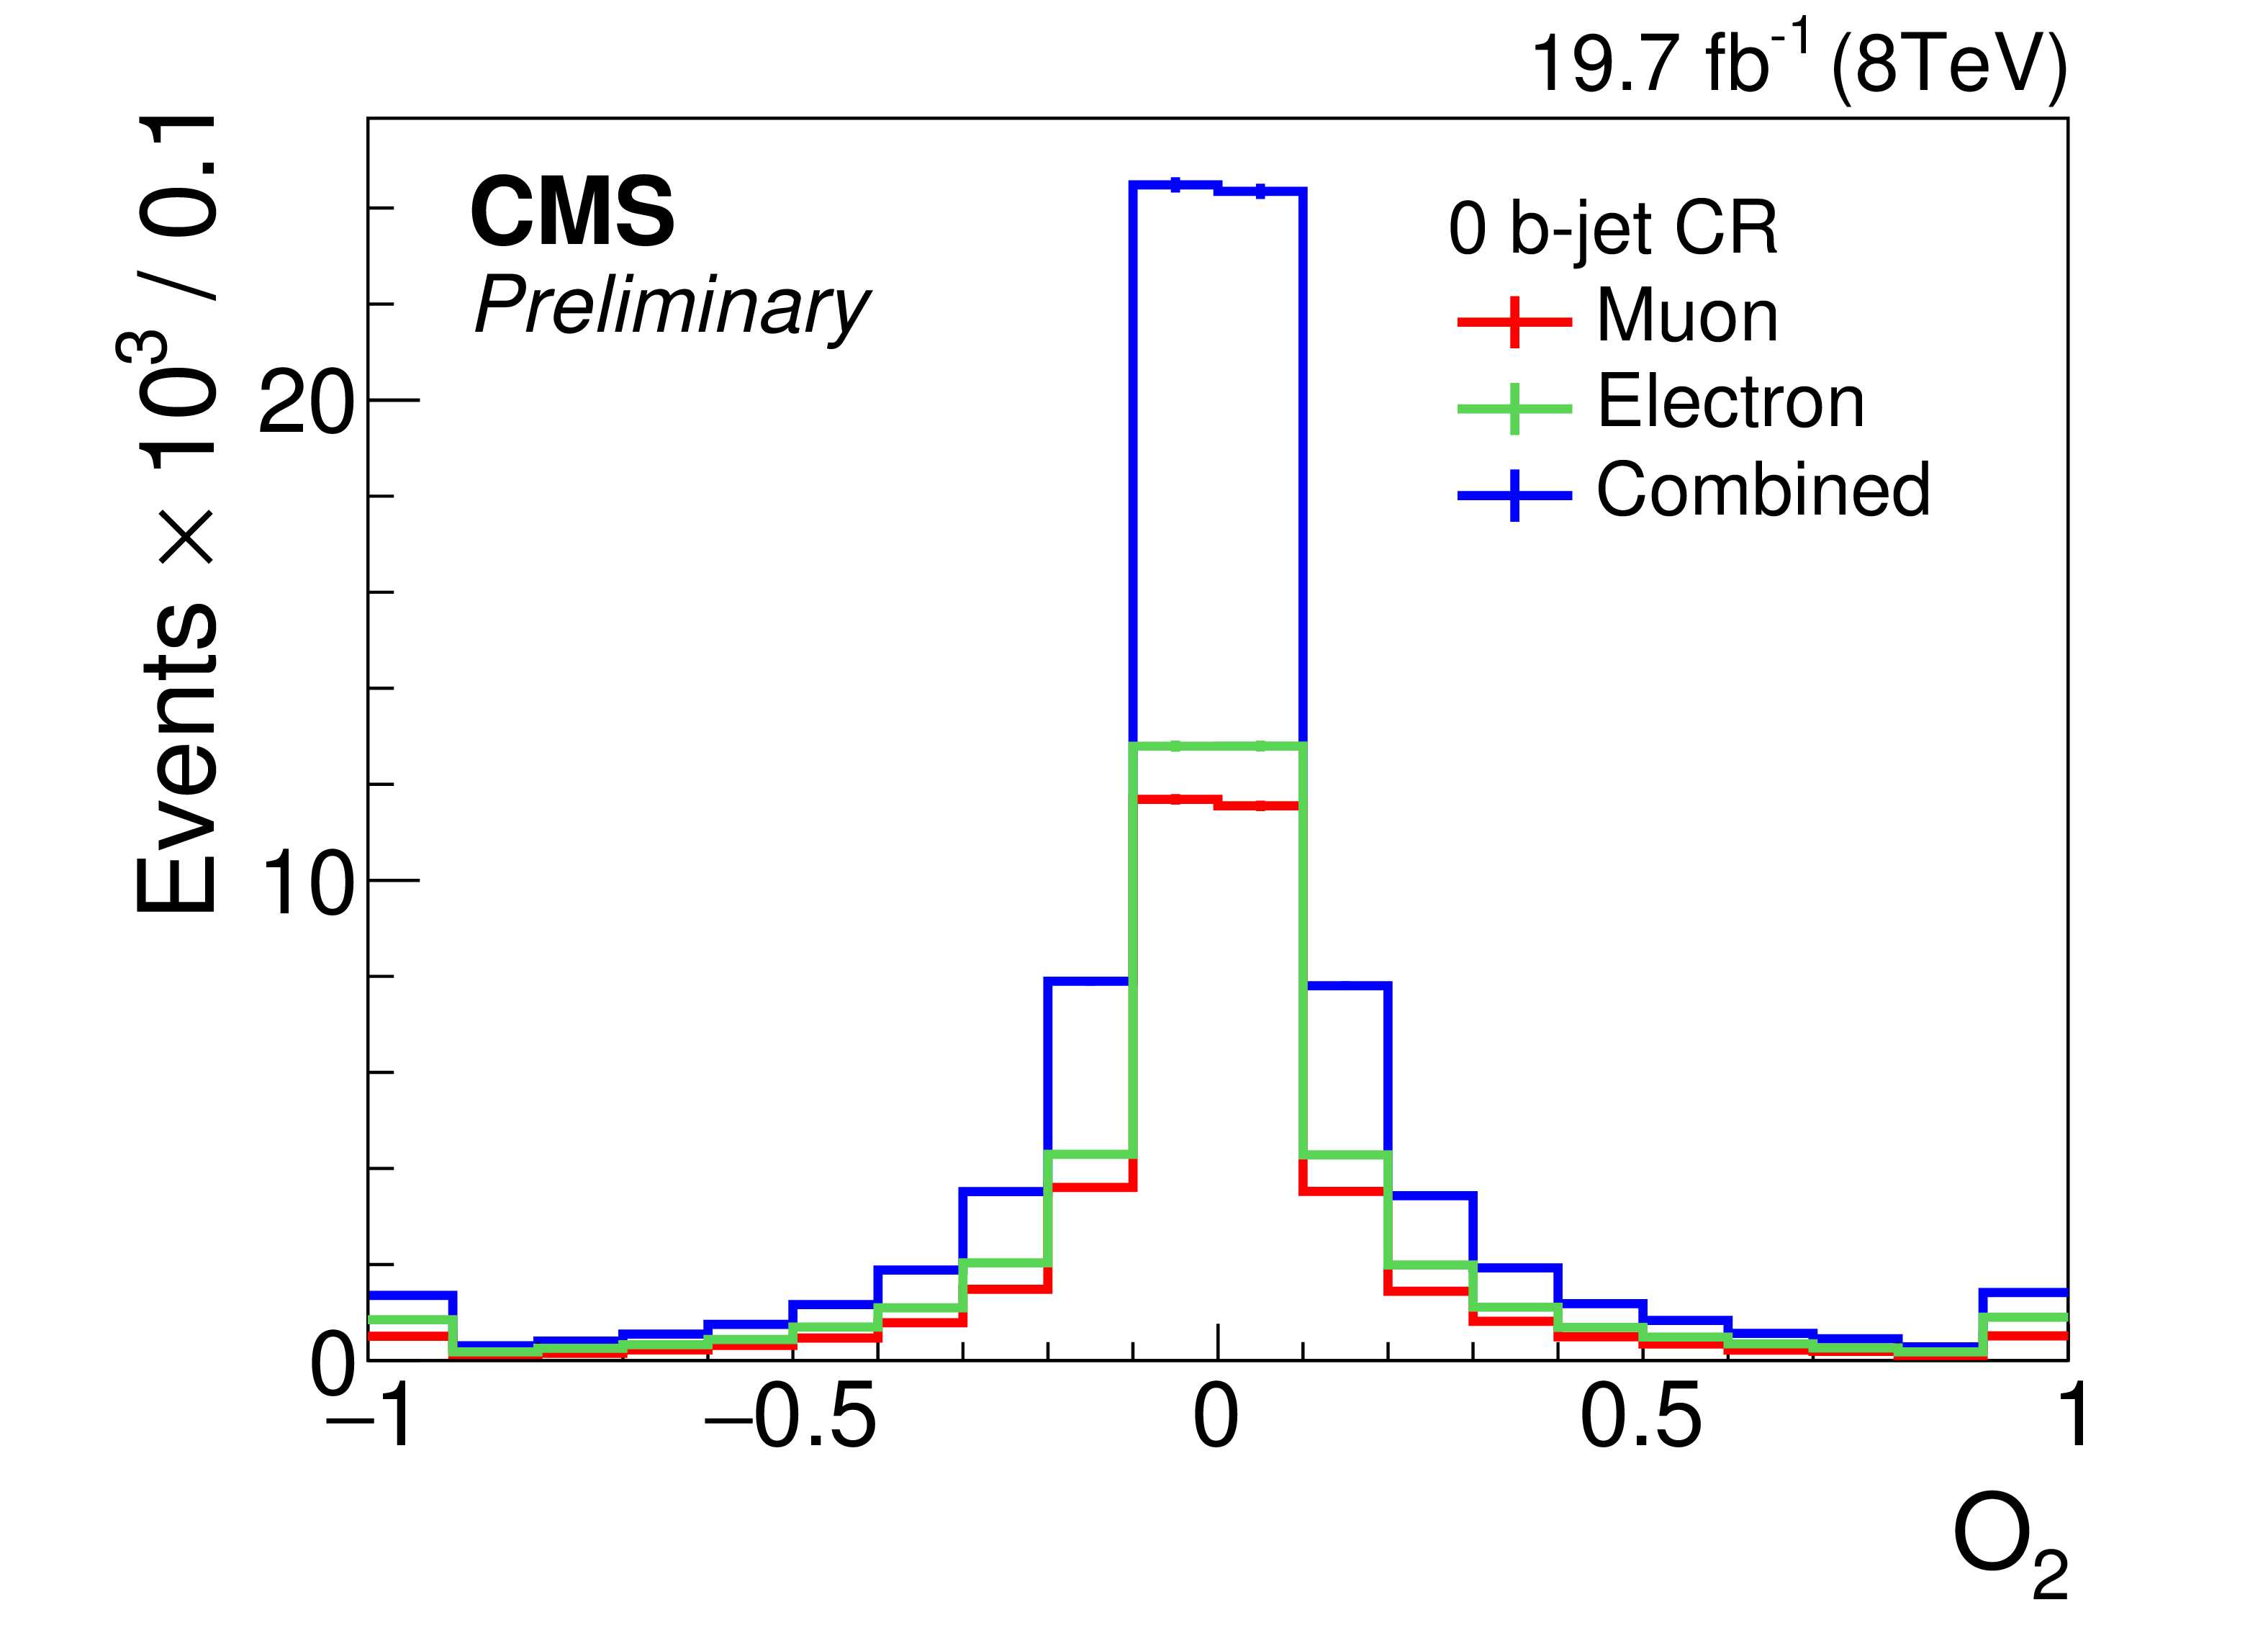
Distribution in data of the observables in the 0 b-jet control region in electron, muon and combined channels. Each observable is given in units of $m_{t}^3$, where $m_{t}$ is the top-quark mass and a value of 172.5 GeV is assumed. |
png pdf |
Figure 2-b:
Distribution in data of the observables in the 0 b-jet control region in electron, muon and combined channels. Each observable is given in units of $m_{t}^3$, where $m_{t}$ is the top-quark mass and a value of 172.5 GeV is assumed. |
png pdf |
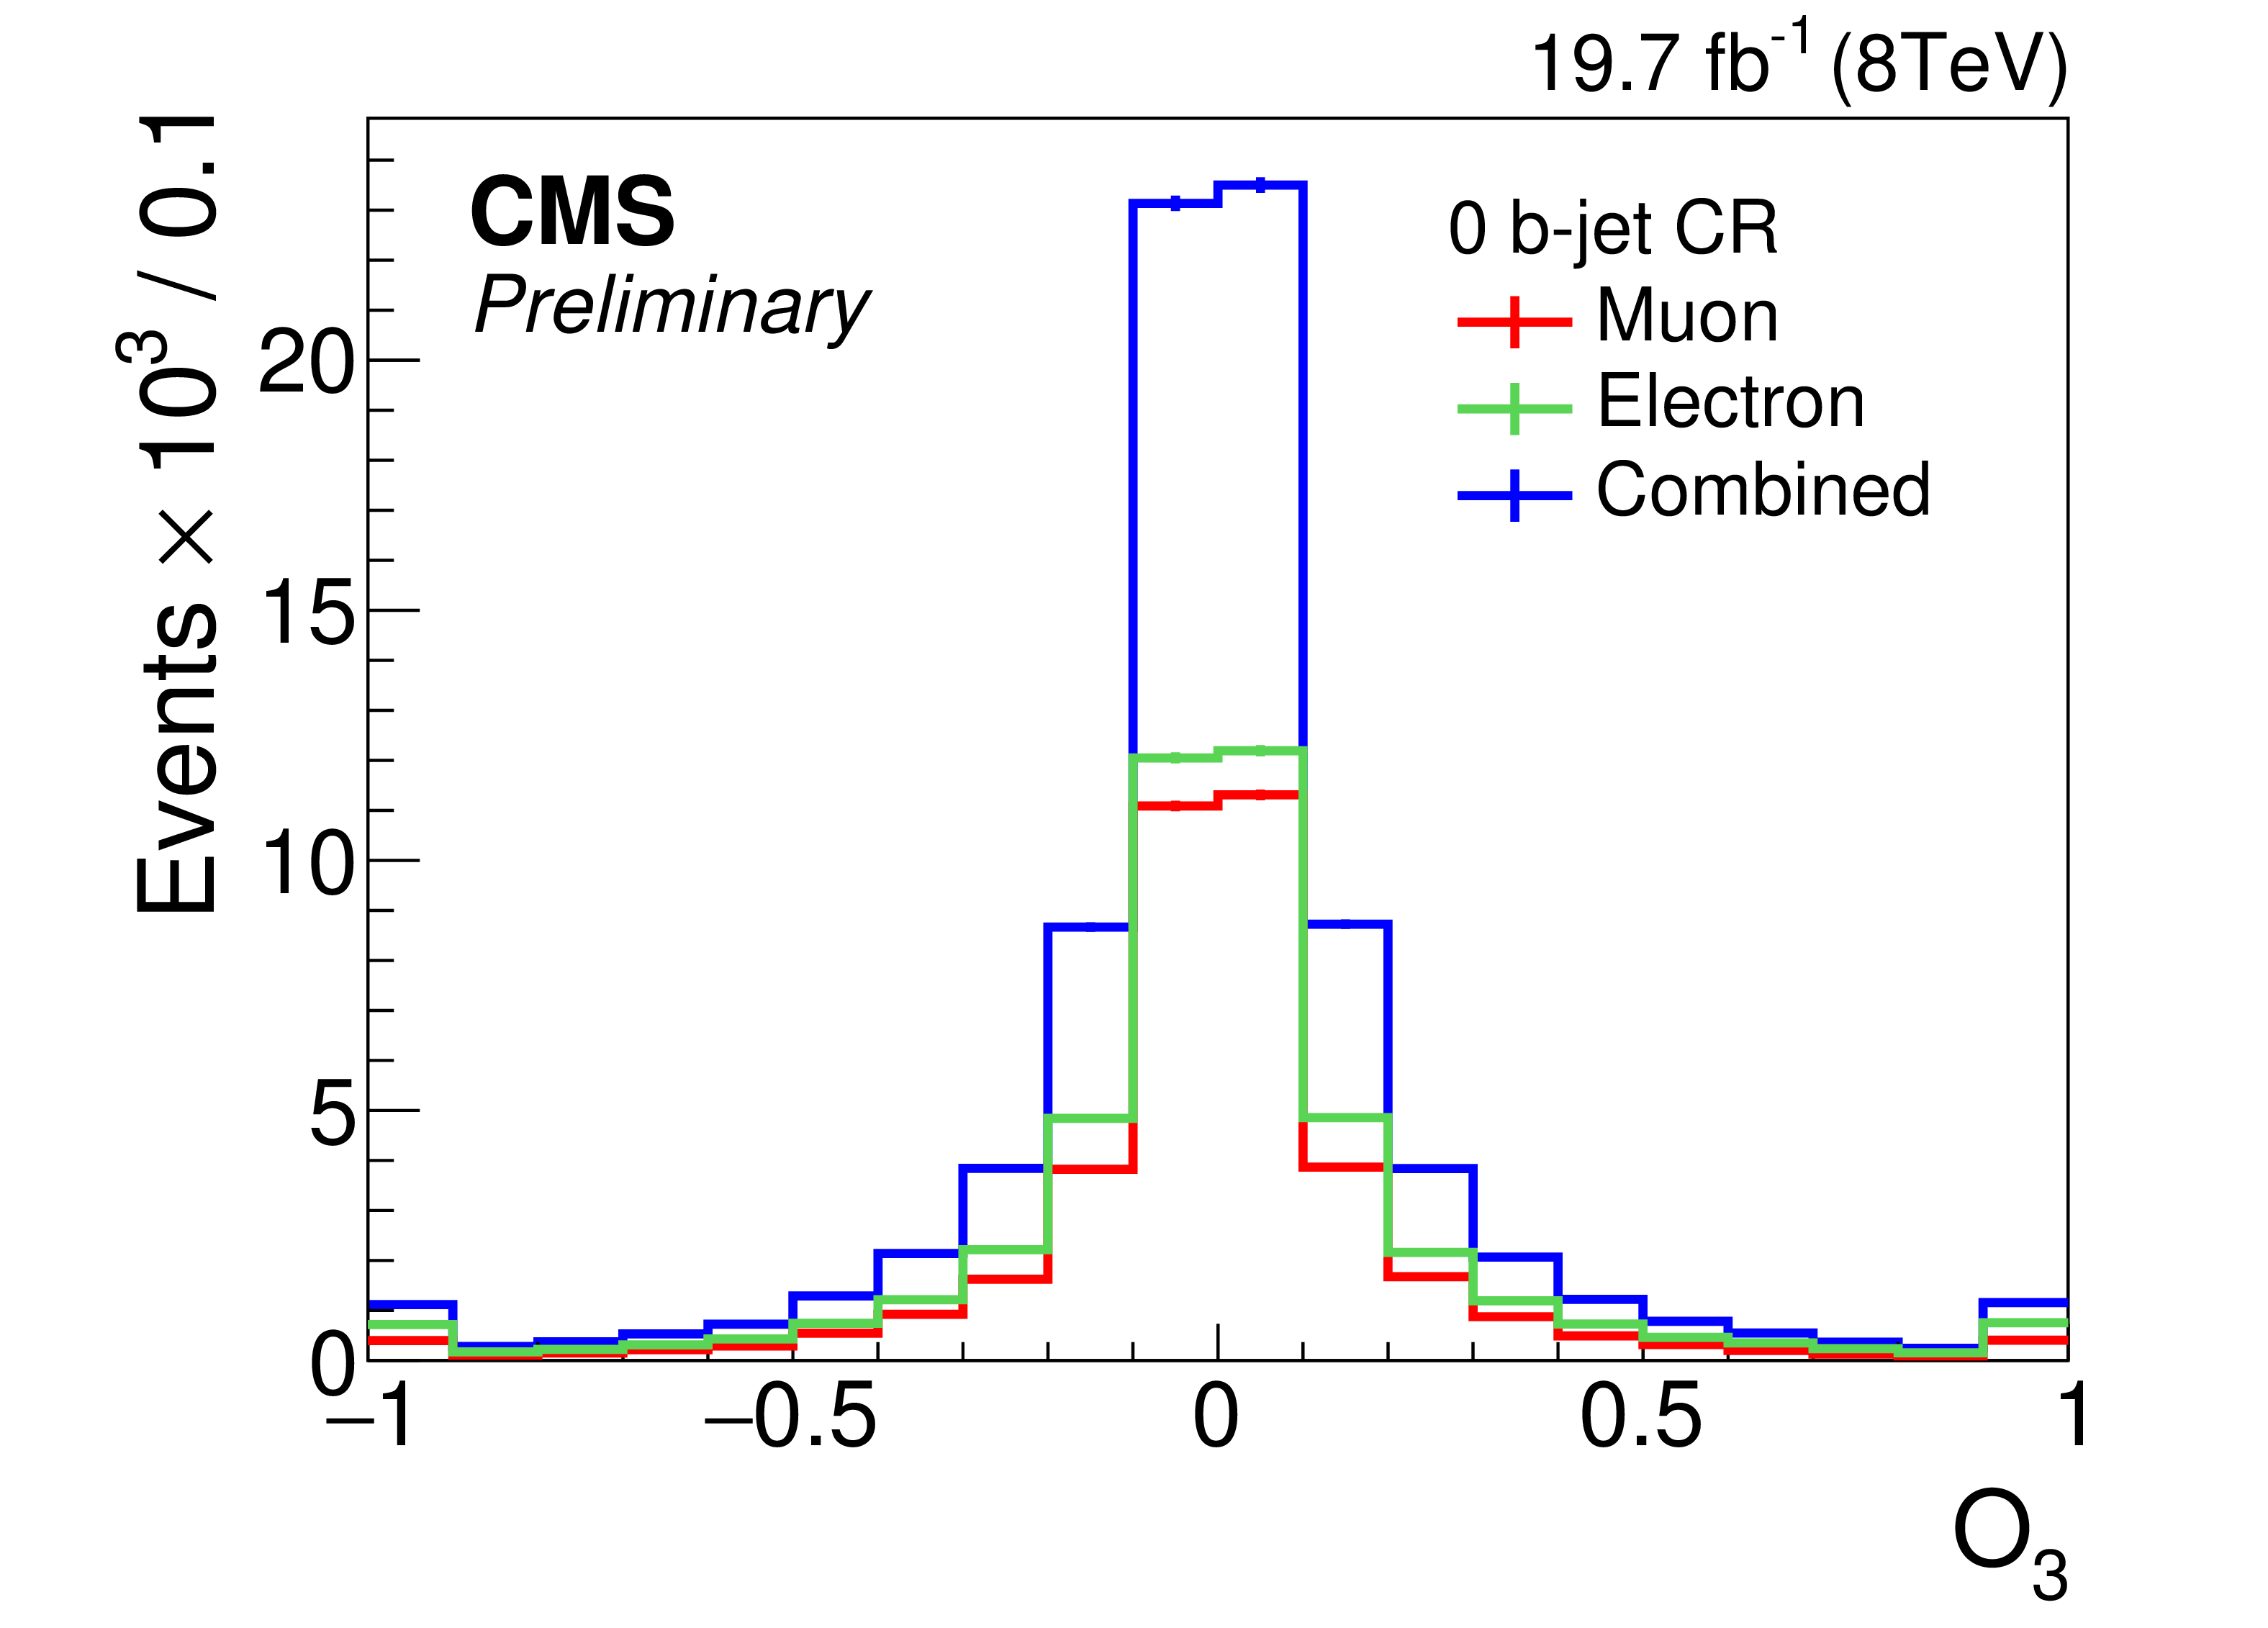
Figure 2-c:
Distribution in data of the observables in the 0 b-jet control region in electron, muon and combined channels. Each observable is given in units of $m_{t}^3$, where $m_{t}$ is the top-quark mass and a value of 172.5 GeV is assumed. |
png pdf |
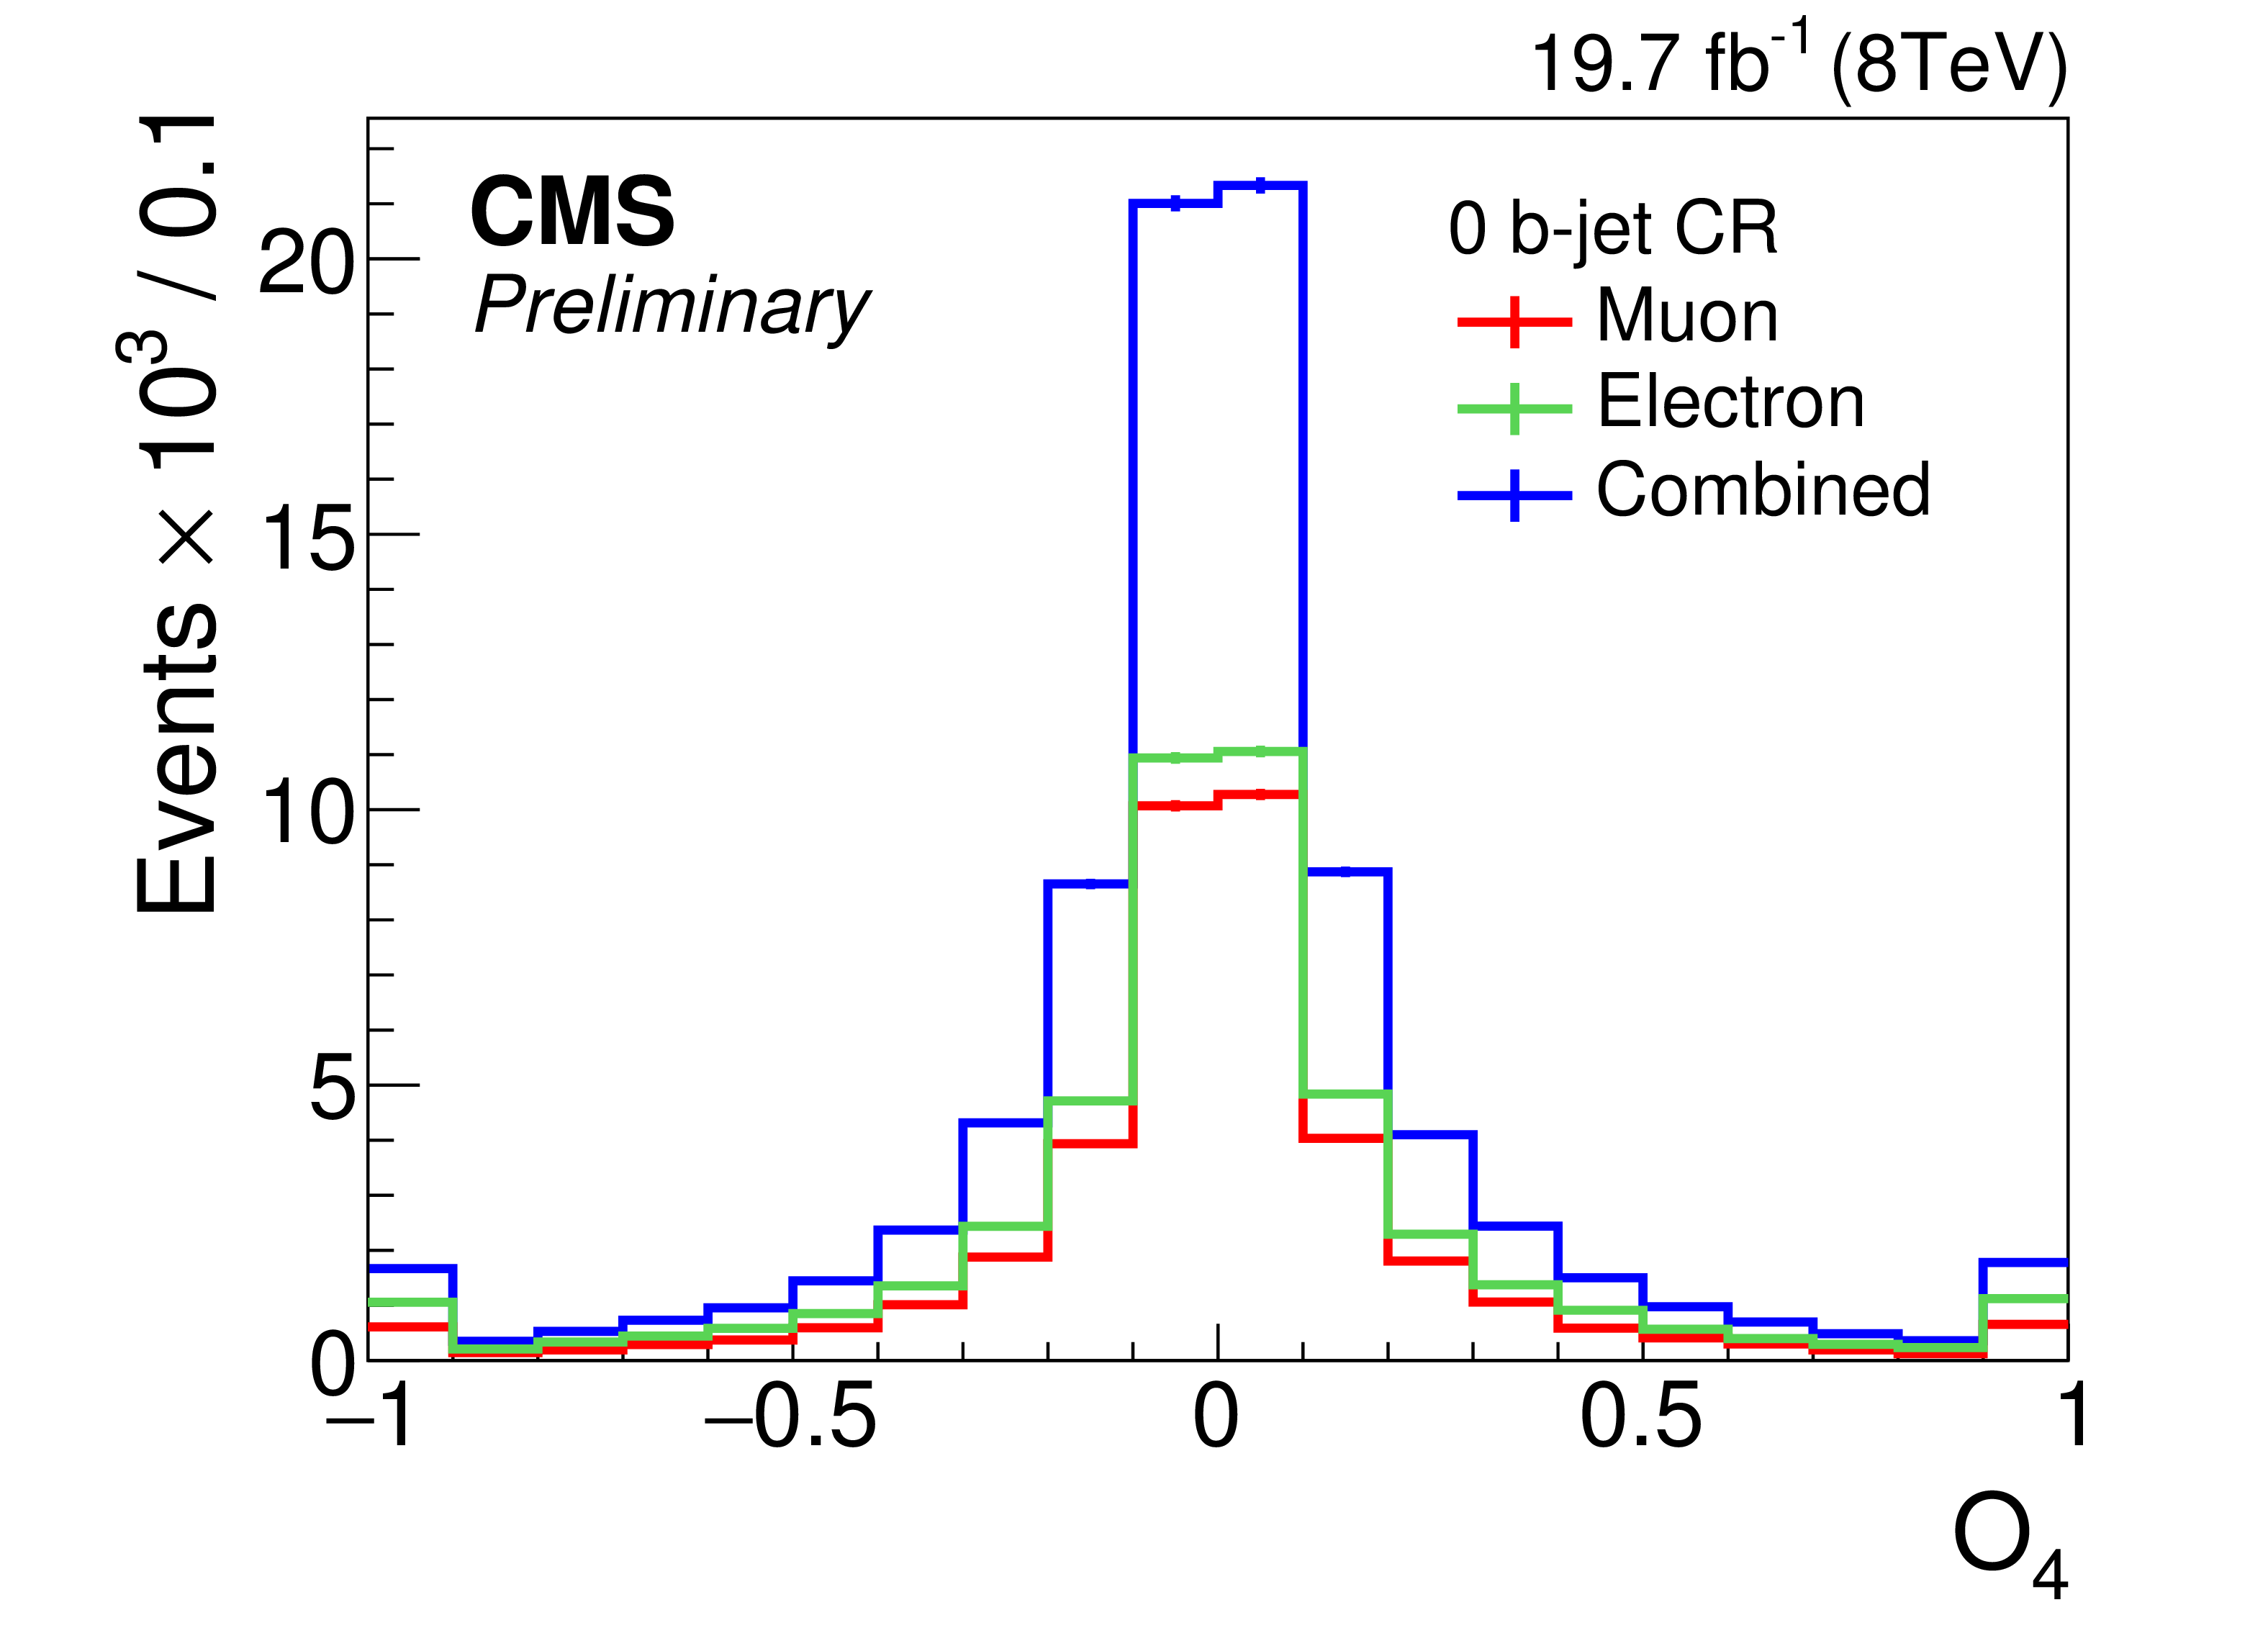
Figure 2-d:
Distribution in data of the observables in the 0 b-jet control region in electron, muon and combined channels. Each observable is given in units of $m_{t}^3$, where $m_{t}$ is the top-quark mass and a value of 172.5 GeV is assumed. |
png pdf |
Figure 3-a:
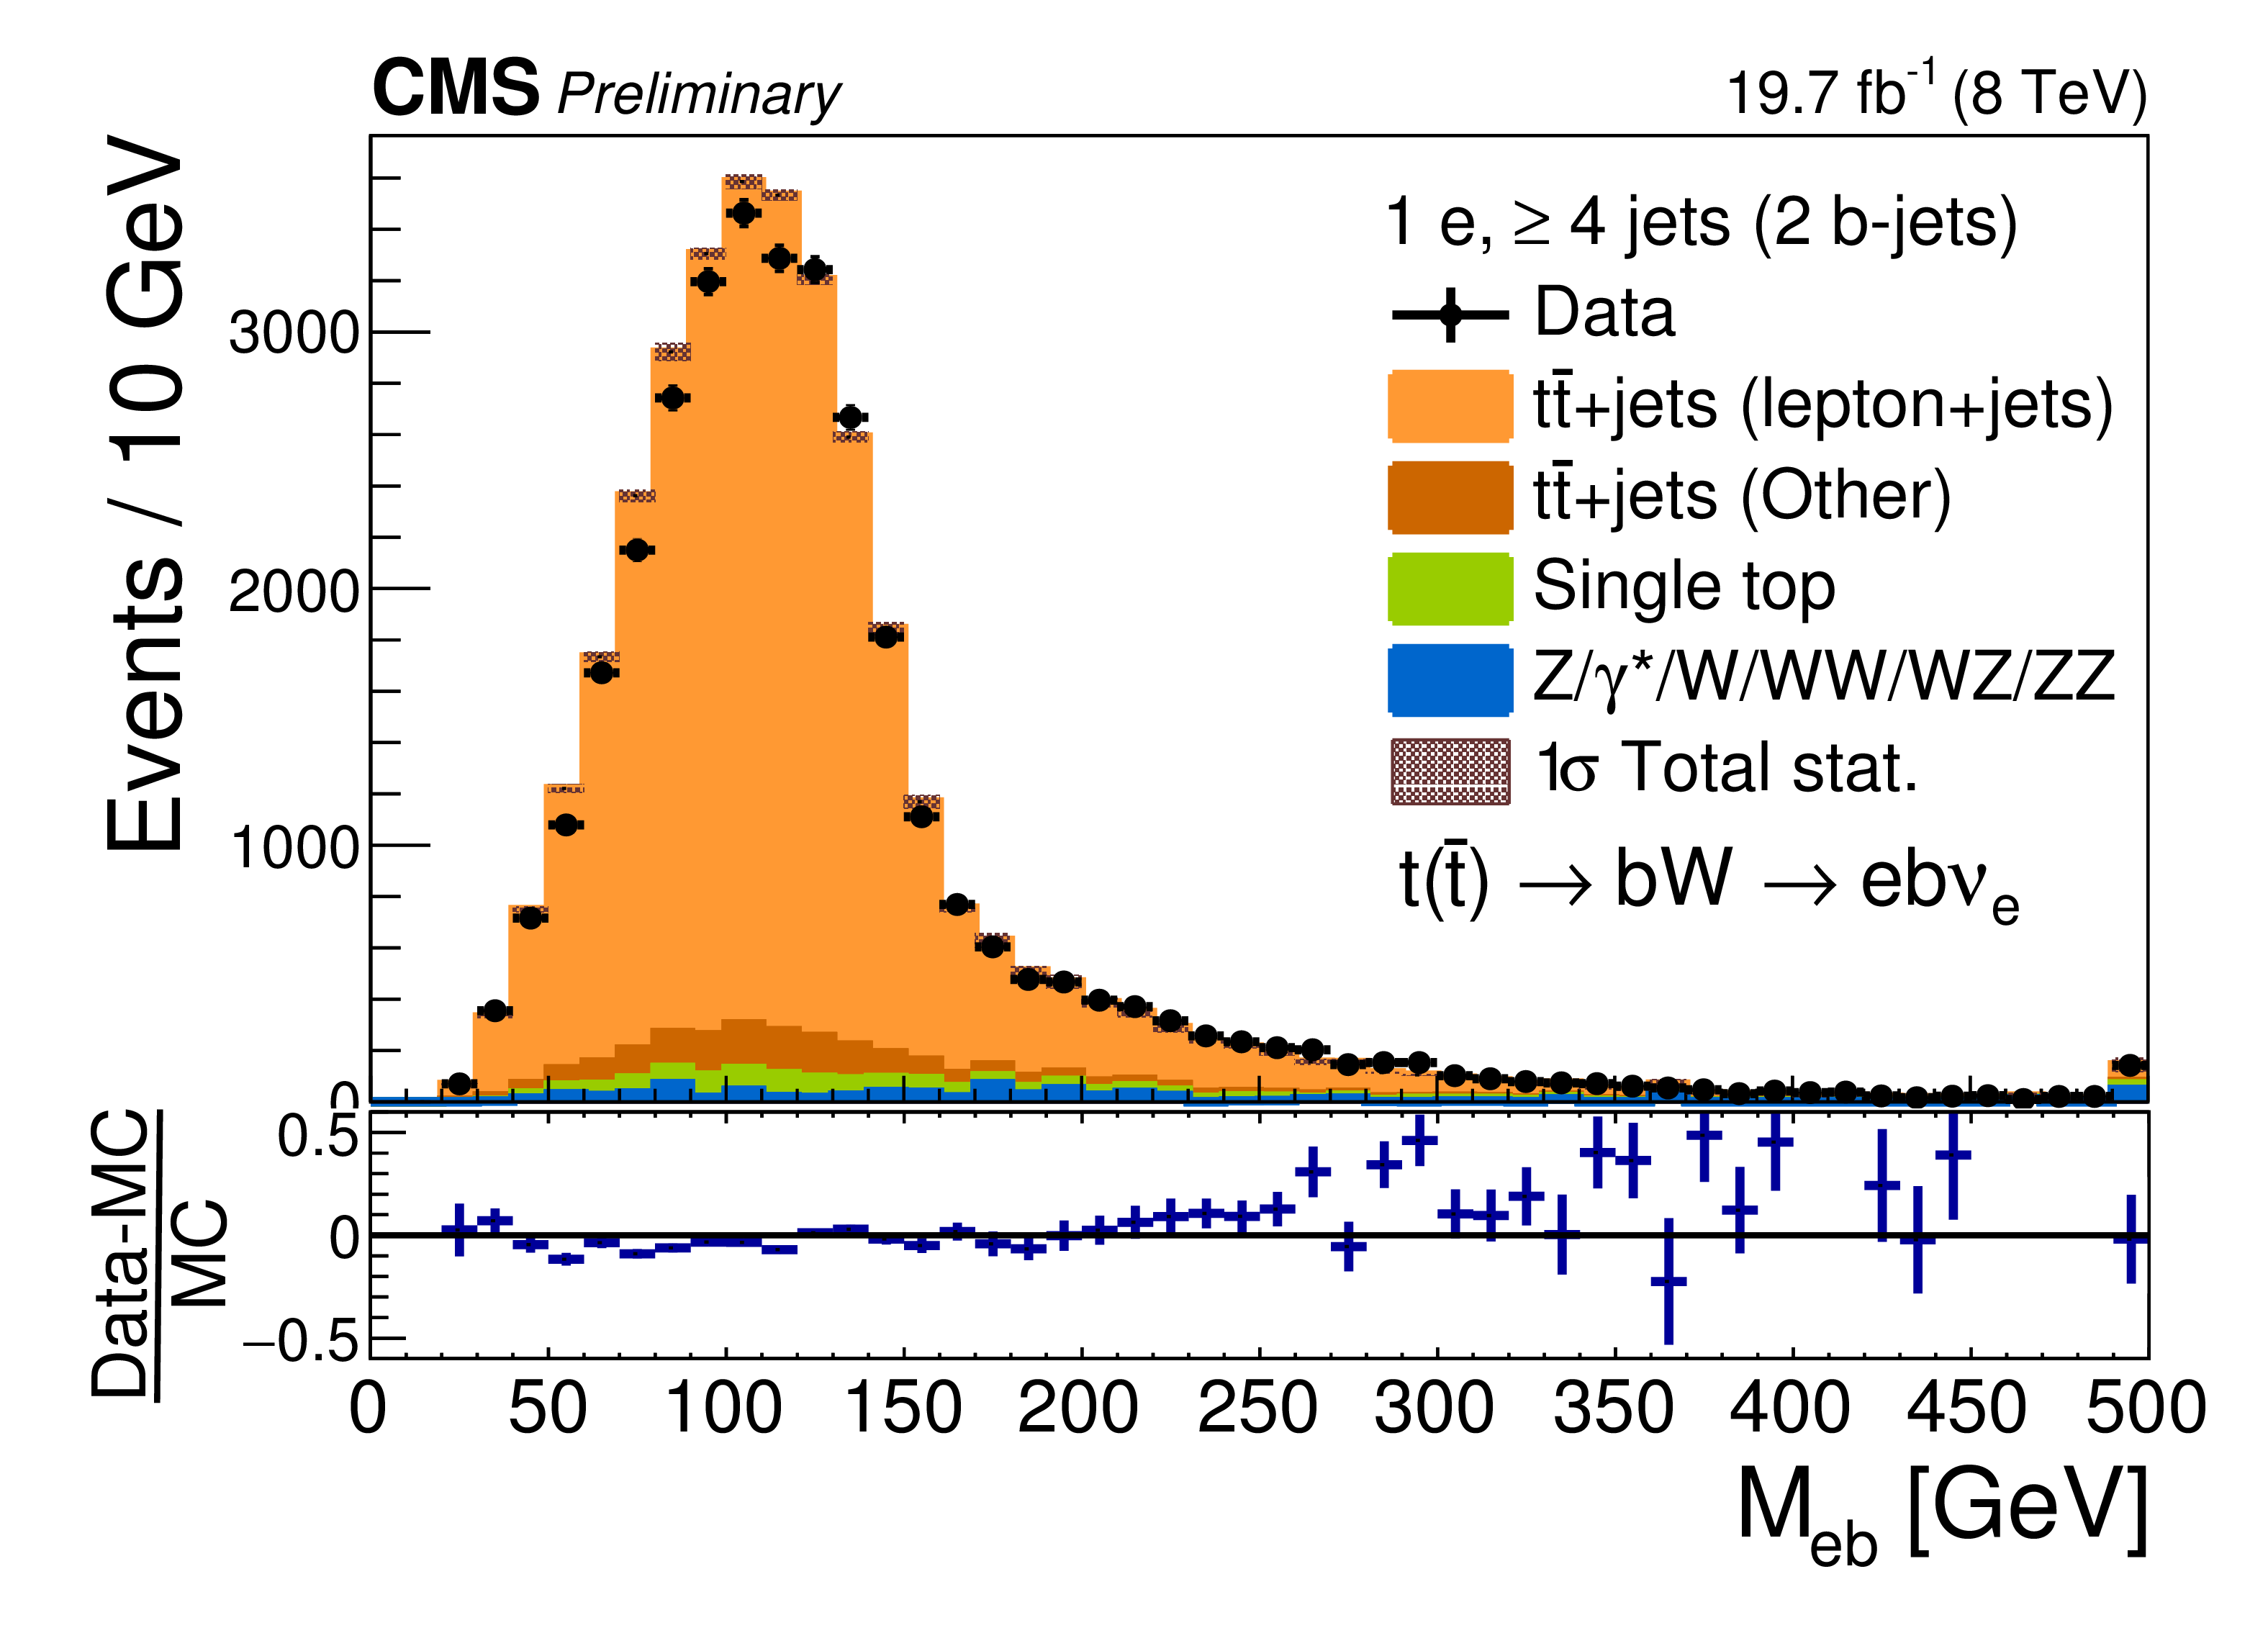
Distribution of the $M_{\ell \mathrm{b} }$ variable in the electron (a) and muon (b) channels. The shaded band represents the total uncertainty. |
png pdf |
Figure 3-b:
Distribution of the $M_{\ell \mathrm{b} }$ variable in the electron (a) and muon (b) channels. The shaded band represents the total uncertainty. |
png pdf |
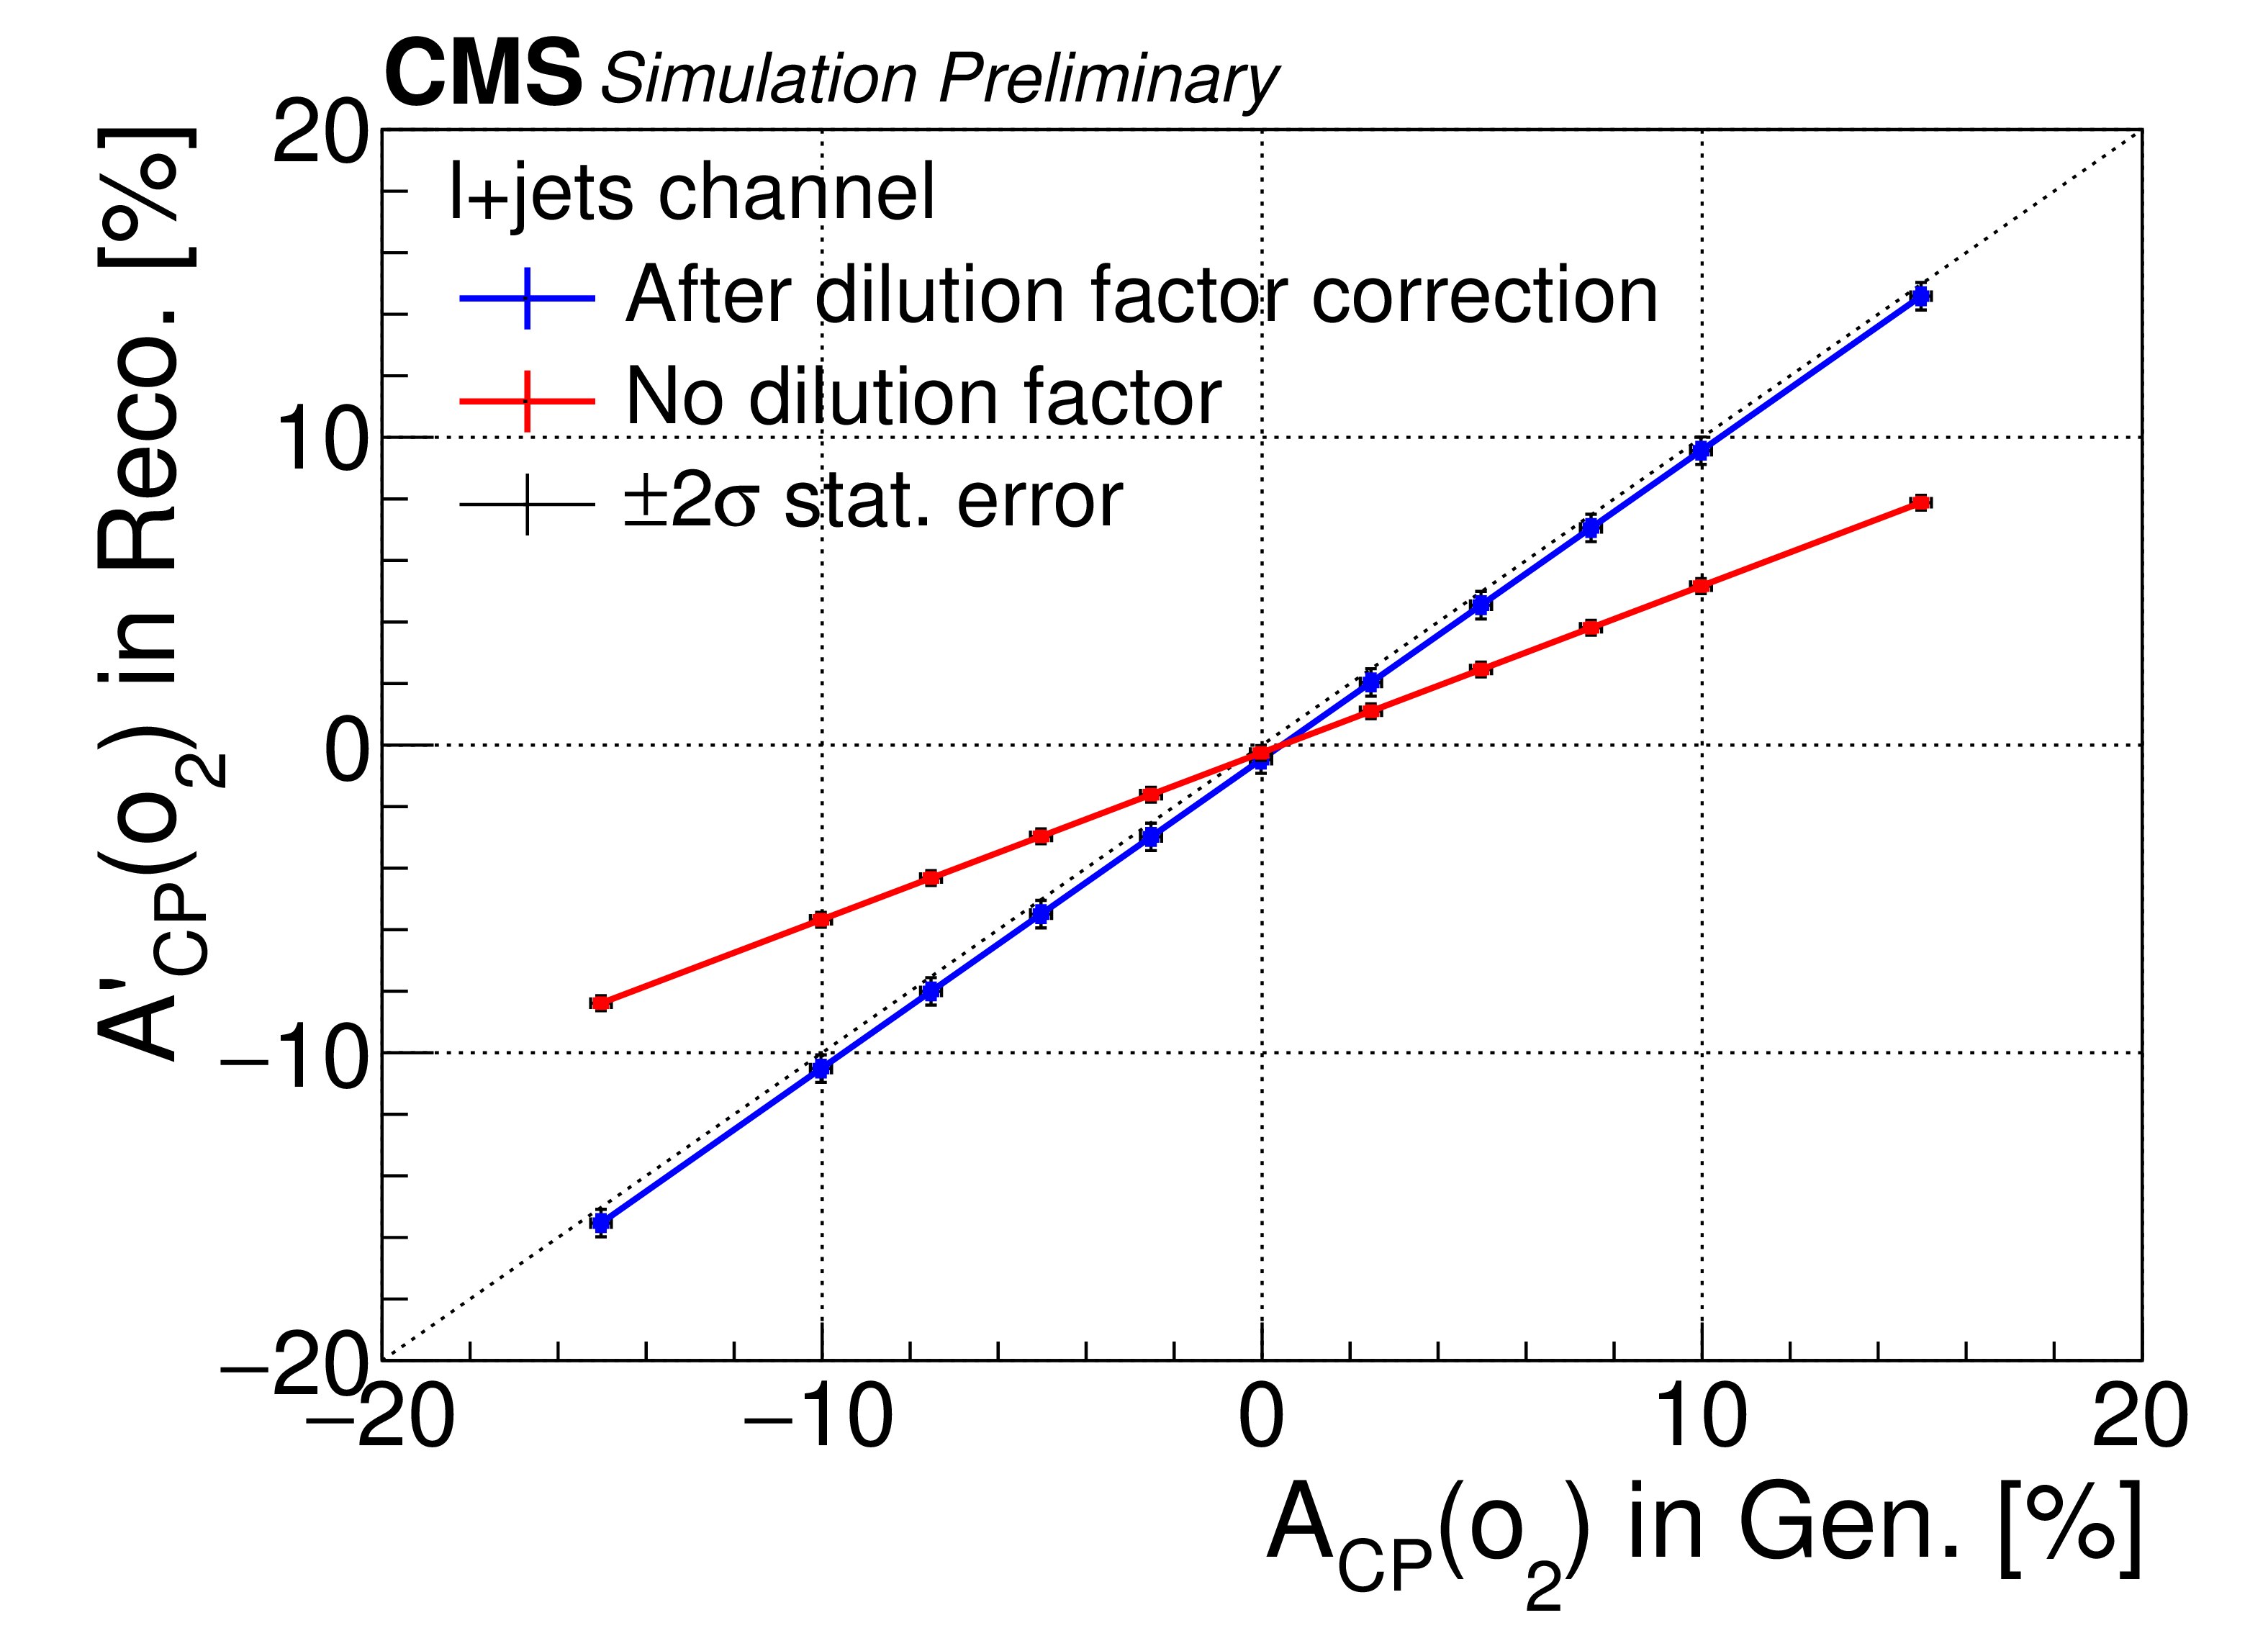
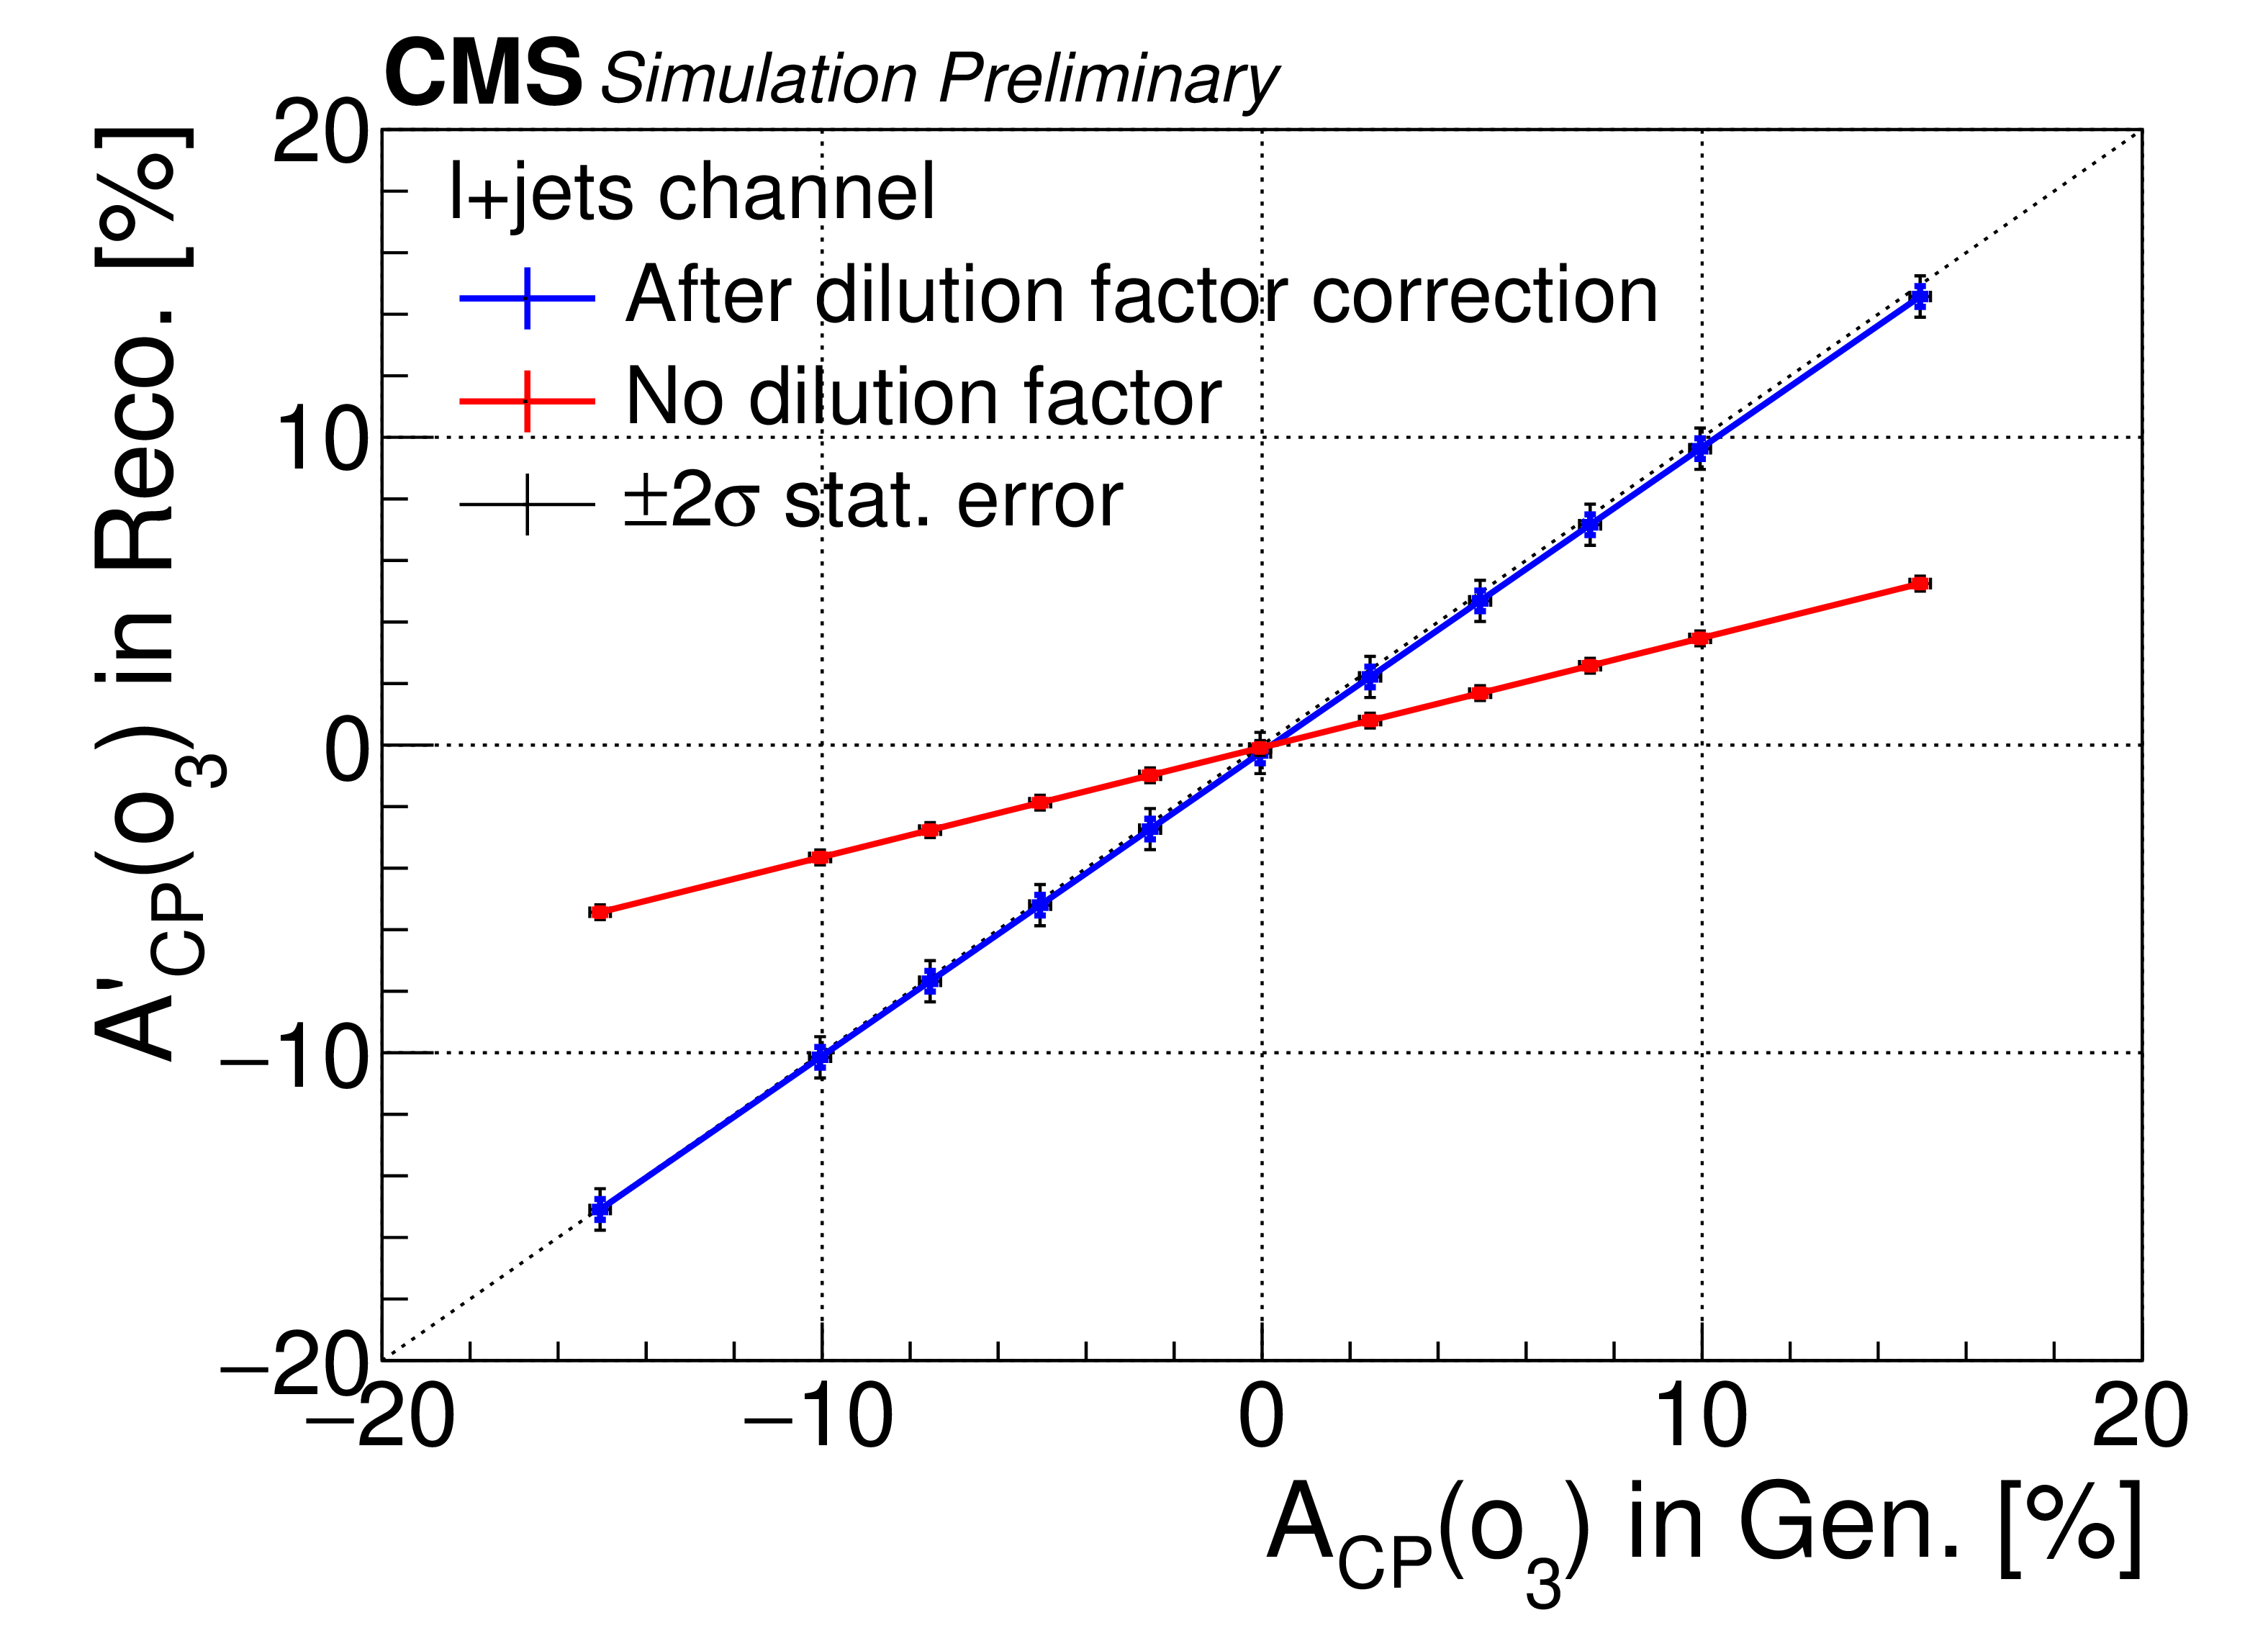
Figure 4-a:
Closure tests for different non-zero $ {A_{CP}} $-scenarios generated from MC truth. The red lines show the obtained $ {A_{CP}^\prime } $ obtained as function of the generated $ {A_{CP}} $, while the blue lines show the corrected $ {A_{CP}} $, after applying the dilution factor expected for each observable. The dashed line shows the expected result from an undiluted reconstruction of the observables. |
png pdf |
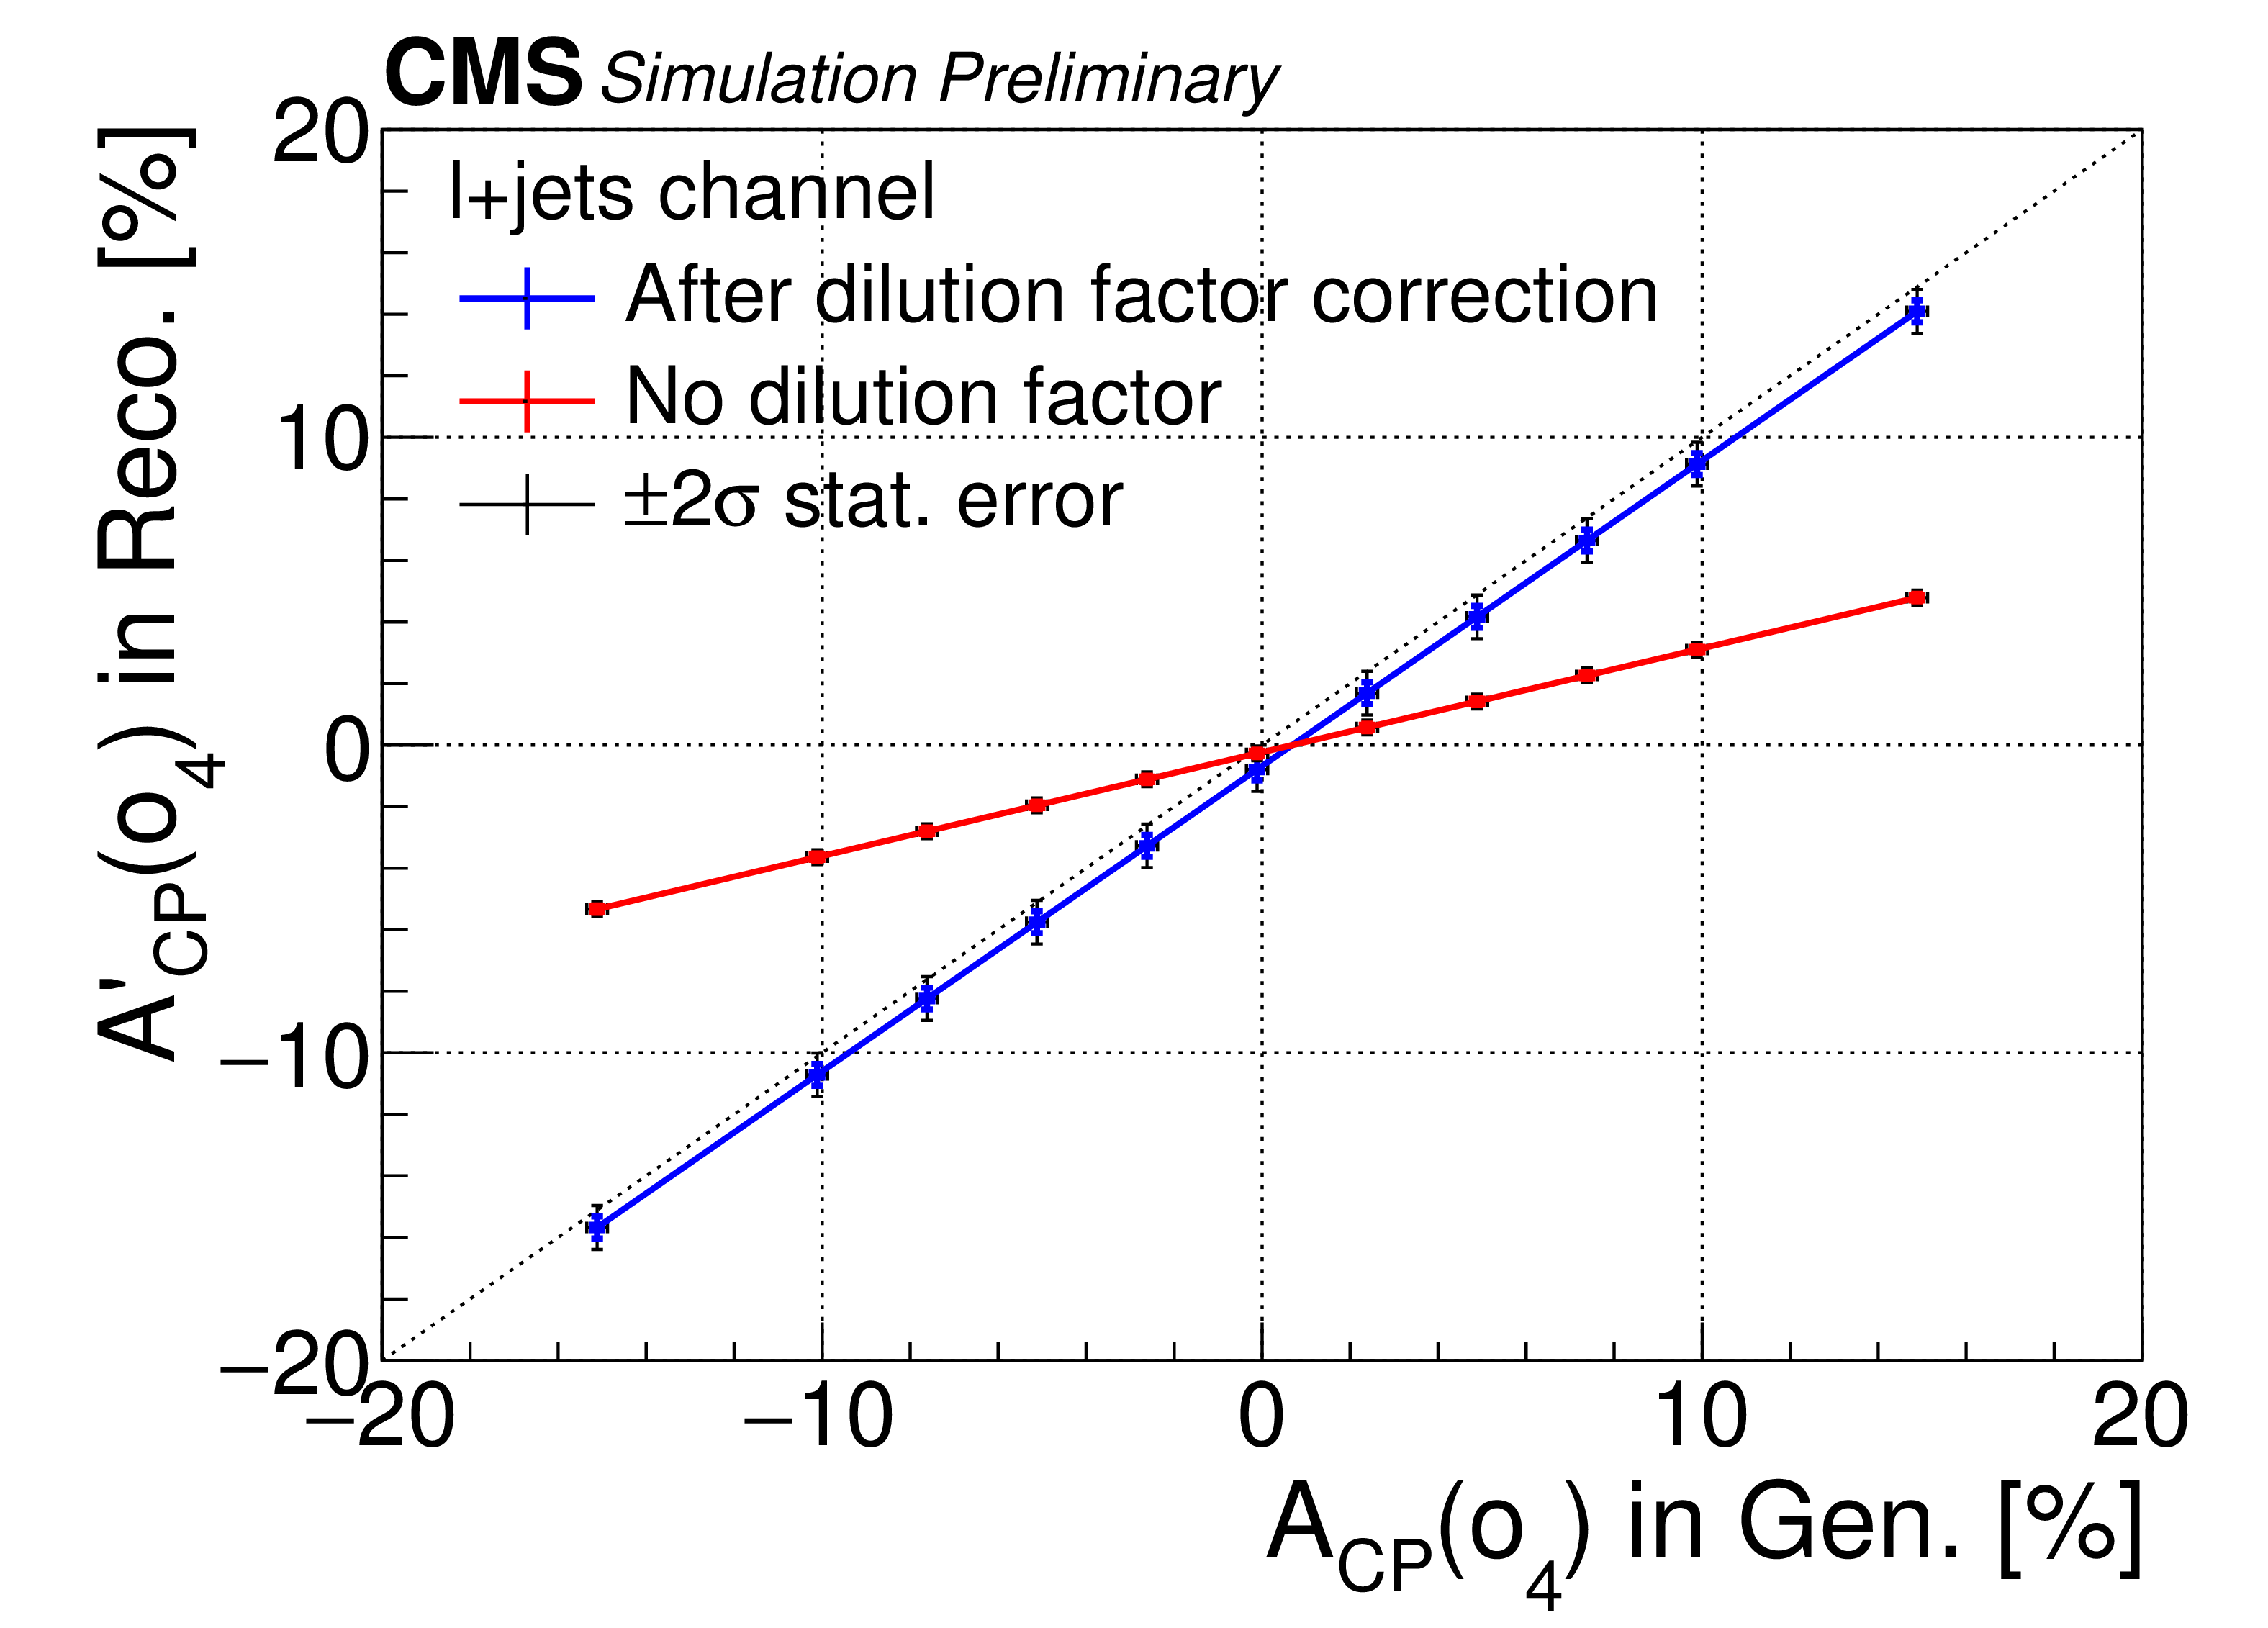
Figure 4-b:
Closure tests for different non-zero $ {A_{CP}} $-scenarios generated from MC truth. The red lines show the obtained $ {A_{CP}^\prime } $ obtained as function of the generated $ {A_{CP}} $, while the blue lines show the corrected $ {A_{CP}} $, after applying the dilution factor expected for each observable. The dashed line shows the expected result from an undiluted reconstruction of the observables. |
png pdf |
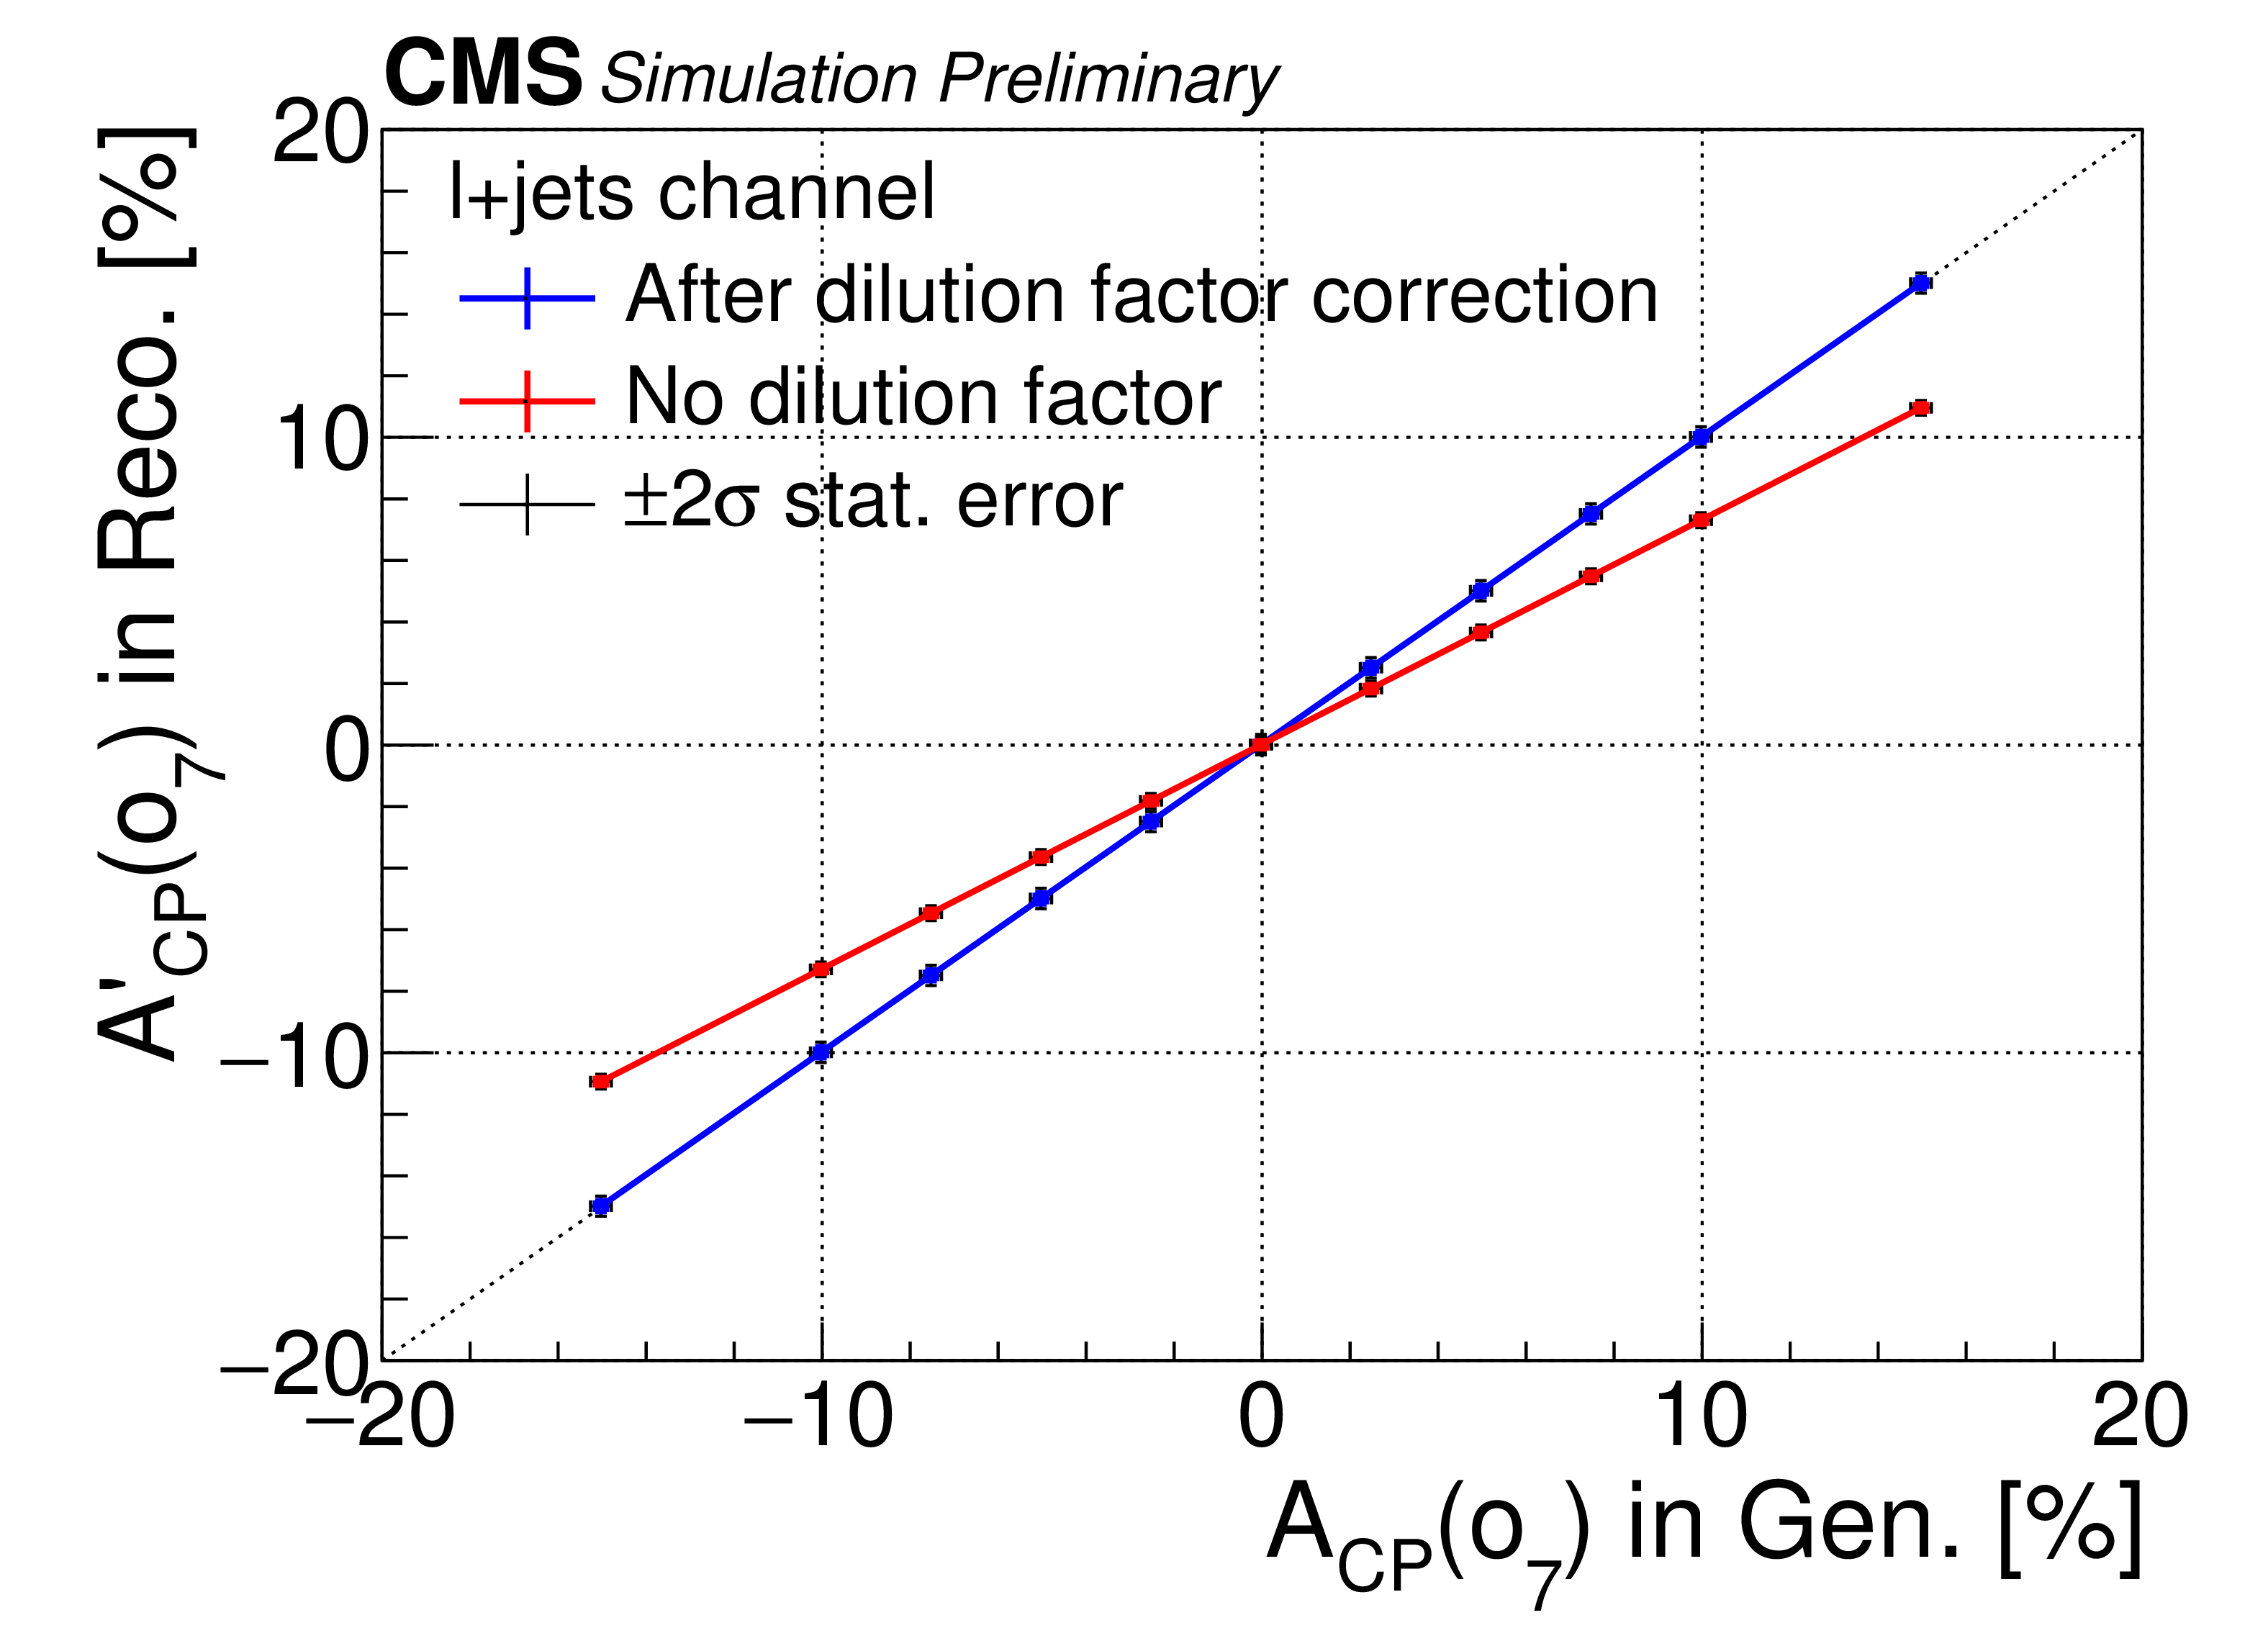
Figure 4-c:
Closure tests for different non-zero $ {A_{CP}} $-scenarios generated from MC truth. The red lines show the obtained $ {A_{CP}^\prime } $ obtained as function of the generated $ {A_{CP}} $, while the blue lines show the corrected $ {A_{CP}} $, after applying the dilution factor expected for each observable. The dashed line shows the expected result from an undiluted reconstruction of the observables. |
png pdf |
Figure 4-d:
Closure tests for different non-zero $ {A_{CP}} $-scenarios generated from MC truth. The red lines show the obtained $ {A_{CP}^\prime } $ obtained as function of the generated $ {A_{CP}} $, while the blue lines show the corrected $ {A_{CP}} $, after applying the dilution factor expected for each observable. The dashed line shows the expected result from an undiluted reconstruction of the observables. |
png pdf |
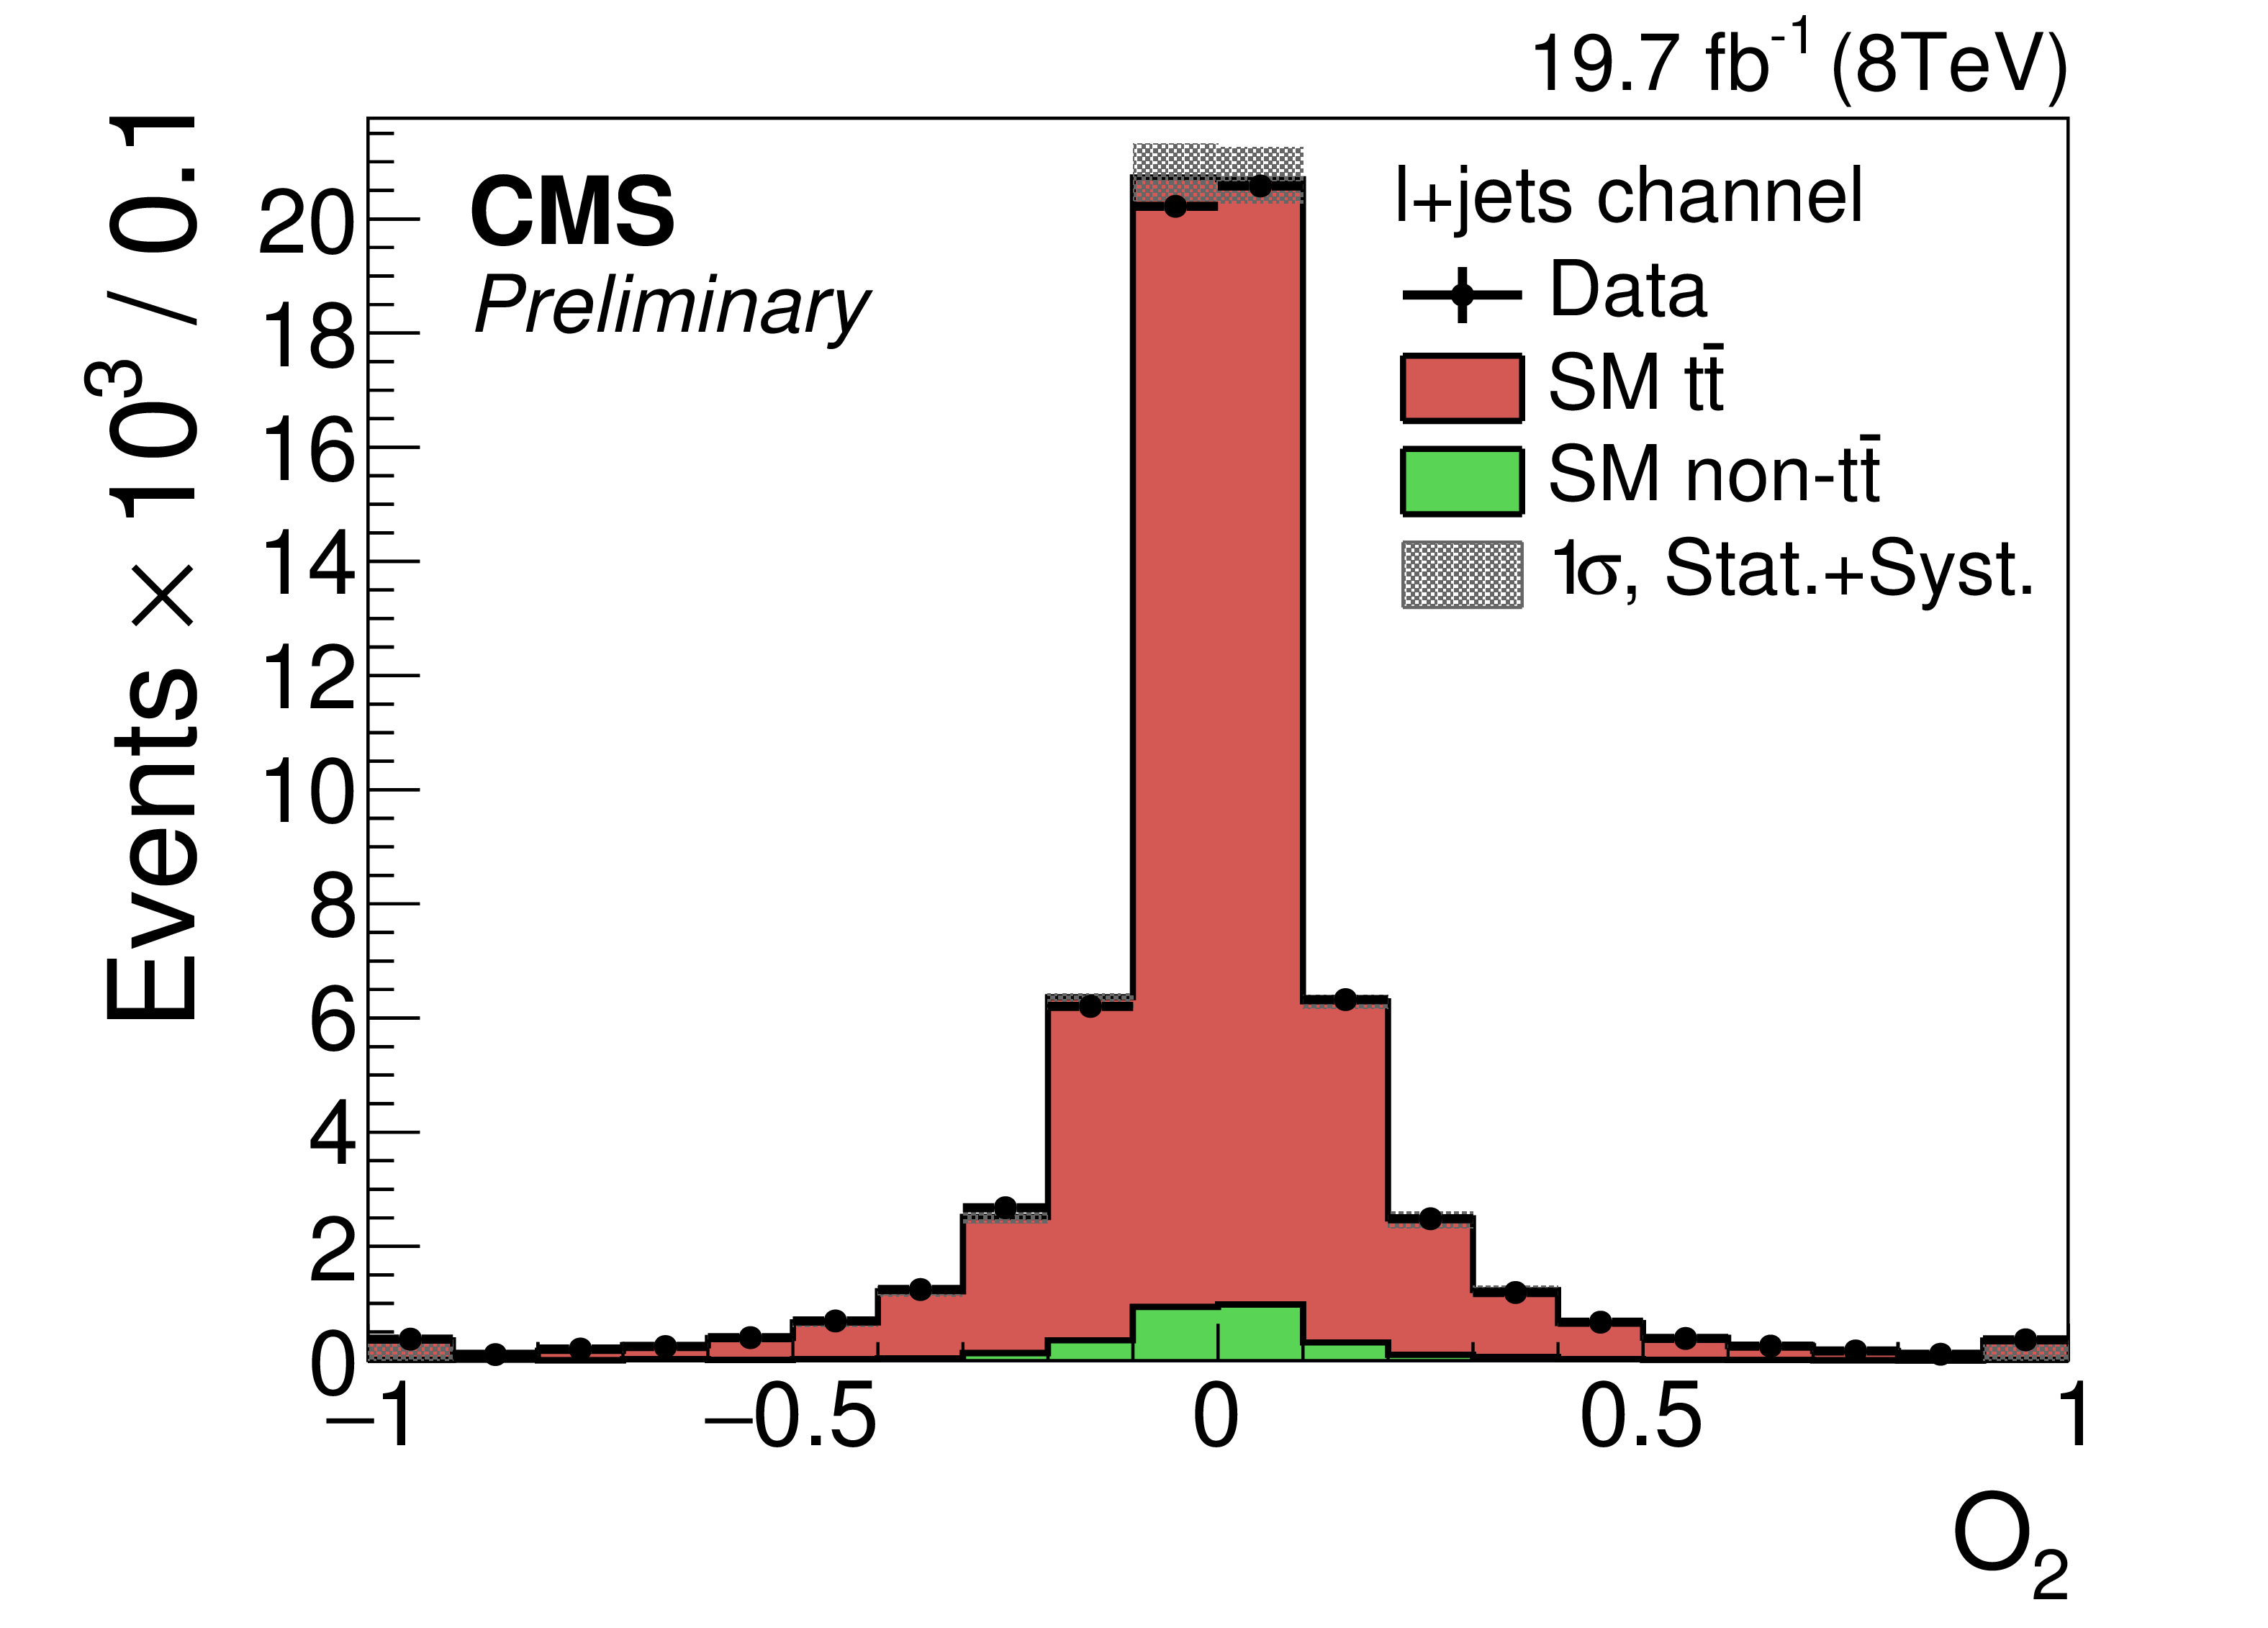
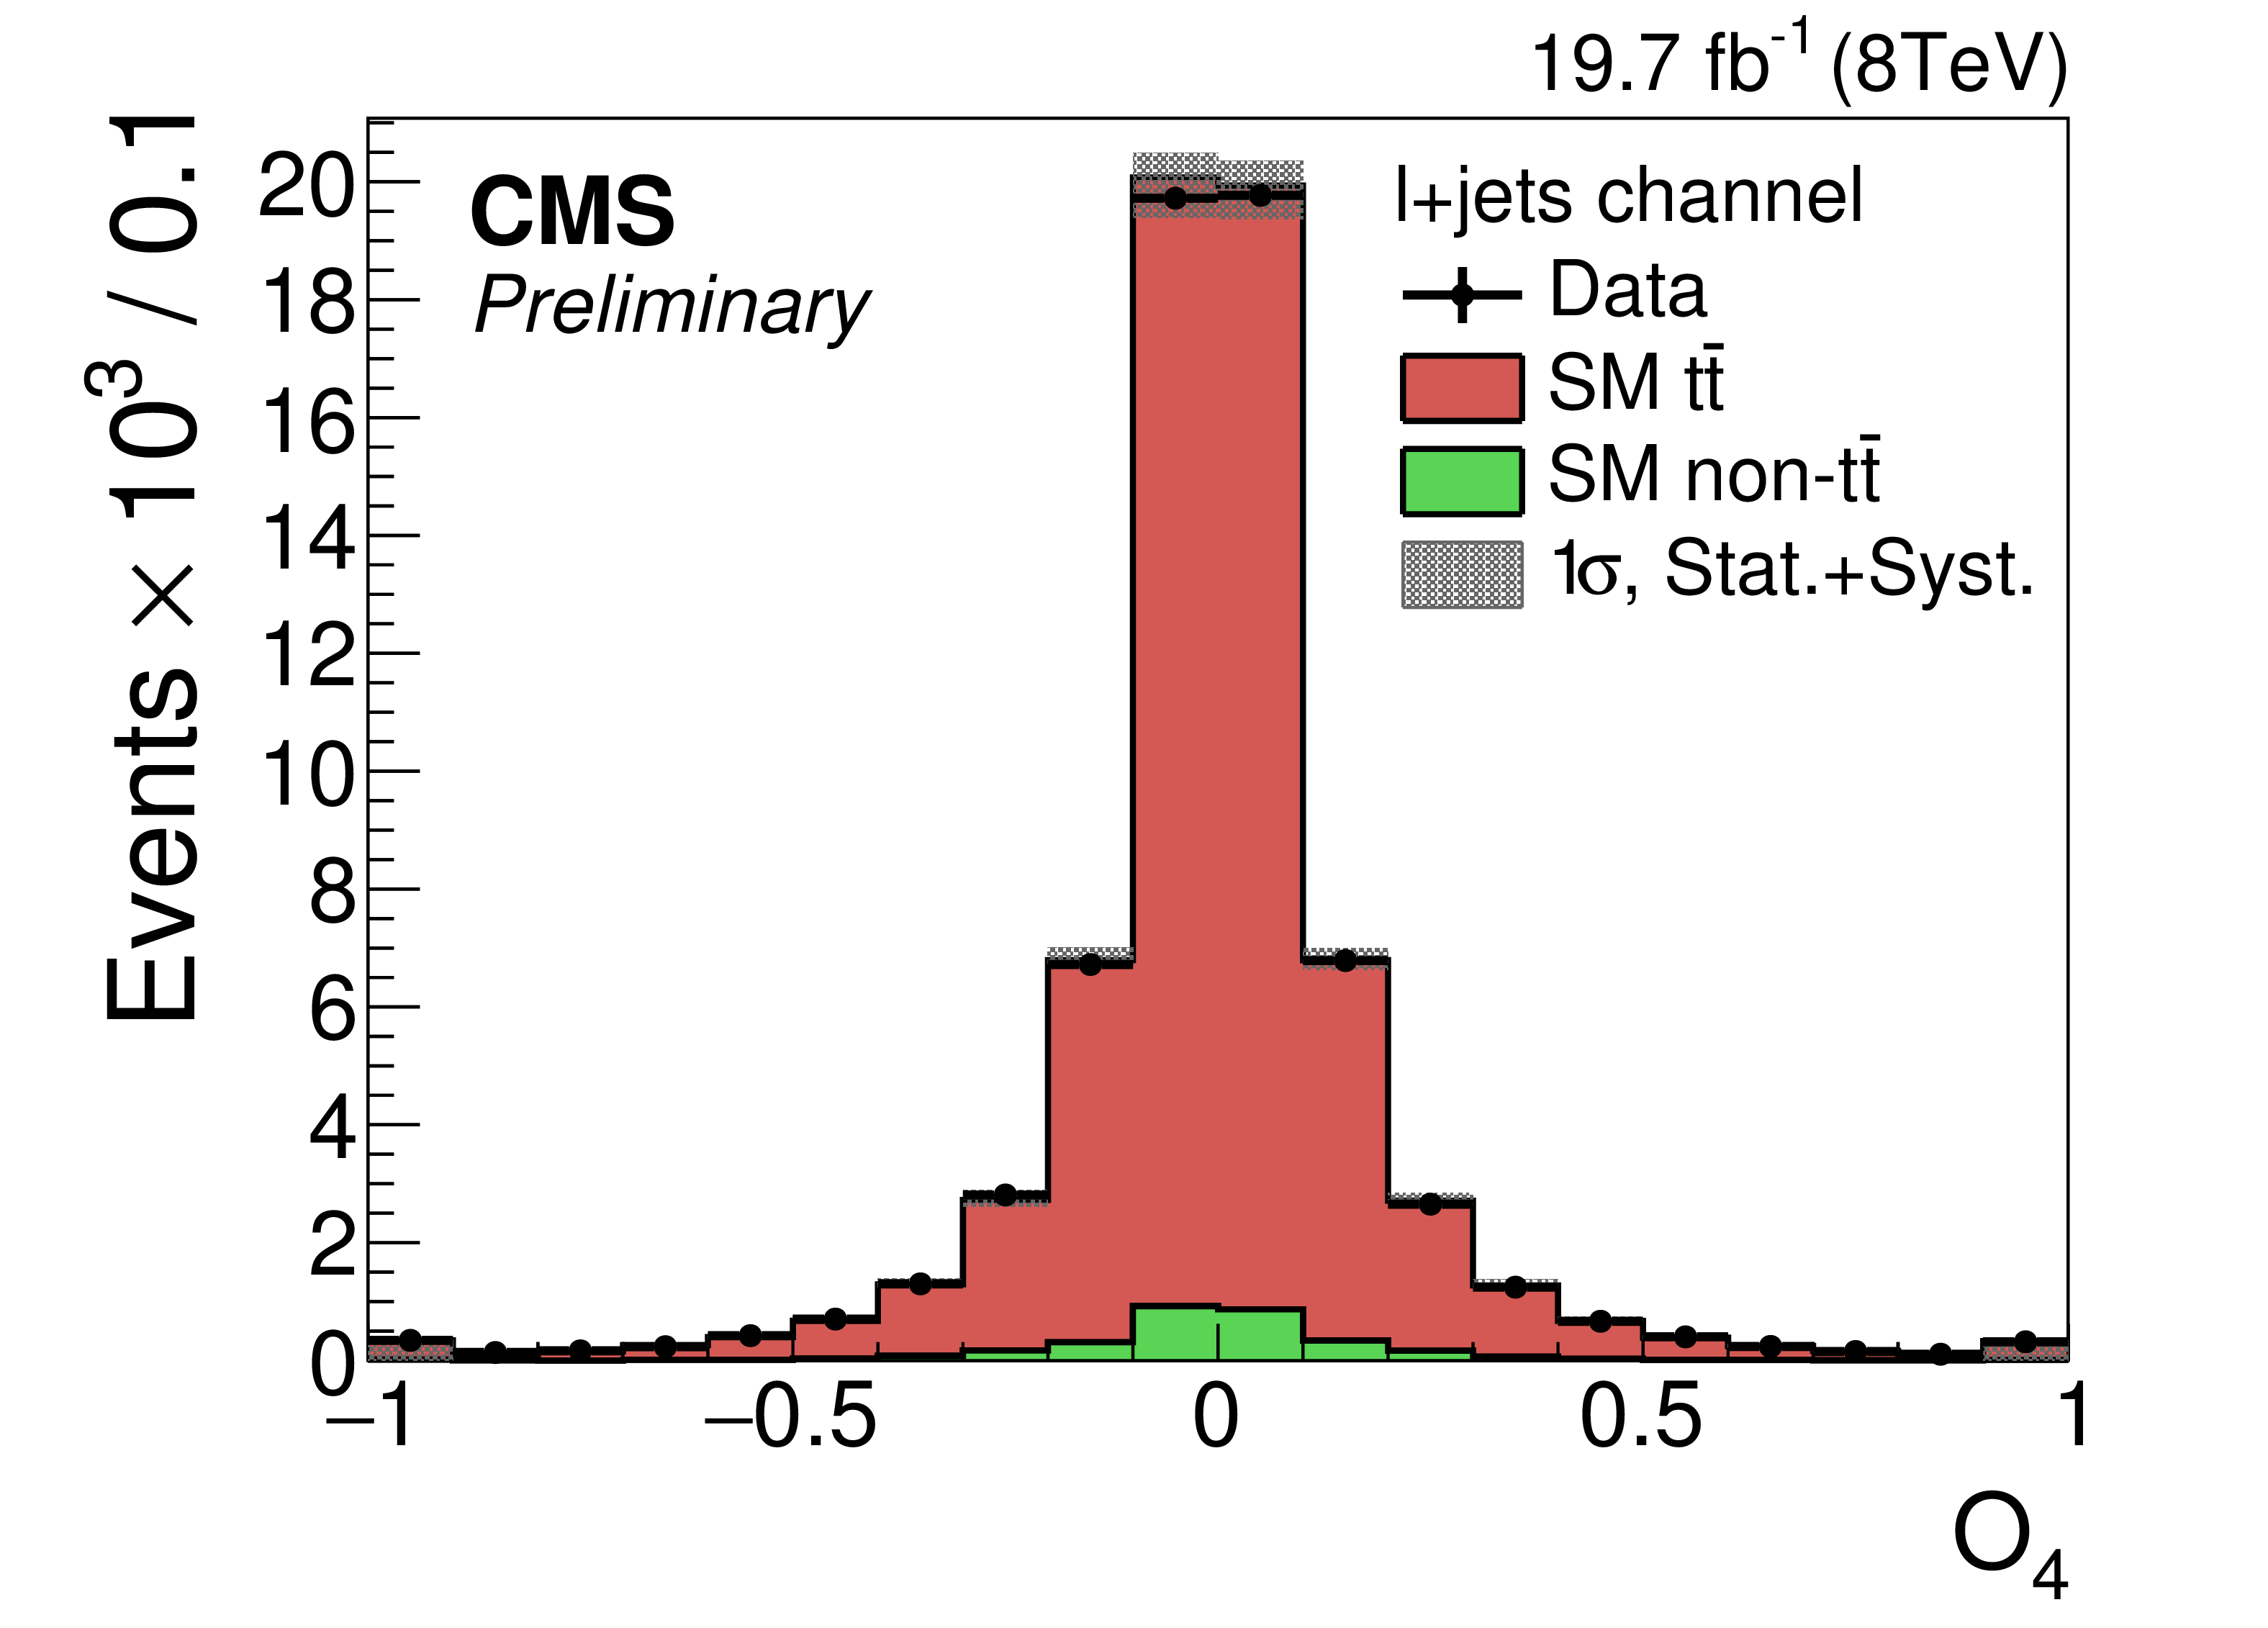
Figure 5-a:
Distribution of the observables of data and simulation (SM) in the signal region in combined channels before the background subtraction. Each observable is given in the units of $m_{ \mathrm{t} }^3$, where $m_{ \mathrm{t} }$ is the top-quark mass with 172.5 GeV. |

png pdf |
Figure 5-b:
Distribution of the observables of data and simulation (SM) in the signal region in combined channels before the background subtraction. Each observable is given in the units of $m_{ \mathrm{t} }^3$, where $m_{ \mathrm{t} }$ is the top-quark mass with 172.5 GeV. |
png pdf |
Figure 5-c:
Distribution of the observables of data and simulation (SM) in the signal region in combined channels before the background subtraction. Each observable is given in the units of $m_{ \mathrm{t} }^3$, where $m_{ \mathrm{t} }$ is the top-quark mass with 172.5 GeV. |

png pdf |
Figure 5-d:
Distribution of the observables of data and simulation (SM) in the signal region in combined channels before the background subtraction. Each observable is given in the units of $m_{ \mathrm{t} }^3$, where $m_{ \mathrm{t} }$ is the top-quark mass with 172.5 GeV. |
png pdf |
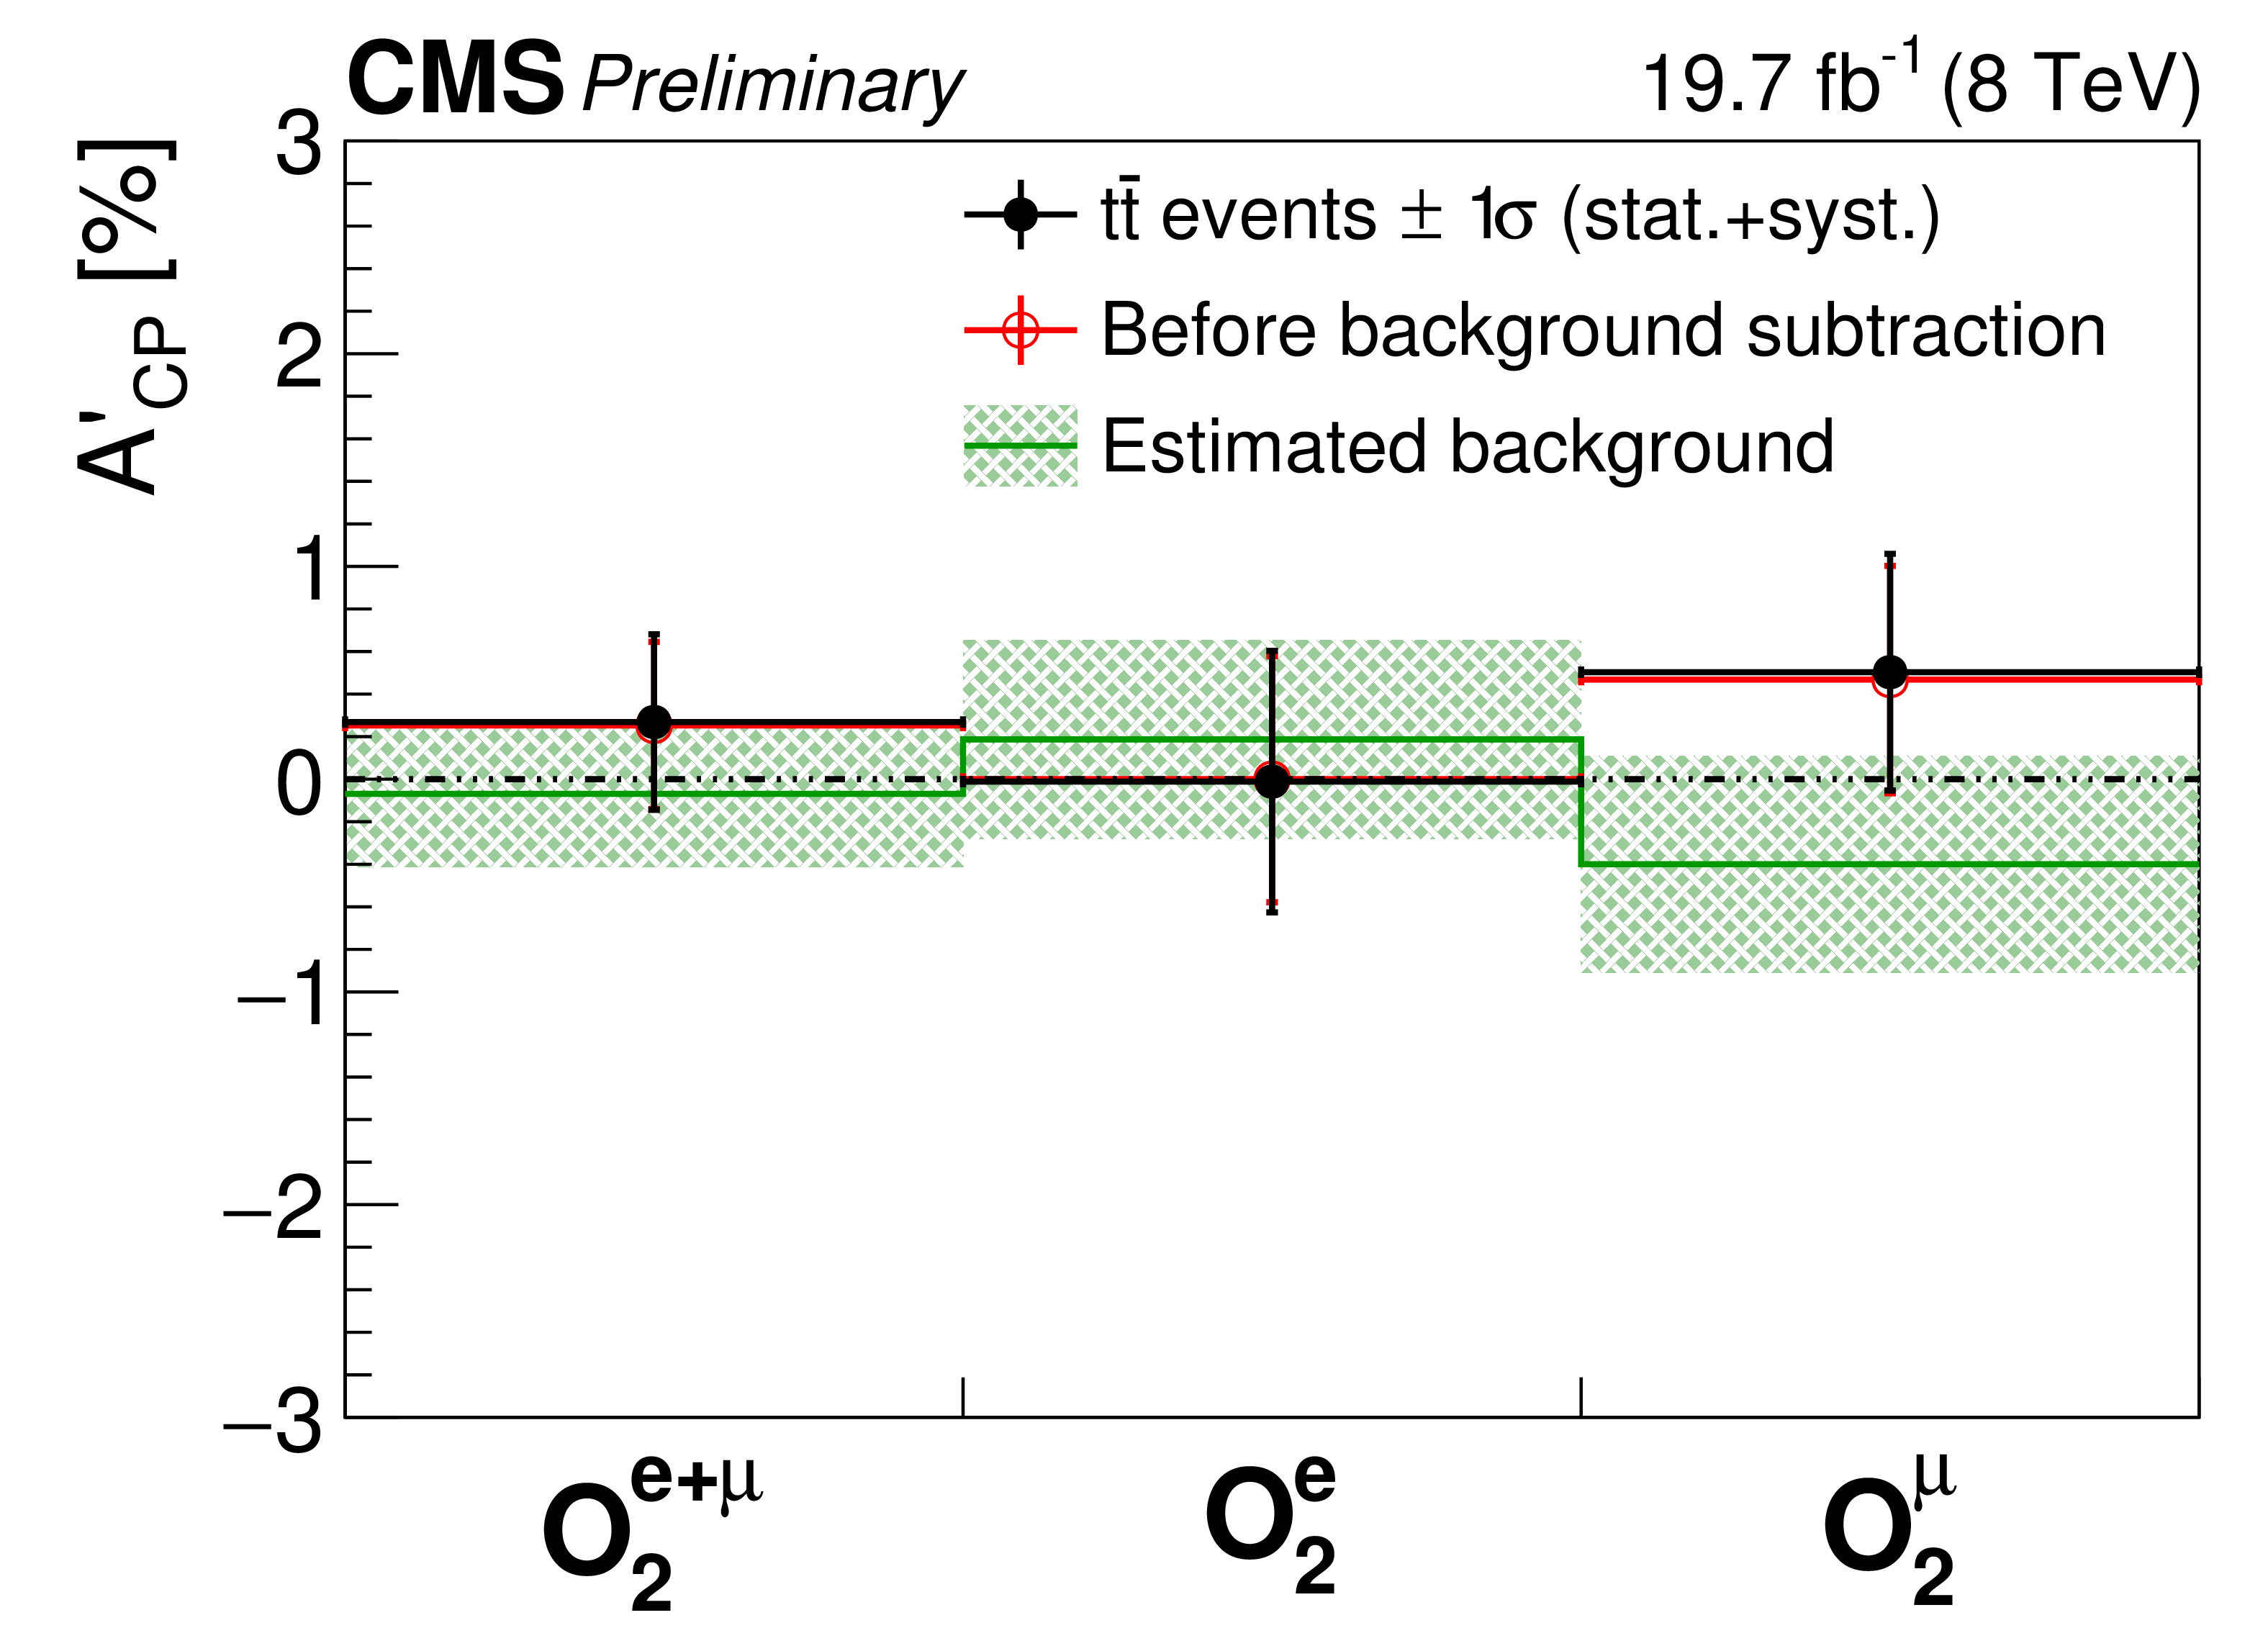
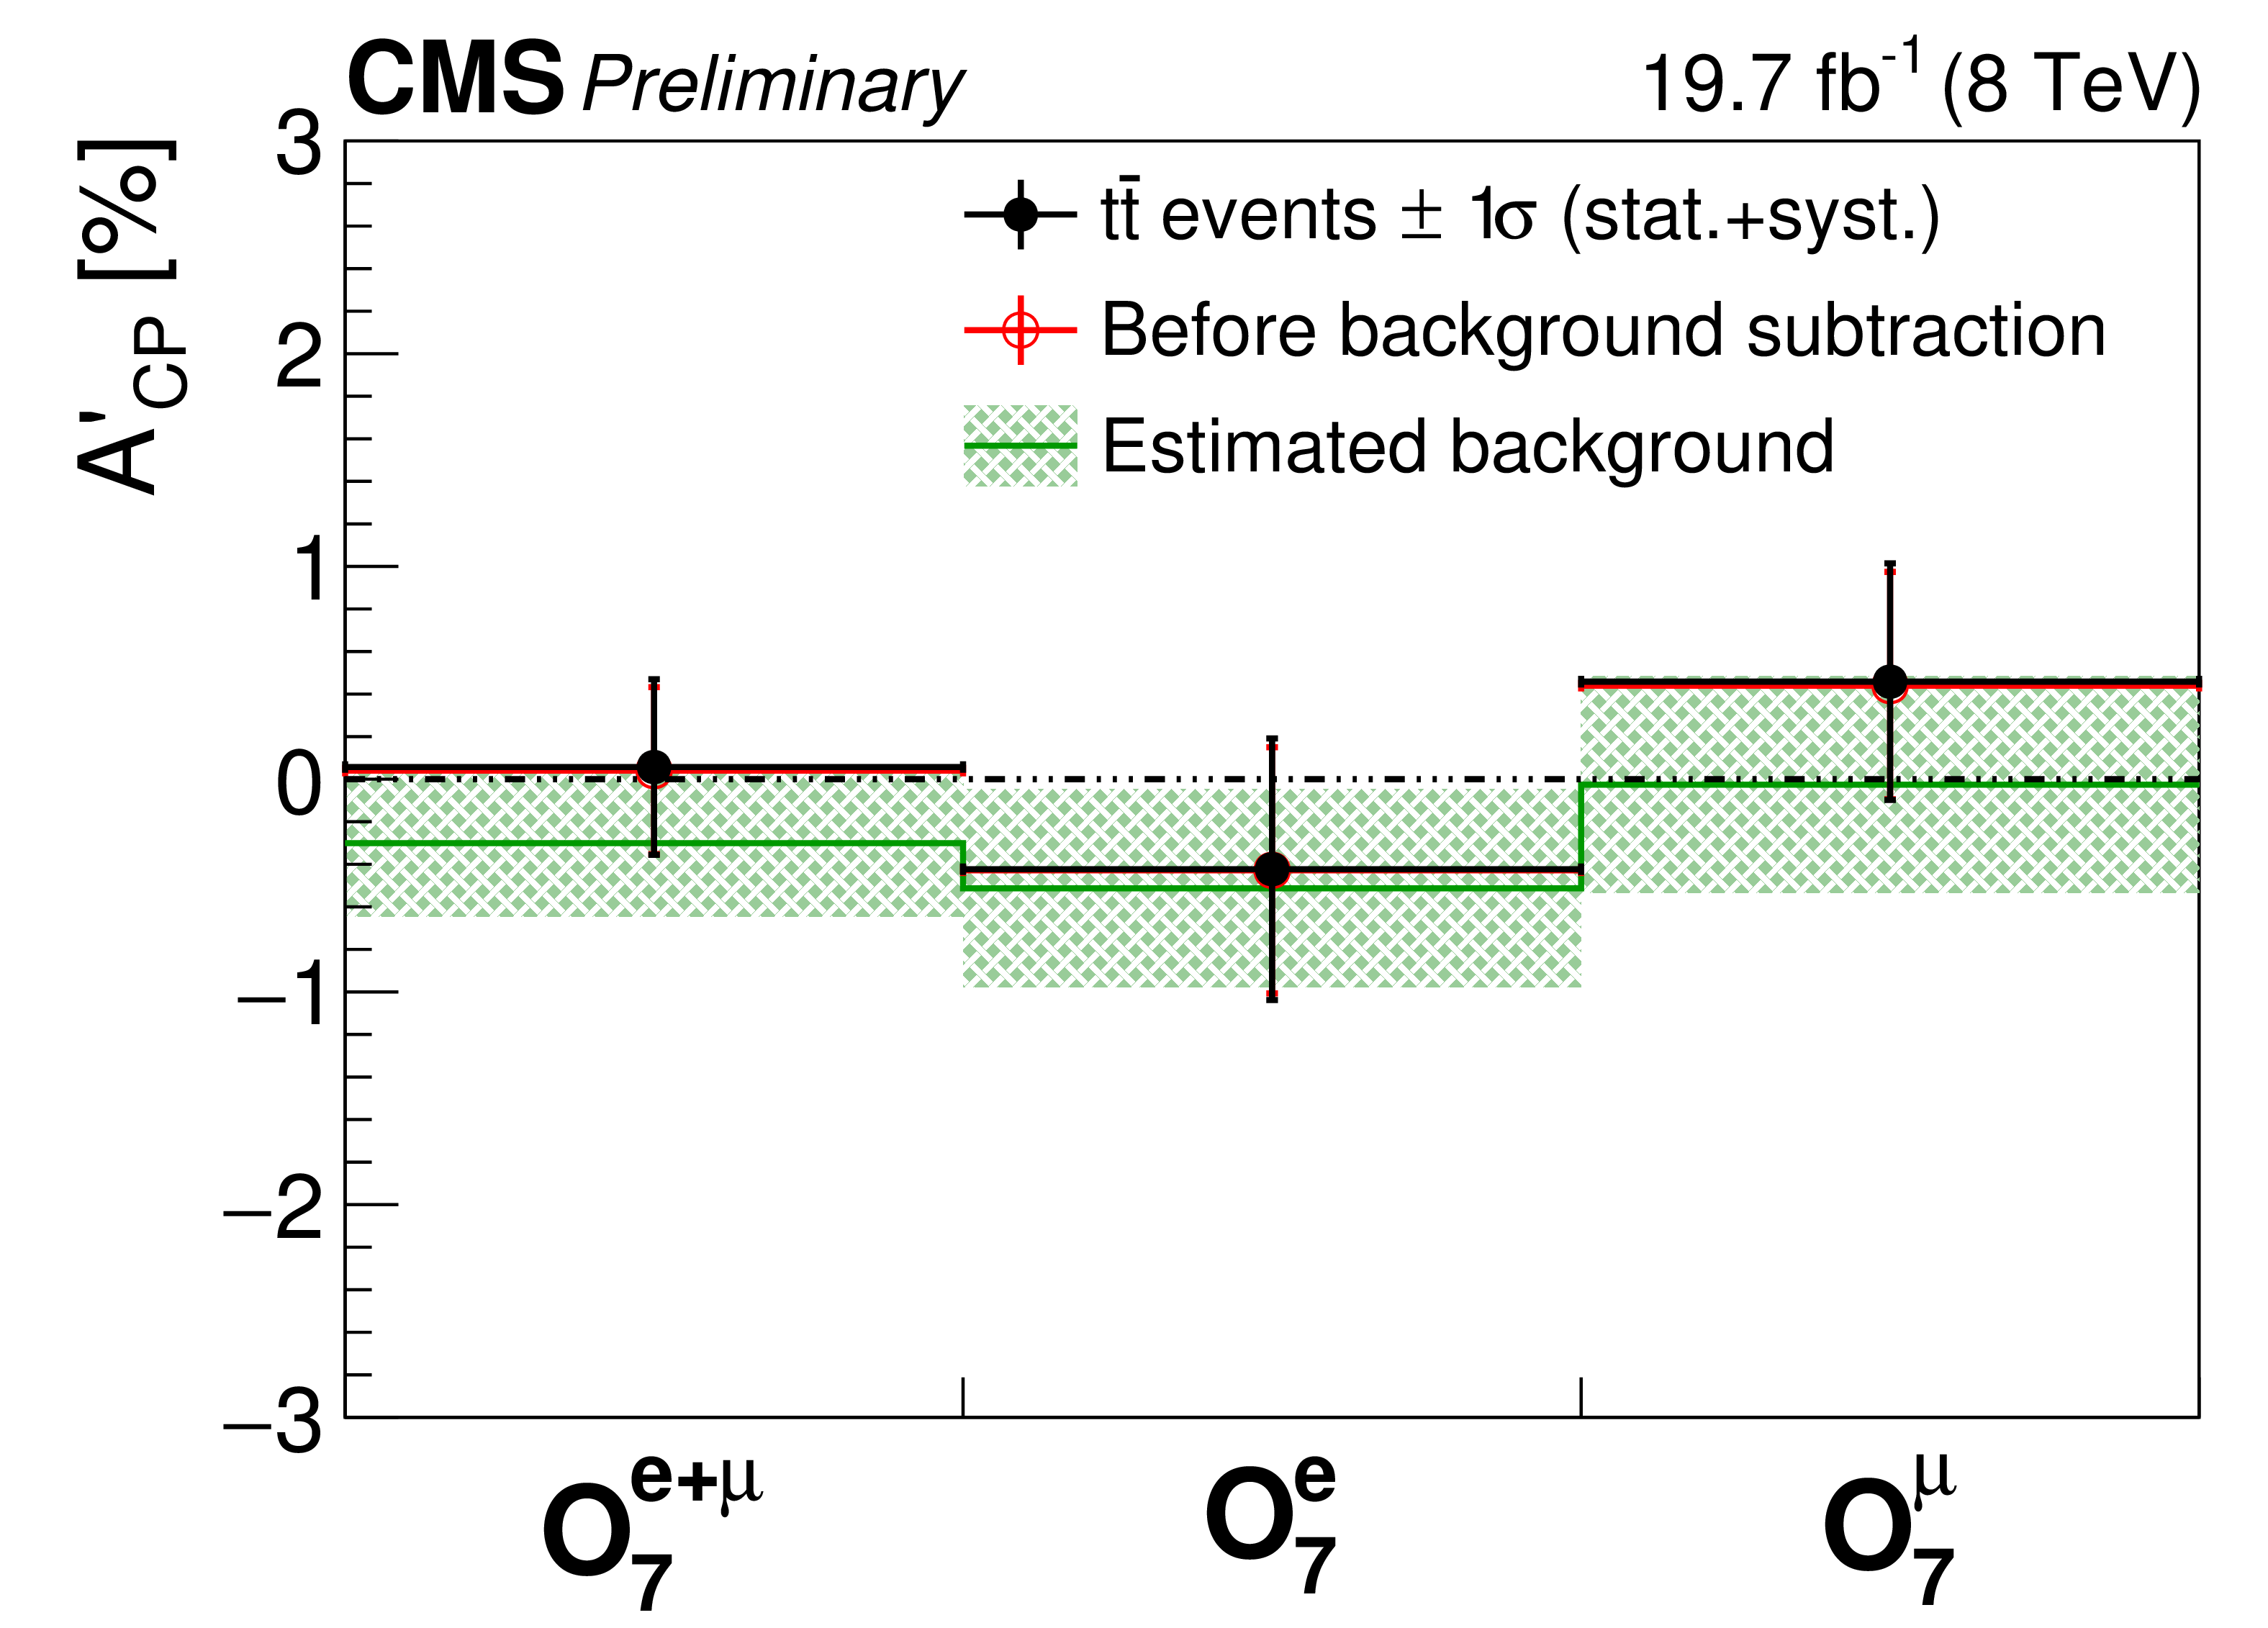
Figure 6-a:
Summary of the $ {A_{CP}^\prime } $ measurements performed for the different observables in all the channels. The background $ {A_{CP}^\prime } $, estimated from data, is represented in green with its statistical uncertainty. The raw $ {A_{CP}^\prime } $ observed in the signal region, prior to any background subtraction is represented in red with its statistical uncertainty. After background subtraction the final result is represented in black including the total (statistical+systematic) uncertainties. |

png pdf |
Figure 6-b:
Summary of the $ {A_{CP}^\prime } $ measurements performed for the different observables in all the channels. The background $ {A_{CP}^\prime } $, estimated from data, is represented in green with its statistical uncertainty. The raw $ {A_{CP}^\prime } $ observed in the signal region, prior to any background subtraction is represented in red with its statistical uncertainty. After background subtraction the final result is represented in black including the total (statistical+systematic) uncertainties. |

png pdf |
Figure 6-c:
Summary of the $ {A_{CP}^\prime } $ measurements performed for the different observables in all the channels. The background $ {A_{CP}^\prime } $, estimated from data, is represented in green with its statistical uncertainty. The raw $ {A_{CP}^\prime } $ observed in the signal region, prior to any background subtraction is represented in red with its statistical uncertainty. After background subtraction the final result is represented in black including the total (statistical+systematic) uncertainties. |
png pdf |
Figure 6-d:
Summary of the $ {A_{CP}^\prime } $ measurements performed for the different observables in all the channels. The background $ {A_{CP}^\prime } $, estimated from data, is represented in green with its statistical uncertainty. The raw $ {A_{CP}^\prime } $ observed in the signal region, prior to any background subtraction is represented in red with its statistical uncertainty. After background subtraction the final result is represented in black including the total (statistical+systematic) uncertainties. |
| Tables | |

png pdf |
Table 1:
$ {A_{CP}^\prime } $ of the 0 b-jet control region in data for each observable in electron, muon and combined channels. The uncertainty is of statistical nature. The values quoted are in %. |
png pdf |
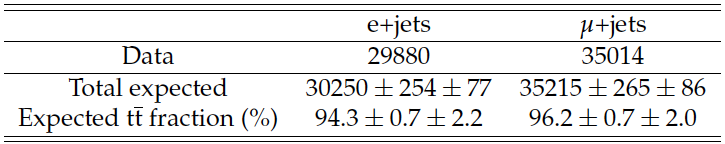
Table 2:
Events observed and expected in the different semileptonic channels after the final selection. The expected $ {\mathrm{ t \bar{t} } }$ fraction (purity) obtained from the fit is also reported. The first (second) uncertainty is of statistical (systematic) nature. |

png pdf |
Table 3:
Break-down of the estimated systematic uncertainties affecting the measurement of $ {A_{CP}^\prime } $ for different variables. The values quoted reflect the expected difference induced with respect to the nominal $ {A_{CP}^\prime } $ for each observable. The values quoted are in %. |
png pdf |
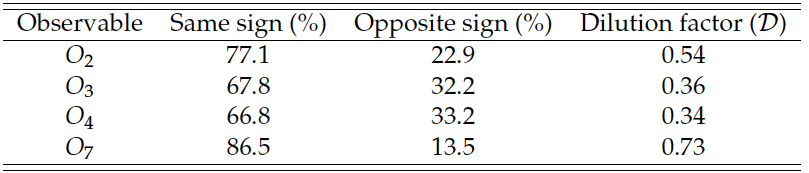
Table 4:
Fraction of same sign and opposite signed events for each observable. If the observables are reconstructed with the same (opposite) sign the event is classified as a same (opposite) signed event. The last column reports the dilution factors computed from the two fractions. |

png pdf |
Table 5:
Measured $ {A_{CP}^\prime } $ in the signal region in data for different observables. The measurements are reported separately for the electron and muon channel, and after combination of the two. The first (second) uncertainty is of statistical (systematic) nature. The values quoted are in %. |
|
|
Compact Muon Solenoid LHC, CERN |
|

|

|

|

|

|