

Compact Muon Solenoid
LHC, CERN
| CMS-PAS-SUS-16-003 | ||
| Search for SUSY with multileptons in 13 TeV data | ||
| CMS Collaboration | ||
| March 2016 | ||
| Abstract: A search for new physics is performed using events with multileptons ($\ge$ 3 electrons or muons) in the final state using the CMS detector. Results are based on a sample of proton-proton collisions at a centre-of-mass energy of 13 TeV at the LHC corresponding to an integrated luminosity of 2.3 fb$^{-1}$. Search regions have been defined by the number of b-tagged jets, missing transverse energy, hadronic transverse energy, and the invariant mass of opposite-sign, same-flavor dilepton pairs in the events. No excess above the standard model background expectation is observed. In a model with gluino pair production where the gluino decays to two top quarks and a neutralino, gluinos with mass less than 1125 GeV are excluded. | ||
|
Links:
CDS record (PDF) ;
CADI line (restricted) ;
These preliminary results are superseded in this paper, EPJC 77 (2017) 635. The superseded preliminary plots can be found here. |
||
| Figures | |

png pdf |
Figure 1-a:
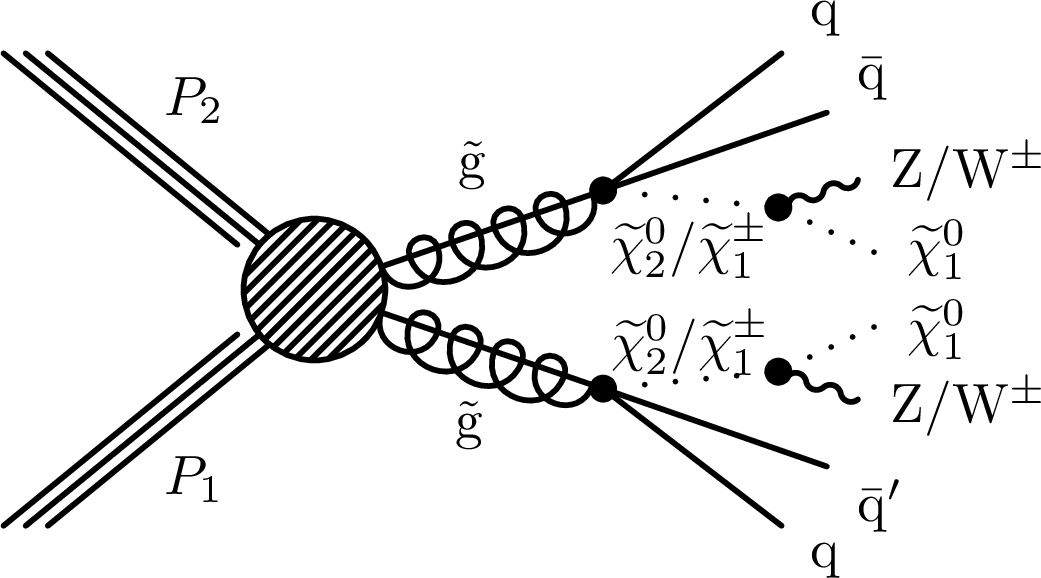
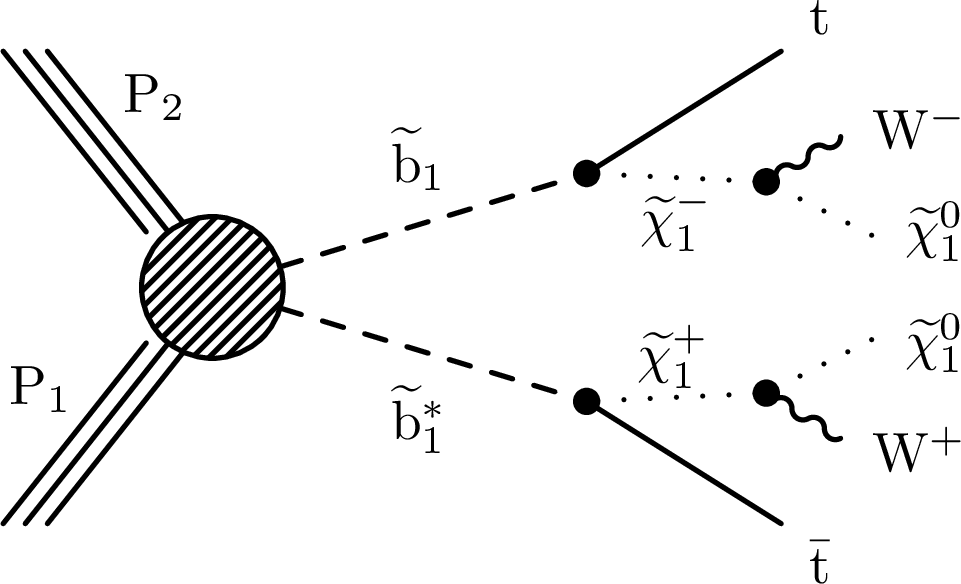
Diagrams for gluino and bottom squark pair production which can produce multilepton events: T1tttt (a), T5qqqqWZ (b), and T6ttWW (c). |
png pdf |
Figure 1-b:
Diagrams for gluino and bottom squark pair production which can produce multilepton events: T1tttt (a), T5qqqqWZ (b), and T6ttWW (c). |
png pdf |
Figure 1-c:
Diagrams for gluino and bottom squark pair production which can produce multilepton events: T1tttt (a), T5qqqqWZ (b), and T6ttWW (c). |
png pdf |
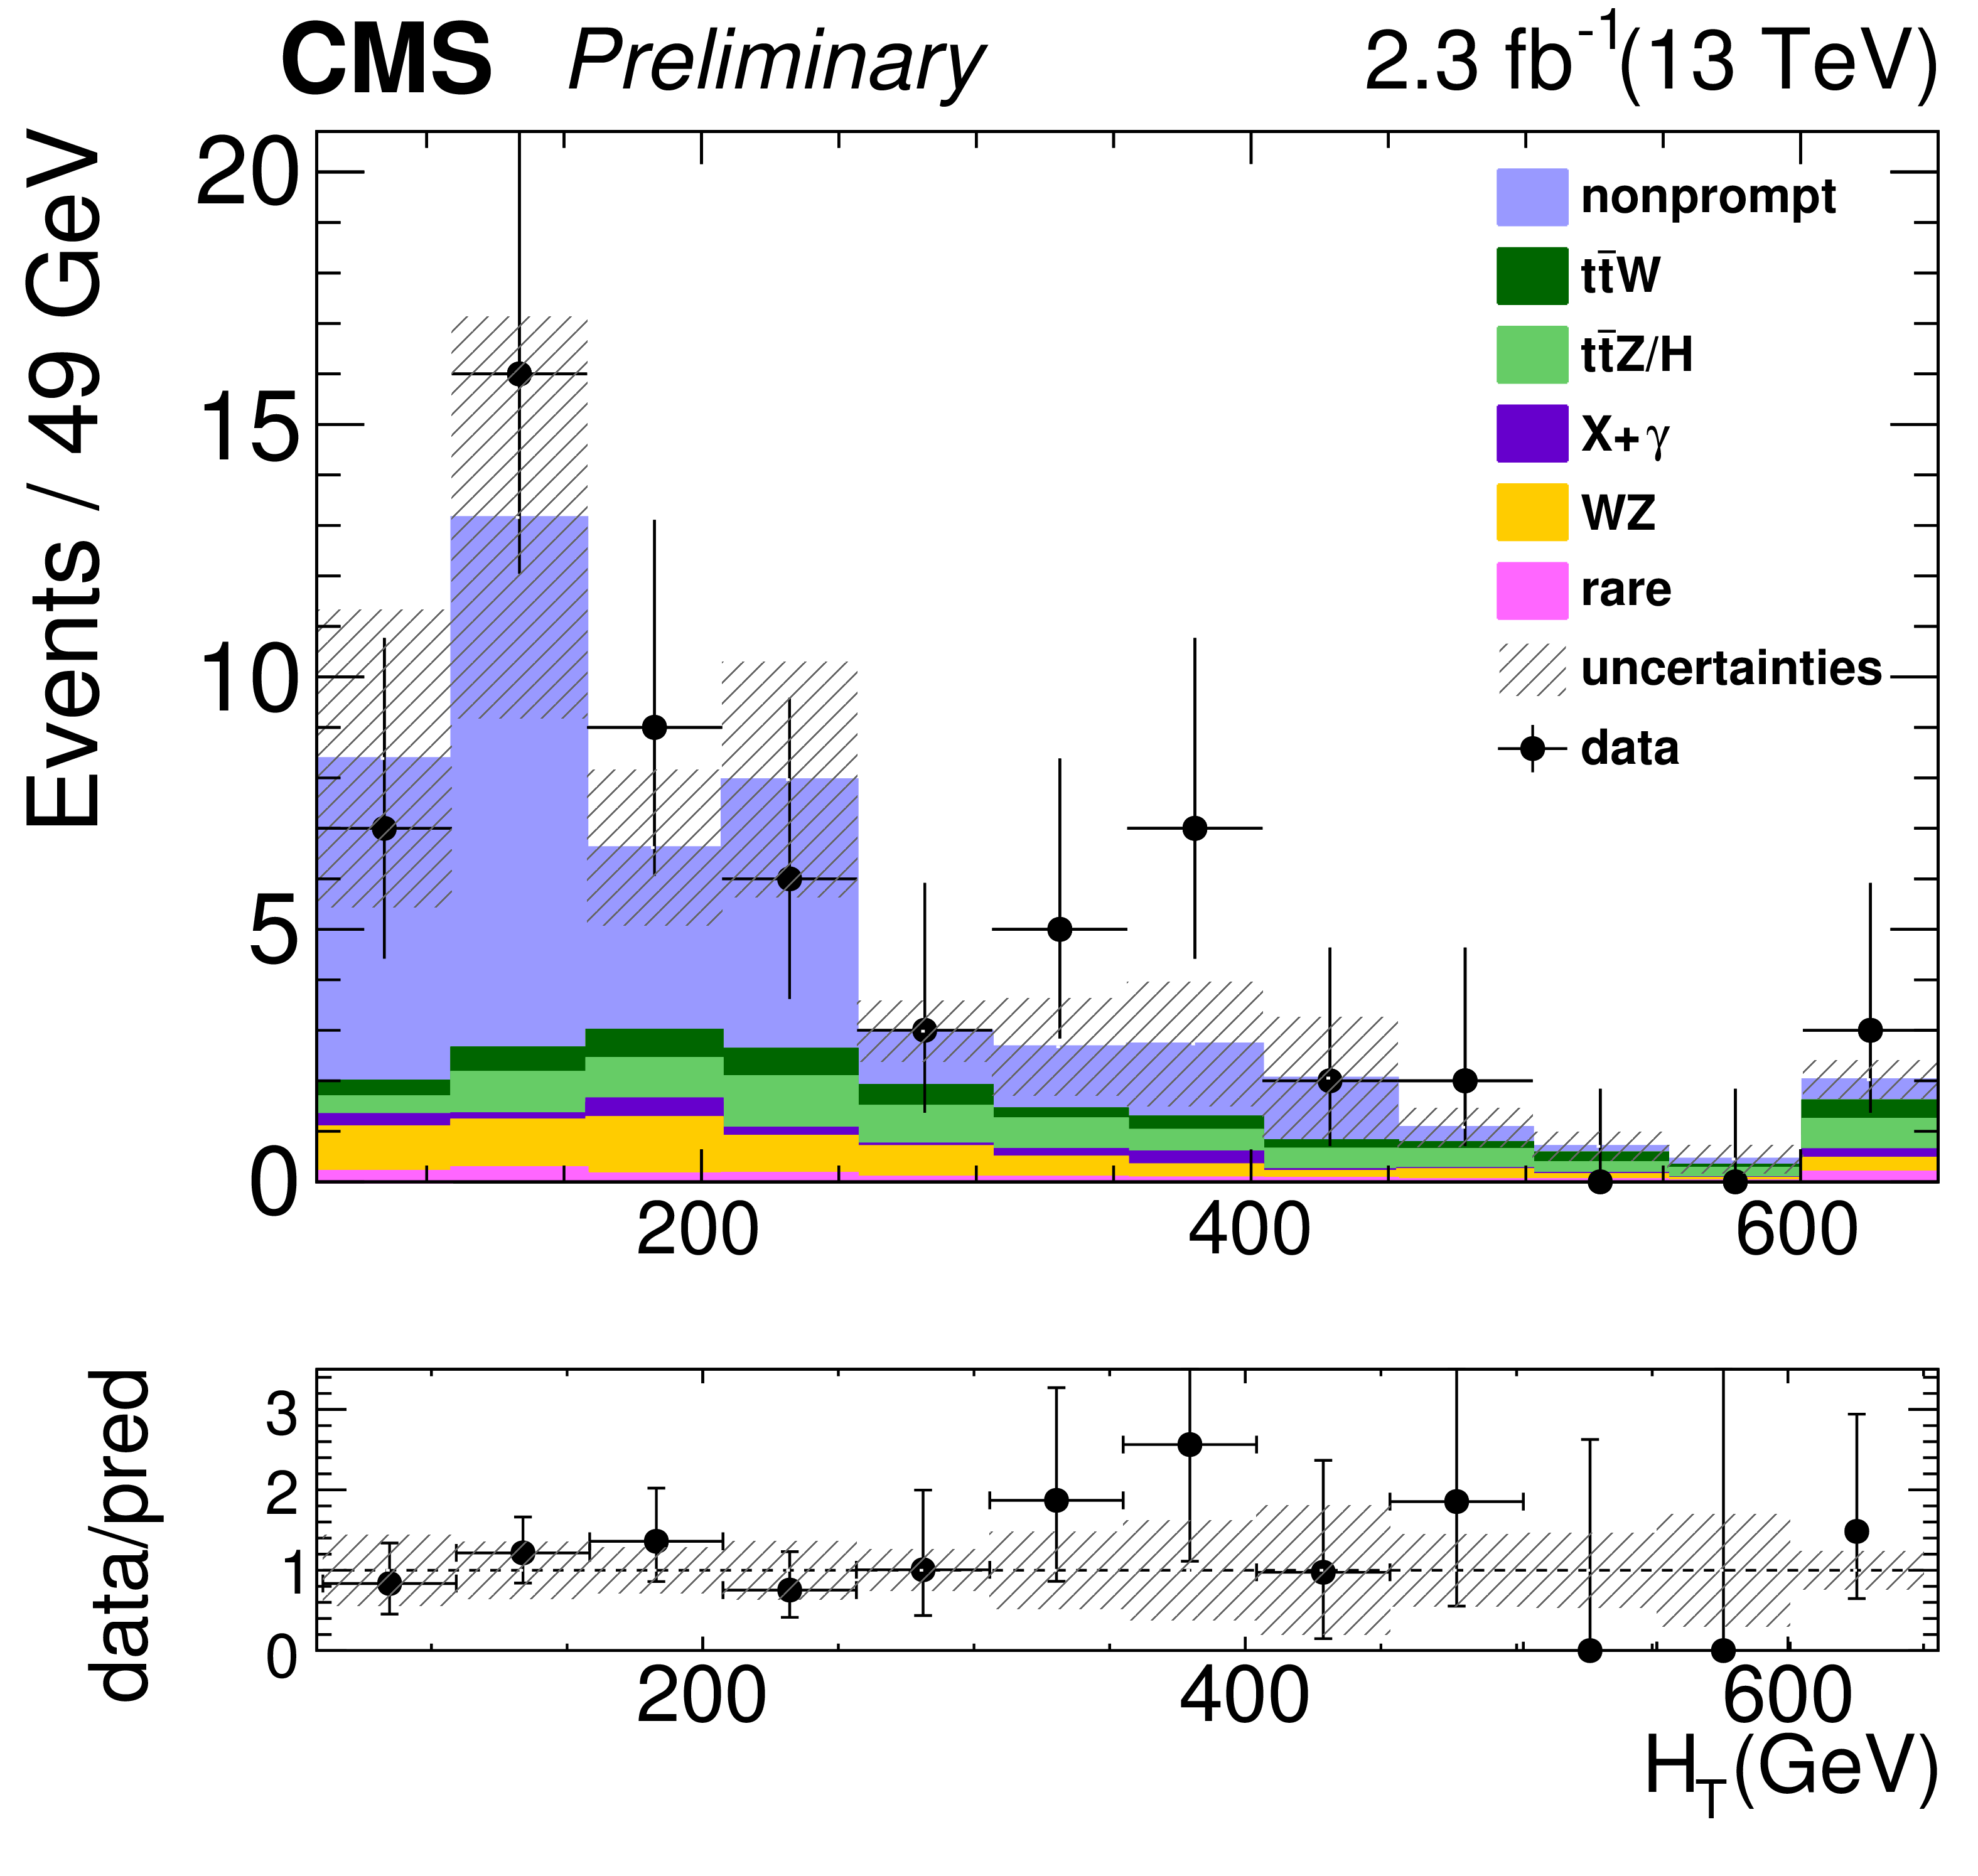
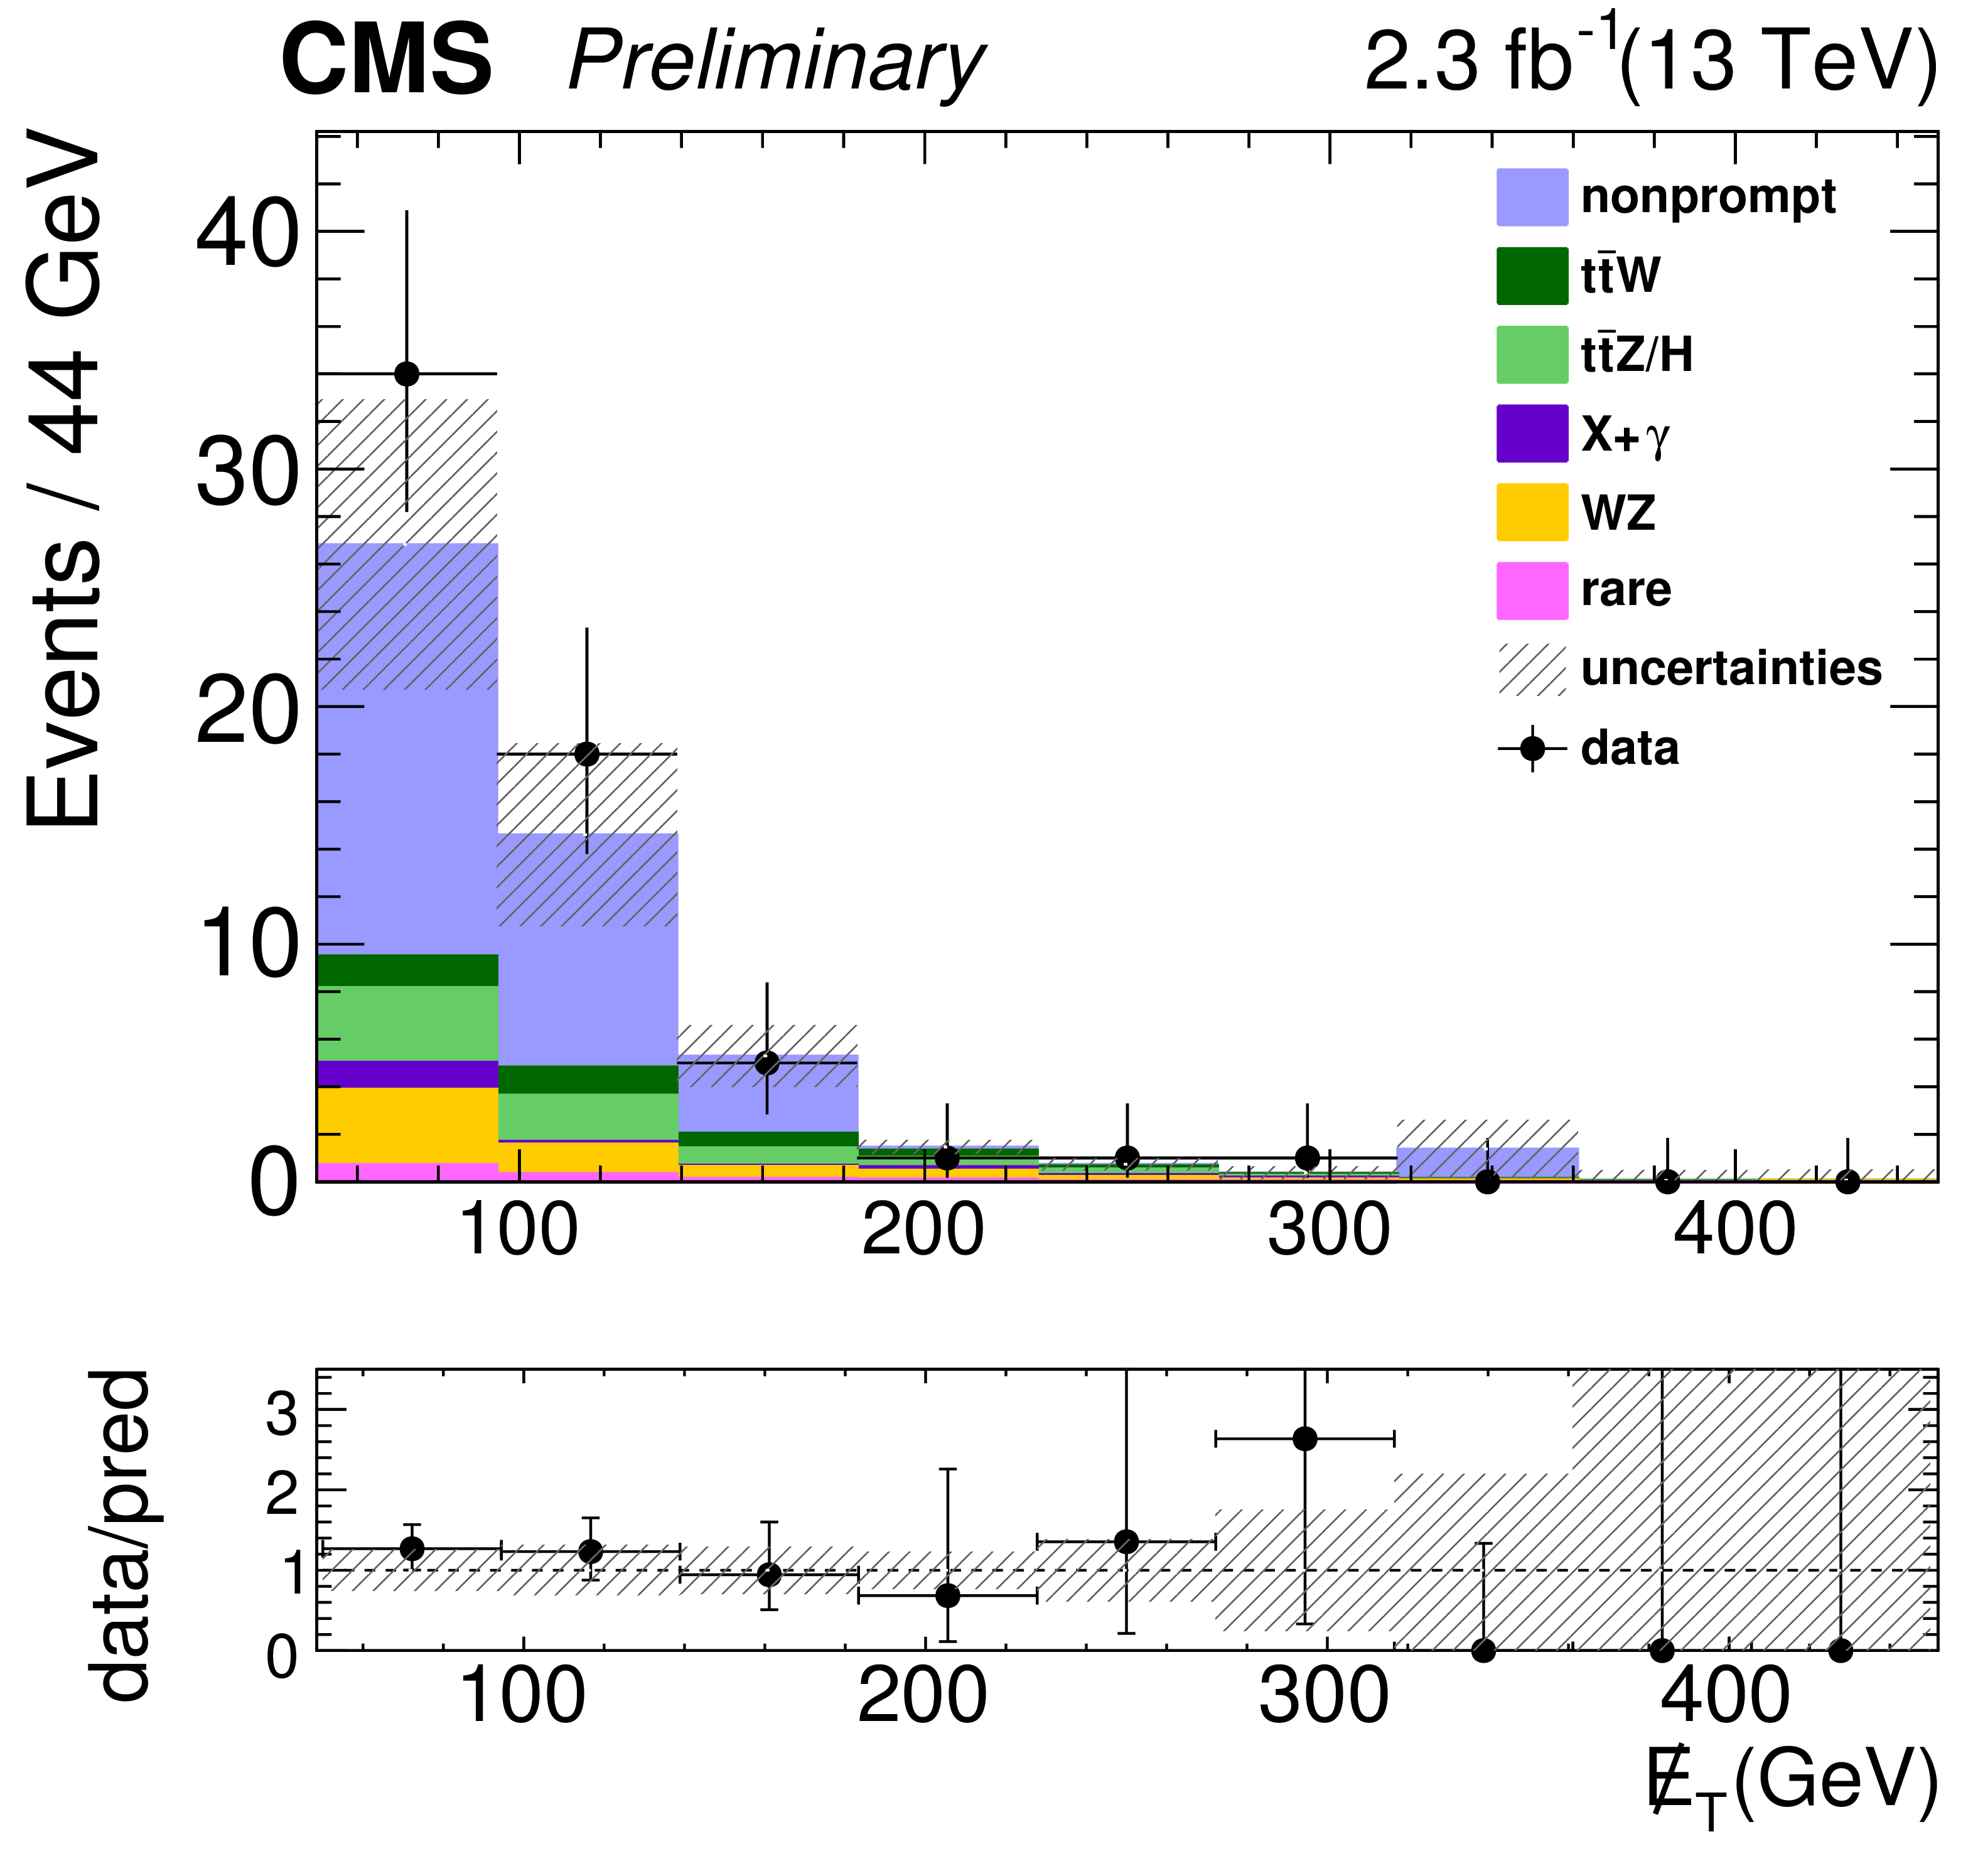
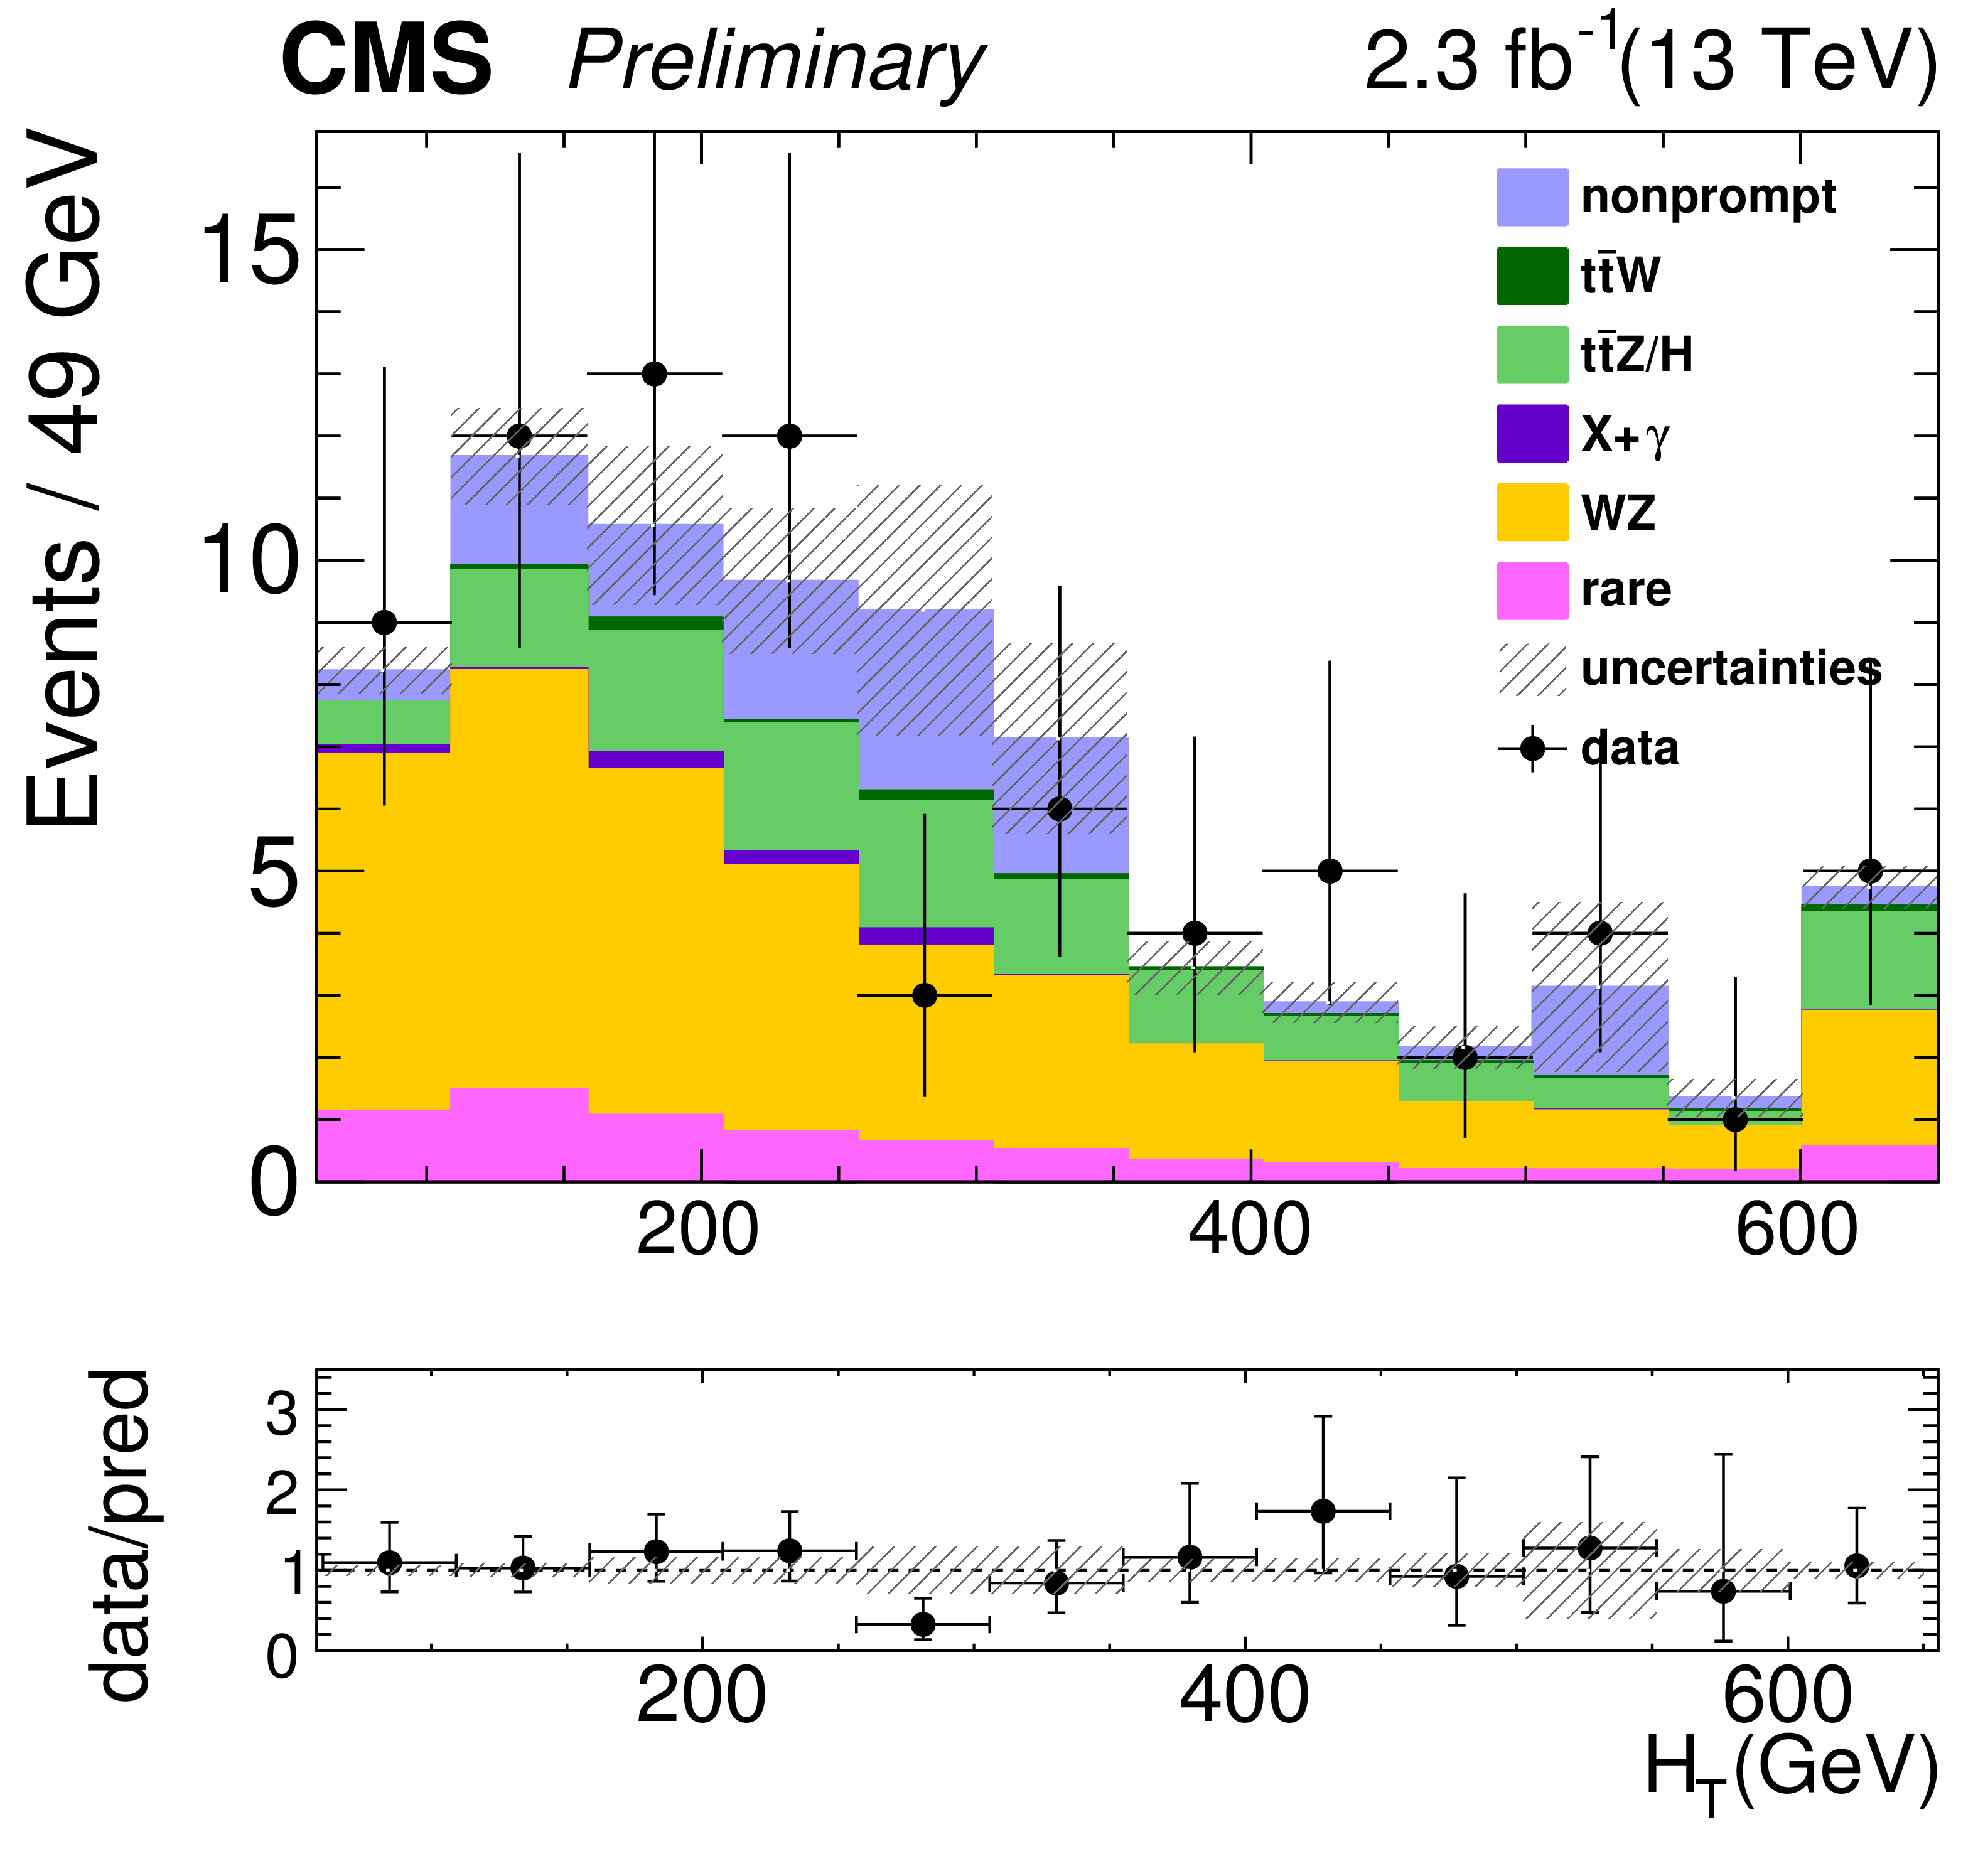
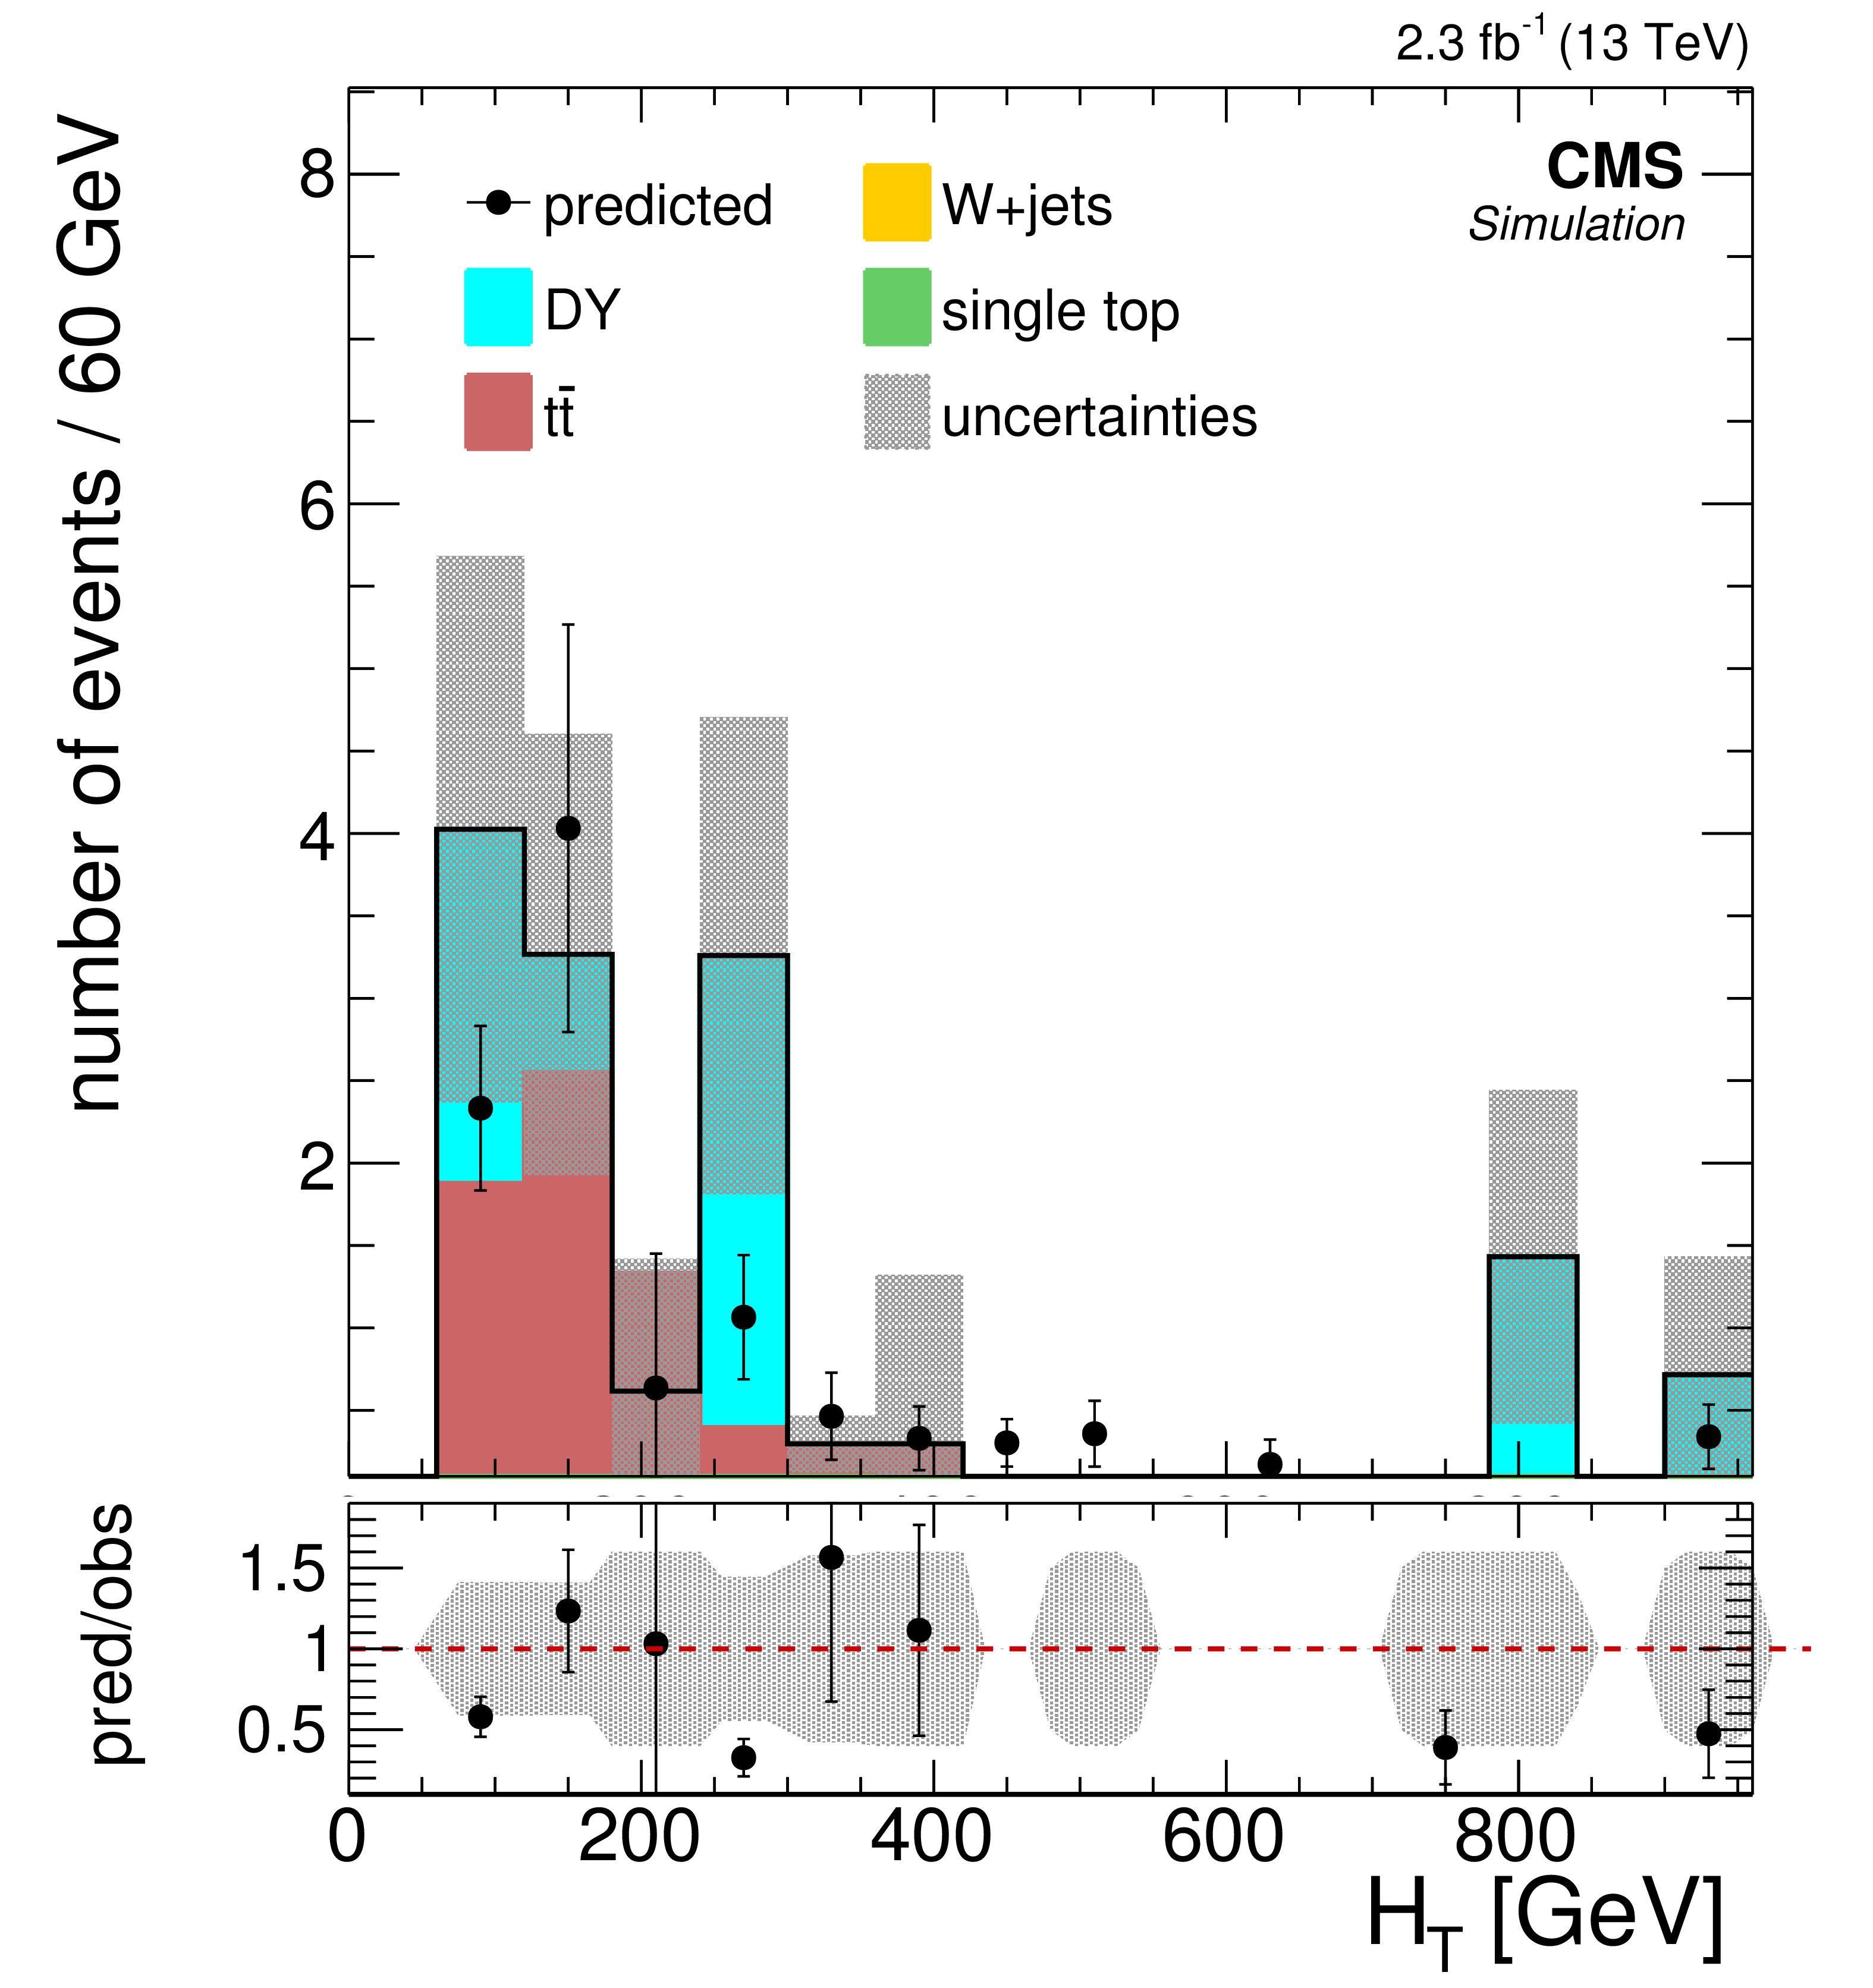
Figure 2-a:
Comparisons of the distributions of (a) $ {H_{\mathrm {T}}} $, (b) $ {E_{\mathrm {T}}^{\text {miss}}} $, (c) $ {N_\text {jets}} $, (d) $ {N_\text {b jets}} $, (e-g) $ {p_{\mathrm {T}}} $ of leptons for the background predictions to those observed in data in the off-Z baseline selection region. The nonprompt lepton backgrounds come from the data-driven technique described in Section 4. The total predicted background and number of events observed in 15 off-Z SRs is shown in (h). |
png pdf |
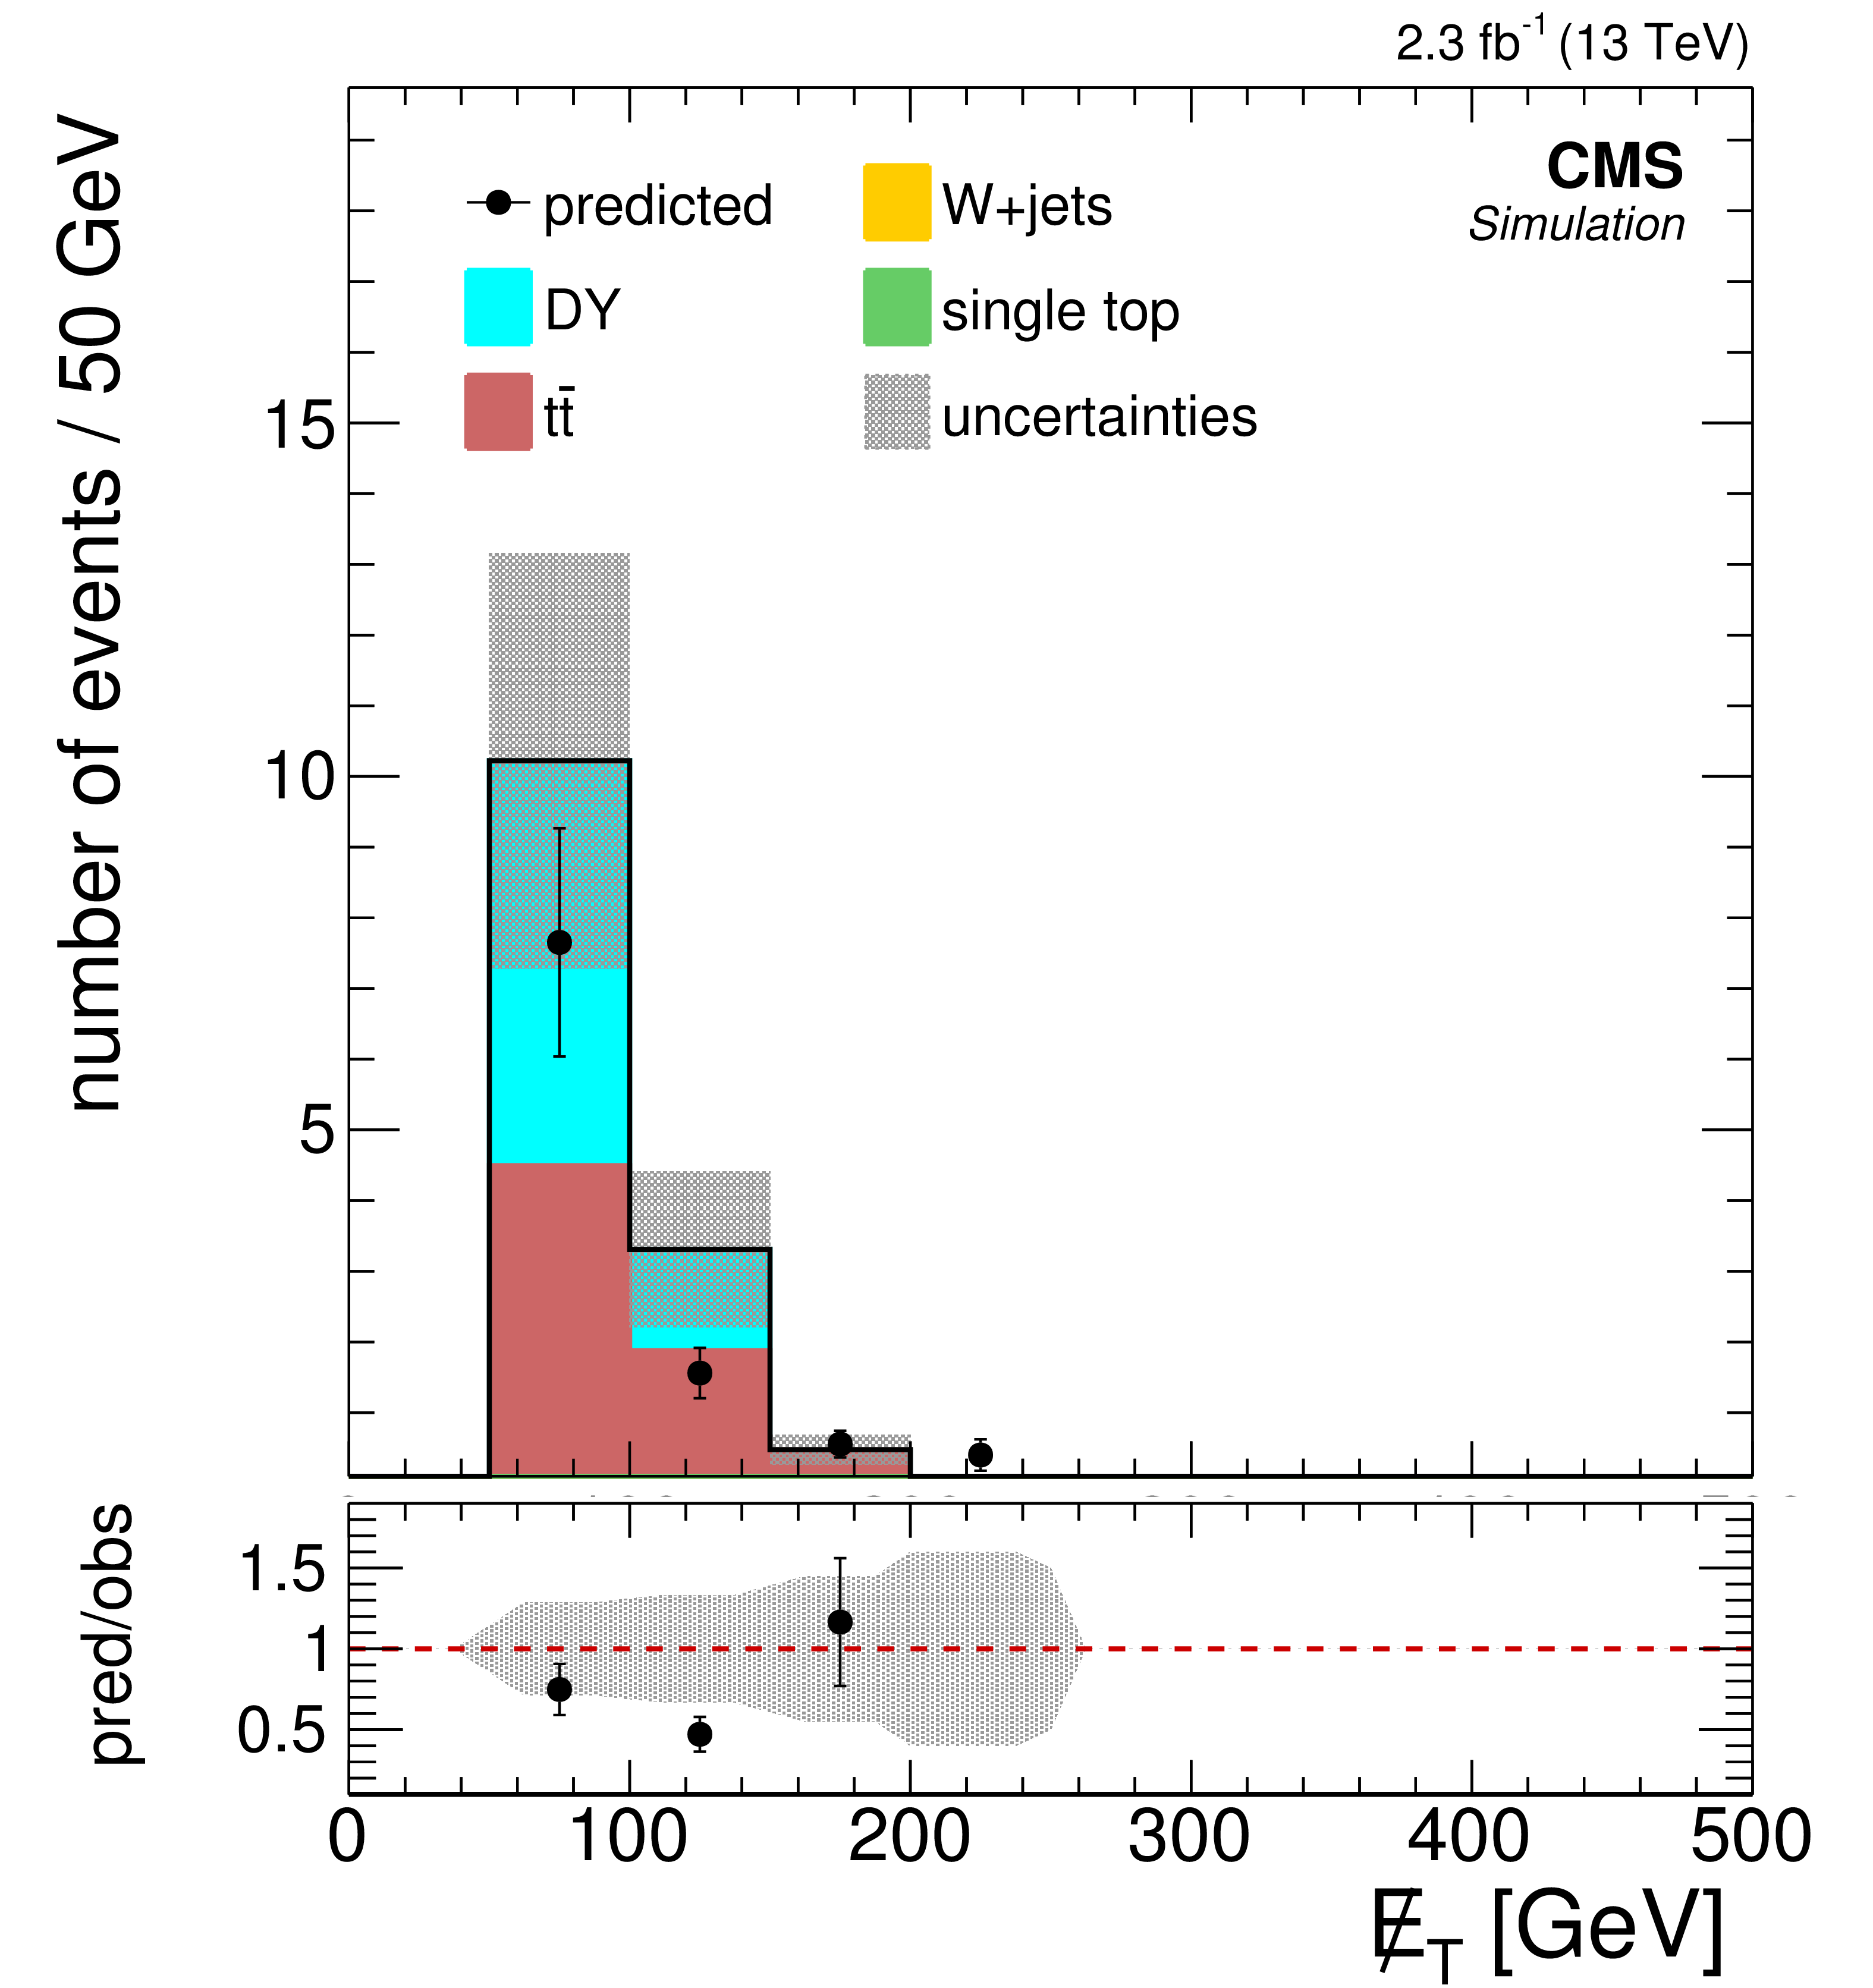
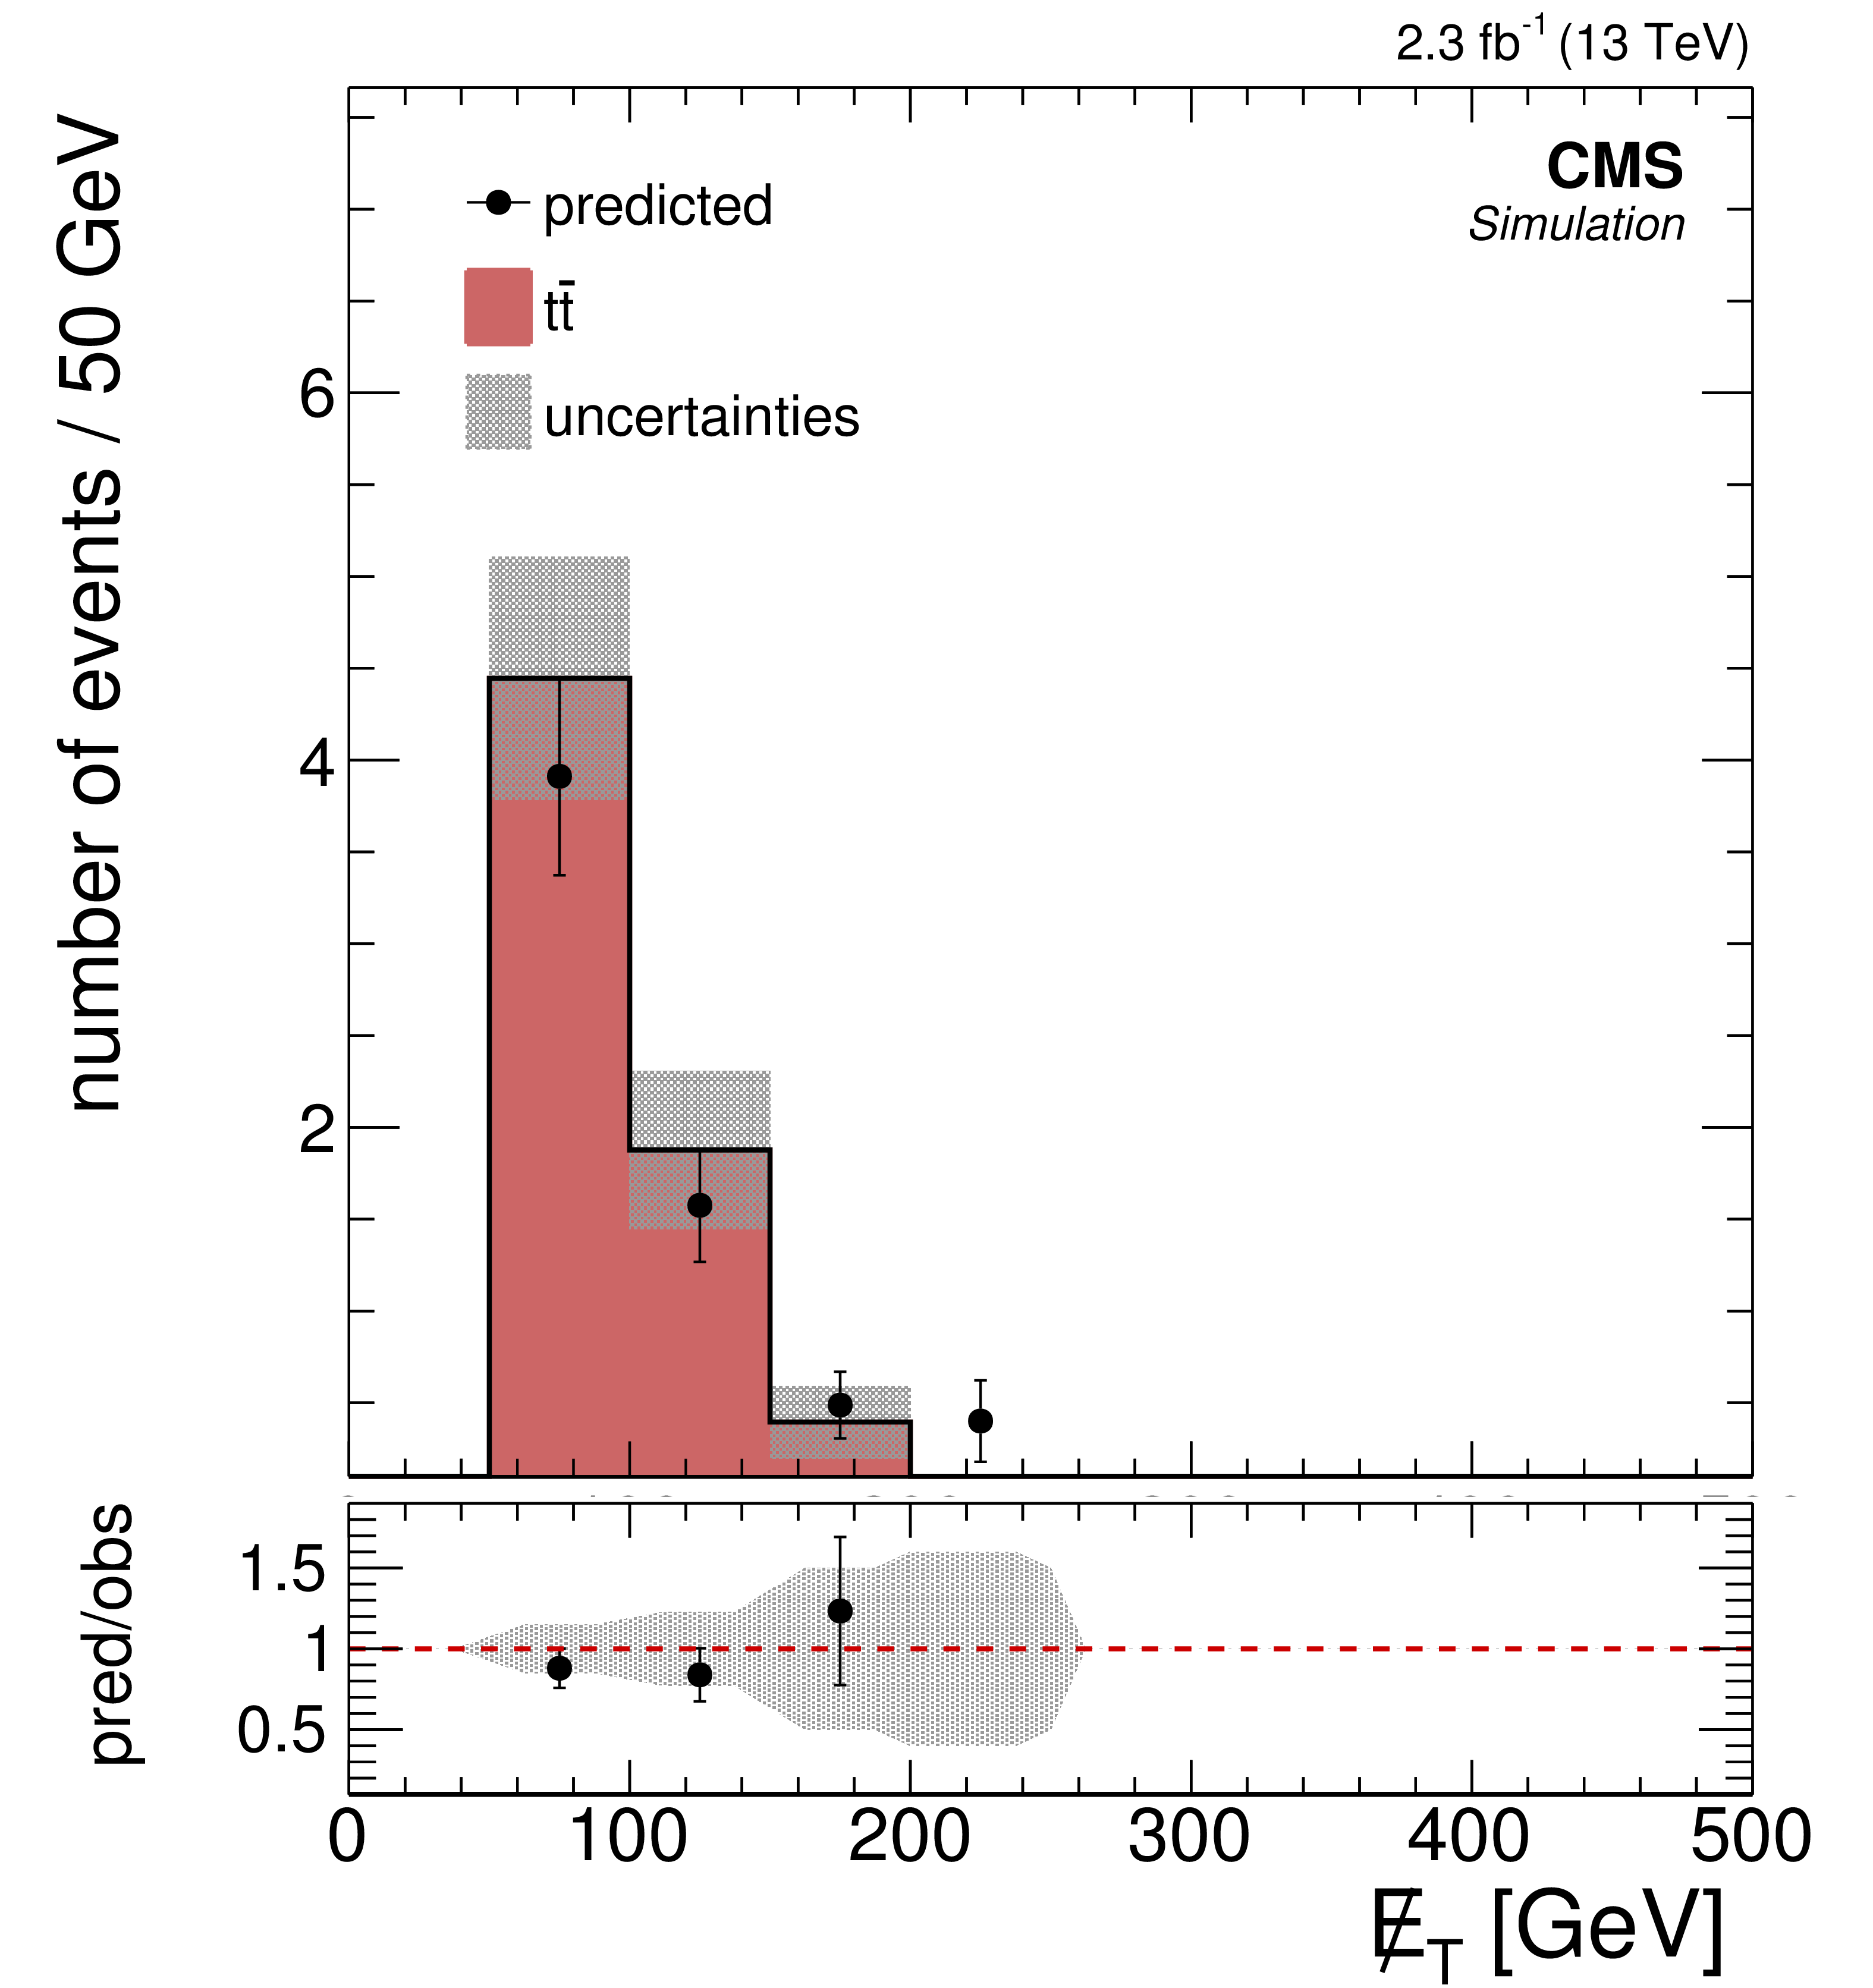
Figure 2-b:
Comparisons of the distributions of (a) $ {H_{\mathrm {T}}} $, (b) $ {E_{\mathrm {T}}^{\text {miss}}} $, (c) $ {N_\text {jets}} $, (d) $ {N_\text {b jets}} $, (e-g) $ {p_{\mathrm {T}}} $ of leptons for the background predictions to those observed in data in the off-Z baseline selection region. The nonprompt lepton backgrounds come from the data-driven technique described in Section 4. The total predicted background and number of events observed in 15 off-Z SRs is shown in (h). |

png pdf |
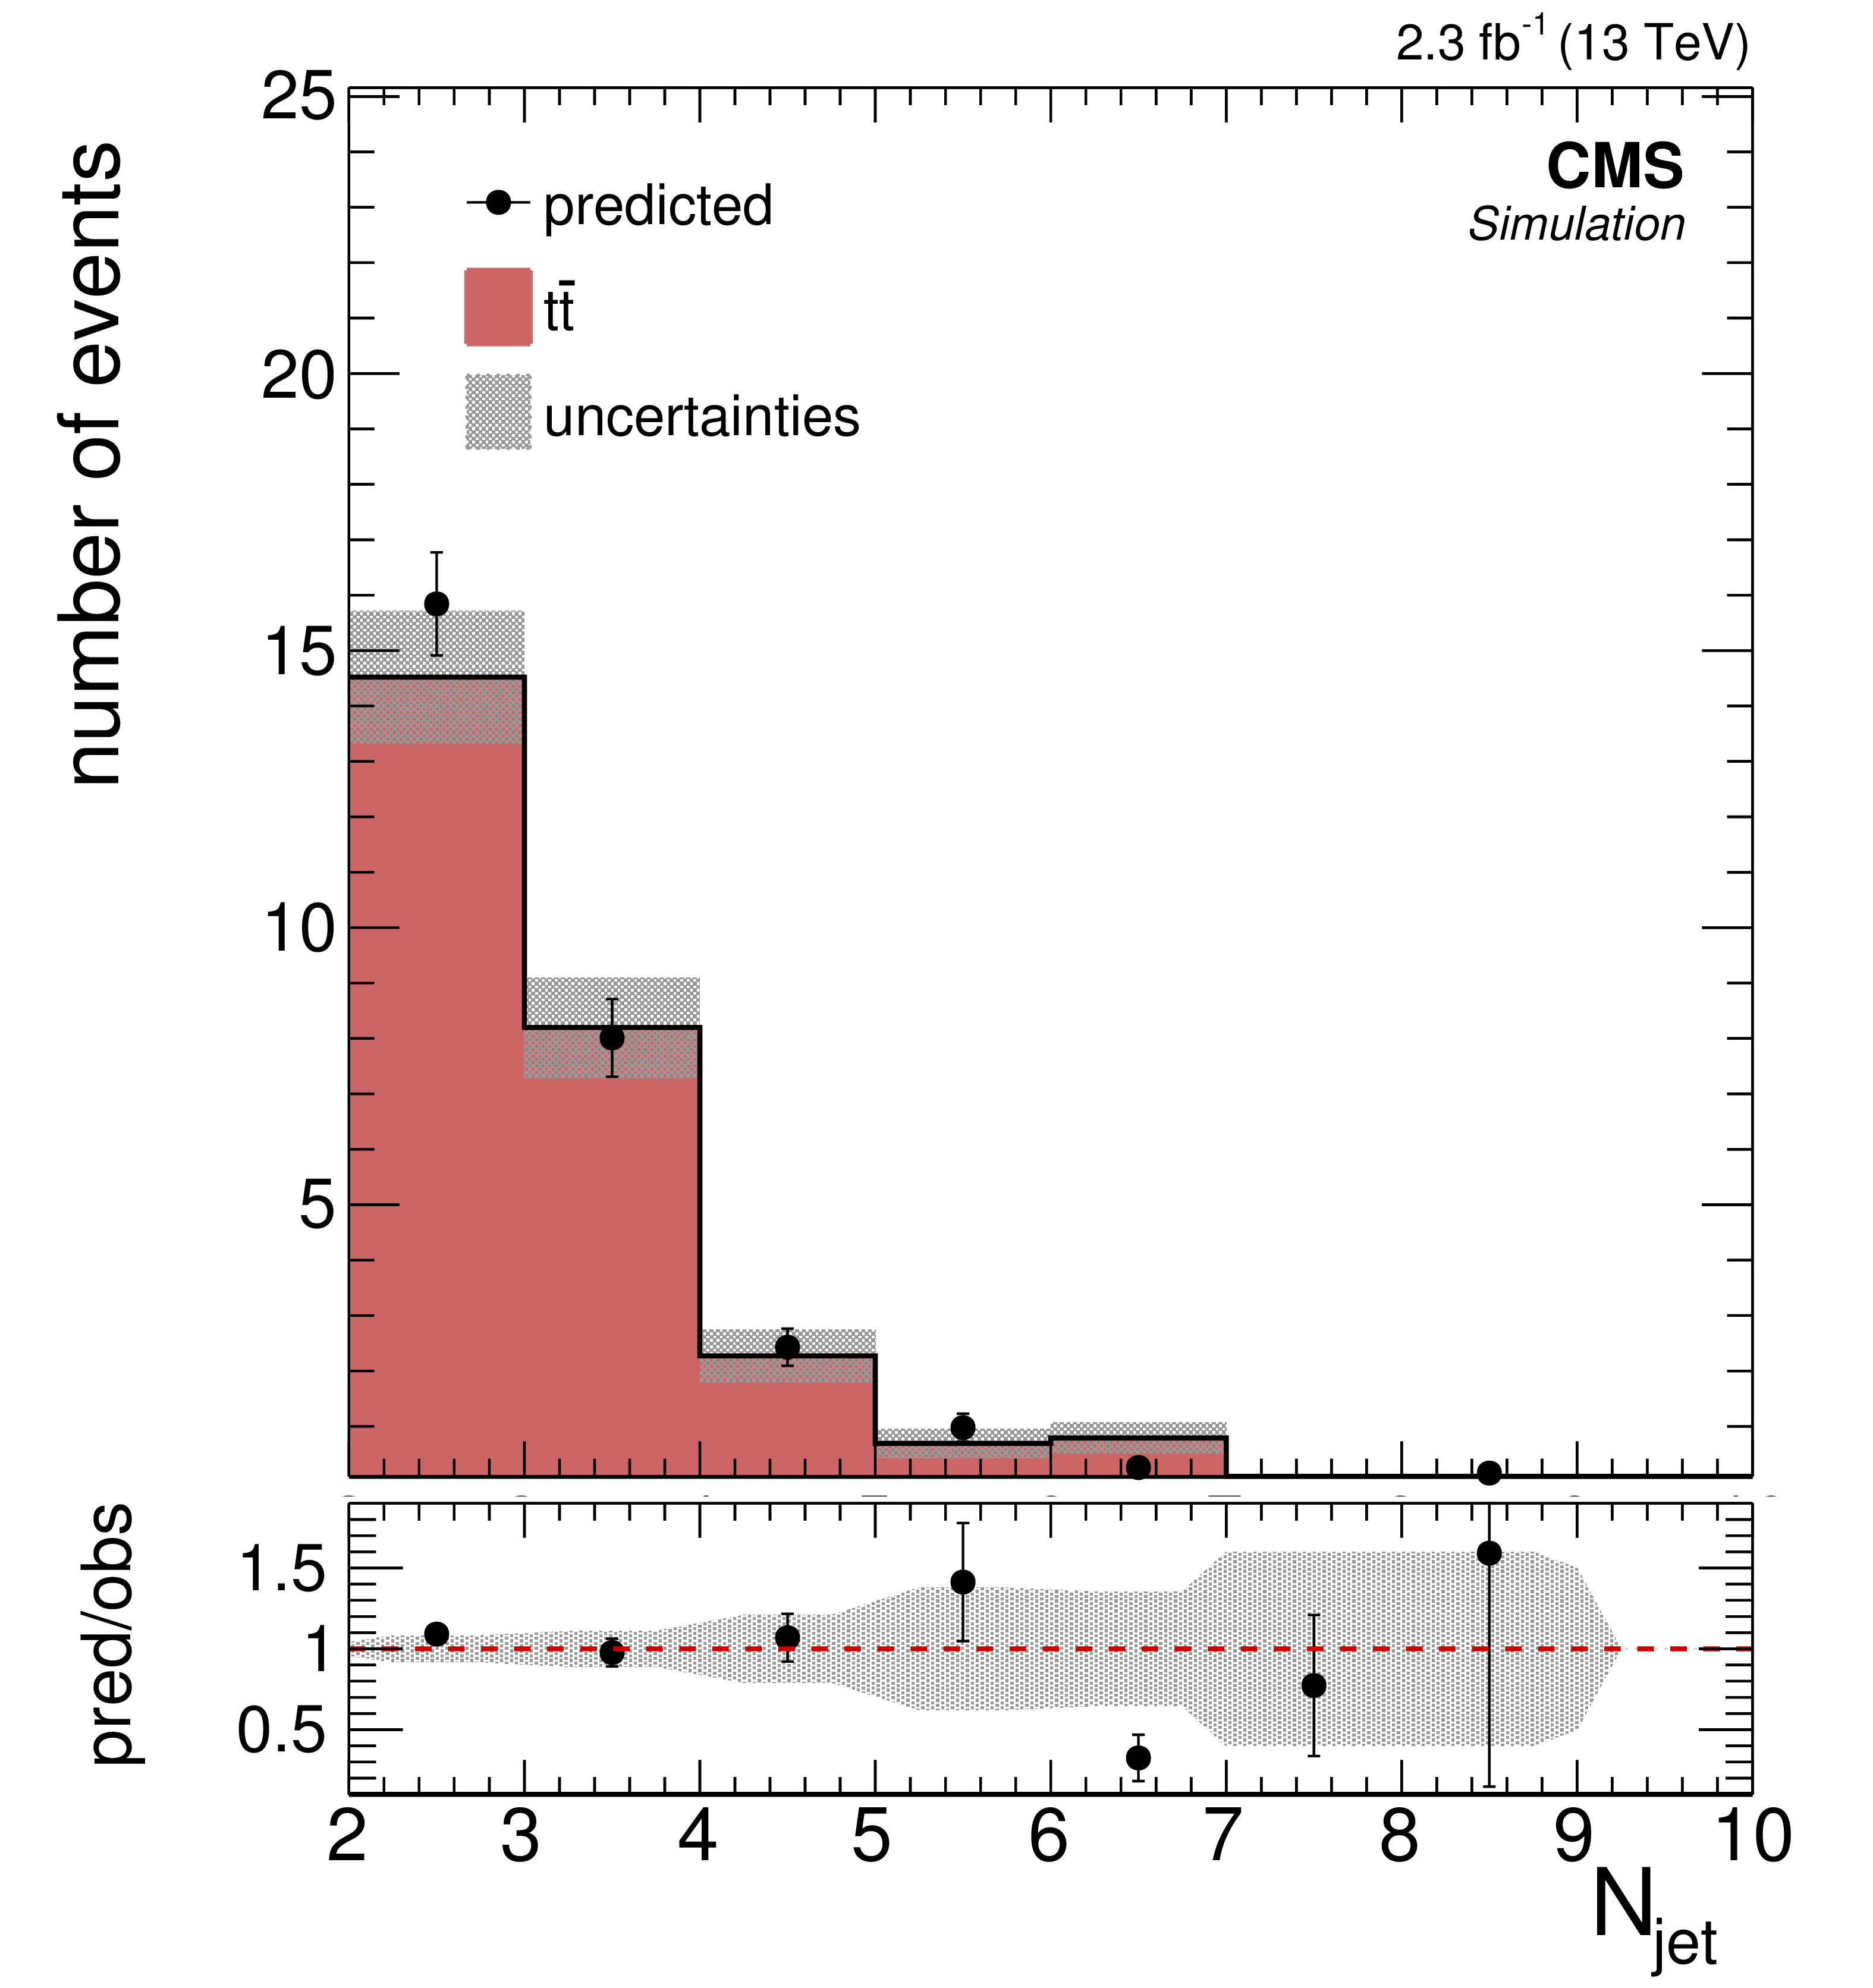
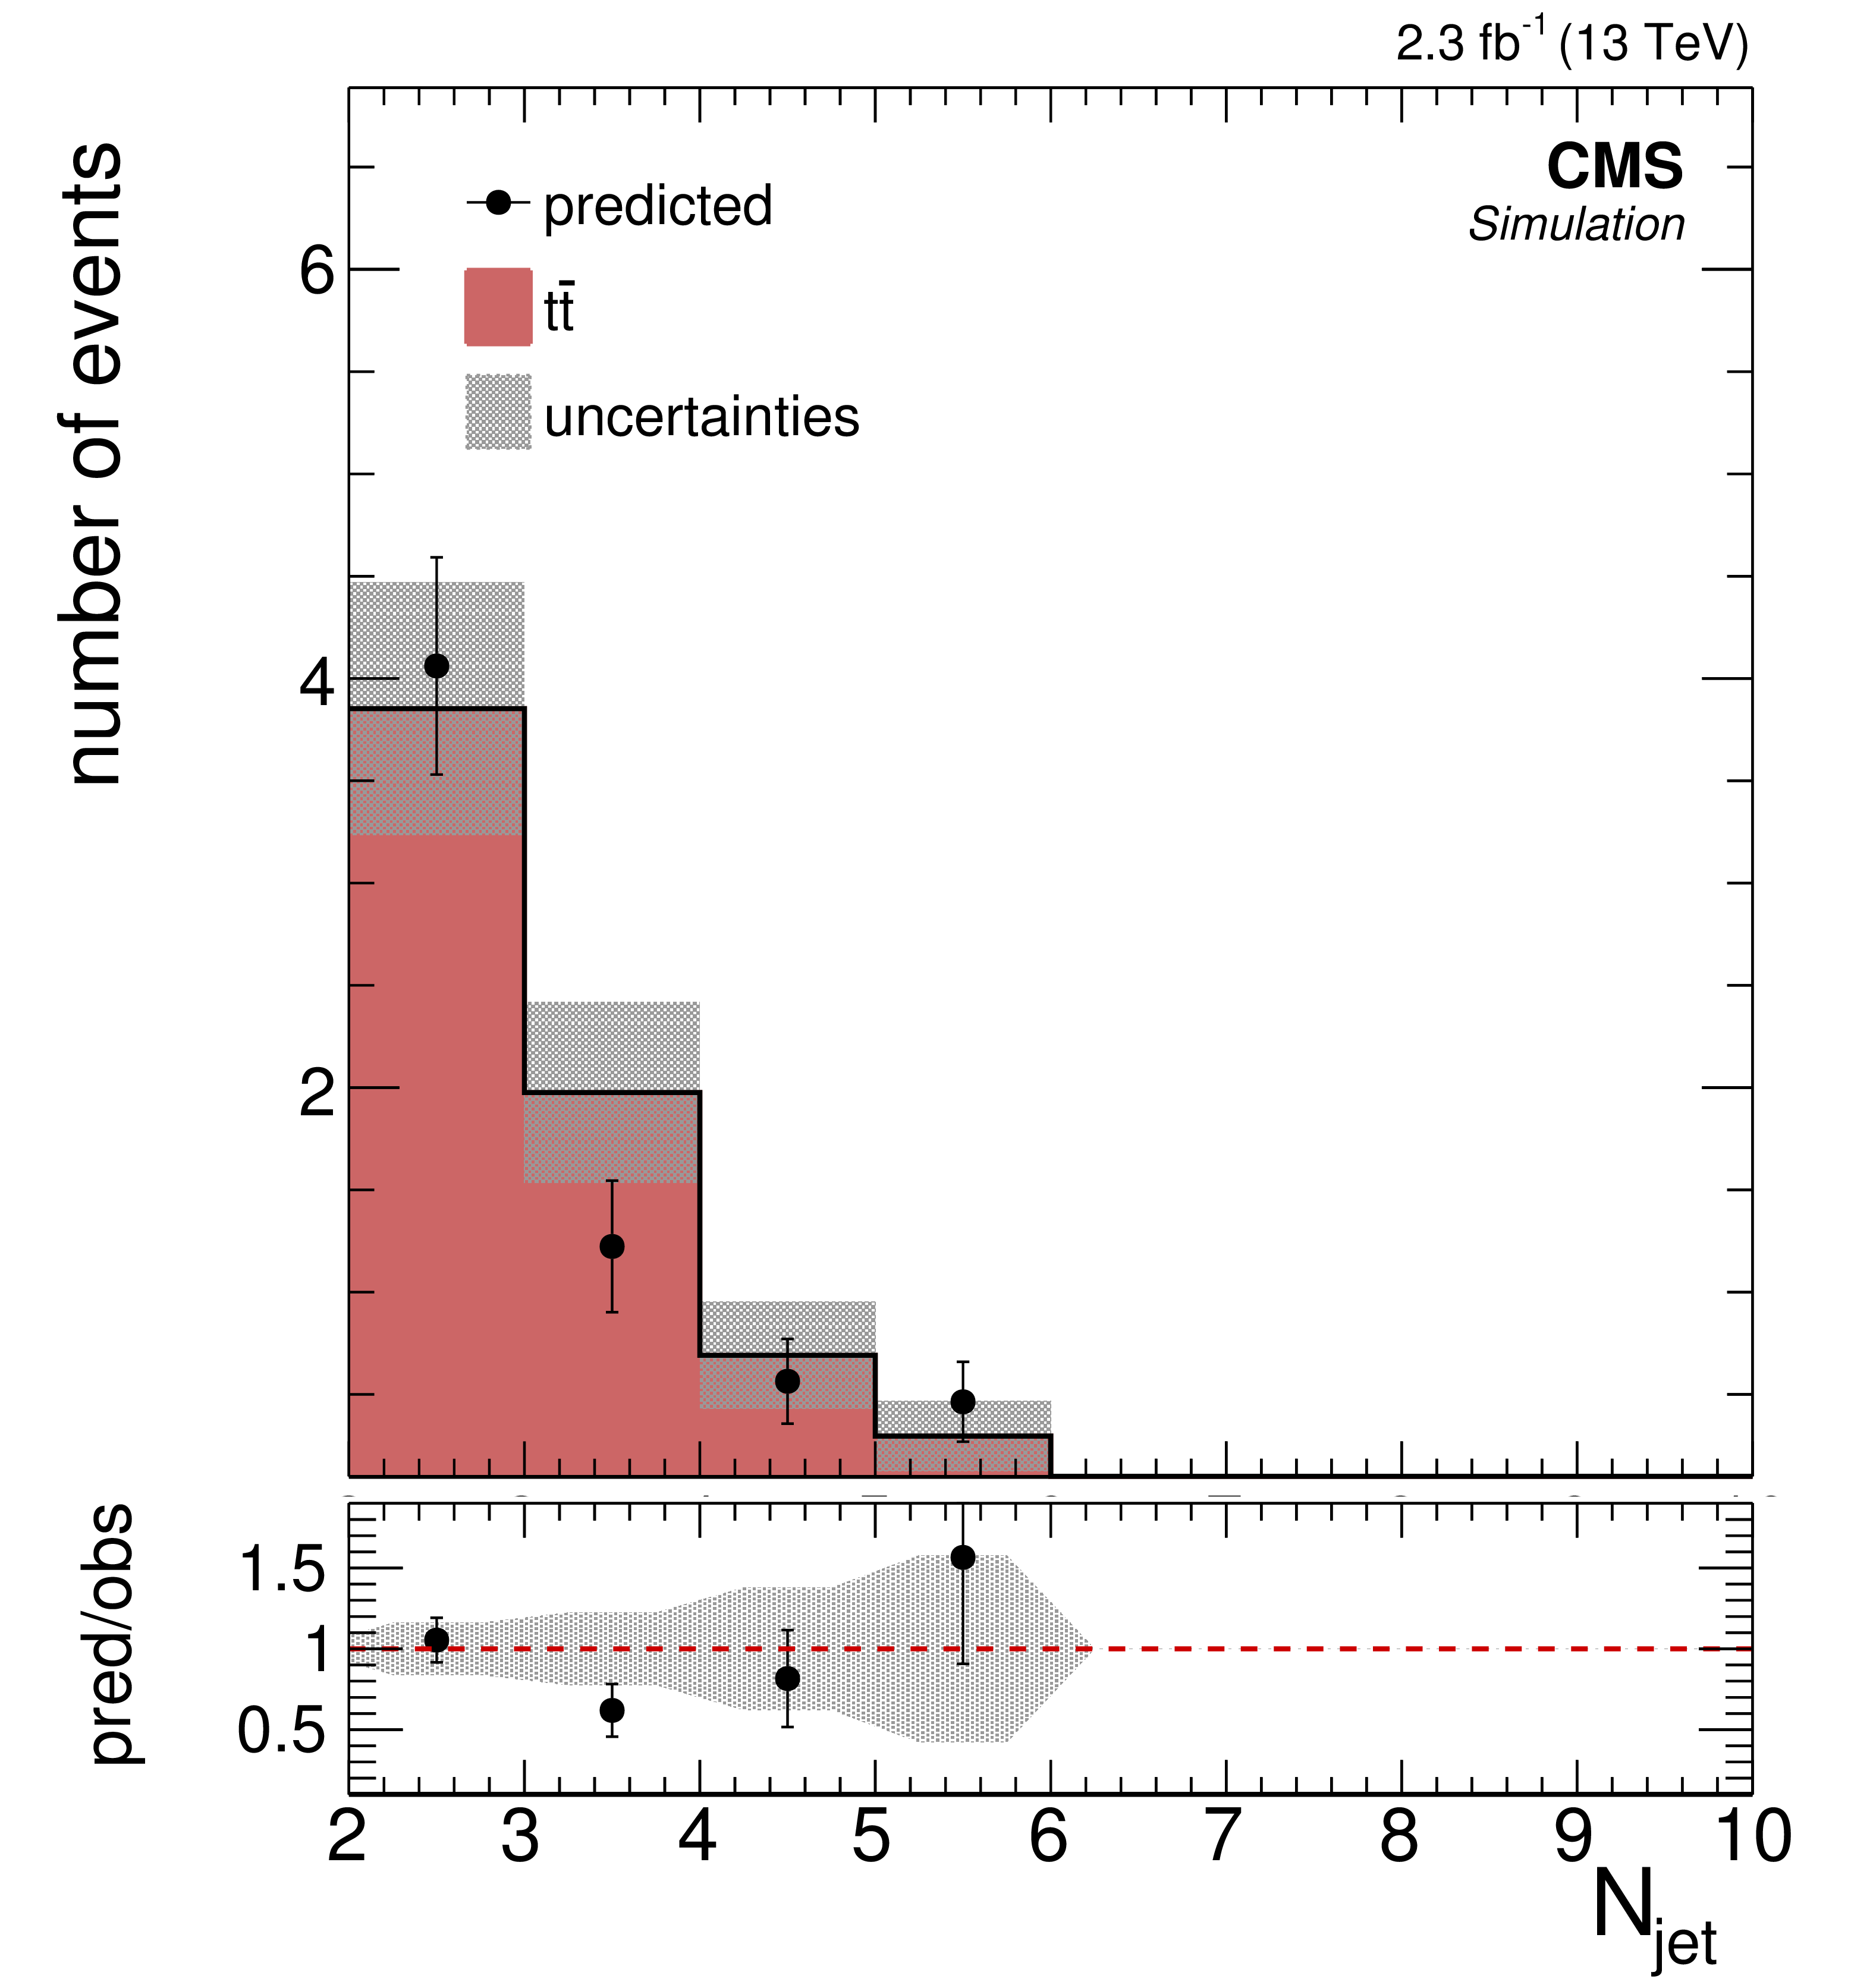
Figure 2-c:
Comparisons of the distributions of (a) $ {H_{\mathrm {T}}} $, (b) $ {E_{\mathrm {T}}^{\text {miss}}} $, (c) $ {N_\text {jets}} $, (d) $ {N_\text {b jets}} $, (e-g) $ {p_{\mathrm {T}}} $ of leptons for the background predictions to those observed in data in the off-Z baseline selection region. The nonprompt lepton backgrounds come from the data-driven technique described in Section 4. The total predicted background and number of events observed in 15 off-Z SRs is shown in (h). |
png pdf |
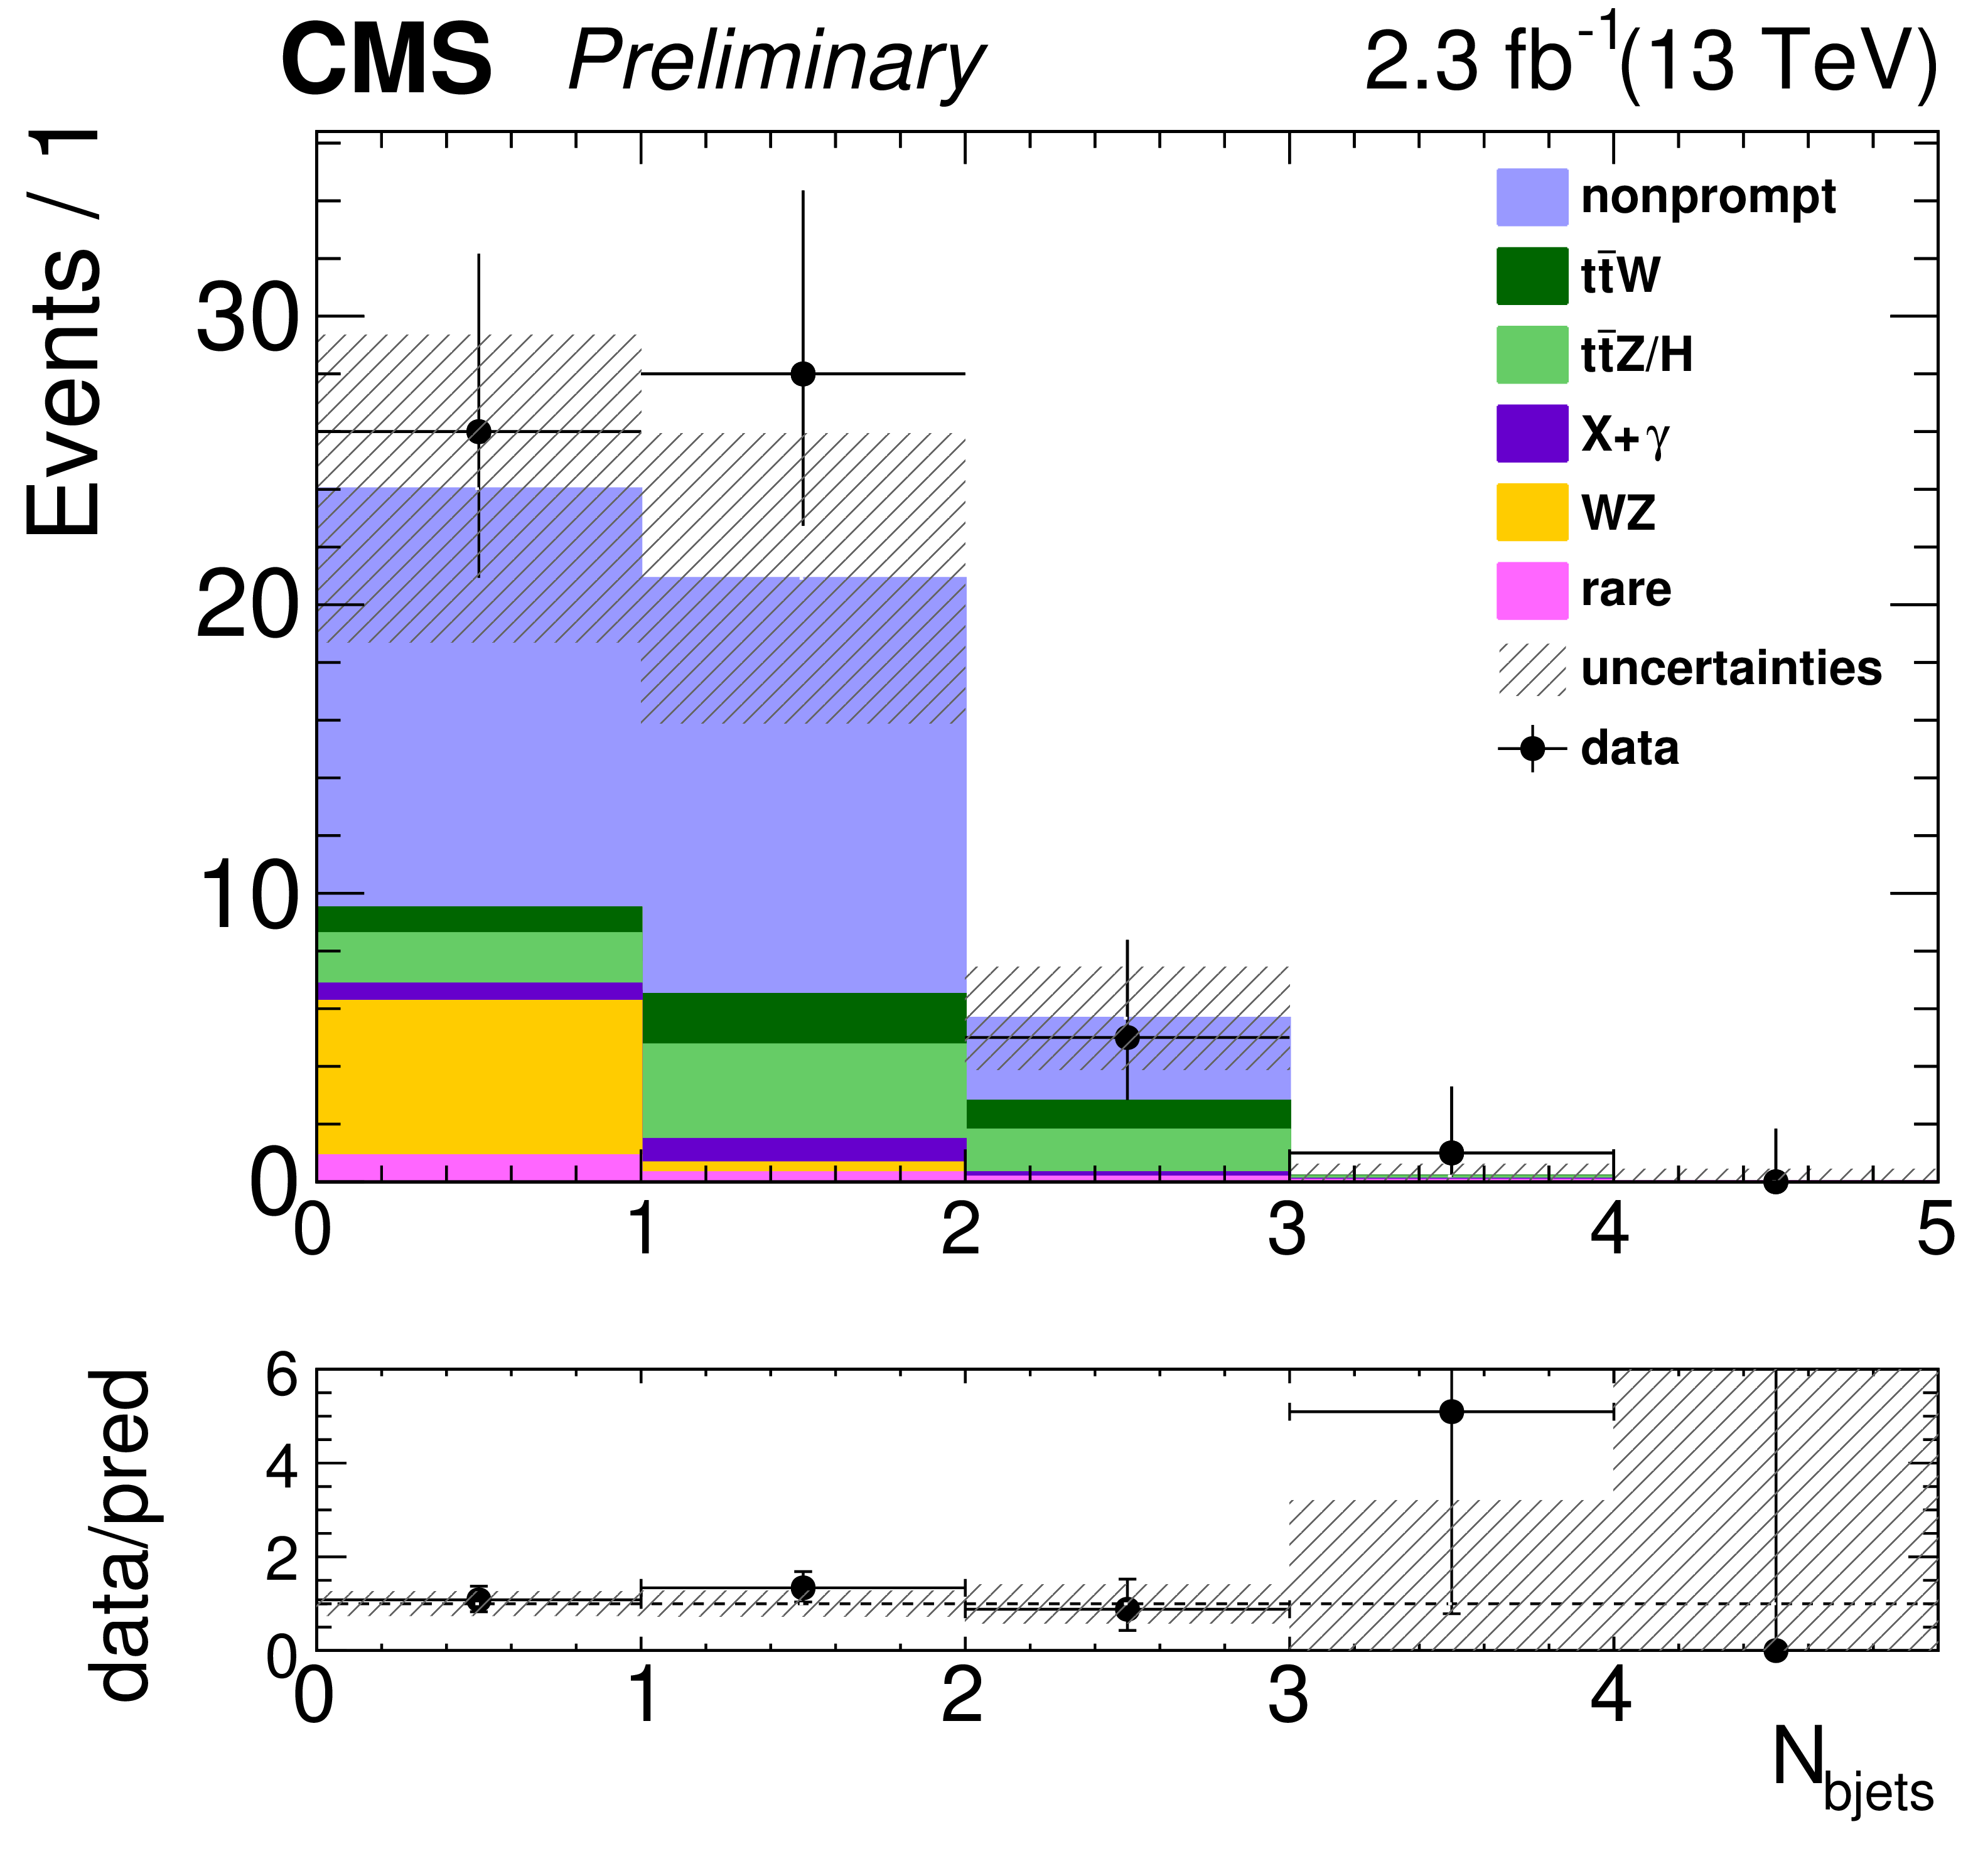
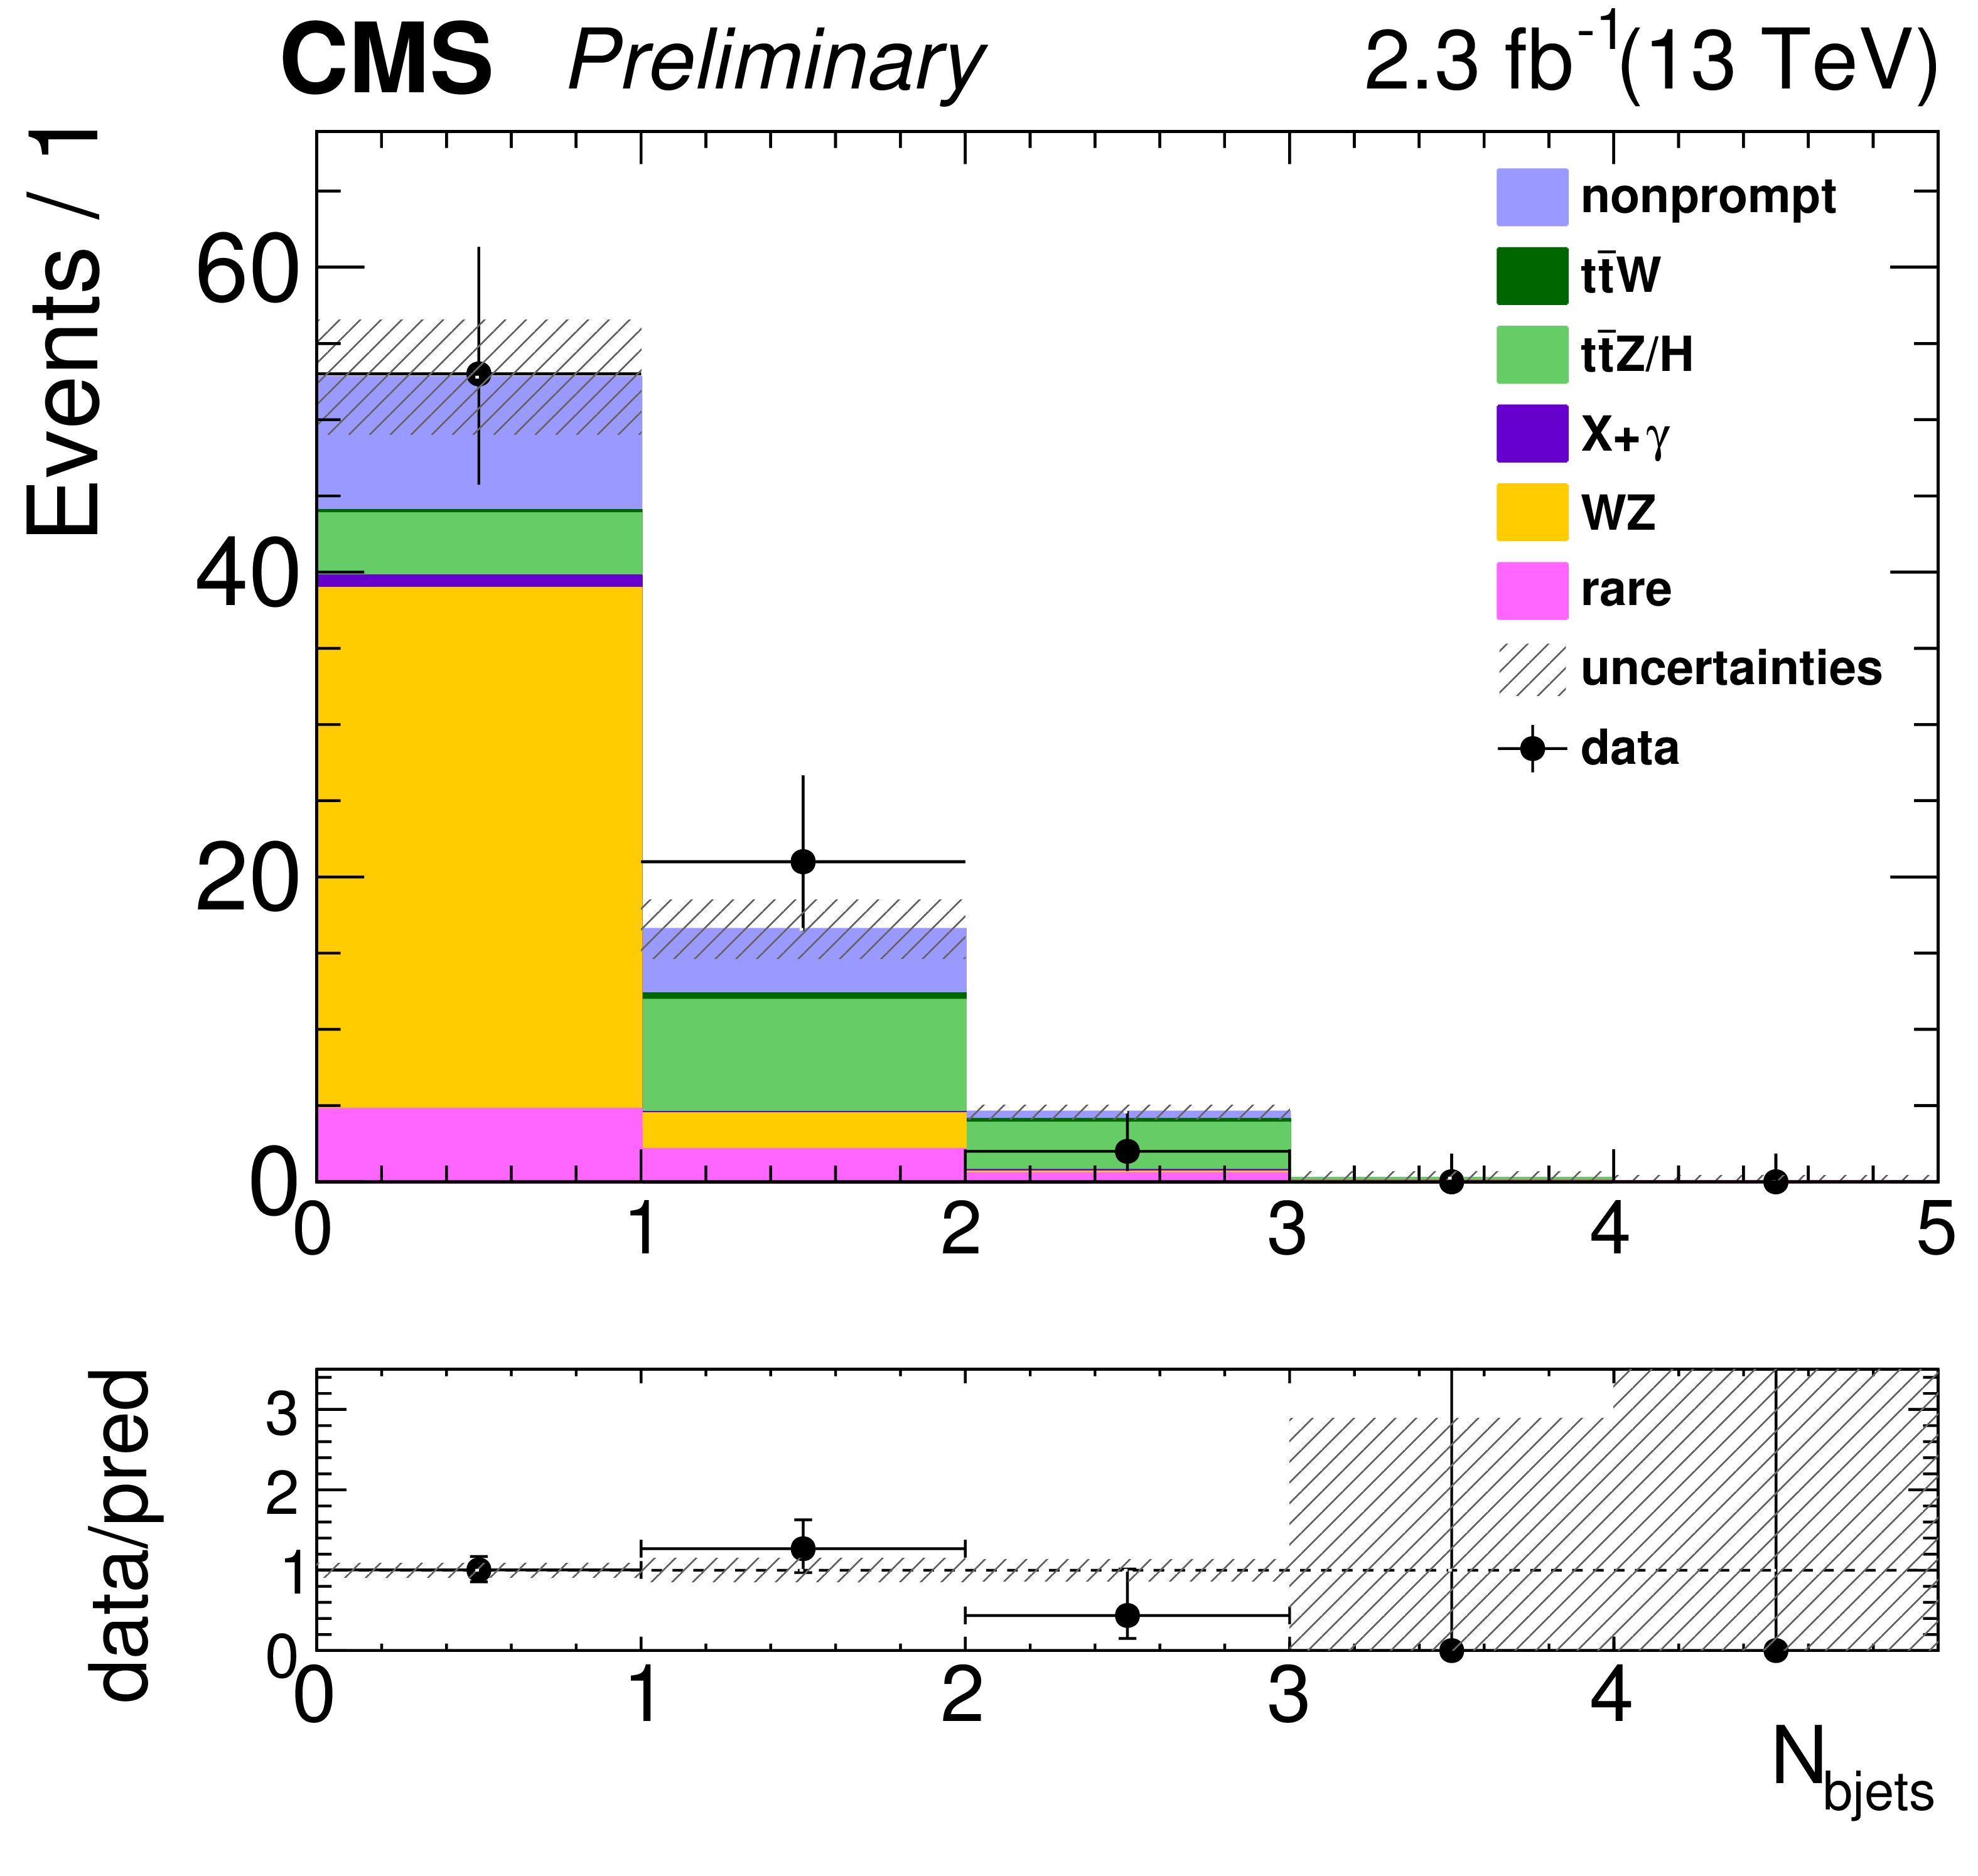
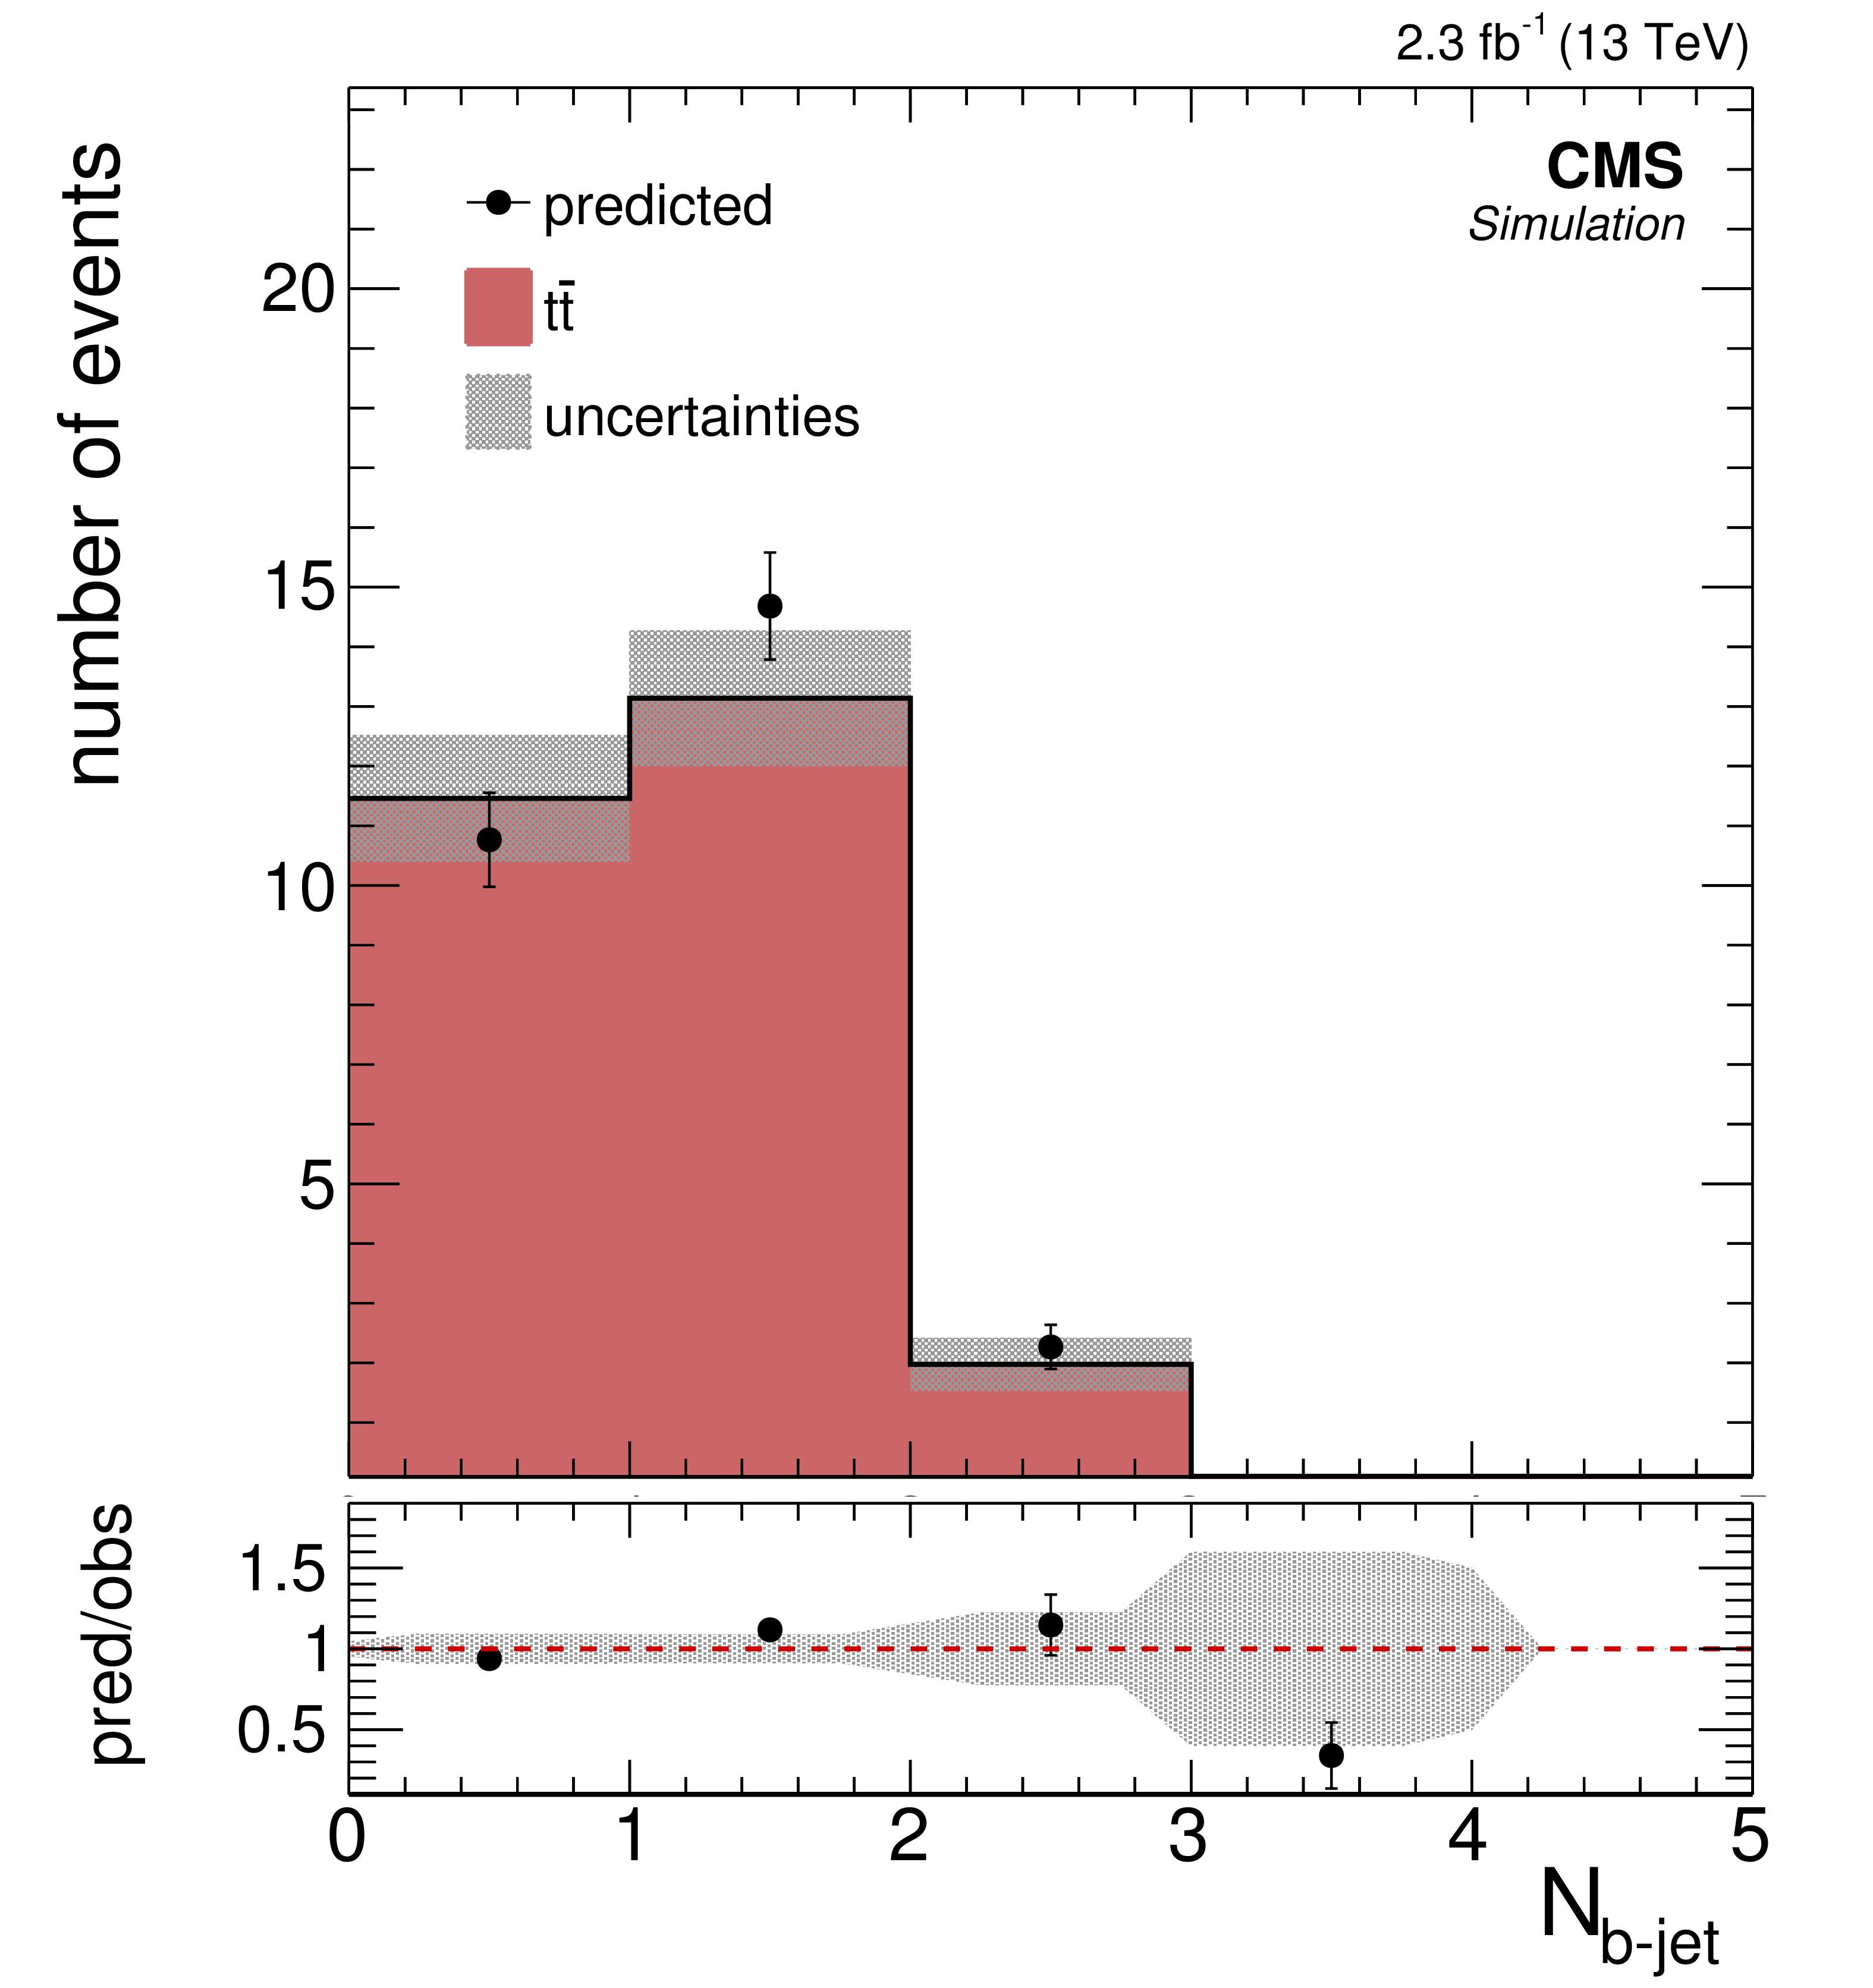
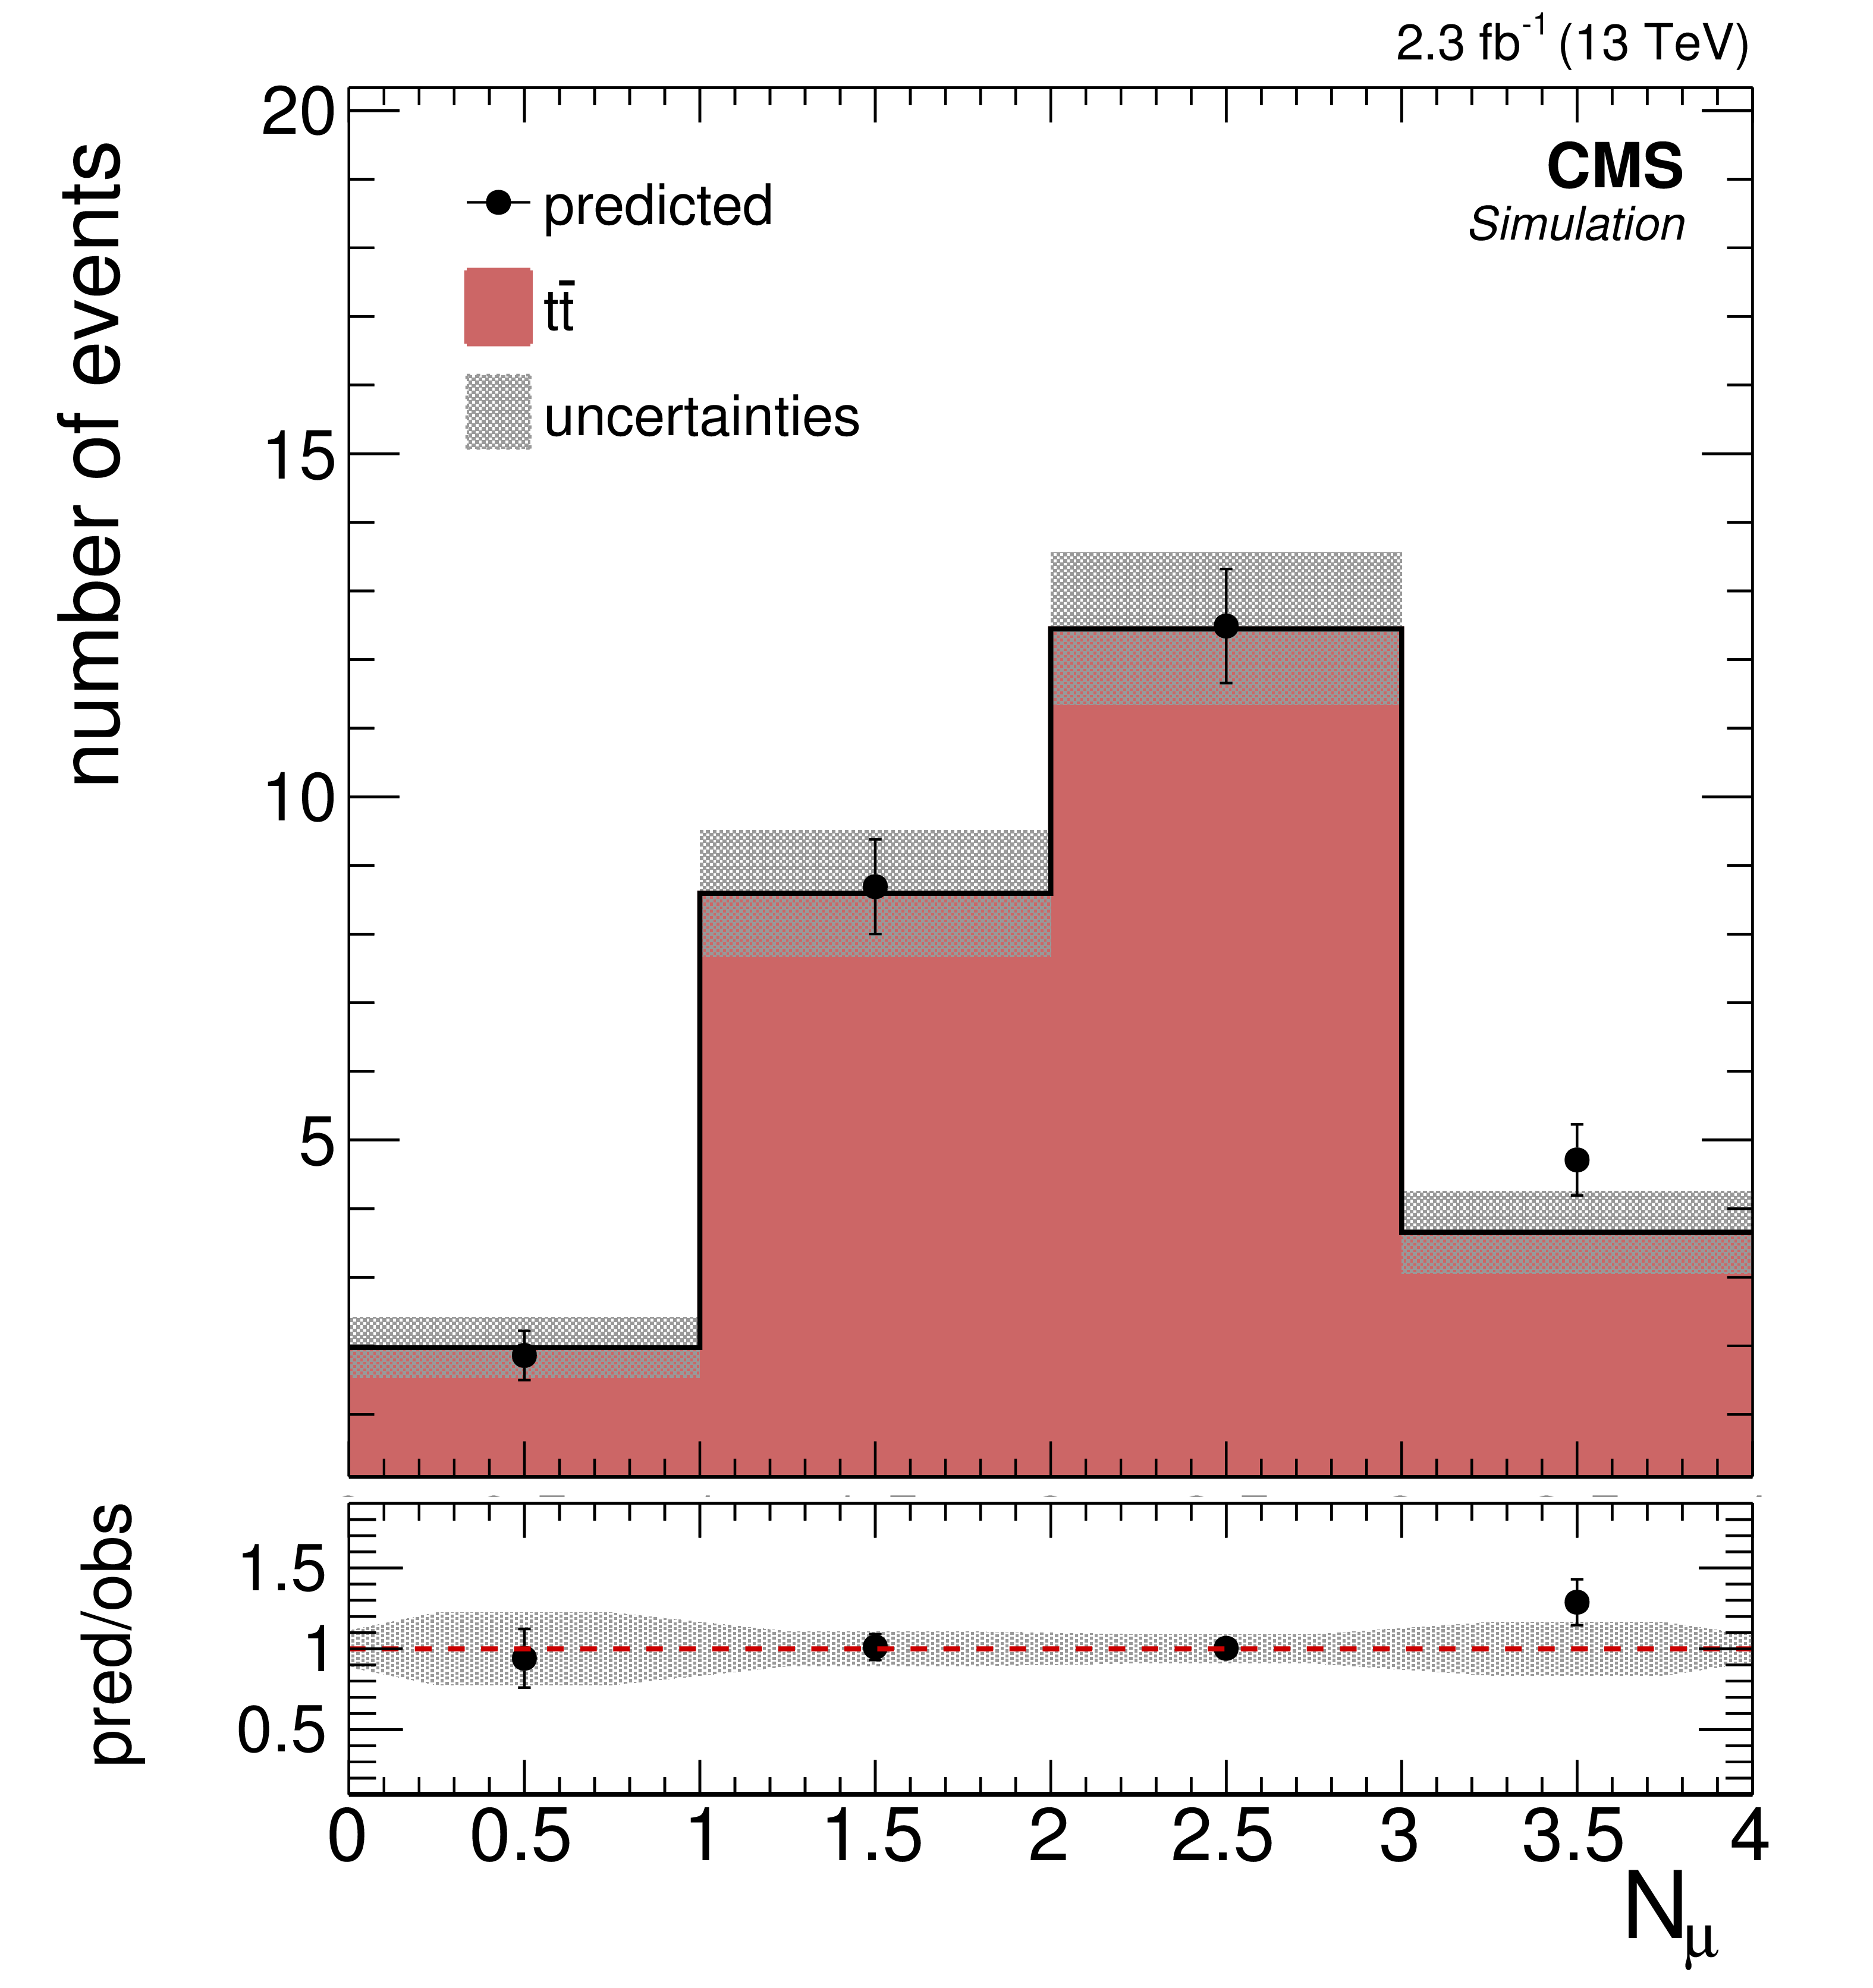
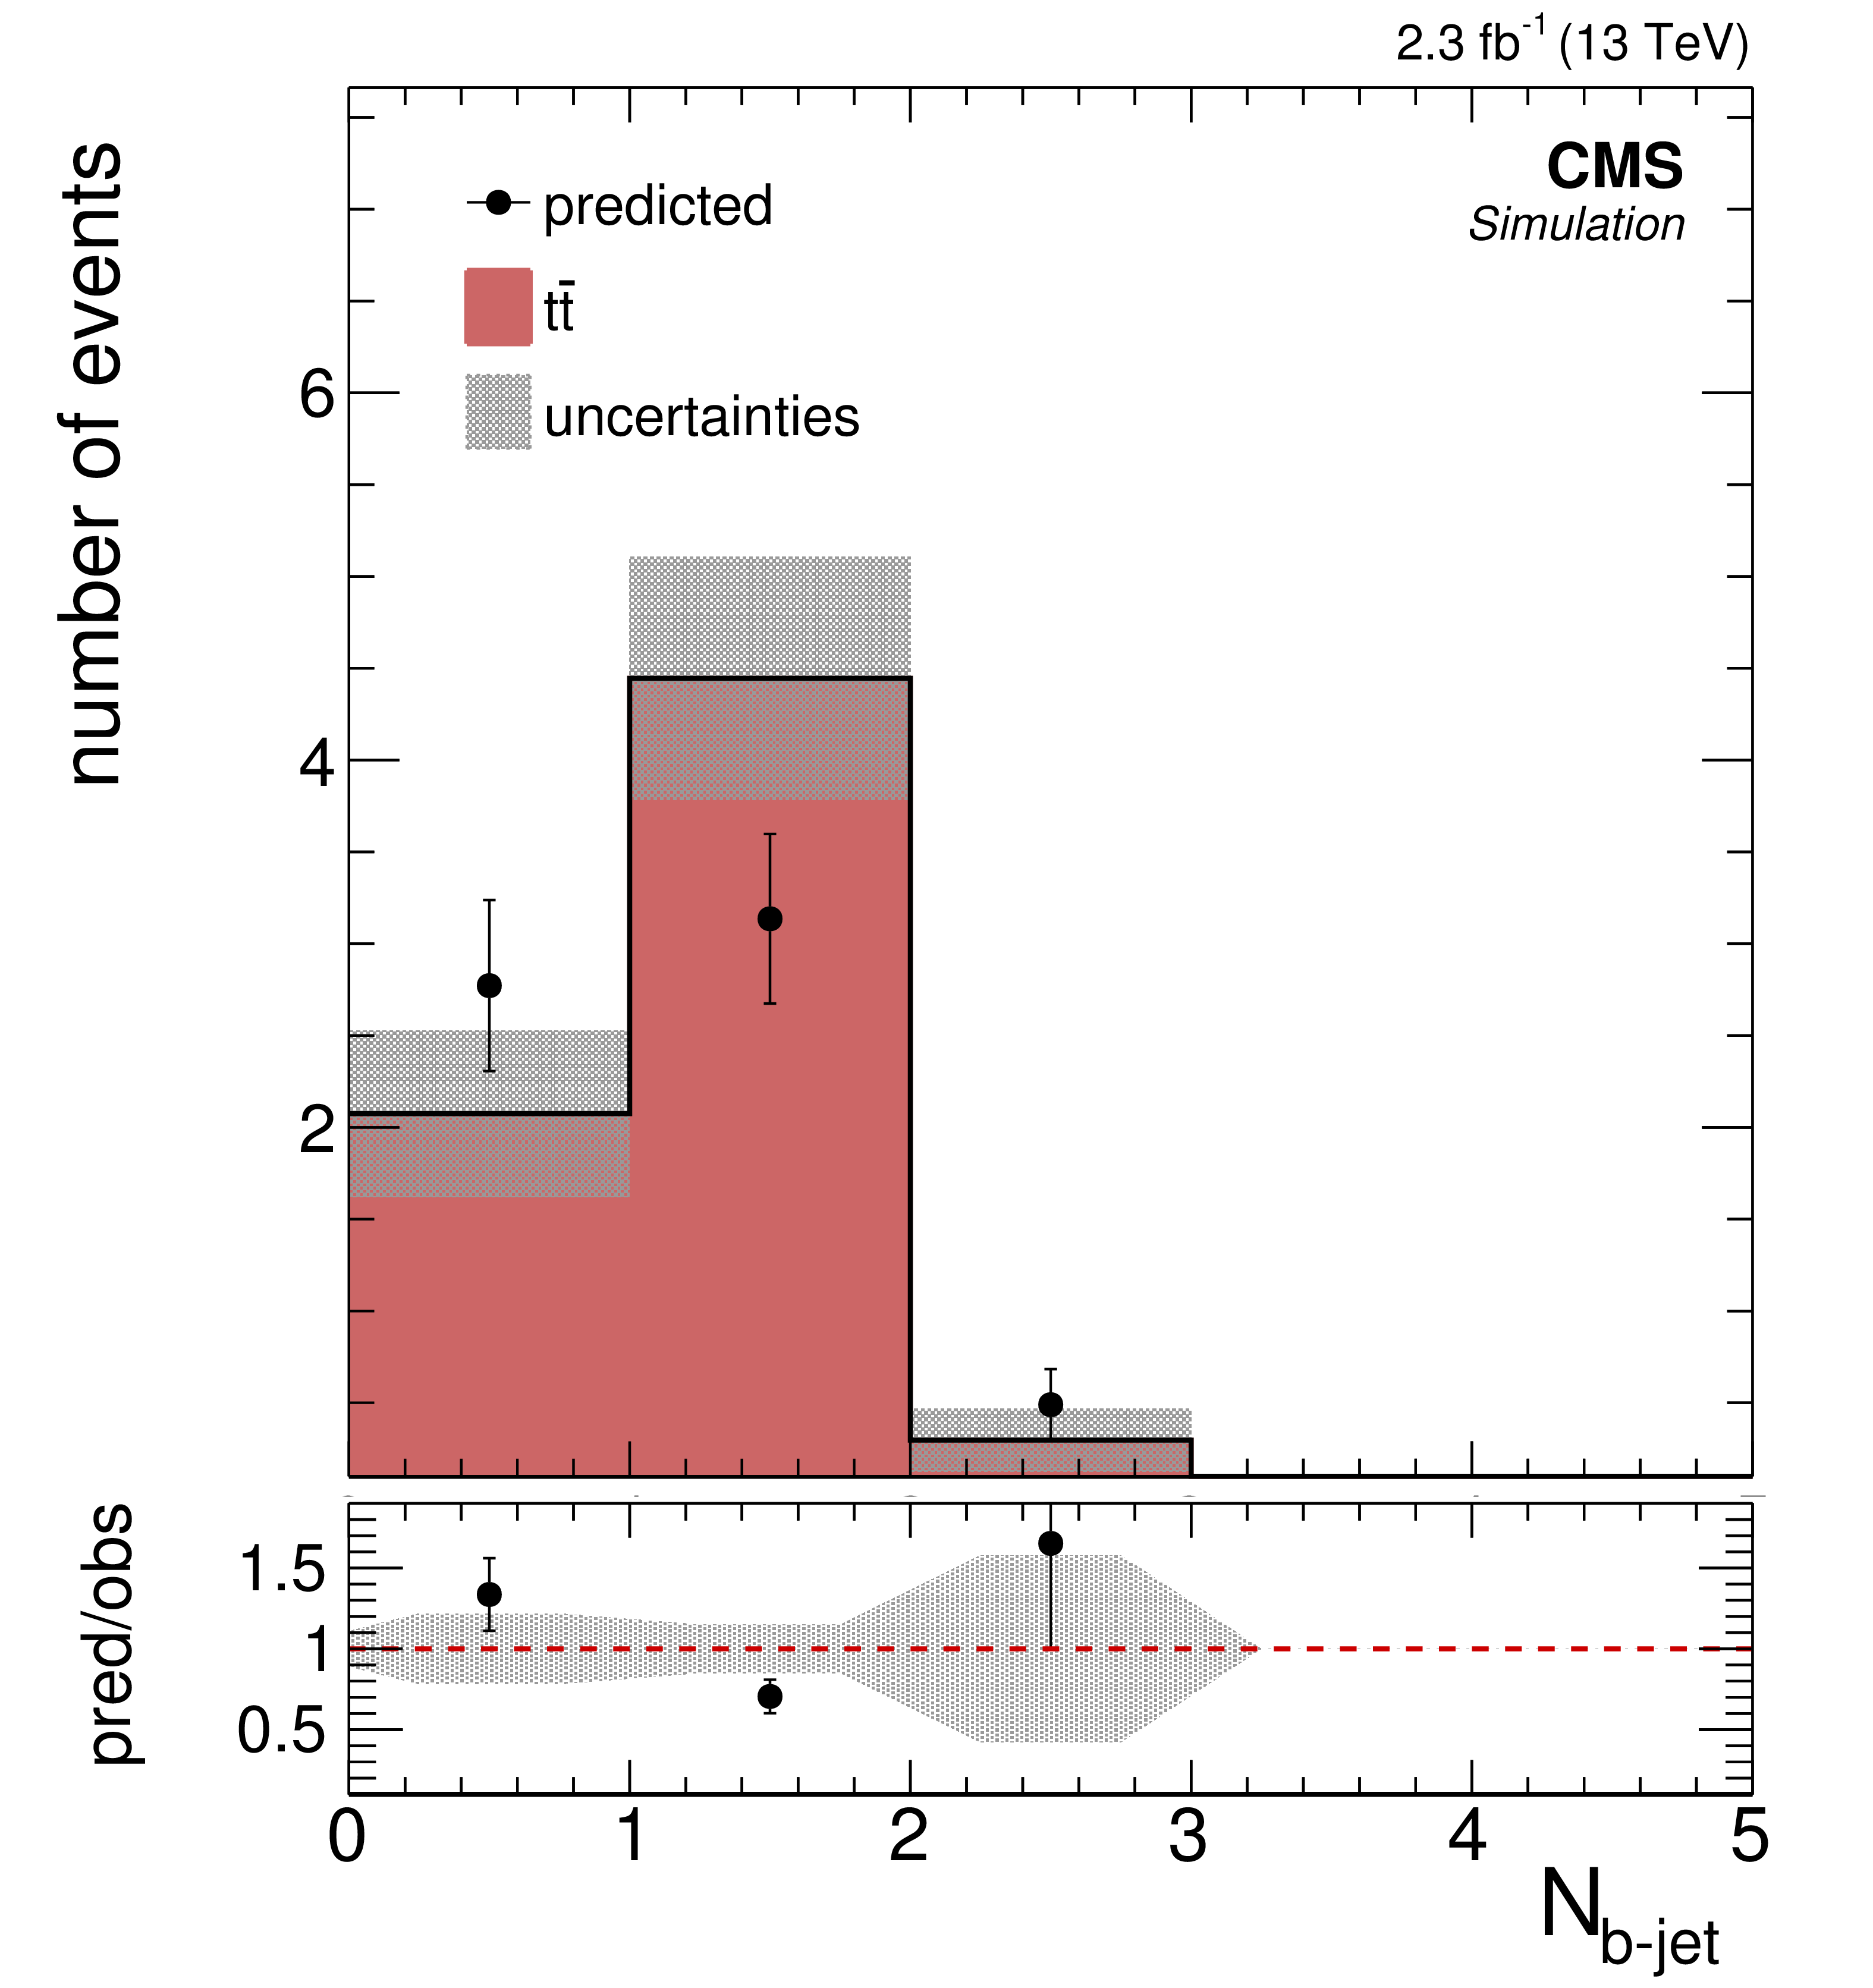
Figure 2-d:
Comparisons of the distributions of (a) $ {H_{\mathrm {T}}} $, (b) $ {E_{\mathrm {T}}^{\text {miss}}} $, (c) $ {N_\text {jets}} $, (d) $ {N_\text {b jets}} $, (e-g) $ {p_{\mathrm {T}}} $ of leptons for the background predictions to those observed in data in the off-Z baseline selection region. The nonprompt lepton backgrounds come from the data-driven technique described in Section 4. The total predicted background and number of events observed in 15 off-Z SRs is shown in (h). |
png pdf |
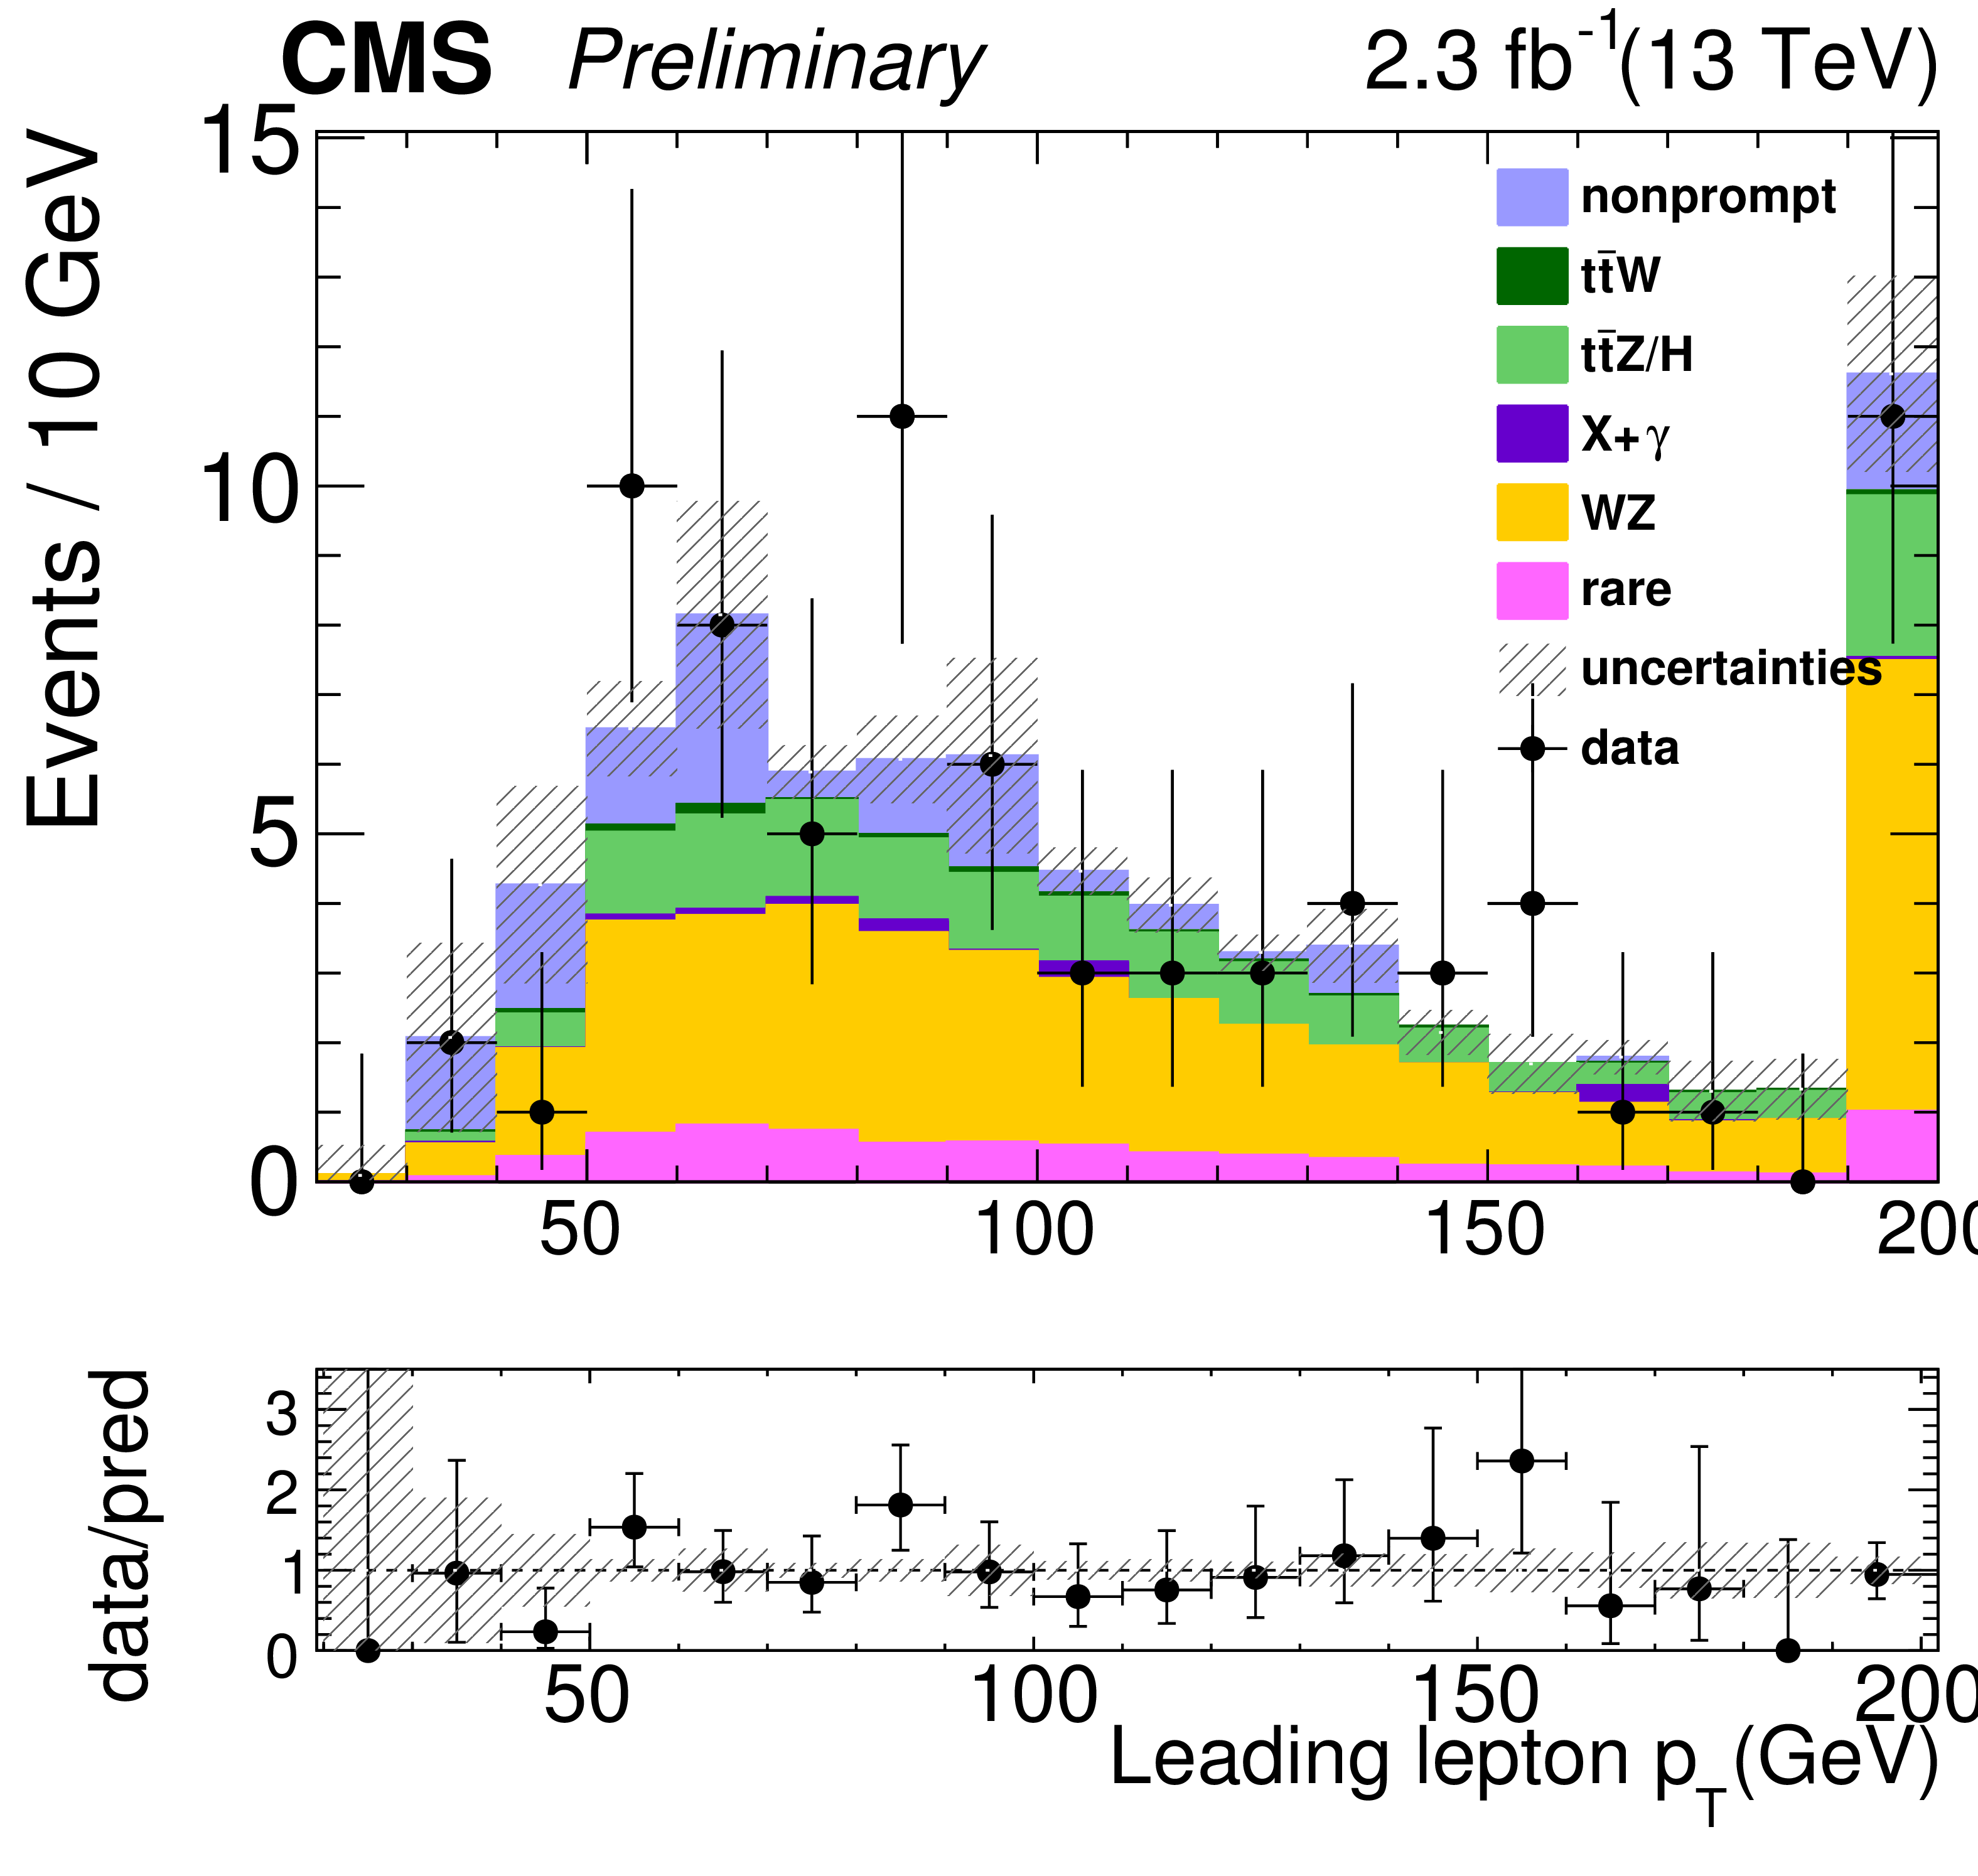
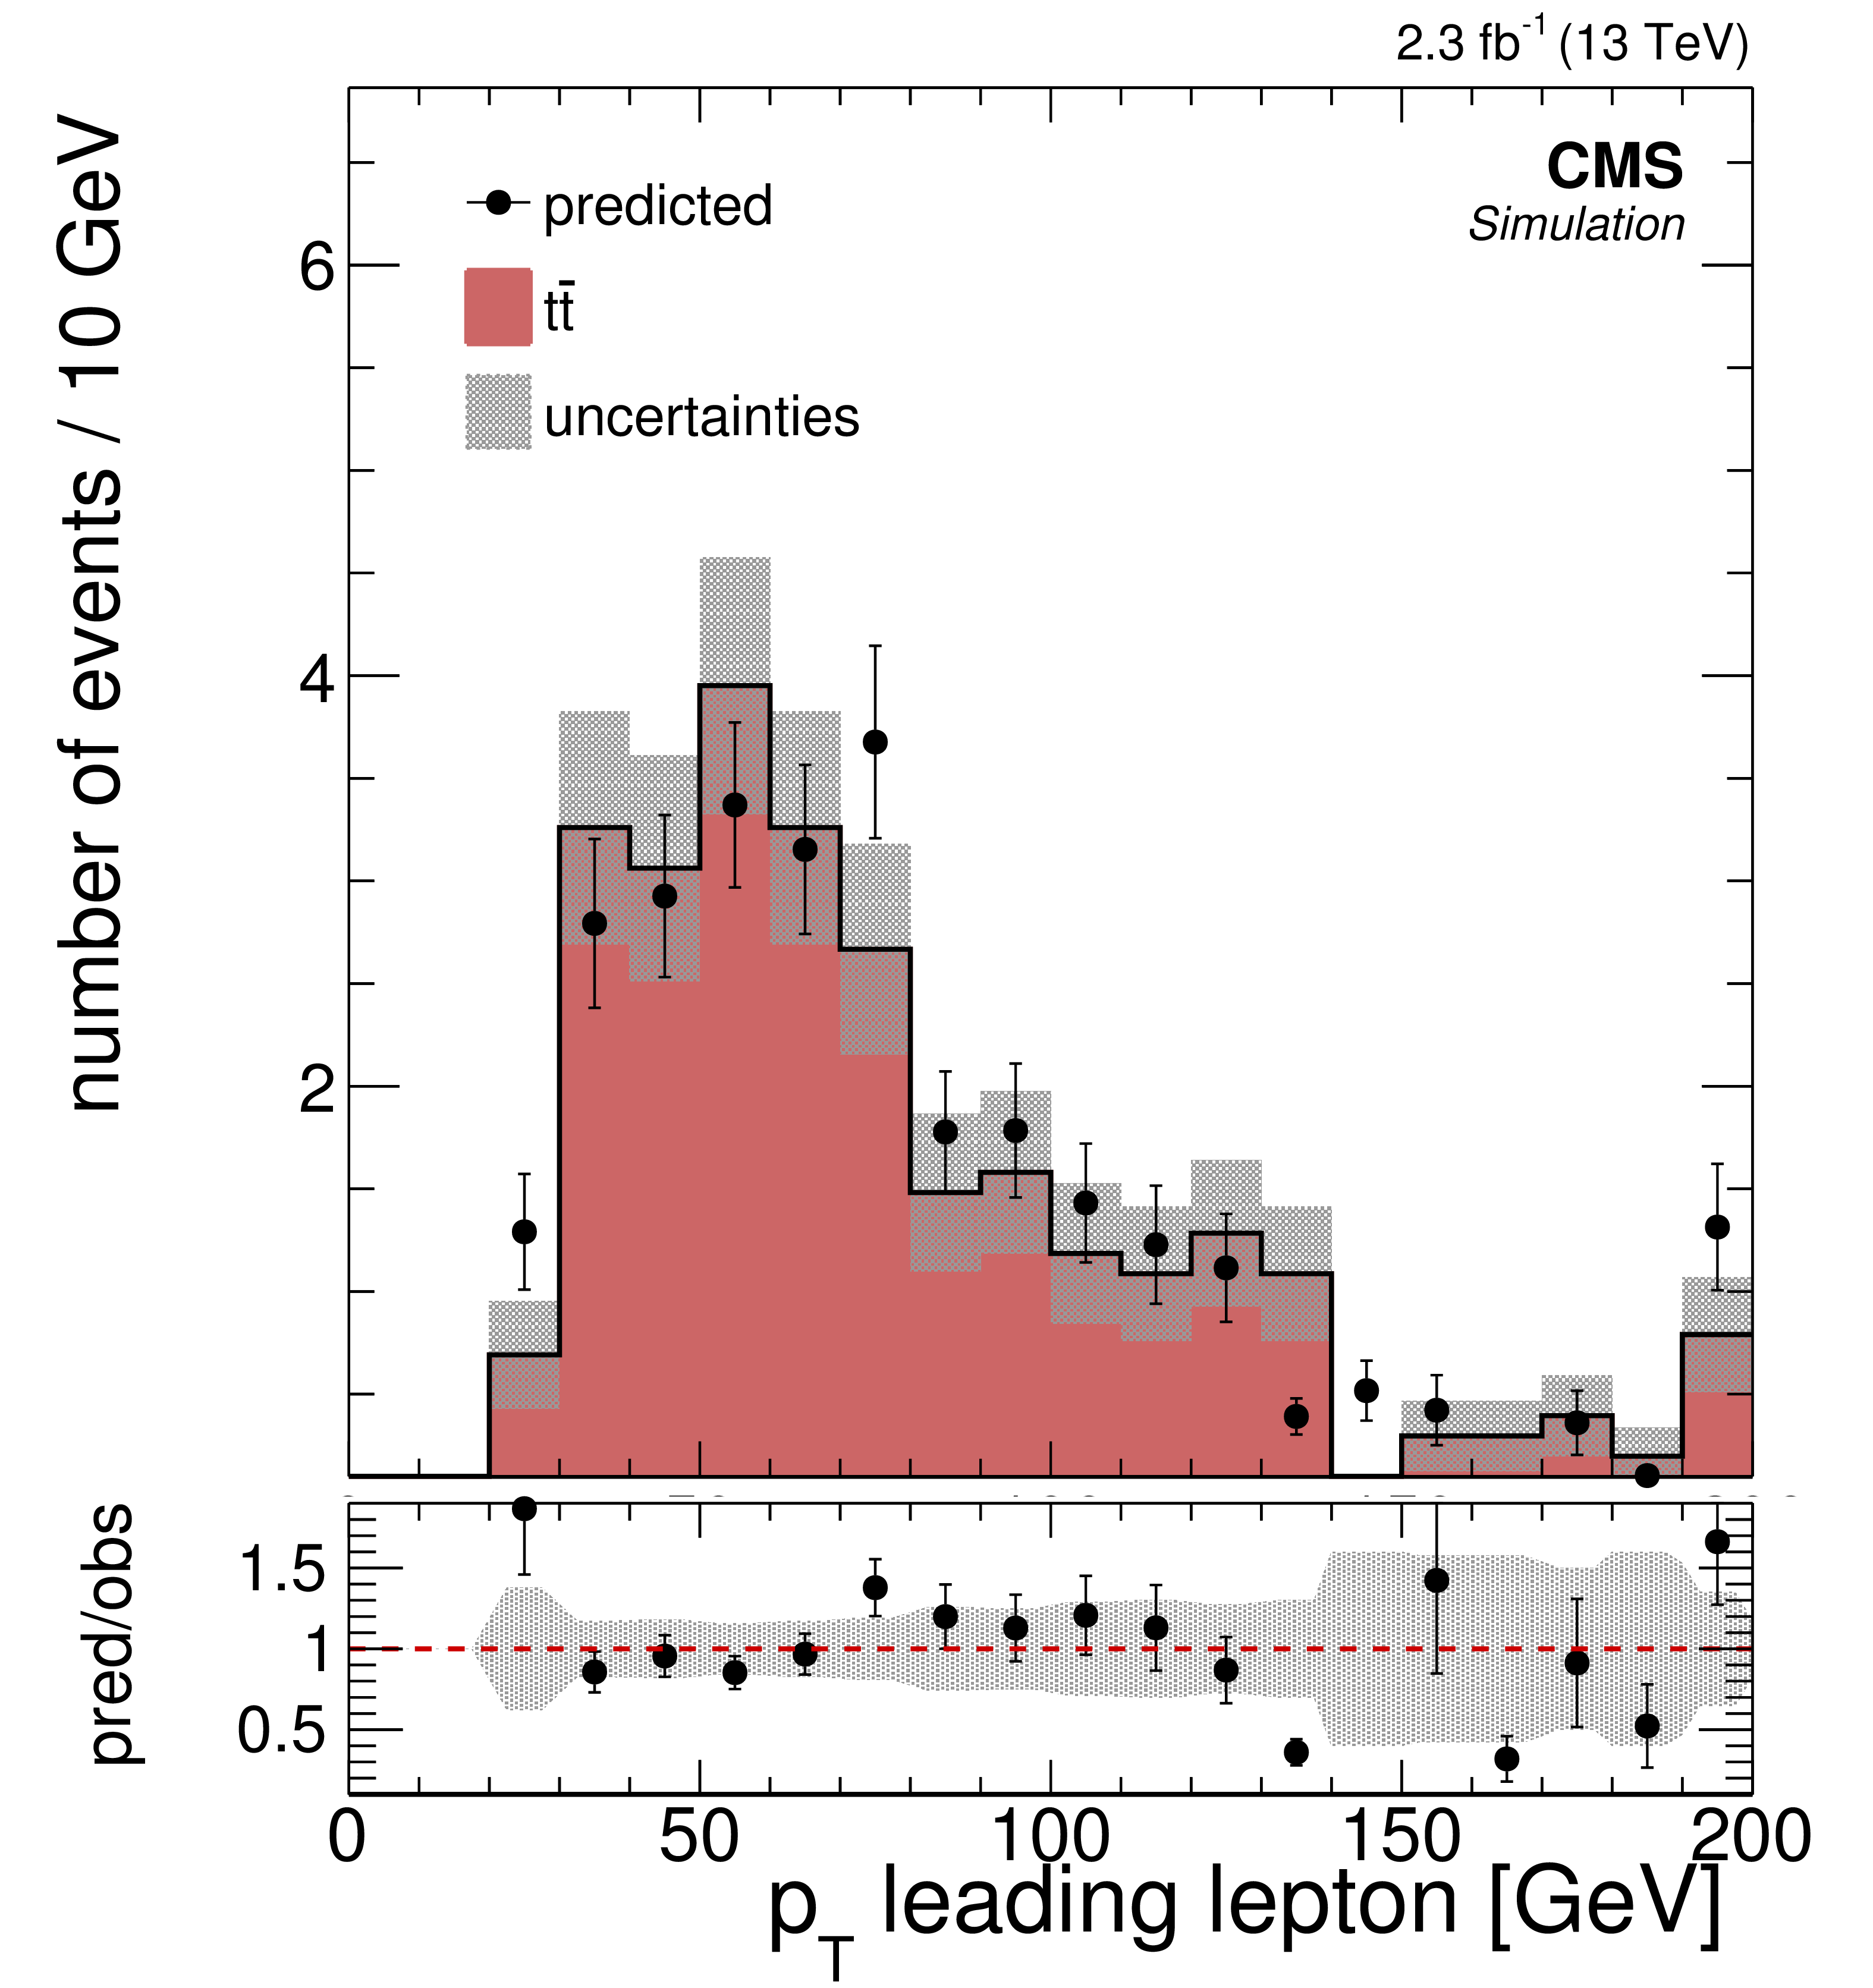
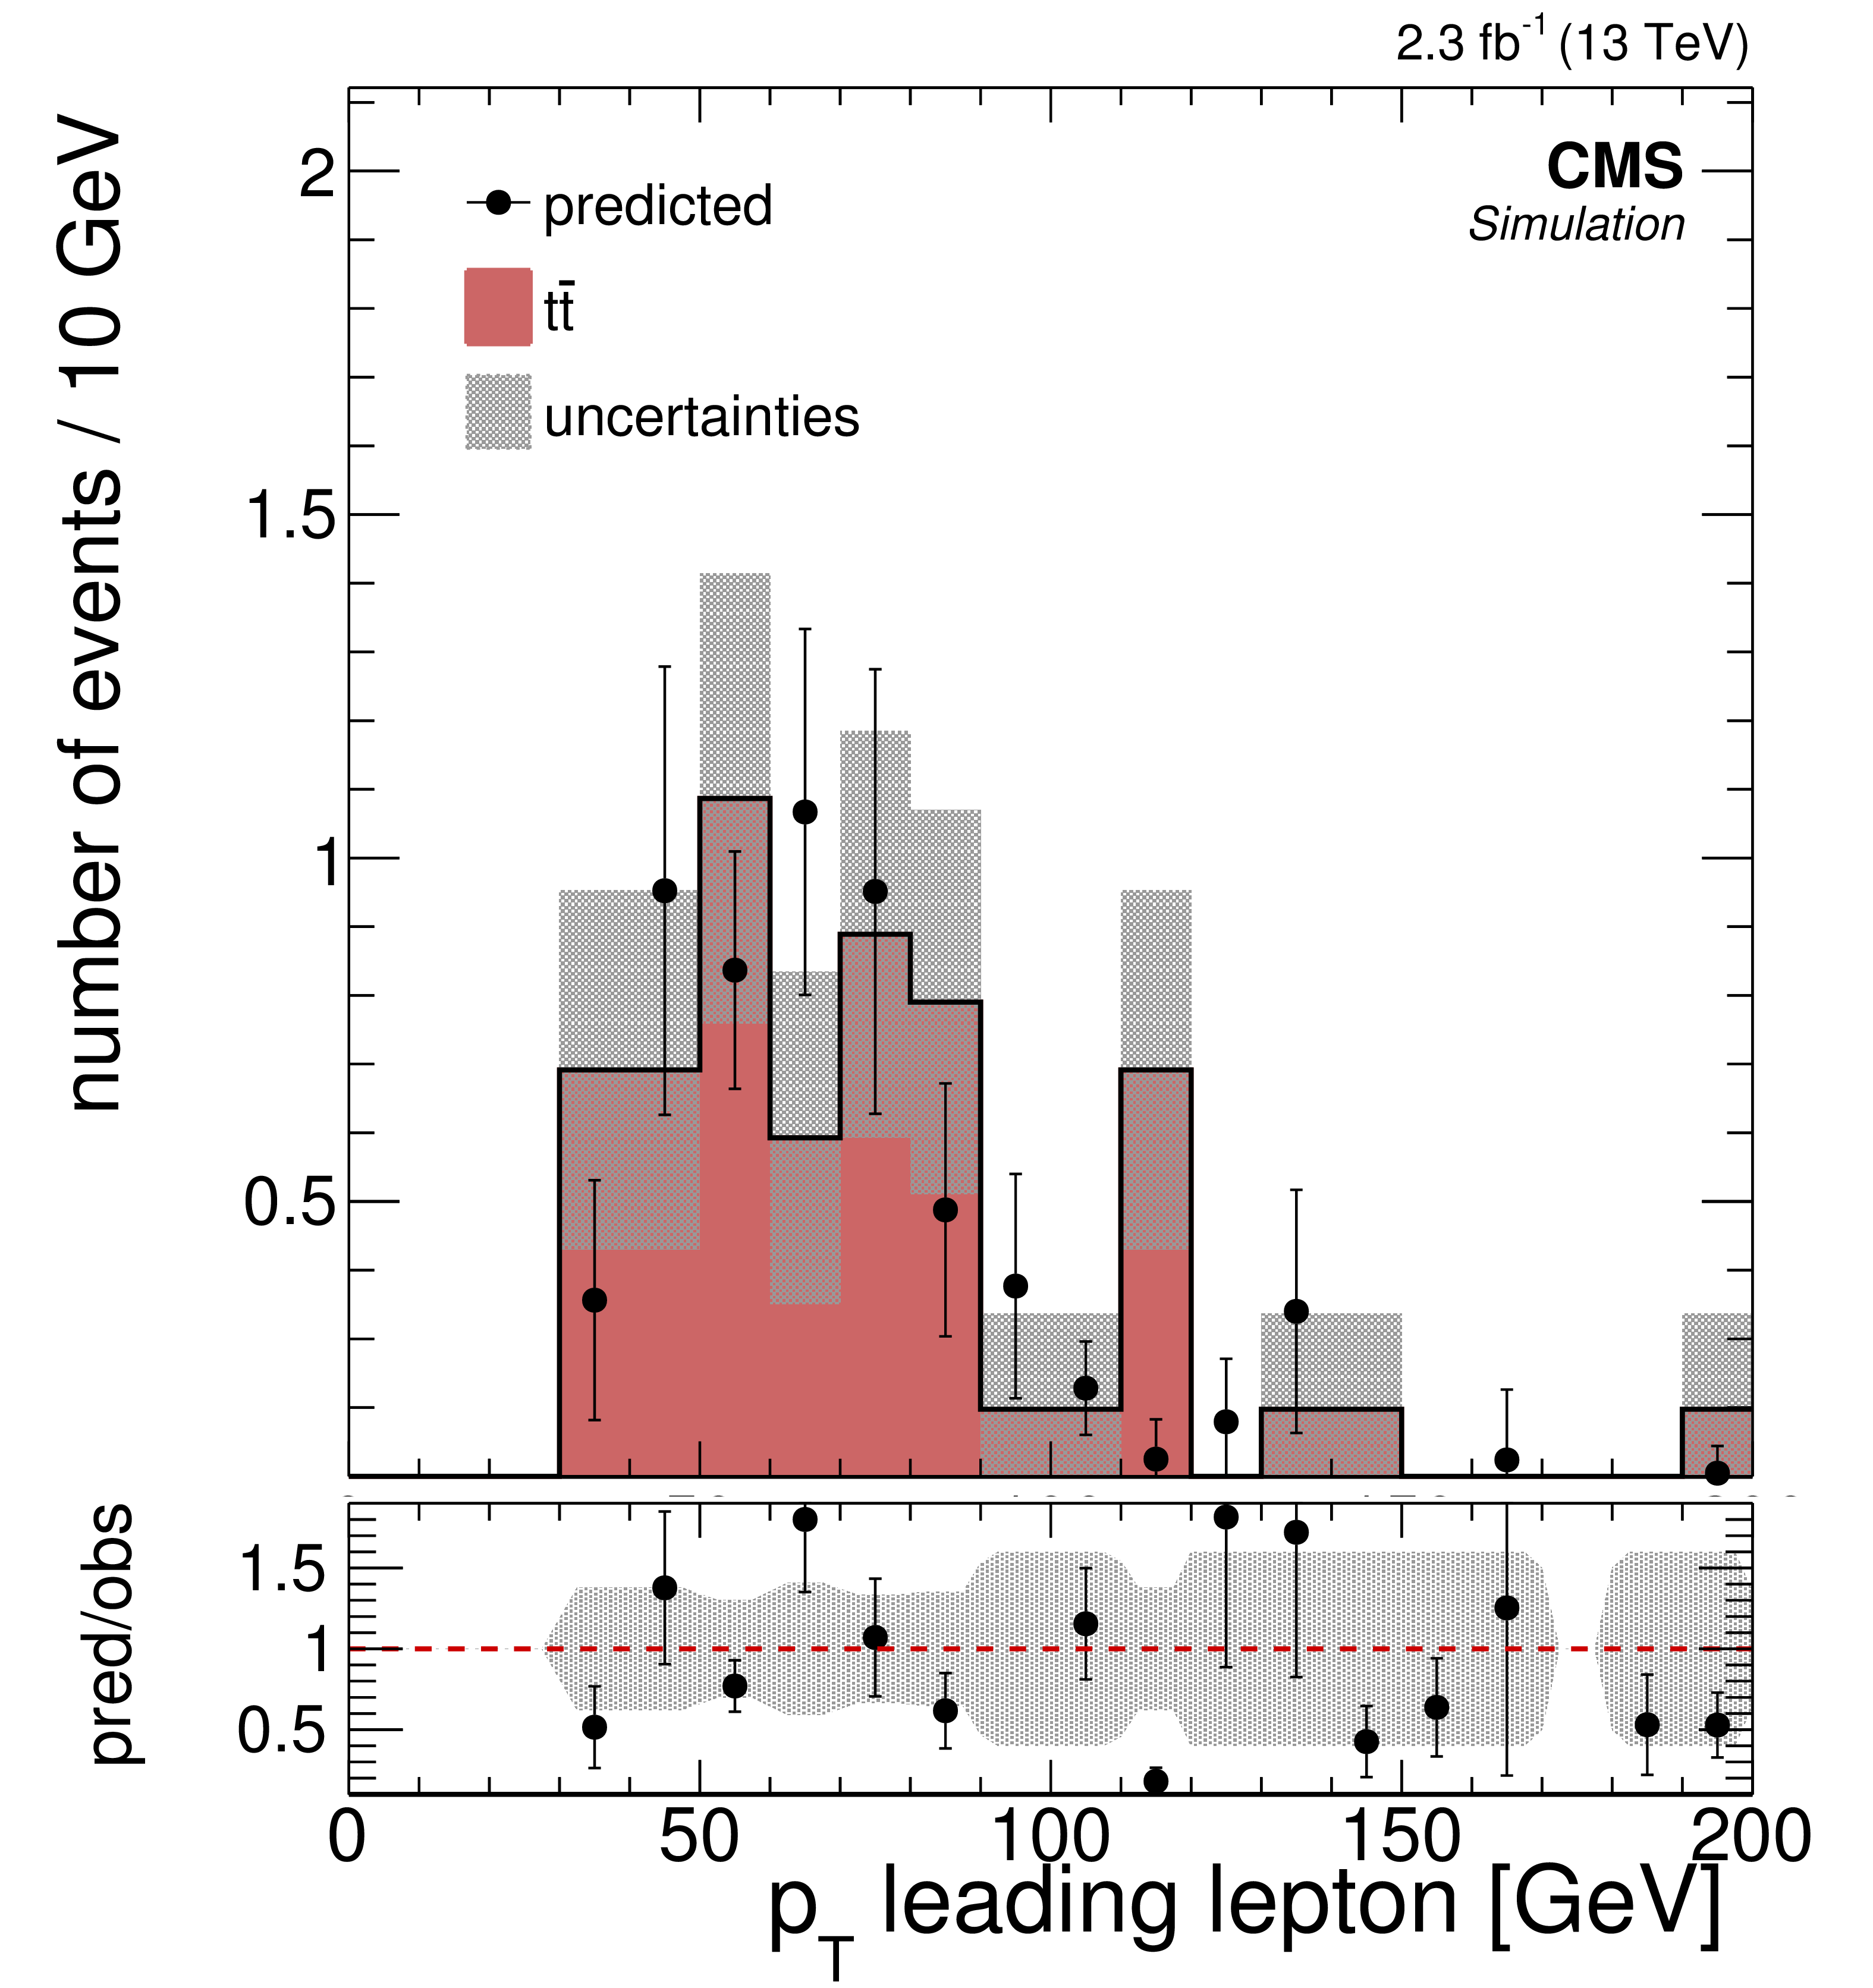
Figure 2-e:
Comparisons of the distributions of (a) $ {H_{\mathrm {T}}} $, (b) $ {E_{\mathrm {T}}^{\text {miss}}} $, (c) $ {N_\text {jets}} $, (d) $ {N_\text {b jets}} $, (e-g) $ {p_{\mathrm {T}}} $ of leptons for the background predictions to those observed in data in the off-Z baseline selection region. The nonprompt lepton backgrounds come from the data-driven technique described in Section 4. The total predicted background and number of events observed in 15 off-Z SRs is shown in (h). |
png pdf |
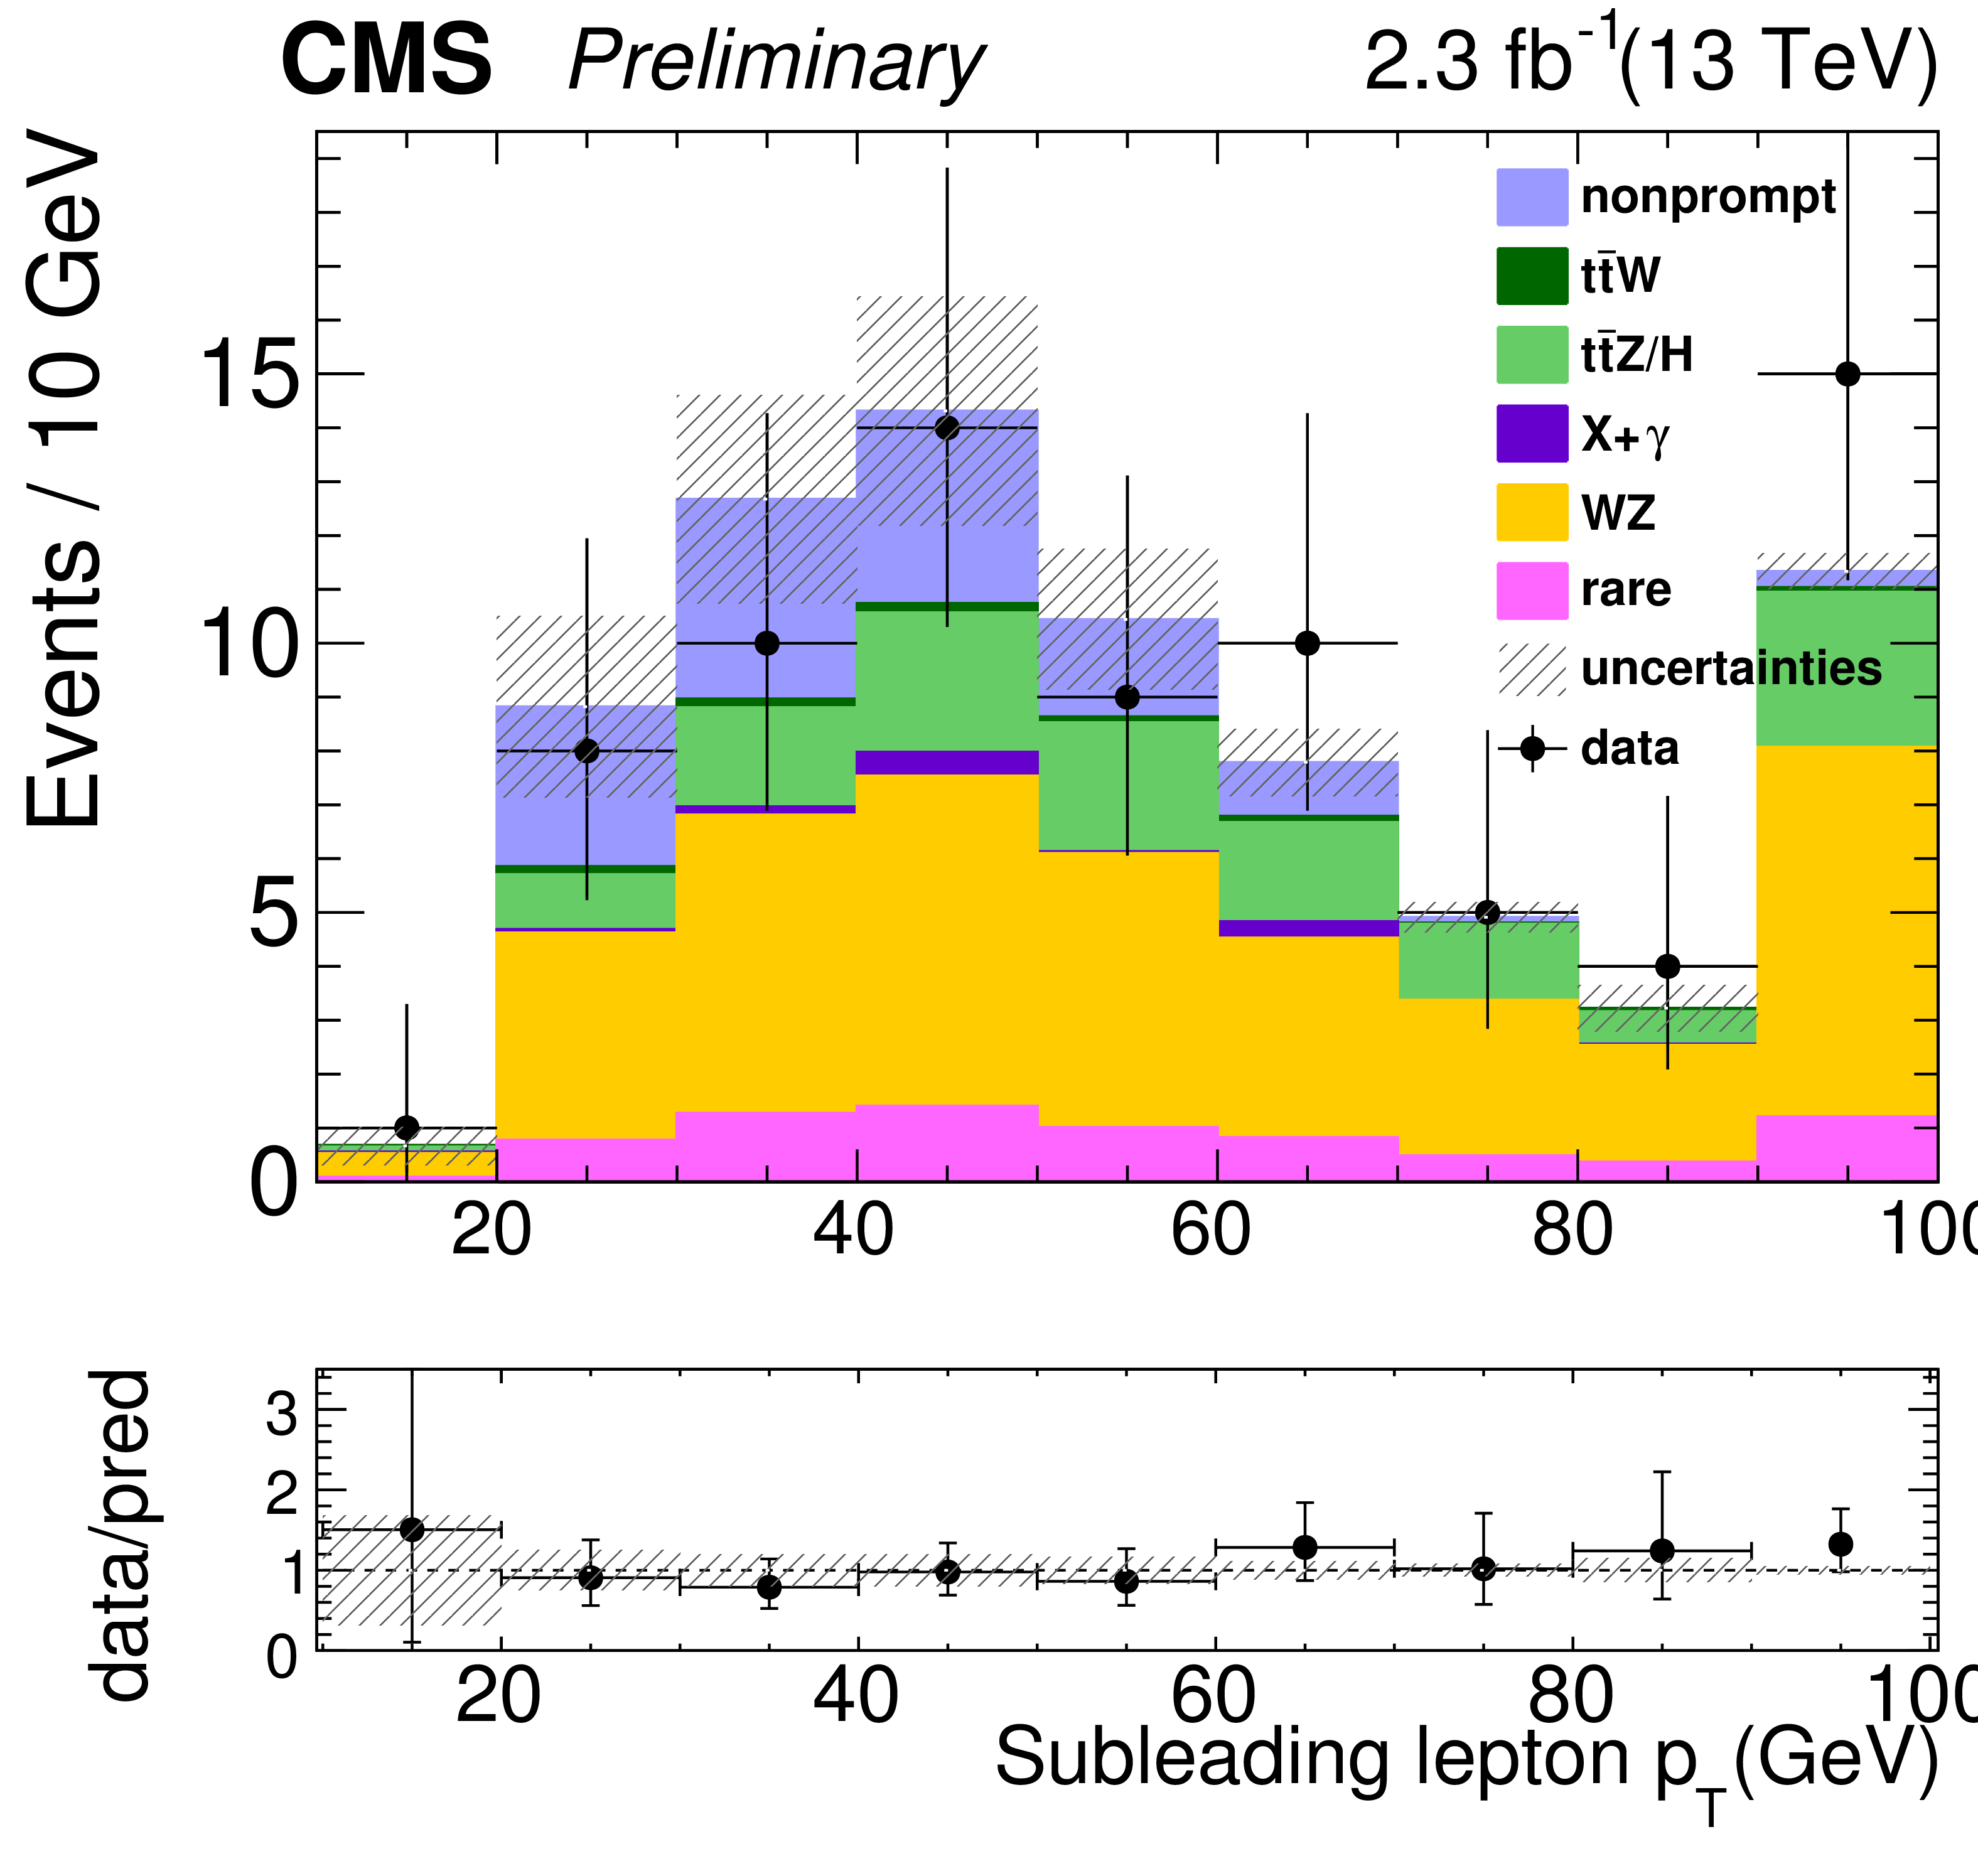
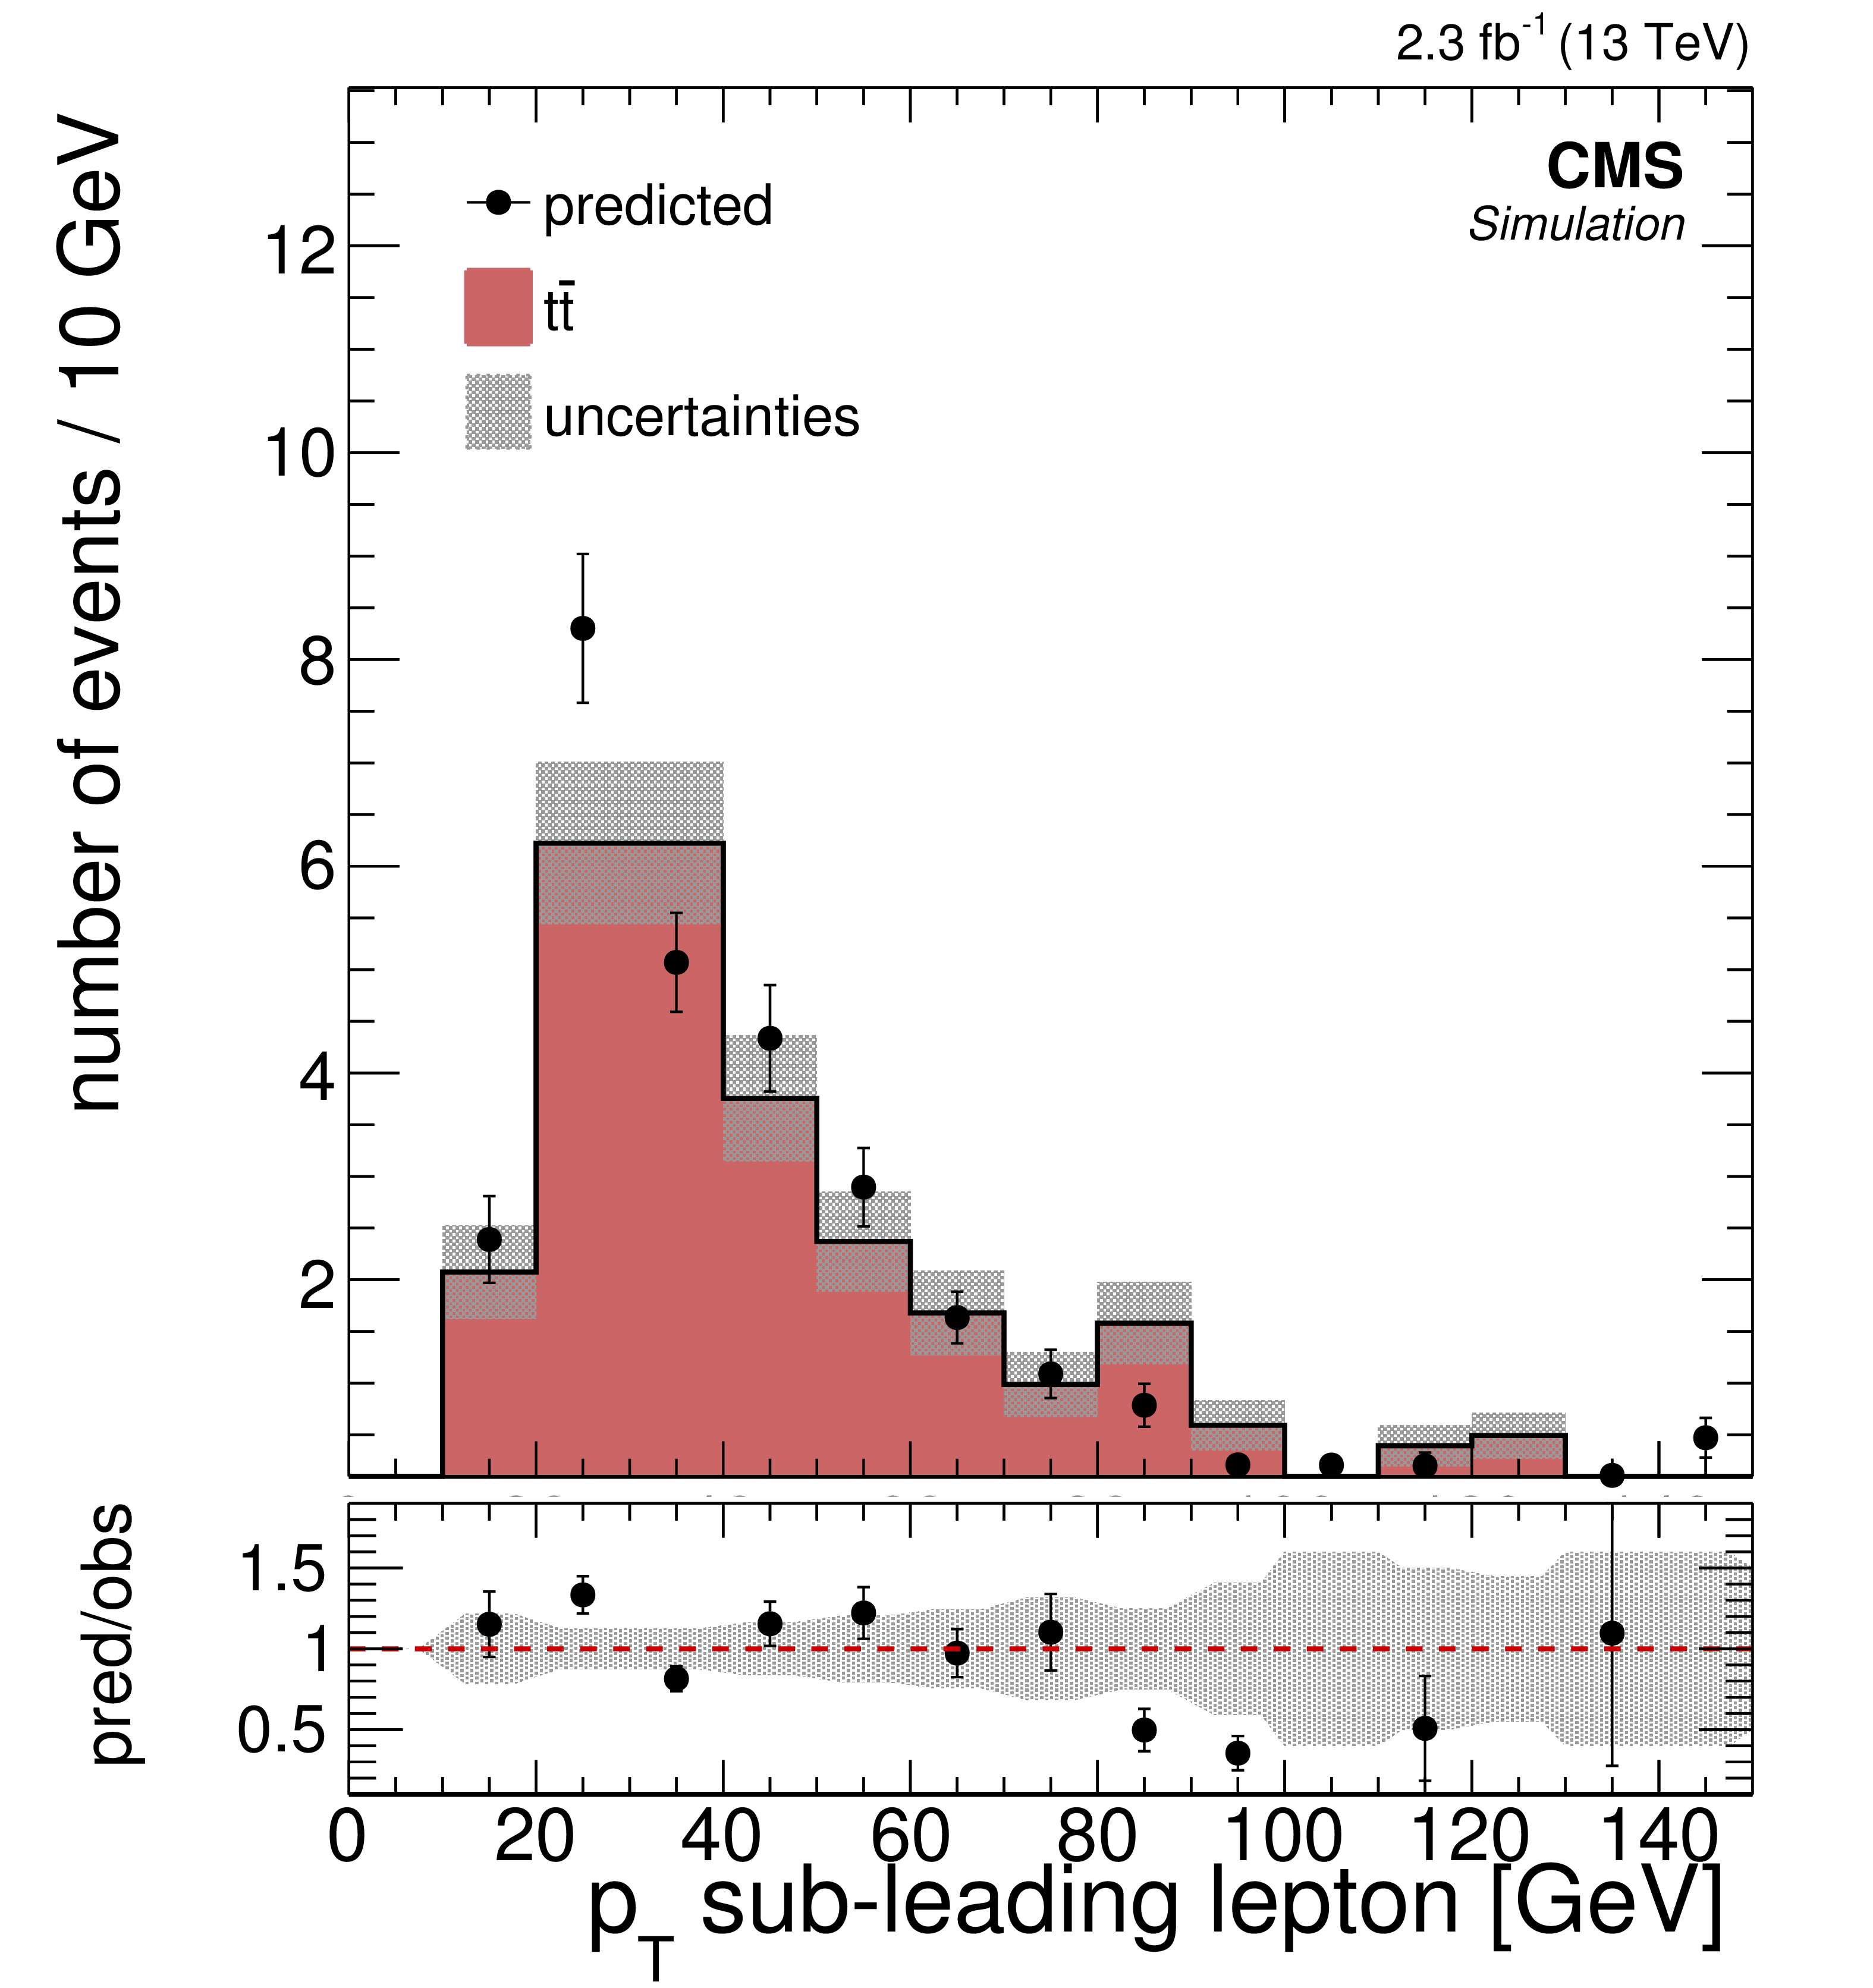
Figure 2-f:
Comparisons of the distributions of (a) $ {H_{\mathrm {T}}} $, (b) $ {E_{\mathrm {T}}^{\text {miss}}} $, (c) $ {N_\text {jets}} $, (d) $ {N_\text {b jets}} $, (e-g) $ {p_{\mathrm {T}}} $ of leptons for the background predictions to those observed in data in the off-Z baseline selection region. The nonprompt lepton backgrounds come from the data-driven technique described in Section 4. The total predicted background and number of events observed in 15 off-Z SRs is shown in (h). |

png pdf |
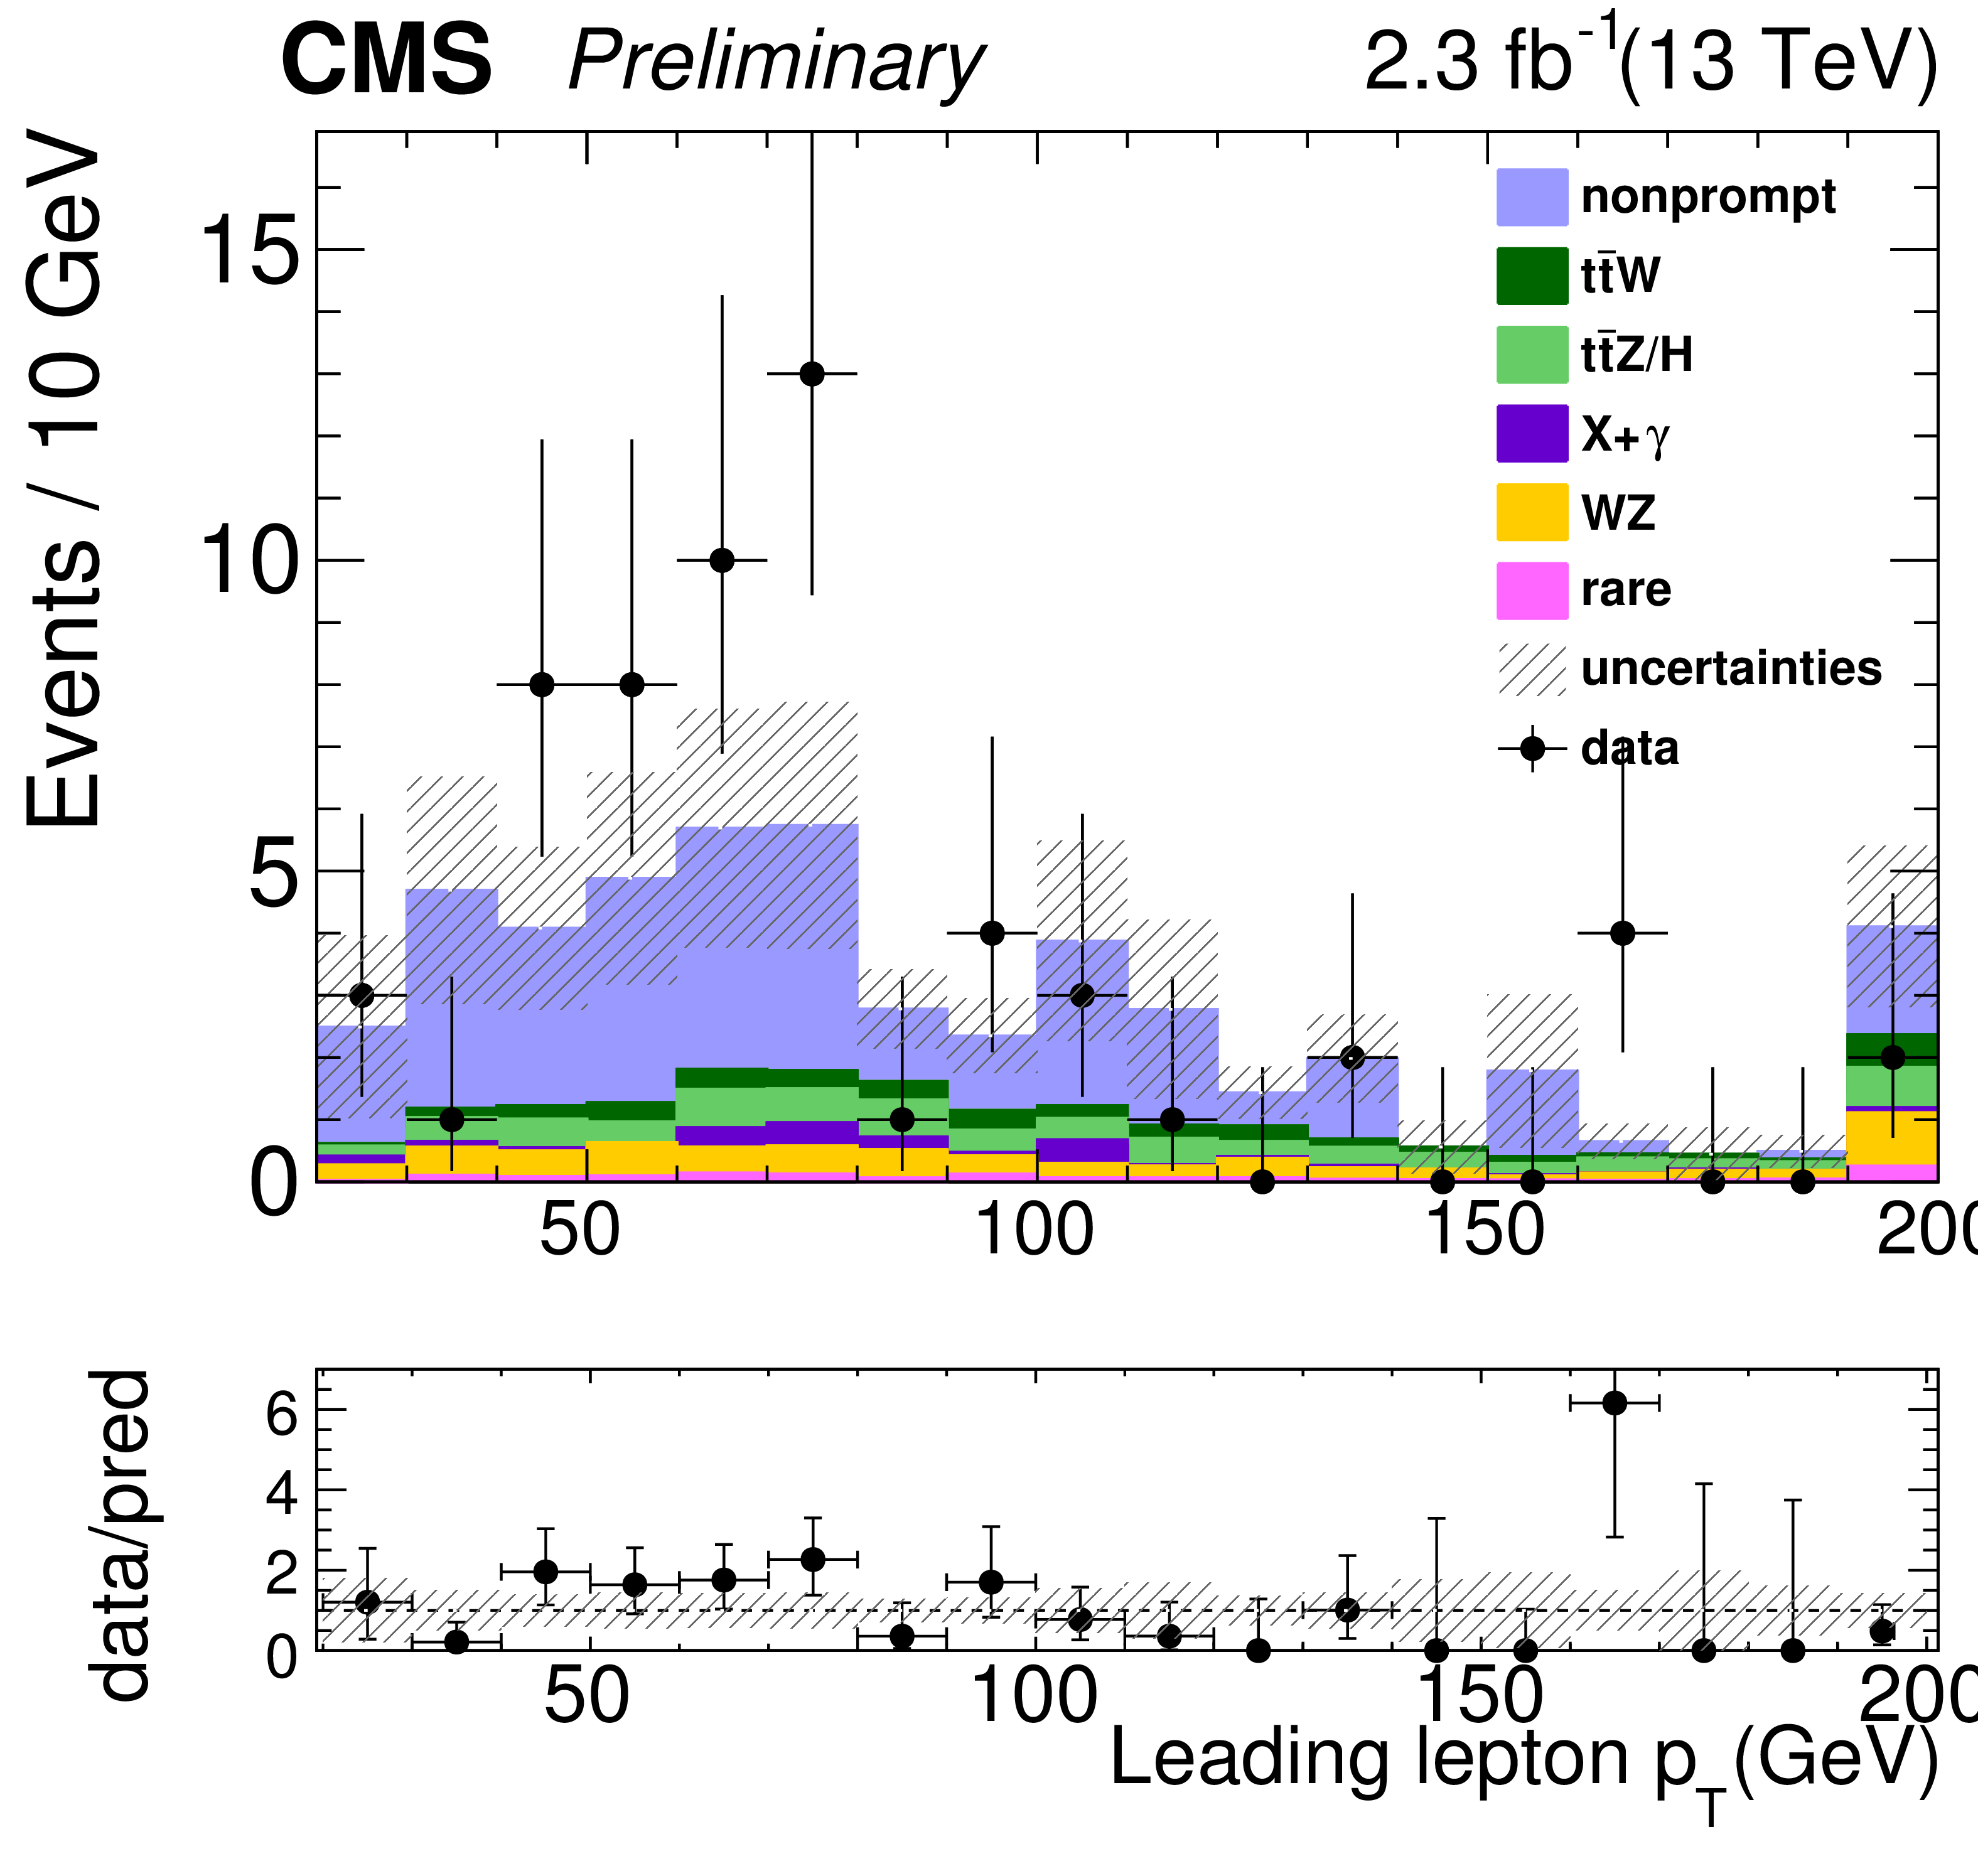
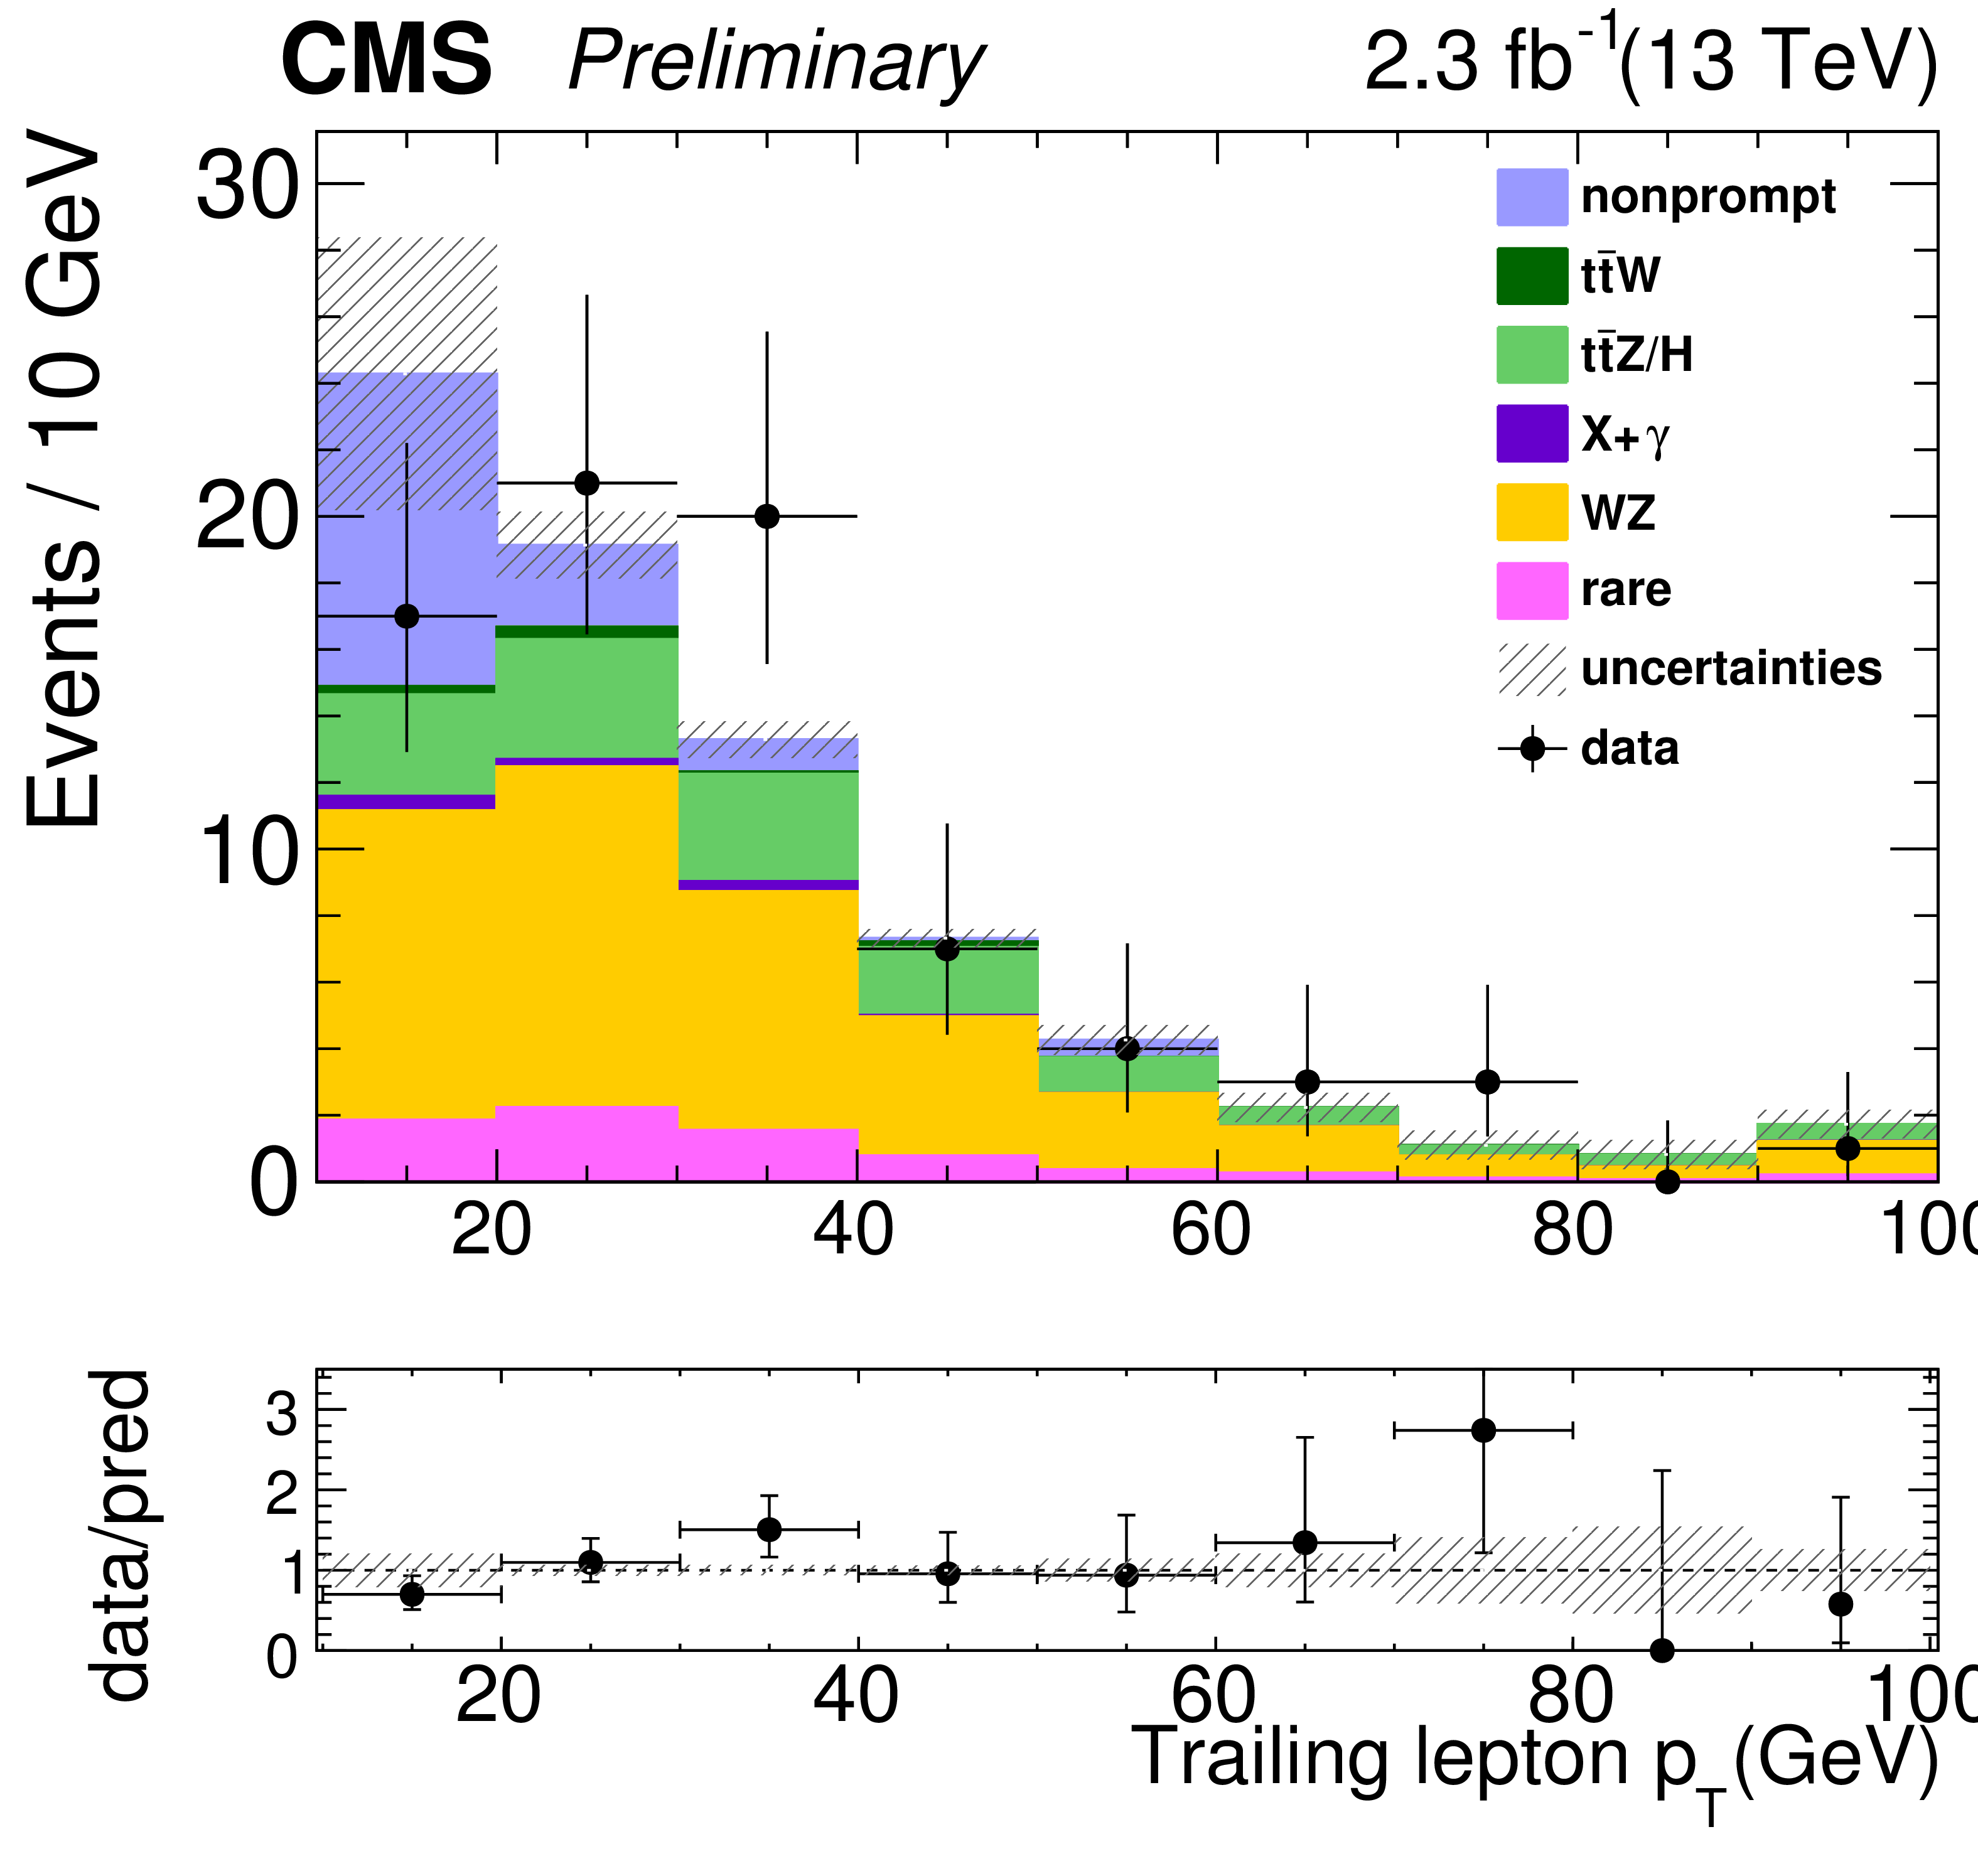
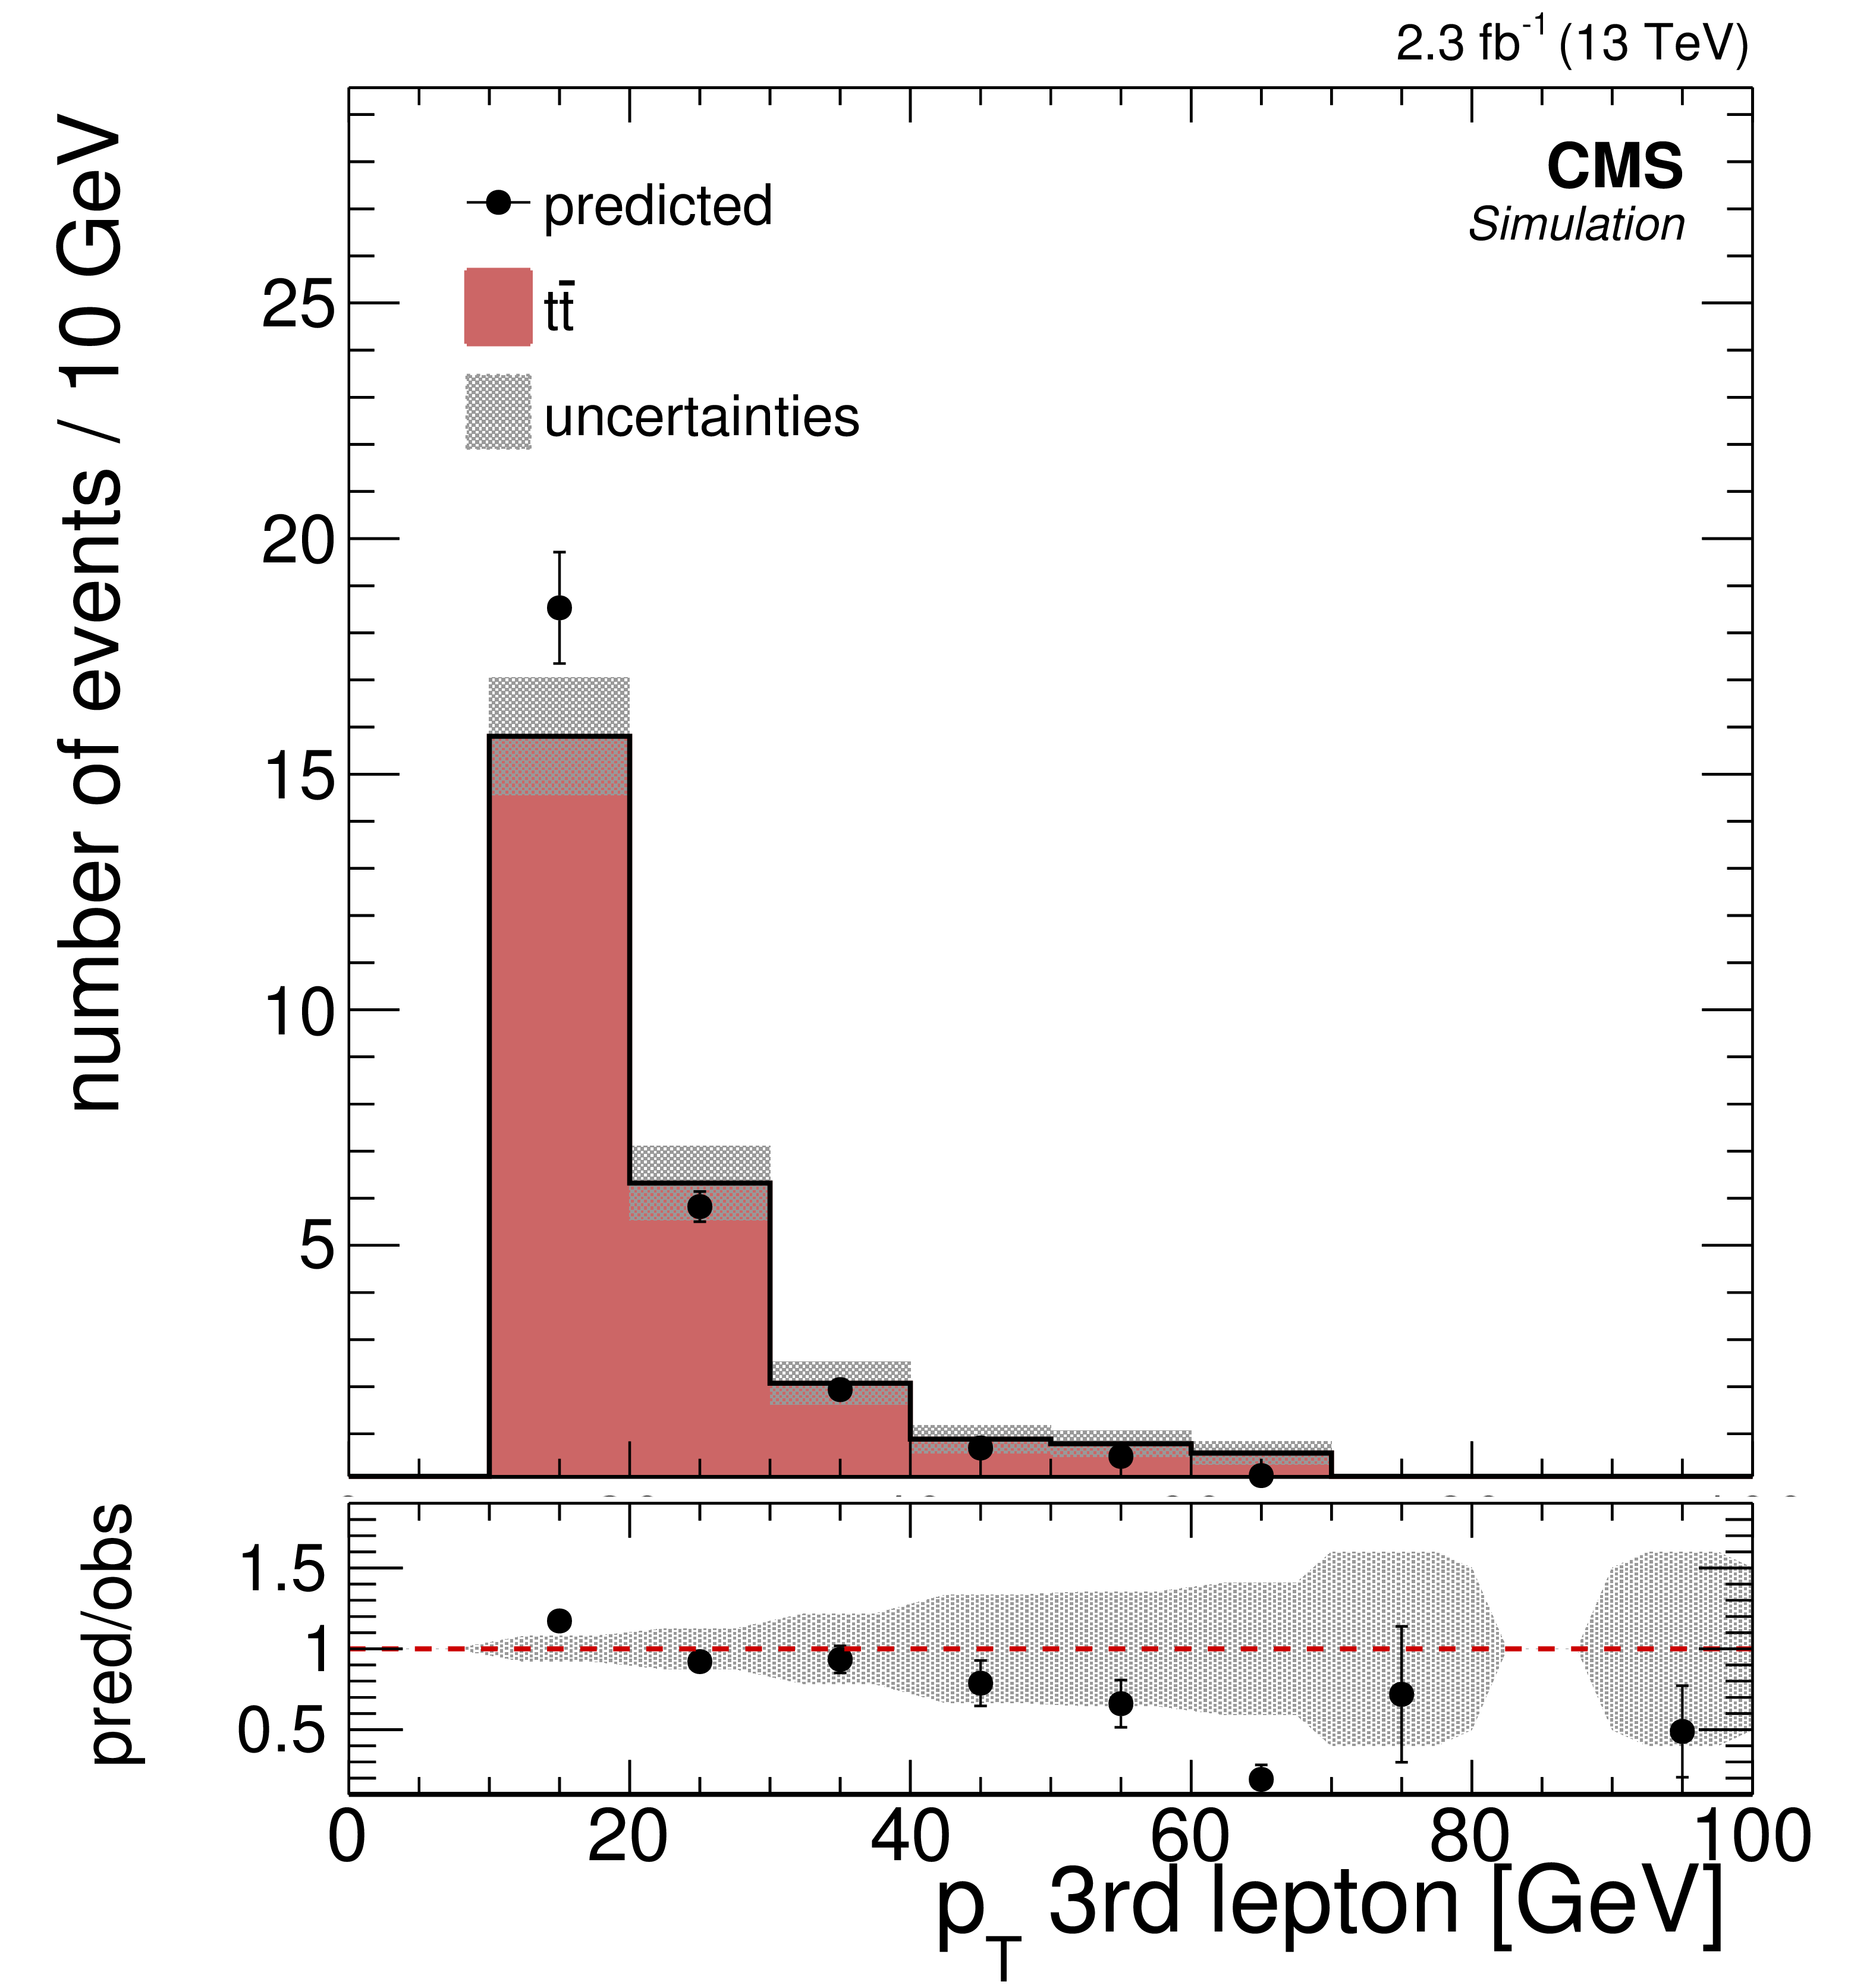
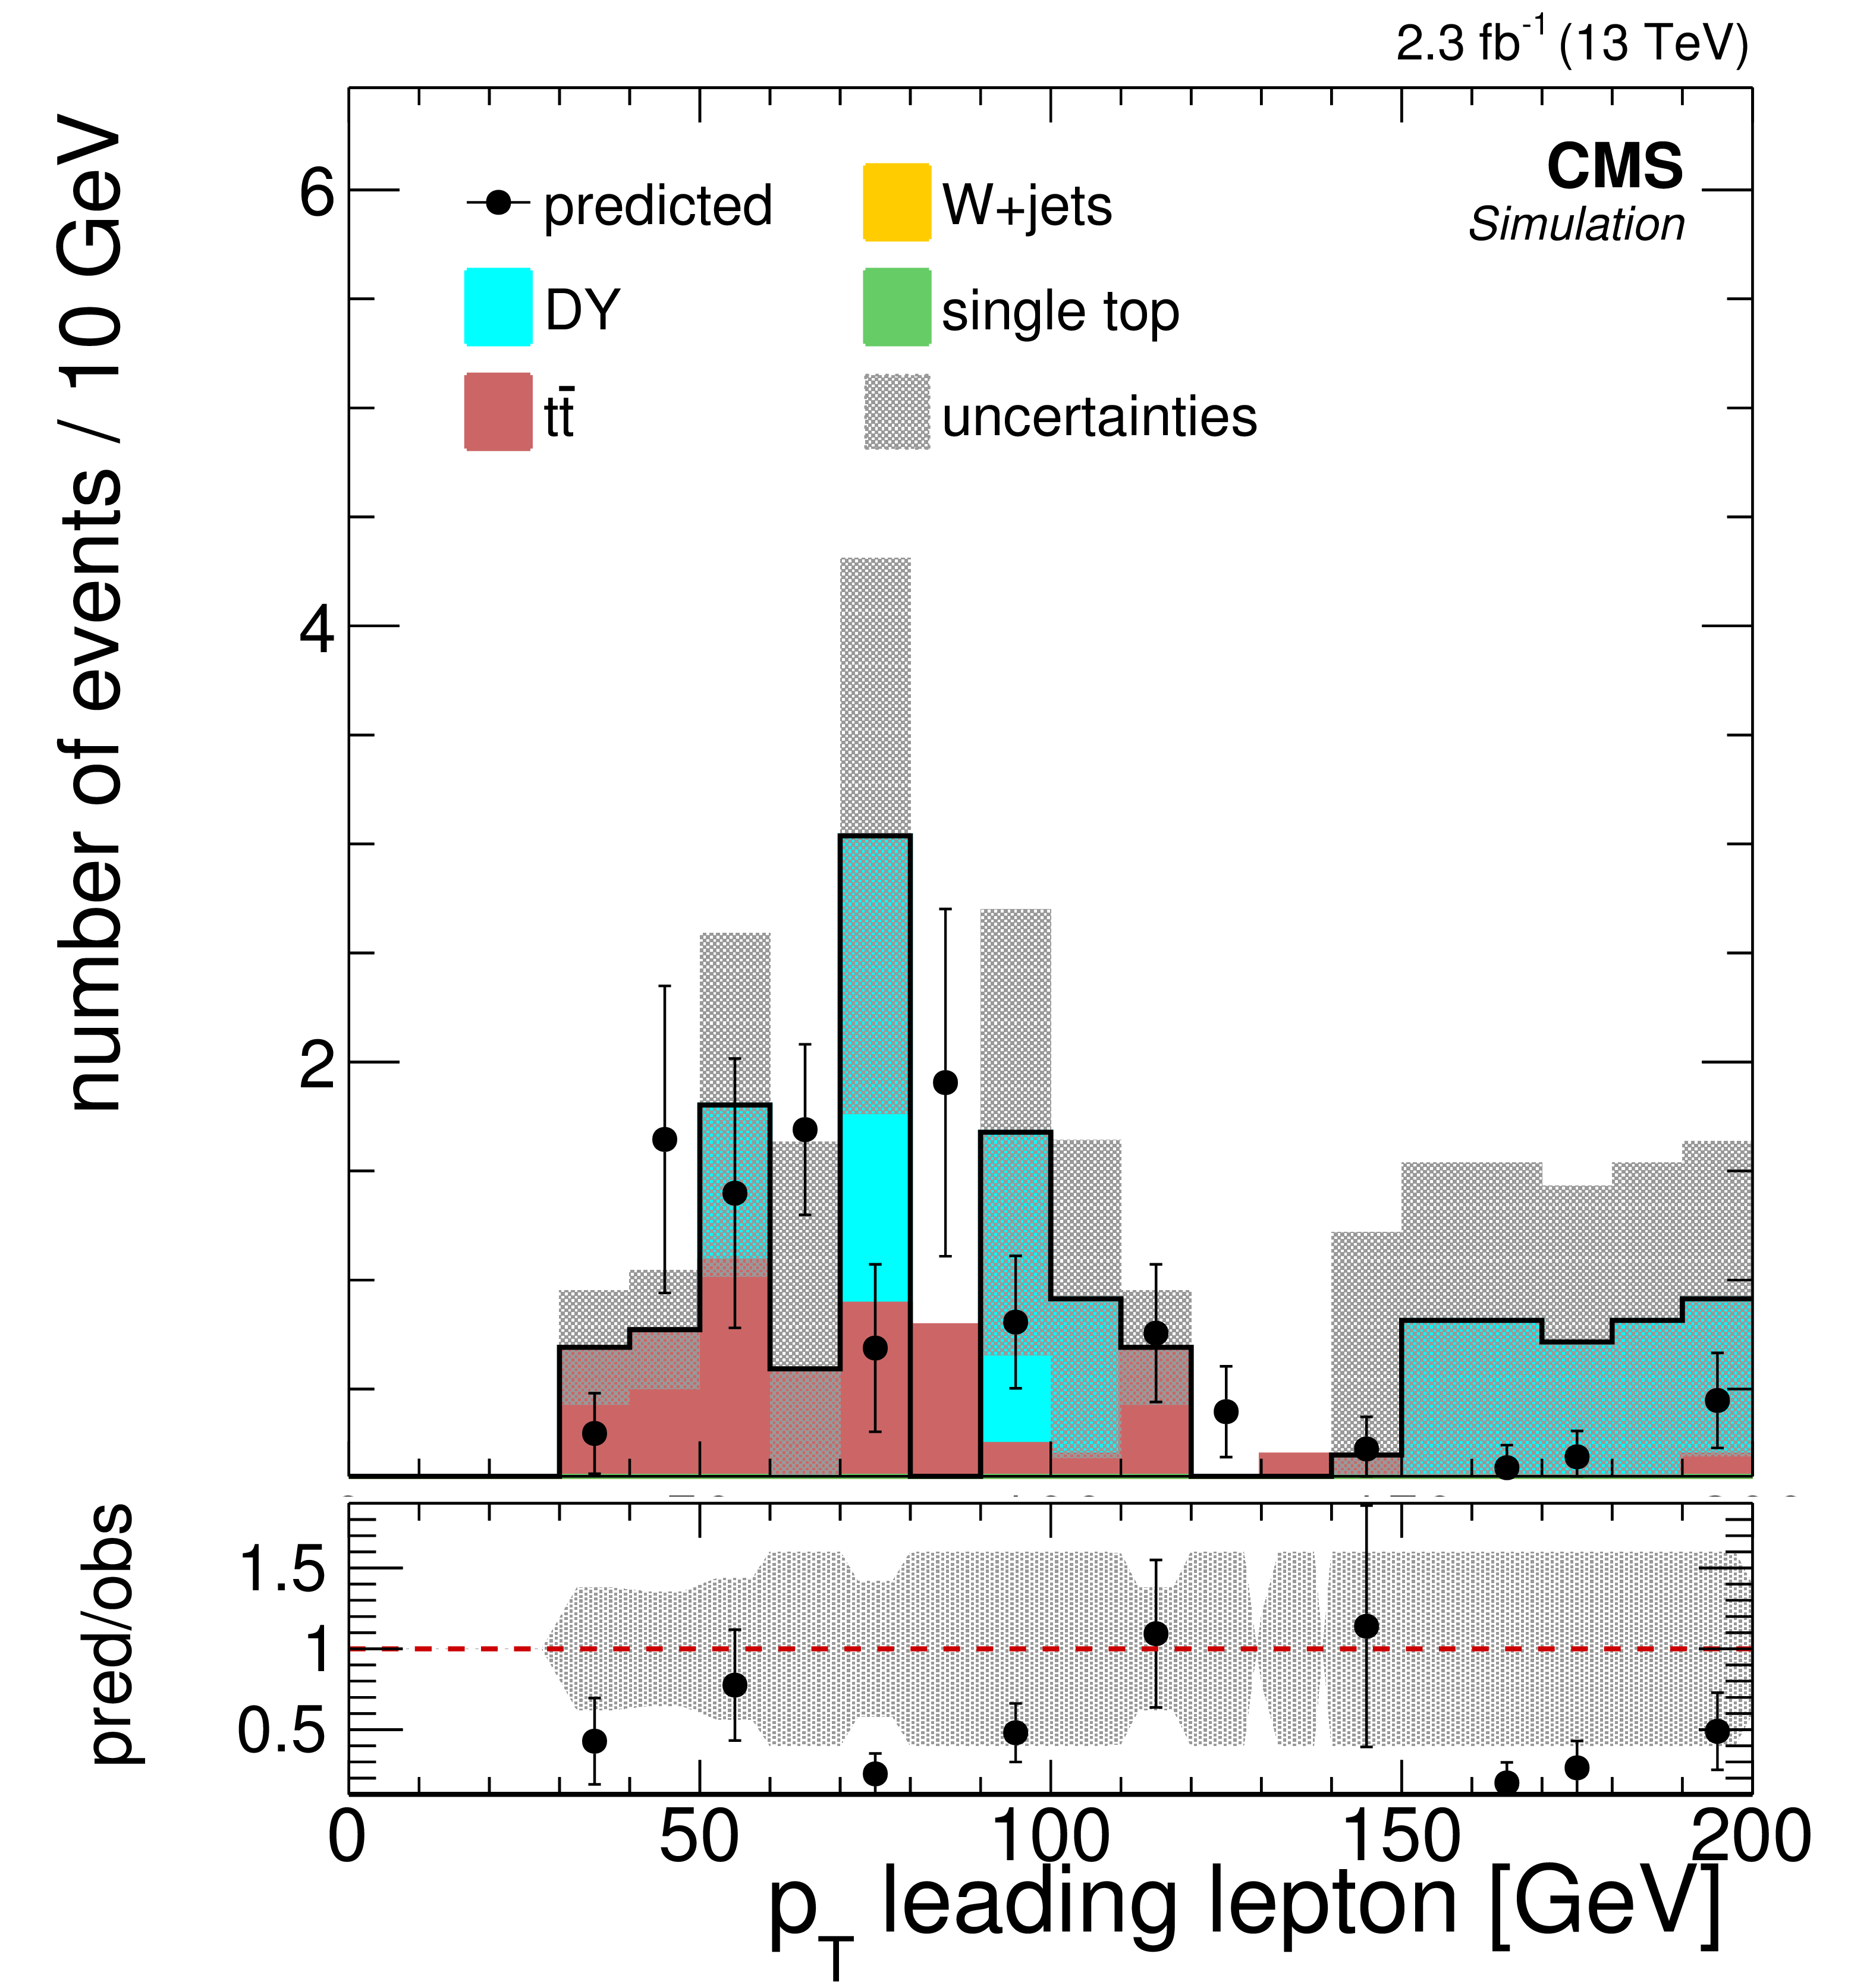
Figure 2-g:
Comparisons of the distributions of (a) $ {H_{\mathrm {T}}} $, (b) $ {E_{\mathrm {T}}^{\text {miss}}} $, (c) $ {N_\text {jets}} $, (d) $ {N_\text {b jets}} $, (e-g) $ {p_{\mathrm {T}}} $ of leptons for the background predictions to those observed in data in the off-Z baseline selection region. The nonprompt lepton backgrounds come from the data-driven technique described in Section 4. The total predicted background and number of events observed in 15 off-Z SRs is shown in (h). |
png pdf |
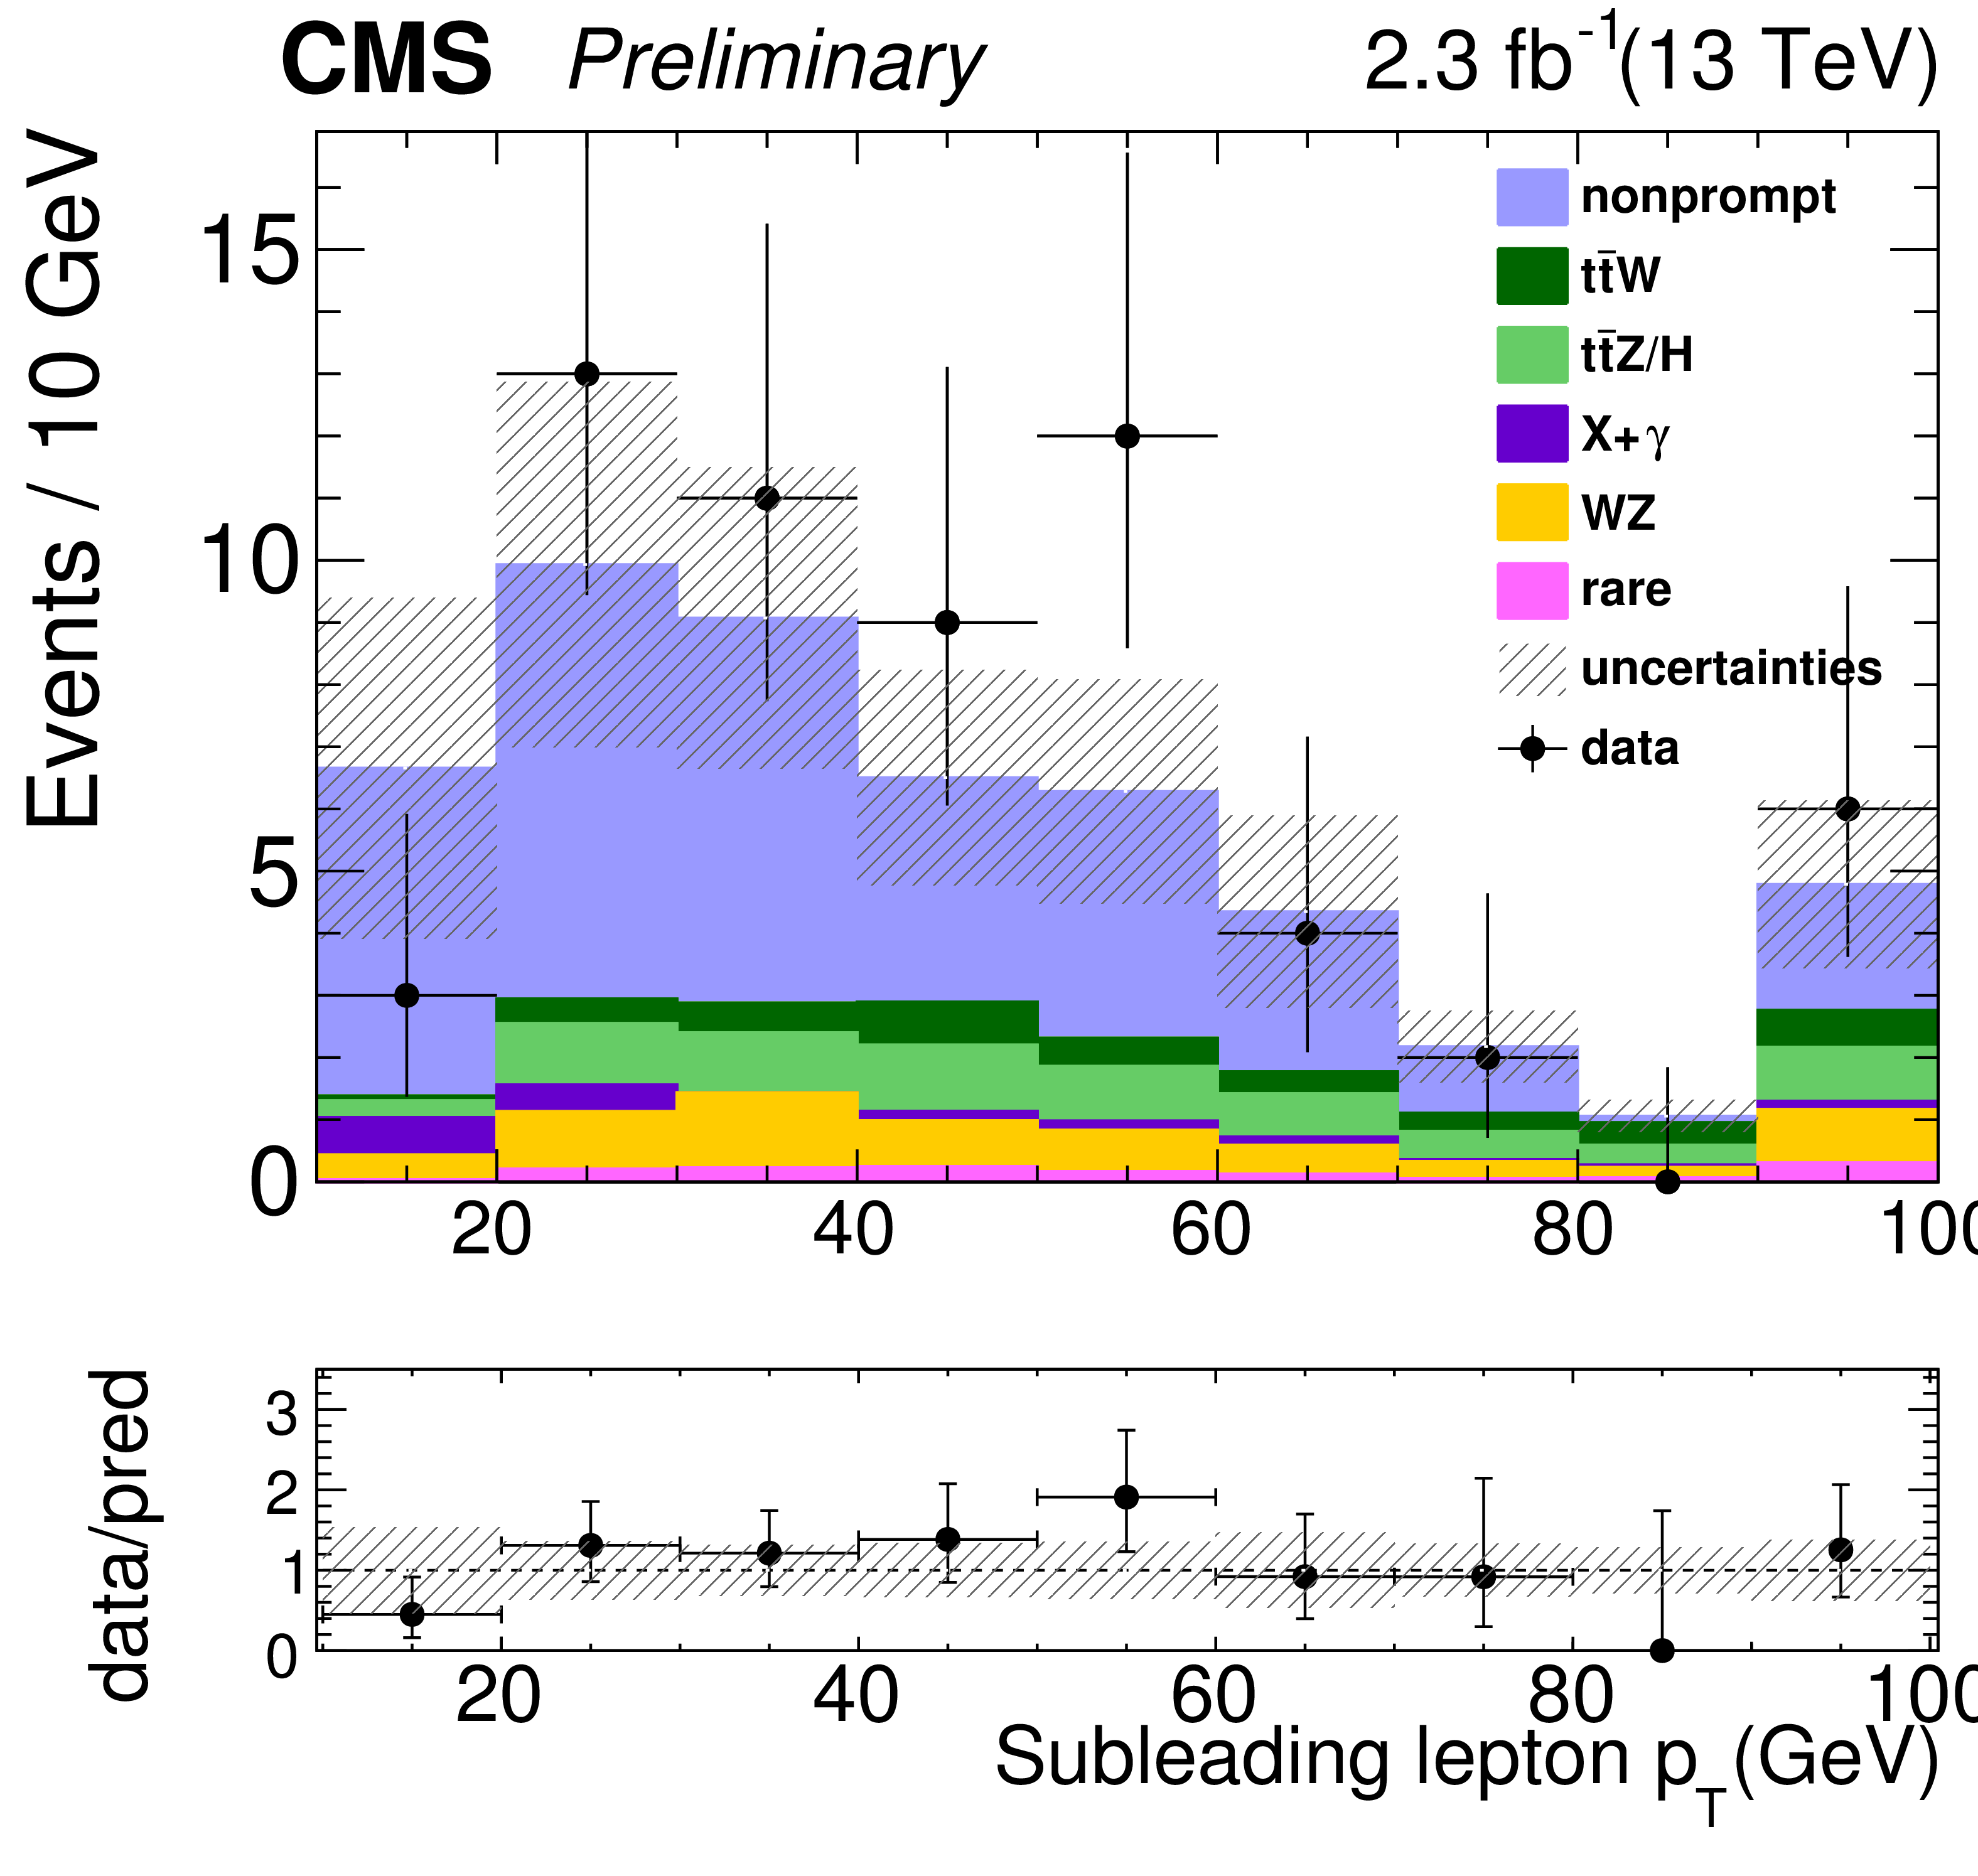
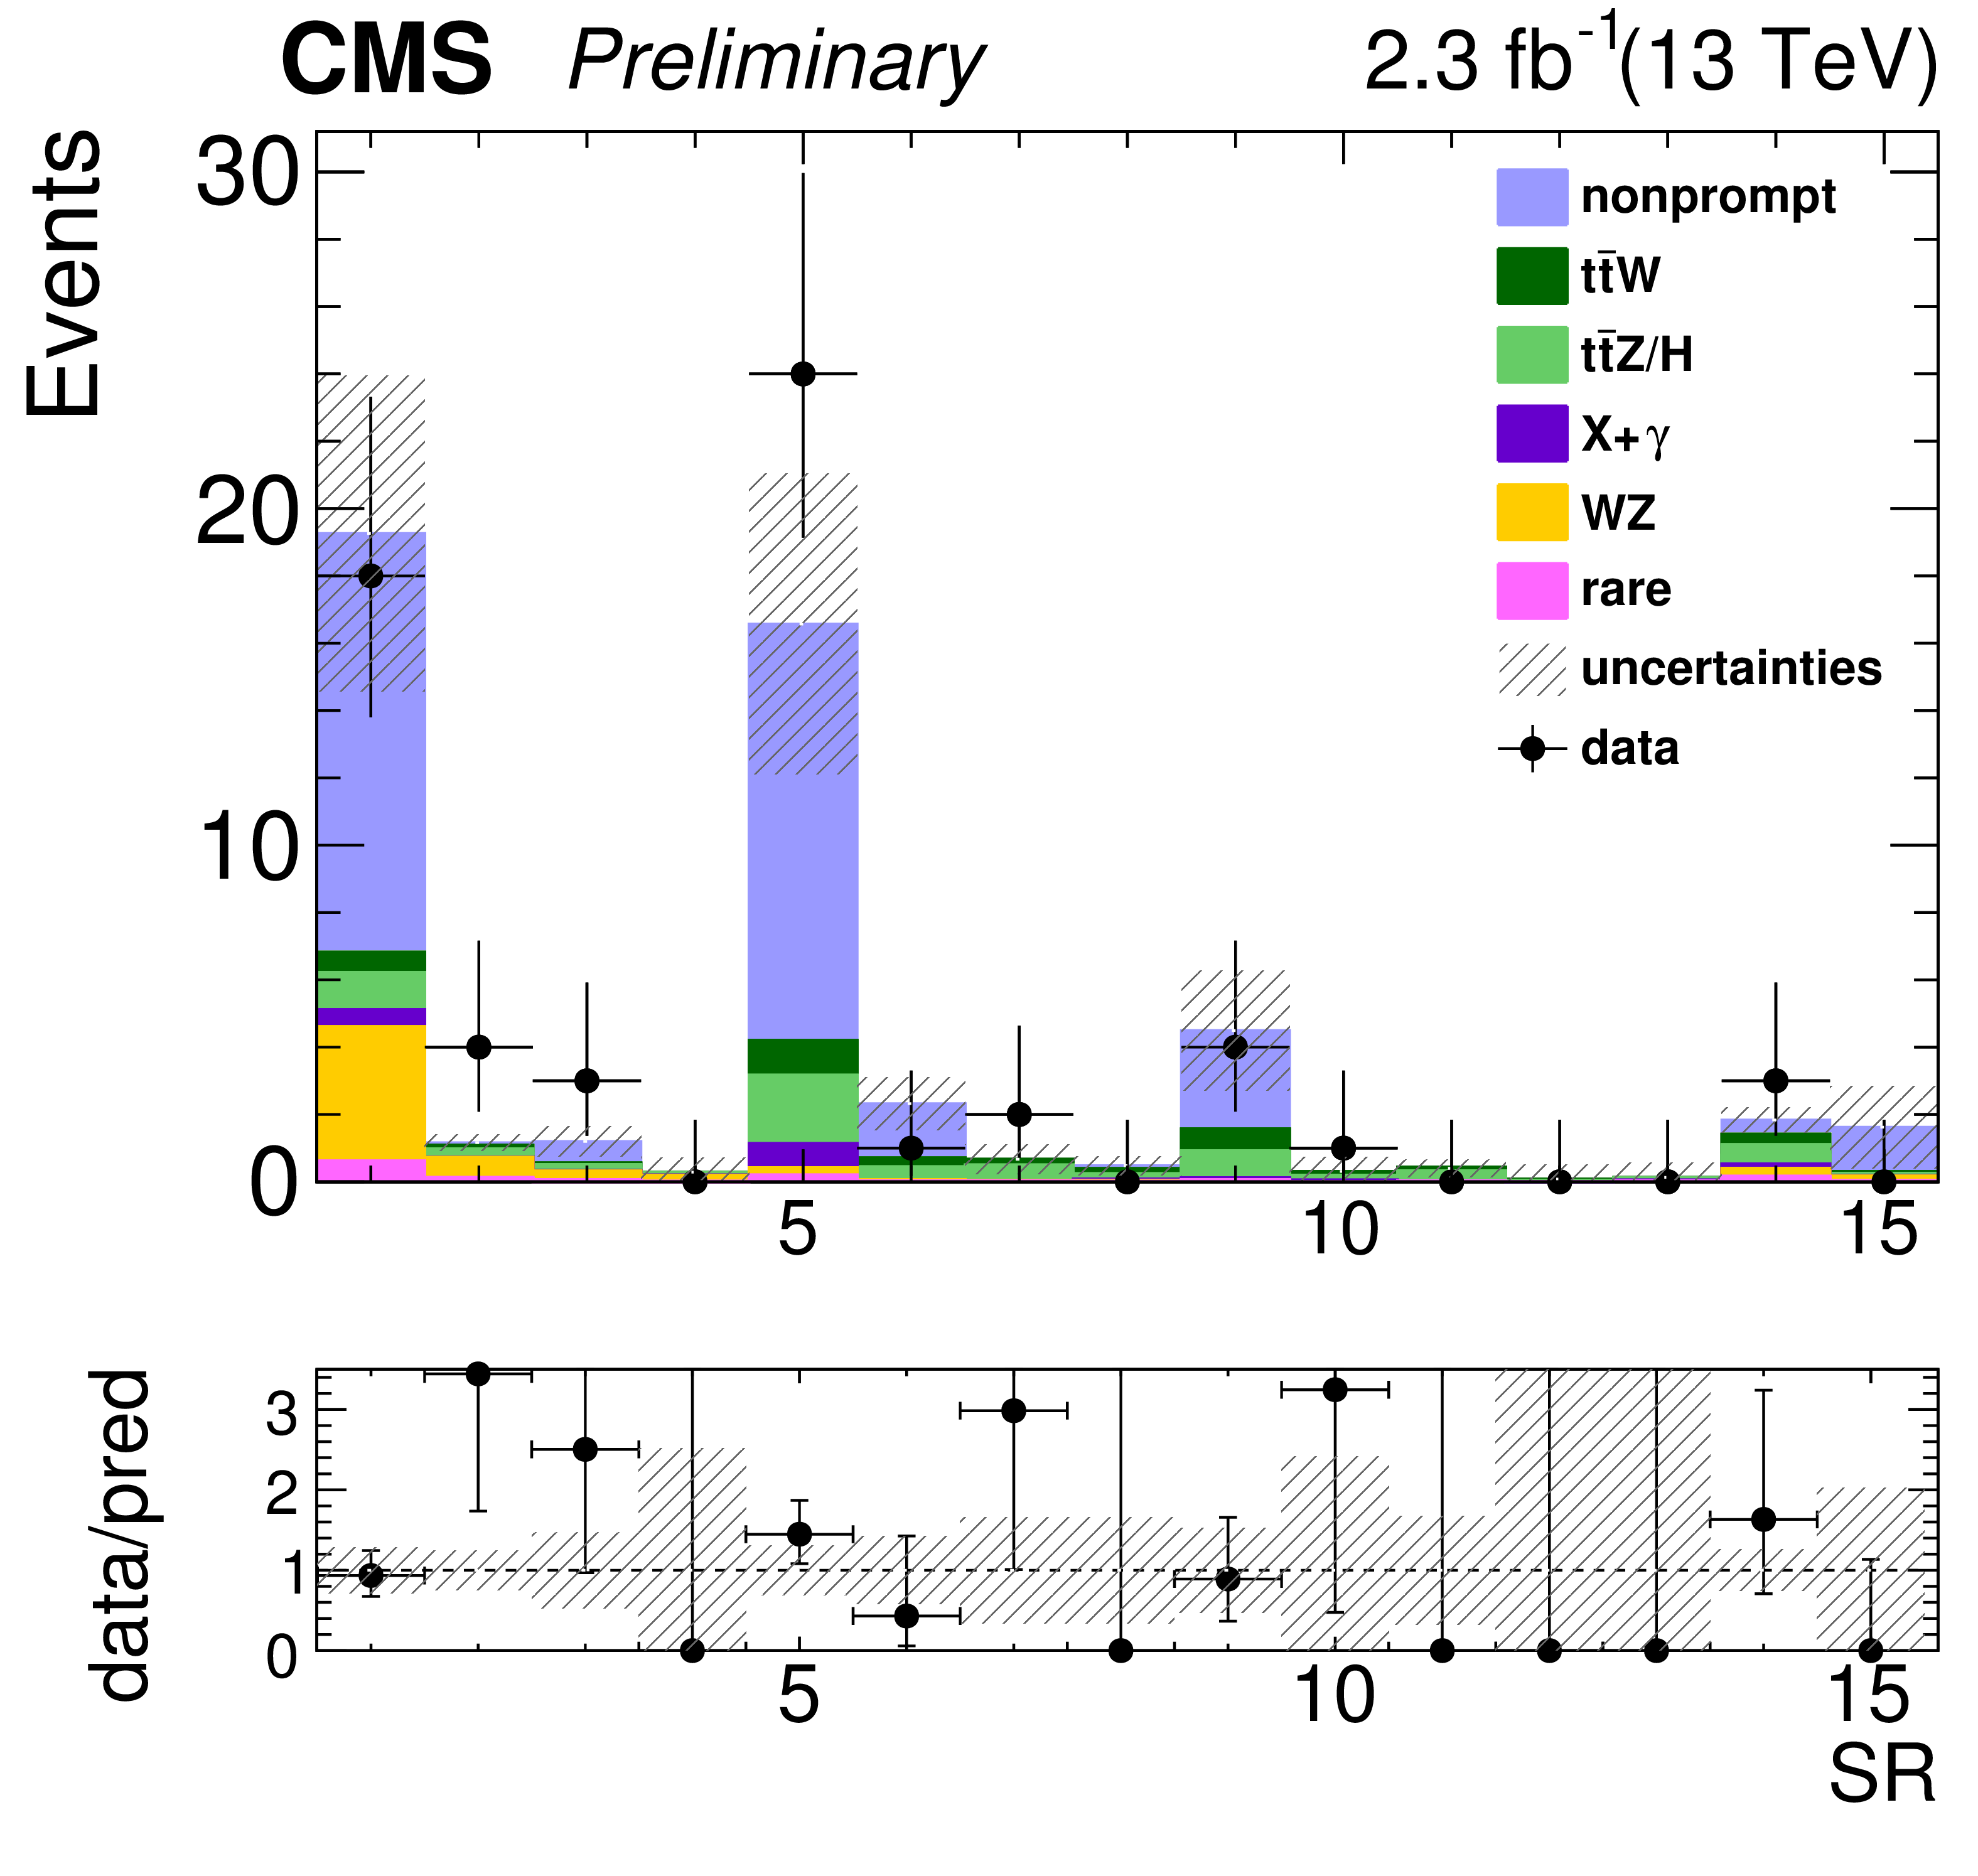
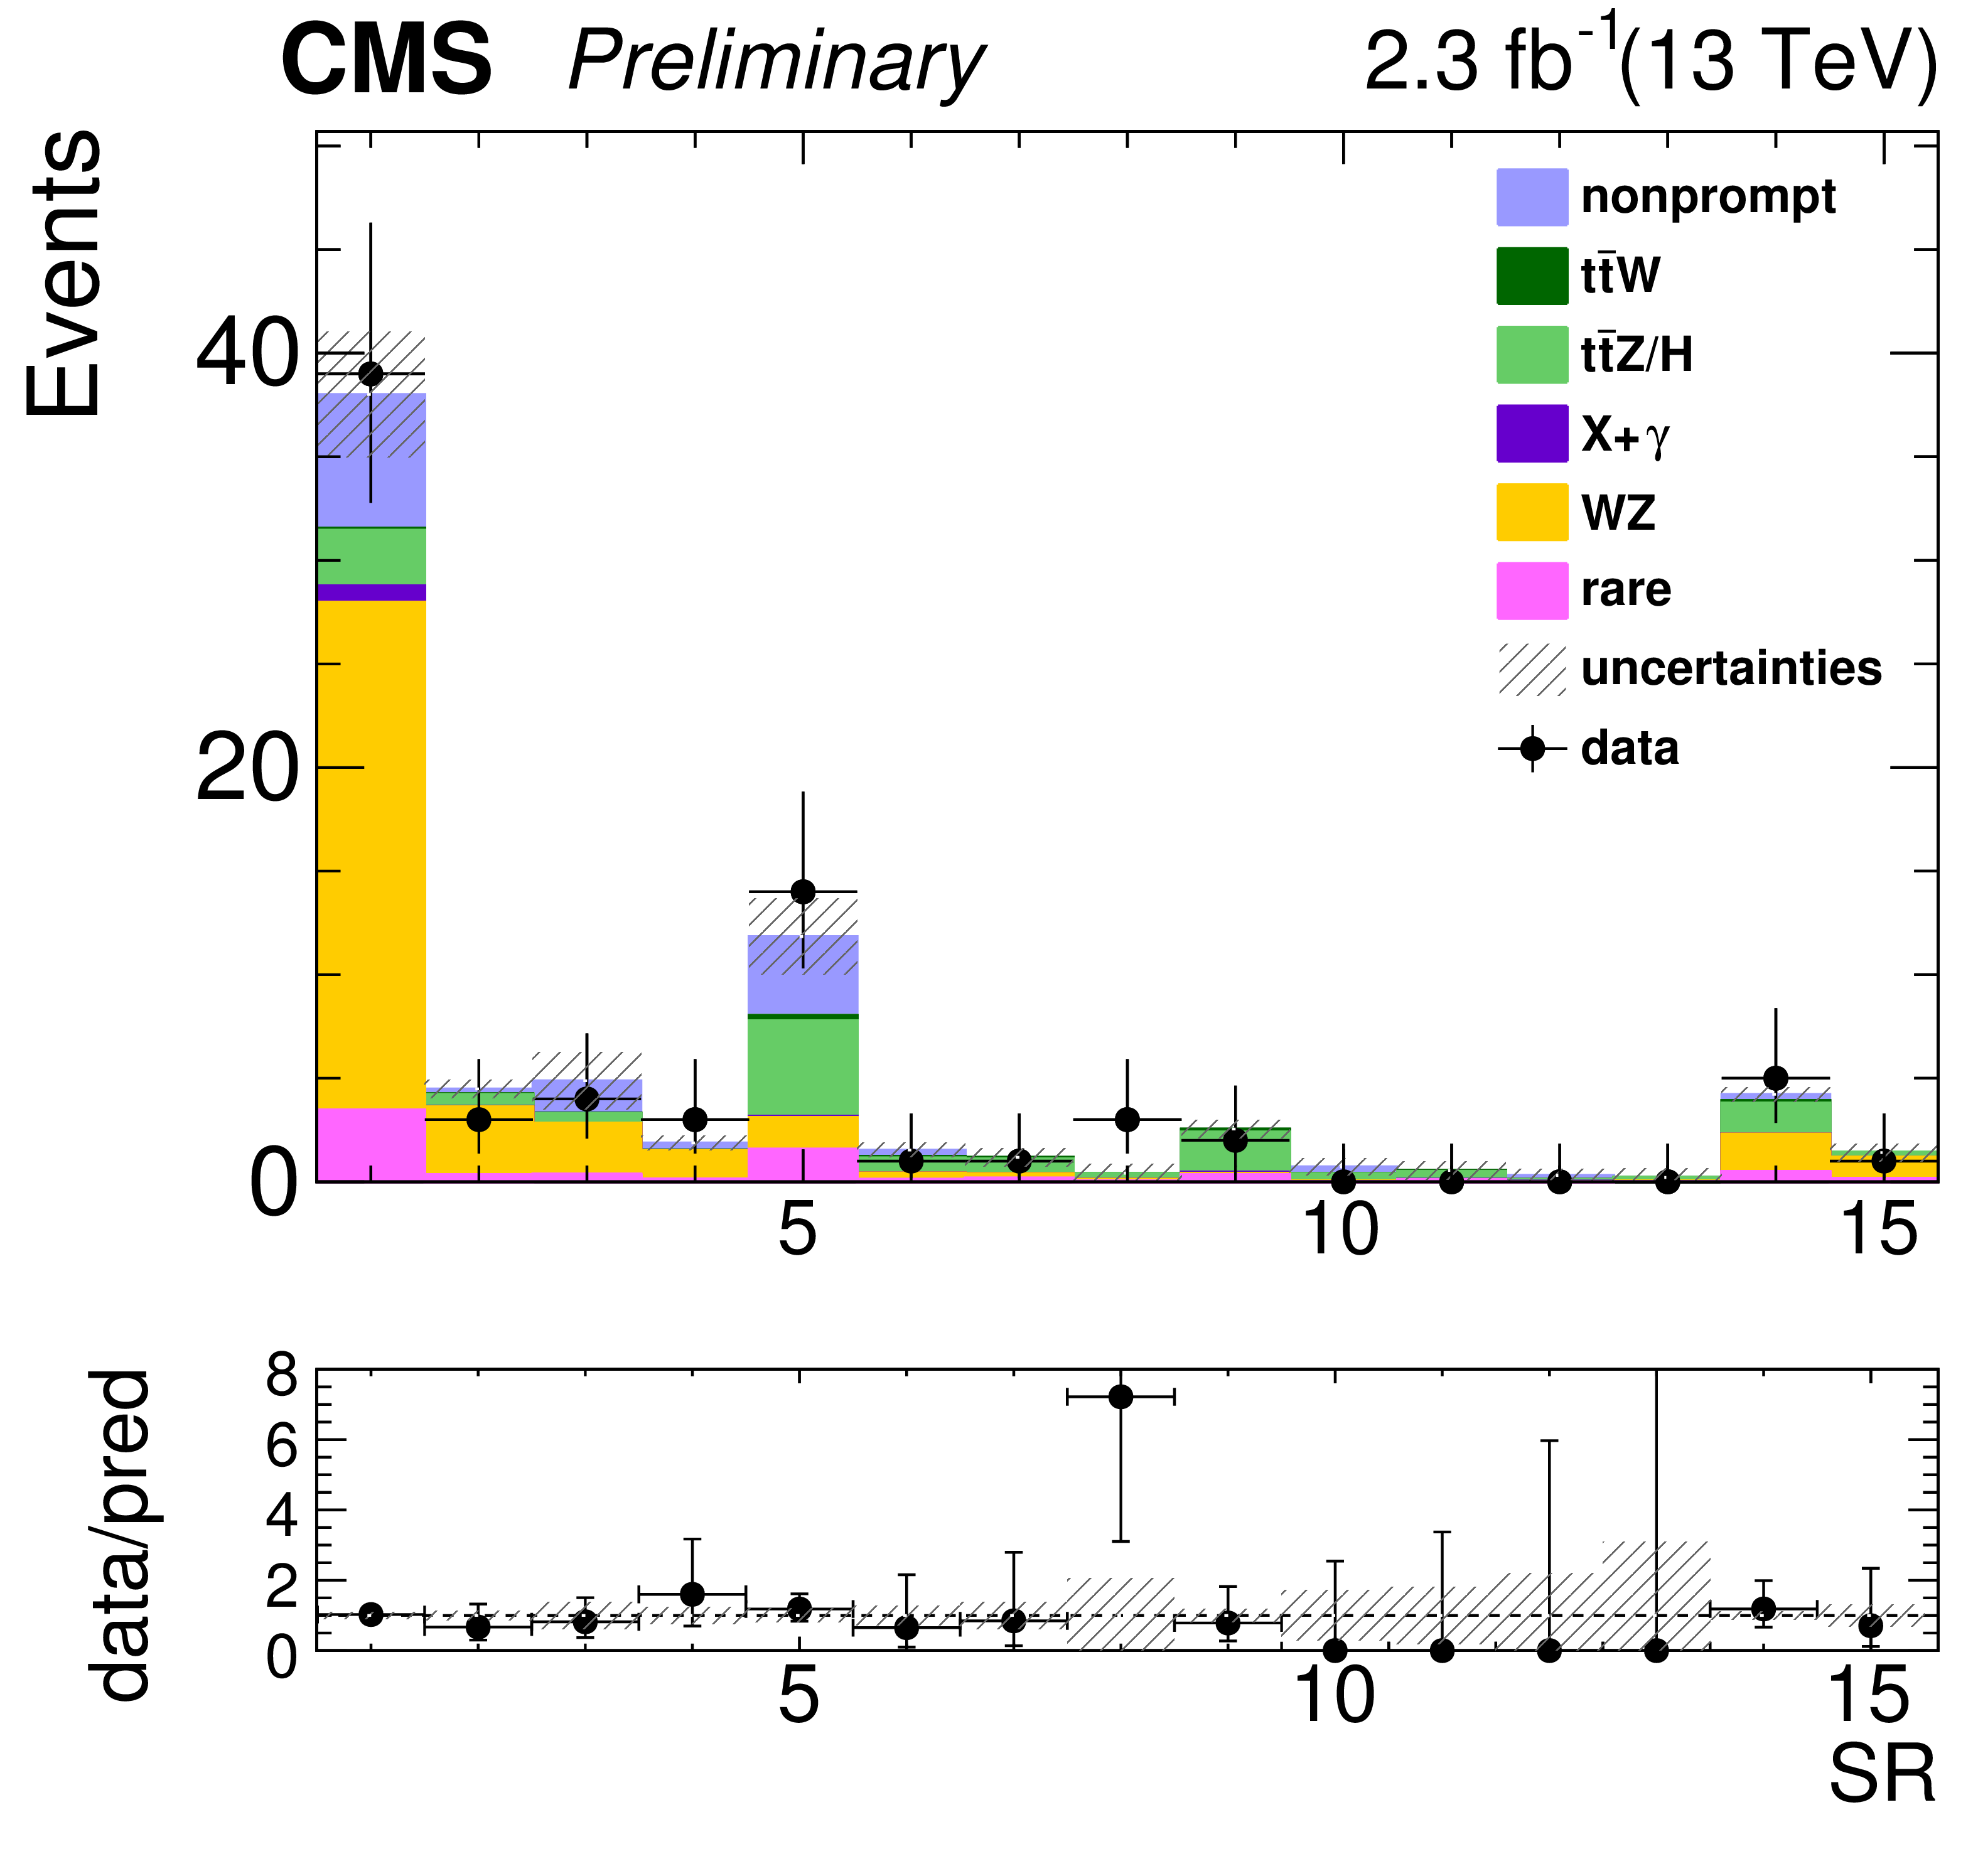
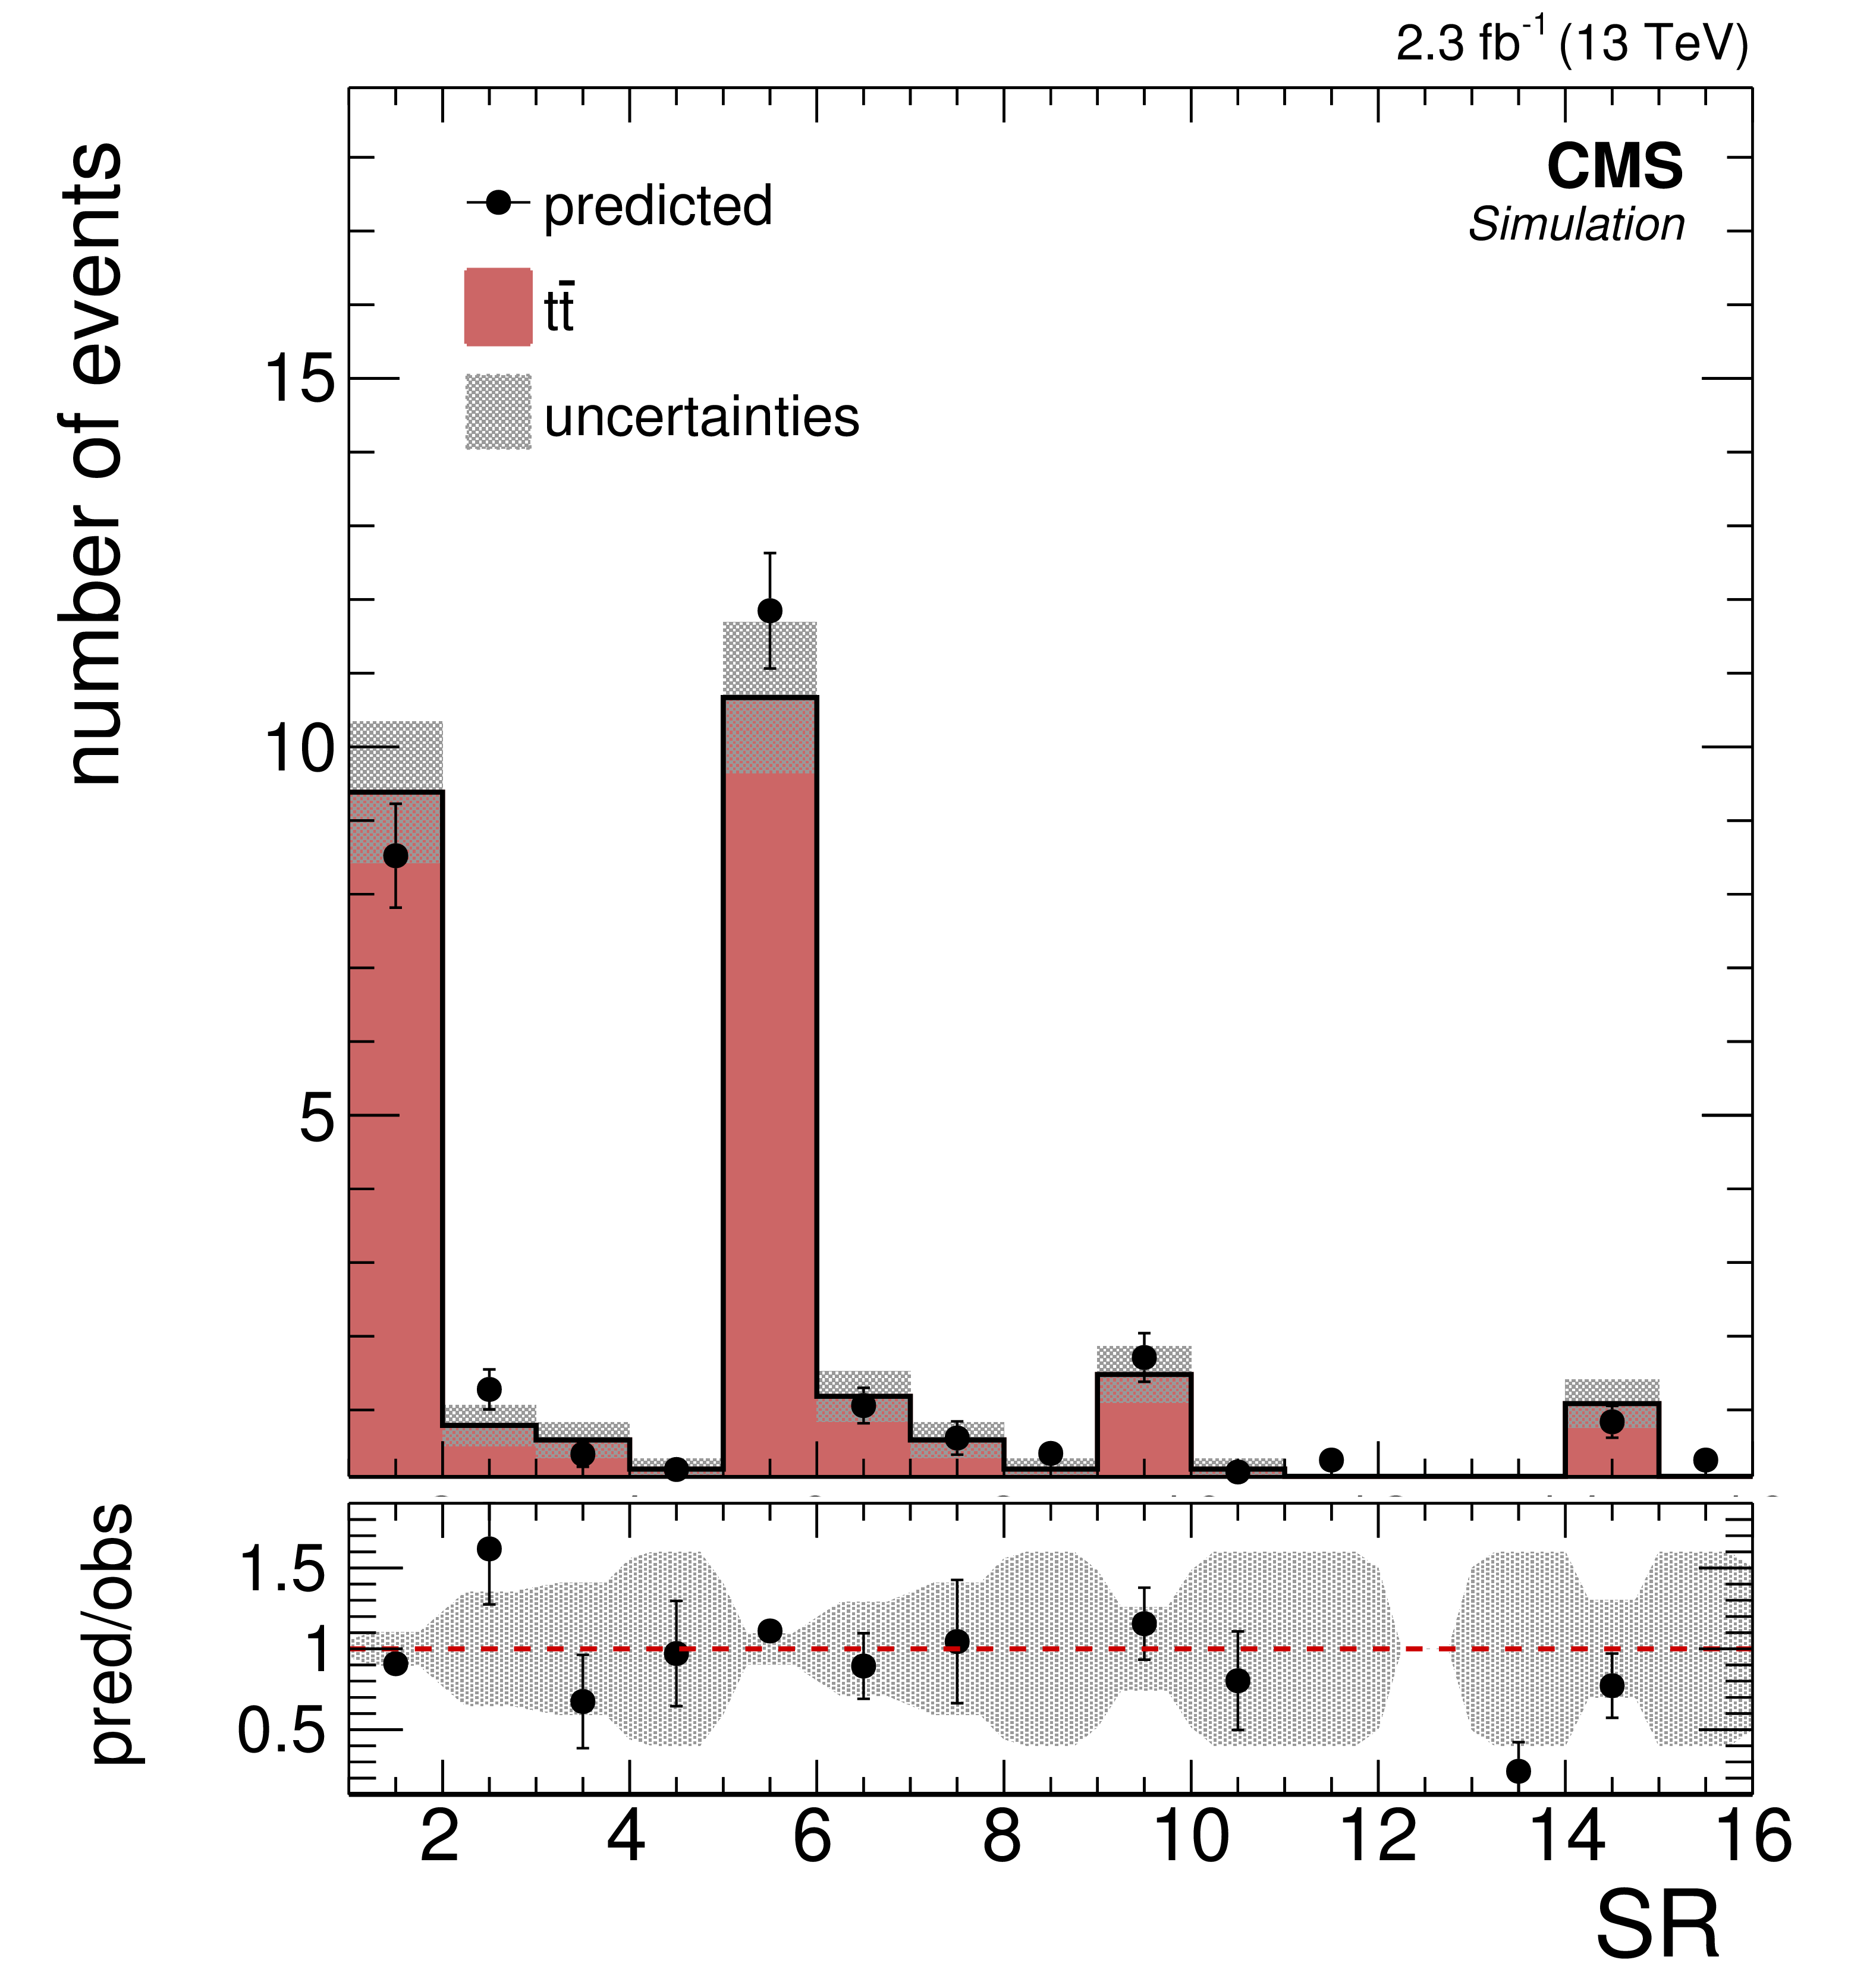
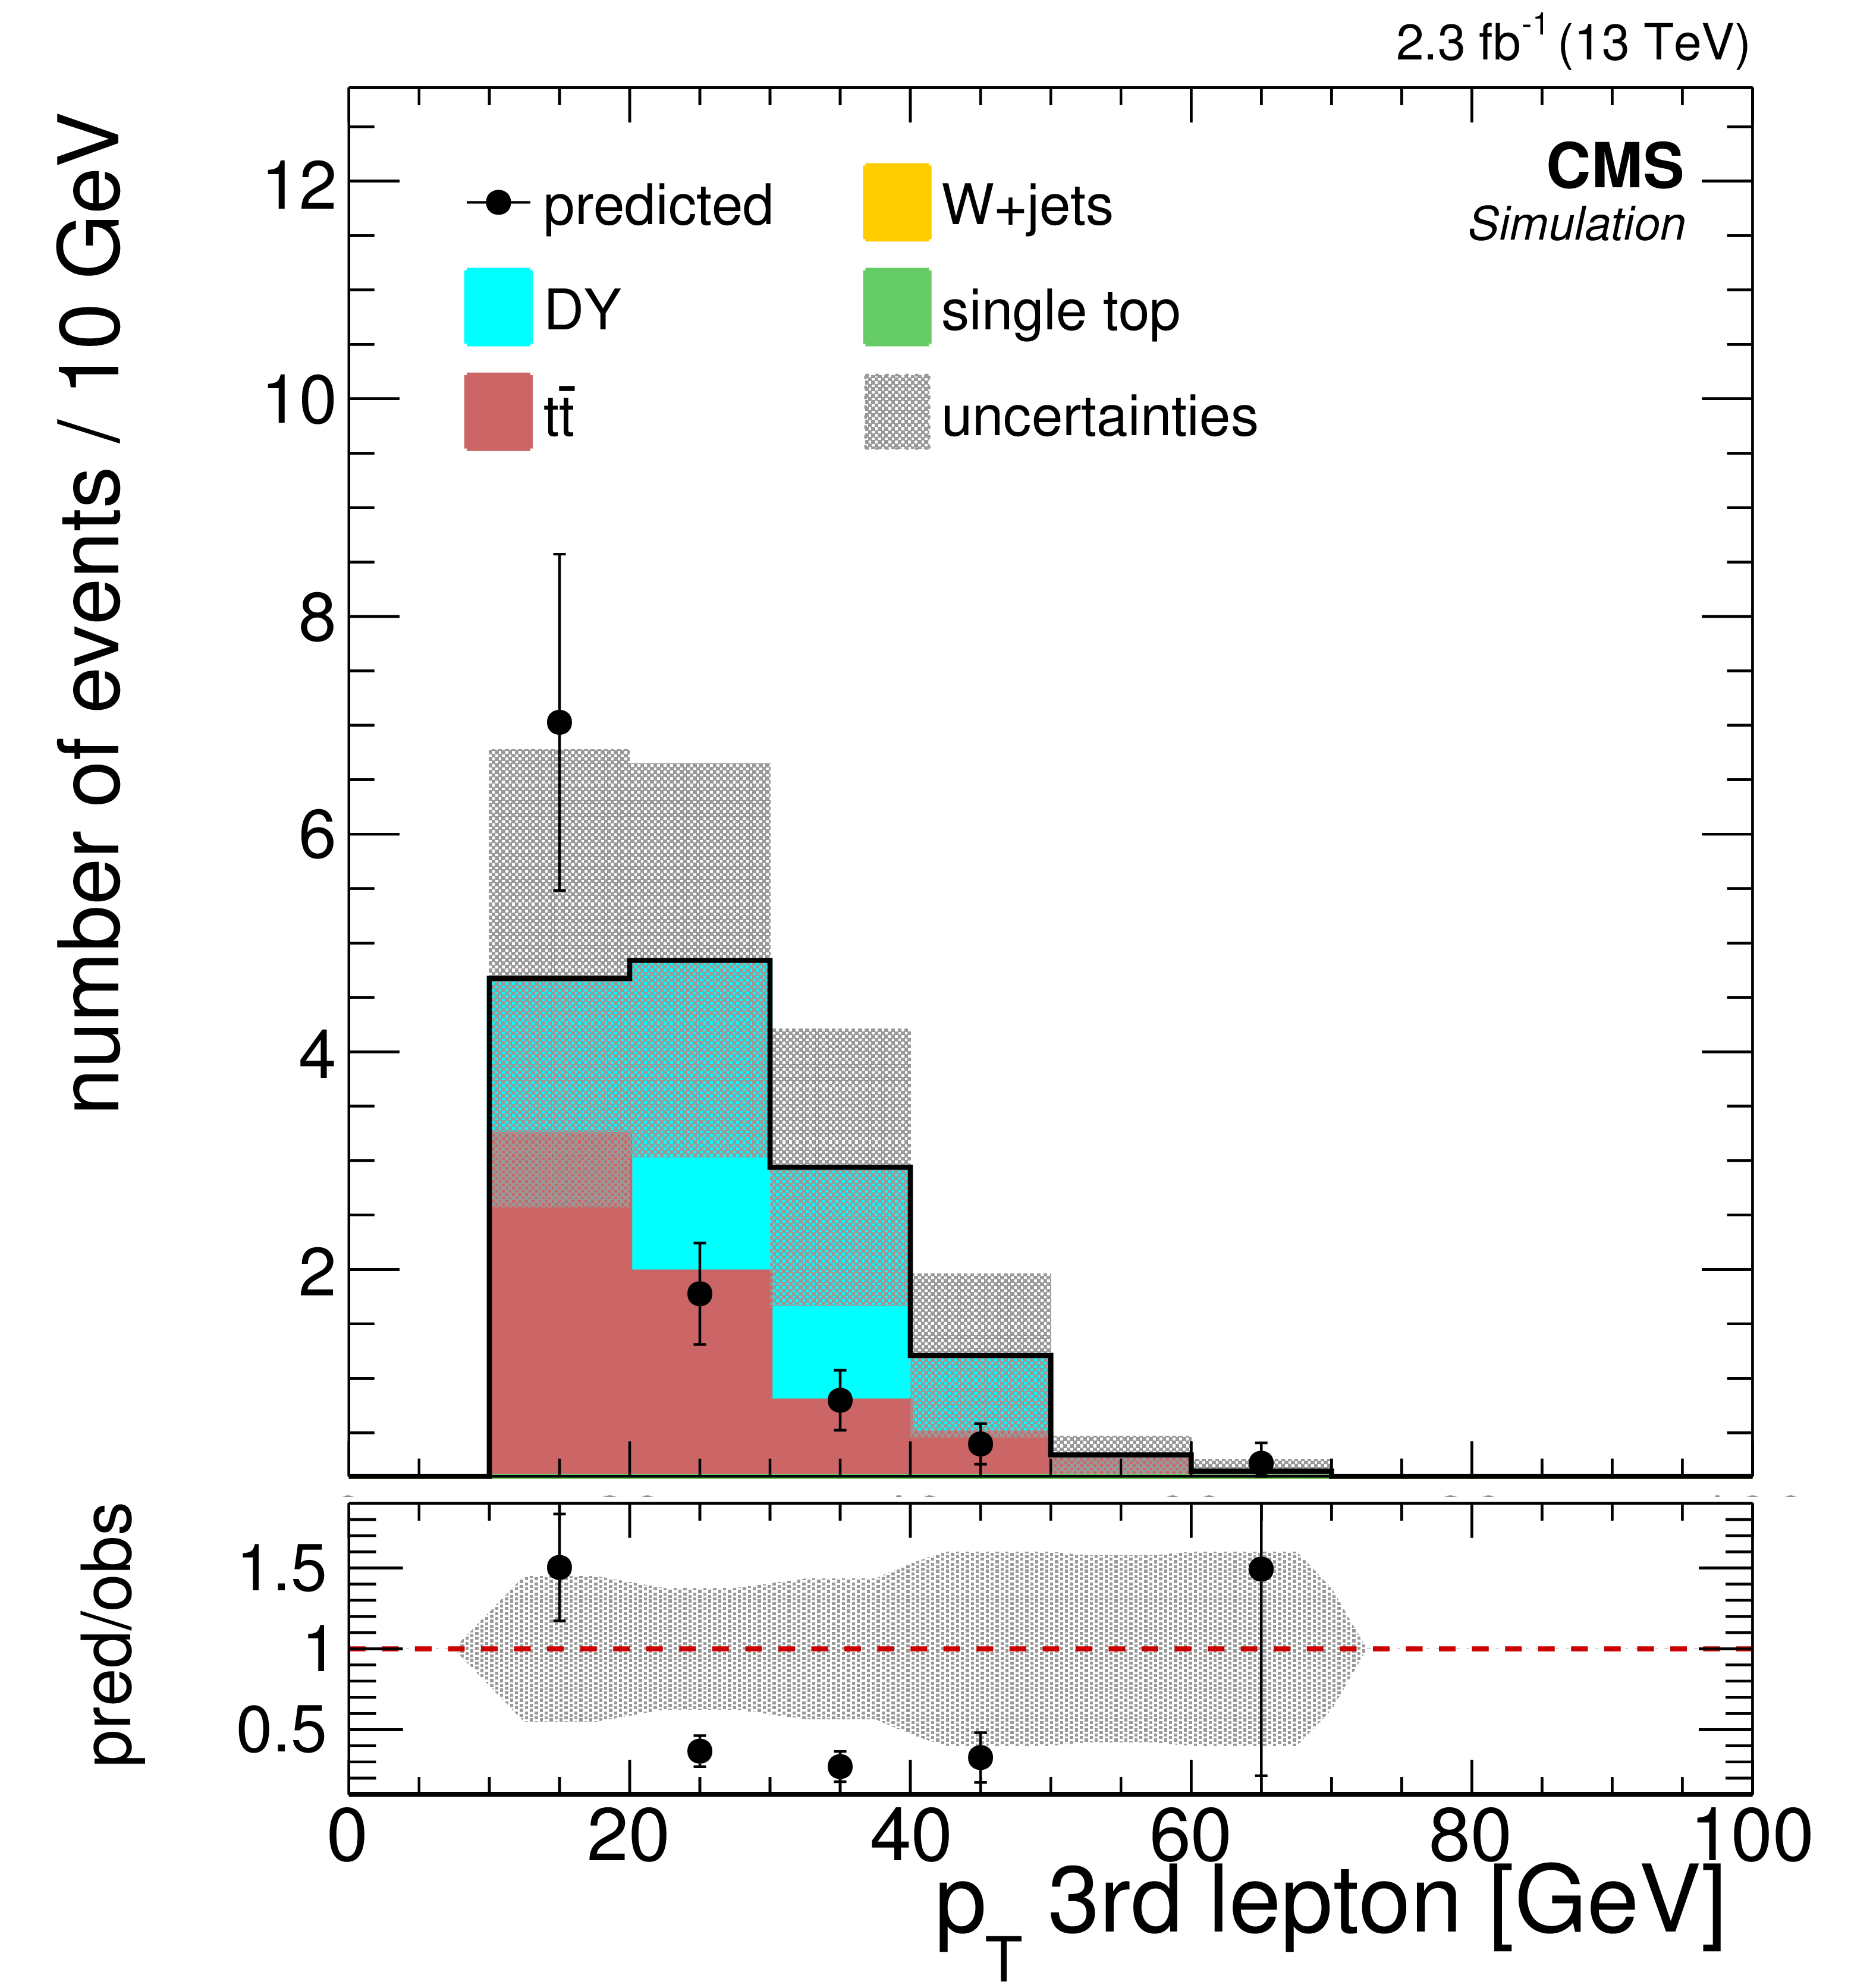
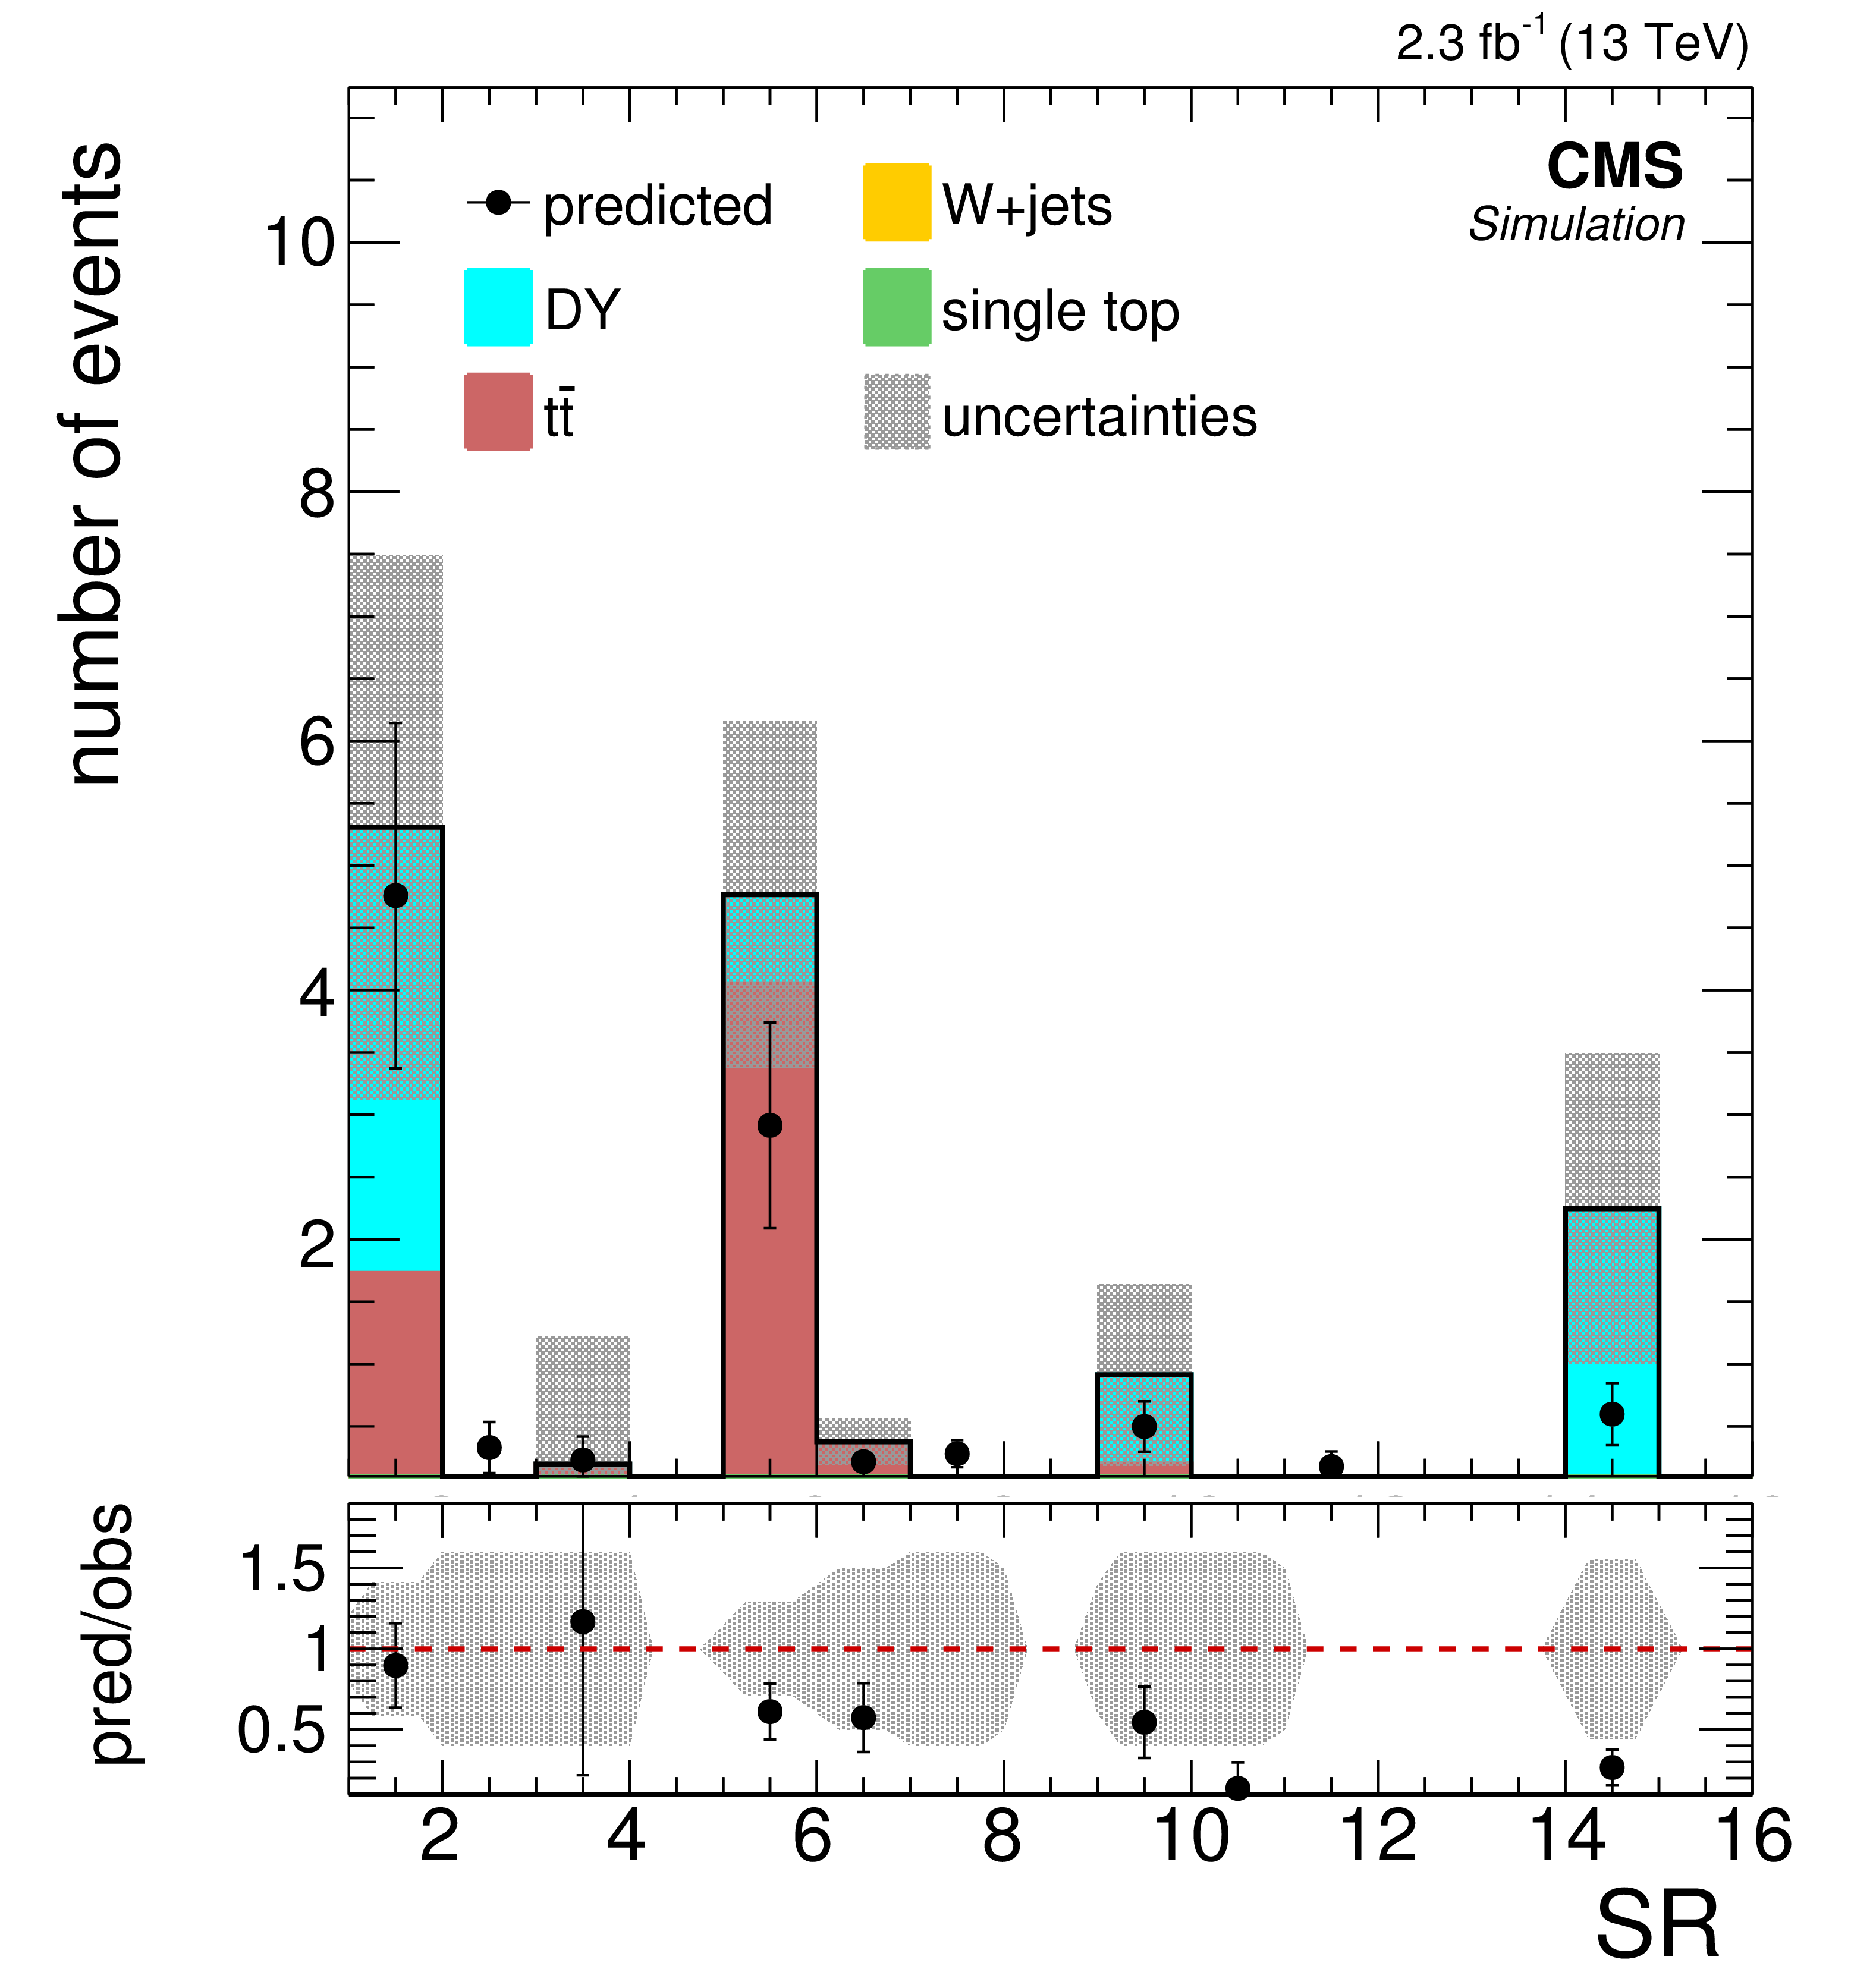
Figure 2-h:
Comparisons of the distributions of (a) $ {H_{\mathrm {T}}} $, (b) $ {E_{\mathrm {T}}^{\text {miss}}} $, (c) $ {N_\text {jets}} $, (d) $ {N_\text {b jets}} $, (e-g) $ {p_{\mathrm {T}}} $ of leptons for the background predictions to those observed in data in the off-Z baseline selection region. The nonprompt lepton backgrounds come from the data-driven technique described in Section 4. The total predicted background and number of events observed in 15 off-Z SRs is shown in (h). |
png pdf |
Figure 3-a:
Comparisons of the distributions of (a) $ {H_{\mathrm {T}}} $, (b) $ {E_{\mathrm {T}}^{\text {miss}}} $, (c) $ {N_\text {jets}} $, (d) $ {N_\text {b jets}} $, (e-g) $ {p_{\mathrm {T}}} $ of leptons for the background predictions to those observed in data in the on-Z baseline selection region. The nonprompt lepton backgrounds come from the data-driven technique described in Section 4. The total predicted background and number of events observed in 15 on-Z SRs is shown in (h). |

png pdf |
Figure 3-b:
Comparisons of the distributions of (a) $ {H_{\mathrm {T}}} $, (b) $ {E_{\mathrm {T}}^{\text {miss}}} $, (c) $ {N_\text {jets}} $, (d) $ {N_\text {b jets}} $, (e-g) $ {p_{\mathrm {T}}} $ of leptons for the background predictions to those observed in data in the on-Z baseline selection region. The nonprompt lepton backgrounds come from the data-driven technique described in Section 4. The total predicted background and number of events observed in 15 on-Z SRs is shown in (h). |

png pdf |
Figure 3-c:
Comparisons of the distributions of (a) $ {H_{\mathrm {T}}} $, (b) $ {E_{\mathrm {T}}^{\text {miss}}} $, (c) $ {N_\text {jets}} $, (d) $ {N_\text {b jets}} $, (e-g) $ {p_{\mathrm {T}}} $ of leptons for the background predictions to those observed in data in the on-Z baseline selection region. The nonprompt lepton backgrounds come from the data-driven technique described in Section 4. The total predicted background and number of events observed in 15 on-Z SRs is shown in (h). |
png pdf |
Figure 3-d:
Comparisons of the distributions of (a) $ {H_{\mathrm {T}}} $, (b) $ {E_{\mathrm {T}}^{\text {miss}}} $, (c) $ {N_\text {jets}} $, (d) $ {N_\text {b jets}} $, (e-g) $ {p_{\mathrm {T}}} $ of leptons for the background predictions to those observed in data in the on-Z baseline selection region. The nonprompt lepton backgrounds come from the data-driven technique described in Section 4. The total predicted background and number of events observed in 15 on-Z SRs is shown in (h). |
png pdf |
Figure 3-e:
Comparisons of the distributions of (a) $ {H_{\mathrm {T}}} $, (b) $ {E_{\mathrm {T}}^{\text {miss}}} $, (c) $ {N_\text {jets}} $, (d) $ {N_\text {b jets}} $, (e-g) $ {p_{\mathrm {T}}} $ of leptons for the background predictions to those observed in data in the on-Z baseline selection region. The nonprompt lepton backgrounds come from the data-driven technique described in Section 4. The total predicted background and number of events observed in 15 on-Z SRs is shown in (h). |
png pdf |
Figure 3-f:
Comparisons of the distributions of (a) $ {H_{\mathrm {T}}} $, (b) $ {E_{\mathrm {T}}^{\text {miss}}} $, (c) $ {N_\text {jets}} $, (d) $ {N_\text {b jets}} $, (e-g) $ {p_{\mathrm {T}}} $ of leptons for the background predictions to those observed in data in the on-Z baseline selection region. The nonprompt lepton backgrounds come from the data-driven technique described in Section 4. The total predicted background and number of events observed in 15 on-Z SRs is shown in (h). |
png pdf |
Figure 3-g:
Comparisons of the distributions of (a) $ {H_{\mathrm {T}}} $, (b) $ {E_{\mathrm {T}}^{\text {miss}}} $, (c) $ {N_\text {jets}} $, (d) $ {N_\text {b jets}} $, (e-g) $ {p_{\mathrm {T}}} $ of leptons for the background predictions to those observed in data in the on-Z baseline selection region. The nonprompt lepton backgrounds come from the data-driven technique described in Section 4. The total predicted background and number of events observed in 15 on-Z SRs is shown in (h). |
png pdf |
Figure 3-h:
Comparisons of the distributions of (a) $ {H_{\mathrm {T}}} $, (b) $ {E_{\mathrm {T}}^{\text {miss}}} $, (c) $ {N_\text {jets}} $, (d) $ {N_\text {b jets}} $, (e-g) $ {p_{\mathrm {T}}} $ of leptons for the background predictions to those observed in data in the on-Z baseline selection region. The nonprompt lepton backgrounds come from the data-driven technique described in Section 4. The total predicted background and number of events observed in 15 on-Z SRs is shown in (h). |

png pdf |
Figure 4:
Excluded region at 95% confidence in the $m(\tilde{ \chi }^0)$ versus $m(\tilde{ g })$ plane for the T1tttt simplified model. The color scale indicates the excluded cross section at a given point in the mass plane. The excluded regions are to the left and below the observed and expected limit curves. |

png pdf |
Figure 5:
Excluded region at 95% confidence in the $m(\tilde{ \chi }^{\pm})$ versus $m(\mathrm{ \tilde{ b } })$ plane for the T6ttWW simplified model. The color scale indicates the excluded cross section at a given point in the mass plane. The excluded regions are to the left and below the observed and expected limit curves. |

png pdf |
Figure 6:
Excluded region at 95% confidence in the $m(\tilde{ \chi }^0)$ versus $m(\tilde{ g })$ plane for the T5qqqqWZ simplified model. For this model the WW final state has been filtered out and the gluino-gluino cross section has been scaled down accordingly. The ZZ final state is neglected because of the low leptonic branching ratio. The color scale indicates the excluded cross section at a given point in the mass plane. The excluded regions are to the left and below the observed and expected limit curves. |
| Tables | |
png pdf |
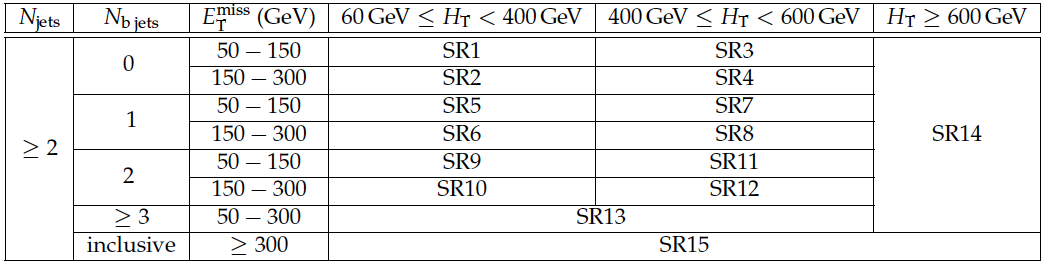
Table 1:
multilepton signal region definition |

png pdf |
Table 2:
Summary of the sources of uncertainties, their magnitude and their effects. The second column indicates the magnitude of the yield variation. The third column indicates if the source of the uncertainty implies a signal region to signal region migration. |
png pdf |
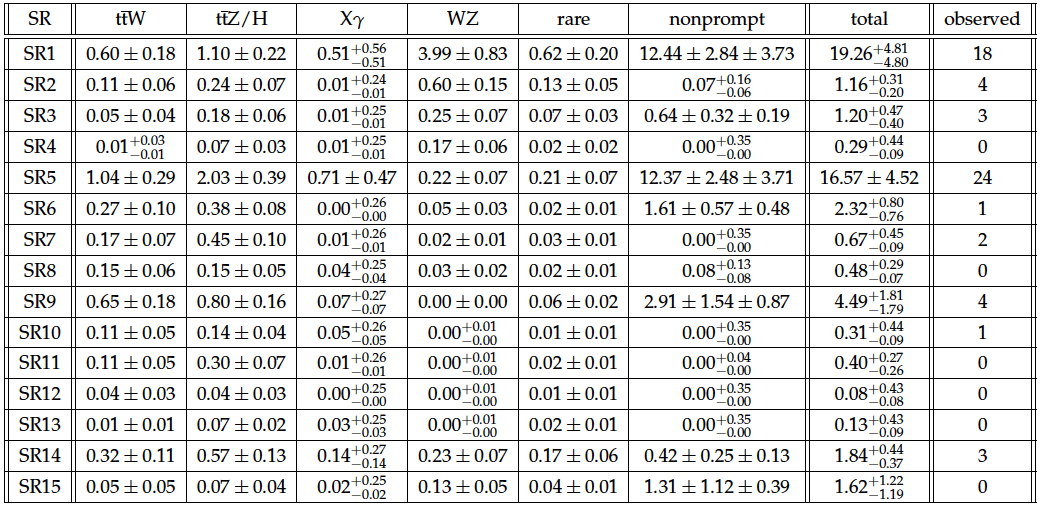
Table 3:
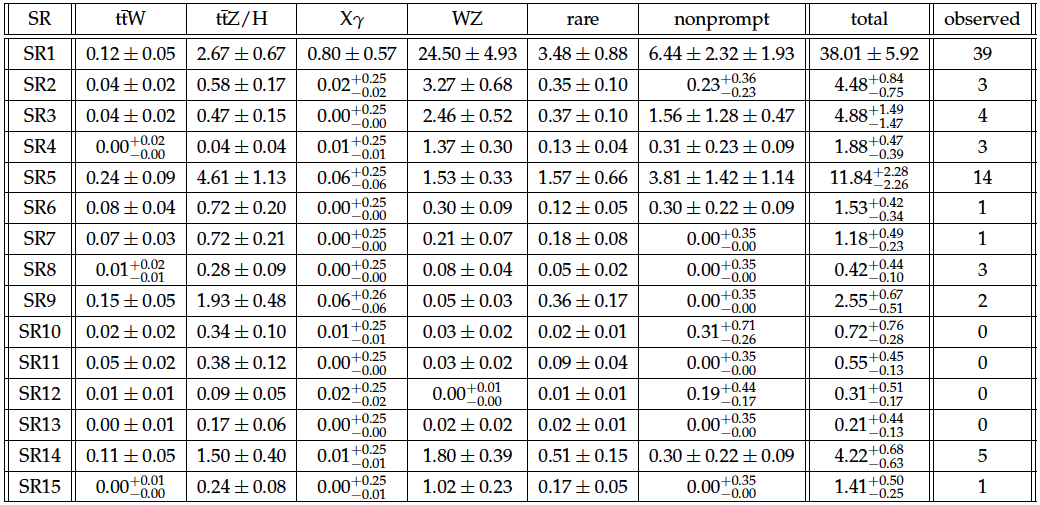
The yields for each background source in the off-Z search regions with the 2.3 fb$^{-1}$ of data. For the nonprompt background, the uncertainties are first statistical, then systematic. For the other backgrounds, the uncertainties are systematic, though this includes statistical uncertainties on the simulation samples. |
png pdf |
Table 4:
The yields for each background source in the on-Z search regions with the 2.3 fb$^{-1}$ of data. For the nonprompt background, the uncertainties are first statistical, then systematic. For the other backgrounds, the uncertainties are systematic, though this includes statistical uncertainties on the simulation samples. |
png pdf |
Table 5:
The total expected yields in the off-Z search regions with the 2.3fb$^{-1}$ of data. |

png pdf |
Table 6:
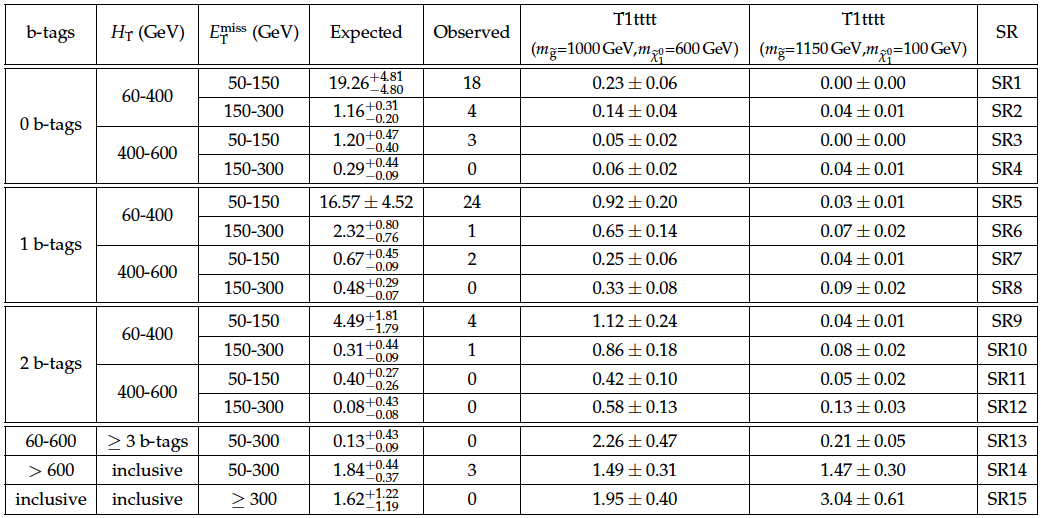
The total expected yields in the on-Z search regions with the 2.3fb$^{-1}$ of data and signal yields for the T5qqqqWZ model for two mass points. The mass points are characterized by the mass of the $ \tilde{g} $ and of the $ {\tilde{\chi}^0_1} $ in units of GeV. The mass of the $\tilde{ \chi }^{\pm} $ is fixed to $m_{\tilde{ \chi }^{\pm}} = 0.5 (m_{ \tilde{g} } - m_{ {\tilde{\chi}^0_1} })$. |
| Auxiliary Figures | |

png pdf |
Auxiliary Figure 1-a:
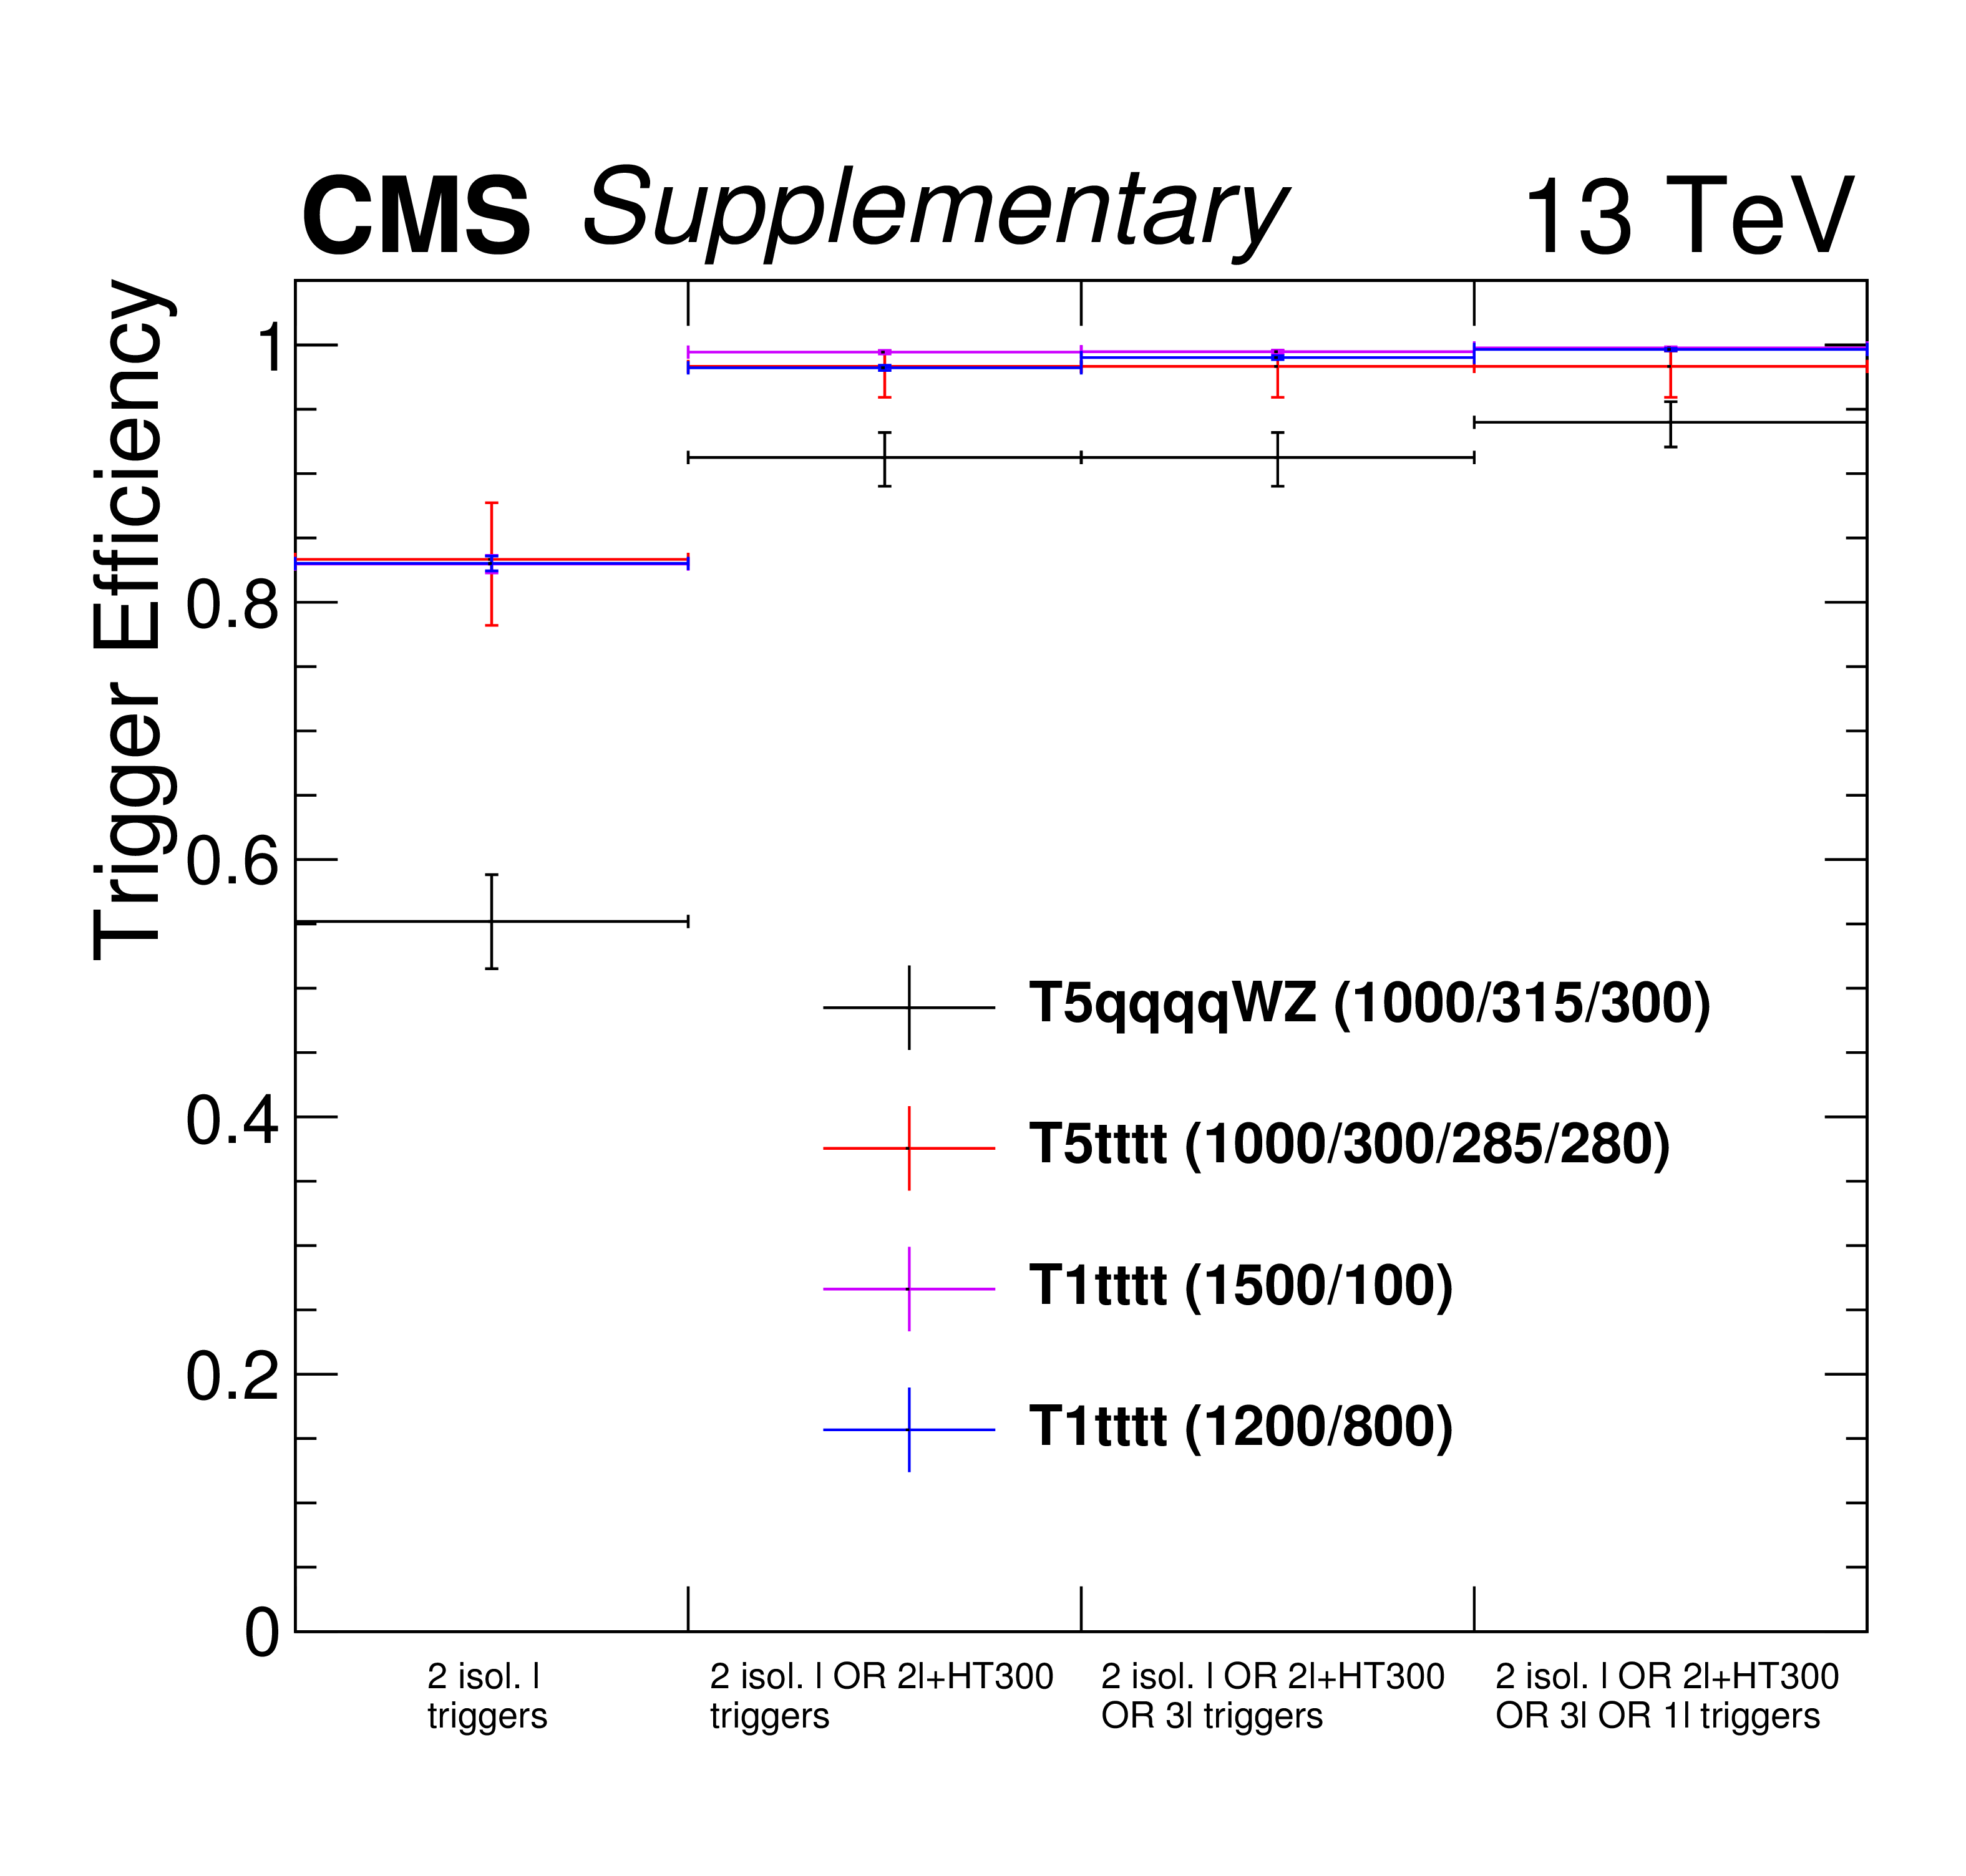
Trigger efficiency for various signal models and offline selections. Various trigger sets are tested (see the text). The events passing the denominator are required to have 3 reconstructed leptons matching generated leptons and passing a loose isolation cut with $ {p_{\mathrm {T}}} >$ 5 GeV (a) or with $ {p_{\mathrm {T}}} >$ 20-15-10 GeV (b). The efficiency is also shown for events containing three leptons passing the full offline selection used in this analysis (c). |
png pdf |
Auxiliary Figure 1-b:
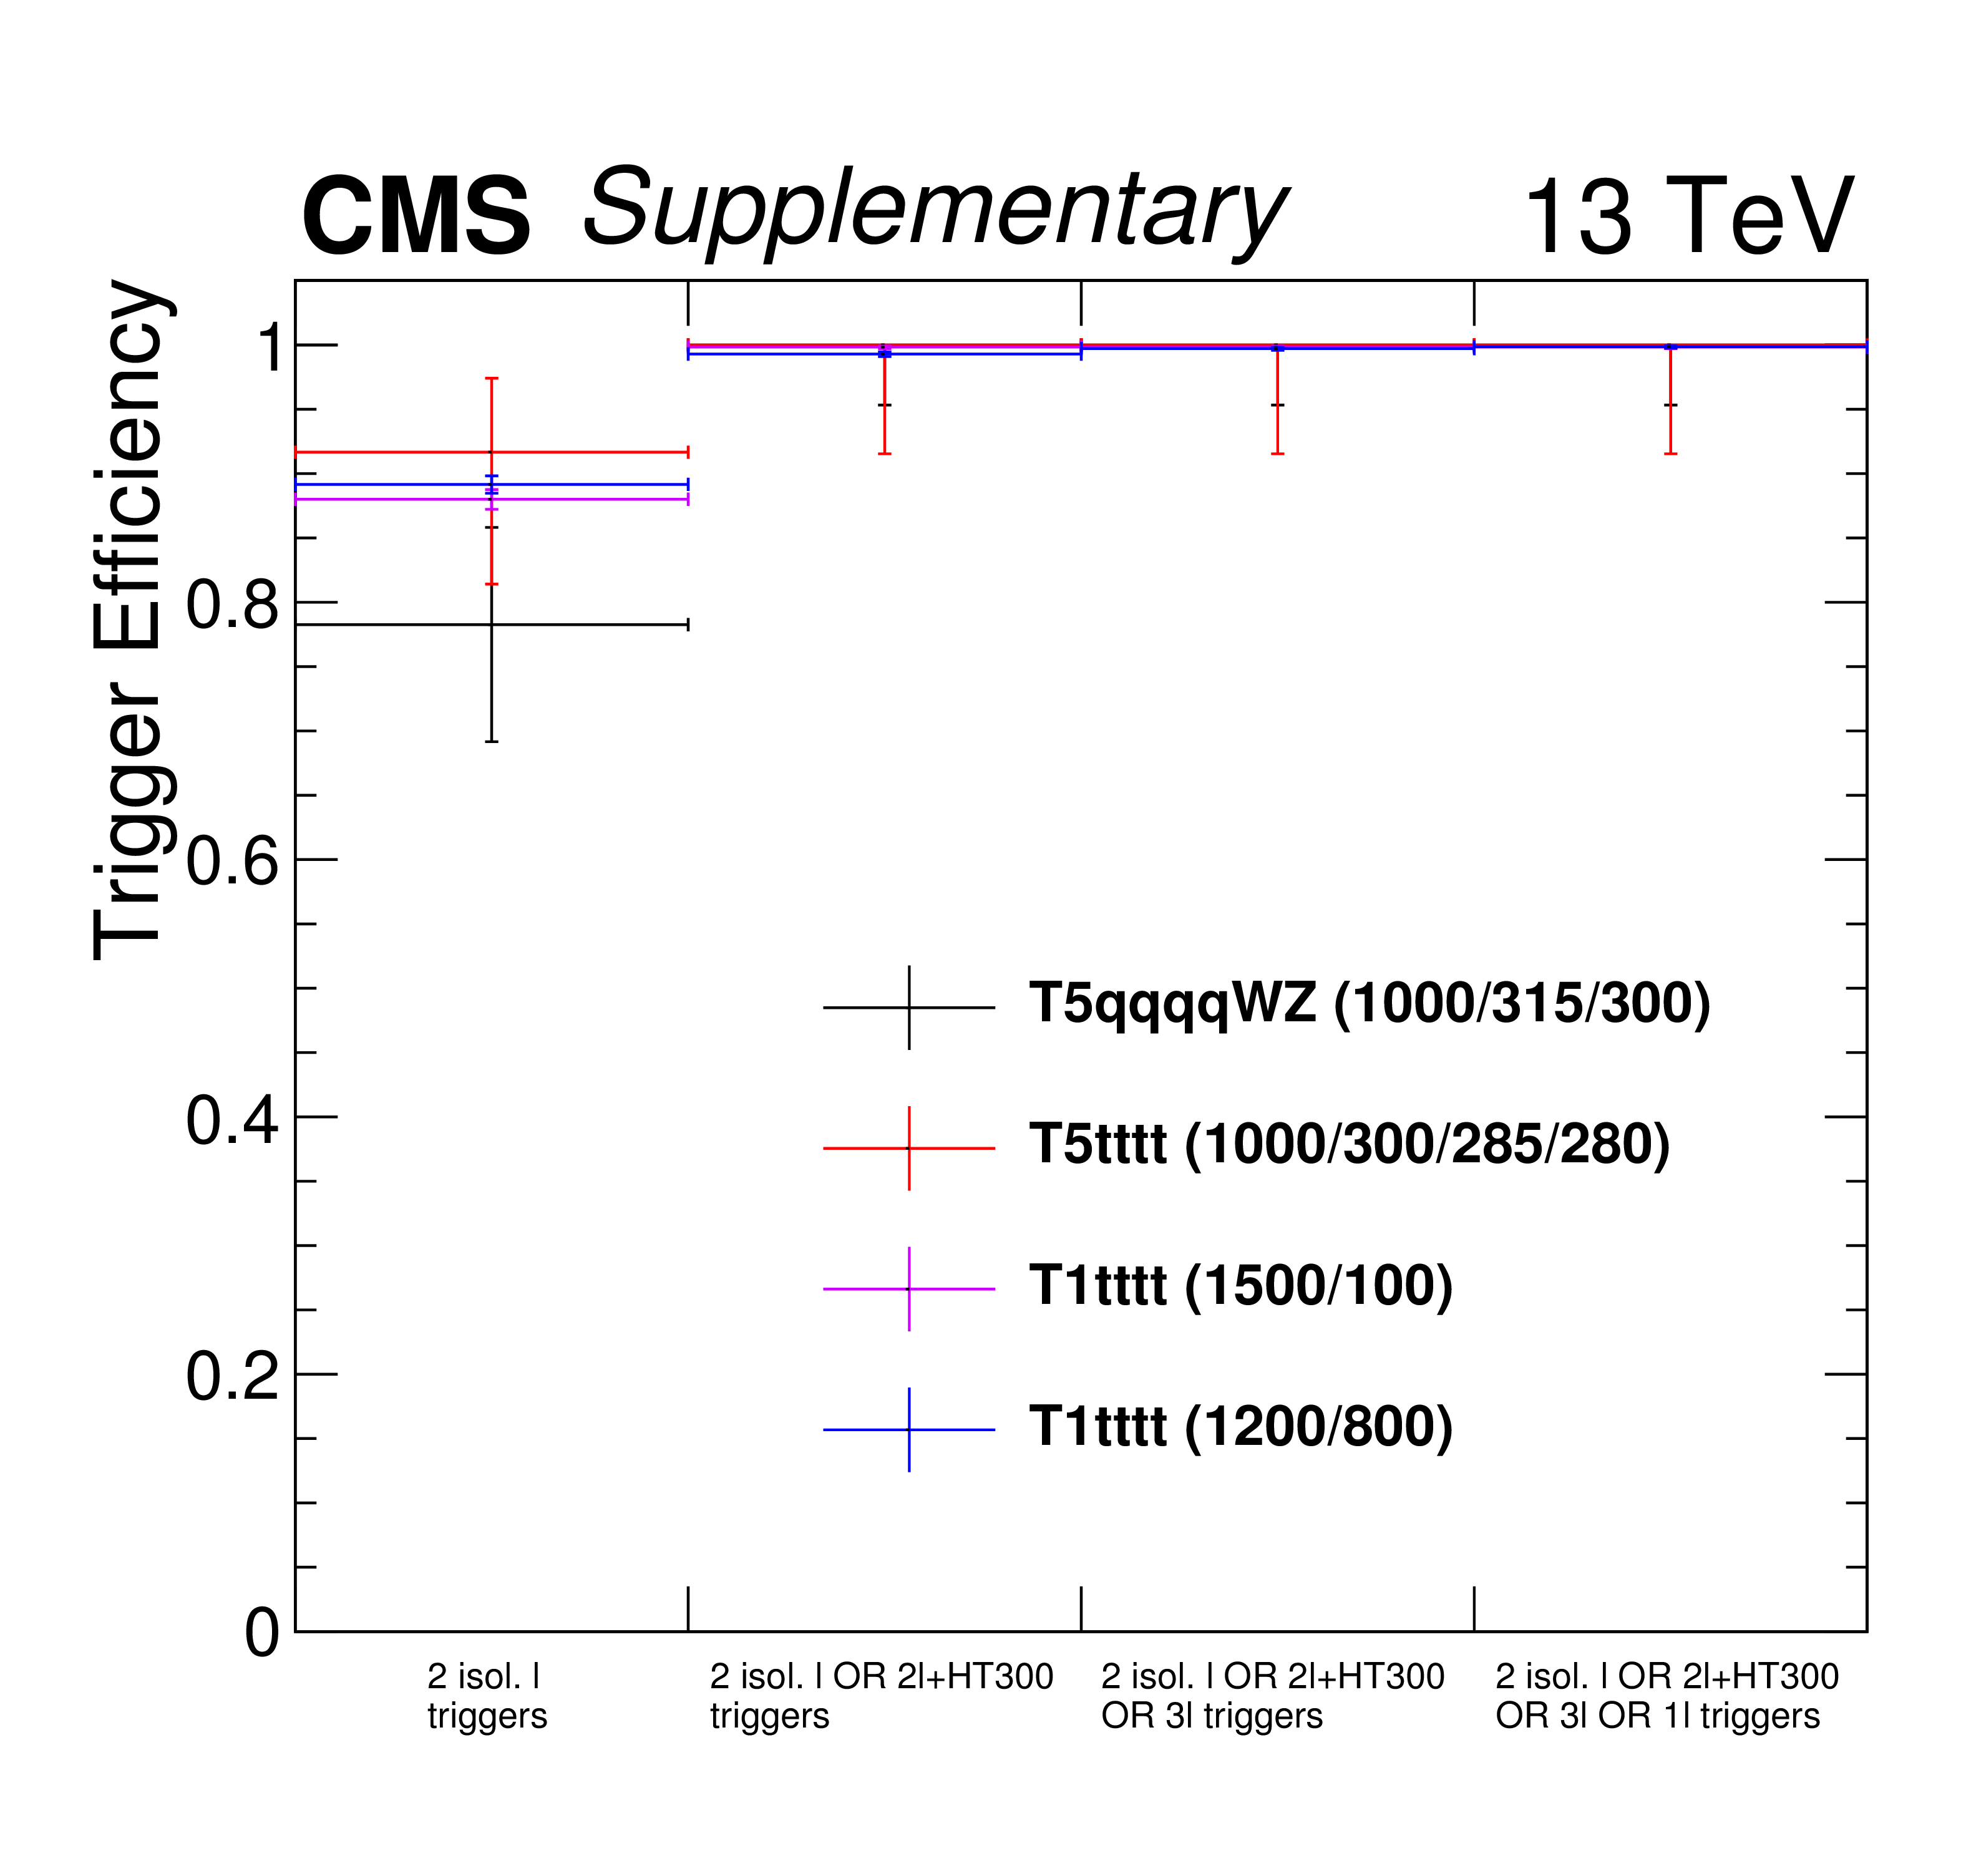
Trigger efficiency for various signal models and offline selections. Various trigger sets are tested (see the text). The events passing the denominator are required to have 3 reconstructed leptons matching generated leptons and passing a loose isolation cut with $ {p_{\mathrm {T}}} >$ 5 GeV (a) or with $ {p_{\mathrm {T}}} >$ 20-15-10 GeV (b). The efficiency is also shown for events containing three leptons passing the full offline selection used in this analysis (c). |
png pdf |
Auxiliary Figure 1-c:
Trigger efficiency for various signal models and offline selections. Various trigger sets are tested (see the text). The events passing the denominator are required to have 3 reconstructed leptons matching generated leptons and passing a loose isolation cut with $ {p_{\mathrm {T}}} >$ 5 GeV (a) or with $ {p_{\mathrm {T}}} >$ 20-15-10 GeV (b). The efficiency is also shown for events containing three leptons passing the full offline selection used in this analysis (c). |

png |
Auxiliary Figure 2-a:
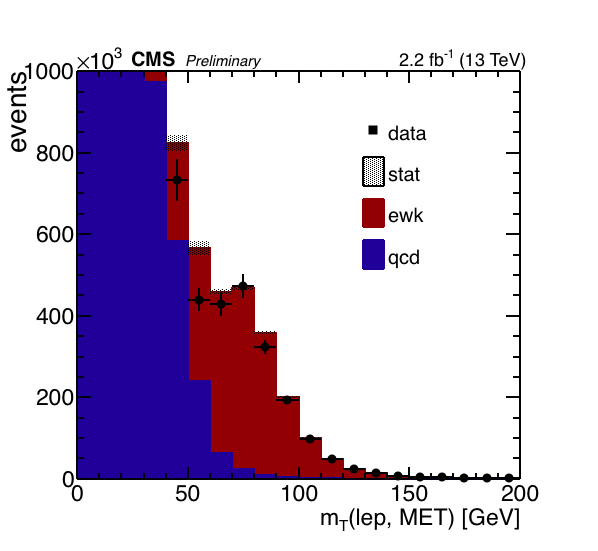
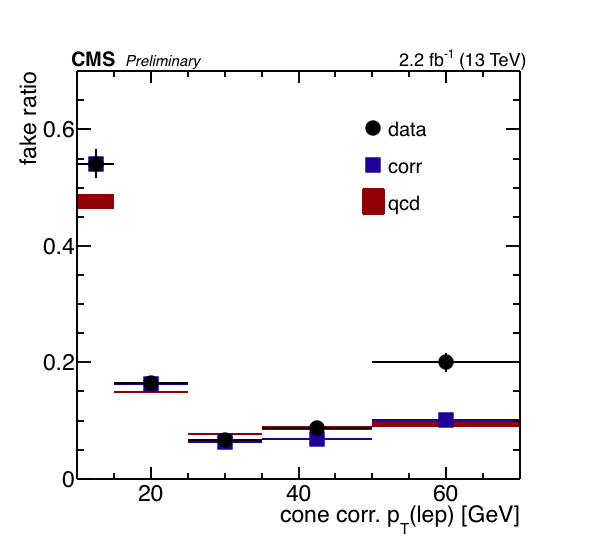
Fake rate measurement and correction for non-isolated muons. Uncorrected fake rate in data (a) and EWK normalization control region (b). EWK-subtracted data fake rate in 2D (c) and projected vs $ {p_{\mathrm {T}}} $ (d). Measurement with 2.2 fb$^{-1}$ of data, uncertainties are statistical only. |
png |
Auxiliary Figure 2-b:
Fake rate measurement and correction for non-isolated muons. Uncorrected fake rate in data (a) and EWK normalization control region (b). EWK-subtracted data fake rate in 2D (c) and projected vs $ {p_{\mathrm {T}}} $ (d). Measurement with 2.2 fb$^{-1}$ of data, uncertainties are statistical only. |

png |
Auxiliary Figure 2-c:
Fake rate measurement and correction for non-isolated muons. Uncorrected fake rate in data (a) and EWK normalization control region (b). EWK-subtracted data fake rate in 2D (c) and projected vs $ {p_{\mathrm {T}}} $ (d). Measurement with 2.2 fb$^{-1}$ of data, uncertainties are statistical only. |
png |
Auxiliary Figure 2-d:
Fake rate measurement and correction for non-isolated muons. Uncorrected fake rate in data (a) and EWK normalization control region (b). EWK-subtracted data fake rate in 2D (c) and projected vs $ {p_{\mathrm {T}}} $ (d). Measurement with 2.2 fb$^{-1}$ of data, uncertainties are statistical only. |

png |
Auxiliary Figure 3-a:
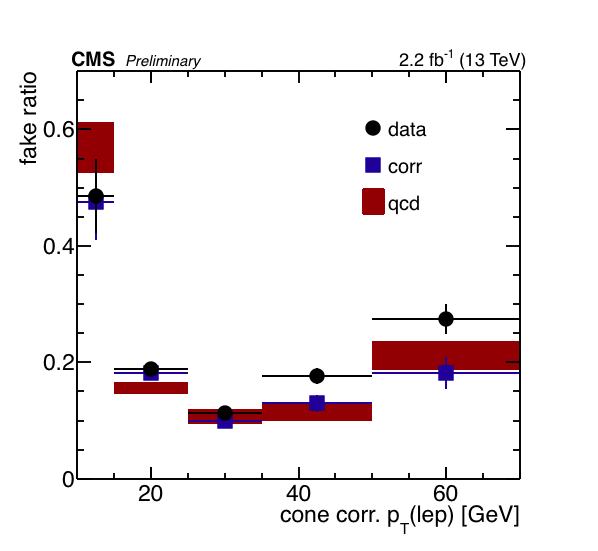
Fake rate measurement and correction for non-isolated electrons. Uncorrected fake rate in data (a) and EWK normalization control region (b). EWK-subtracted data fake rate in 2D (c) and projected vs $ {p_{\mathrm {T}}} $ (d). Measurement with 2.2 fb$^{-1}$ of data, uncertainties are statistical only. |

png |
Auxiliary Figure 3-b:
Fake rate measurement and correction for non-isolated electrons. Uncorrected fake rate in data (a) and EWK normalization control region (b). EWK-subtracted data fake rate in 2D (c) and projected vs $ {p_{\mathrm {T}}} $ (d). Measurement with 2.2 fb$^{-1}$ of data, uncertainties are statistical only. |

png |
Auxiliary Figure 3-c:
Fake rate measurement and correction for non-isolated electrons. Uncorrected fake rate in data (a) and EWK normalization control region (b). EWK-subtracted data fake rate in 2D (c) and projected vs $ {p_{\mathrm {T}}} $ (d). Measurement with 2.2 fb$^{-1}$ of data, uncertainties are statistical only. |
png |
Auxiliary Figure 3-d:
Fake rate measurement and correction for non-isolated electrons. Uncorrected fake rate in data (a) and EWK normalization control region (b). EWK-subtracted data fake rate in 2D (c) and projected vs $ {p_{\mathrm {T}}} $ (d). Measurement with 2.2 fb$^{-1}$ of data, uncertainties are statistical only. |

png pdf |
Auxiliary Figure 4-a:
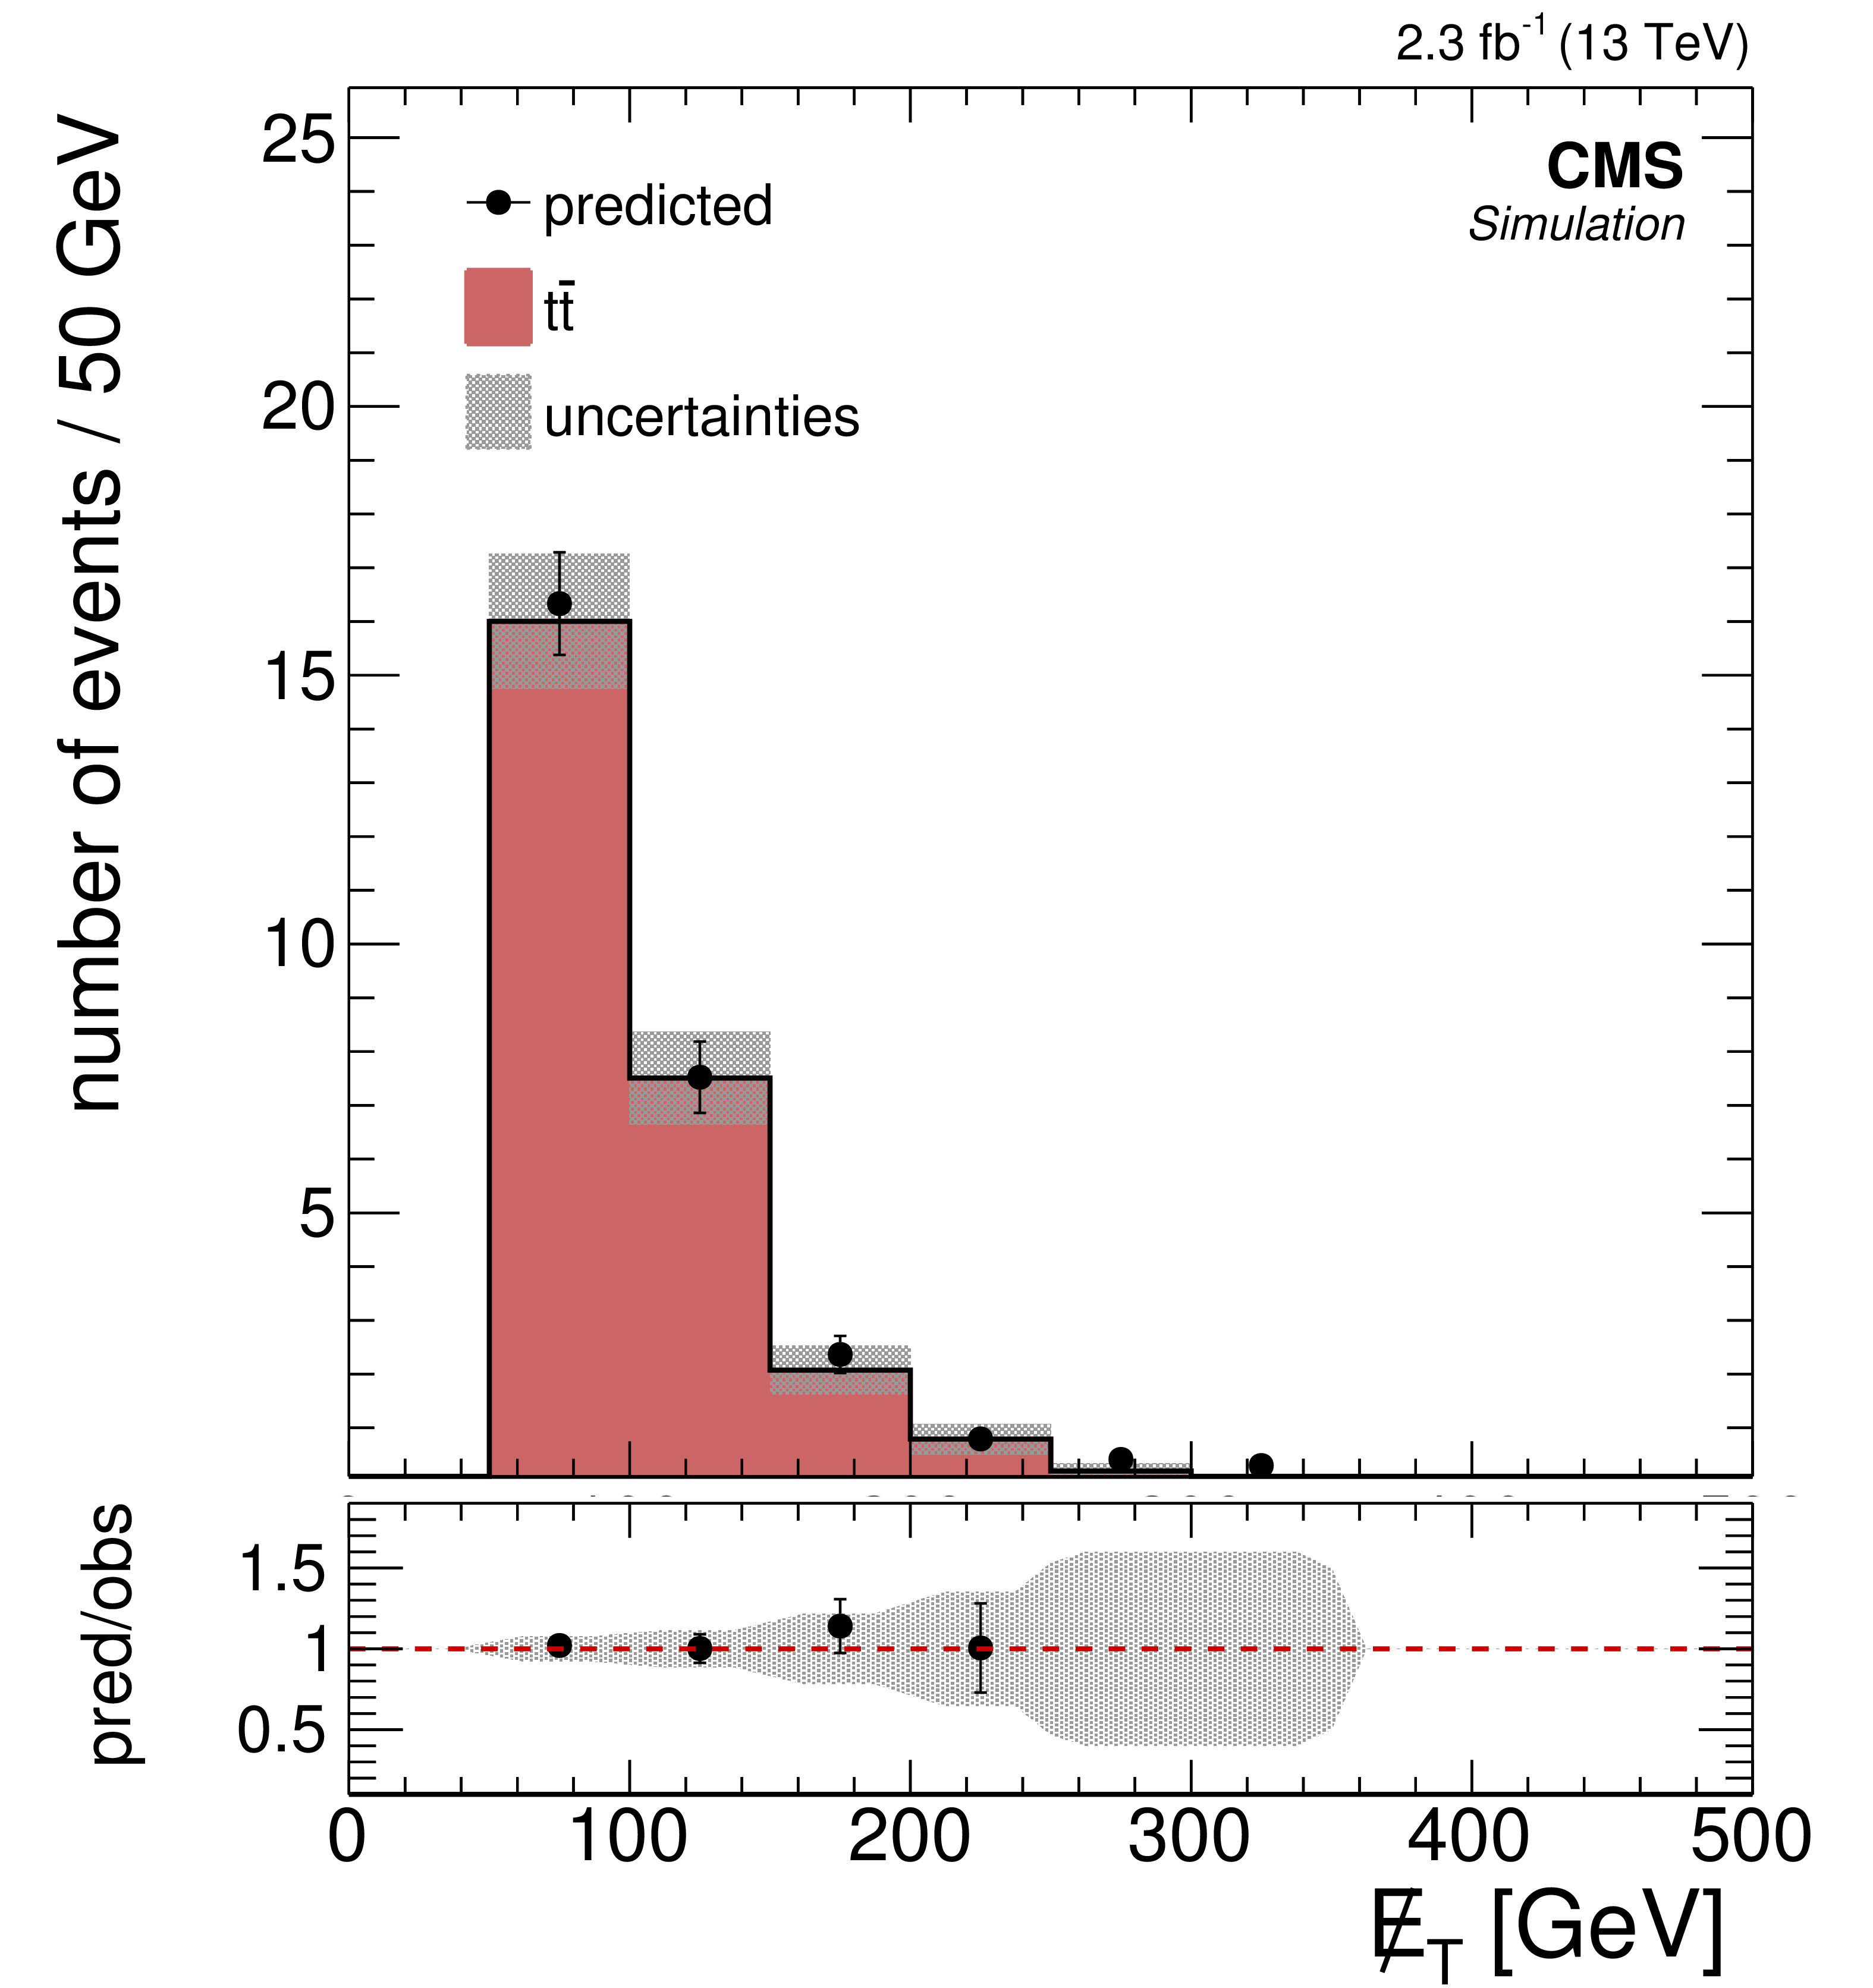
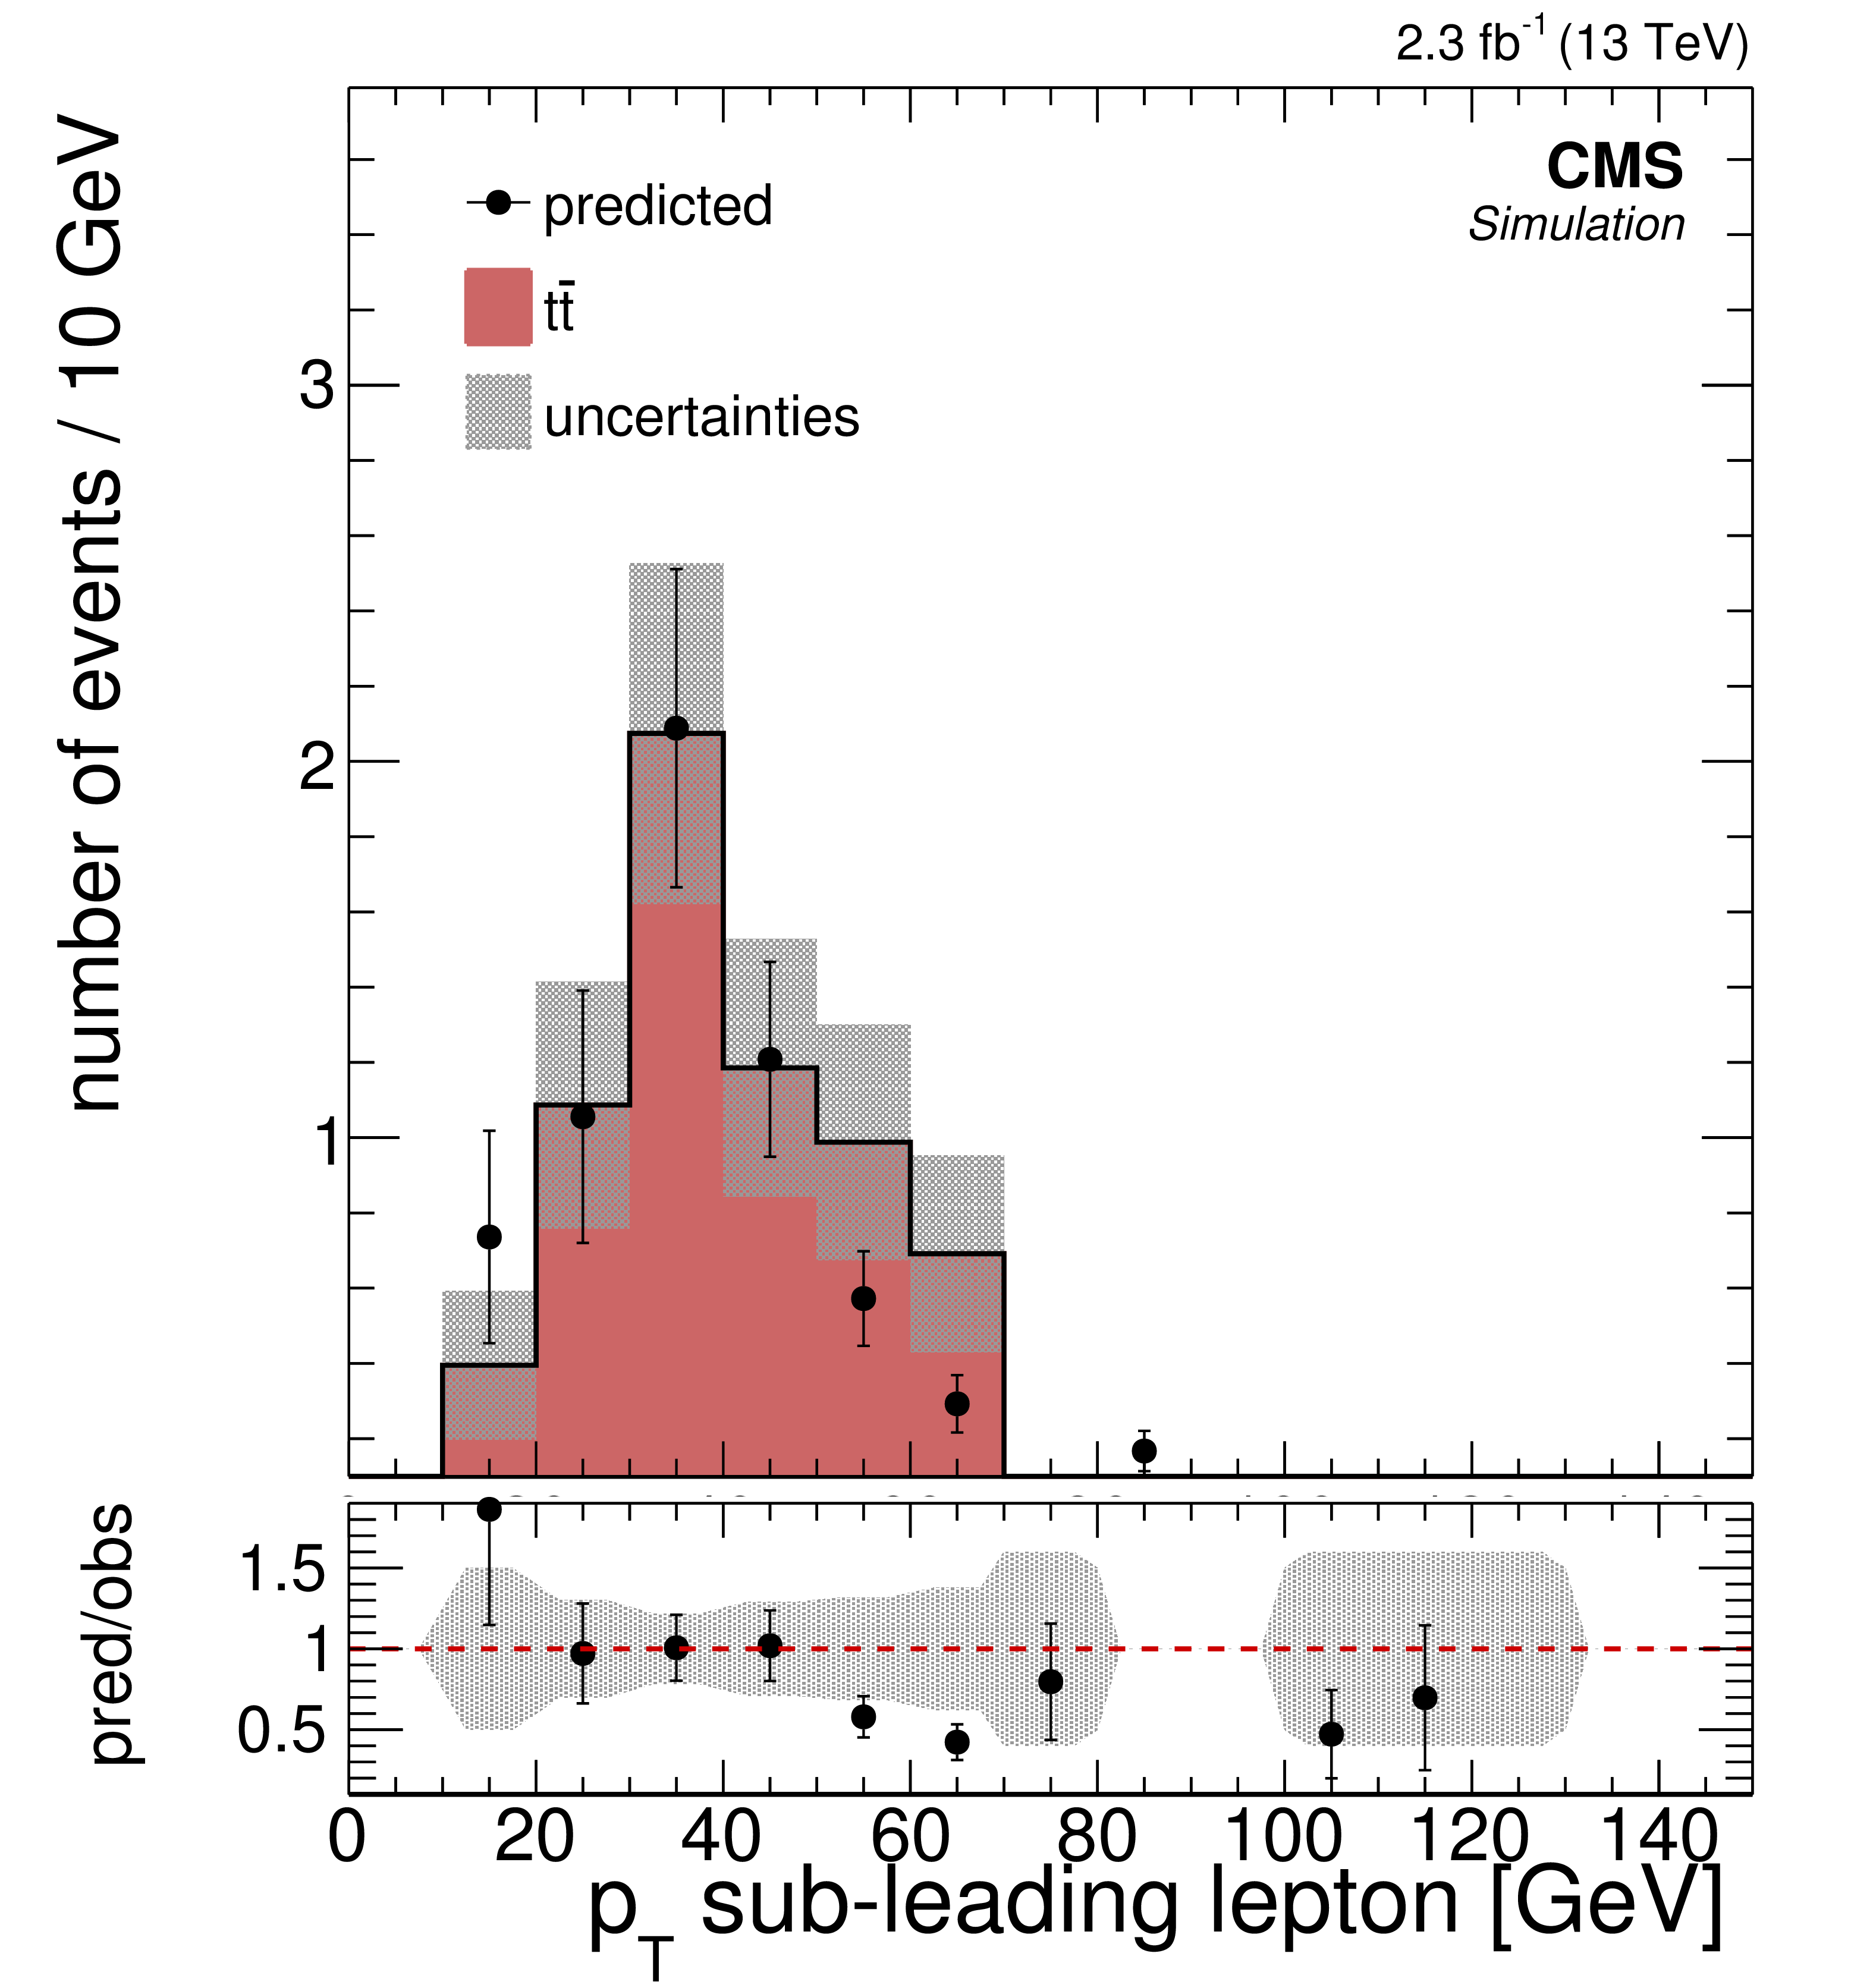
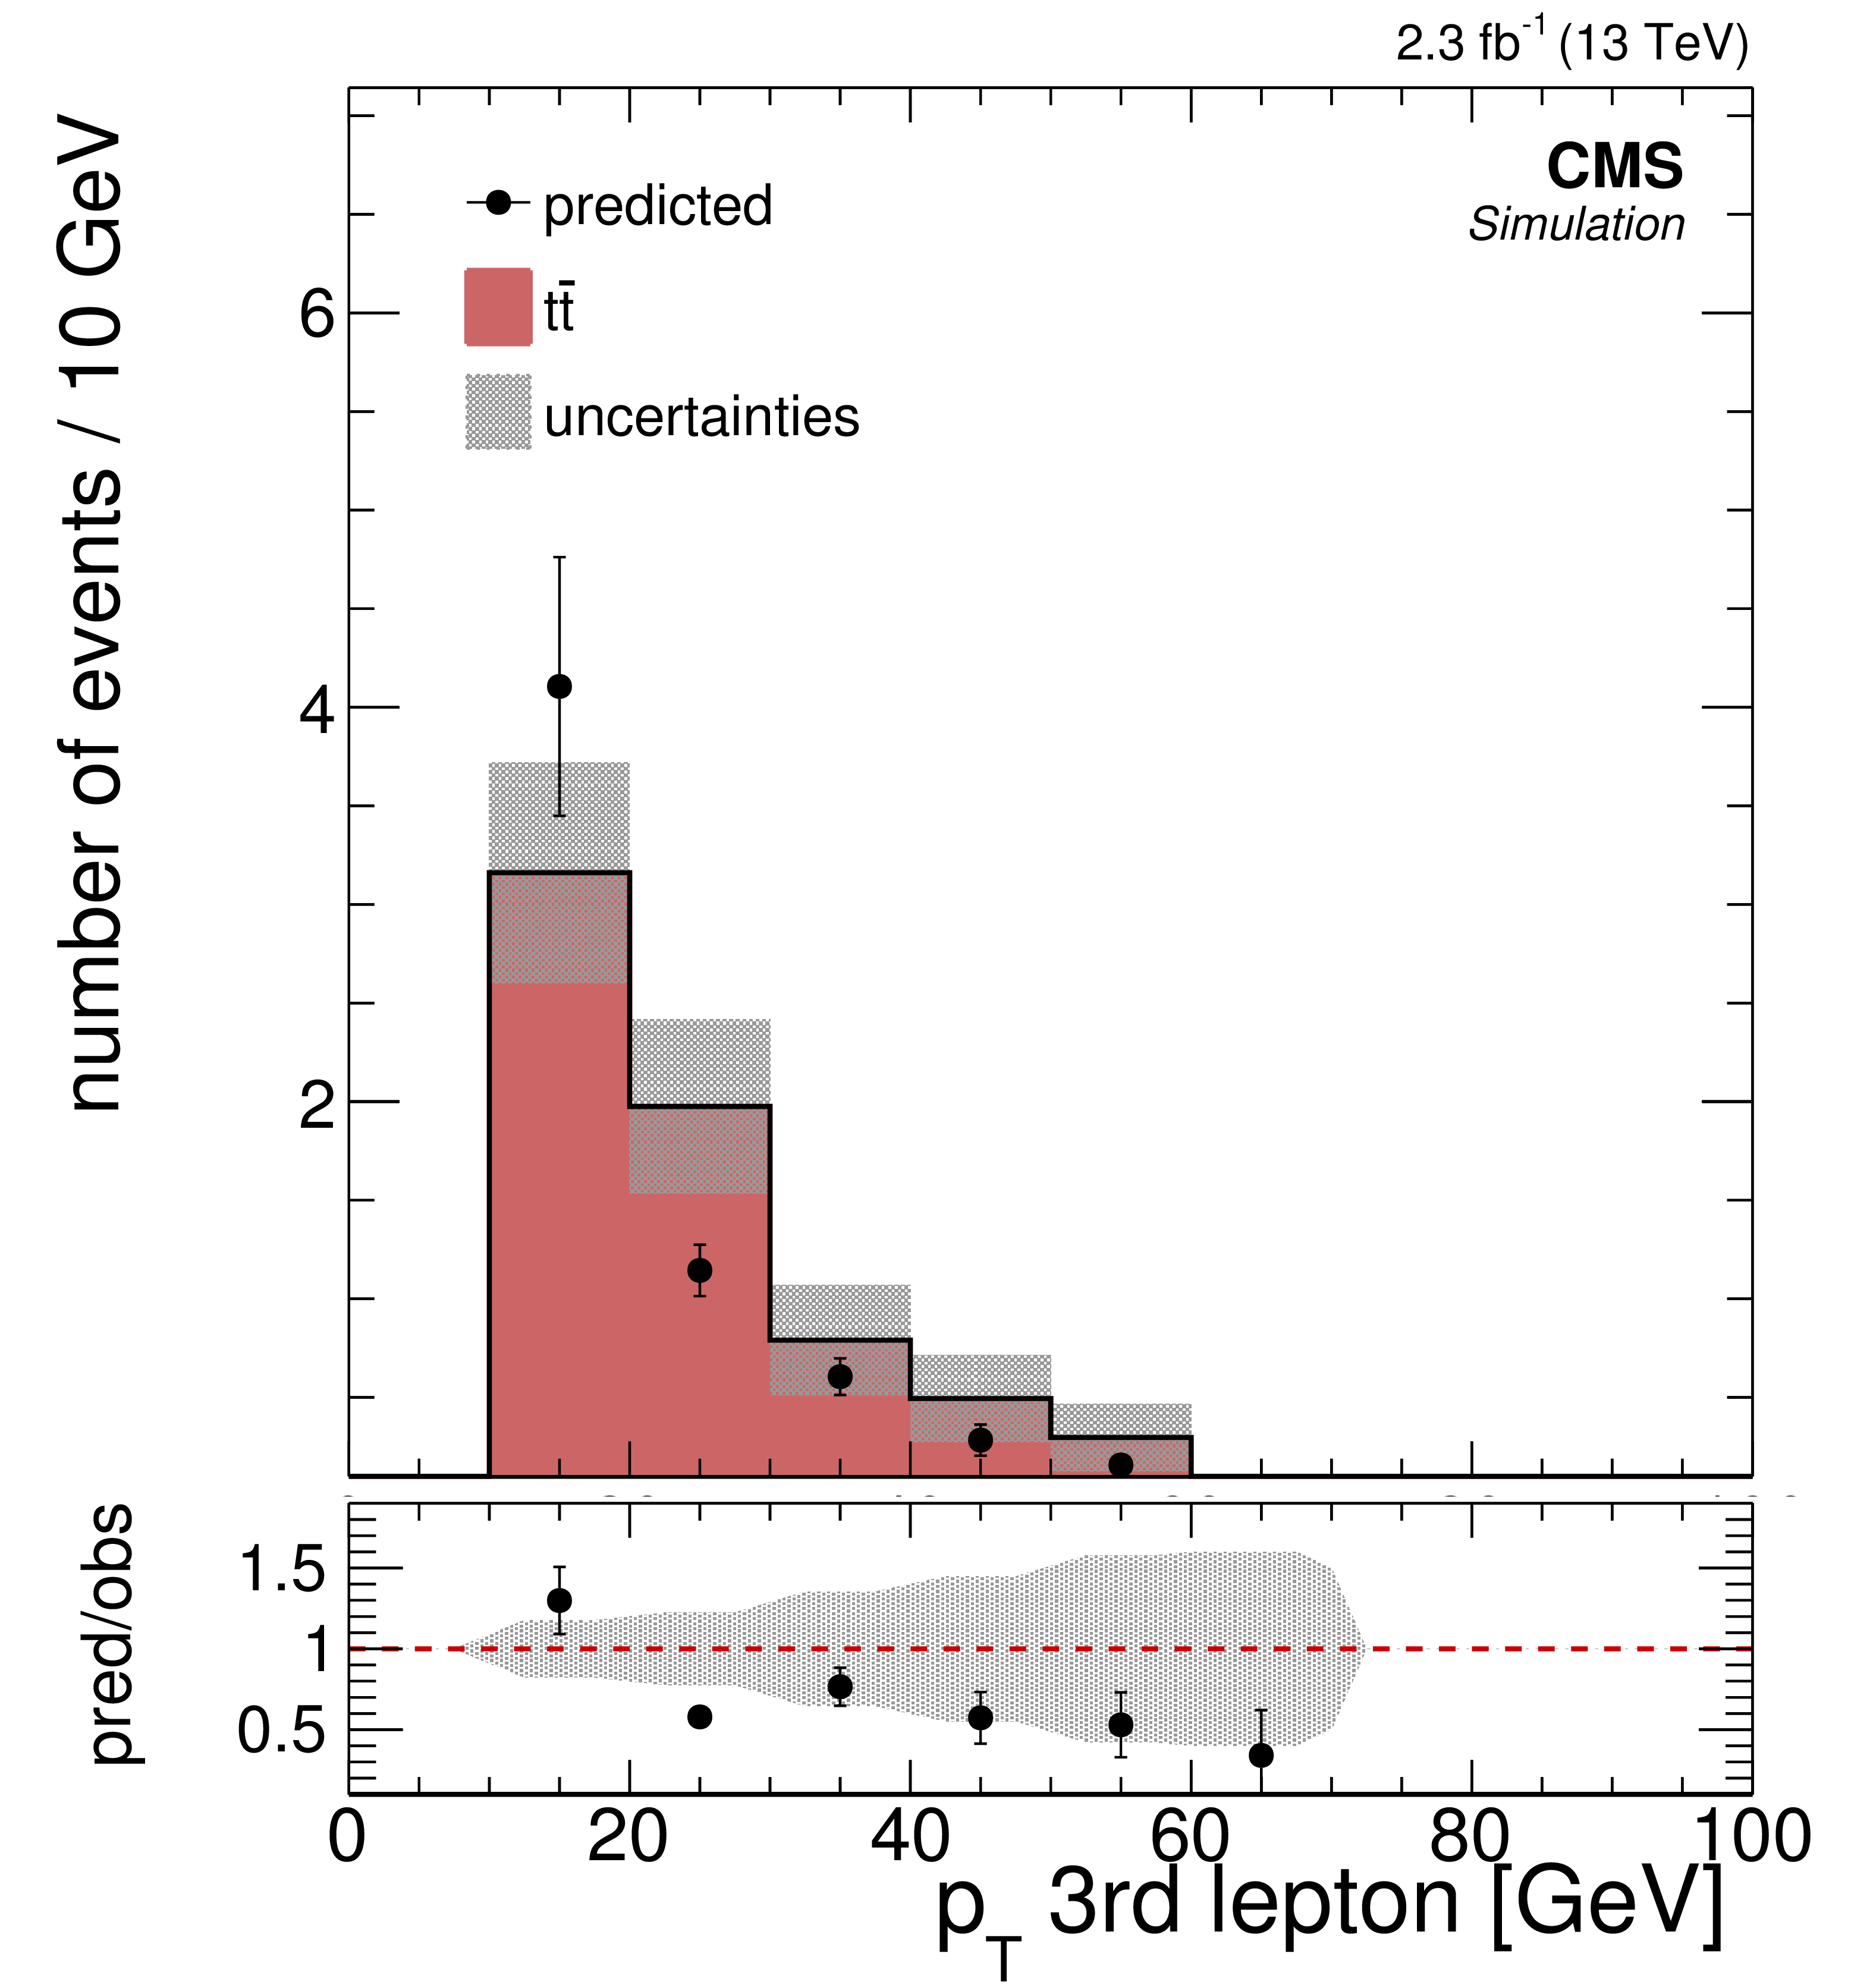
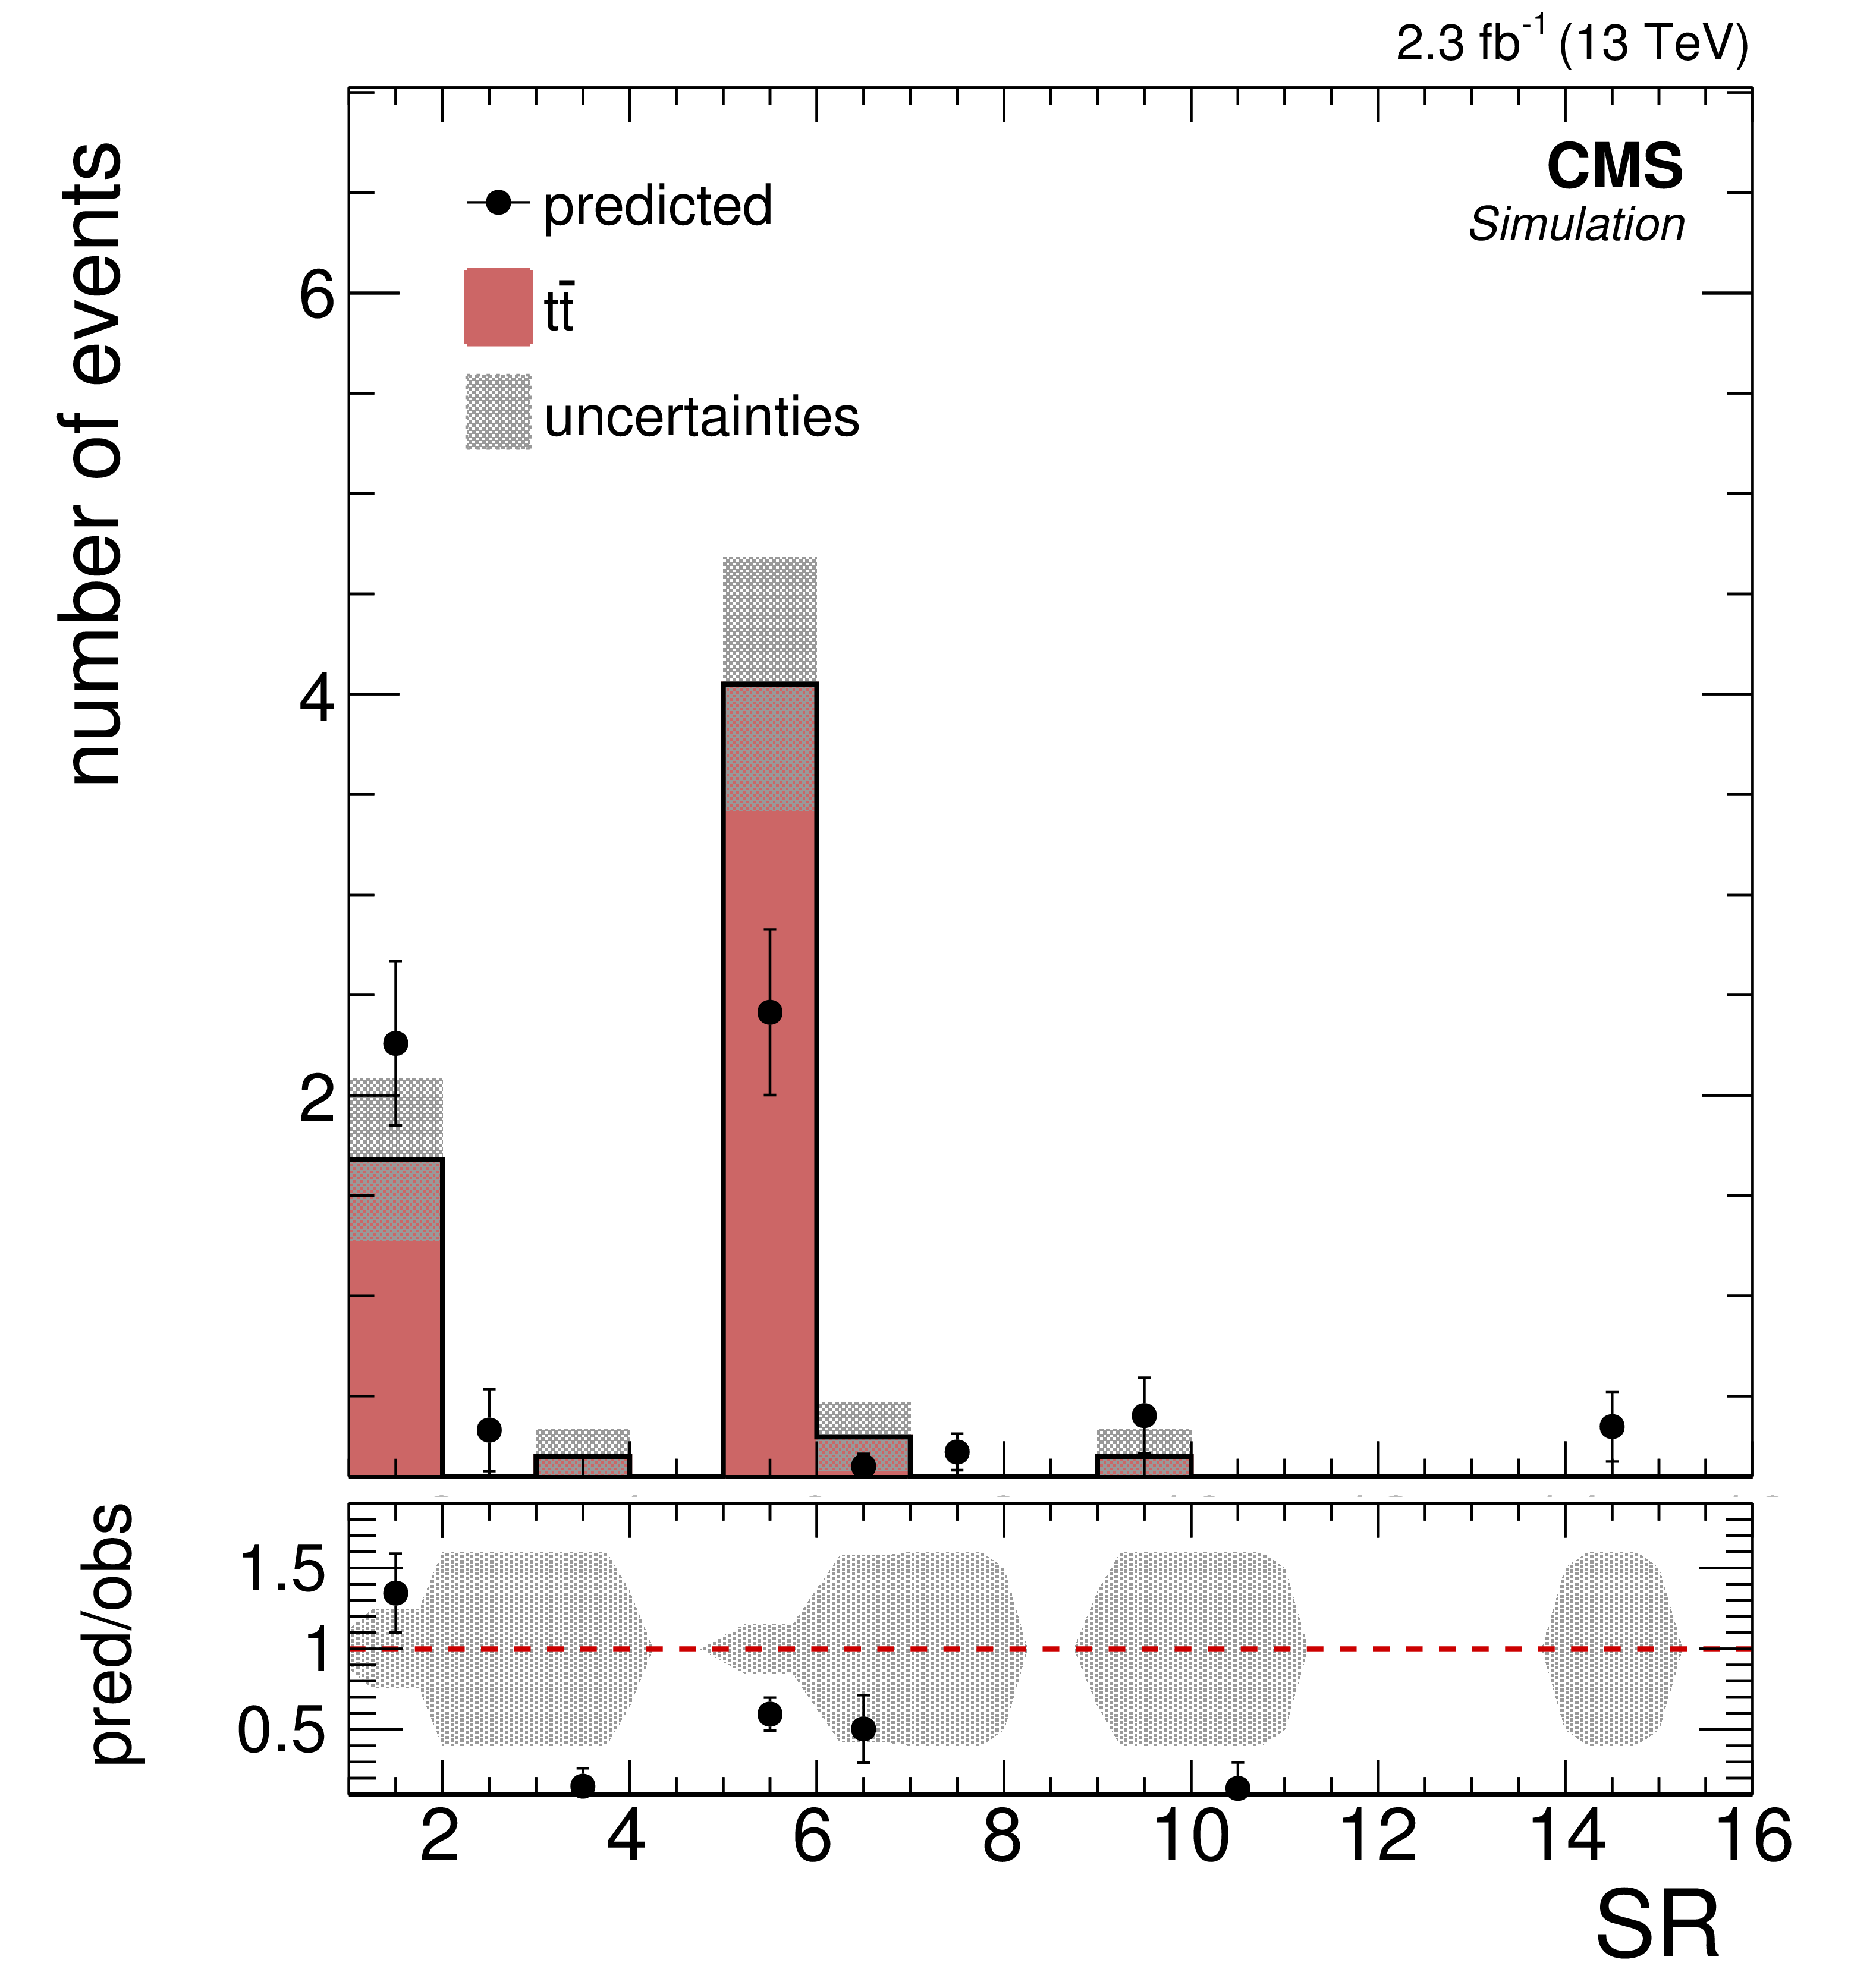
Fake background estimation closure in $ {\mathrm{ t \bar{t} } } $ in the off-Z regions. The fake rate has been measured in QCD MC and yields are normalized to an integrated luminosity of with 2.3 fb$^{-1}$. Shown are the distributions of the hadronic activity $ {H_{\mathrm {T}}} $, the missing transverse energy $ {E_{\mathrm {T}}^{\text {miss}}} $, the (b-)jet multiplicity $ {N_\text {jets}} $ ($ {N_\text {b jets}} $), and the $ {p_{\mathrm {T}}} $ distributions for the leading, the sub-leading and the trailing leptons for events with muons and electrons. Additionally, the yields in the 15 SR is shown and the observed and predicted number of events as a function of the flavor composition of the event is shown. |
png pdf |
Auxiliary Figure 4-b:
Fake background estimation closure in $ {\mathrm{ t \bar{t} } } $ in the off-Z regions. The fake rate has been measured in QCD MC and yields are normalized to an integrated luminosity of with 2.3 fb$^{-1}$. Shown are the distributions of the hadronic activity $ {H_{\mathrm {T}}} $, the missing transverse energy $ {E_{\mathrm {T}}^{\text {miss}}} $, the (b-)jet multiplicity $ {N_\text {jets}} $ ($ {N_\text {b jets}} $), and the $ {p_{\mathrm {T}}} $ distributions for the leading, the sub-leading and the trailing leptons for events with muons and electrons. Additionally, the yields in the 15 SR is shown and the observed and predicted number of events as a function of the flavor composition of the event is shown. |
png pdf |
Auxiliary Figure 4-c:
Fake background estimation closure in $ {\mathrm{ t \bar{t} } } $ in the off-Z regions. The fake rate has been measured in QCD MC and yields are normalized to an integrated luminosity of with 2.3 fb$^{-1}$. Shown are the distributions of the hadronic activity $ {H_{\mathrm {T}}} $, the missing transverse energy $ {E_{\mathrm {T}}^{\text {miss}}} $, the (b-)jet multiplicity $ {N_\text {jets}} $ ($ {N_\text {b jets}} $), and the $ {p_{\mathrm {T}}} $ distributions for the leading, the sub-leading and the trailing leptons for events with muons and electrons. Additionally, the yields in the 15 SR is shown and the observed and predicted number of events as a function of the flavor composition of the event is shown. |
png pdf |
Auxiliary Figure 4-d:
Fake background estimation closure in $ {\mathrm{ t \bar{t} } } $ in the off-Z regions. The fake rate has been measured in QCD MC and yields are normalized to an integrated luminosity of with 2.3 fb$^{-1}$. Shown are the distributions of the hadronic activity $ {H_{\mathrm {T}}} $, the missing transverse energy $ {E_{\mathrm {T}}^{\text {miss}}} $, the (b-)jet multiplicity $ {N_\text {jets}} $ ($ {N_\text {b jets}} $), and the $ {p_{\mathrm {T}}} $ distributions for the leading, the sub-leading and the trailing leptons for events with muons and electrons. Additionally, the yields in the 15 SR is shown and the observed and predicted number of events as a function of the flavor composition of the event is shown. |
png pdf |
Auxiliary Figure 4-e:
Fake background estimation closure in $ {\mathrm{ t \bar{t} } } $ in the off-Z regions. The fake rate has been measured in QCD MC and yields are normalized to an integrated luminosity of with 2.3 fb$^{-1}$. Shown are the distributions of the hadronic activity $ {H_{\mathrm {T}}} $, the missing transverse energy $ {E_{\mathrm {T}}^{\text {miss}}} $, the (b-)jet multiplicity $ {N_\text {jets}} $ ($ {N_\text {b jets}} $), and the $ {p_{\mathrm {T}}} $ distributions for the leading, the sub-leading and the trailing leptons for events with muons and electrons. Additionally, the yields in the 15 SR is shown and the observed and predicted number of events as a function of the flavor composition of the event is shown. |
png pdf |
Auxiliary Figure 4-f:
Fake background estimation closure in $ {\mathrm{ t \bar{t} } } $ in the off-Z regions. The fake rate has been measured in QCD MC and yields are normalized to an integrated luminosity of with 2.3 fb$^{-1}$. Shown are the distributions of the hadronic activity $ {H_{\mathrm {T}}} $, the missing transverse energy $ {E_{\mathrm {T}}^{\text {miss}}} $, the (b-)jet multiplicity $ {N_\text {jets}} $ ($ {N_\text {b jets}} $), and the $ {p_{\mathrm {T}}} $ distributions for the leading, the sub-leading and the trailing leptons for events with muons and electrons. Additionally, the yields in the 15 SR is shown and the observed and predicted number of events as a function of the flavor composition of the event is shown. |
png pdf |
Auxiliary Figure 4-g:
Fake background estimation closure in $ {\mathrm{ t \bar{t} } } $ in the off-Z regions. The fake rate has been measured in QCD MC and yields are normalized to an integrated luminosity of with 2.3 fb$^{-1}$. Shown are the distributions of the hadronic activity $ {H_{\mathrm {T}}} $, the missing transverse energy $ {E_{\mathrm {T}}^{\text {miss}}} $, the (b-)jet multiplicity $ {N_\text {jets}} $ ($ {N_\text {b jets}} $), and the $ {p_{\mathrm {T}}} $ distributions for the leading, the sub-leading and the trailing leptons for events with muons and electrons. Additionally, the yields in the 15 SR is shown and the observed and predicted number of events as a function of the flavor composition of the event is shown. |
png pdf |
Auxiliary Figure 4-h:
Fake background estimation closure in $ {\mathrm{ t \bar{t} } } $ in the off-Z regions. The fake rate has been measured in QCD MC and yields are normalized to an integrated luminosity of with 2.3 fb$^{-1}$. Shown are the distributions of the hadronic activity $ {H_{\mathrm {T}}} $, the missing transverse energy $ {E_{\mathrm {T}}^{\text {miss}}} $, the (b-)jet multiplicity $ {N_\text {jets}} $ ($ {N_\text {b jets}} $), and the $ {p_{\mathrm {T}}} $ distributions for the leading, the sub-leading and the trailing leptons for events with muons and electrons. Additionally, the yields in the 15 SR is shown and the observed and predicted number of events as a function of the flavor composition of the event is shown. |
png pdf |
Auxiliary Figure 4-i:
Fake background estimation closure in $ {\mathrm{ t \bar{t} } } $ in the off-Z regions. The fake rate has been measured in QCD MC and yields are normalized to an integrated luminosity of with 2.3 fb$^{-1}$. Shown are the distributions of the hadronic activity $ {H_{\mathrm {T}}} $, the missing transverse energy $ {E_{\mathrm {T}}^{\text {miss}}} $, the (b-)jet multiplicity $ {N_\text {jets}} $ ($ {N_\text {b jets}} $), and the $ {p_{\mathrm {T}}} $ distributions for the leading, the sub-leading and the trailing leptons for events with muons and electrons. Additionally, the yields in the 15 SR is shown and the observed and predicted number of events as a function of the flavor composition of the event is shown. |
png pdf |
Auxiliary Figure 5-a:
Fake background estimation closure with a mixture of MC samples yielding non-prompt leptons in the on-Z regions. Fake leptons in the on-Z baseline region originate from $ {\mathrm{ t \bar{t} } } $ and Drell-Yan, each process with about 50\%. The fake rate has been measured in QCD MC and yields are normalized to an integrated luminosity of with 2.3 fb$^{-1}$. Shown are the distributions of the hadronic activity $ {H_{\mathrm {T}}} $, the missing transverse energy $ {E_{\mathrm {T}}^{\text {miss}}} $, the (b-)jet multiplicity $ {N_\text {jets}} $ ($ {N_\text {b jets}} $), and the $ {p_{\mathrm {T}}} $ distributions for the leading, the sub-leading and the trailing leptons for events with muons and electrons. Additionally, the yields in the 15 SR is shown and the observed and predicted number of events as a function of the flavor composition of the event is shown. |
png pdf |
Auxiliary Figure 5-b:
Fake background estimation closure with a mixture of MC samples yielding non-prompt leptons in the on-Z regions. Fake leptons in the on-Z baseline region originate from $ {\mathrm{ t \bar{t} } } $ and Drell-Yan, each process with about 50\%. The fake rate has been measured in QCD MC and yields are normalized to an integrated luminosity of with 2.3 fb$^{-1}$. Shown are the distributions of the hadronic activity $ {H_{\mathrm {T}}} $, the missing transverse energy $ {E_{\mathrm {T}}^{\text {miss}}} $, the (b-)jet multiplicity $ {N_\text {jets}} $ ($ {N_\text {b jets}} $), and the $ {p_{\mathrm {T}}} $ distributions for the leading, the sub-leading and the trailing leptons for events with muons and electrons. Additionally, the yields in the 15 SR is shown and the observed and predicted number of events as a function of the flavor composition of the event is shown. |

png pdf |
Auxiliary Figure 5-c:
Fake background estimation closure with a mixture of MC samples yielding non-prompt leptons in the on-Z regions. Fake leptons in the on-Z baseline region originate from $ {\mathrm{ t \bar{t} } } $ and Drell-Yan, each process with about 50\%. The fake rate has been measured in QCD MC and yields are normalized to an integrated luminosity of with 2.3 fb$^{-1}$. Shown are the distributions of the hadronic activity $ {H_{\mathrm {T}}} $, the missing transverse energy $ {E_{\mathrm {T}}^{\text {miss}}} $, the (b-)jet multiplicity $ {N_\text {jets}} $ ($ {N_\text {b jets}} $), and the $ {p_{\mathrm {T}}} $ distributions for the leading, the sub-leading and the trailing leptons for events with muons and electrons. Additionally, the yields in the 15 SR is shown and the observed and predicted number of events as a function of the flavor composition of the event is shown. |

png pdf |
Auxiliary Figure 5-d:
Fake background estimation closure with a mixture of MC samples yielding non-prompt leptons in the on-Z regions. Fake leptons in the on-Z baseline region originate from $ {\mathrm{ t \bar{t} } } $ and Drell-Yan, each process with about 50\%. The fake rate has been measured in QCD MC and yields are normalized to an integrated luminosity of with 2.3 fb$^{-1}$. Shown are the distributions of the hadronic activity $ {H_{\mathrm {T}}} $, the missing transverse energy $ {E_{\mathrm {T}}^{\text {miss}}} $, the (b-)jet multiplicity $ {N_\text {jets}} $ ($ {N_\text {b jets}} $), and the $ {p_{\mathrm {T}}} $ distributions for the leading, the sub-leading and the trailing leptons for events with muons and electrons. Additionally, the yields in the 15 SR is shown and the observed and predicted number of events as a function of the flavor composition of the event is shown. |
png pdf |
Auxiliary Figure 5-e:
Fake background estimation closure with a mixture of MC samples yielding non-prompt leptons in the on-Z regions. Fake leptons in the on-Z baseline region originate from $ {\mathrm{ t \bar{t} } } $ and Drell-Yan, each process with about 50\%. The fake rate has been measured in QCD MC and yields are normalized to an integrated luminosity of with 2.3 fb$^{-1}$. Shown are the distributions of the hadronic activity $ {H_{\mathrm {T}}} $, the missing transverse energy $ {E_{\mathrm {T}}^{\text {miss}}} $, the (b-)jet multiplicity $ {N_\text {jets}} $ ($ {N_\text {b jets}} $), and the $ {p_{\mathrm {T}}} $ distributions for the leading, the sub-leading and the trailing leptons for events with muons and electrons. Additionally, the yields in the 15 SR is shown and the observed and predicted number of events as a function of the flavor composition of the event is shown. |

png pdf |
Auxiliary Figure 5-f:
Fake background estimation closure with a mixture of MC samples yielding non-prompt leptons in the on-Z regions. Fake leptons in the on-Z baseline region originate from $ {\mathrm{ t \bar{t} } } $ and Drell-Yan, each process with about 50\%. The fake rate has been measured in QCD MC and yields are normalized to an integrated luminosity of with 2.3 fb$^{-1}$. Shown are the distributions of the hadronic activity $ {H_{\mathrm {T}}} $, the missing transverse energy $ {E_{\mathrm {T}}^{\text {miss}}} $, the (b-)jet multiplicity $ {N_\text {jets}} $ ($ {N_\text {b jets}} $), and the $ {p_{\mathrm {T}}} $ distributions for the leading, the sub-leading and the trailing leptons for events with muons and electrons. Additionally, the yields in the 15 SR is shown and the observed and predicted number of events as a function of the flavor composition of the event is shown. |
png pdf |
Auxiliary Figure 5-g:
Fake background estimation closure with a mixture of MC samples yielding non-prompt leptons in the on-Z regions. Fake leptons in the on-Z baseline region originate from $ {\mathrm{ t \bar{t} } } $ and Drell-Yan, each process with about 50\%. The fake rate has been measured in QCD MC and yields are normalized to an integrated luminosity of with 2.3 fb$^{-1}$. Shown are the distributions of the hadronic activity $ {H_{\mathrm {T}}} $, the missing transverse energy $ {E_{\mathrm {T}}^{\text {miss}}} $, the (b-)jet multiplicity $ {N_\text {jets}} $ ($ {N_\text {b jets}} $), and the $ {p_{\mathrm {T}}} $ distributions for the leading, the sub-leading and the trailing leptons for events with muons and electrons. Additionally, the yields in the 15 SR is shown and the observed and predicted number of events as a function of the flavor composition of the event is shown. |

png pdf |
Auxiliary Figure 5-h:
Fake background estimation closure with a mixture of MC samples yielding non-prompt leptons in the on-Z regions. Fake leptons in the on-Z baseline region originate from $ {\mathrm{ t \bar{t} } } $ and Drell-Yan, each process with about 50\%. The fake rate has been measured in QCD MC and yields are normalized to an integrated luminosity of with 2.3 fb$^{-1}$. Shown are the distributions of the hadronic activity $ {H_{\mathrm {T}}} $, the missing transverse energy $ {E_{\mathrm {T}}^{\text {miss}}} $, the (b-)jet multiplicity $ {N_\text {jets}} $ ($ {N_\text {b jets}} $), and the $ {p_{\mathrm {T}}} $ distributions for the leading, the sub-leading and the trailing leptons for events with muons and electrons. Additionally, the yields in the 15 SR is shown and the observed and predicted number of events as a function of the flavor composition of the event is shown. |
png pdf |
Auxiliary Figure 5-i:
Fake background estimation closure with a mixture of MC samples yielding non-prompt leptons in the on-Z regions. Fake leptons in the on-Z baseline region originate from $ {\mathrm{ t \bar{t} } } $ and Drell-Yan, each process with about 50\%. The fake rate has been measured in QCD MC and yields are normalized to an integrated luminosity of with 2.3 fb$^{-1}$. Shown are the distributions of the hadronic activity $ {H_{\mathrm {T}}} $, the missing transverse energy $ {E_{\mathrm {T}}^{\text {miss}}} $, the (b-)jet multiplicity $ {N_\text {jets}} $ ($ {N_\text {b jets}} $), and the $ {p_{\mathrm {T}}} $ distributions for the leading, the sub-leading and the trailing leptons for events with muons and electrons. Additionally, the yields in the 15 SR is shown and the observed and predicted number of events as a function of the flavor composition of the event is shown. |

png pdf |
Auxiliary Figure 6-a:
Fake background estimation closure in the on-Z regions with $ {\mathrm{ t \bar{t} } } $ only. The fake rate has been measured in QCD MC and yields are normalized to an integrated luminosity of with 2.3 fb$^{-1}$. Shown are the distributions of the hadronic activity $ {H_{\mathrm {T}}} $, the missing transverse energy $ {E_{\mathrm {T}}^{\text {miss}}} $, the (b-)jet multiplicity $ {N_\text {jets}} $ ($ {N_\text {b jets}} $), and the $ {p_{\mathrm {T}}} $ distributions for the leading, the sub-leading and the trailing leptons for events with muons and electrons. Additionally, the yields in the 15 SR is shown and the observed and predicted number of events as a function of the flavor composition of the event is shown. |
png pdf |
Auxiliary Figure 6-b:
Fake background estimation closure in the on-Z regions with $ {\mathrm{ t \bar{t} } } $ only. The fake rate has been measured in QCD MC and yields are normalized to an integrated luminosity of with 2.3 fb$^{-1}$. Shown are the distributions of the hadronic activity $ {H_{\mathrm {T}}} $, the missing transverse energy $ {E_{\mathrm {T}}^{\text {miss}}} $, the (b-)jet multiplicity $ {N_\text {jets}} $ ($ {N_\text {b jets}} $), and the $ {p_{\mathrm {T}}} $ distributions for the leading, the sub-leading and the trailing leptons for events with muons and electrons. Additionally, the yields in the 15 SR is shown and the observed and predicted number of events as a function of the flavor composition of the event is shown. |
png pdf |
Auxiliary Figure 6-c:
Fake background estimation closure in the on-Z regions with $ {\mathrm{ t \bar{t} } } $ only. The fake rate has been measured in QCD MC and yields are normalized to an integrated luminosity of with 2.3 fb$^{-1}$. Shown are the distributions of the hadronic activity $ {H_{\mathrm {T}}} $, the missing transverse energy $ {E_{\mathrm {T}}^{\text {miss}}} $, the (b-)jet multiplicity $ {N_\text {jets}} $ ($ {N_\text {b jets}} $), and the $ {p_{\mathrm {T}}} $ distributions for the leading, the sub-leading and the trailing leptons for events with muons and electrons. Additionally, the yields in the 15 SR is shown and the observed and predicted number of events as a function of the flavor composition of the event is shown. |
png pdf |
Auxiliary Figure 6-d:
Fake background estimation closure in the on-Z regions with $ {\mathrm{ t \bar{t} } } $ only. The fake rate has been measured in QCD MC and yields are normalized to an integrated luminosity of with 2.3 fb$^{-1}$. Shown are the distributions of the hadronic activity $ {H_{\mathrm {T}}} $, the missing transverse energy $ {E_{\mathrm {T}}^{\text {miss}}} $, the (b-)jet multiplicity $ {N_\text {jets}} $ ($ {N_\text {b jets}} $), and the $ {p_{\mathrm {T}}} $ distributions for the leading, the sub-leading and the trailing leptons for events with muons and electrons. Additionally, the yields in the 15 SR is shown and the observed and predicted number of events as a function of the flavor composition of the event is shown. |
png pdf |
Auxiliary Figure 6-e:
Fake background estimation closure in the on-Z regions with $ {\mathrm{ t \bar{t} } } $ only. The fake rate has been measured in QCD MC and yields are normalized to an integrated luminosity of with 2.3 fb$^{-1}$. Shown are the distributions of the hadronic activity $ {H_{\mathrm {T}}} $, the missing transverse energy $ {E_{\mathrm {T}}^{\text {miss}}} $, the (b-)jet multiplicity $ {N_\text {jets}} $ ($ {N_\text {b jets}} $), and the $ {p_{\mathrm {T}}} $ distributions for the leading, the sub-leading and the trailing leptons for events with muons and electrons. Additionally, the yields in the 15 SR is shown and the observed and predicted number of events as a function of the flavor composition of the event is shown. |
png pdf |
Auxiliary Figure 6-f:
Fake background estimation closure in the on-Z regions with $ {\mathrm{ t \bar{t} } } $ only. The fake rate has been measured in QCD MC and yields are normalized to an integrated luminosity of with 2.3 fb$^{-1}$. Shown are the distributions of the hadronic activity $ {H_{\mathrm {T}}} $, the missing transverse energy $ {E_{\mathrm {T}}^{\text {miss}}} $, the (b-)jet multiplicity $ {N_\text {jets}} $ ($ {N_\text {b jets}} $), and the $ {p_{\mathrm {T}}} $ distributions for the leading, the sub-leading and the trailing leptons for events with muons and electrons. Additionally, the yields in the 15 SR is shown and the observed and predicted number of events as a function of the flavor composition of the event is shown. |
png pdf |
Auxiliary Figure 6-g:
Fake background estimation closure in the on-Z regions with $ {\mathrm{ t \bar{t} } } $ only. The fake rate has been measured in QCD MC and yields are normalized to an integrated luminosity of with 2.3 fb$^{-1}$. Shown are the distributions of the hadronic activity $ {H_{\mathrm {T}}} $, the missing transverse energy $ {E_{\mathrm {T}}^{\text {miss}}} $, the (b-)jet multiplicity $ {N_\text {jets}} $ ($ {N_\text {b jets}} $), and the $ {p_{\mathrm {T}}} $ distributions for the leading, the sub-leading and the trailing leptons for events with muons and electrons. Additionally, the yields in the 15 SR is shown and the observed and predicted number of events as a function of the flavor composition of the event is shown. |

png pdf |
Auxiliary Figure 6-h:
Fake background estimation closure in the on-Z regions with $ {\mathrm{ t \bar{t} } } $ only. The fake rate has been measured in QCD MC and yields are normalized to an integrated luminosity of with 2.3 fb$^{-1}$. Shown are the distributions of the hadronic activity $ {H_{\mathrm {T}}} $, the missing transverse energy $ {E_{\mathrm {T}}^{\text {miss}}} $, the (b-)jet multiplicity $ {N_\text {jets}} $ ($ {N_\text {b jets}} $), and the $ {p_{\mathrm {T}}} $ distributions for the leading, the sub-leading and the trailing leptons for events with muons and electrons. Additionally, the yields in the 15 SR is shown and the observed and predicted number of events as a function of the flavor composition of the event is shown. |
png pdf |
Auxiliary Figure 6-i:
Fake background estimation closure in the on-Z regions with $ {\mathrm{ t \bar{t} } } $ only. The fake rate has been measured in QCD MC and yields are normalized to an integrated luminosity of with 2.3 fb$^{-1}$. Shown are the distributions of the hadronic activity $ {H_{\mathrm {T}}} $, the missing transverse energy $ {E_{\mathrm {T}}^{\text {miss}}} $, the (b-)jet multiplicity $ {N_\text {jets}} $ ($ {N_\text {b jets}} $), and the $ {p_{\mathrm {T}}} $ distributions for the leading, the sub-leading and the trailing leptons for events with muons and electrons. Additionally, the yields in the 15 SR is shown and the observed and predicted number of events as a function of the flavor composition of the event is shown. |
png pdf |
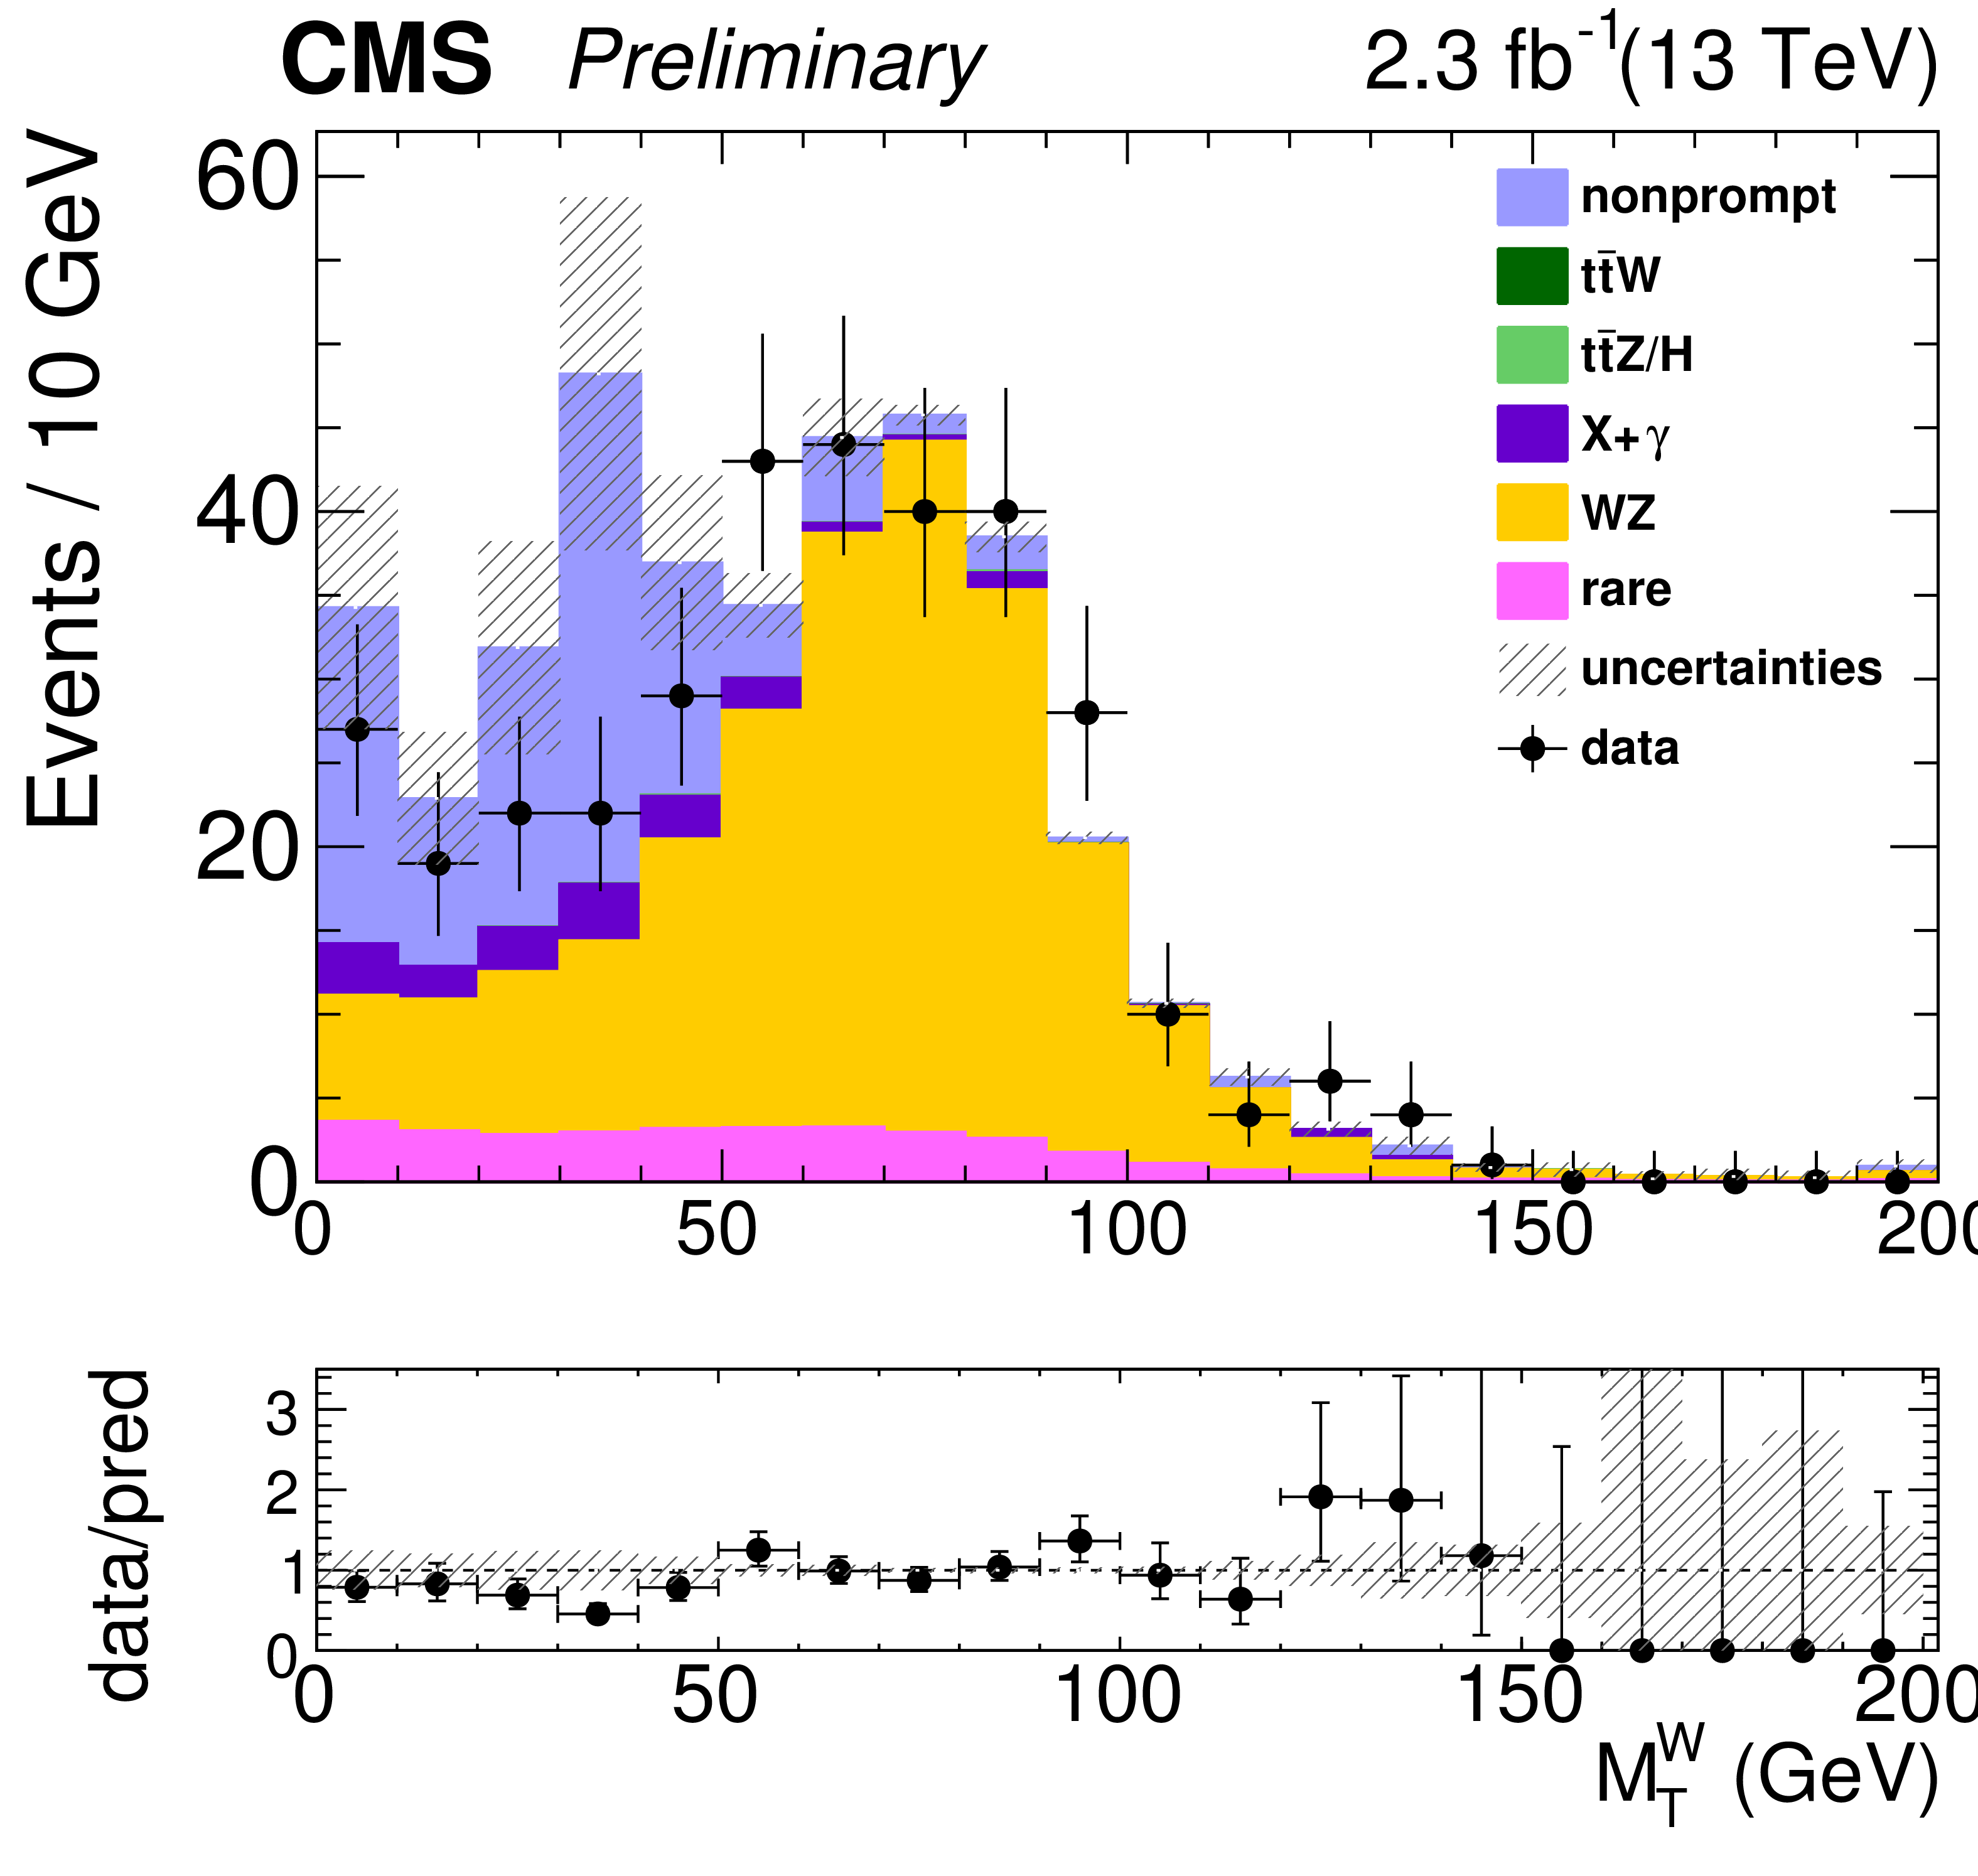
Auxiliary Figure 7-a:
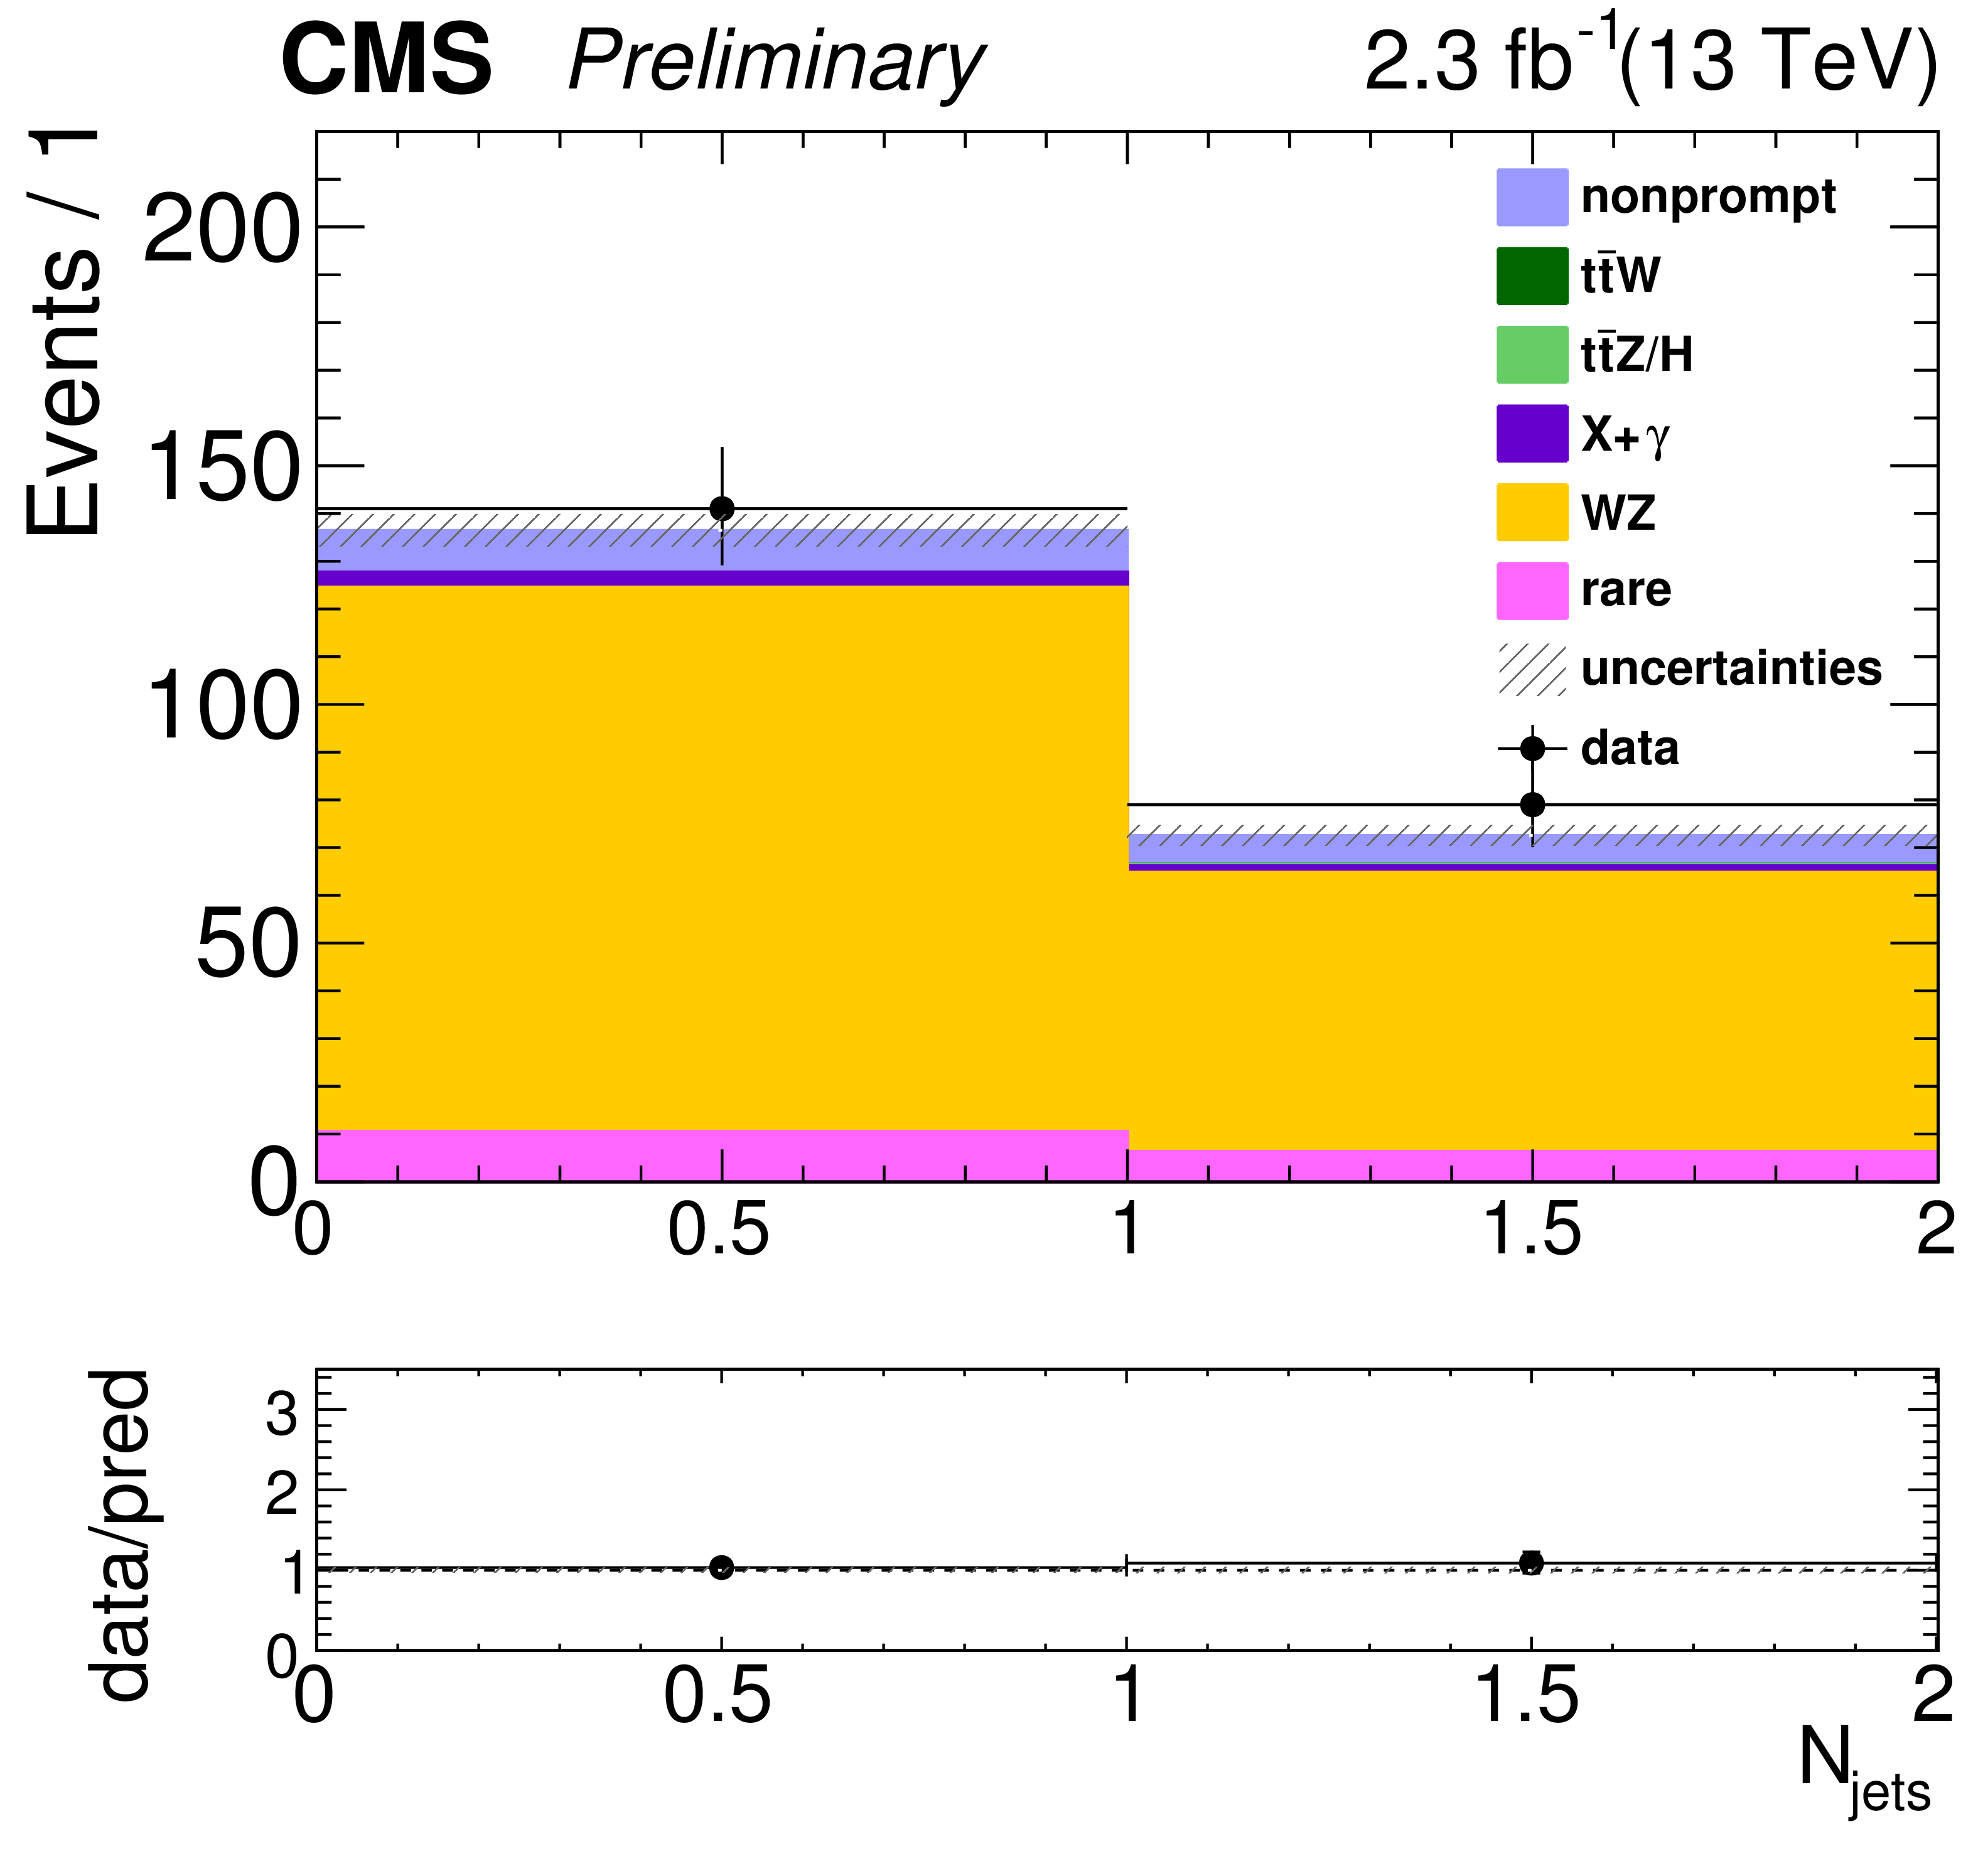
WZ control region plots: $ {N_\text {jets}} $, $ {M_\text {T}} ^{\mathrm{W} }$, $ {E_{\mathrm {T}}^{\text {miss}}} $ and $ {H_{\mathrm {T}}} $ distributions for 2.3 fb$^{-1}$. |
png pdf |
Auxiliary Figure 7-b:
WZ control region plots: $ {N_\text {jets}} $, $ {M_\text {T}} ^{\mathrm{W} }$, $ {E_{\mathrm {T}}^{\text {miss}}} $ and $ {H_{\mathrm {T}}} $ distributions for 2.3 fb$^{-1}$. |
png pdf |
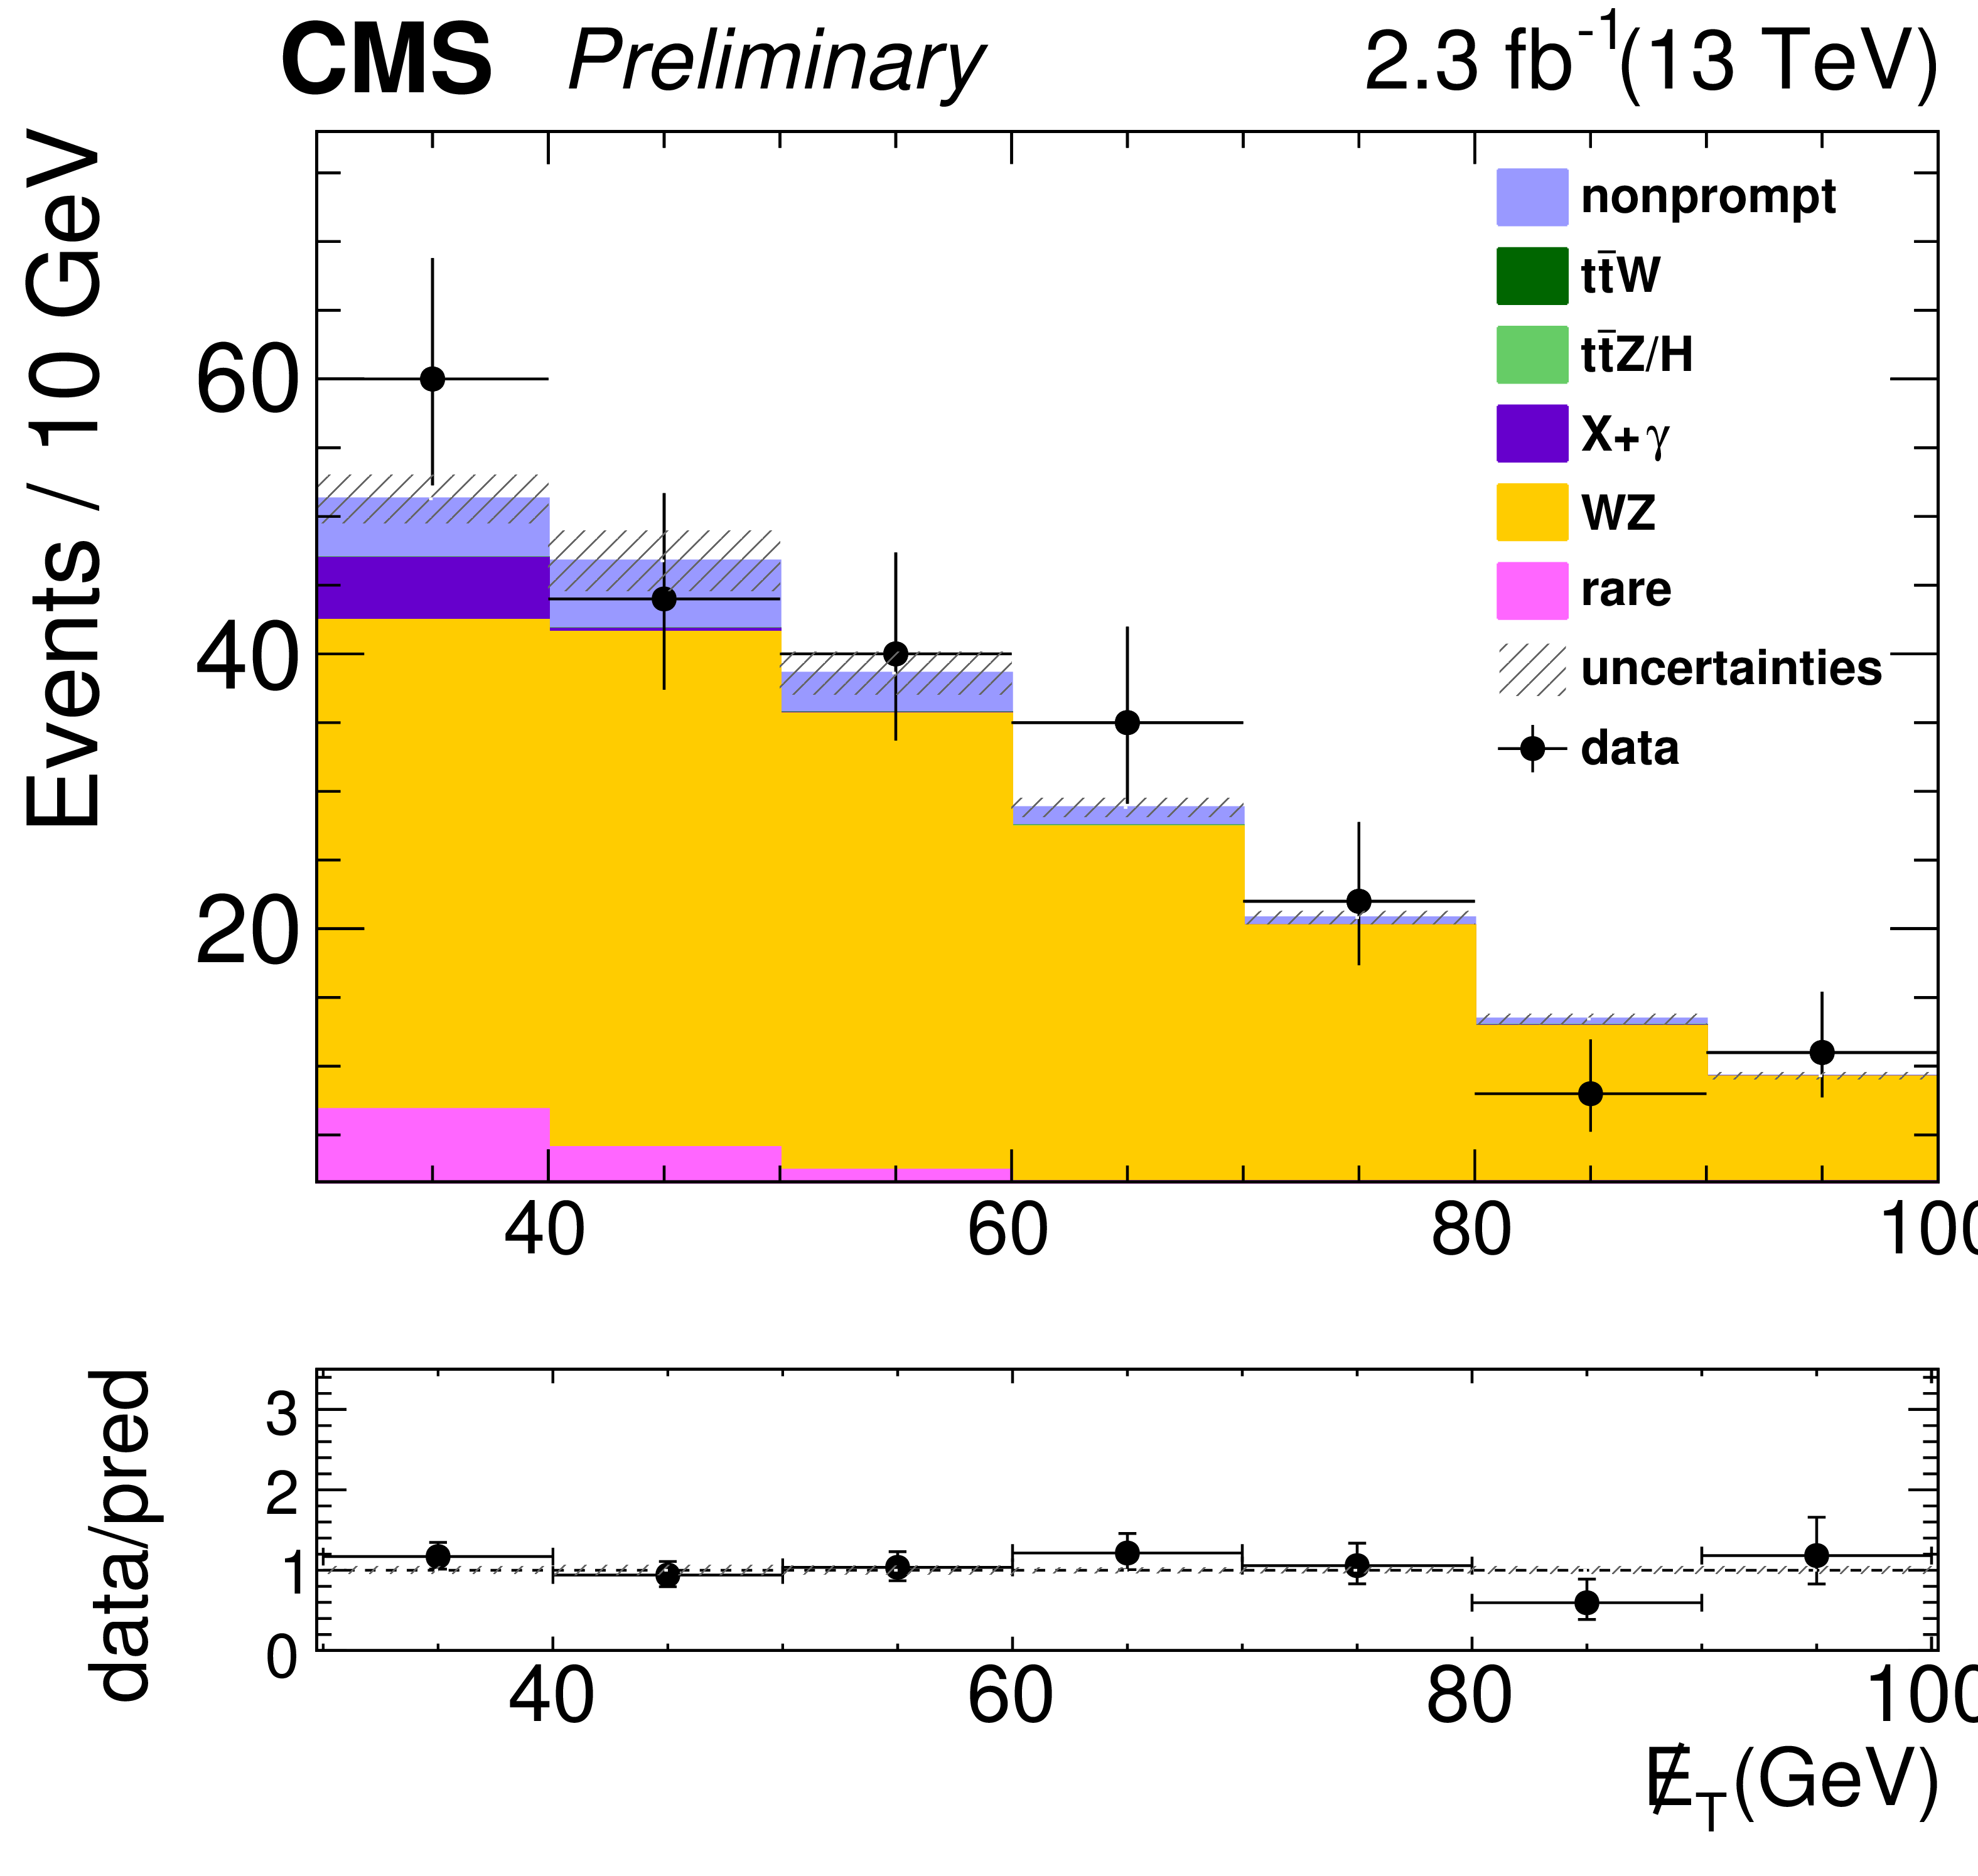
Auxiliary Figure 7-c:
WZ control region plots: $ {N_\text {jets}} $, $ {M_\text {T}} ^{\mathrm{W} }$, $ {E_{\mathrm {T}}^{\text {miss}}} $ and $ {H_{\mathrm {T}}} $ distributions for 2.3 fb$^{-1}$. |
png pdf |
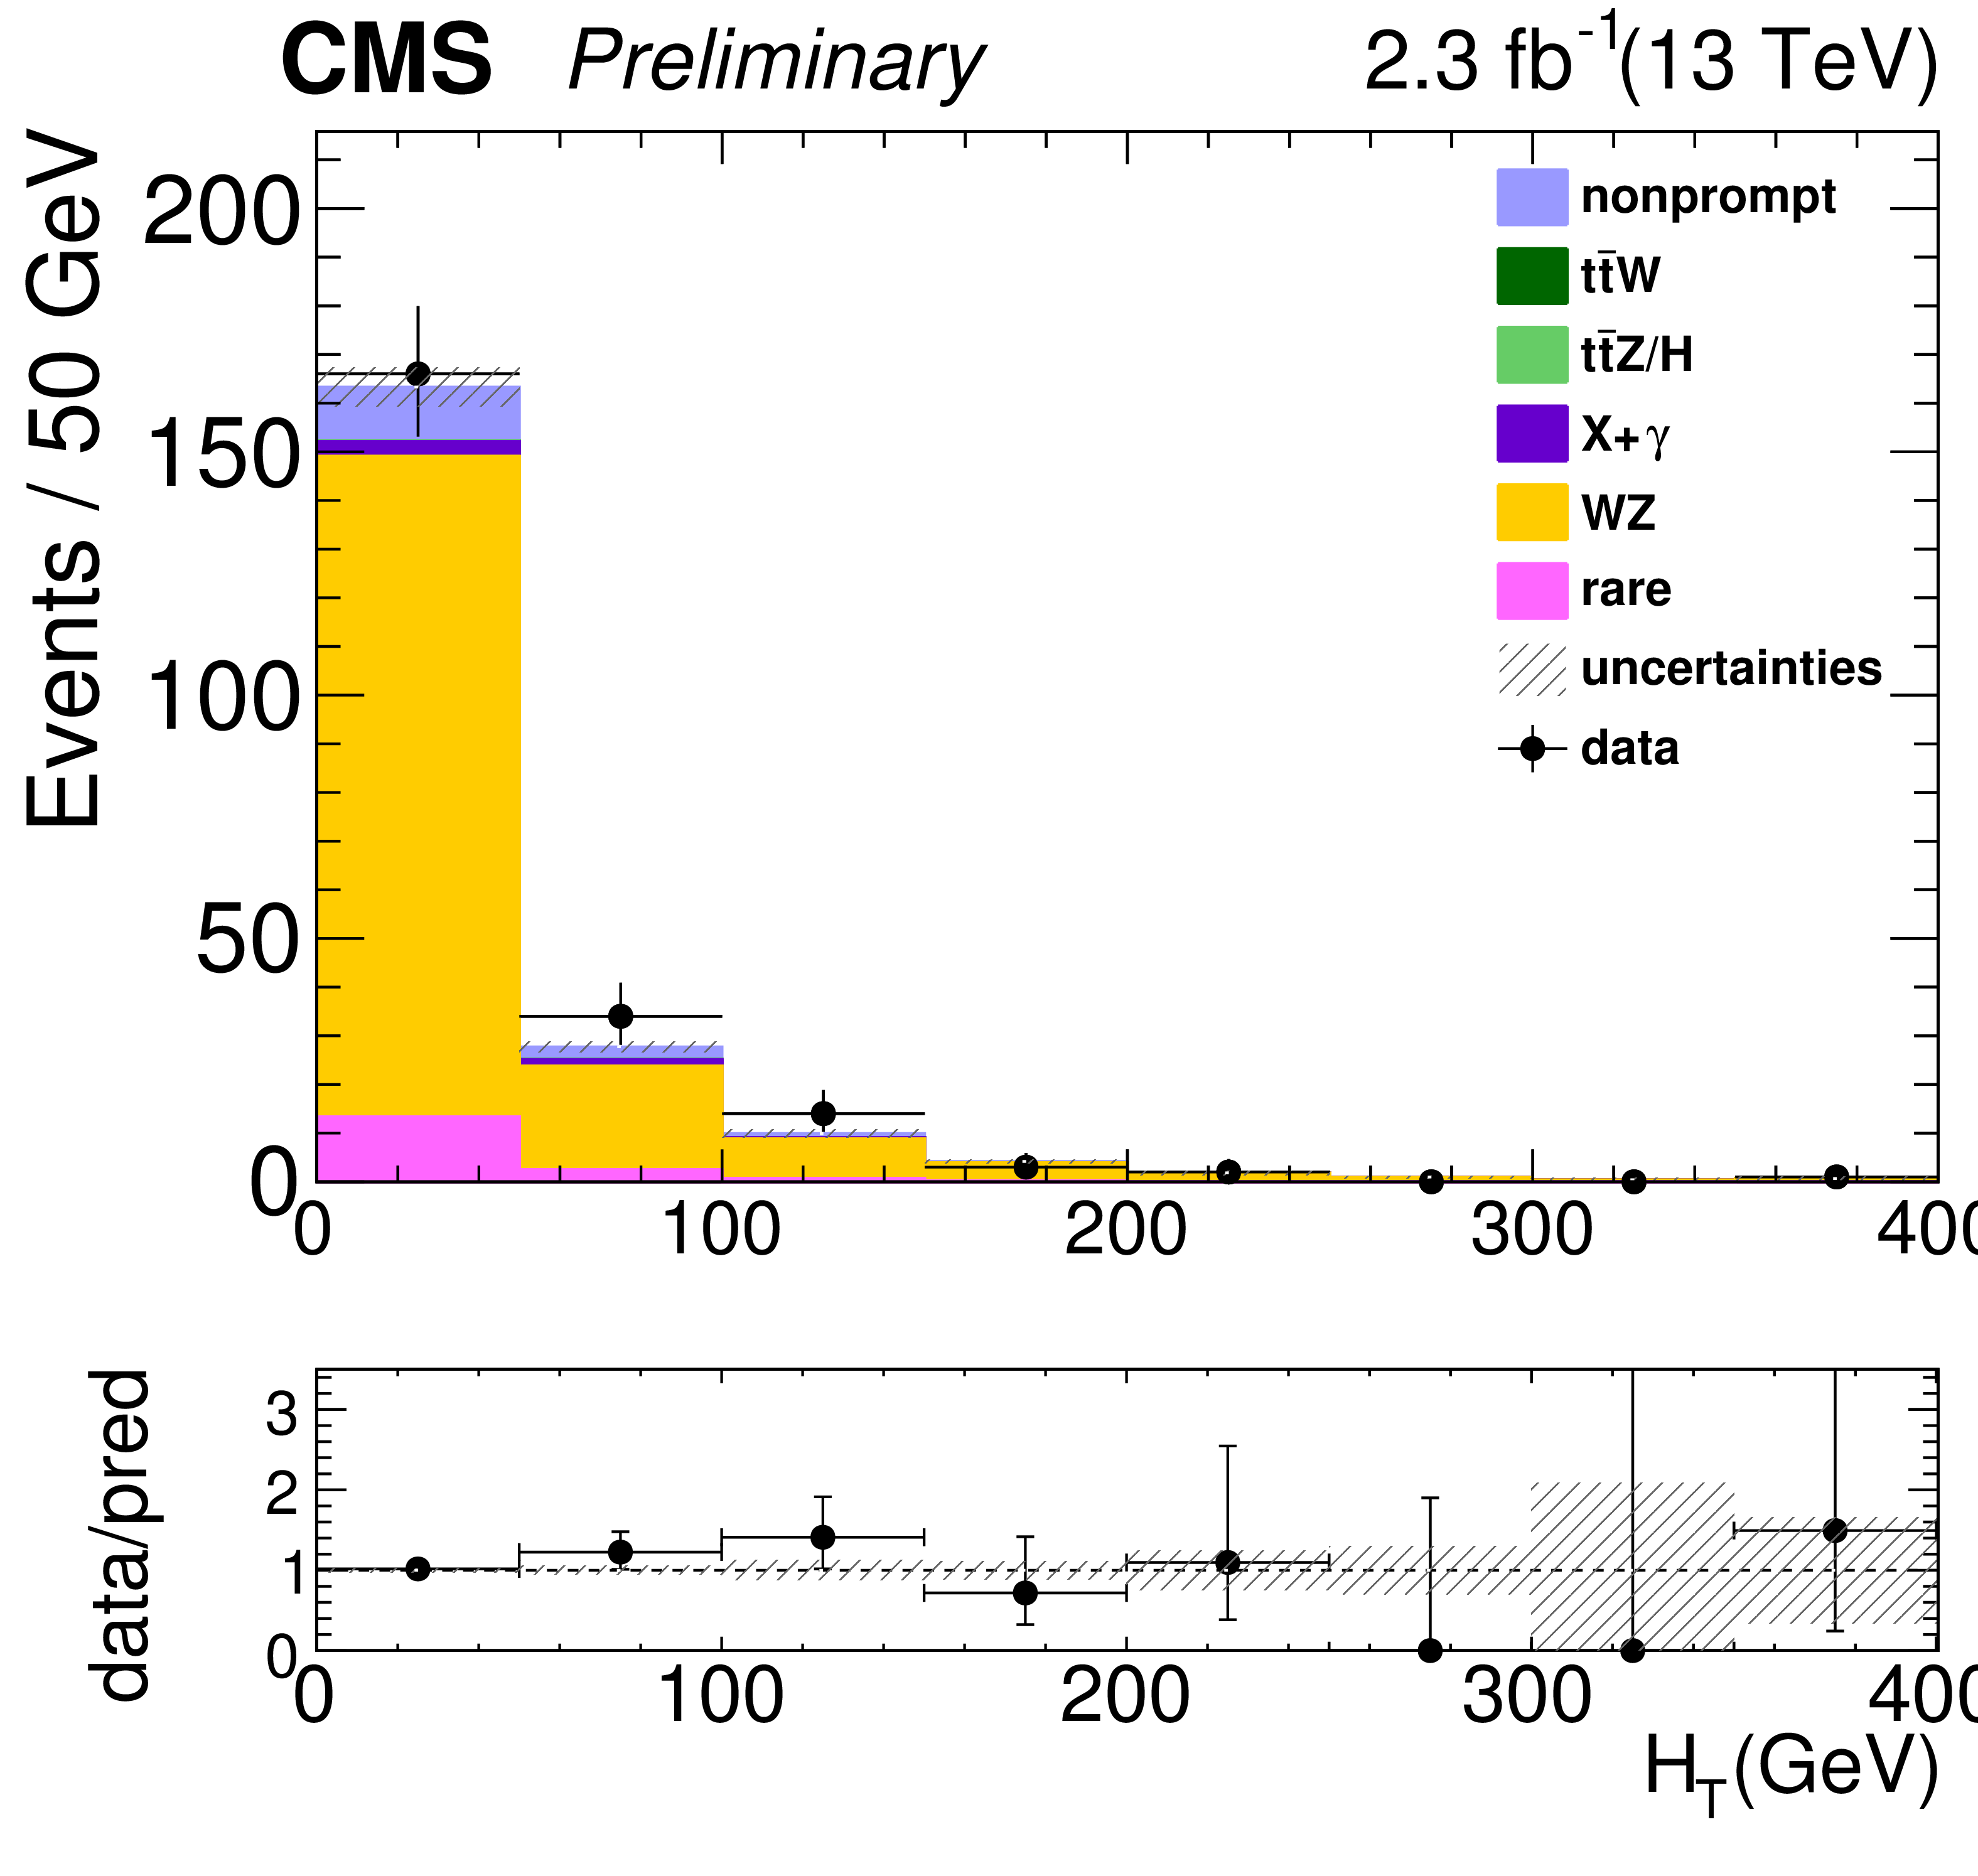
Auxiliary Figure 7-d:
WZ control region plots: $ {N_\text {jets}} $, $ {M_\text {T}} ^{\mathrm{W} }$, $ {E_{\mathrm {T}}^{\text {miss}}} $ and $ {H_{\mathrm {T}}} $ distributions for 2.3 fb$^{-1}$. |
png pdf |
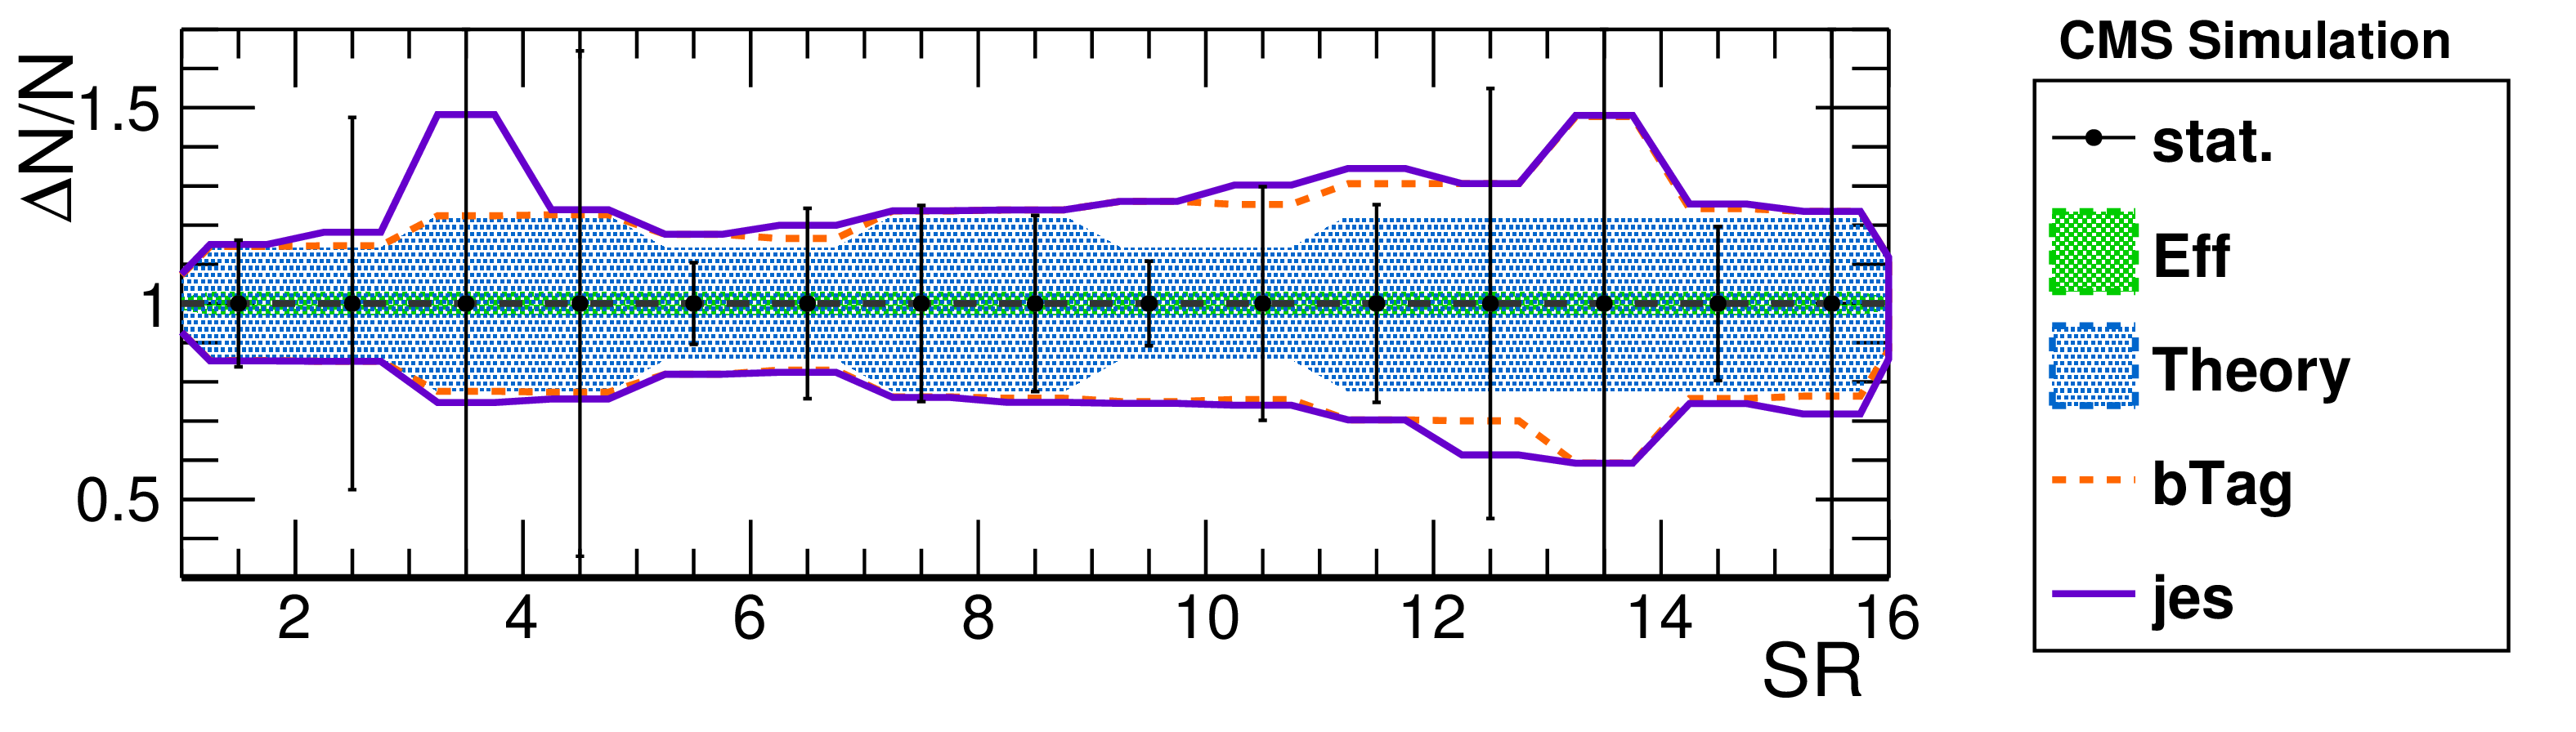
Auxiliary Figure 8-a:
Cumulated major uncertainties for the $ { {\mathrm{ t \bar{t} } } \mathrm{W} } $ process (a), $ { {\mathrm{ t \bar{t} } } \mathrm{Z} } $ process (b) and WZ background (c) |

png pdf |
Auxiliary Figure 8-b:
Cumulated major uncertainties for the $ { {\mathrm{ t \bar{t} } } \mathrm{W} } $ process (a), $ { {\mathrm{ t \bar{t} } } \mathrm{Z} } $ process (b) and WZ background (c) |

png pdf |
Auxiliary Figure 8-c:
Cumulated major uncertainties for the $ { {\mathrm{ t \bar{t} } } \mathrm{W} } $ process (a), $ { {\mathrm{ t \bar{t} } } \mathrm{Z} } $ process (b) and WZ background (c) |

png pdf |
Auxiliary Figure 9:
The signal region at each grid point of the T1tttt scan with the lowest observed cross section limit. |
png pdf |
Auxiliary Figure 10:
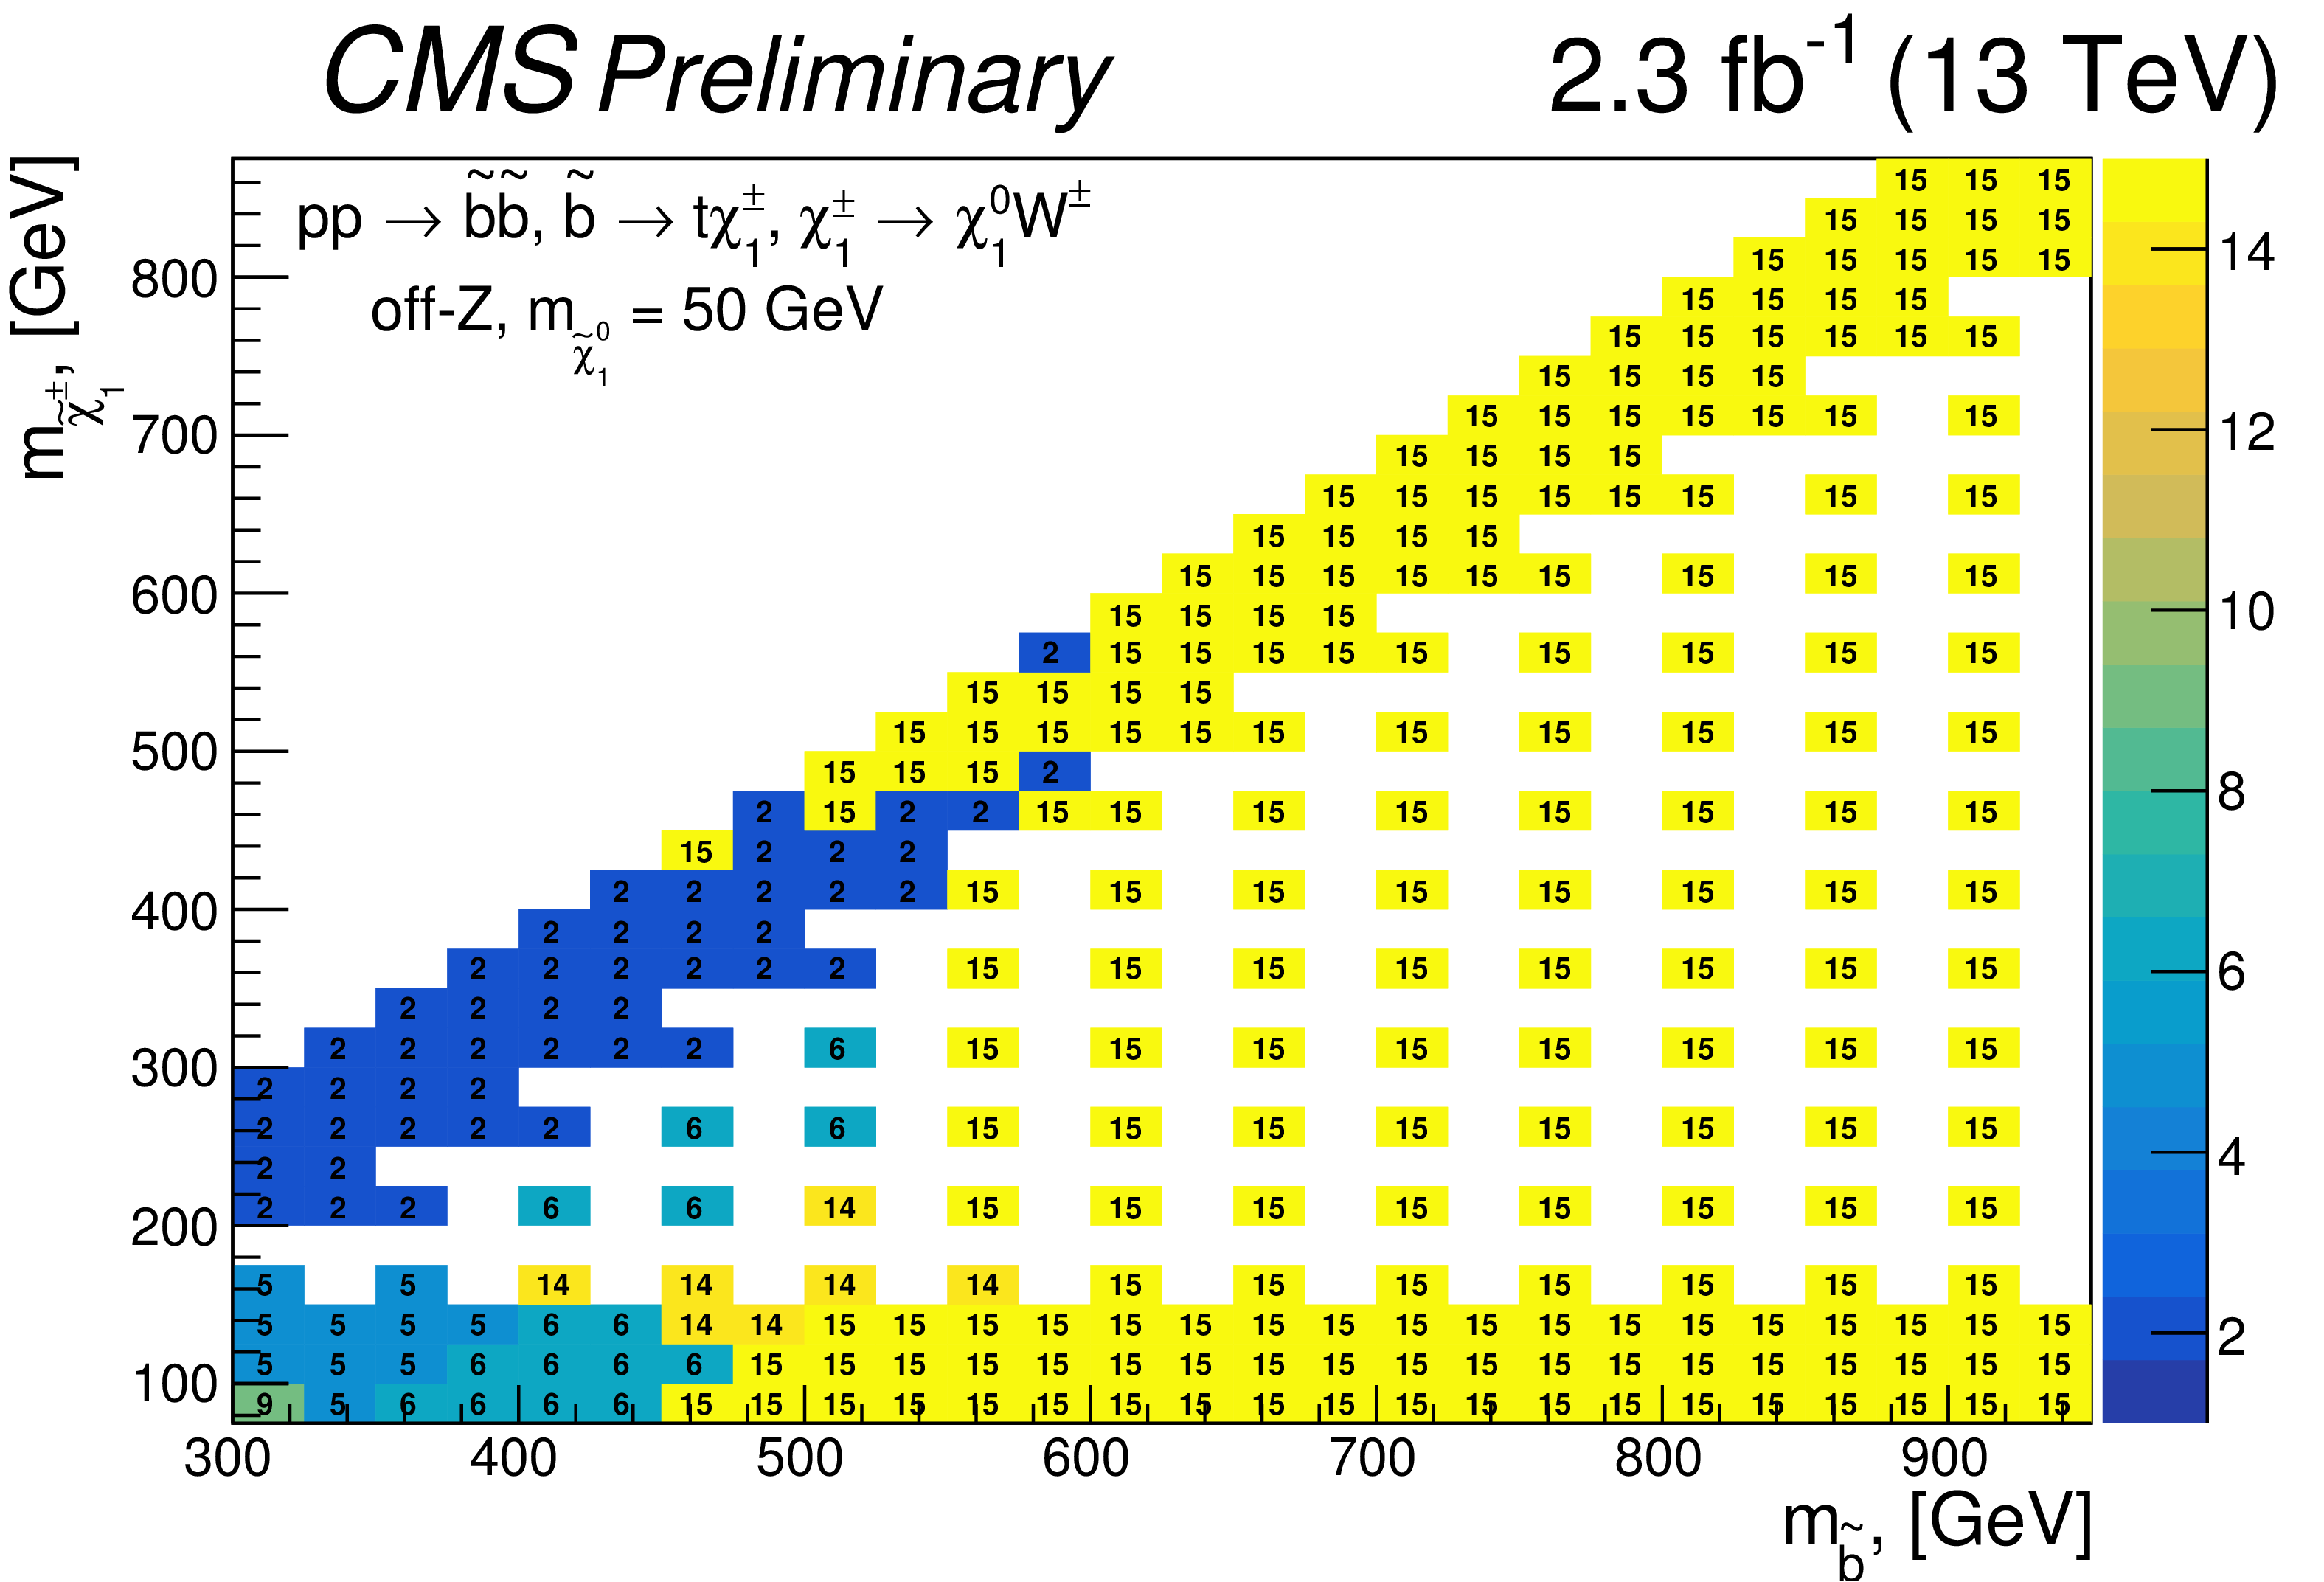
The signal region at each grid point of the T6ttWW scan with the lowest observed cross section limit. |

png pdf |
Auxiliary Figure 11:
The signal region at each grid point of the T5qqqqWZ scan with the lowest observed cross section limit. |
| Auxiliary Tables | |

png pdf |
Auxiliary Table 1:
Evolution of the yields of selected SUSY benchmark models targeted by the analysis with the cut flow of the off-Z baseline selection. The yields are normalized to an integrated luminosity of $ {\mathcal {L}} = $ 2.3 fb$^{-1}$. |

png pdf |
Auxiliary Table 2:
Evolution of the yields of selected mass points of the T1tttt SUSY benchmark model with the cut flow of the off-Z baseline selection. The yields are normalized to an integrated luminosity of $ {\mathcal {L}} =$ 2.3 fb$^{-1}$. |

png pdf |
Auxiliary Table 3:
Evolution of the yields of selected mass points of the T6ttWW SUSY benchmark model with the cut flow of the off-Z baseline selection. The $ {\tilde{\chi}^0_1} $ mass is fixed to 50 GeV. The yields are normalized to an integrated luminosity of $ {\mathcal {L}} =$ 2.3 fb$^{-1}$. |
png pdf |
Auxiliary Table 4:
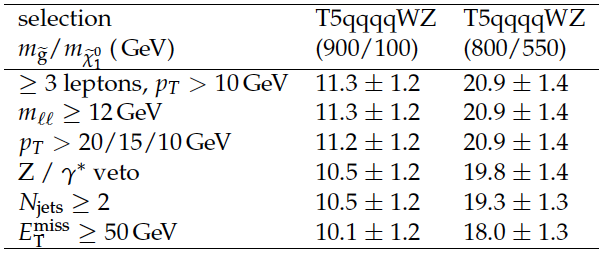
Evolution of the yields of selected mass points of the T5qqqqWZ SUSY benchmark model with the cut flow of the on-Z baseline selection. The chargino mass is fixed to $m_{\tilde{ \chi }^{\pm} } = 0.5 (m_{ \tilde{g} } - m_{ {\tilde{\chi}^0_1} })$. The yields are normalized to an integrated luminosity of $ {\mathcal {L}} =$ 2.3 fb$^{-1}$. |

png pdf |
Auxiliary Table 5:
The total expected yields in the off-Z search regions with the $ {\mathcal {L}} =$ 2.3 fb$^{-1}$ of data and signal yields of the T6ttWW model for several mass points. The mass points are characterized by the mass of the $ \tilde{b} $ and of the $\tilde{ \chi }^{\pm} $ in units of GeV. The mass of the $ {\tilde{\chi}^0_1} $ is fixed to $m_{ {\tilde{\chi}^0_1} } =$ 50 GeV. |
|
|
Compact Muon Solenoid LHC, CERN |
|

|

|

|

|

|