

Compact Muon Solenoid
LHC, CERN
| CMS-PAS-SUS-15-010 | ||
| Phenomenological MSSM interpretation of CMS results at $\sqrt{s}=$ 7 and 8 TeV | ||
| CMS Collaboration | ||
| October 2015 | ||
| Abstract: Using a global Bayesian analysis, it is shown how the results from searches for supersymmetry performed by CMS constrain the Minimal Supersymmetric Standard Model (MSSM). The study is performed within the framework of the phenomenological MSSM (pMSSM), a 19-parameter realization of the R-parity conserving weak-scale MSSM, that captures most of the latter's phenomenological features and which, therefore, permits robust conclusions to be drawn about the MSSM. It is found that all pMSSM points considered with a gluino mass below 500 GeV are excluded. In the mass range between 500 GeV and 1400 GeV, there are many scenarios that cannot as yet be excluded, contrary to current gluino mass limits using simplified models. Similar conclusions are made for squarks, charginos, and neutralinos. The mass of the lighter top squark $\tilde{t}_1$ is found to be unconstrained and, therefore, a relatively light $\tilde{t}_1$ cannot be excluded in the pMSSM context. Constraints on the pMSSM parameter space provided by the Higgs boson signal strength measurements do not alter the conclusions drawn from the direct searches for supersymmetry. The results used in this analysis are based on datasets from proton-proton collisions at 7 TeV and 8 TeV with integrated luminosities of 5.0 fb$^{-1}$ and 19.5 fb$^{-1}$, respectively. | ||
|
Links:
CDS record (PDF) ;
Public twiki page ;
CADI line (restricted) ; Figures are also available from the CDS record. These preliminary results are superseded in this paper, JHEP 10 (2016) 129. The superseded preliminary plots can be found here. |
||
| Figures | |
png ; pdf |
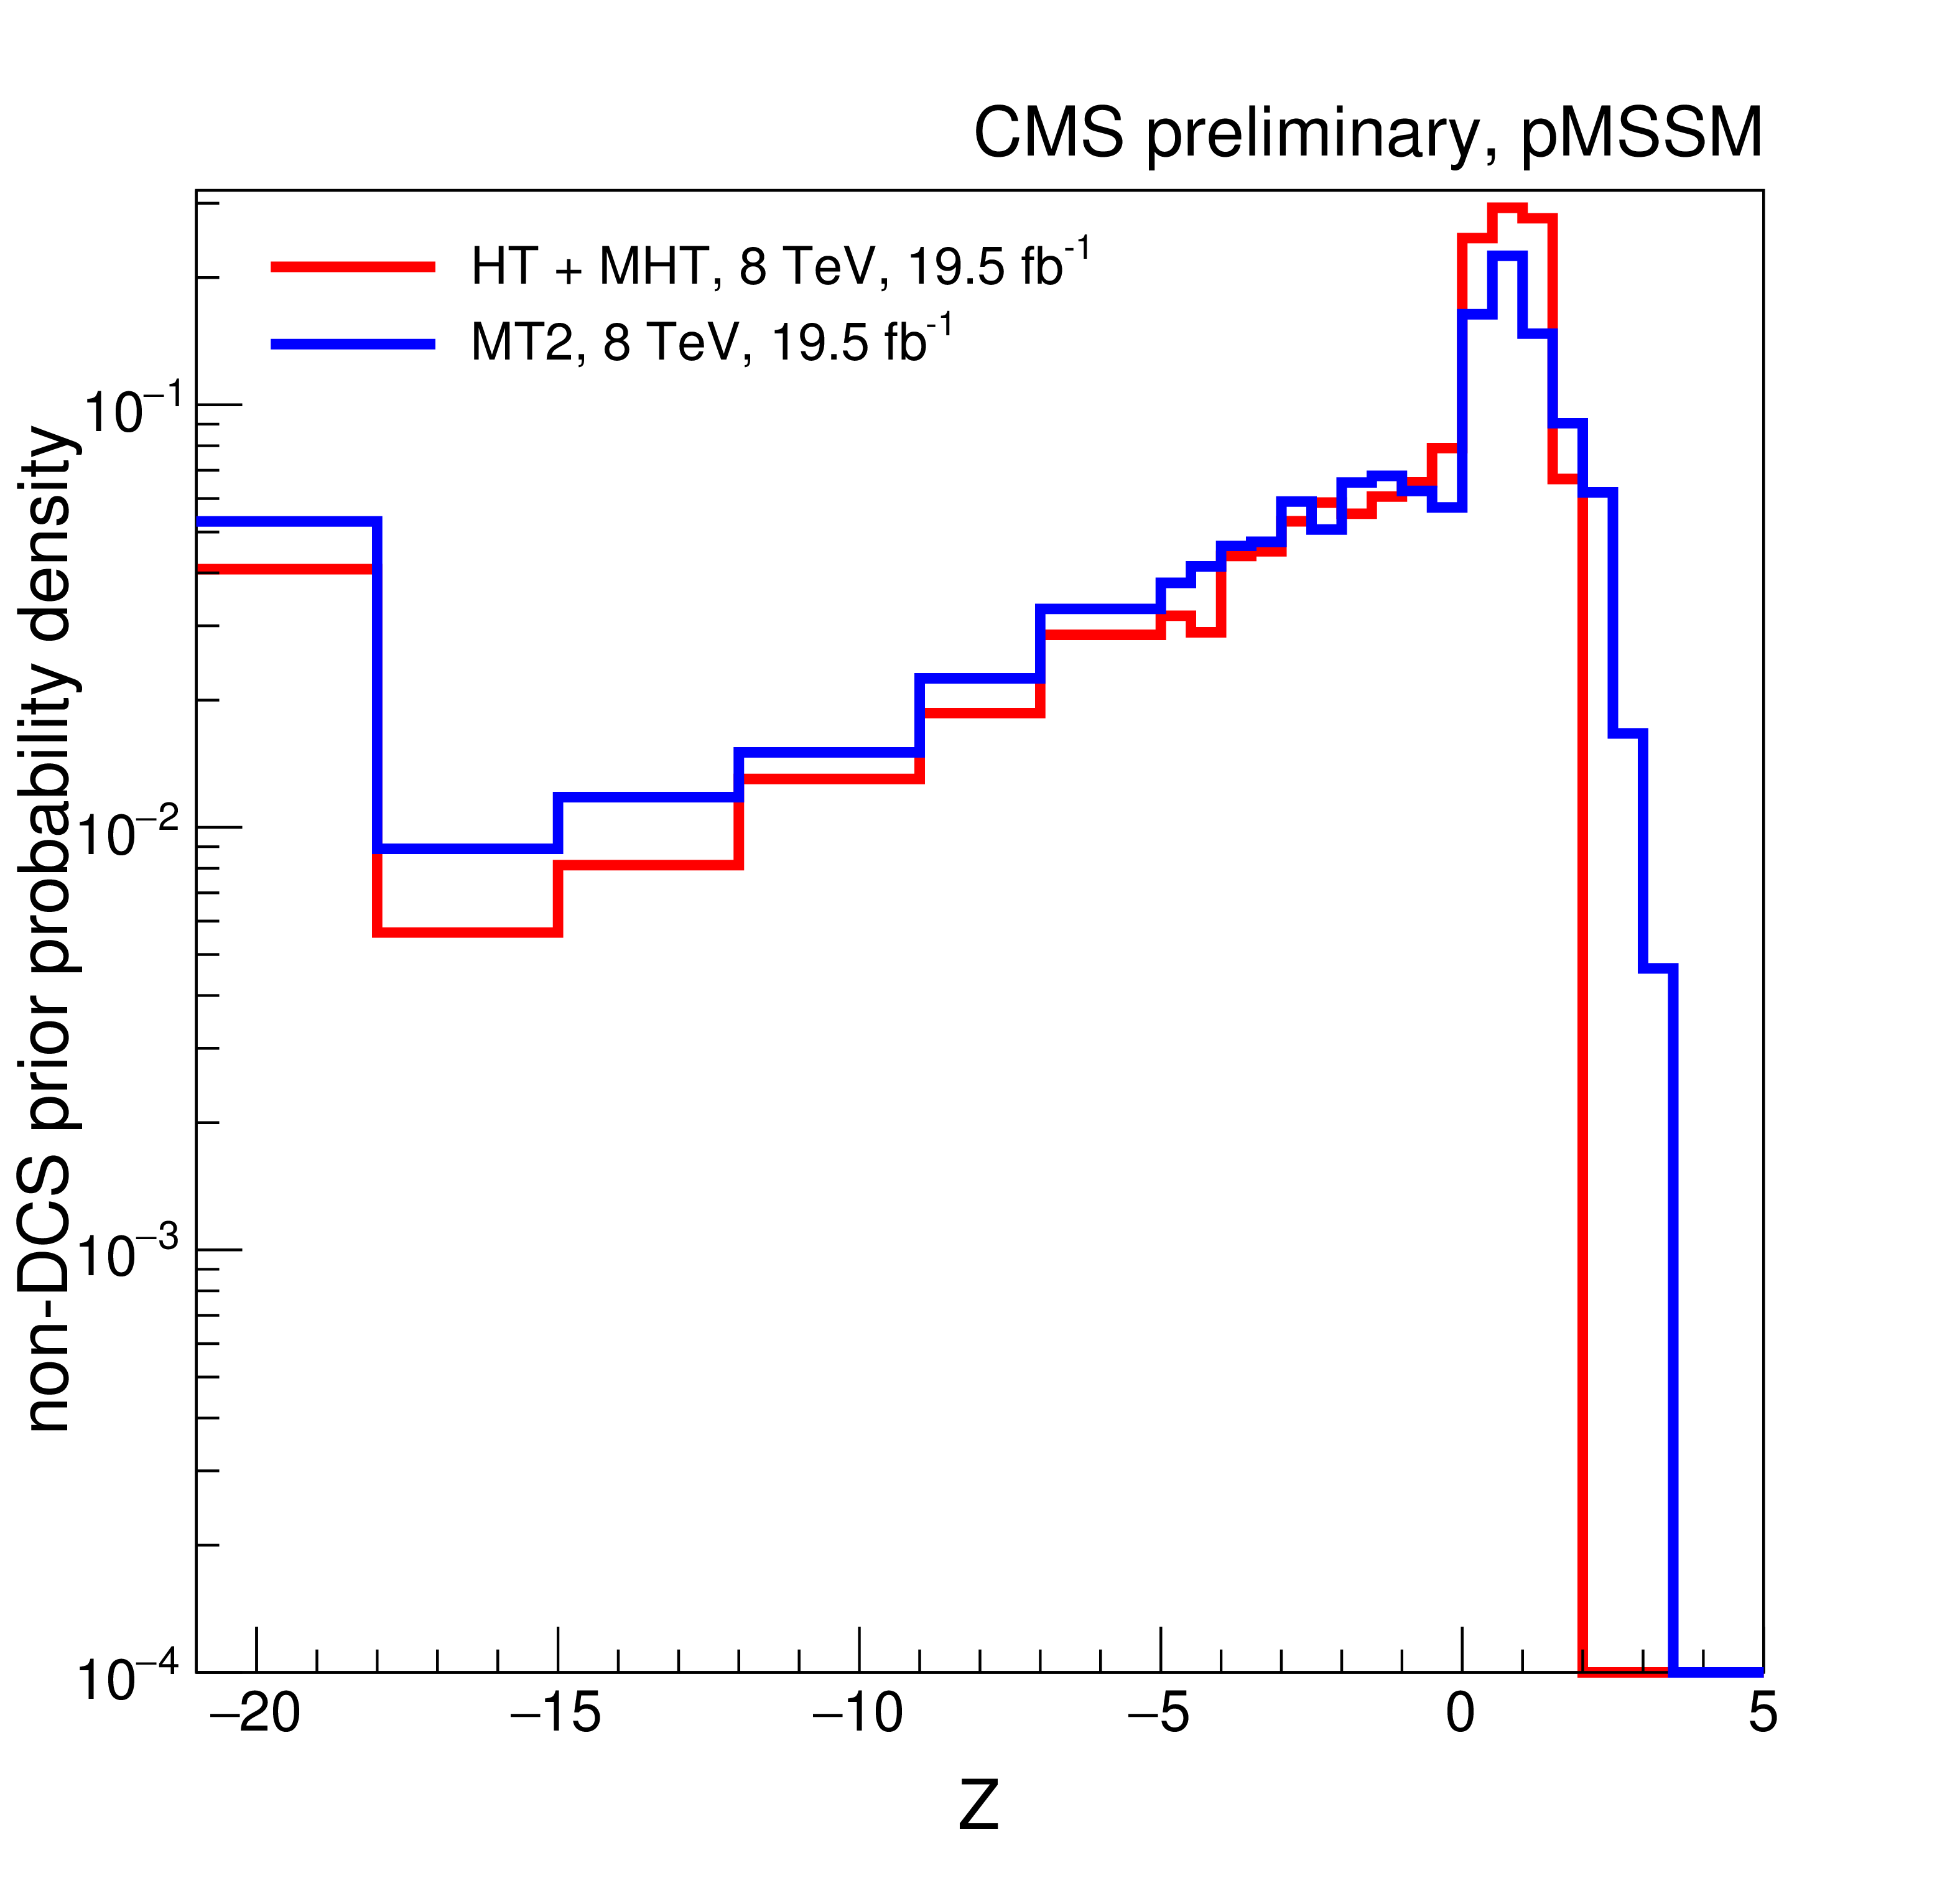
Figure 1-a:
$Z$-significance distributions for the individual 8 TeV searches (a-c), and for 7 TeV combined and 7$+$8 TeV combined searches (d). The left-most bin contains the underflow entries. |
png ; pdf |
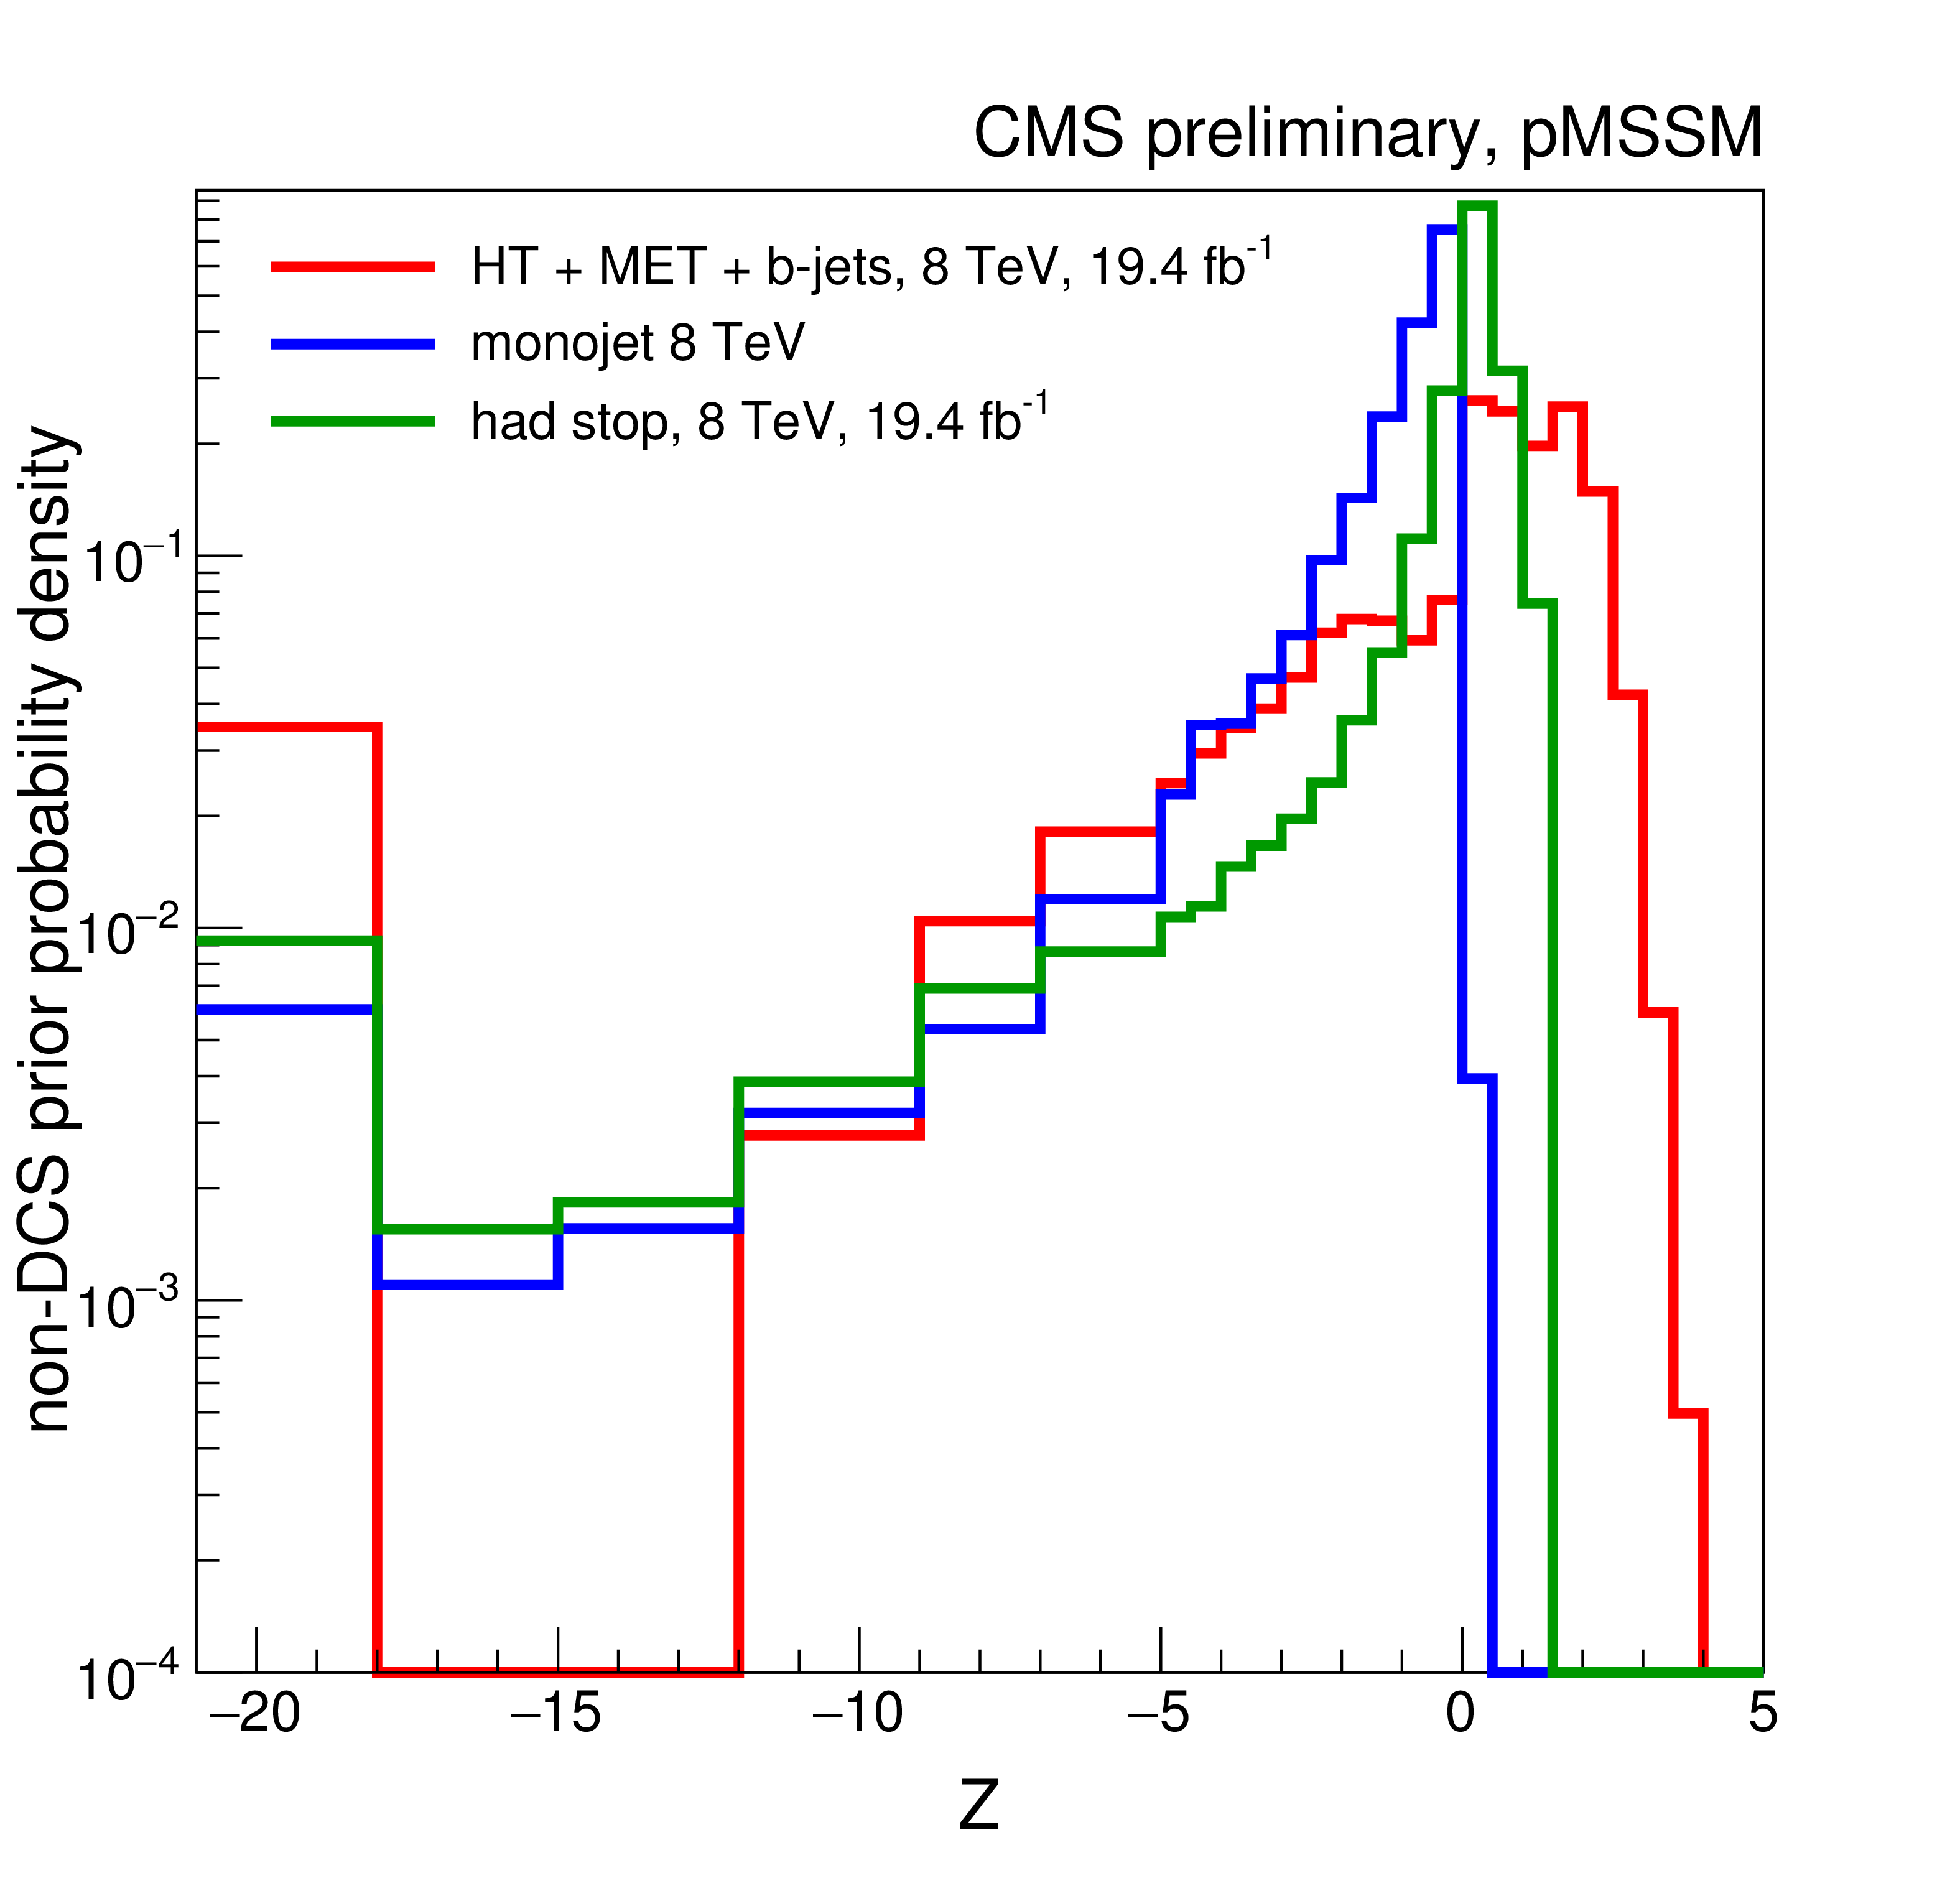
Figure 1-b:
$Z$-significance distributions for the individual 8 TeV searches (a-c), and for 7 TeV combined and 7$+$8 TeV combined searches (d). The left-most bin contains the underflow entries. |
png ; pdf |
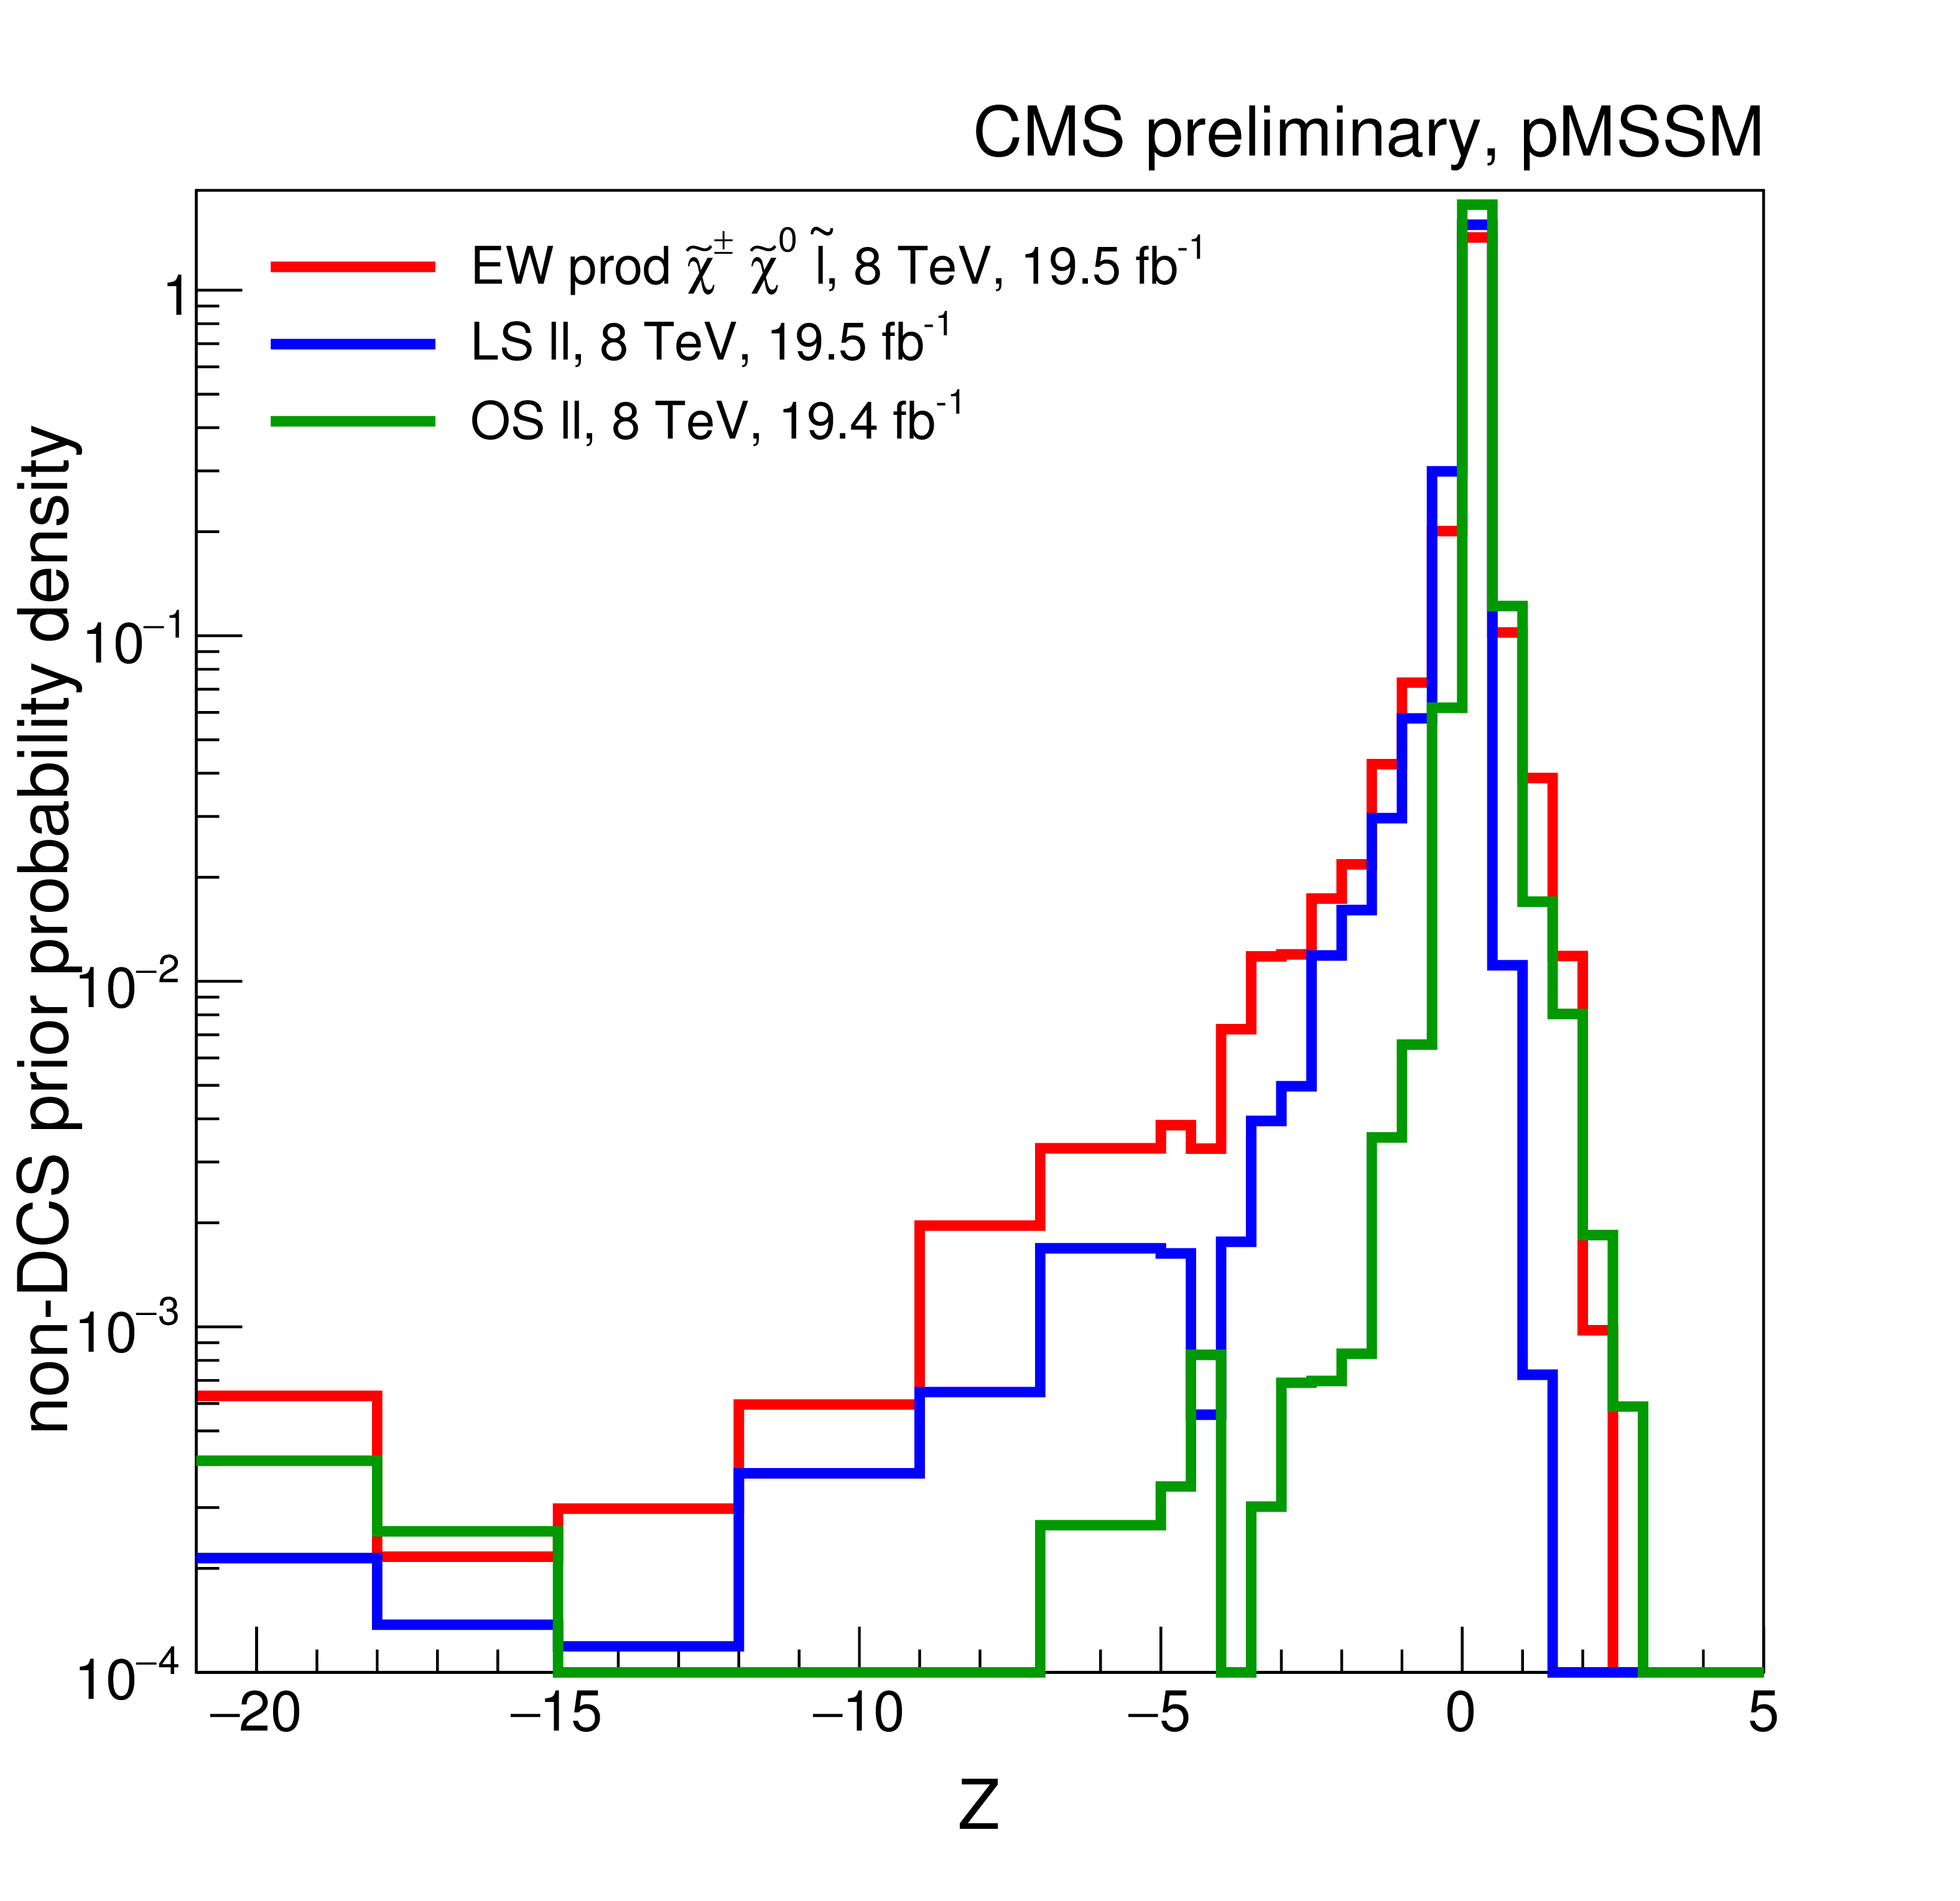
Figure 1-c:
$Z$-significance distributions for the individual 8 TeV searches (a-c), and for 7 TeV combined and 7$+$8 TeV combined searches (d). The left-most bin contains the underflow entries. |

png ; pdf |
Figure 1-d:
$Z$-significance distributions for the individual 8 TeV searches (a-c), and for 7 TeV combined and 7$+$8 TeV combined searches (d). The left-most bin contains the underflow entries. |

png ; pdf |
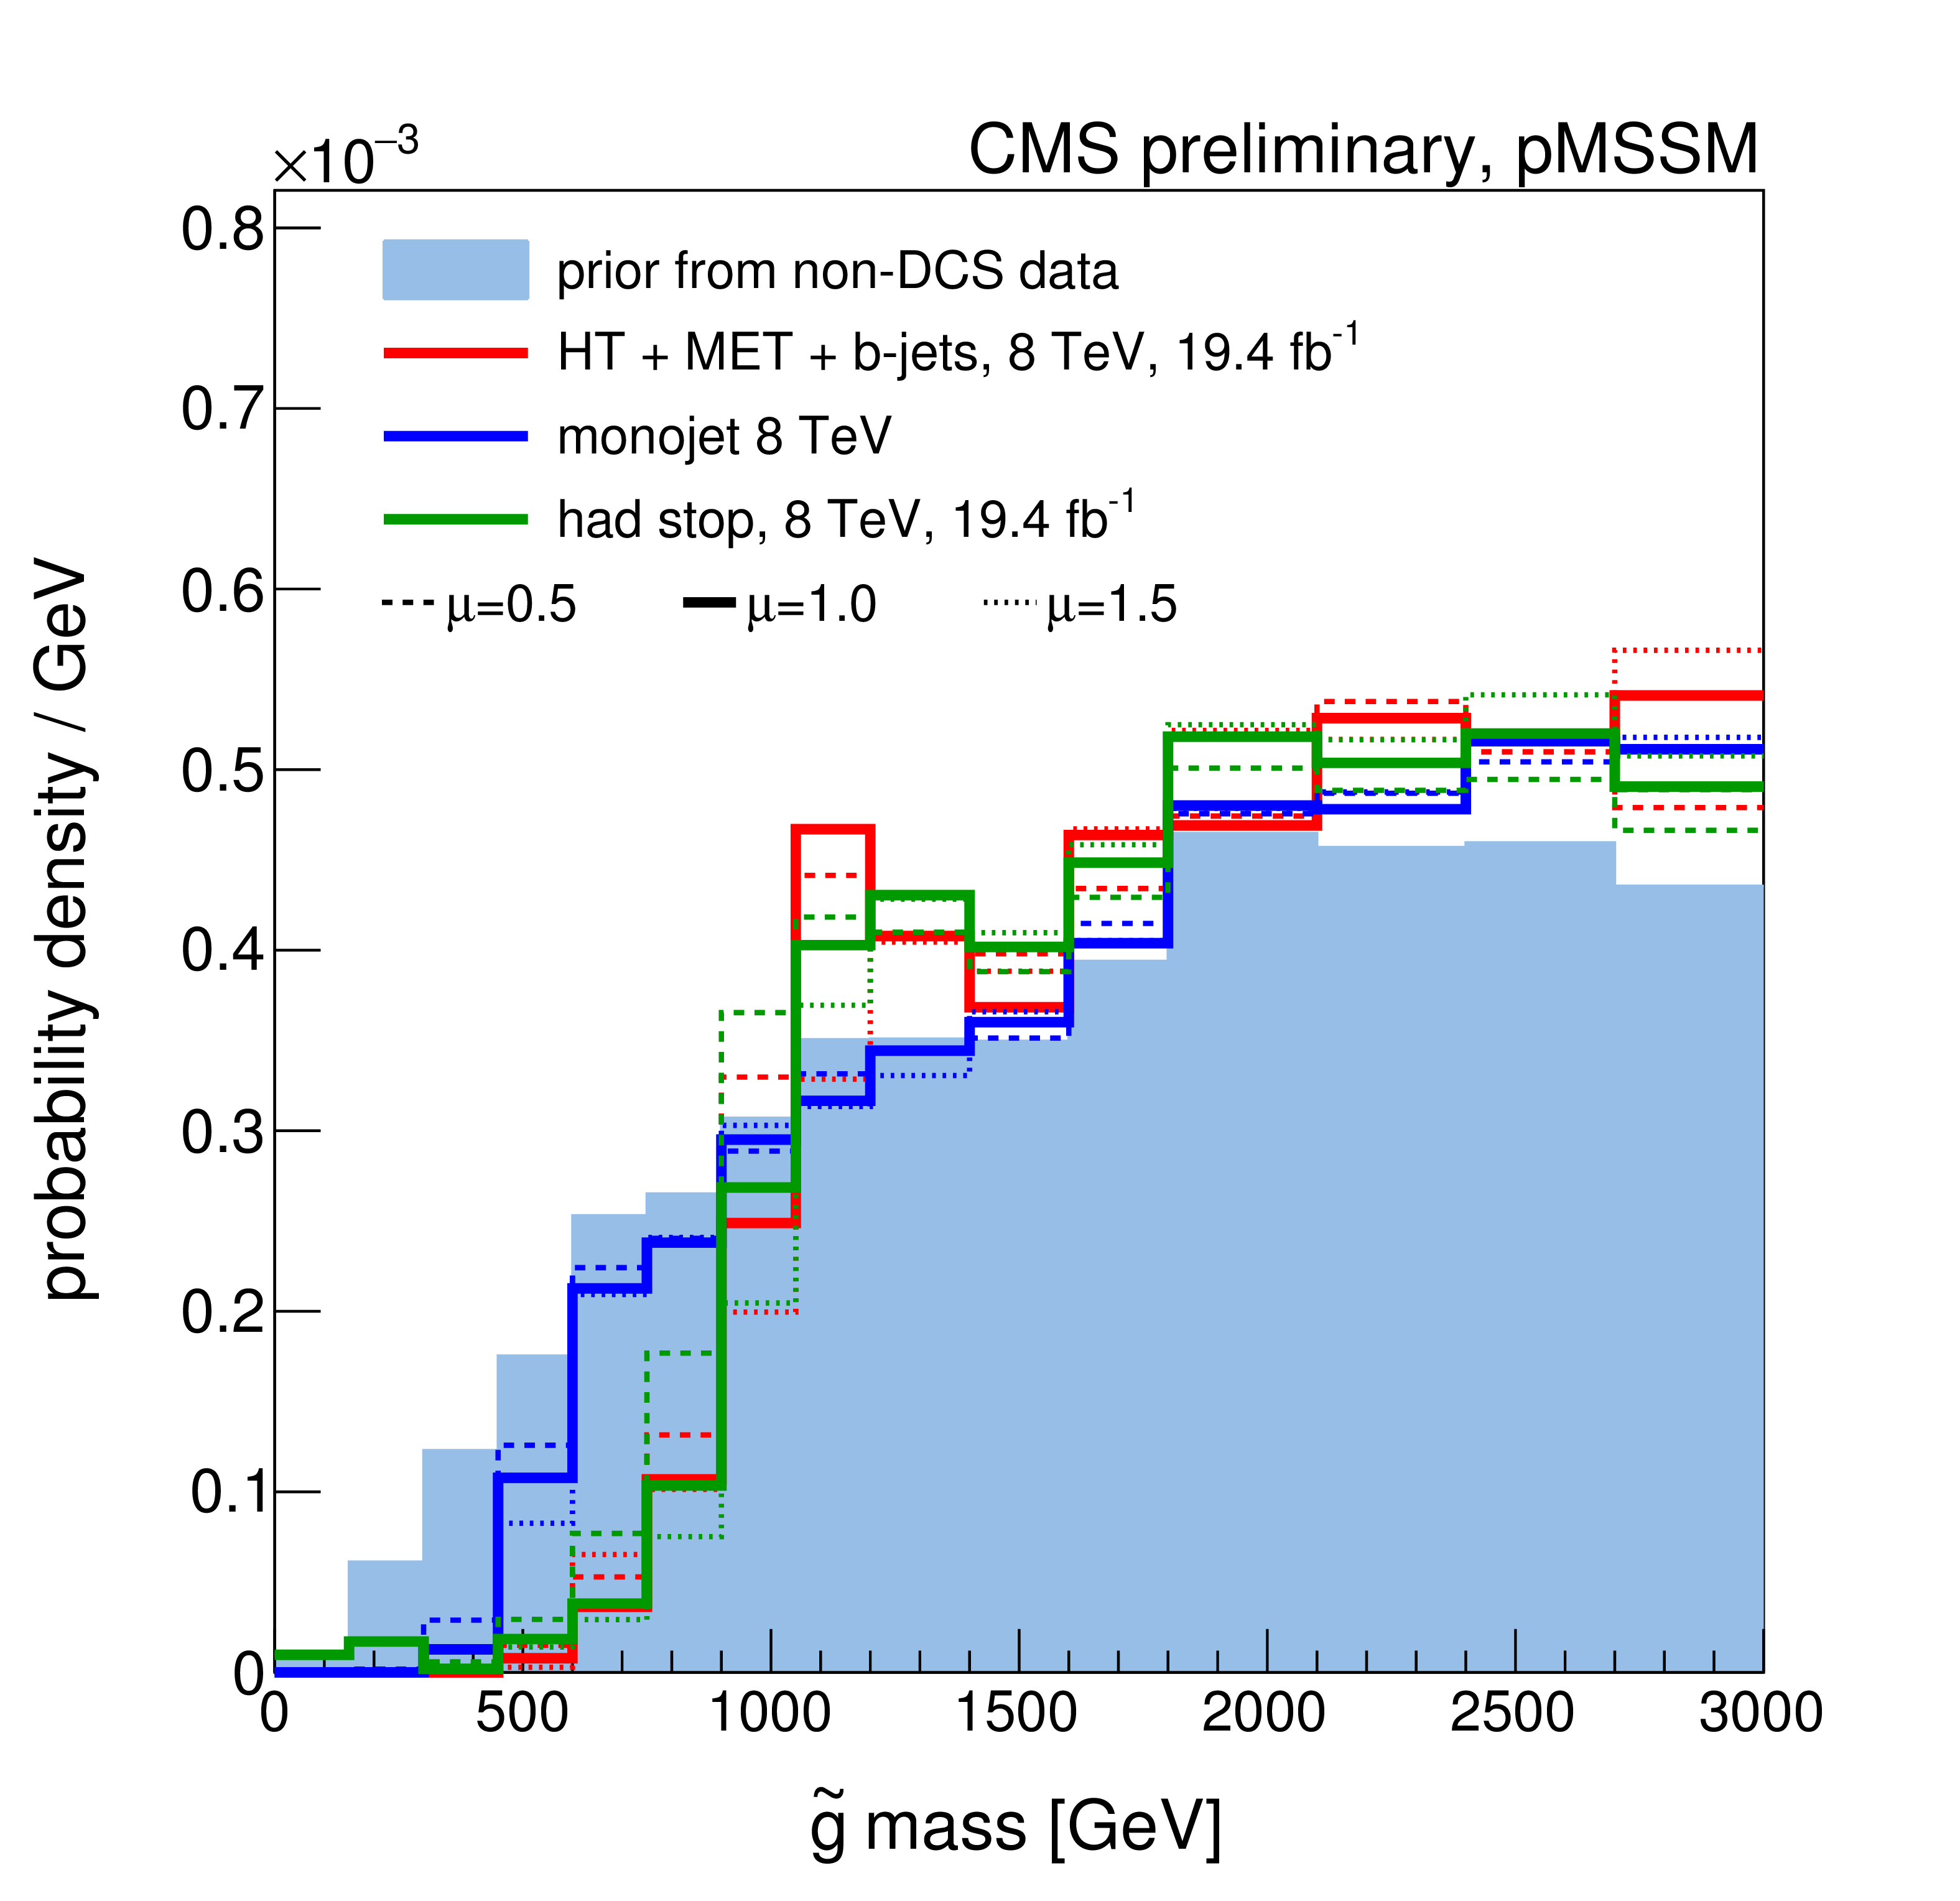
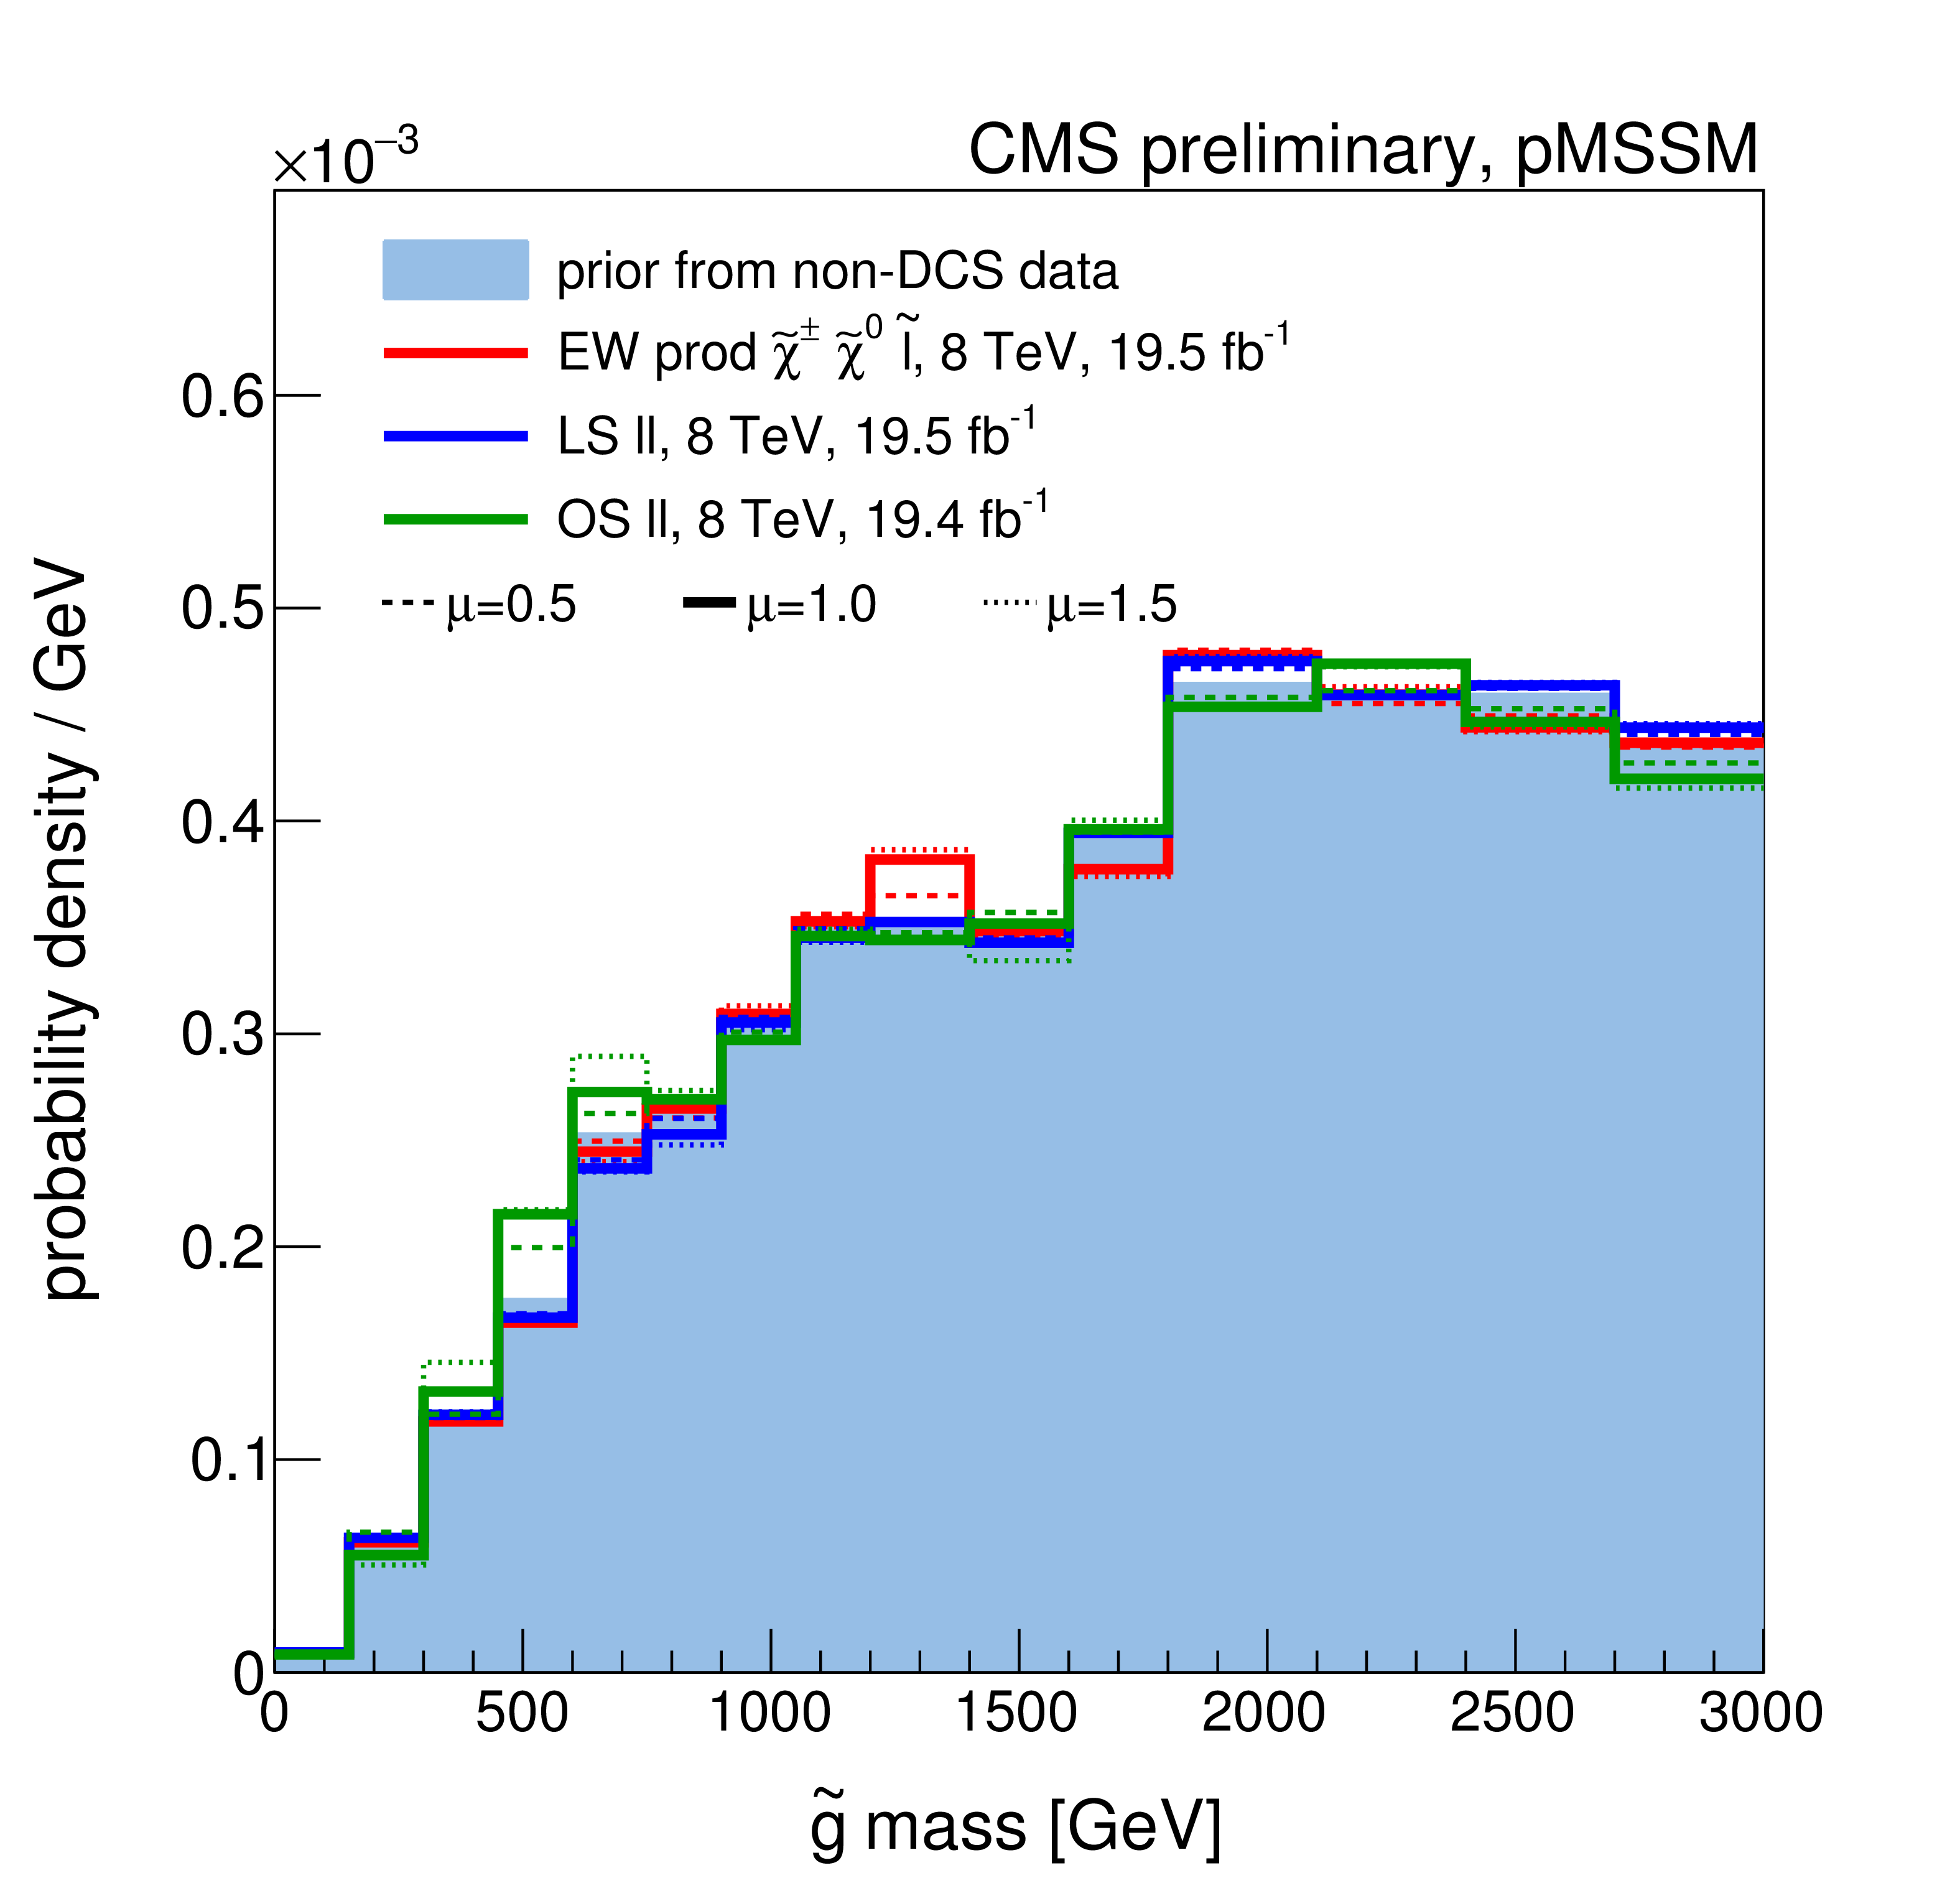
Figure 2-a:
A summary of the impact of CMS searches on our knowledge of the gluino mass in the pMSSM parameter space. Plots (a)-(d) compare the non-DCS prior distribution of the gluino mass (blue filled histograms) to posterior distributions after data from various CMS searches (line histograms), where (d) shows the combined effect of CMS searches and the Higgs boson results. Plot (e) shows survival probabilities as a function of the gluino mass for various combinations of CMS data and data from Higgs boson measurements. Plot (f) shows the distribution of the gluino mass versus the $Z$-significance calculated from the combination of all searches. |
png ; pdf |
Figure 2-b:
A summary of the impact of CMS searches on our knowledge of the gluino mass in the pMSSM parameter space. Plots (a)-(d) compare the non-DCS prior distribution of the gluino mass (blue filled histograms) to posterior distributions after data from various CMS searches (line histograms), where (d) shows the combined effect of CMS searches and the Higgs boson results. Plot (e) shows survival probabilities as a function of the gluino mass for various combinations of CMS data and data from Higgs boson measurements. Plot (f) shows the distribution of the gluino mass versus the $Z$-significance calculated from the combination of all searches. |
png ; pdf |
Figure 2-c:
A summary of the impact of CMS searches on our knowledge of the gluino mass in the pMSSM parameter space. Plots (a)-(d) compare the non-DCS prior distribution of the gluino mass (blue filled histograms) to posterior distributions after data from various CMS searches (line histograms), where (d) shows the combined effect of CMS searches and the Higgs boson results. Plot (e) shows survival probabilities as a function of the gluino mass for various combinations of CMS data and data from Higgs boson measurements. Plot (f) shows the distribution of the gluino mass versus the $Z$-significance calculated from the combination of all searches. |
png ; pdf |
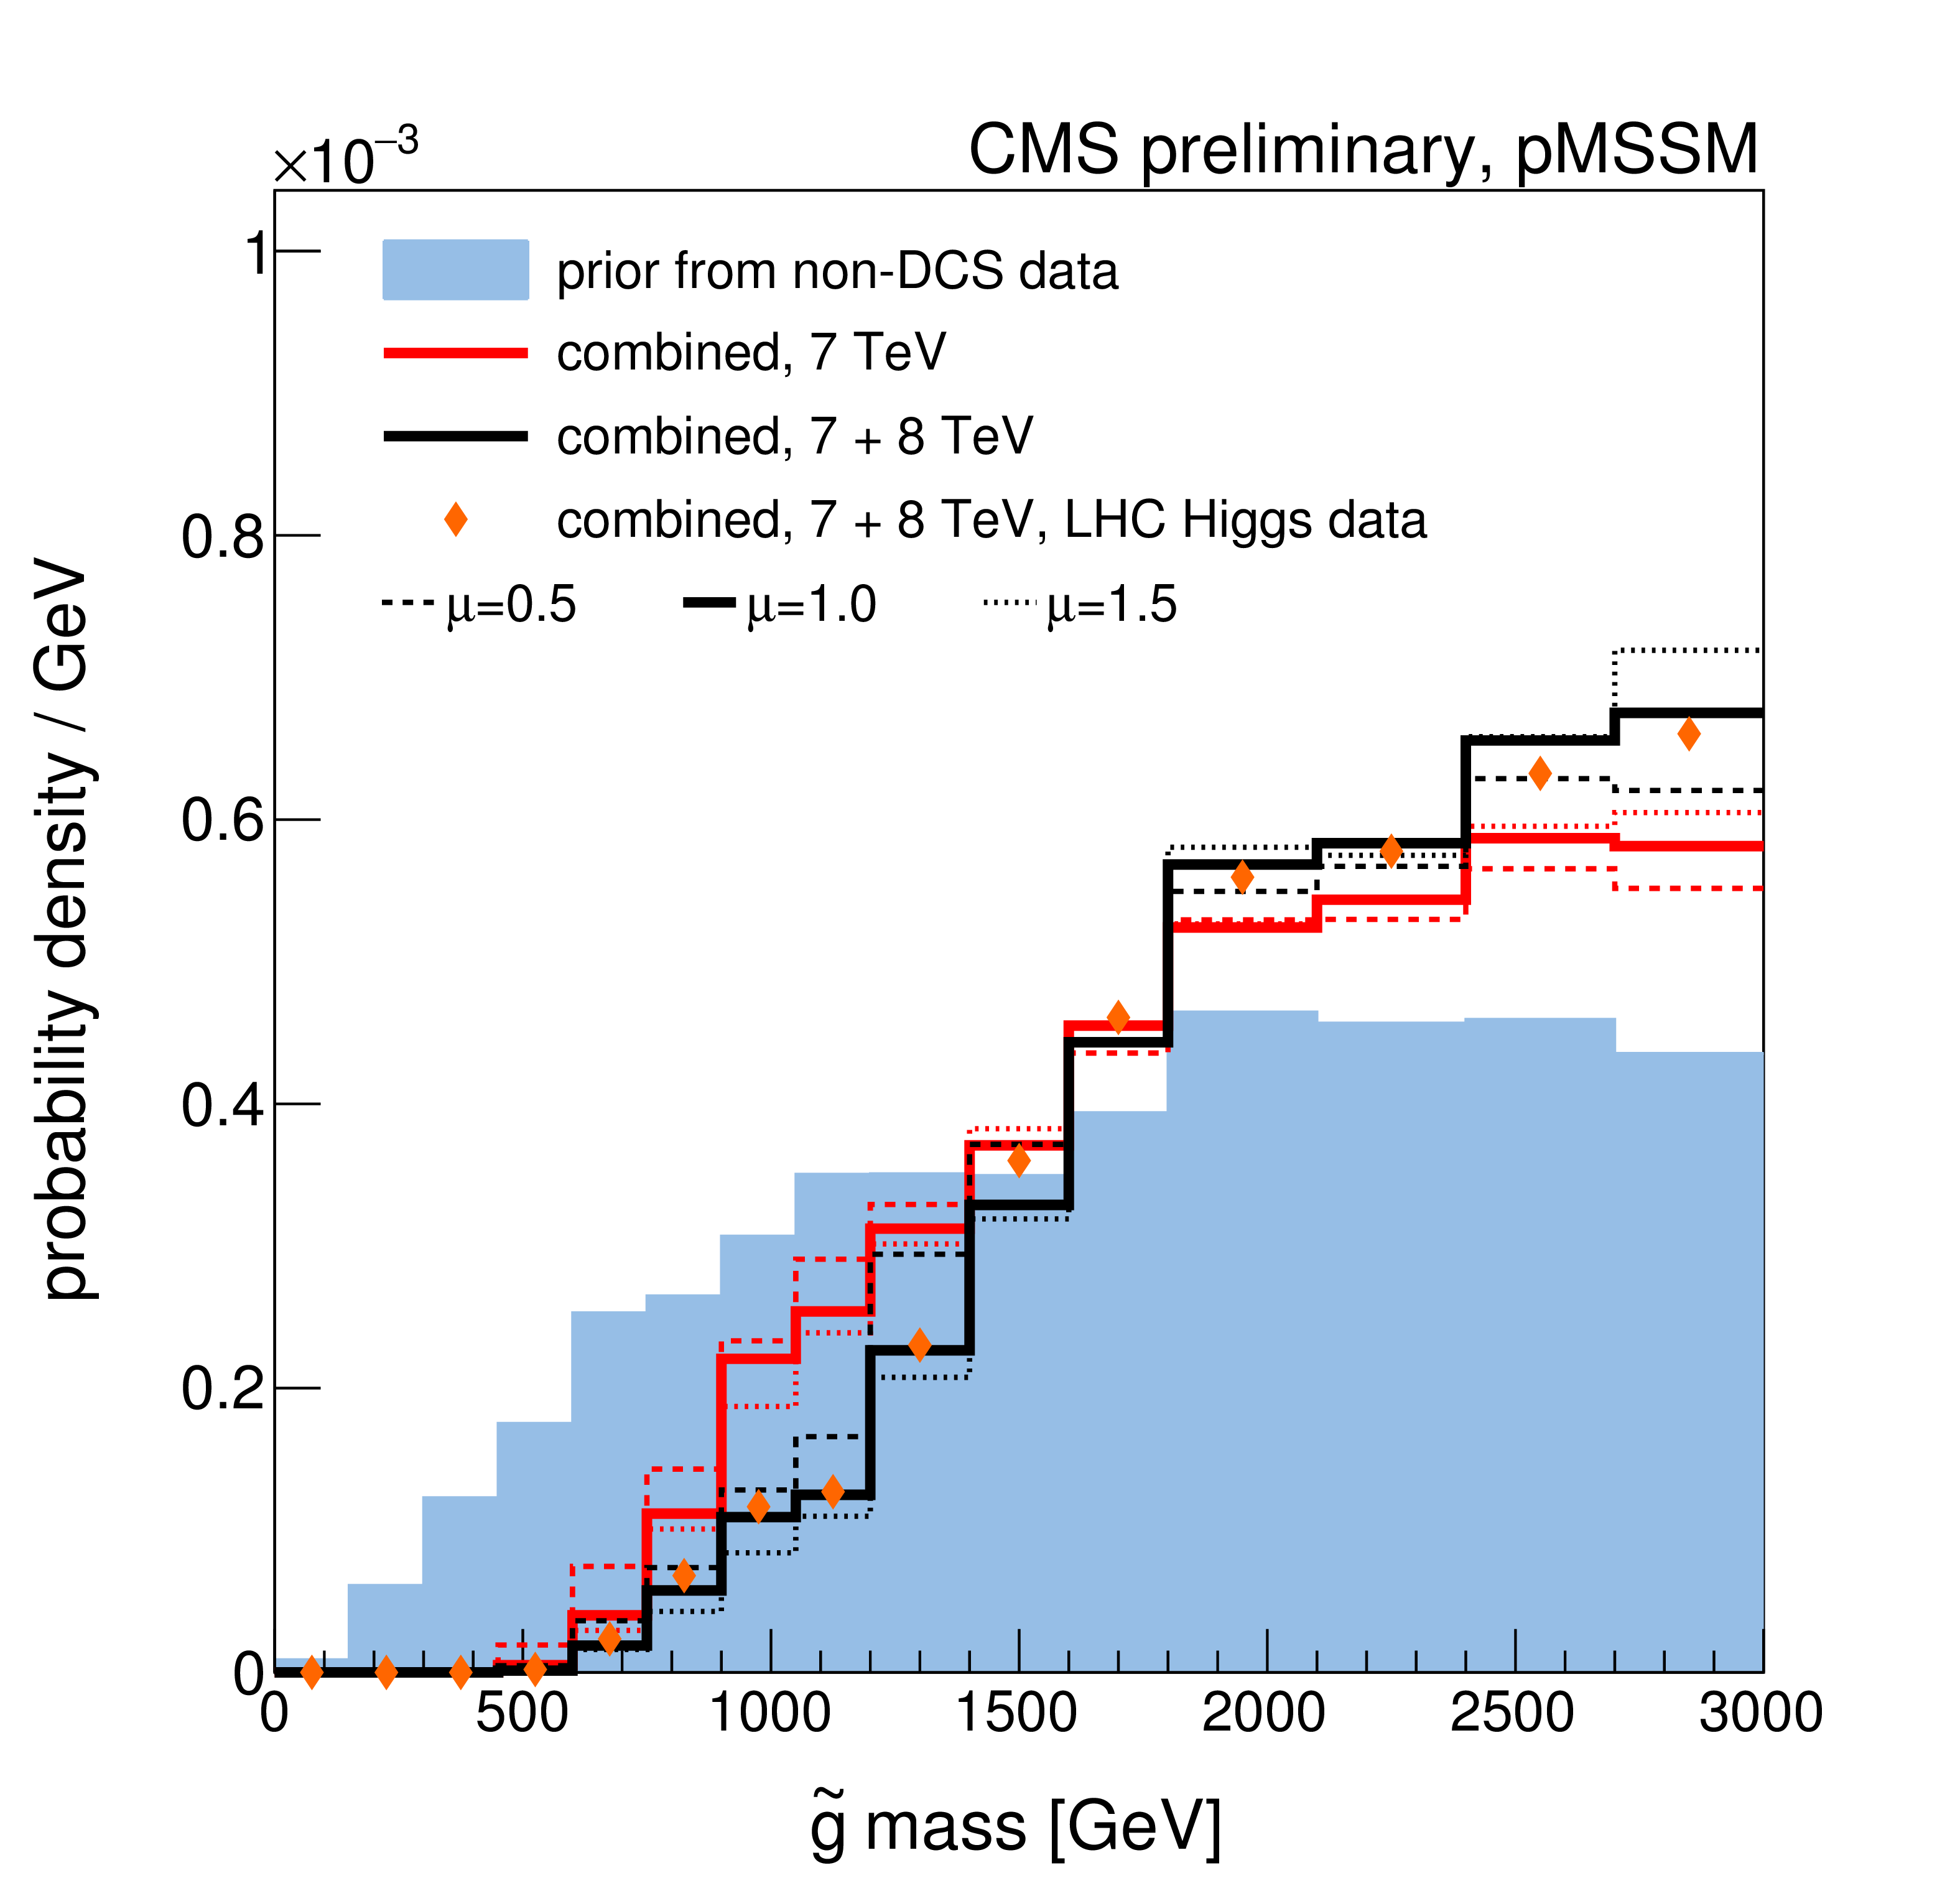
Figure 2-d:
A summary of the impact of CMS searches on our knowledge of the gluino mass in the pMSSM parameter space. Plots (a)-(d) compare the non-DCS prior distribution of the gluino mass (blue filled histograms) to posterior distributions after data from various CMS searches (line histograms), where (d) shows the combined effect of CMS searches and the Higgs boson results. Plot (e) shows survival probabilities as a function of the gluino mass for various combinations of CMS data and data from Higgs boson measurements. Plot (f) shows the distribution of the gluino mass versus the $Z$-significance calculated from the combination of all searches. |
png ; pdf |
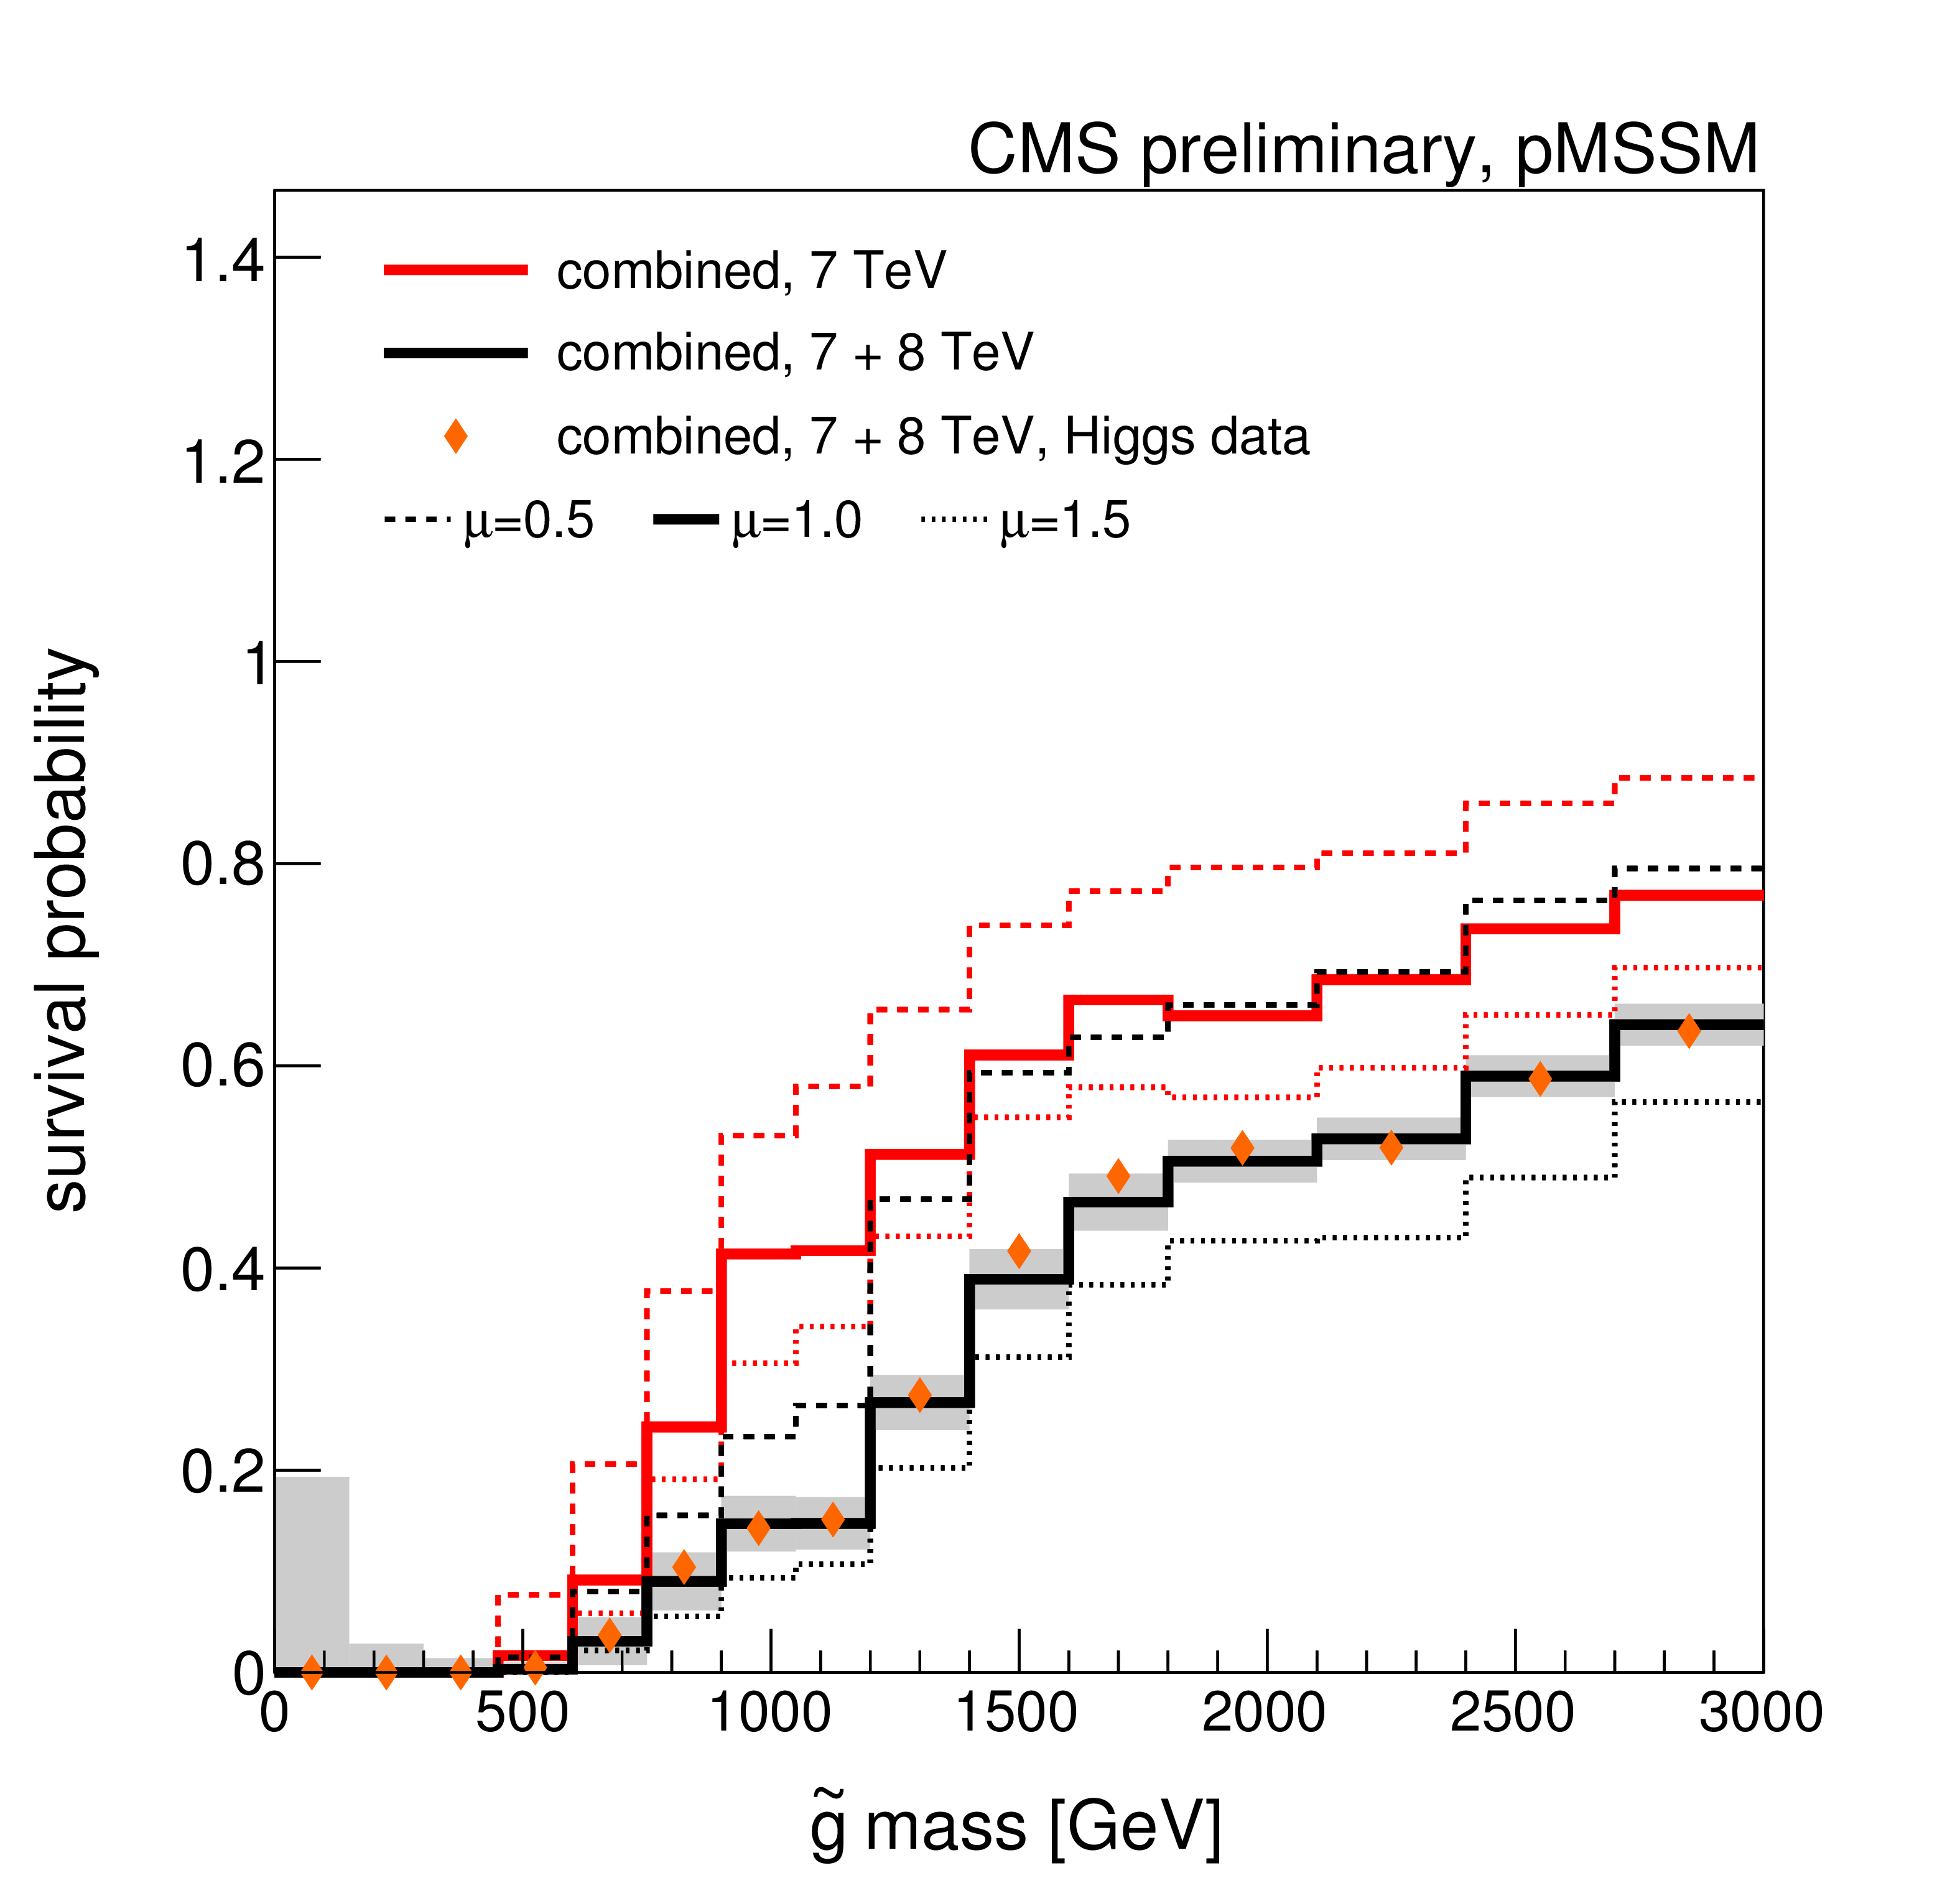
Figure 2-e:
A summary of the impact of CMS searches on our knowledge of the gluino mass in the pMSSM parameter space. Plots (a)-(d) compare the non-DCS prior distribution of the gluino mass (blue filled histograms) to posterior distributions after data from various CMS searches (line histograms), where (d) shows the combined effect of CMS searches and the Higgs boson results. Plot (e) shows survival probabilities as a function of the gluino mass for various combinations of CMS data and data from Higgs boson measurements. Plot (f) shows the distribution of the gluino mass versus the $Z$-significance calculated from the combination of all searches. |
png ; pdf |
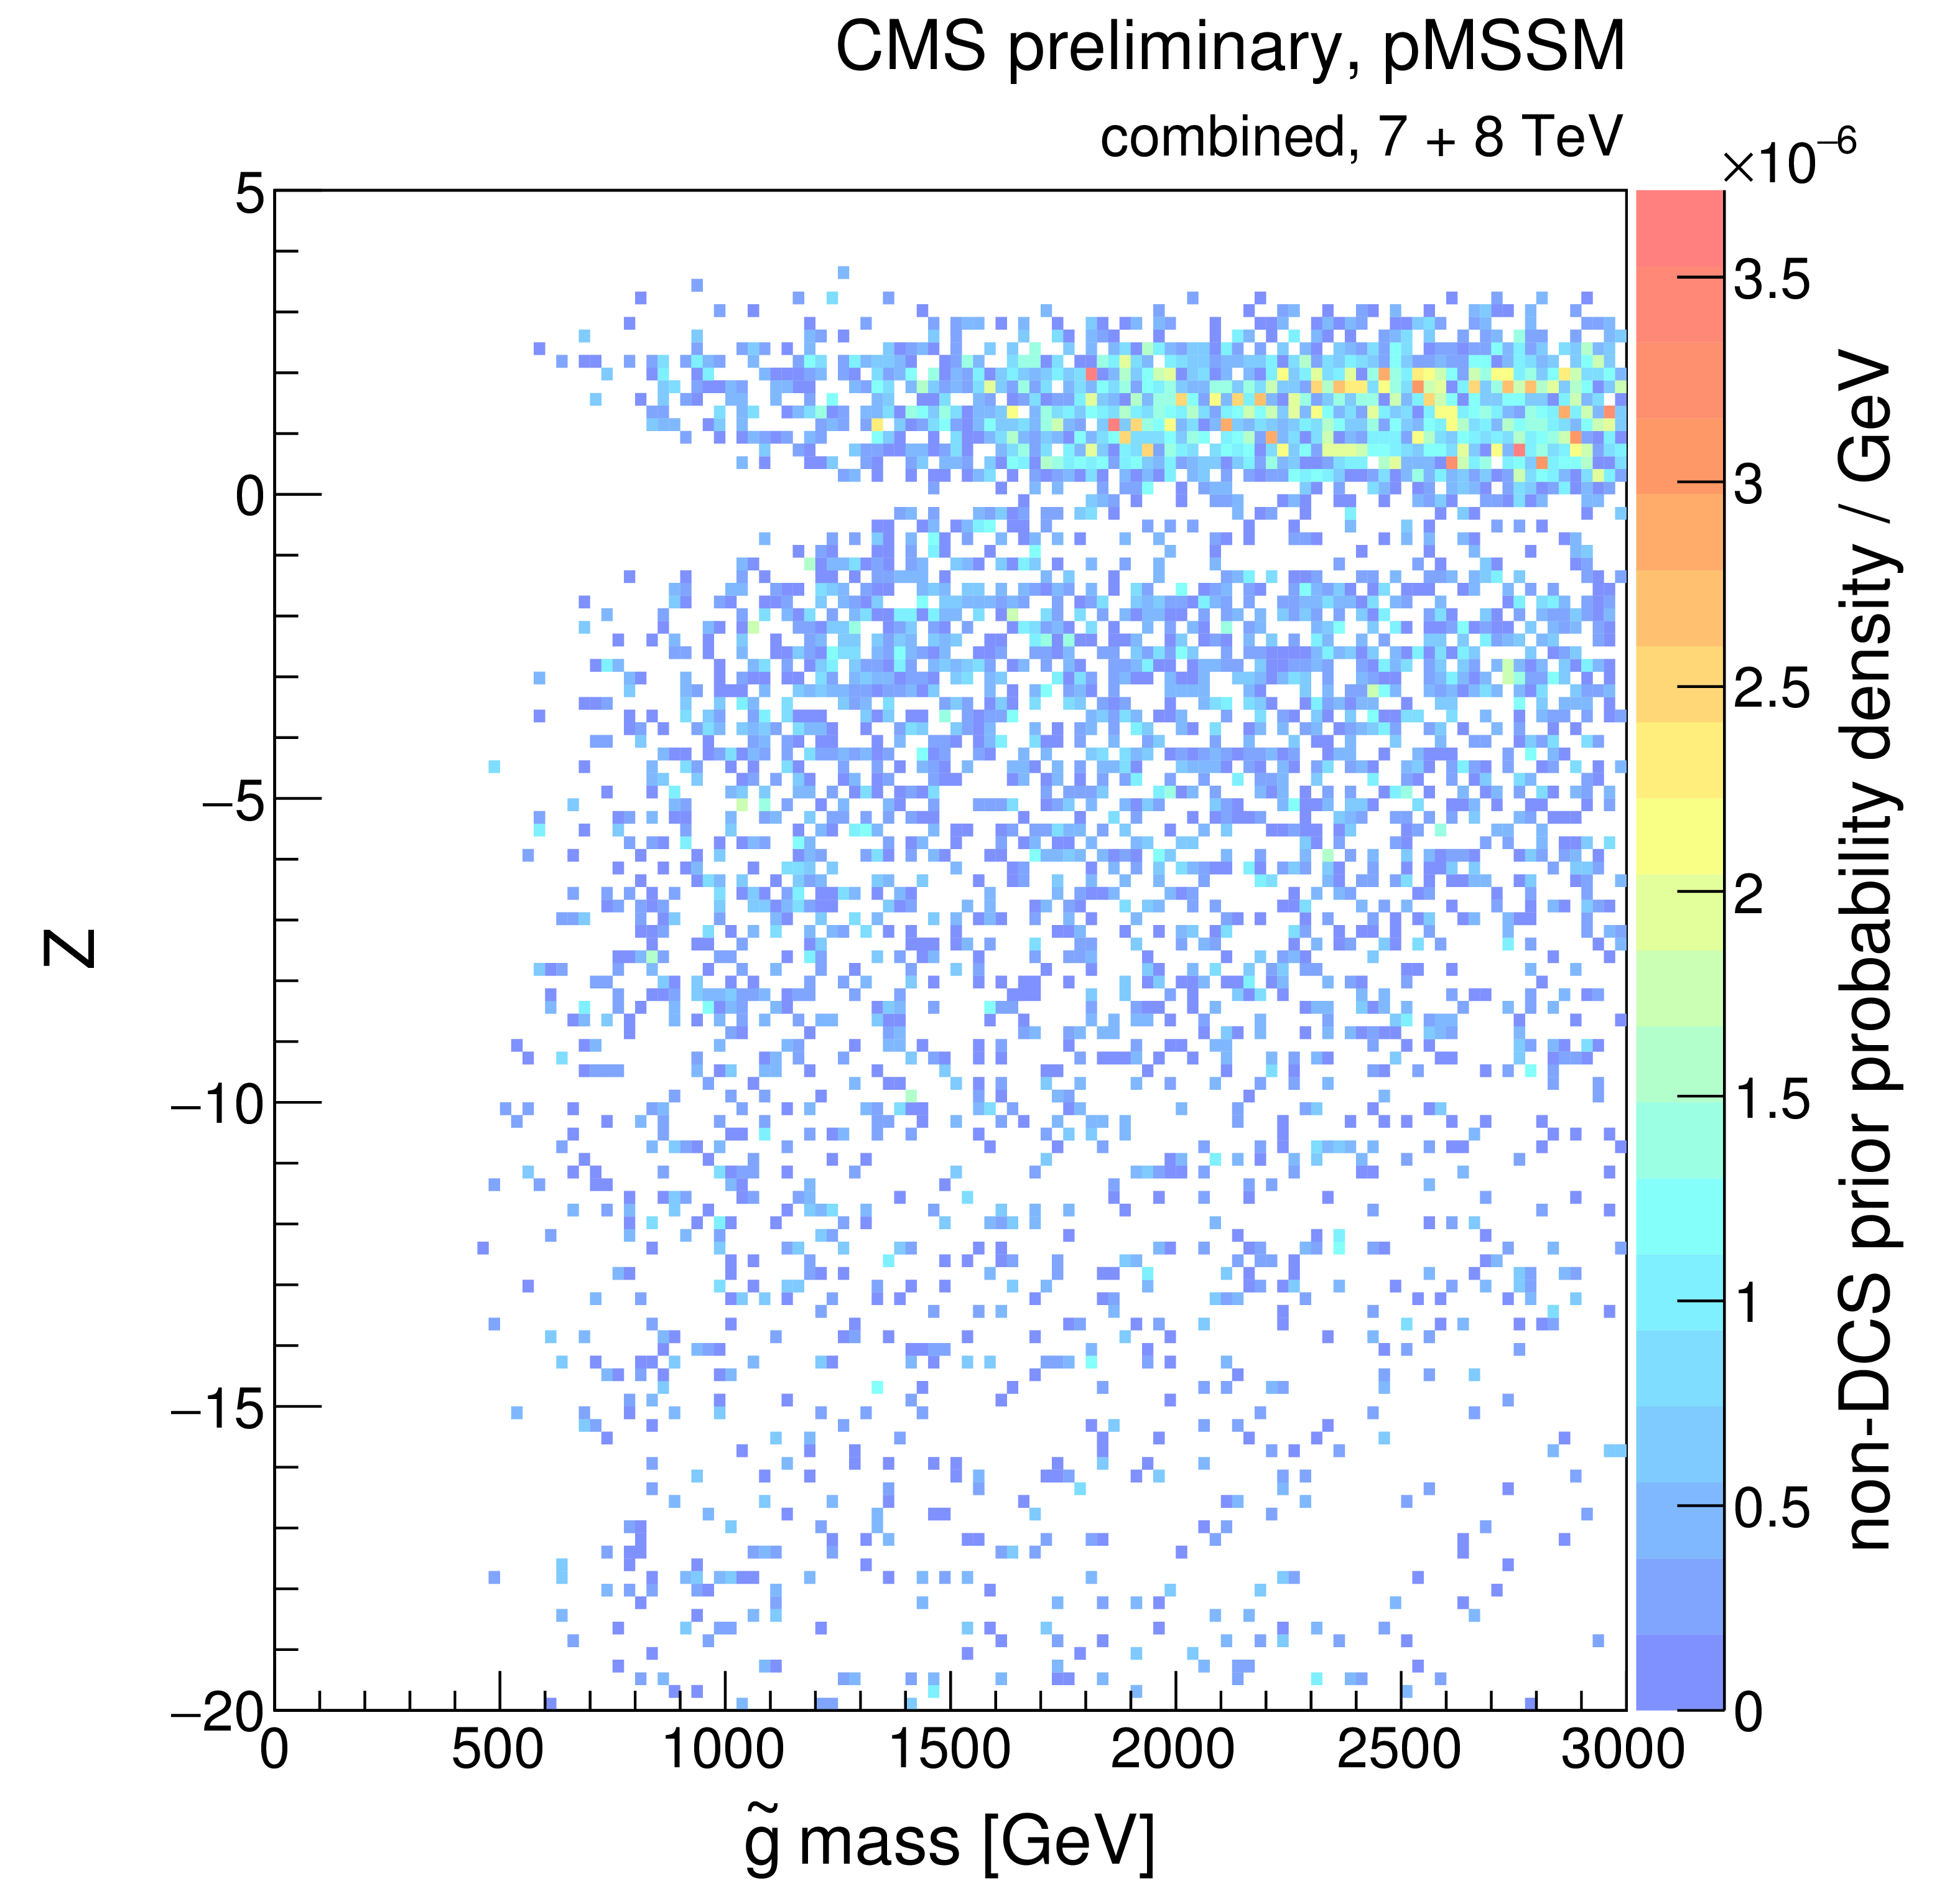
Figure 2-f:
A summary of the impact of CMS searches on our knowledge of the gluino mass in the pMSSM parameter space. Plots (a)-(d) compare the non-DCS prior distribution of the gluino mass (blue filled histograms) to posterior distributions after data from various CMS searches (line histograms), where (d) shows the combined effect of CMS searches and the Higgs boson results. Plot (e) shows survival probabilities as a function of the gluino mass for various combinations of CMS data and data from Higgs boson measurements. Plot (f) shows the distribution of the gluino mass versus the $Z$-significance calculated from the combination of all searches. |
png ; pdf |
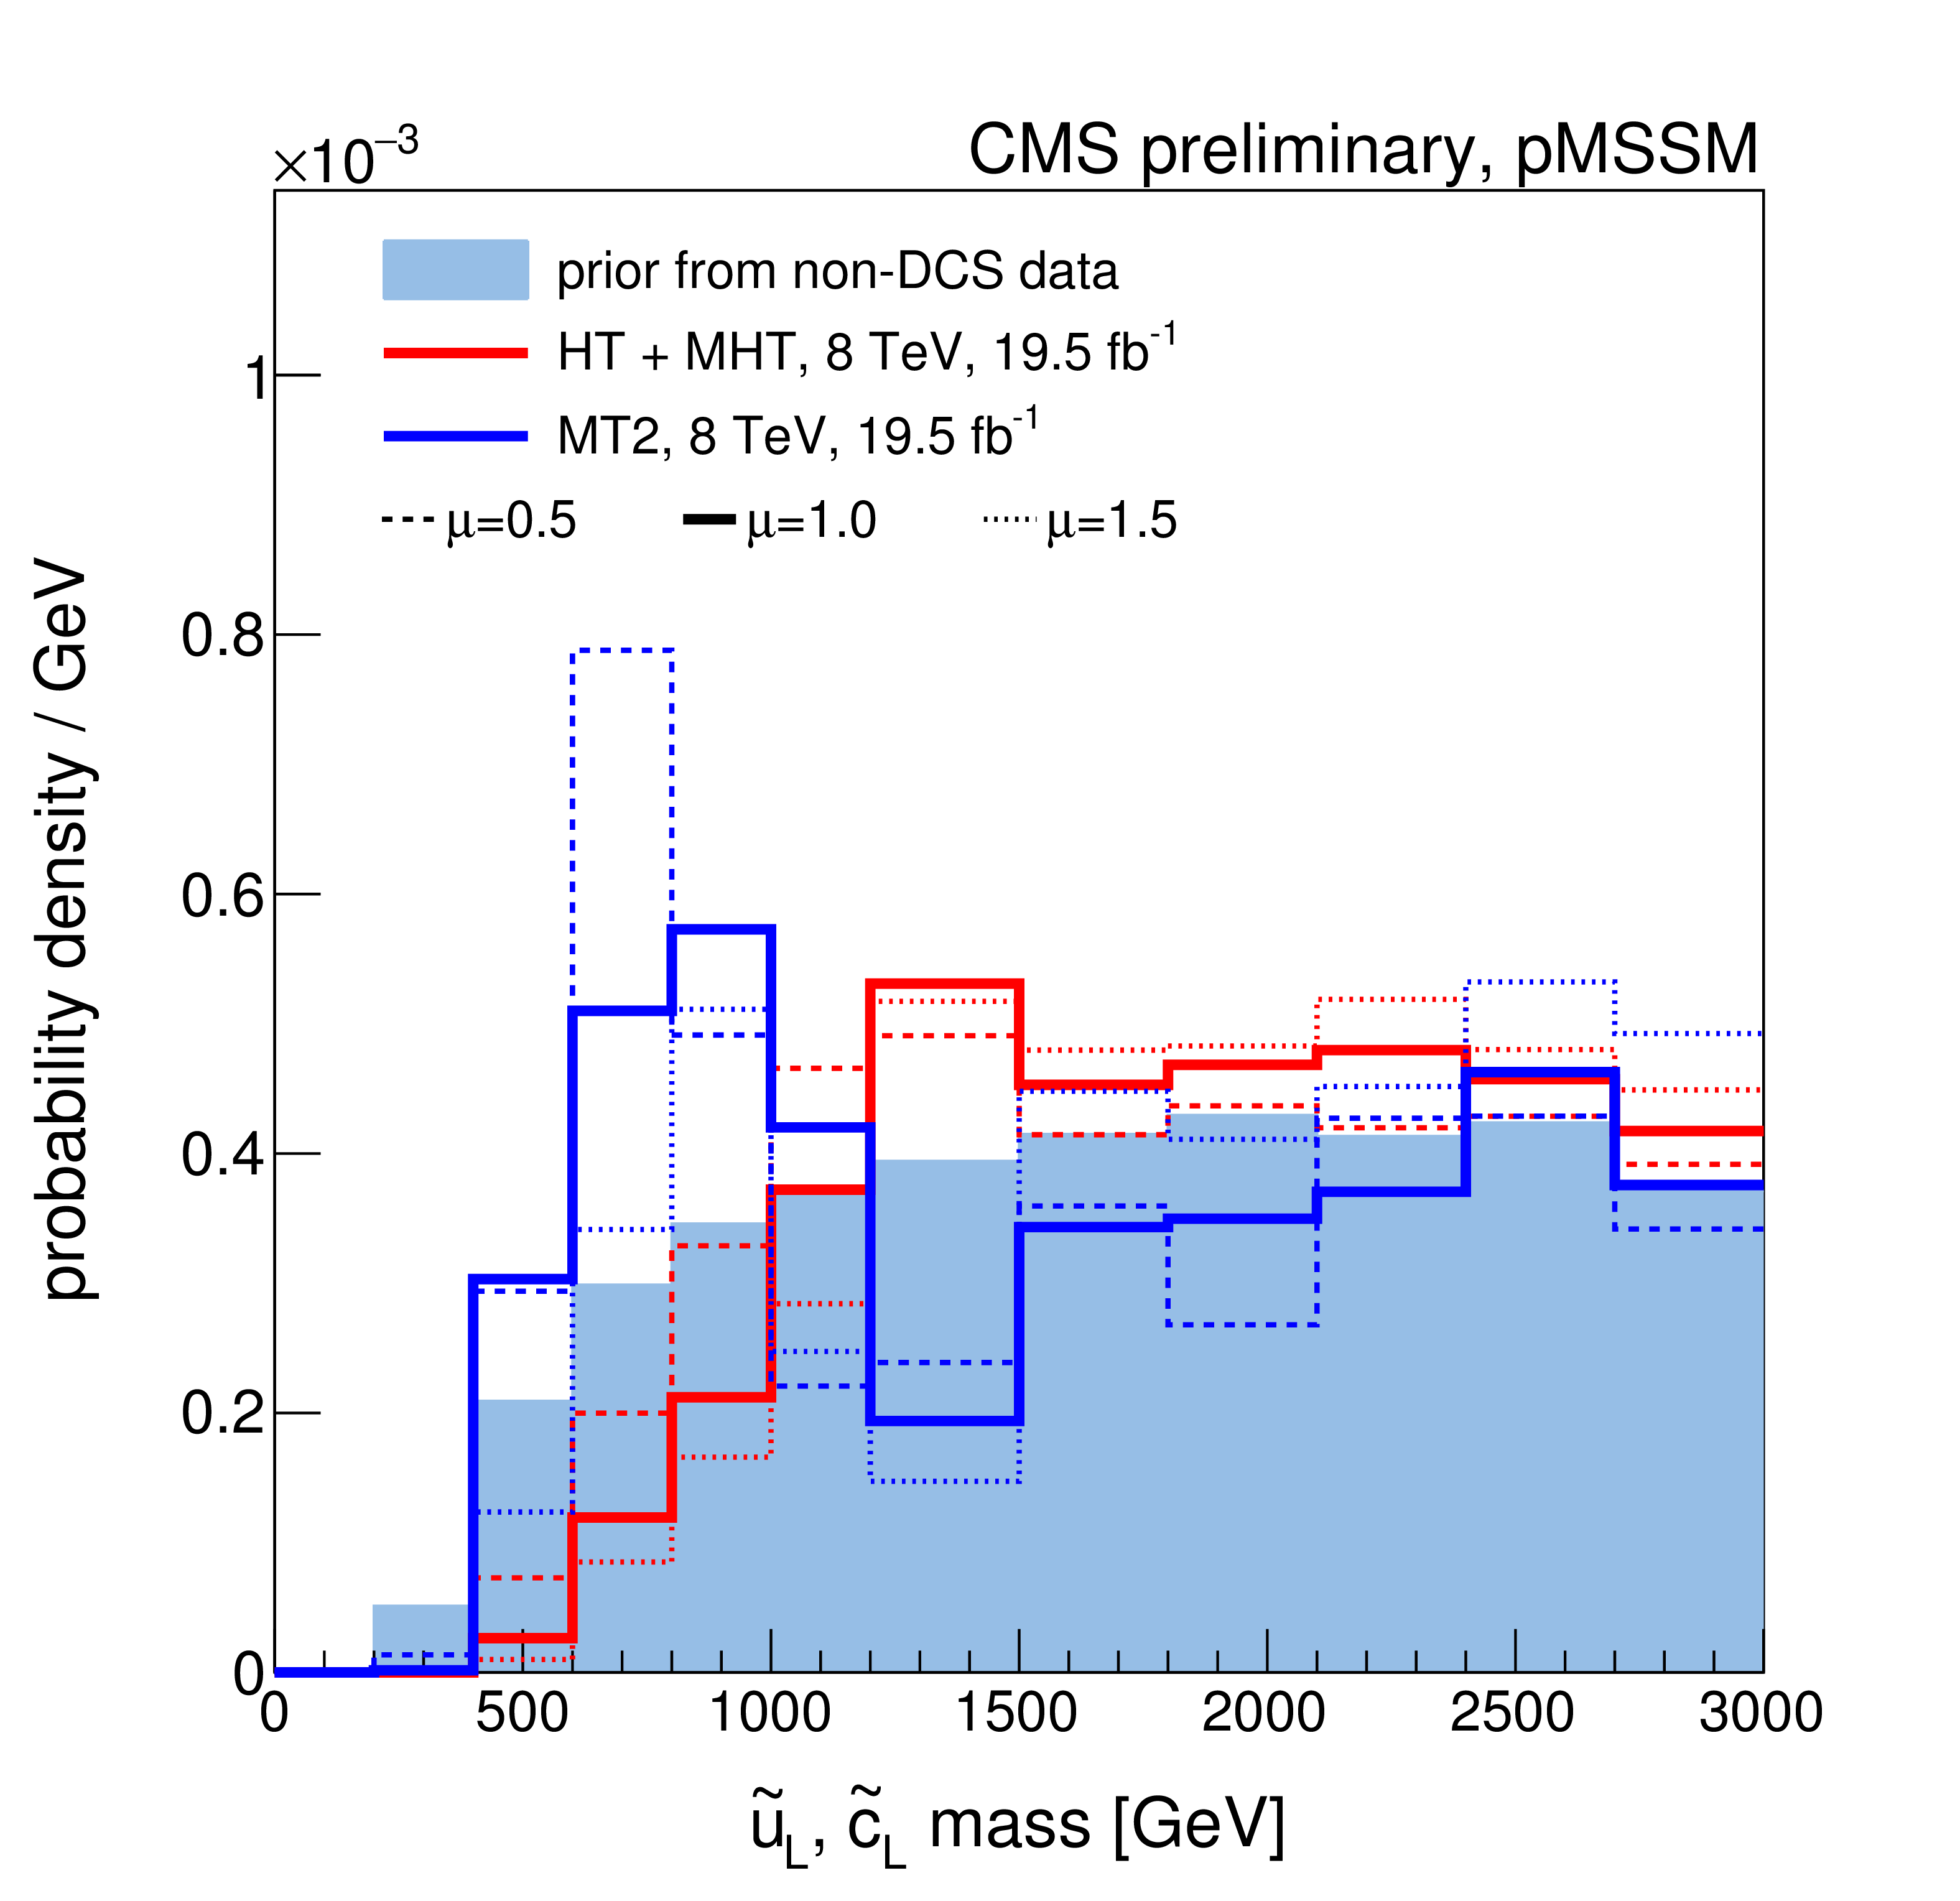
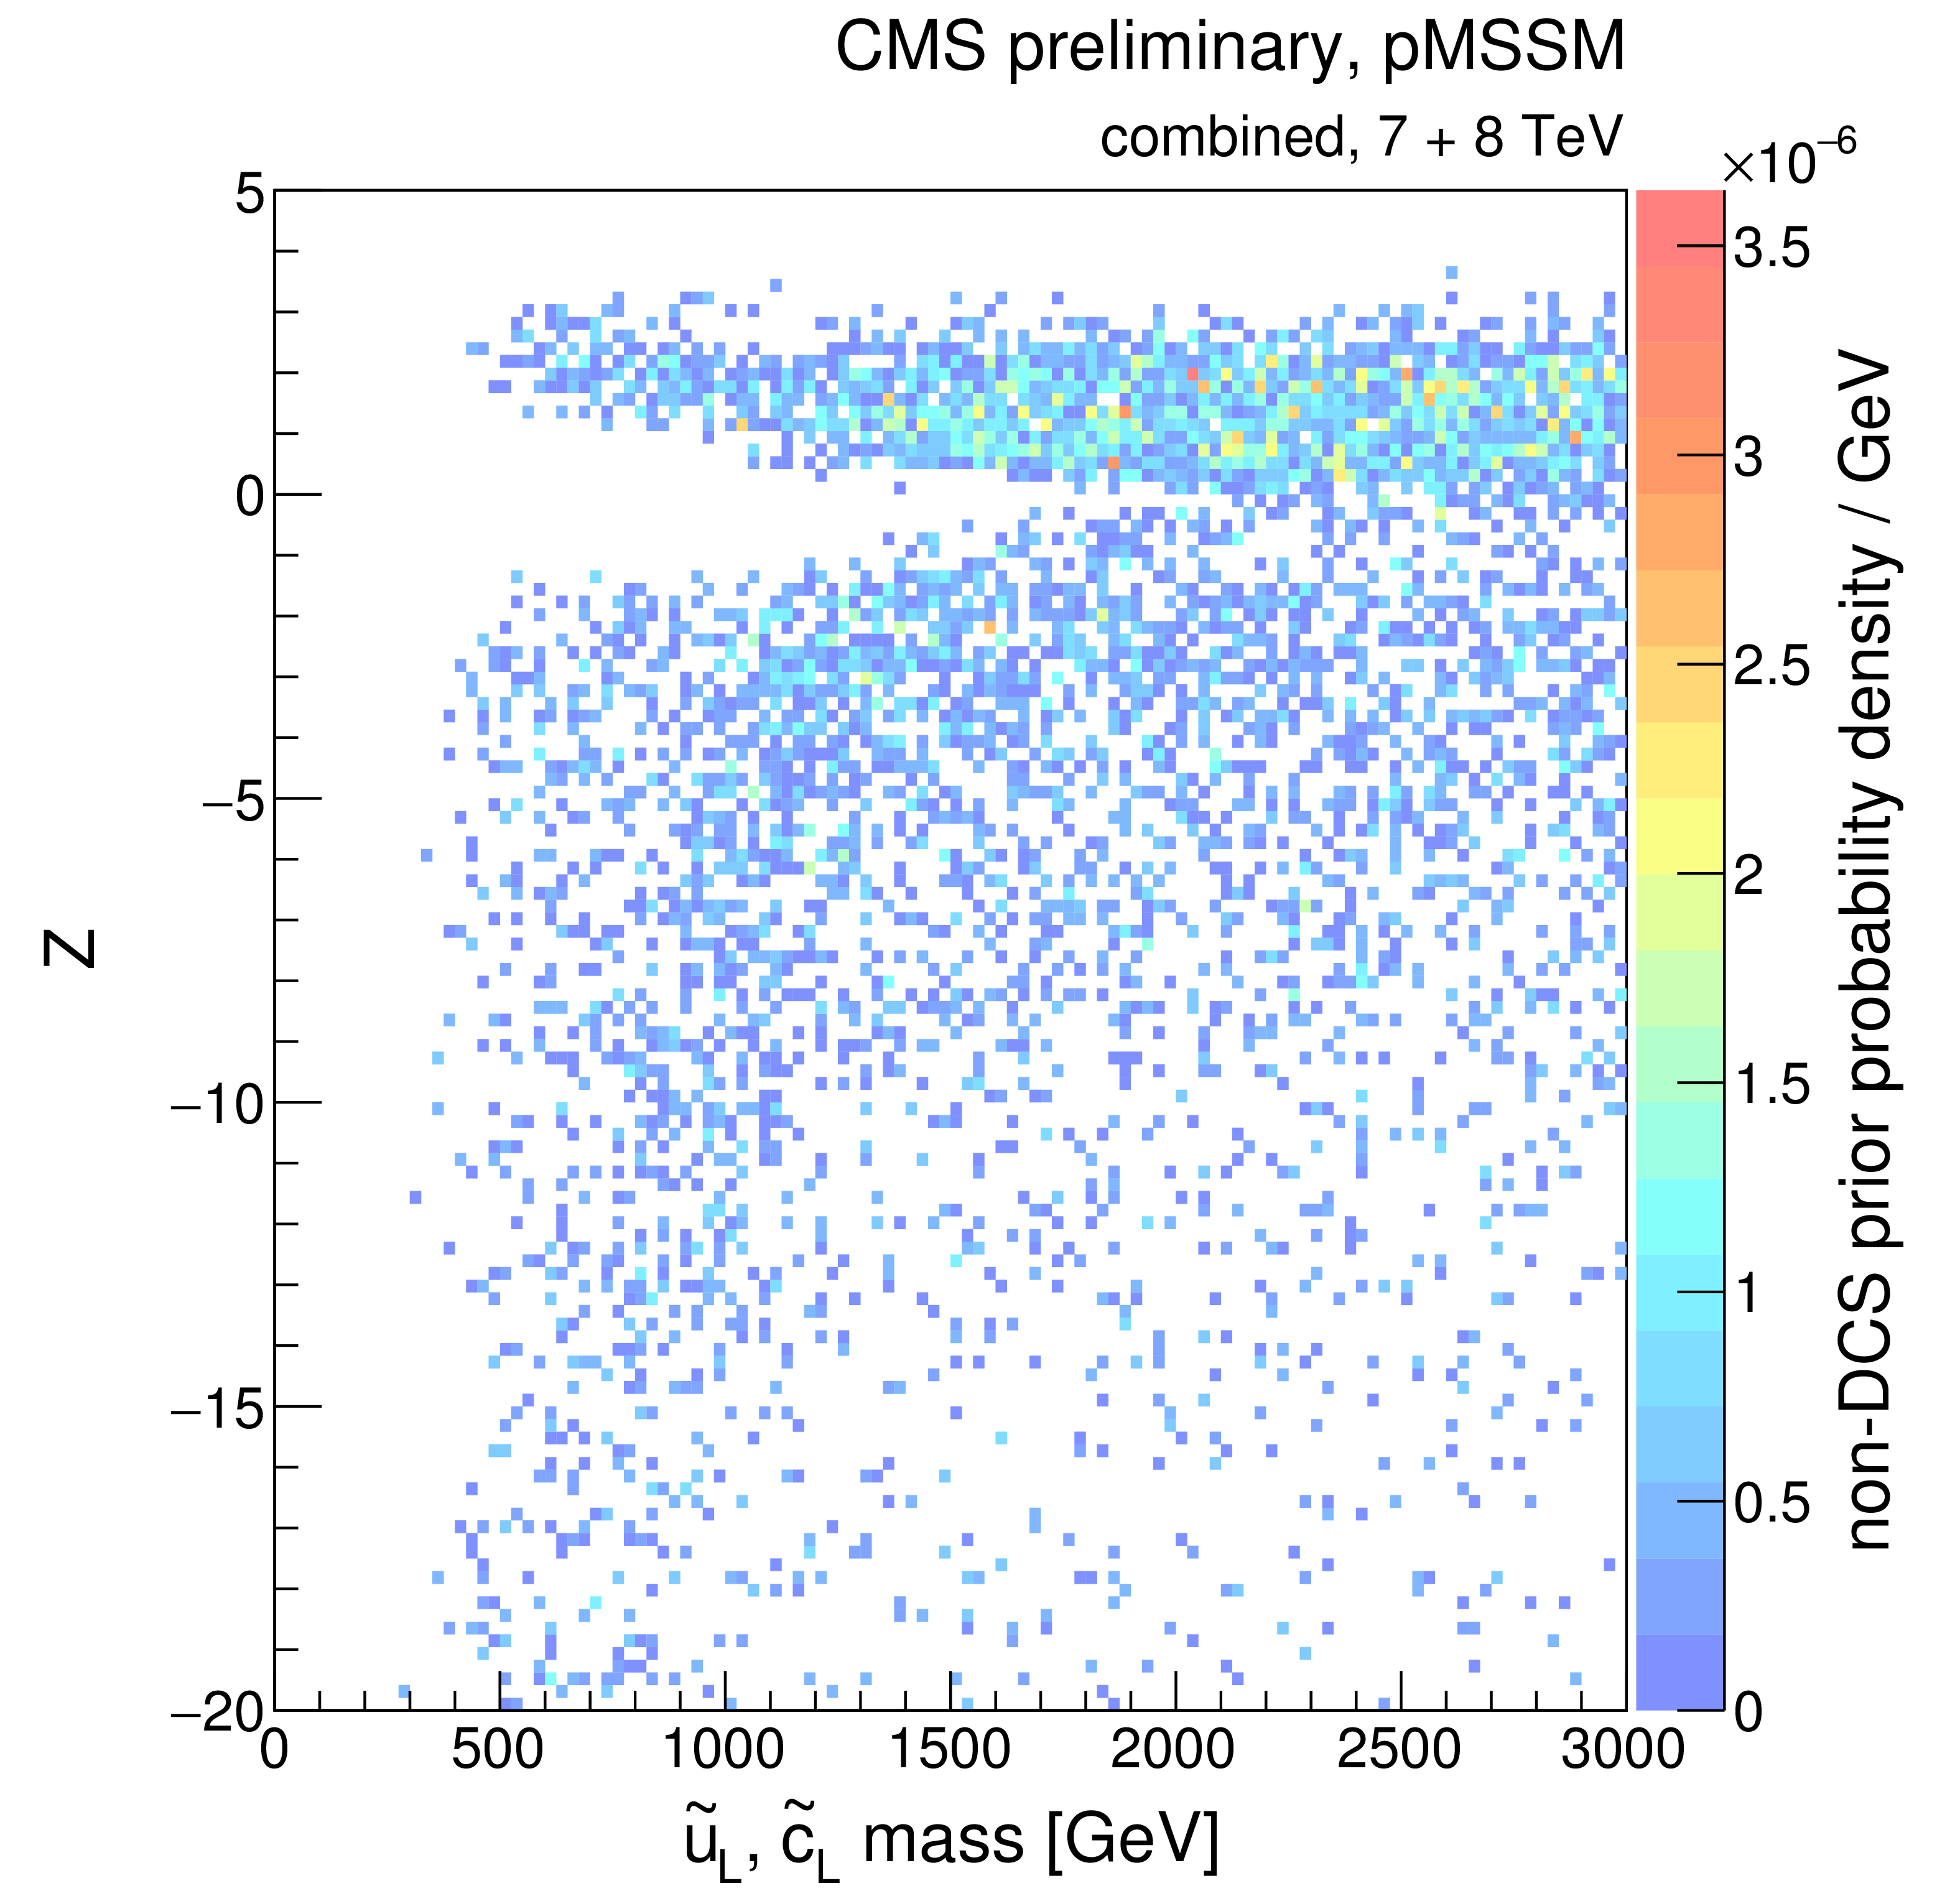
Figure 3-a:
A summary of the impact of CMS searches on our knowledge of the $\tilde{u}_L$ quark mass in the pMSSM parameter space. Plots (a)-(d) compare the non-DCS prior distribution of the $\tilde{u}_L$ quark mass to posterior distributions after data from various CMS searches, where (d) shows the combined effect of CMS searches and the Higgs boson results. Plot (e) shows survival probabilities as a function of the $\tilde{u}_L$ quark mass for various combinations of CMS data and data from Higgs boson measurements. Plot (f) shows the distribution of the $\tilde{u}_L$ quark mass versus the $Z$-significance calculated from the combination of all searches. See Fig.2 for a description of the shading. |
png ; pdf |
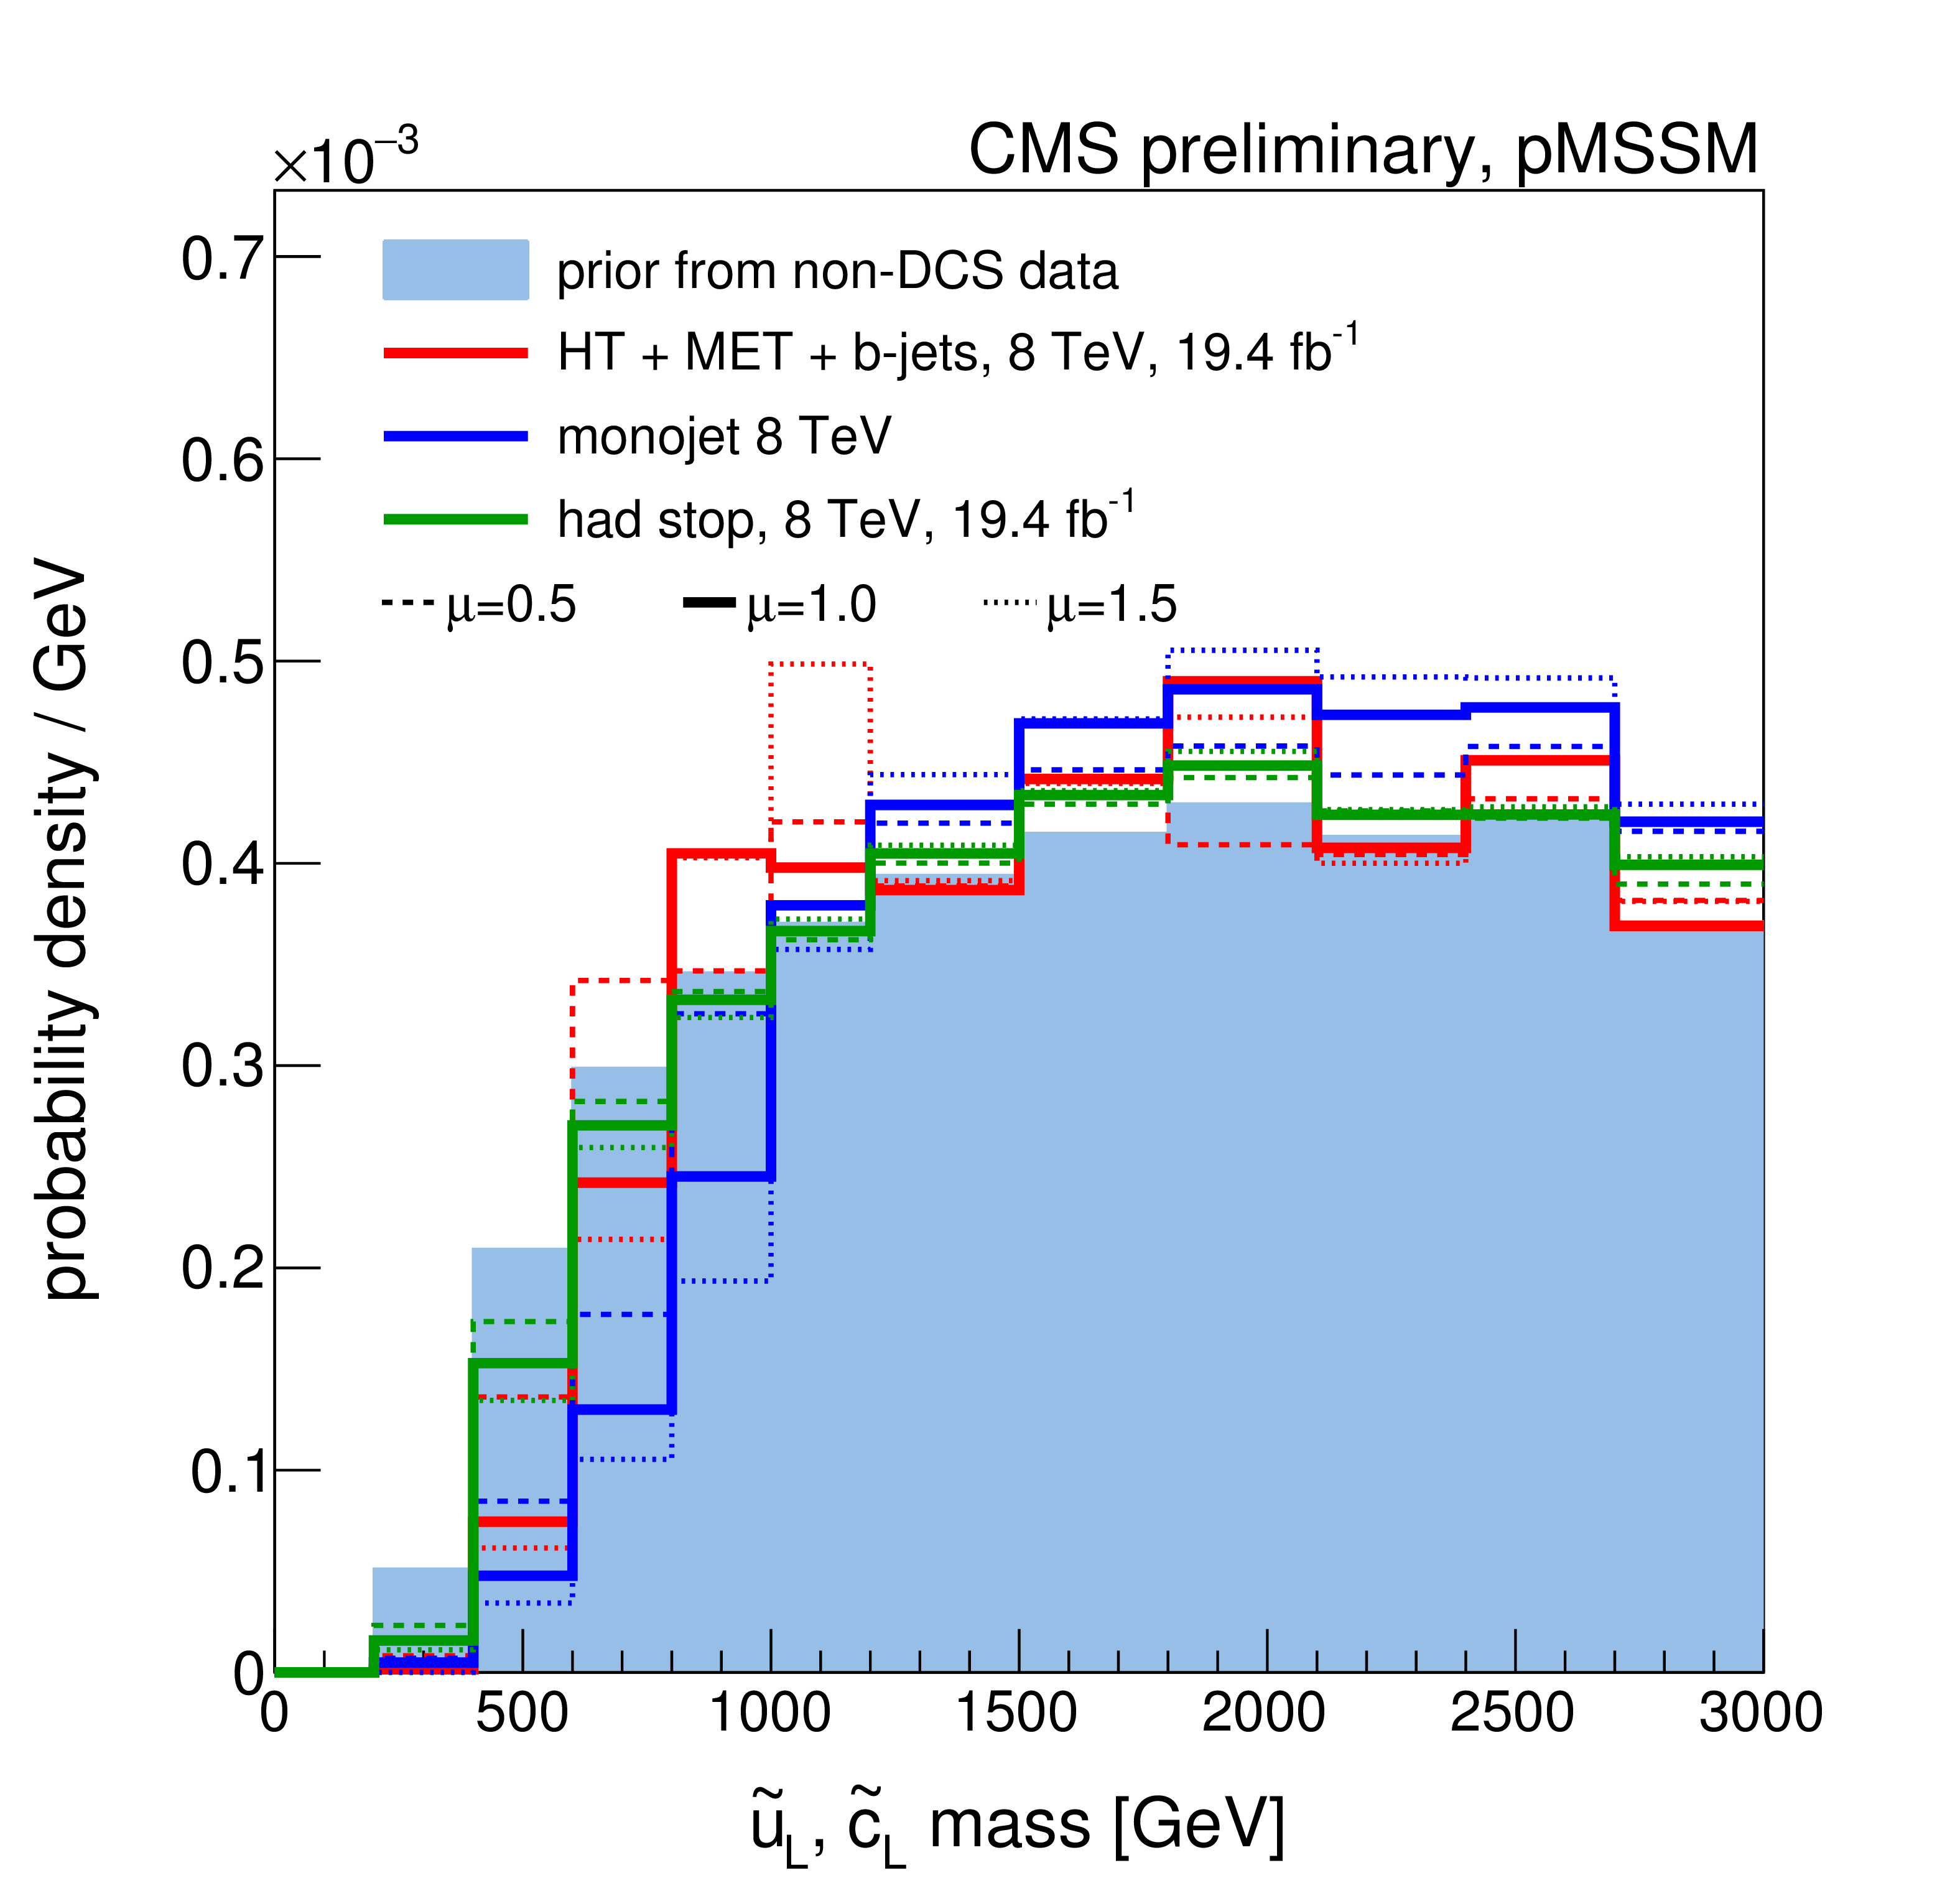
Figure 3-b:
A summary of the impact of CMS searches on our knowledge of the $\tilde{u}_L$ quark mass in the pMSSM parameter space. Plots (a)-(d) compare the non-DCS prior distribution of the $\tilde{u}_L$ quark mass to posterior distributions after data from various CMS searches, where (d) shows the combined effect of CMS searches and the Higgs boson results. Plot (e) shows survival probabilities as a function of the $\tilde{u}_L$ quark mass for various combinations of CMS data and data from Higgs boson measurements. Plot (f) shows the distribution of the $\tilde{u}_L$ quark mass versus the $Z$-significance calculated from the combination of all searches. See Fig.2 for a description of the shading. |

png ; pdf |
Figure 3-c:
A summary of the impact of CMS searches on our knowledge of the $\tilde{u}_L$ quark mass in the pMSSM parameter space. Plots (a)-(d) compare the non-DCS prior distribution of the $\tilde{u}_L$ quark mass to posterior distributions after data from various CMS searches, where (d) shows the combined effect of CMS searches and the Higgs boson results. Plot (e) shows survival probabilities as a function of the $\tilde{u}_L$ quark mass for various combinations of CMS data and data from Higgs boson measurements. Plot (f) shows the distribution of the $\tilde{u}_L$ quark mass versus the $Z$-significance calculated from the combination of all searches. See Fig.2 for a description of the shading. |
png ; pdf |
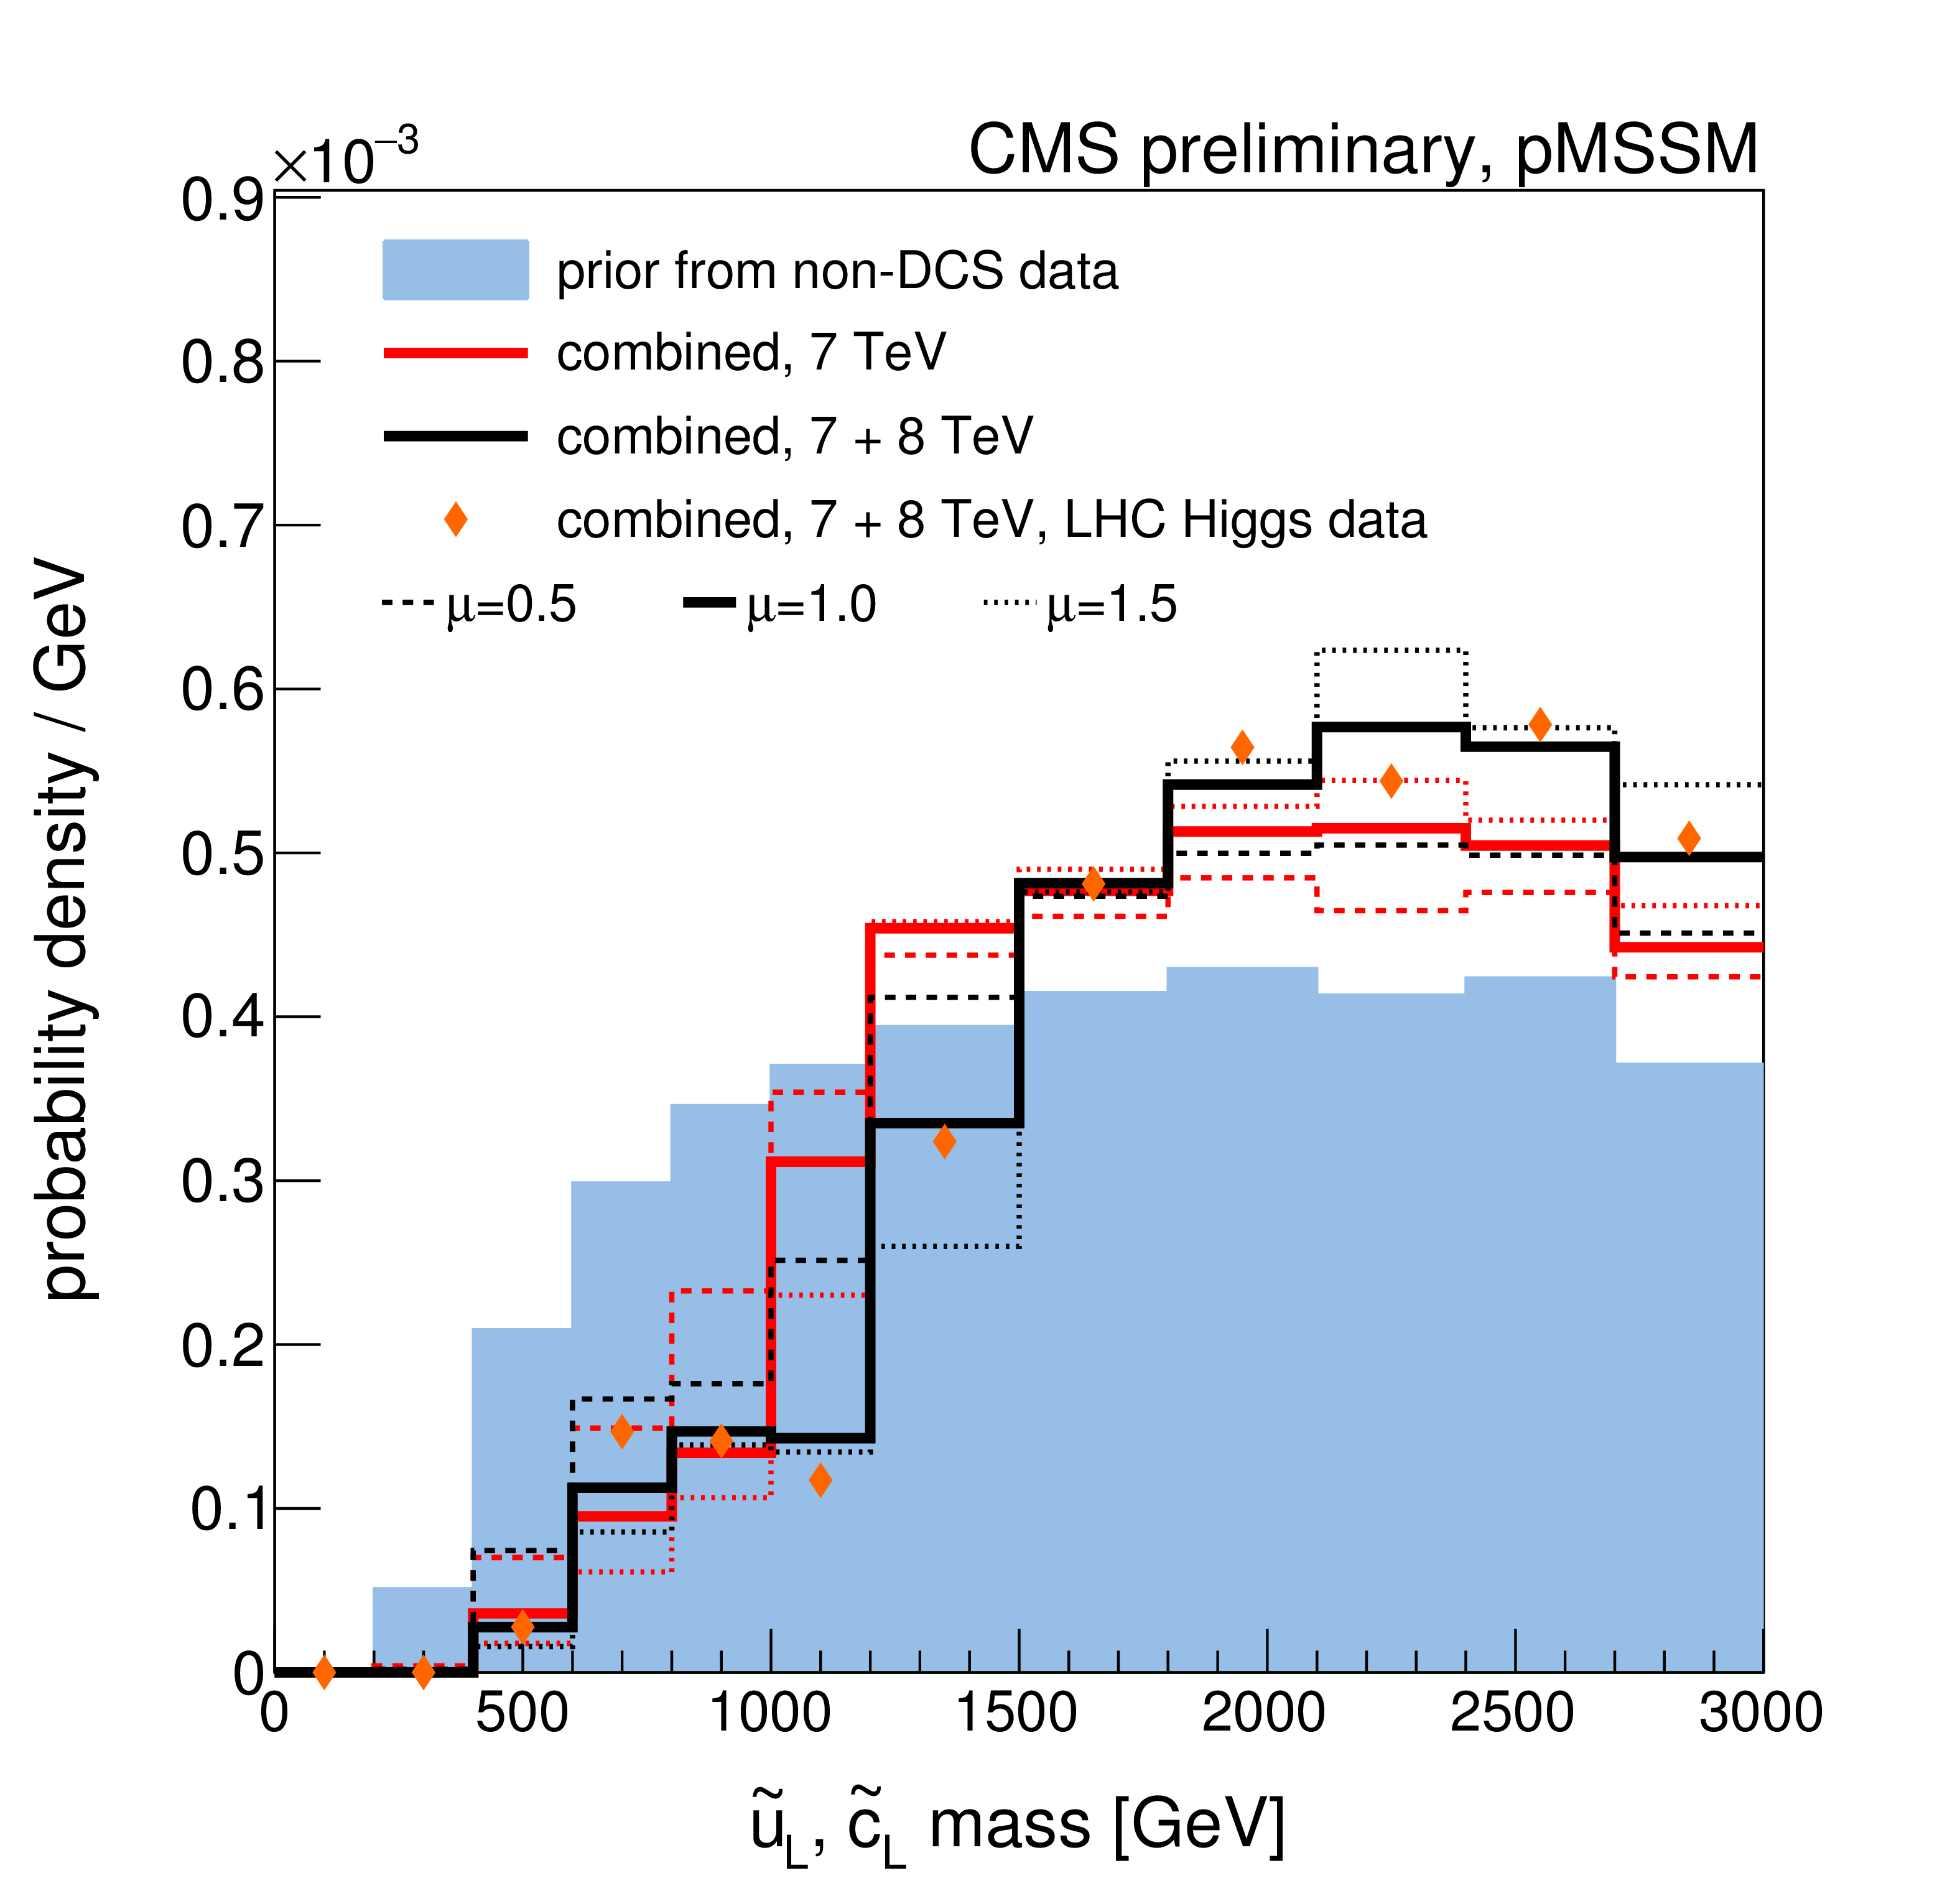
Figure 3-d:
A summary of the impact of CMS searches on our knowledge of the $\tilde{u}_L$ quark mass in the pMSSM parameter space. Plots (a)-(d) compare the non-DCS prior distribution of the $\tilde{u}_L$ quark mass to posterior distributions after data from various CMS searches, where (d) shows the combined effect of CMS searches and the Higgs boson results. Plot (e) shows survival probabilities as a function of the $\tilde{u}_L$ quark mass for various combinations of CMS data and data from Higgs boson measurements. Plot (f) shows the distribution of the $\tilde{u}_L$ quark mass versus the $Z$-significance calculated from the combination of all searches. See Fig.2 for a description of the shading. |
png ; pdf |
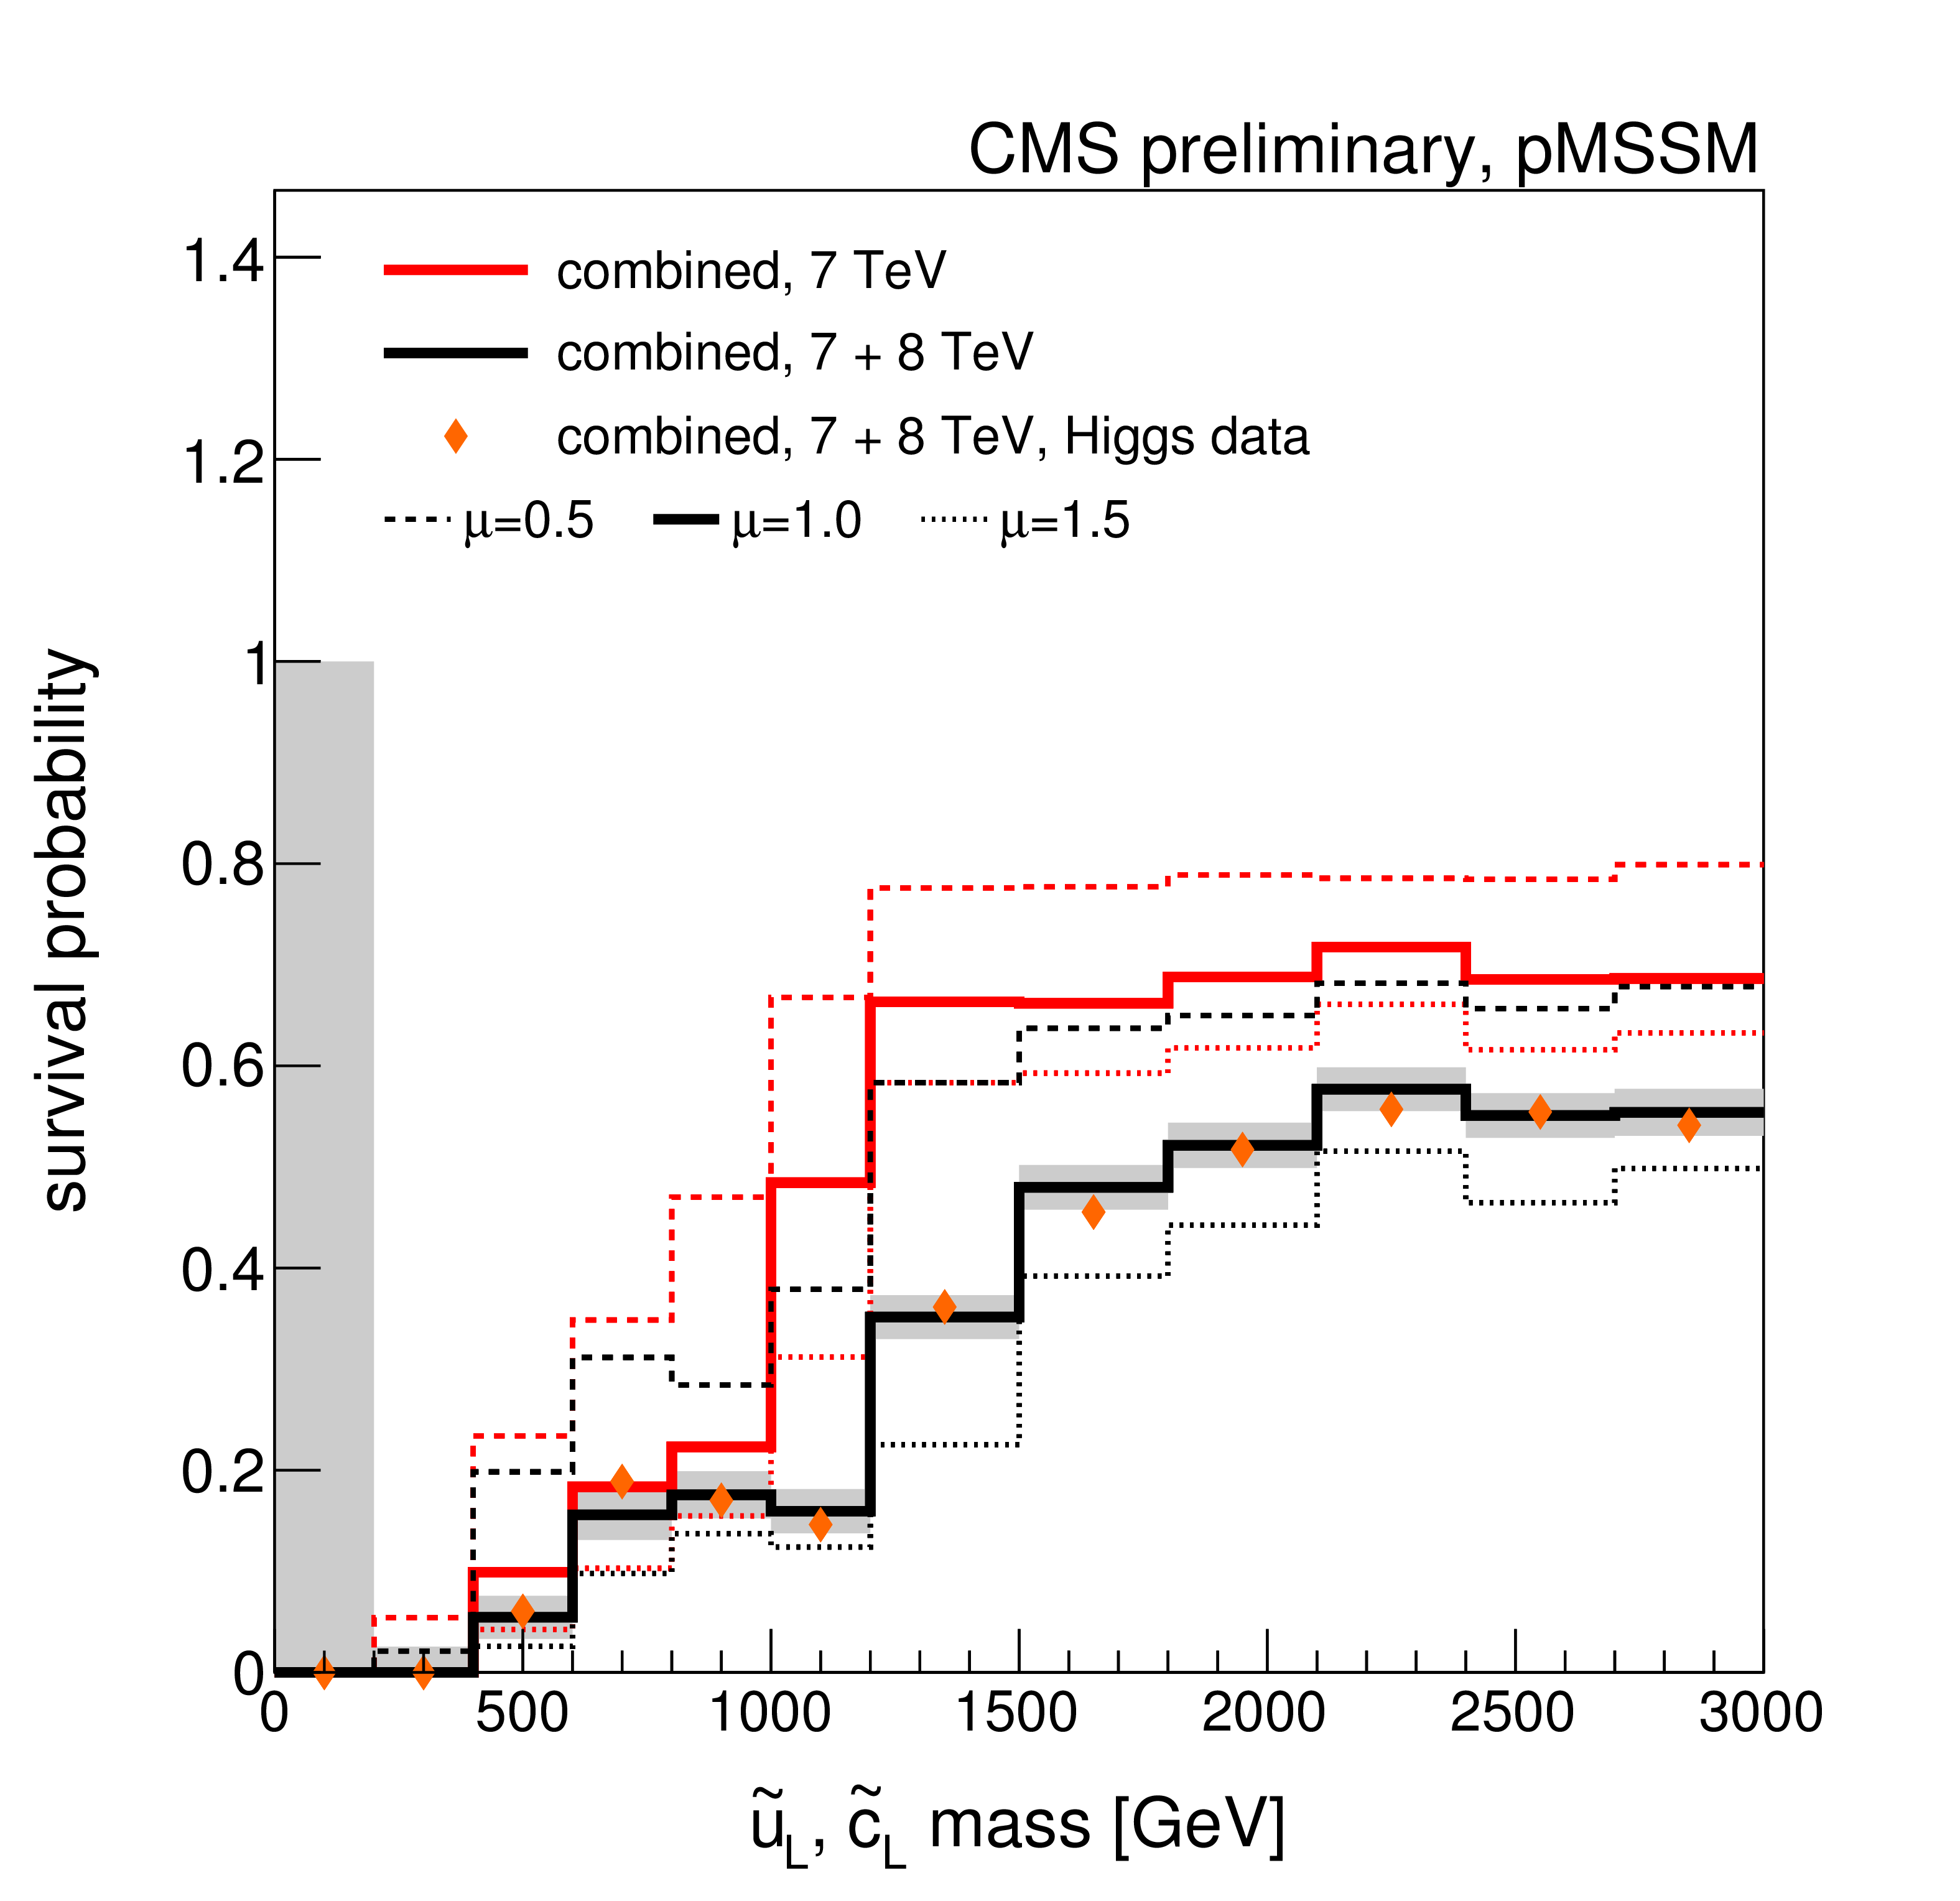
Figure 3-e:
A summary of the impact of CMS searches on our knowledge of the $\tilde{u}_L$ quark mass in the pMSSM parameter space. Plots (a)-(d) compare the non-DCS prior distribution of the $\tilde{u}_L$ quark mass to posterior distributions after data from various CMS searches, where (d) shows the combined effect of CMS searches and the Higgs boson results. Plot (e) shows survival probabilities as a function of the $\tilde{u}_L$ quark mass for various combinations of CMS data and data from Higgs boson measurements. Plot (f) shows the distribution of the $\tilde{u}_L$ quark mass versus the $Z$-significance calculated from the combination of all searches. See Fig.2 for a description of the shading. |
png ; pdf |
Figure 3-f:
A summary of the impact of CMS searches on our knowledge of the $\tilde{u}_L$ quark mass in the pMSSM parameter space. Plots (a)-(d) compare the non-DCS prior distribution of the $\tilde{u}_L$ quark mass to posterior distributions after data from various CMS searches, where (d) shows the combined effect of CMS searches and the Higgs boson results. Plot (e) shows survival probabilities as a function of the $\tilde{u}_L$ quark mass for various combinations of CMS data and data from Higgs boson measurements. Plot (f) shows the distribution of the $\tilde{u}_L$ quark mass versus the $Z$-significance calculated from the combination of all searches. See Fig.2 for a description of the shading. |
png ; pdf |
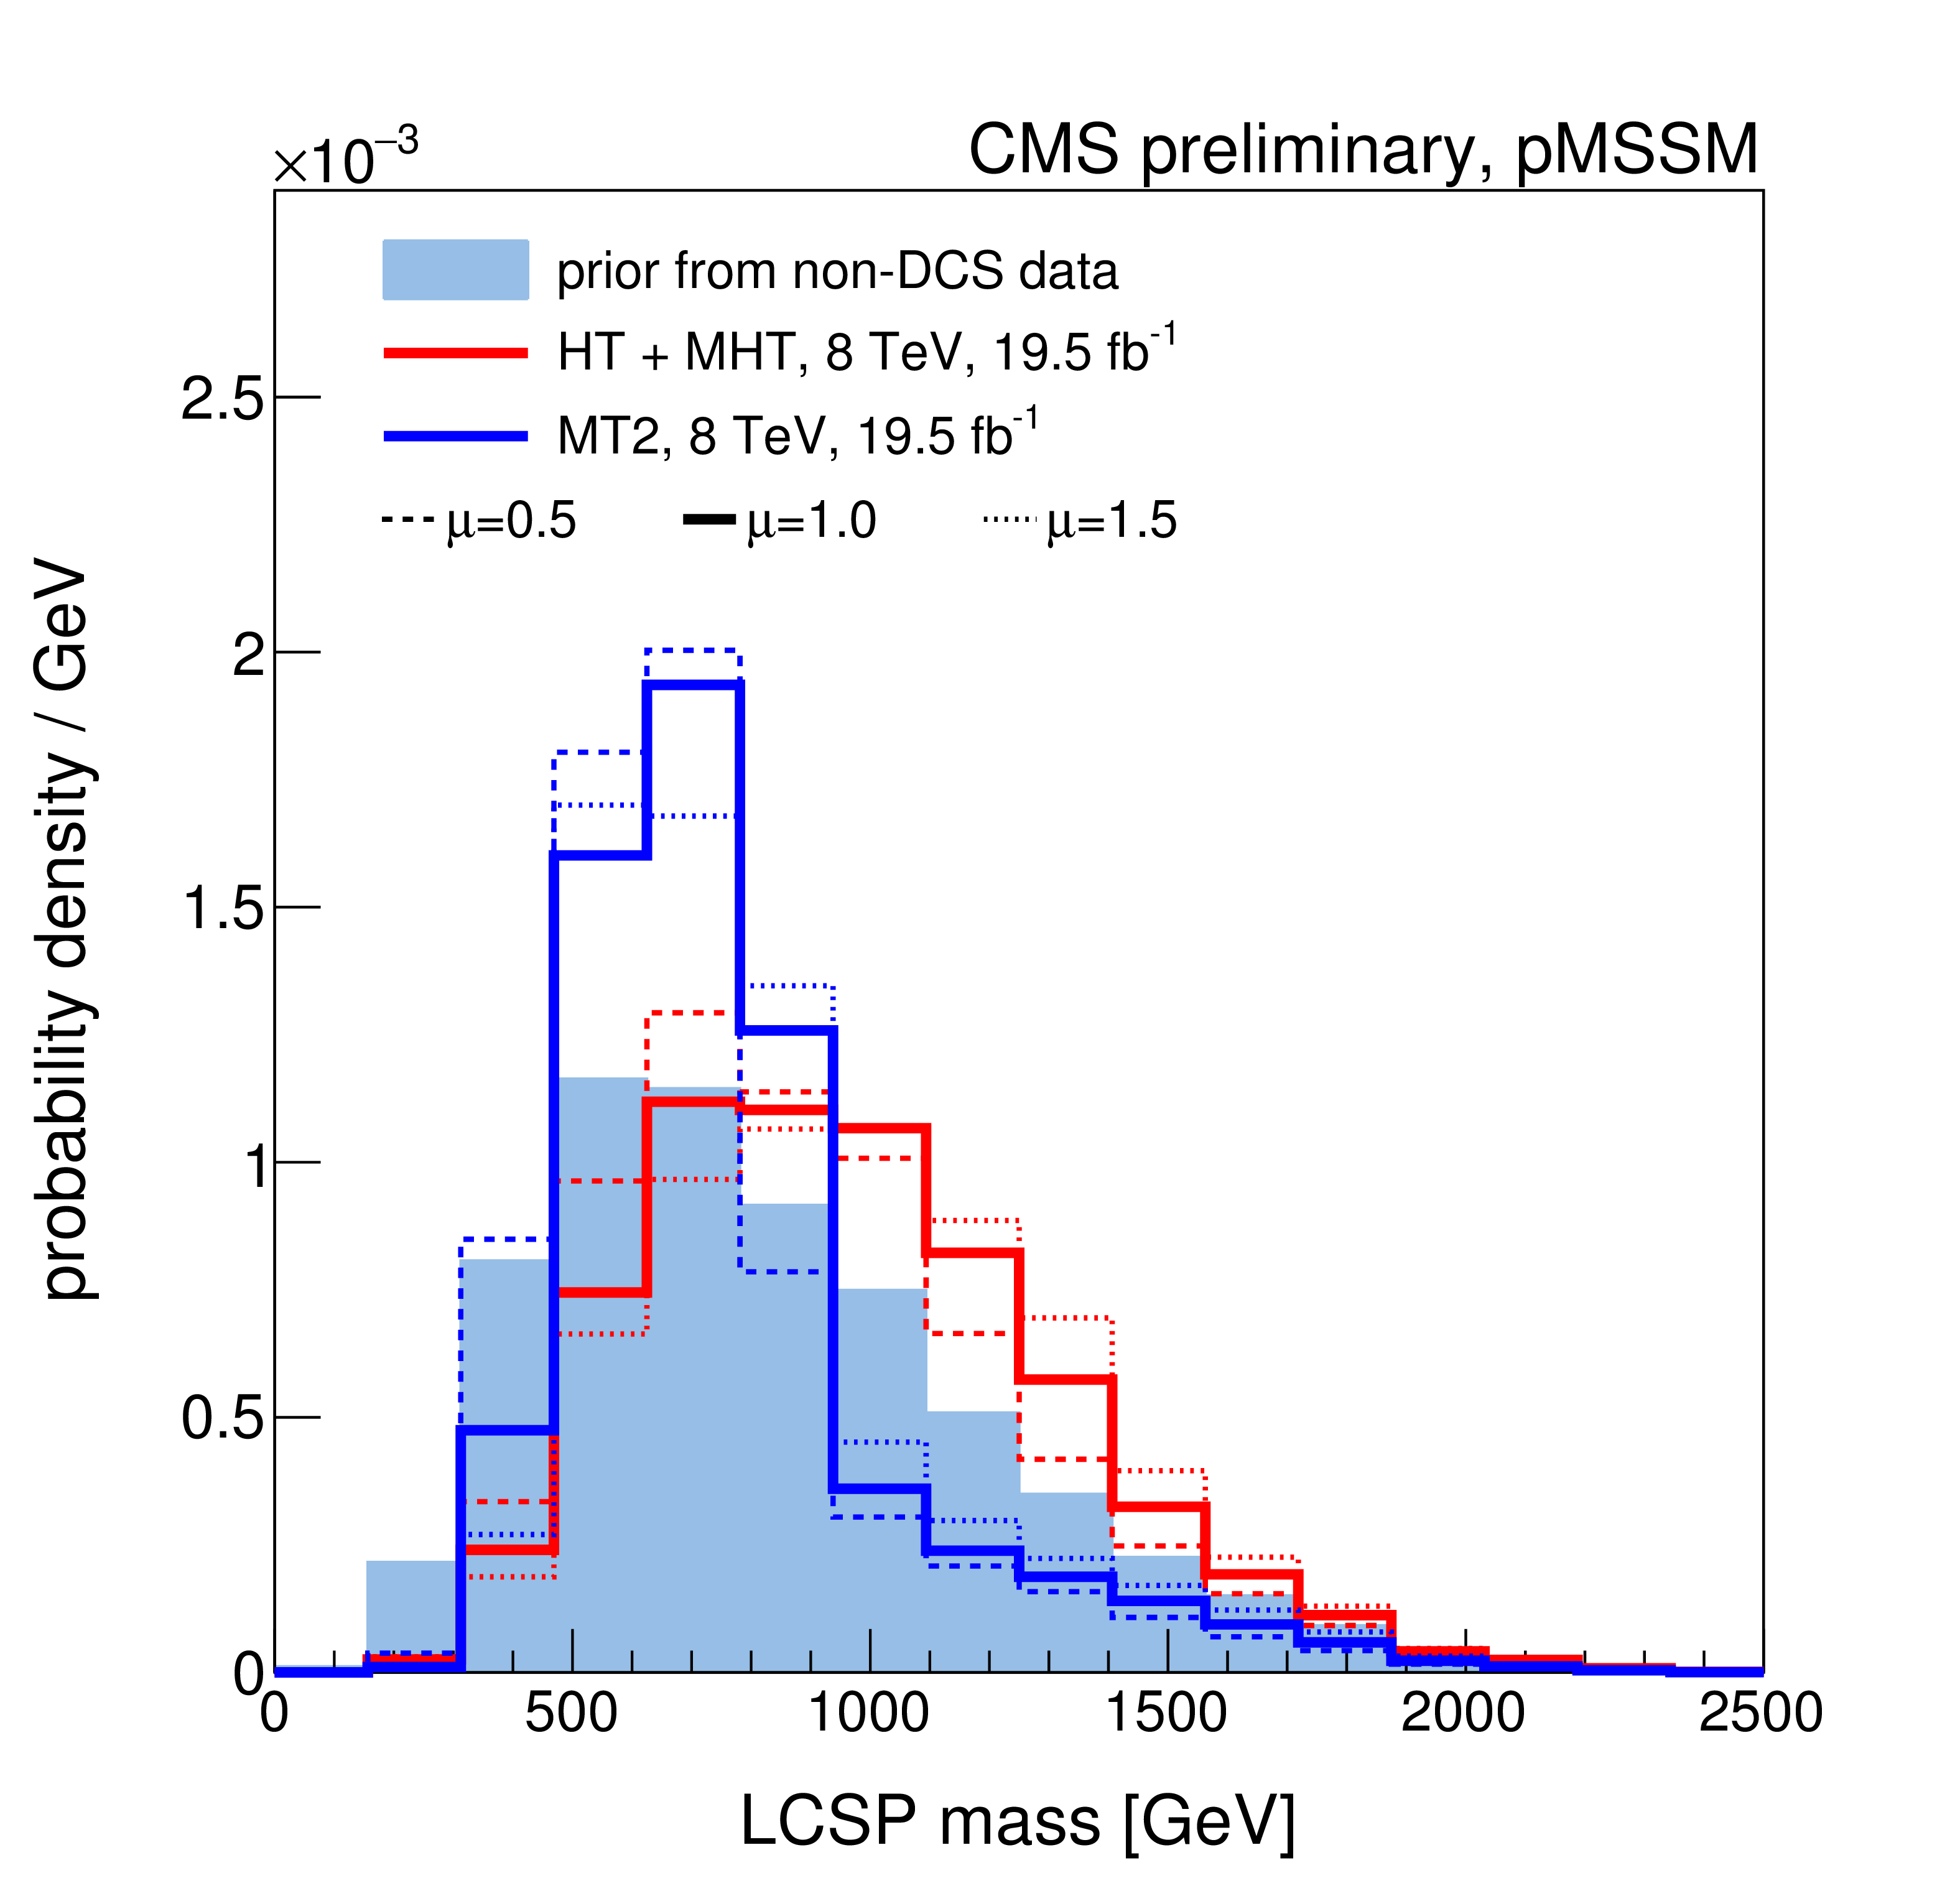
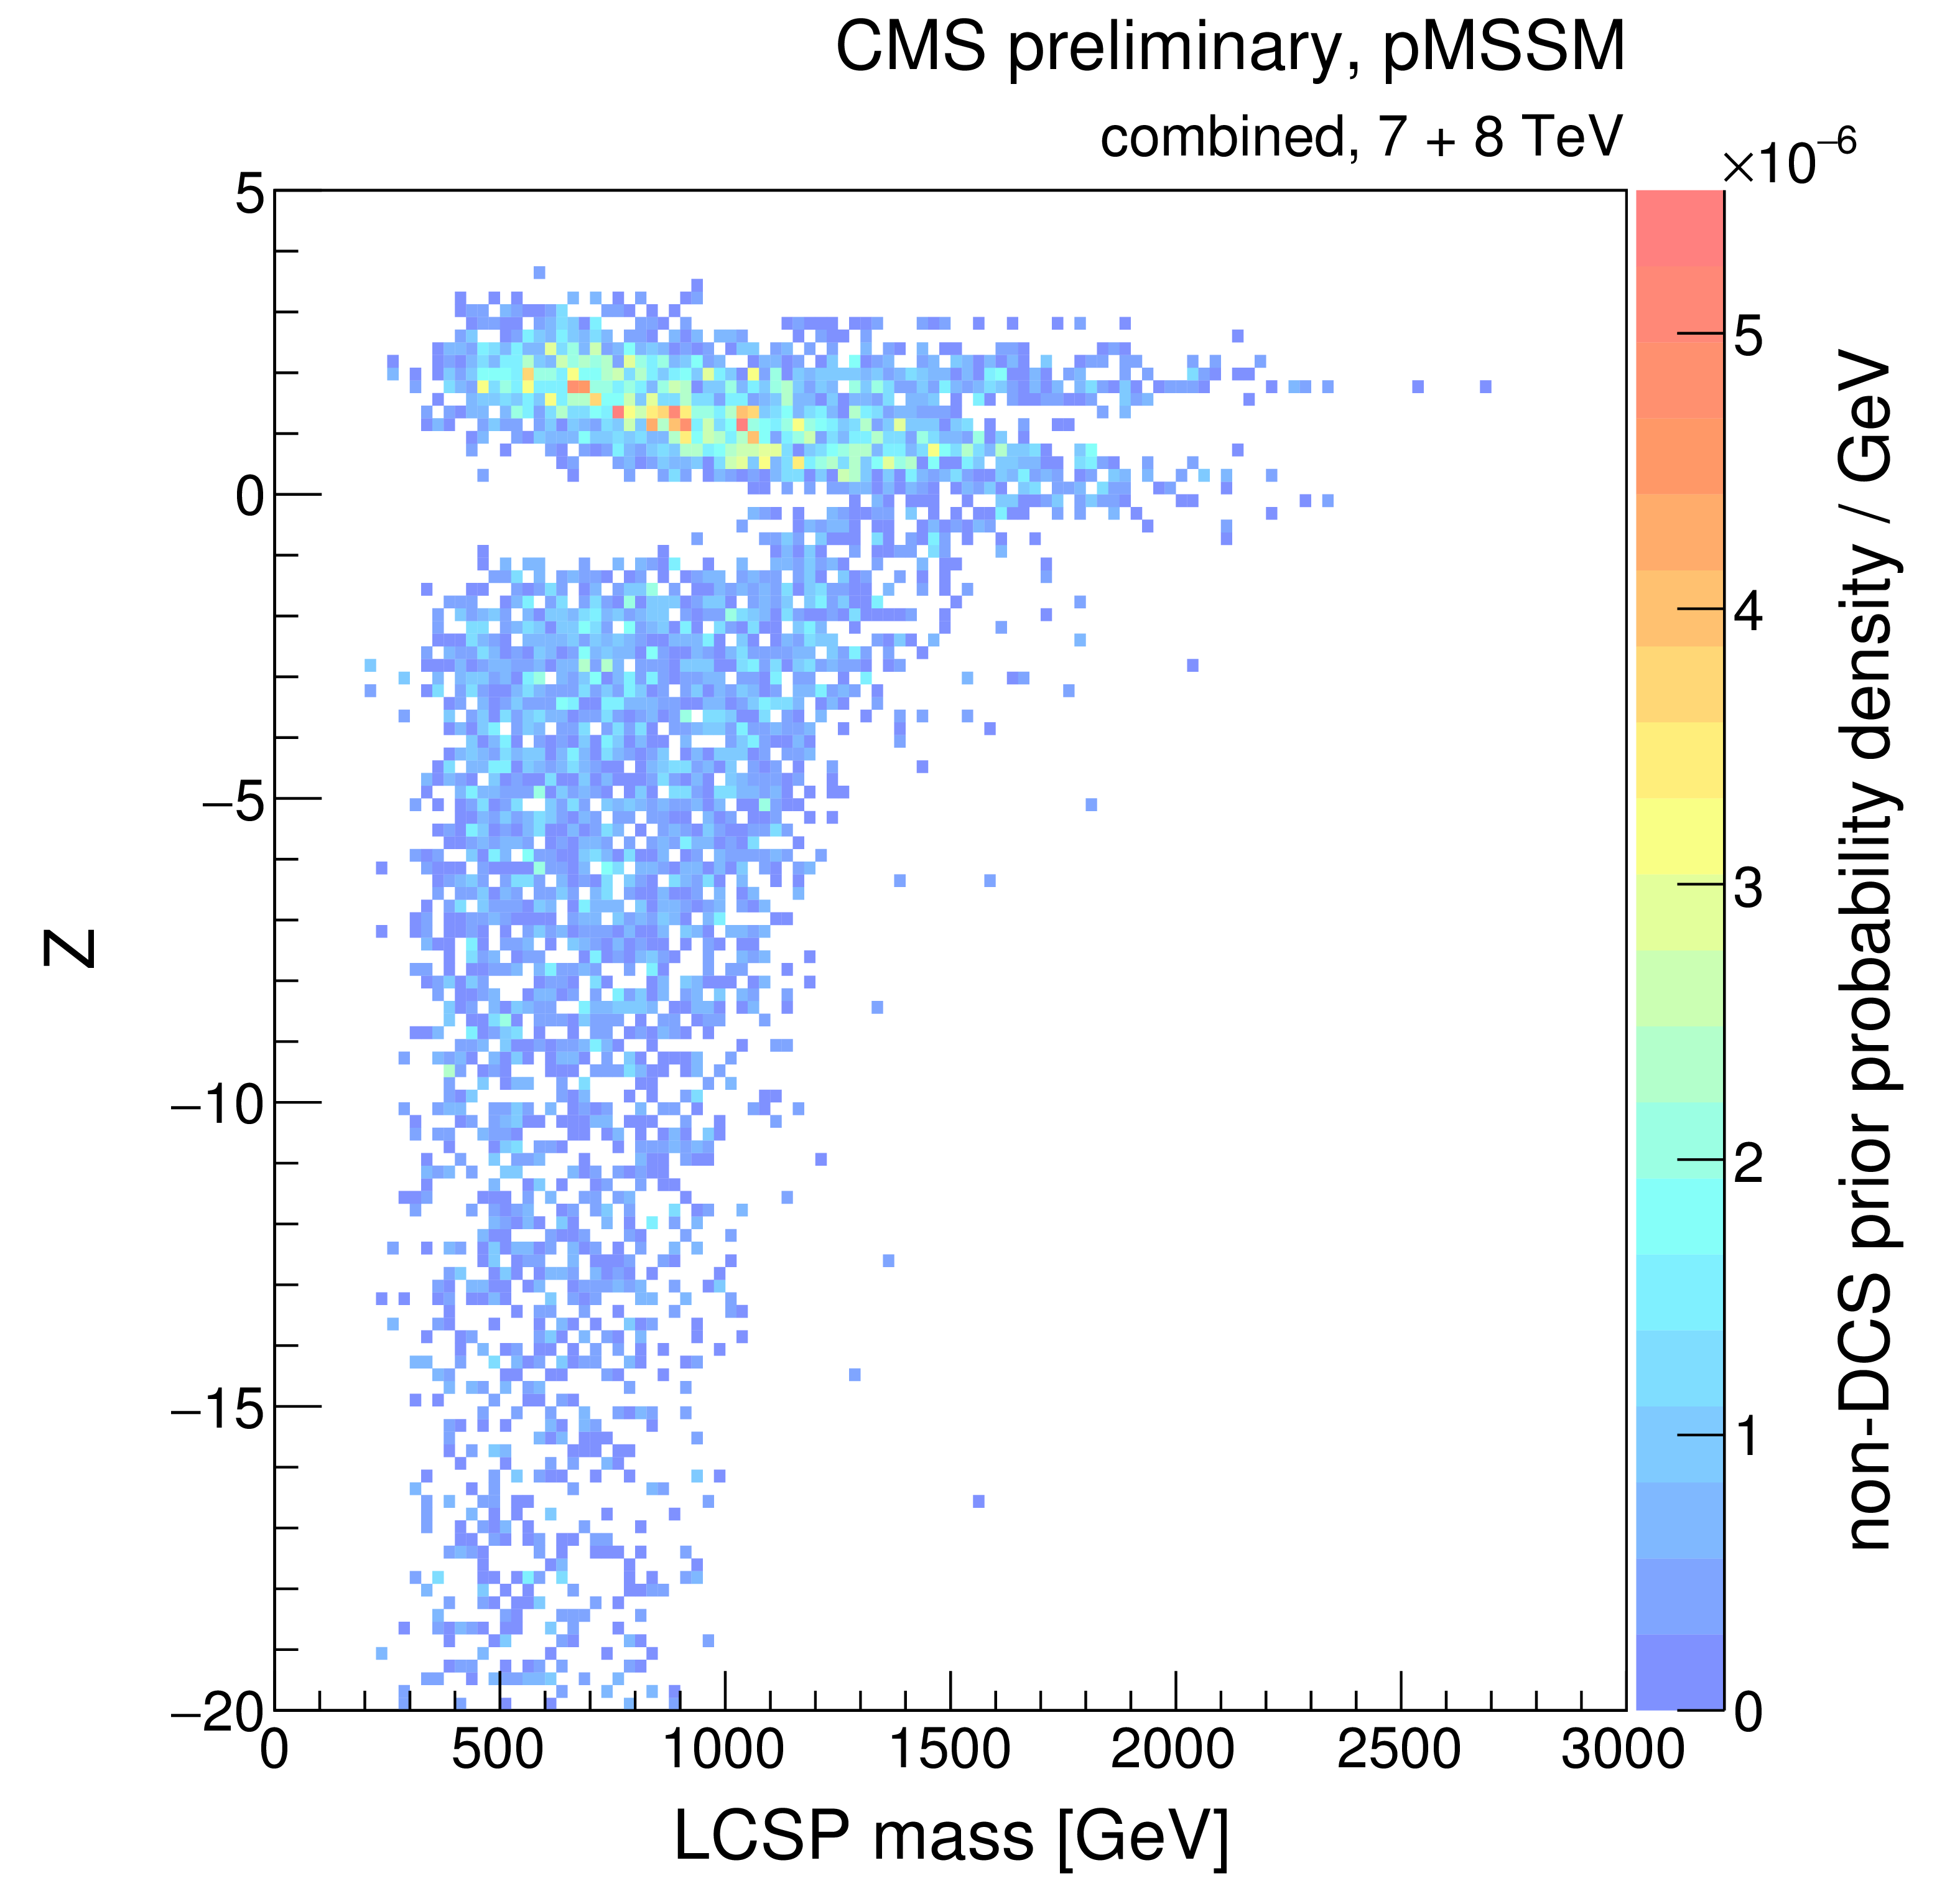
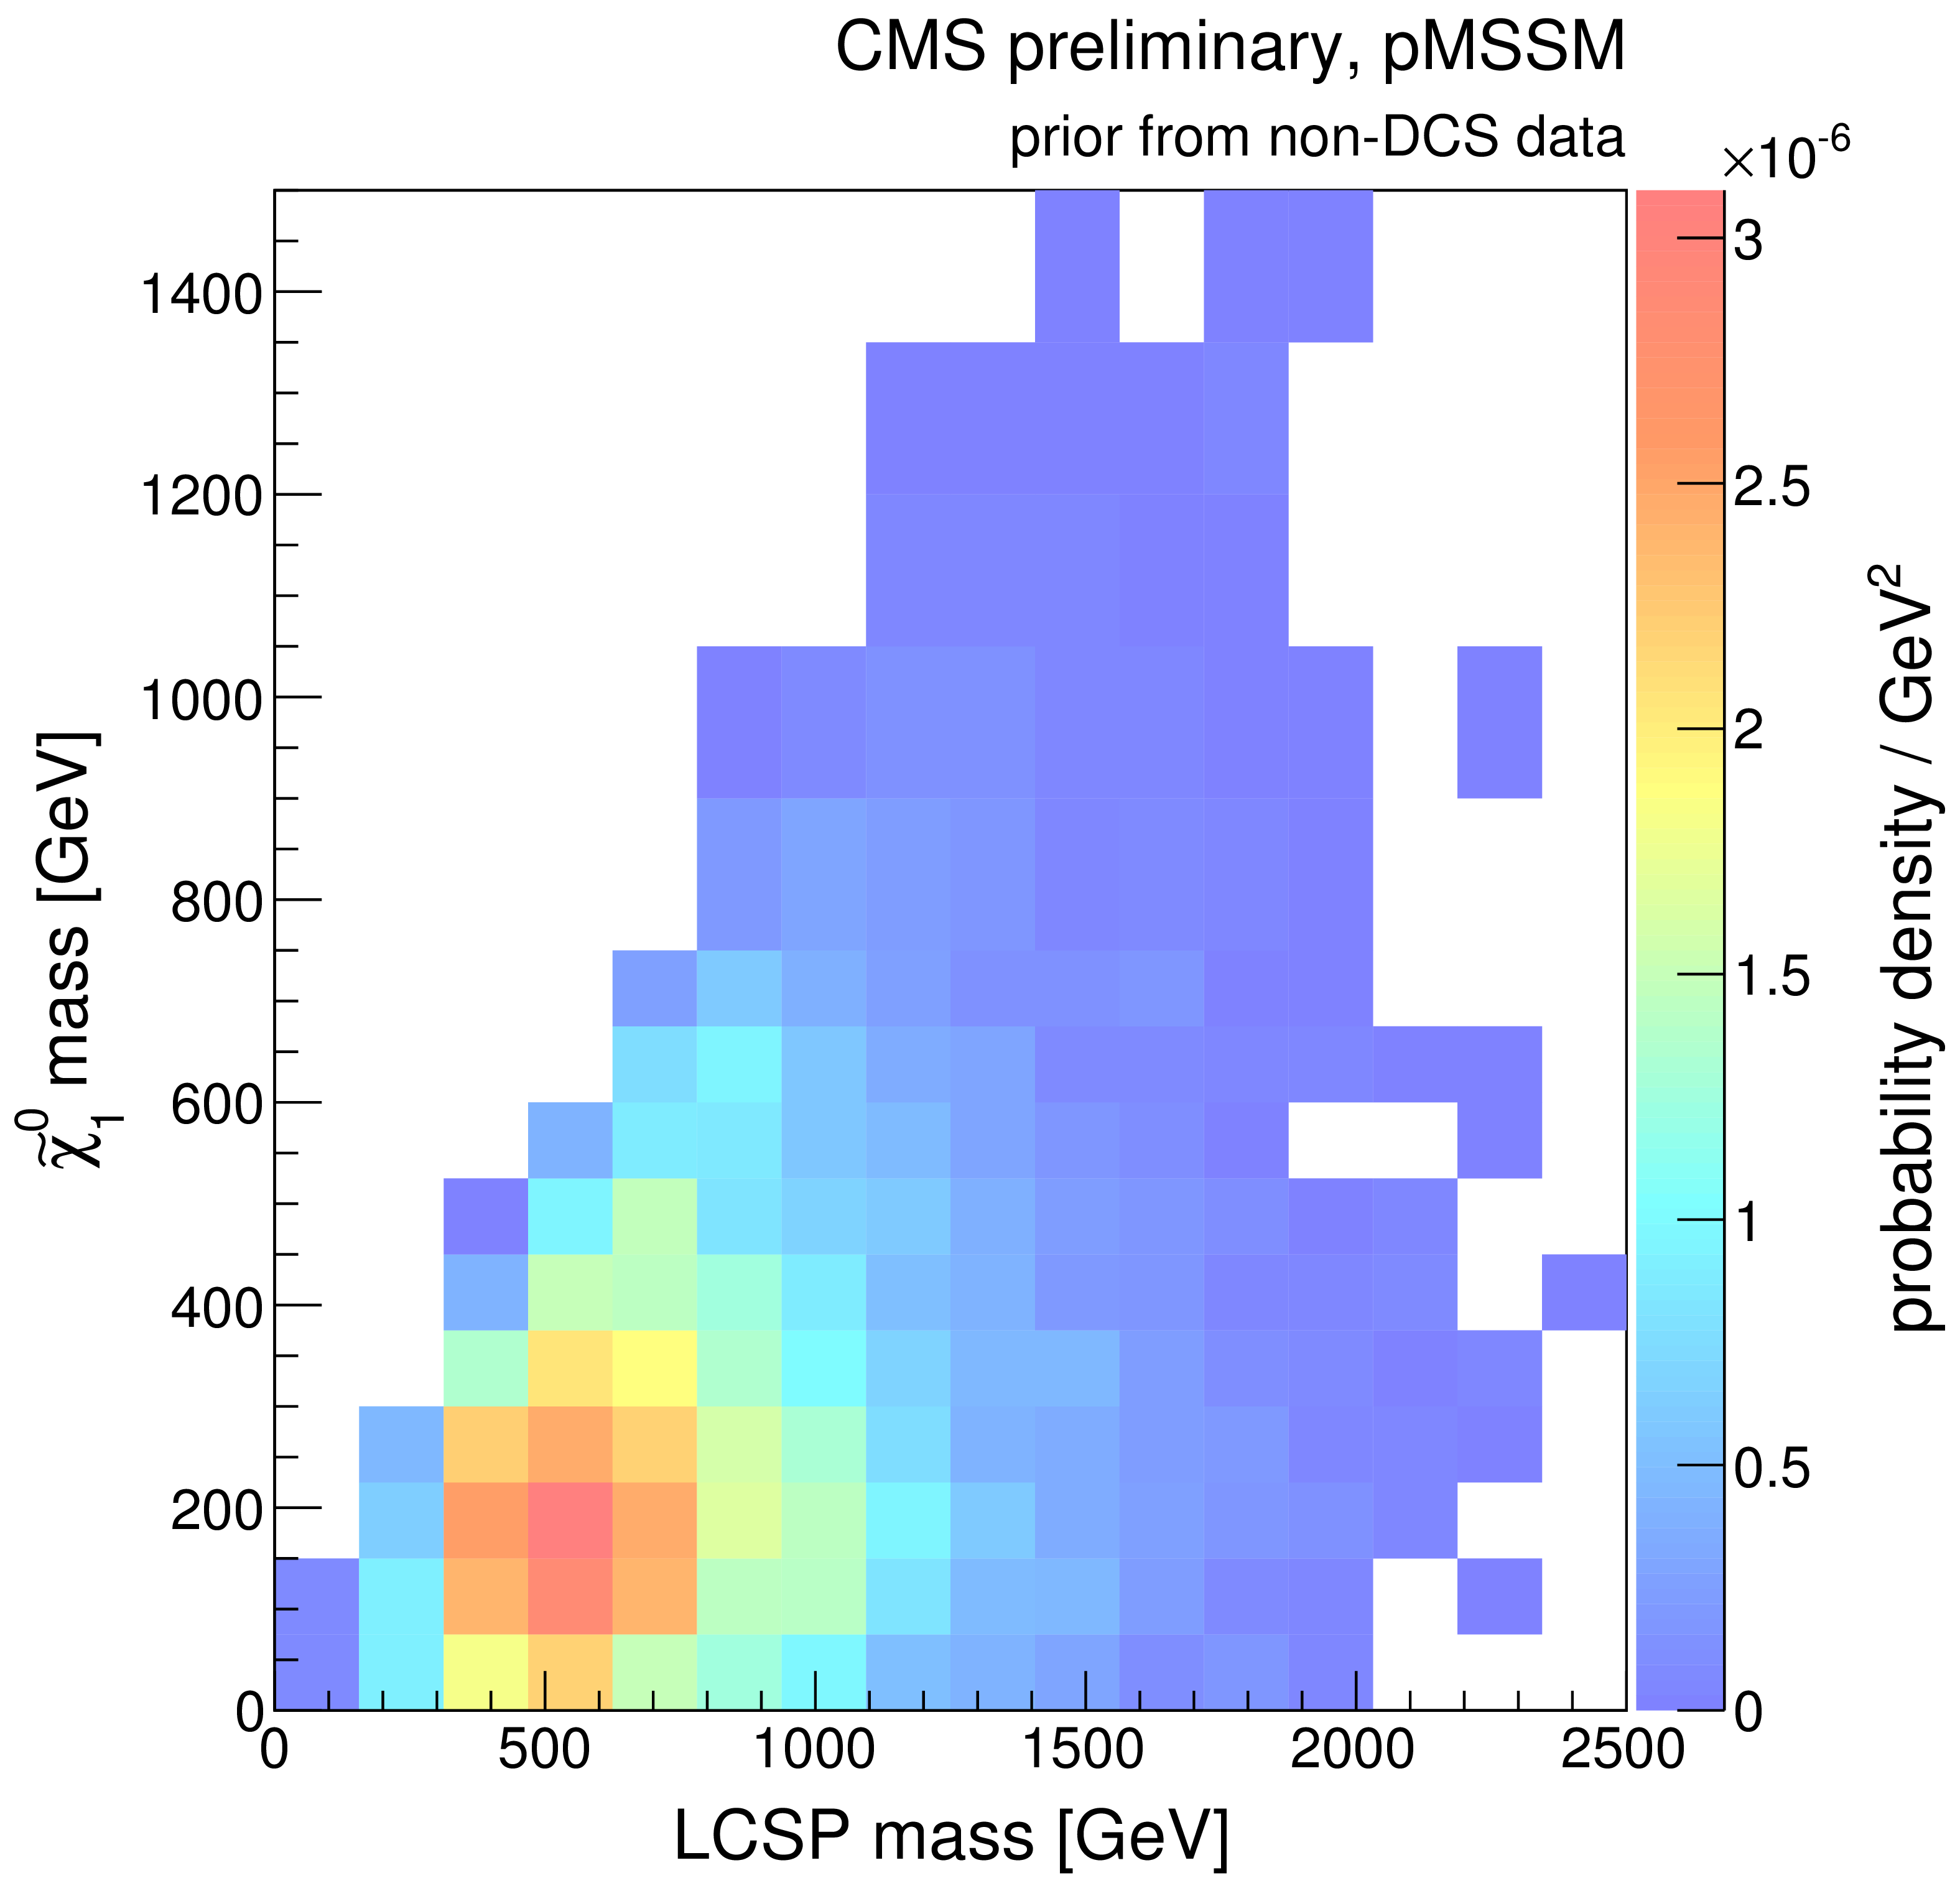
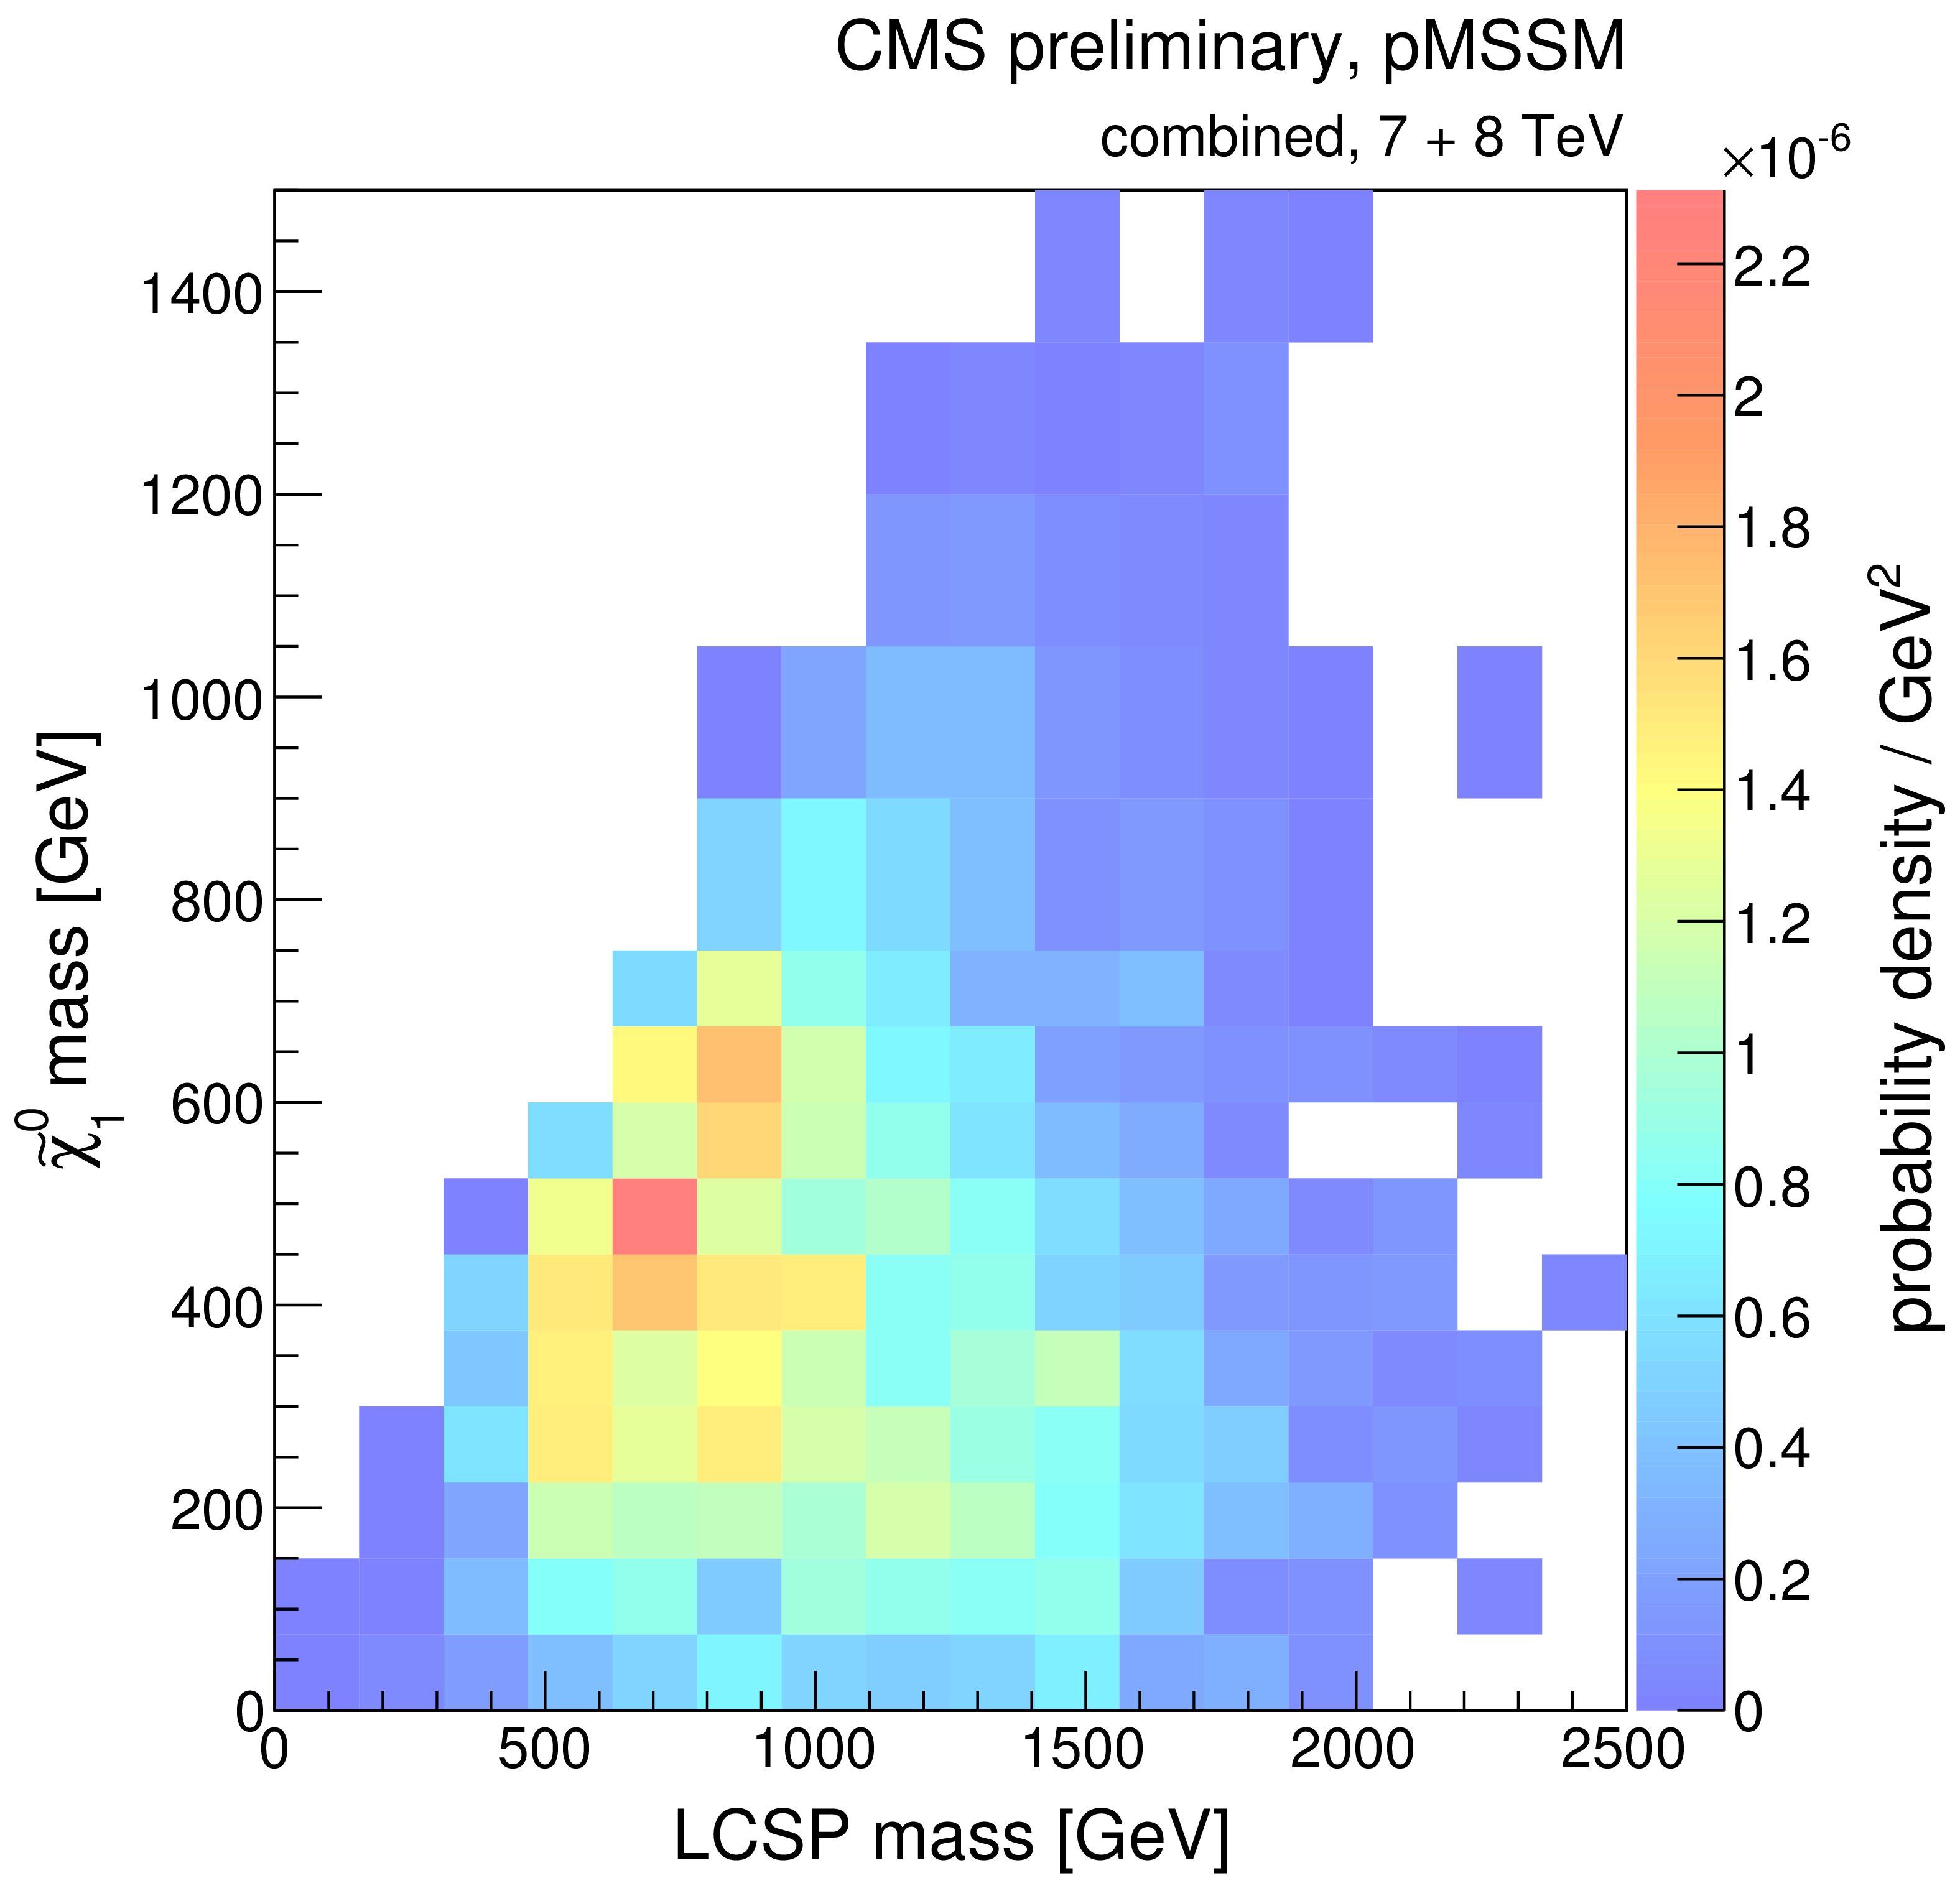
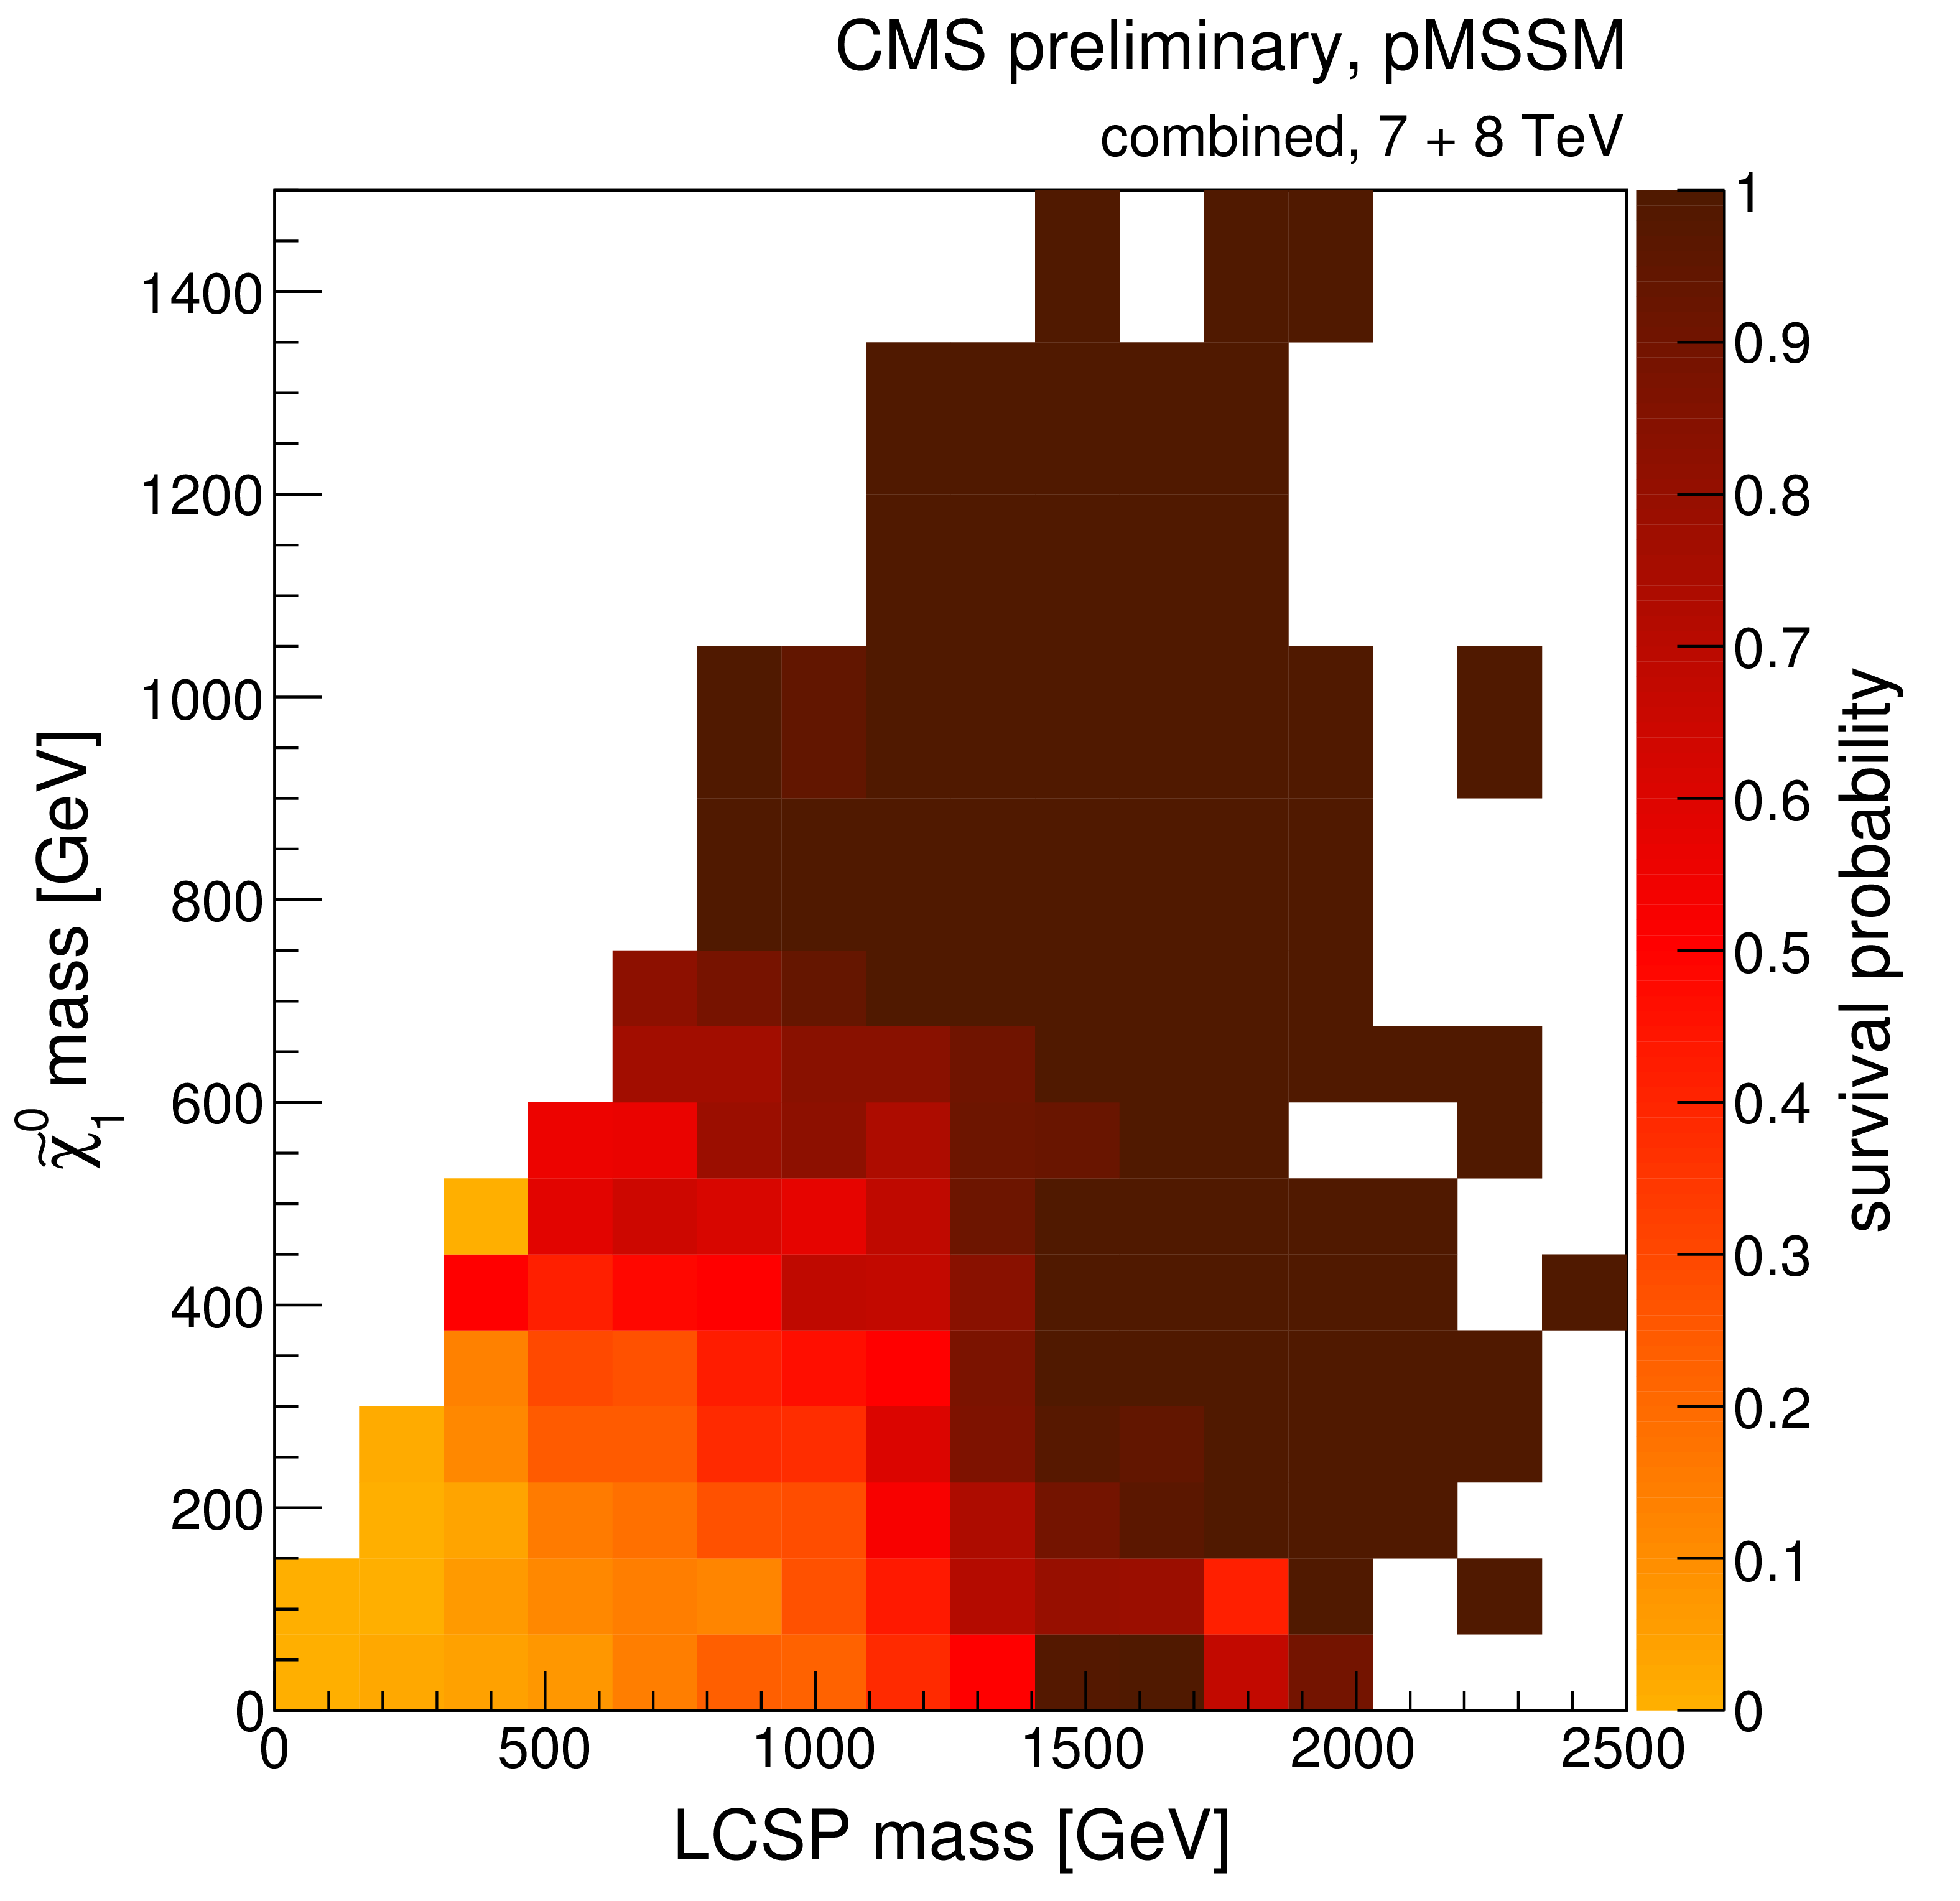
Figure 4-a:
A summary of the impact of CMS searches on our knowledge of the mass of the Lightest Colored SUSY Particle (LCSP) in the pMSSM parameter space. Plots (a)-(d) compare the non-DCS prior distribution of the LCSP mass to posterior distributions after data from various CMS searches, where (d) shows the combined effect of CMS searches and the Higgs boson results. Plot (e) shows survival probabilities as a function of the LCSP mass for various combinations of CMS data and data from Higgs boson measurements. Plot (f) shows the distribution of the LCSP mass versus the $Z$-significance calculated from the combination of all searches. See Fig.2 for a description of the shading. |
png ; pdf |
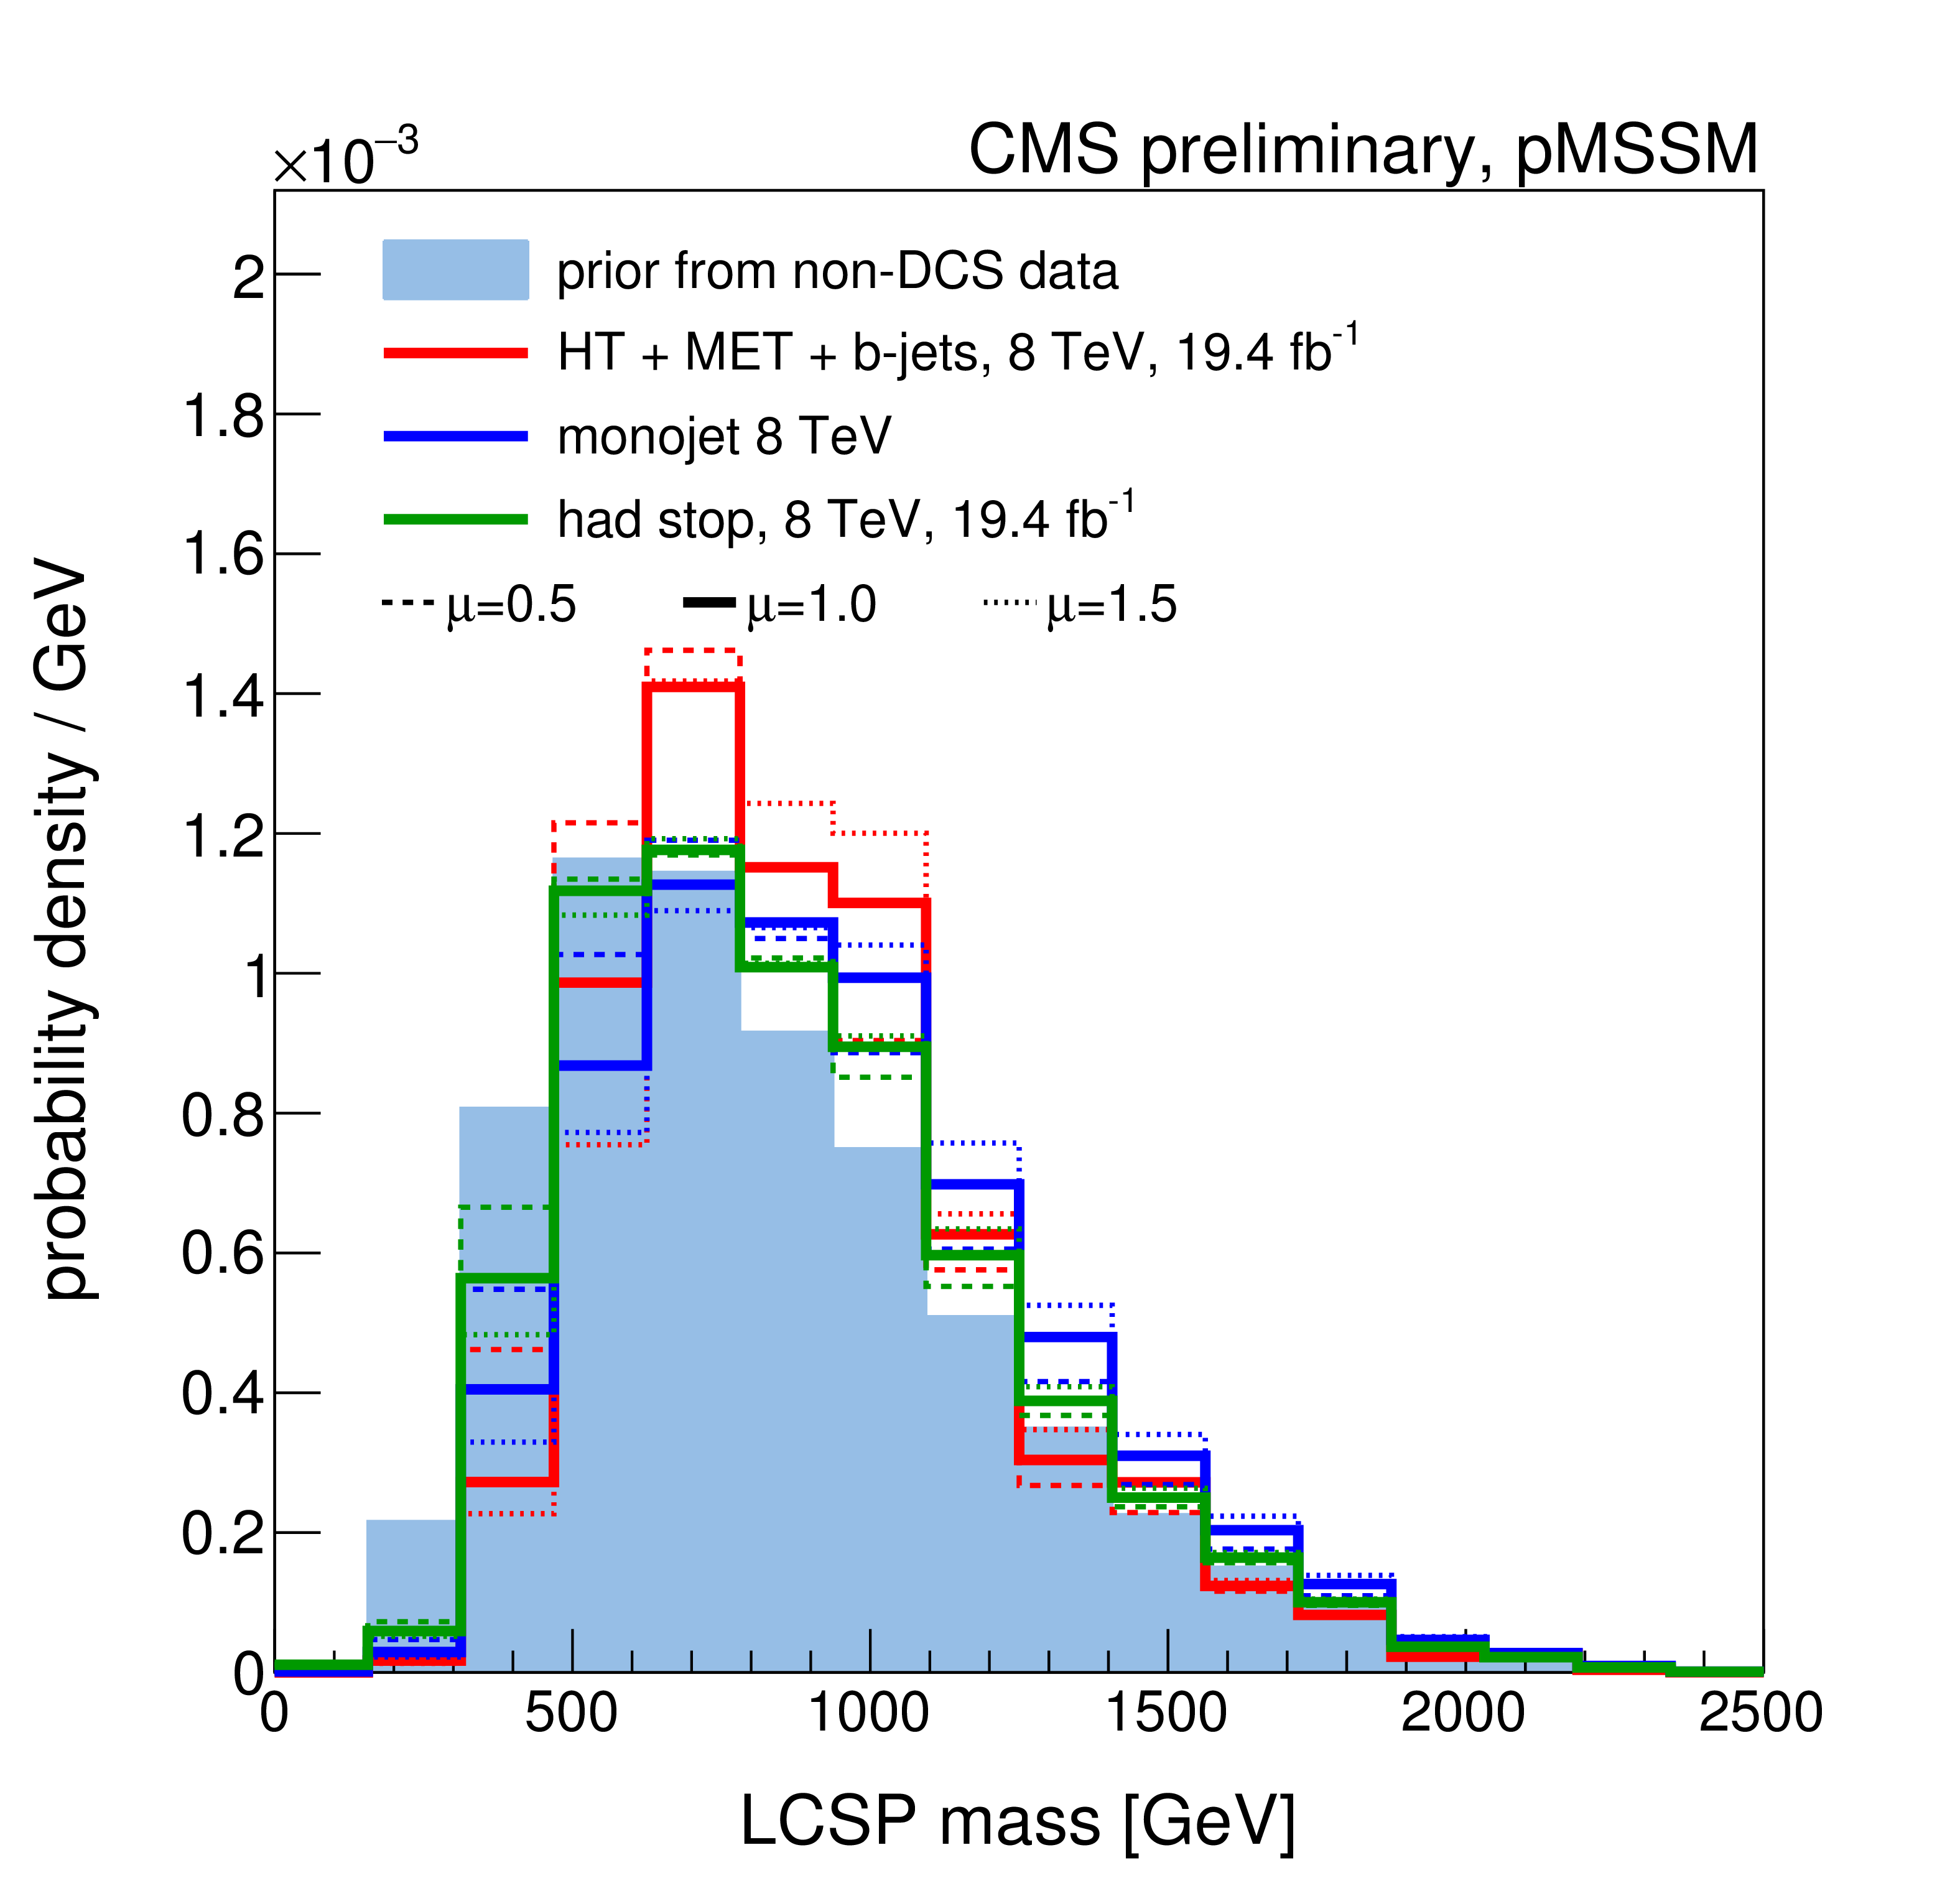
Figure 4-b:
A summary of the impact of CMS searches on our knowledge of the mass of the Lightest Colored SUSY Particle (LCSP) in the pMSSM parameter space. Plots (a)-(d) compare the non-DCS prior distribution of the LCSP mass to posterior distributions after data from various CMS searches, where (d) shows the combined effect of CMS searches and the Higgs boson results. Plot (e) shows survival probabilities as a function of the LCSP mass for various combinations of CMS data and data from Higgs boson measurements. Plot (f) shows the distribution of the LCSP mass versus the $Z$-significance calculated from the combination of all searches. See Fig.2 for a description of the shading. |
png ; pdf |
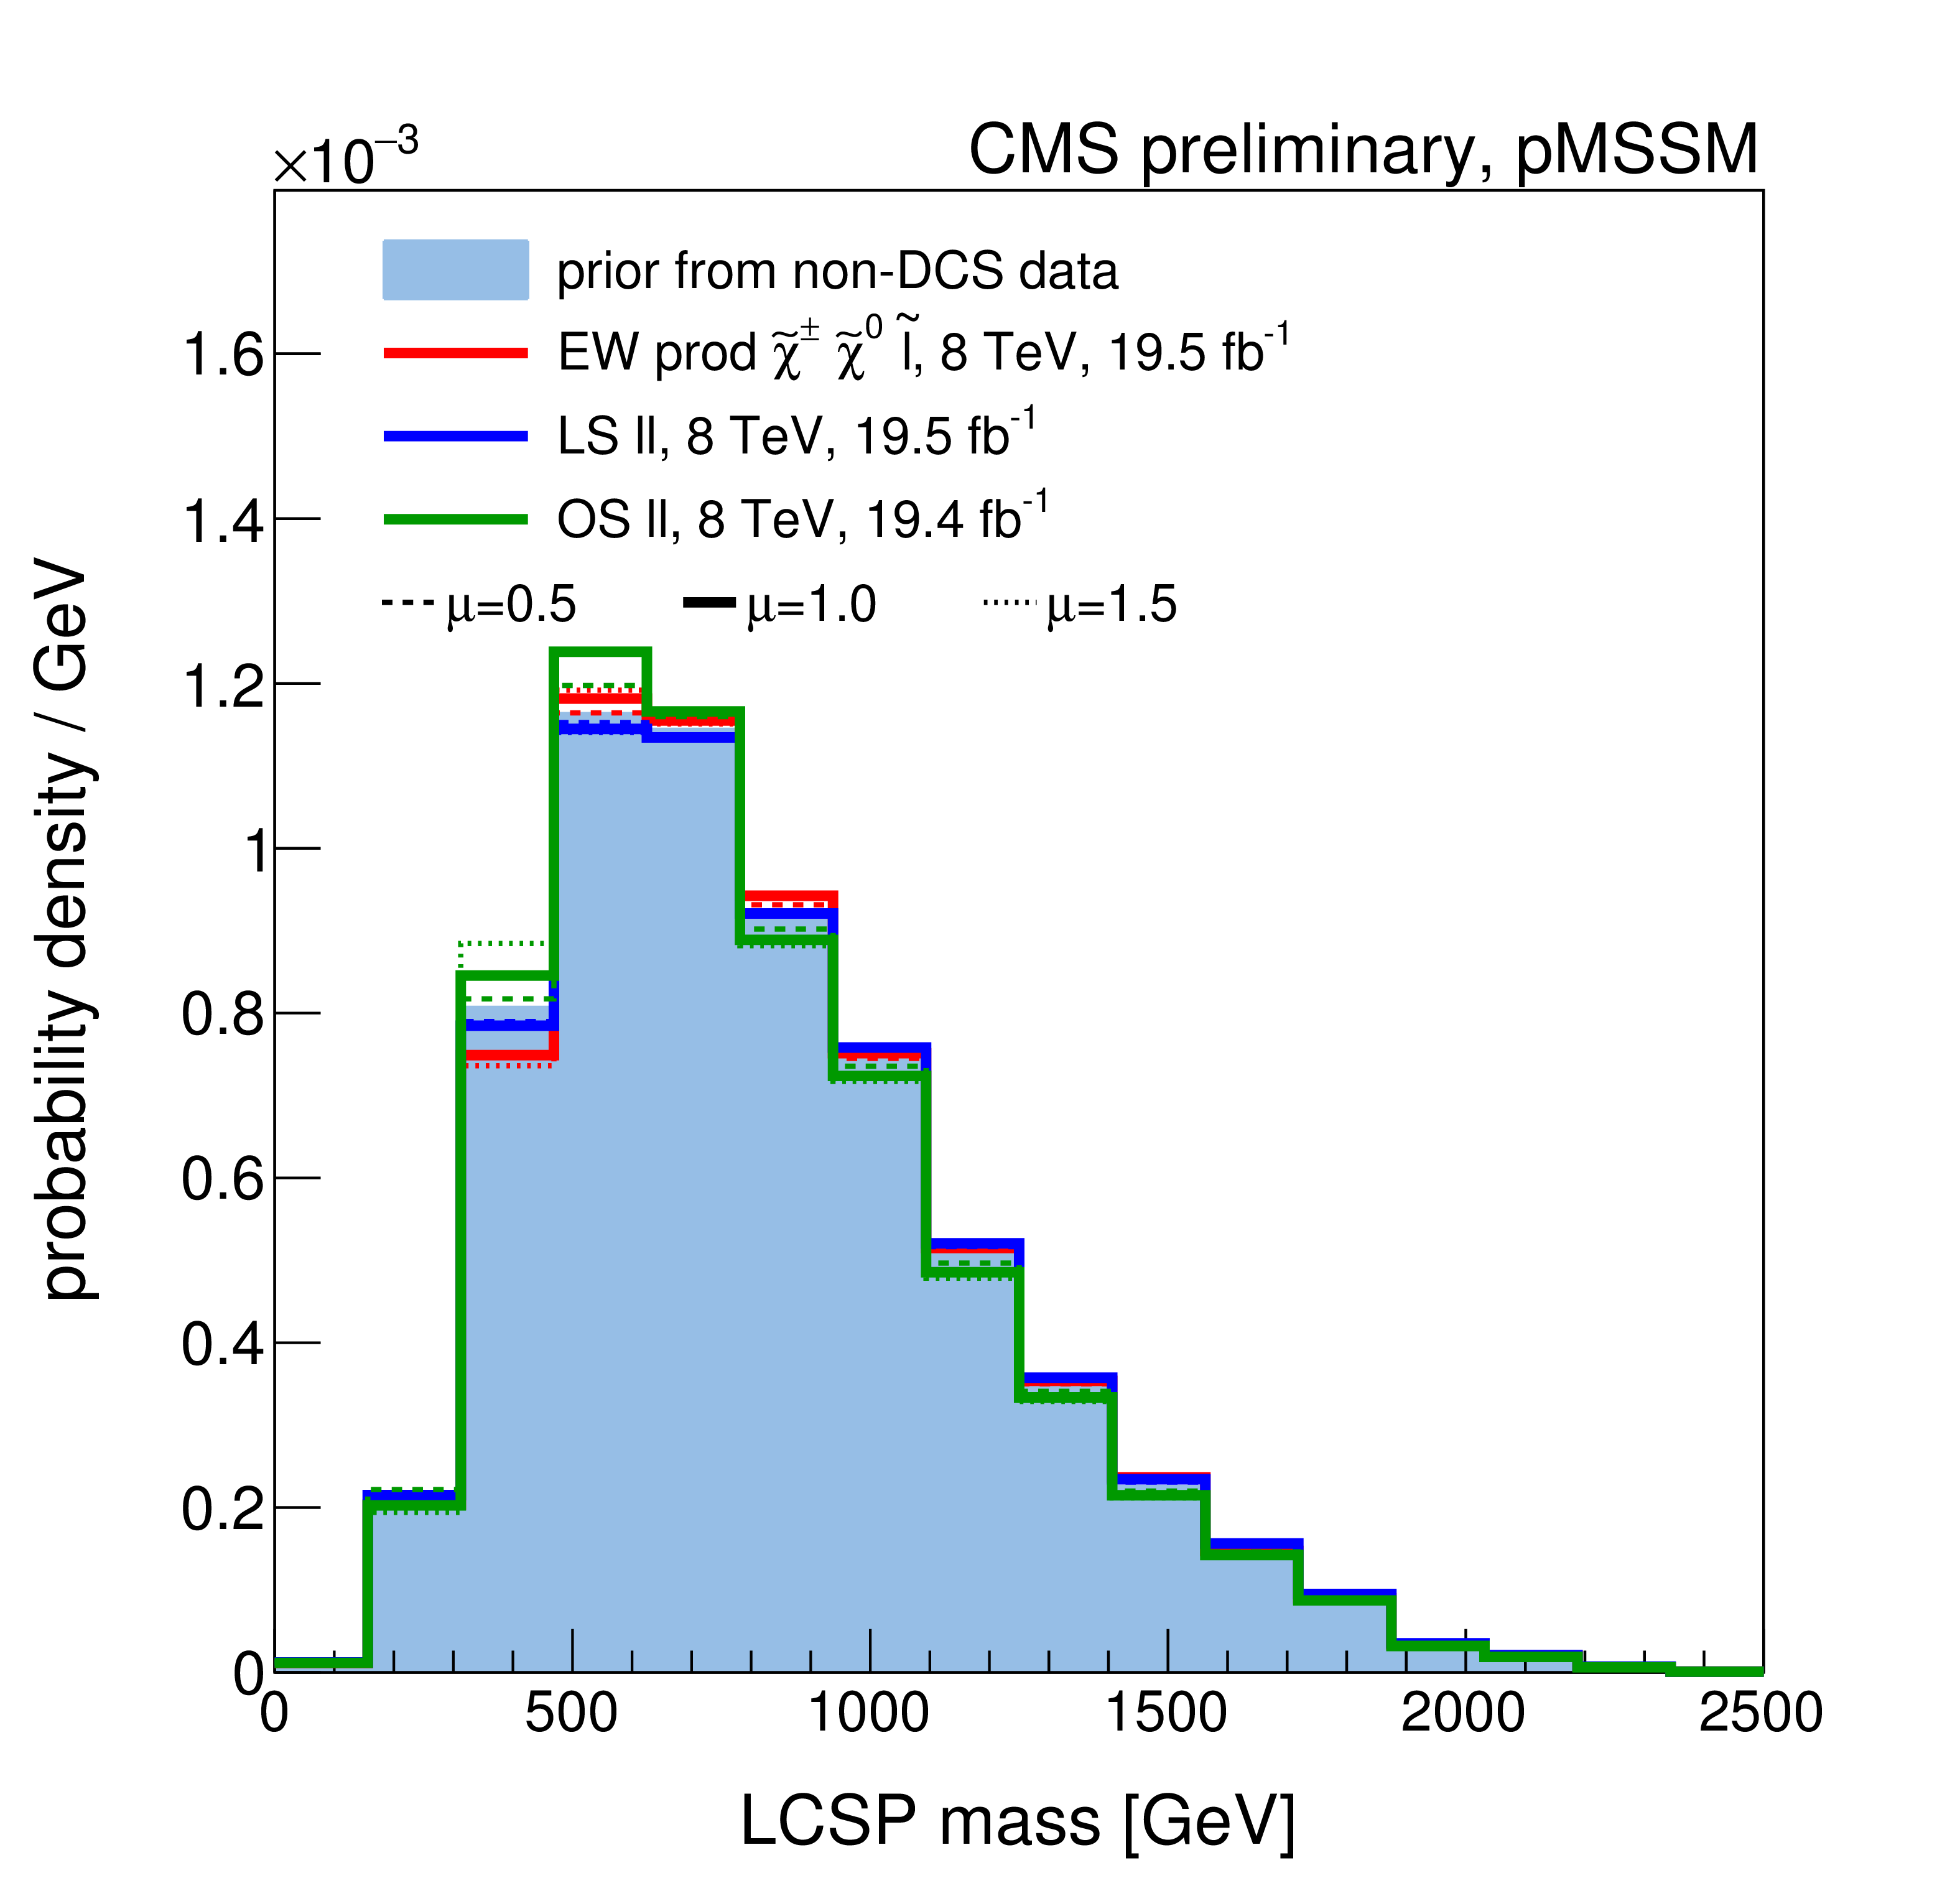
Figure 4-c:
A summary of the impact of CMS searches on our knowledge of the mass of the Lightest Colored SUSY Particle (LCSP) in the pMSSM parameter space. Plots (a)-(d) compare the non-DCS prior distribution of the LCSP mass to posterior distributions after data from various CMS searches, where (d) shows the combined effect of CMS searches and the Higgs boson results. Plot (e) shows survival probabilities as a function of the LCSP mass for various combinations of CMS data and data from Higgs boson measurements. Plot (f) shows the distribution of the LCSP mass versus the $Z$-significance calculated from the combination of all searches. See Fig.2 for a description of the shading. |

png ; pdf |
Figure 4-d:
A summary of the impact of CMS searches on our knowledge of the mass of the Lightest Colored SUSY Particle (LCSP) in the pMSSM parameter space. Plots (a)-(d) compare the non-DCS prior distribution of the LCSP mass to posterior distributions after data from various CMS searches, where (d) shows the combined effect of CMS searches and the Higgs boson results. Plot (e) shows survival probabilities as a function of the LCSP mass for various combinations of CMS data and data from Higgs boson measurements. Plot (f) shows the distribution of the LCSP mass versus the $Z$-significance calculated from the combination of all searches. See Fig.2 for a description of the shading. |

png ; pdf |
Figure 4-e:
A summary of the impact of CMS searches on our knowledge of the mass of the Lightest Colored SUSY Particle (LCSP) in the pMSSM parameter space. Plots (a)-(d) compare the non-DCS prior distribution of the LCSP mass to posterior distributions after data from various CMS searches, where (d) shows the combined effect of CMS searches and the Higgs boson results. Plot (e) shows survival probabilities as a function of the LCSP mass for various combinations of CMS data and data from Higgs boson measurements. Plot (f) shows the distribution of the LCSP mass versus the $Z$-significance calculated from the combination of all searches. See Fig.2 for a description of the shading. |
png ; pdf |
Figure 4-f:
A summary of the impact of CMS searches on our knowledge of the mass of the Lightest Colored SUSY Particle (LCSP) in the pMSSM parameter space. Plots (a)-(d) compare the non-DCS prior distribution of the LCSP mass to posterior distributions after data from various CMS searches, where (d) shows the combined effect of CMS searches and the Higgs boson results. Plot (e) shows survival probabilities as a function of the LCSP mass for various combinations of CMS data and data from Higgs boson measurements. Plot (f) shows the distribution of the LCSP mass versus the $Z$-significance calculated from the combination of all searches. See Fig.2 for a description of the shading. |
png ; pdf |
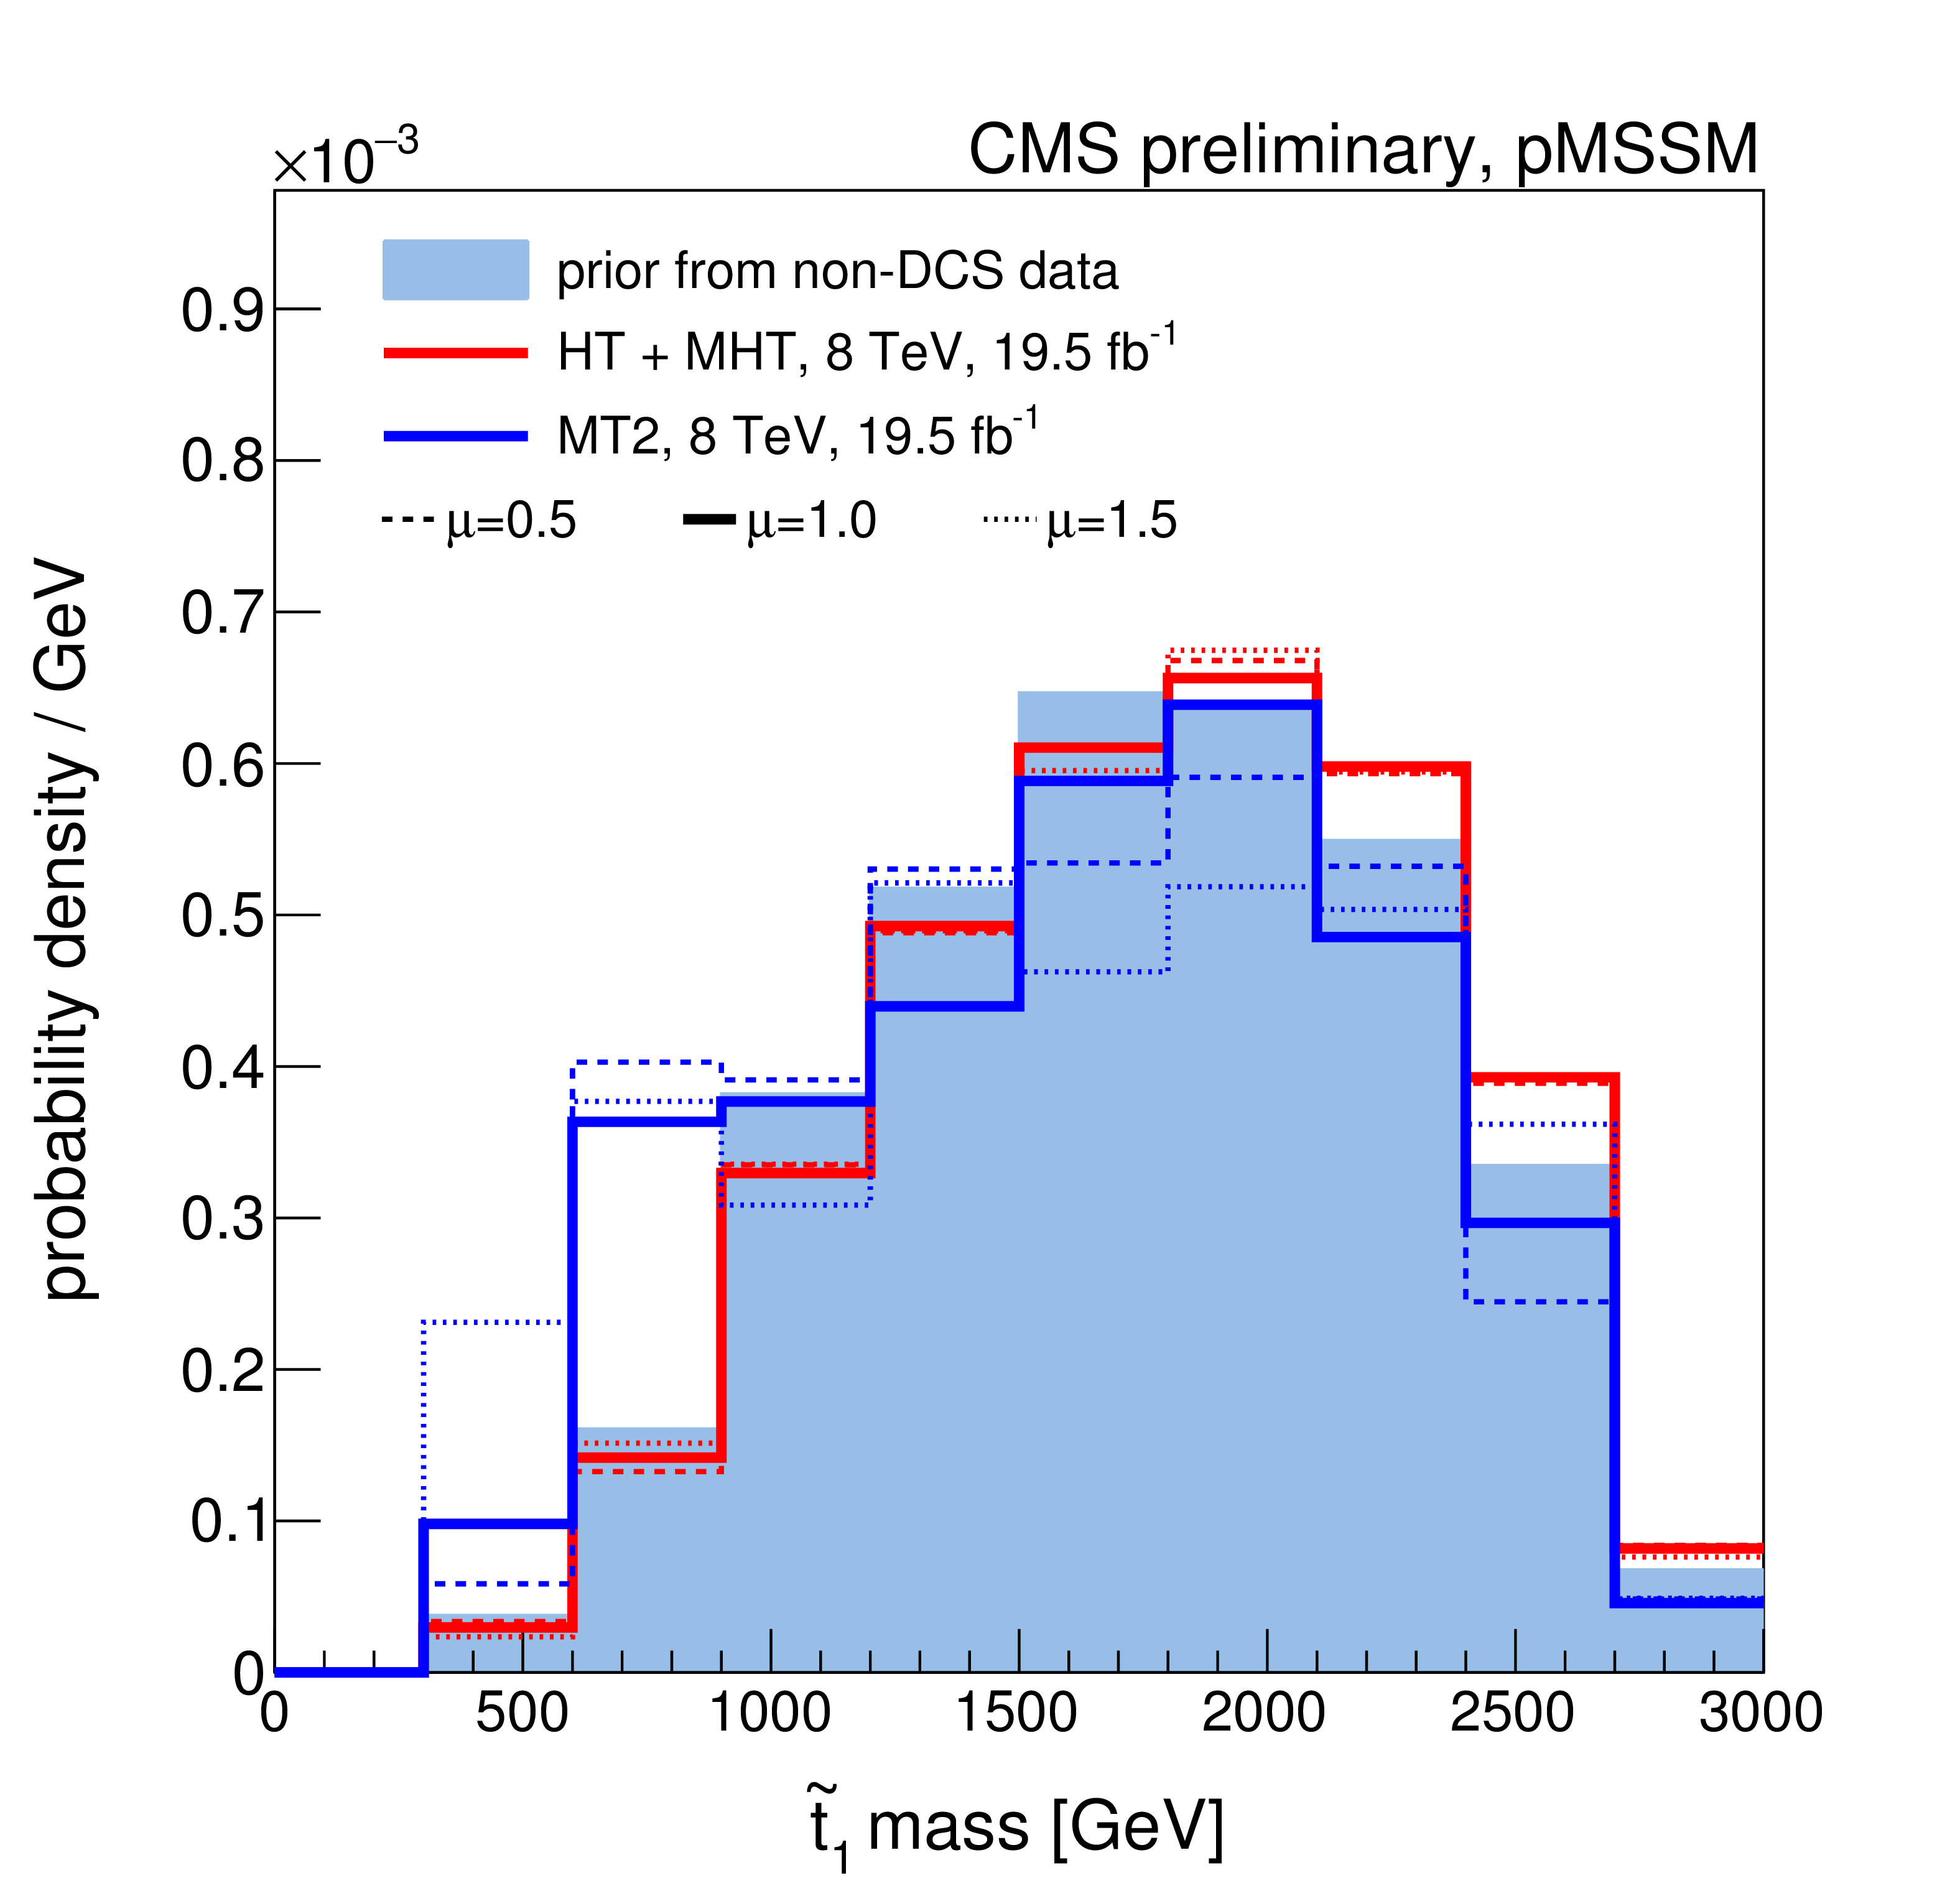
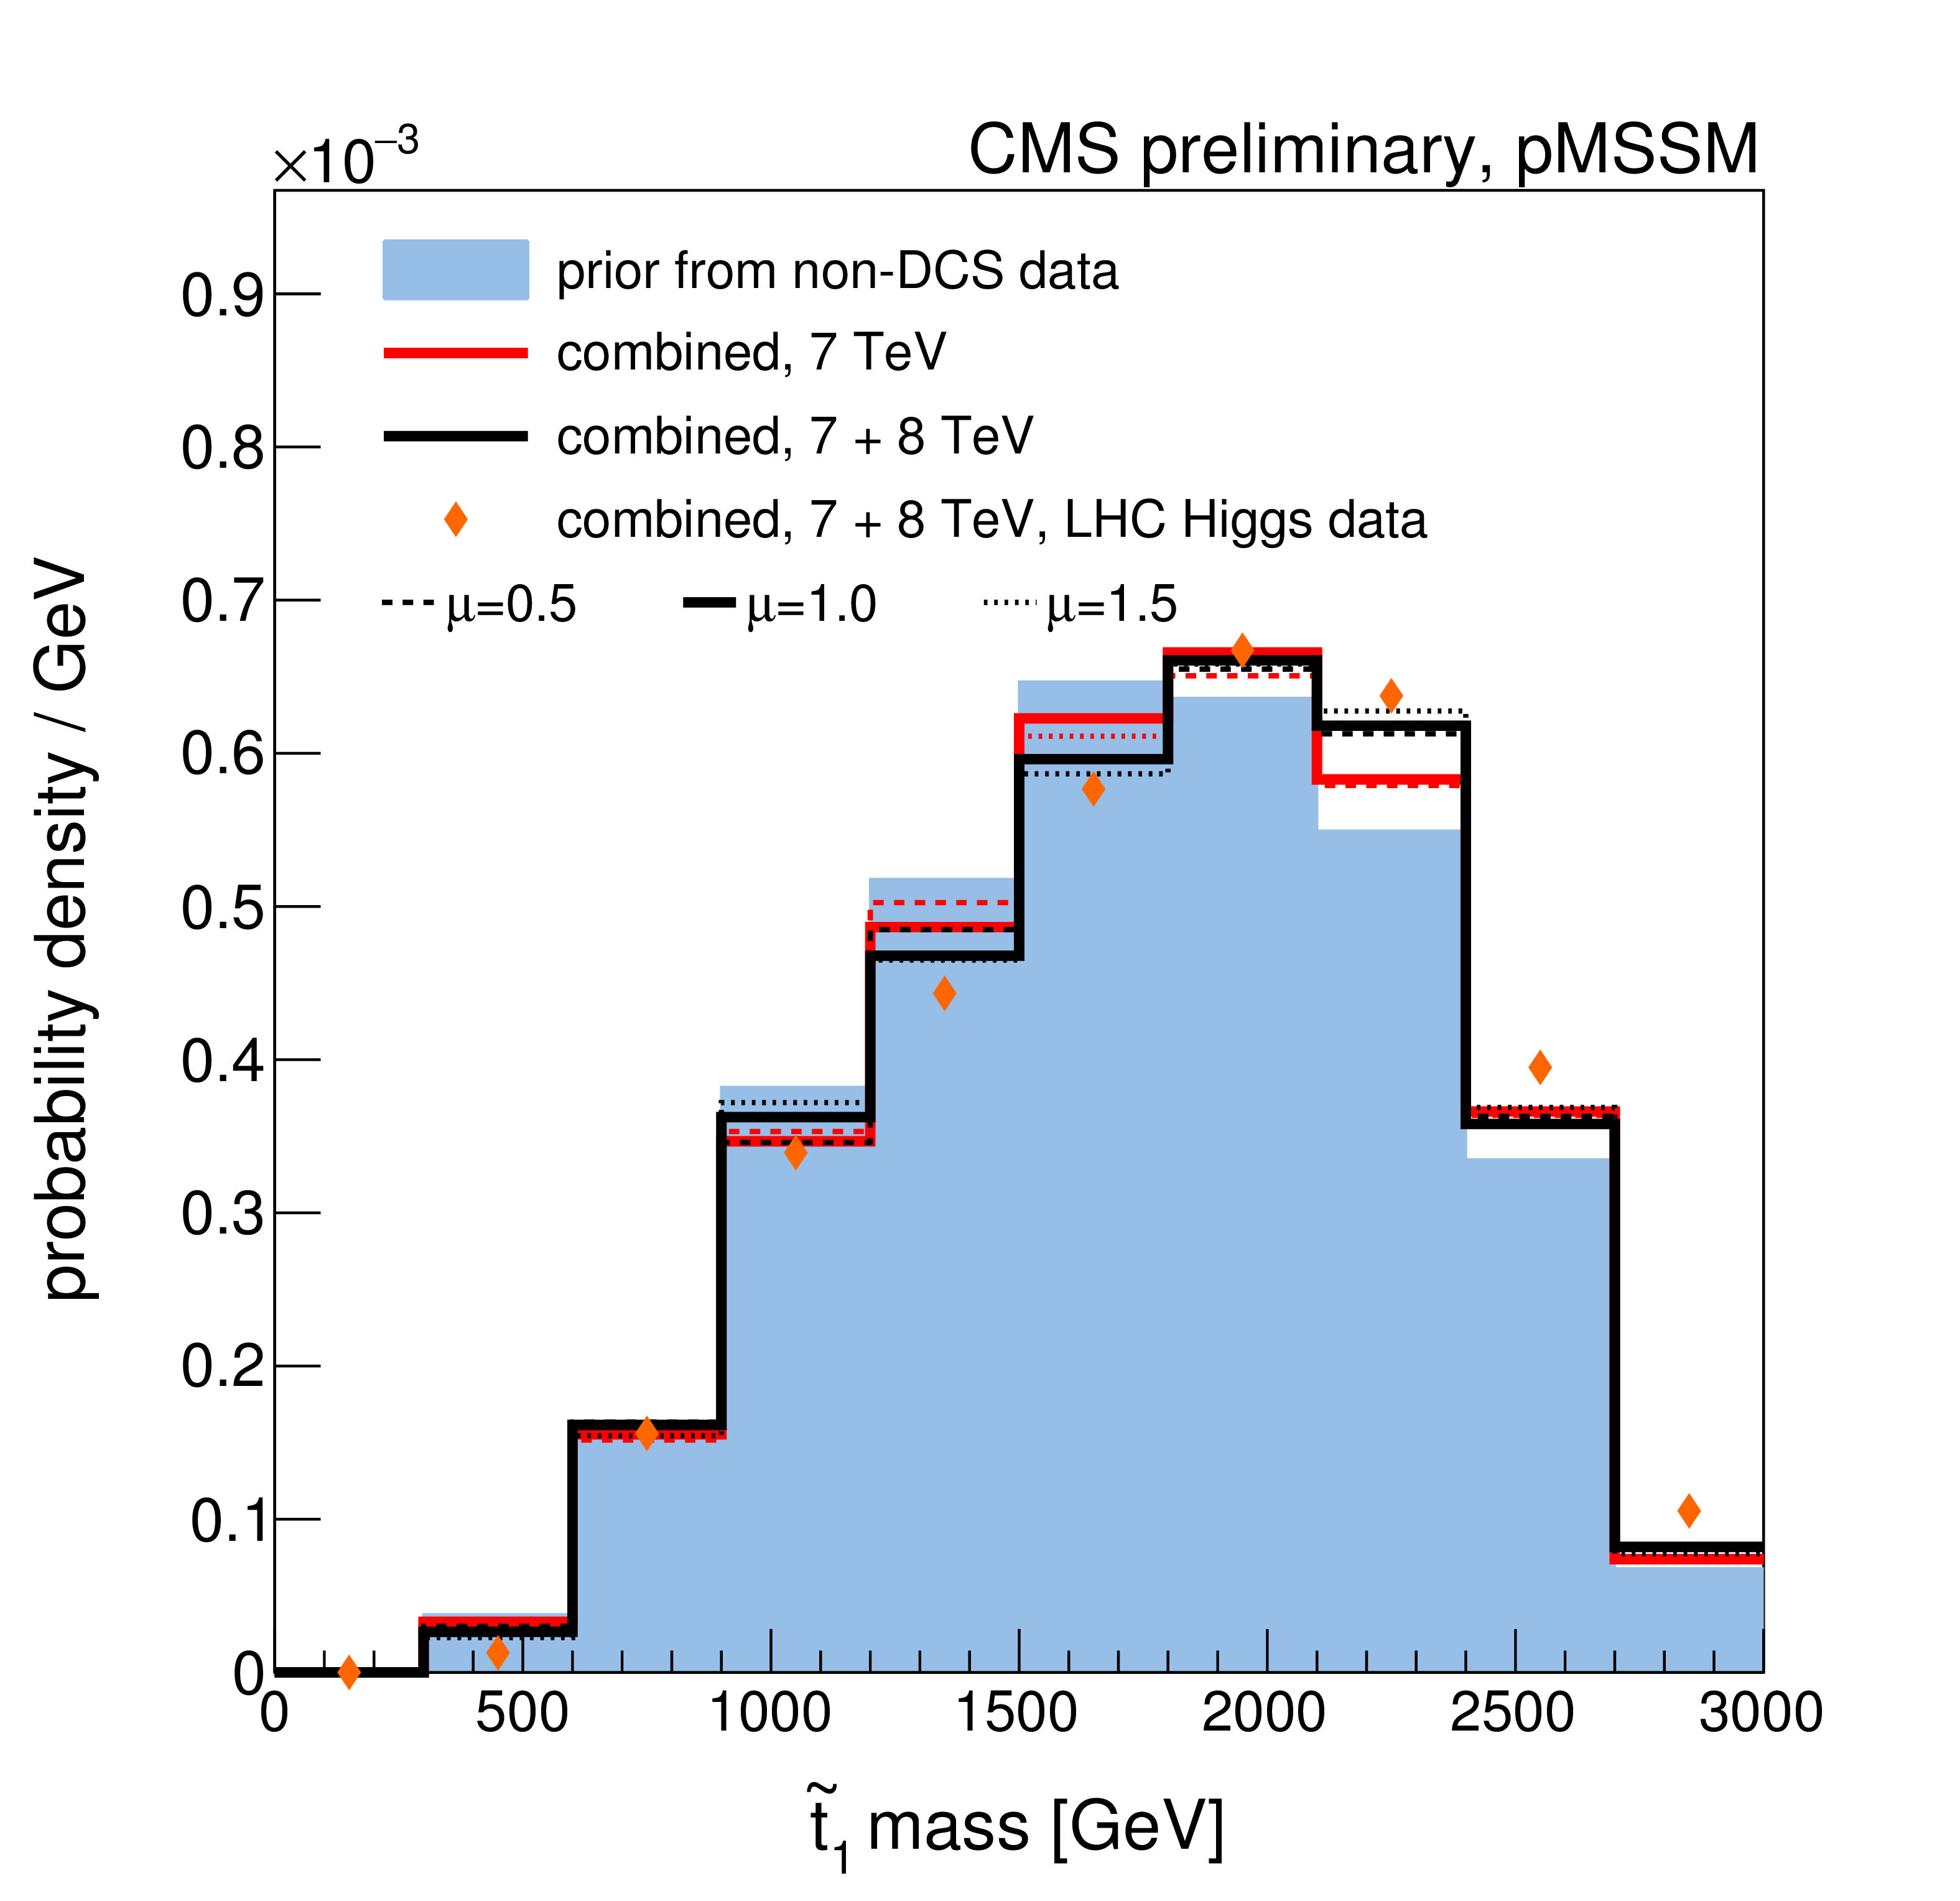
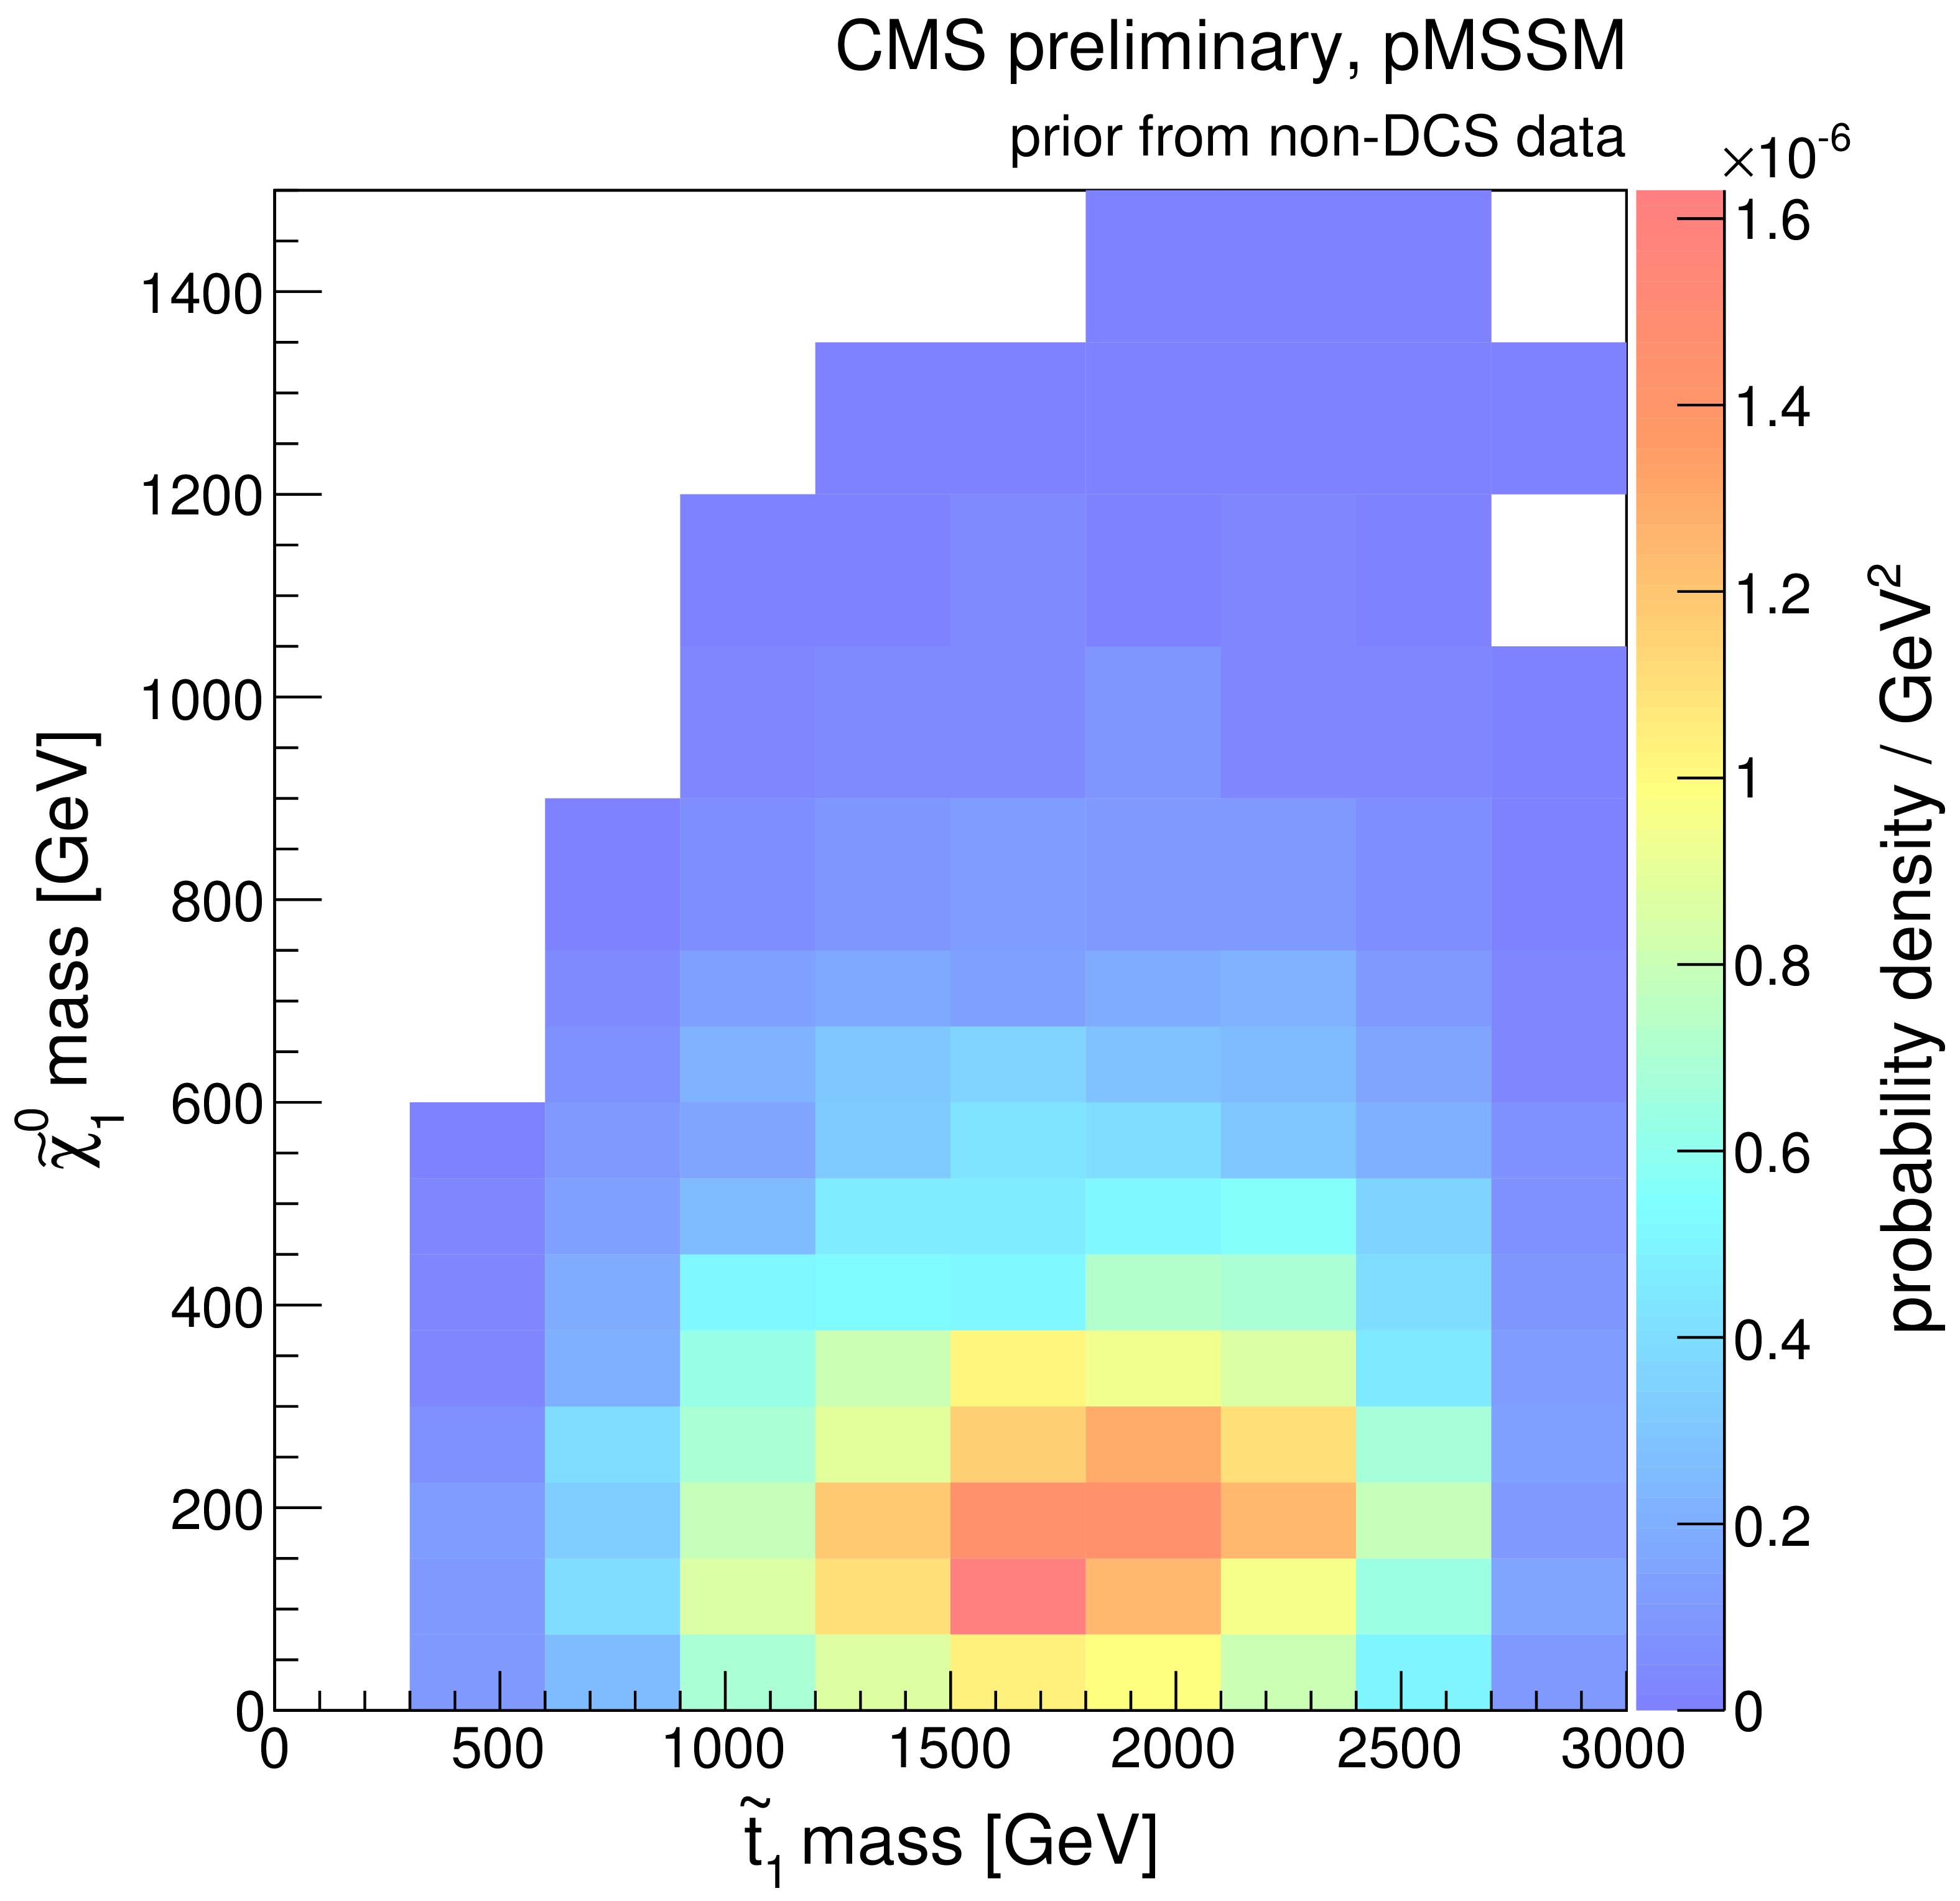
Figure 5-a:
A summary of the impact of CMS searches on our knowledge of the $\tilde{t}_1$ quark mass in the pMSSM parameter space. Plots (a)-(d) compare the non-DCS prior distribution of the $\tilde{t}_1$ quark mass to posterior distributions after data from various CMS searches, where (d) shows the combined effect of CMS searches and the Higgs boson results. Plot (e) shows survival probabilities as a function of the $\tilde{t}_1$ quark mass for various combinations of CMS data and data from Higgs boson measurements. Plot (f) shows the distribution of the $\tilde{t}_1$ quark mass versus the $Z$-significance calculated from the combination of all searches. See Fig.2 for a description of the shading. |
png ; pdf |
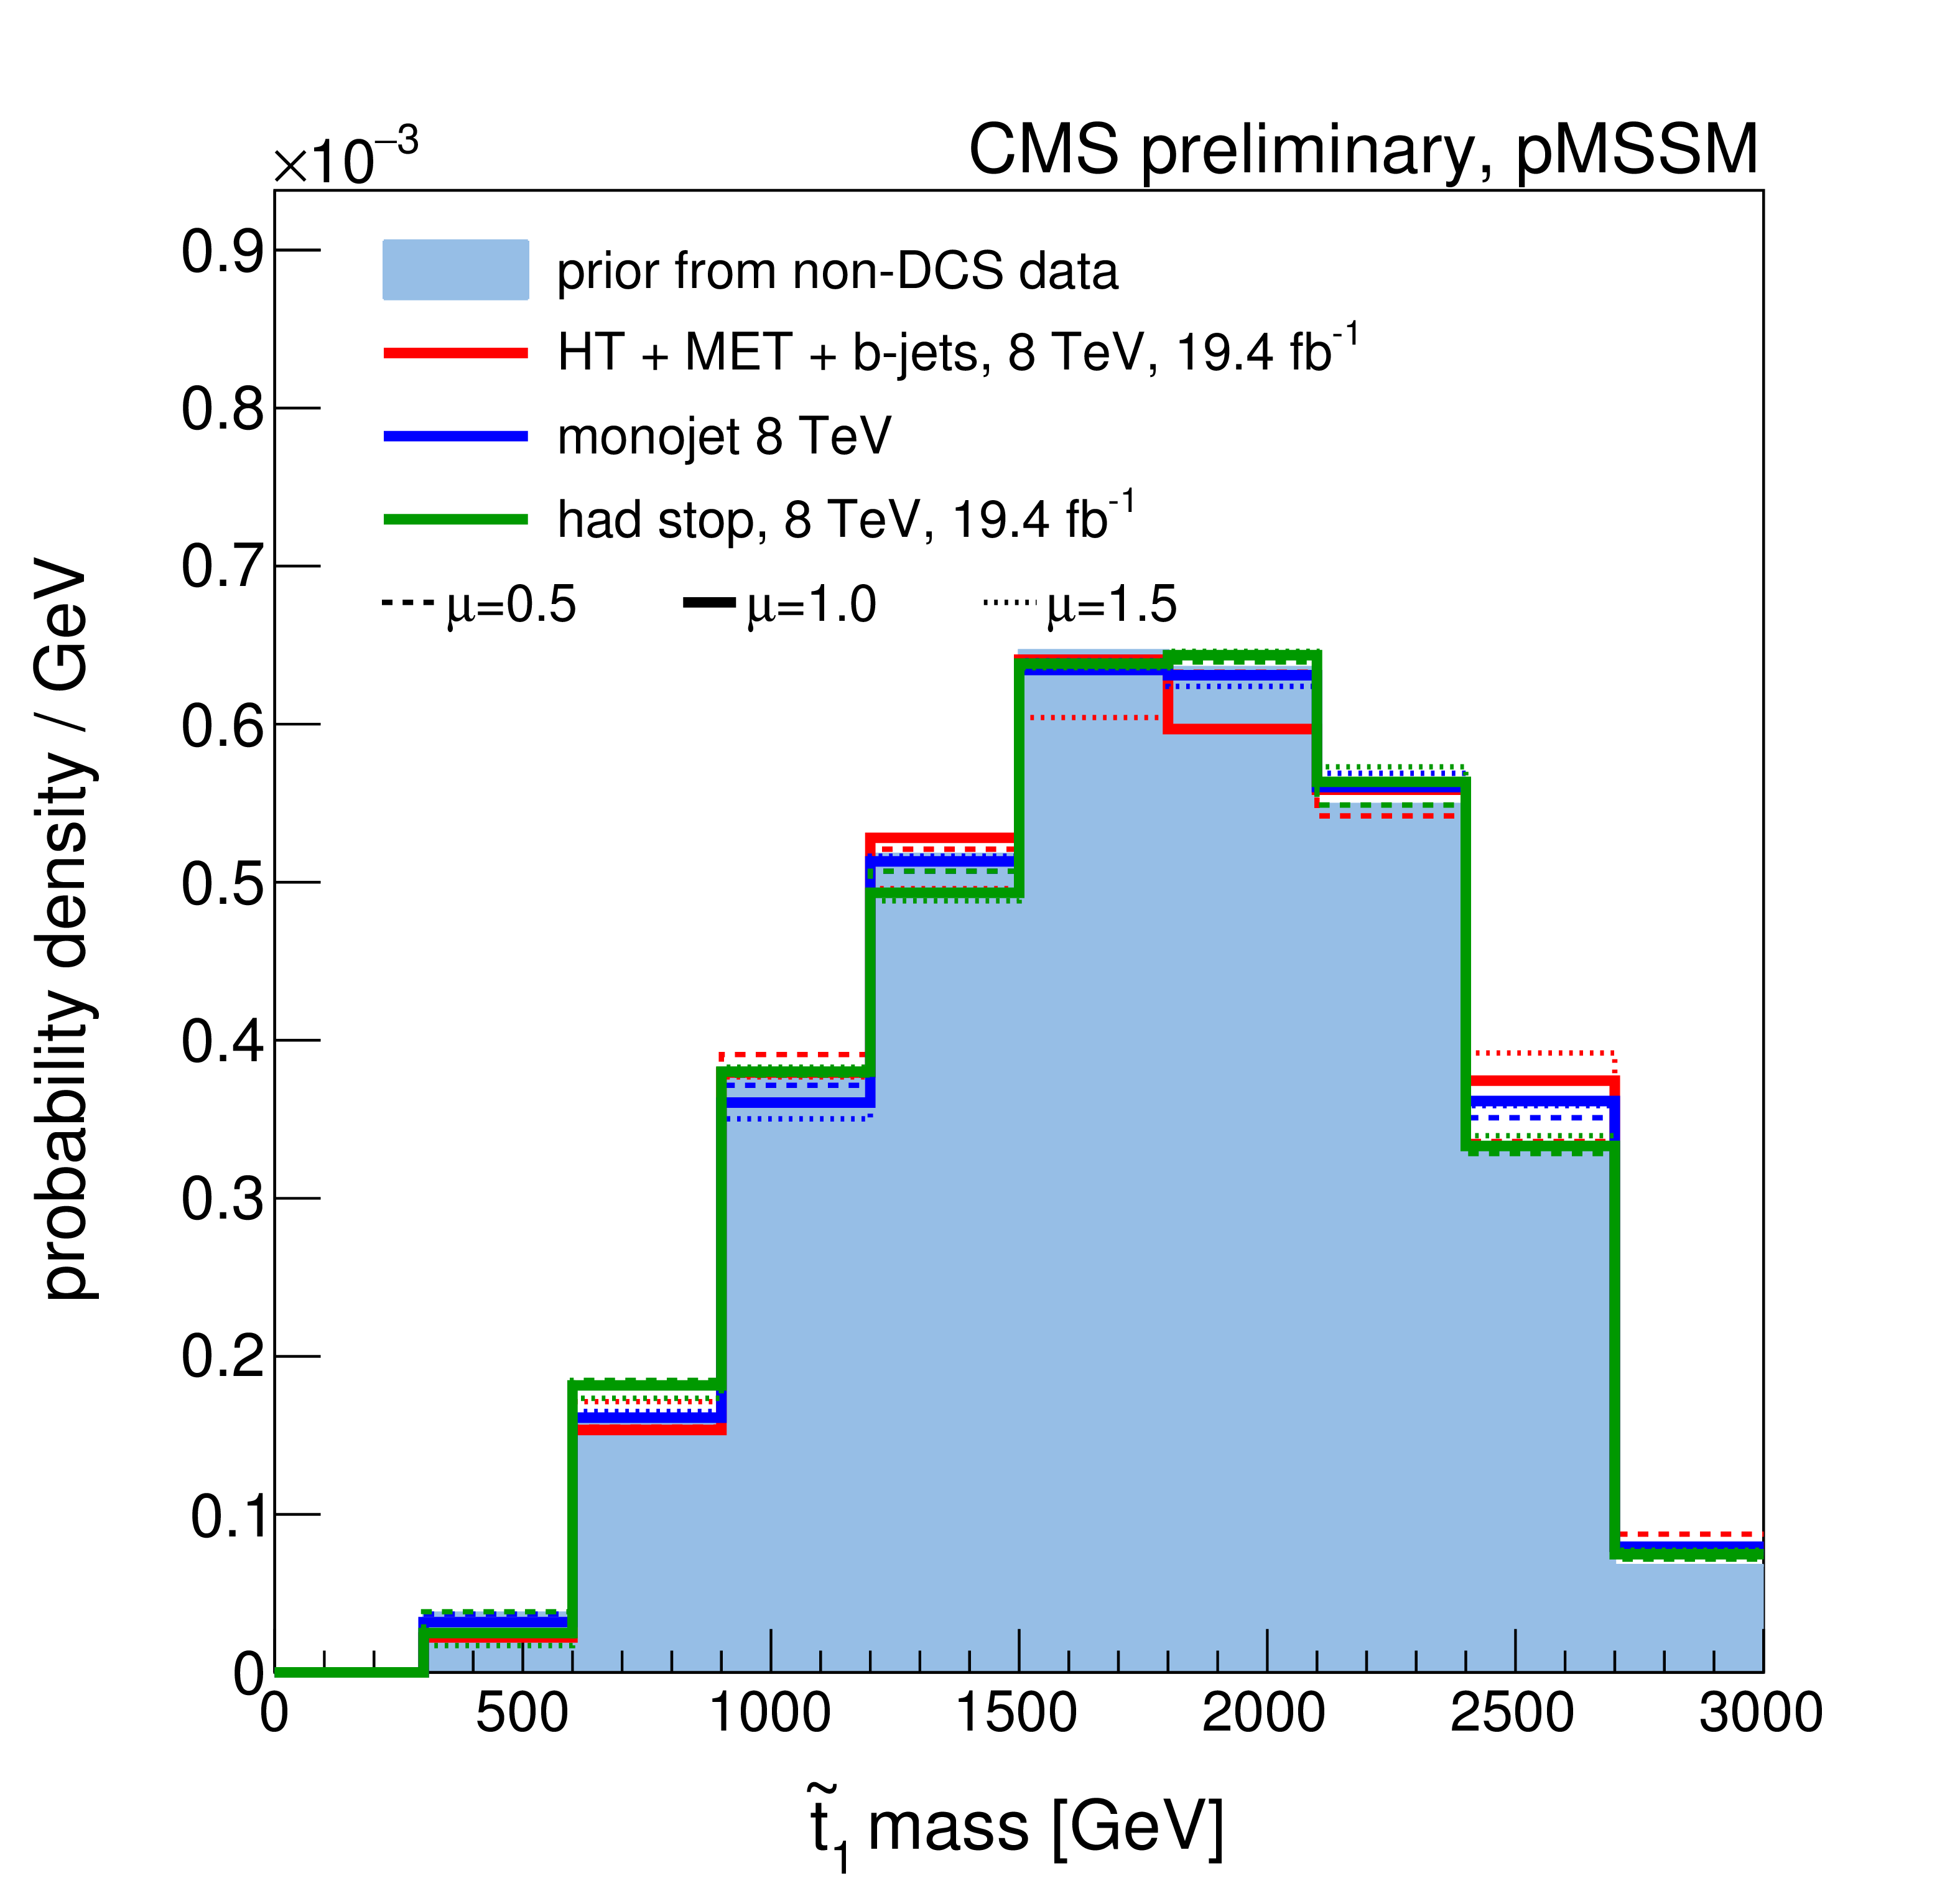
Figure 5-b:
A summary of the impact of CMS searches on our knowledge of the $\tilde{t}_1$ quark mass in the pMSSM parameter space. Plots (a)-(d) compare the non-DCS prior distribution of the $\tilde{t}_1$ quark mass to posterior distributions after data from various CMS searches, where (d) shows the combined effect of CMS searches and the Higgs boson results. Plot (e) shows survival probabilities as a function of the $\tilde{t}_1$ quark mass for various combinations of CMS data and data from Higgs boson measurements. Plot (f) shows the distribution of the $\tilde{t}_1$ quark mass versus the $Z$-significance calculated from the combination of all searches. See Fig.2 for a description of the shading. |
png ; pdf |
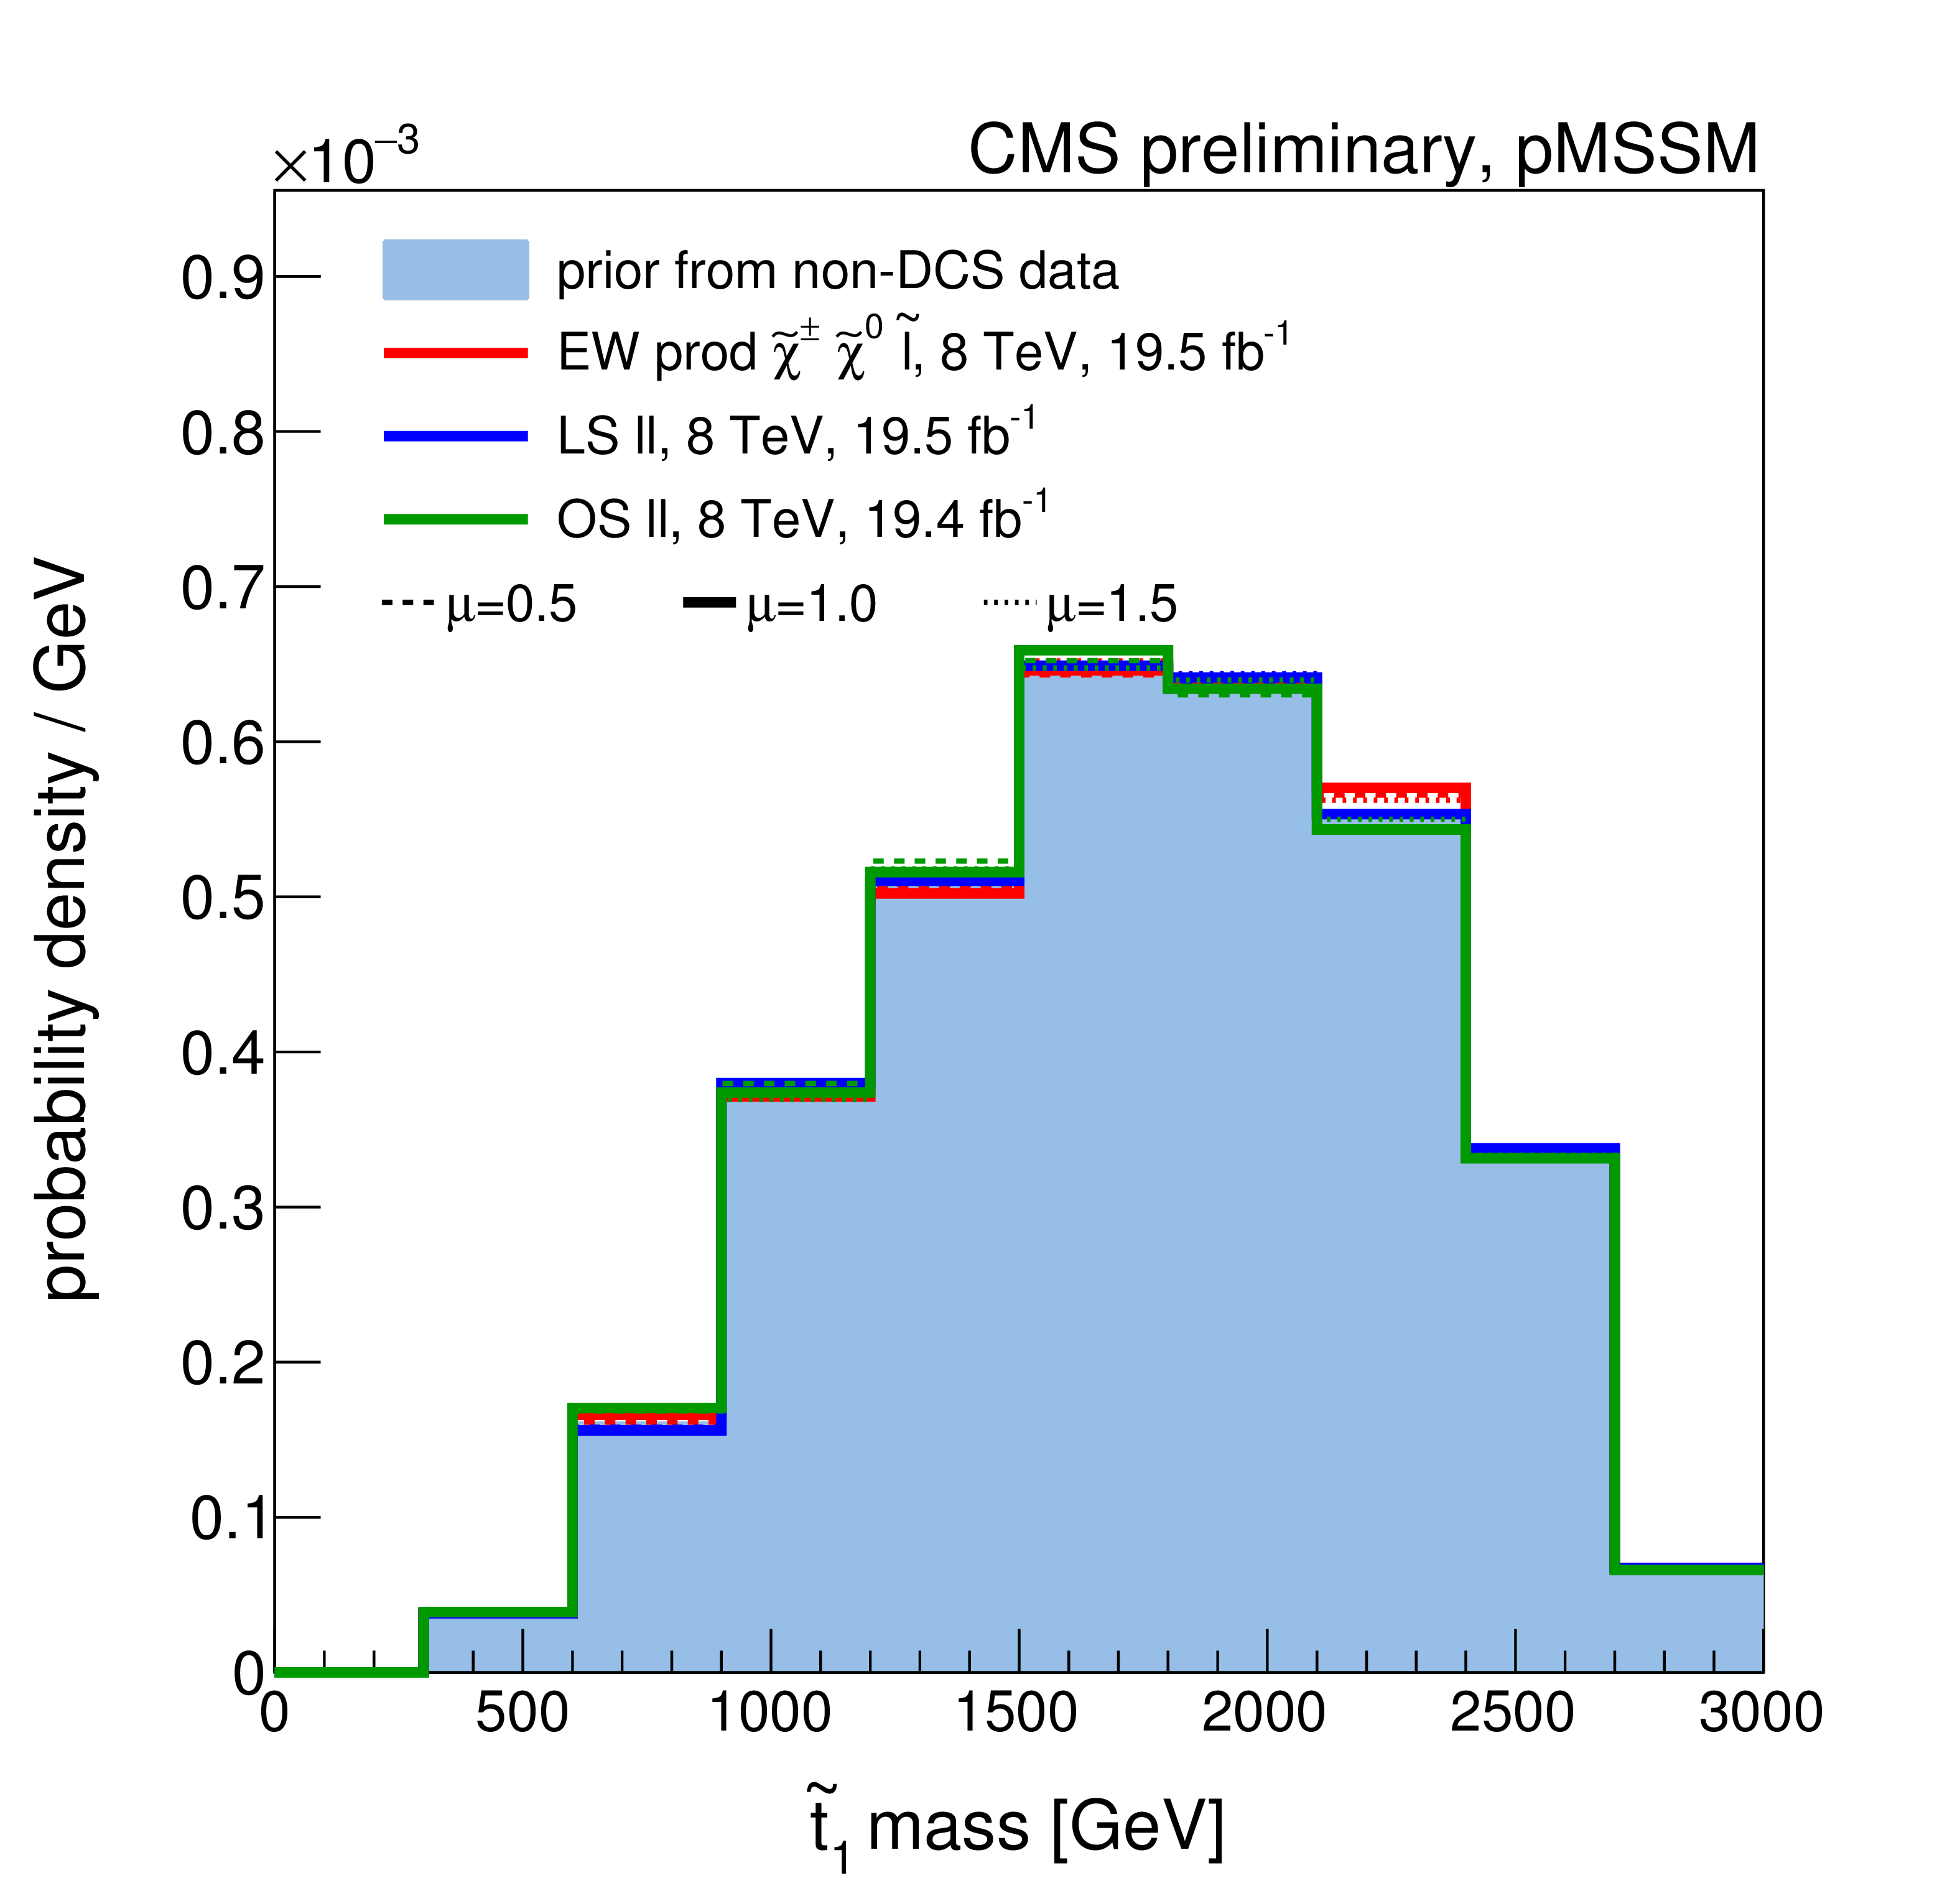
Figure 5-c:
A summary of the impact of CMS searches on our knowledge of the $\tilde{t}_1$ quark mass in the pMSSM parameter space. Plots (a)-(d) compare the non-DCS prior distribution of the $\tilde{t}_1$ quark mass to posterior distributions after data from various CMS searches, where (d) shows the combined effect of CMS searches and the Higgs boson results. Plot (e) shows survival probabilities as a function of the $\tilde{t}_1$ quark mass for various combinations of CMS data and data from Higgs boson measurements. Plot (f) shows the distribution of the $\tilde{t}_1$ quark mass versus the $Z$-significance calculated from the combination of all searches. See Fig.2 for a description of the shading. |
png ; pdf |
Figure 5-d:
A summary of the impact of CMS searches on our knowledge of the $\tilde{t}_1$ quark mass in the pMSSM parameter space. Plots (a)-(d) compare the non-DCS prior distribution of the $\tilde{t}_1$ quark mass to posterior distributions after data from various CMS searches, where (d) shows the combined effect of CMS searches and the Higgs boson results. Plot (e) shows survival probabilities as a function of the $\tilde{t}_1$ quark mass for various combinations of CMS data and data from Higgs boson measurements. Plot (f) shows the distribution of the $\tilde{t}_1$ quark mass versus the $Z$-significance calculated from the combination of all searches. See Fig.2 for a description of the shading. |
png ; pdf |
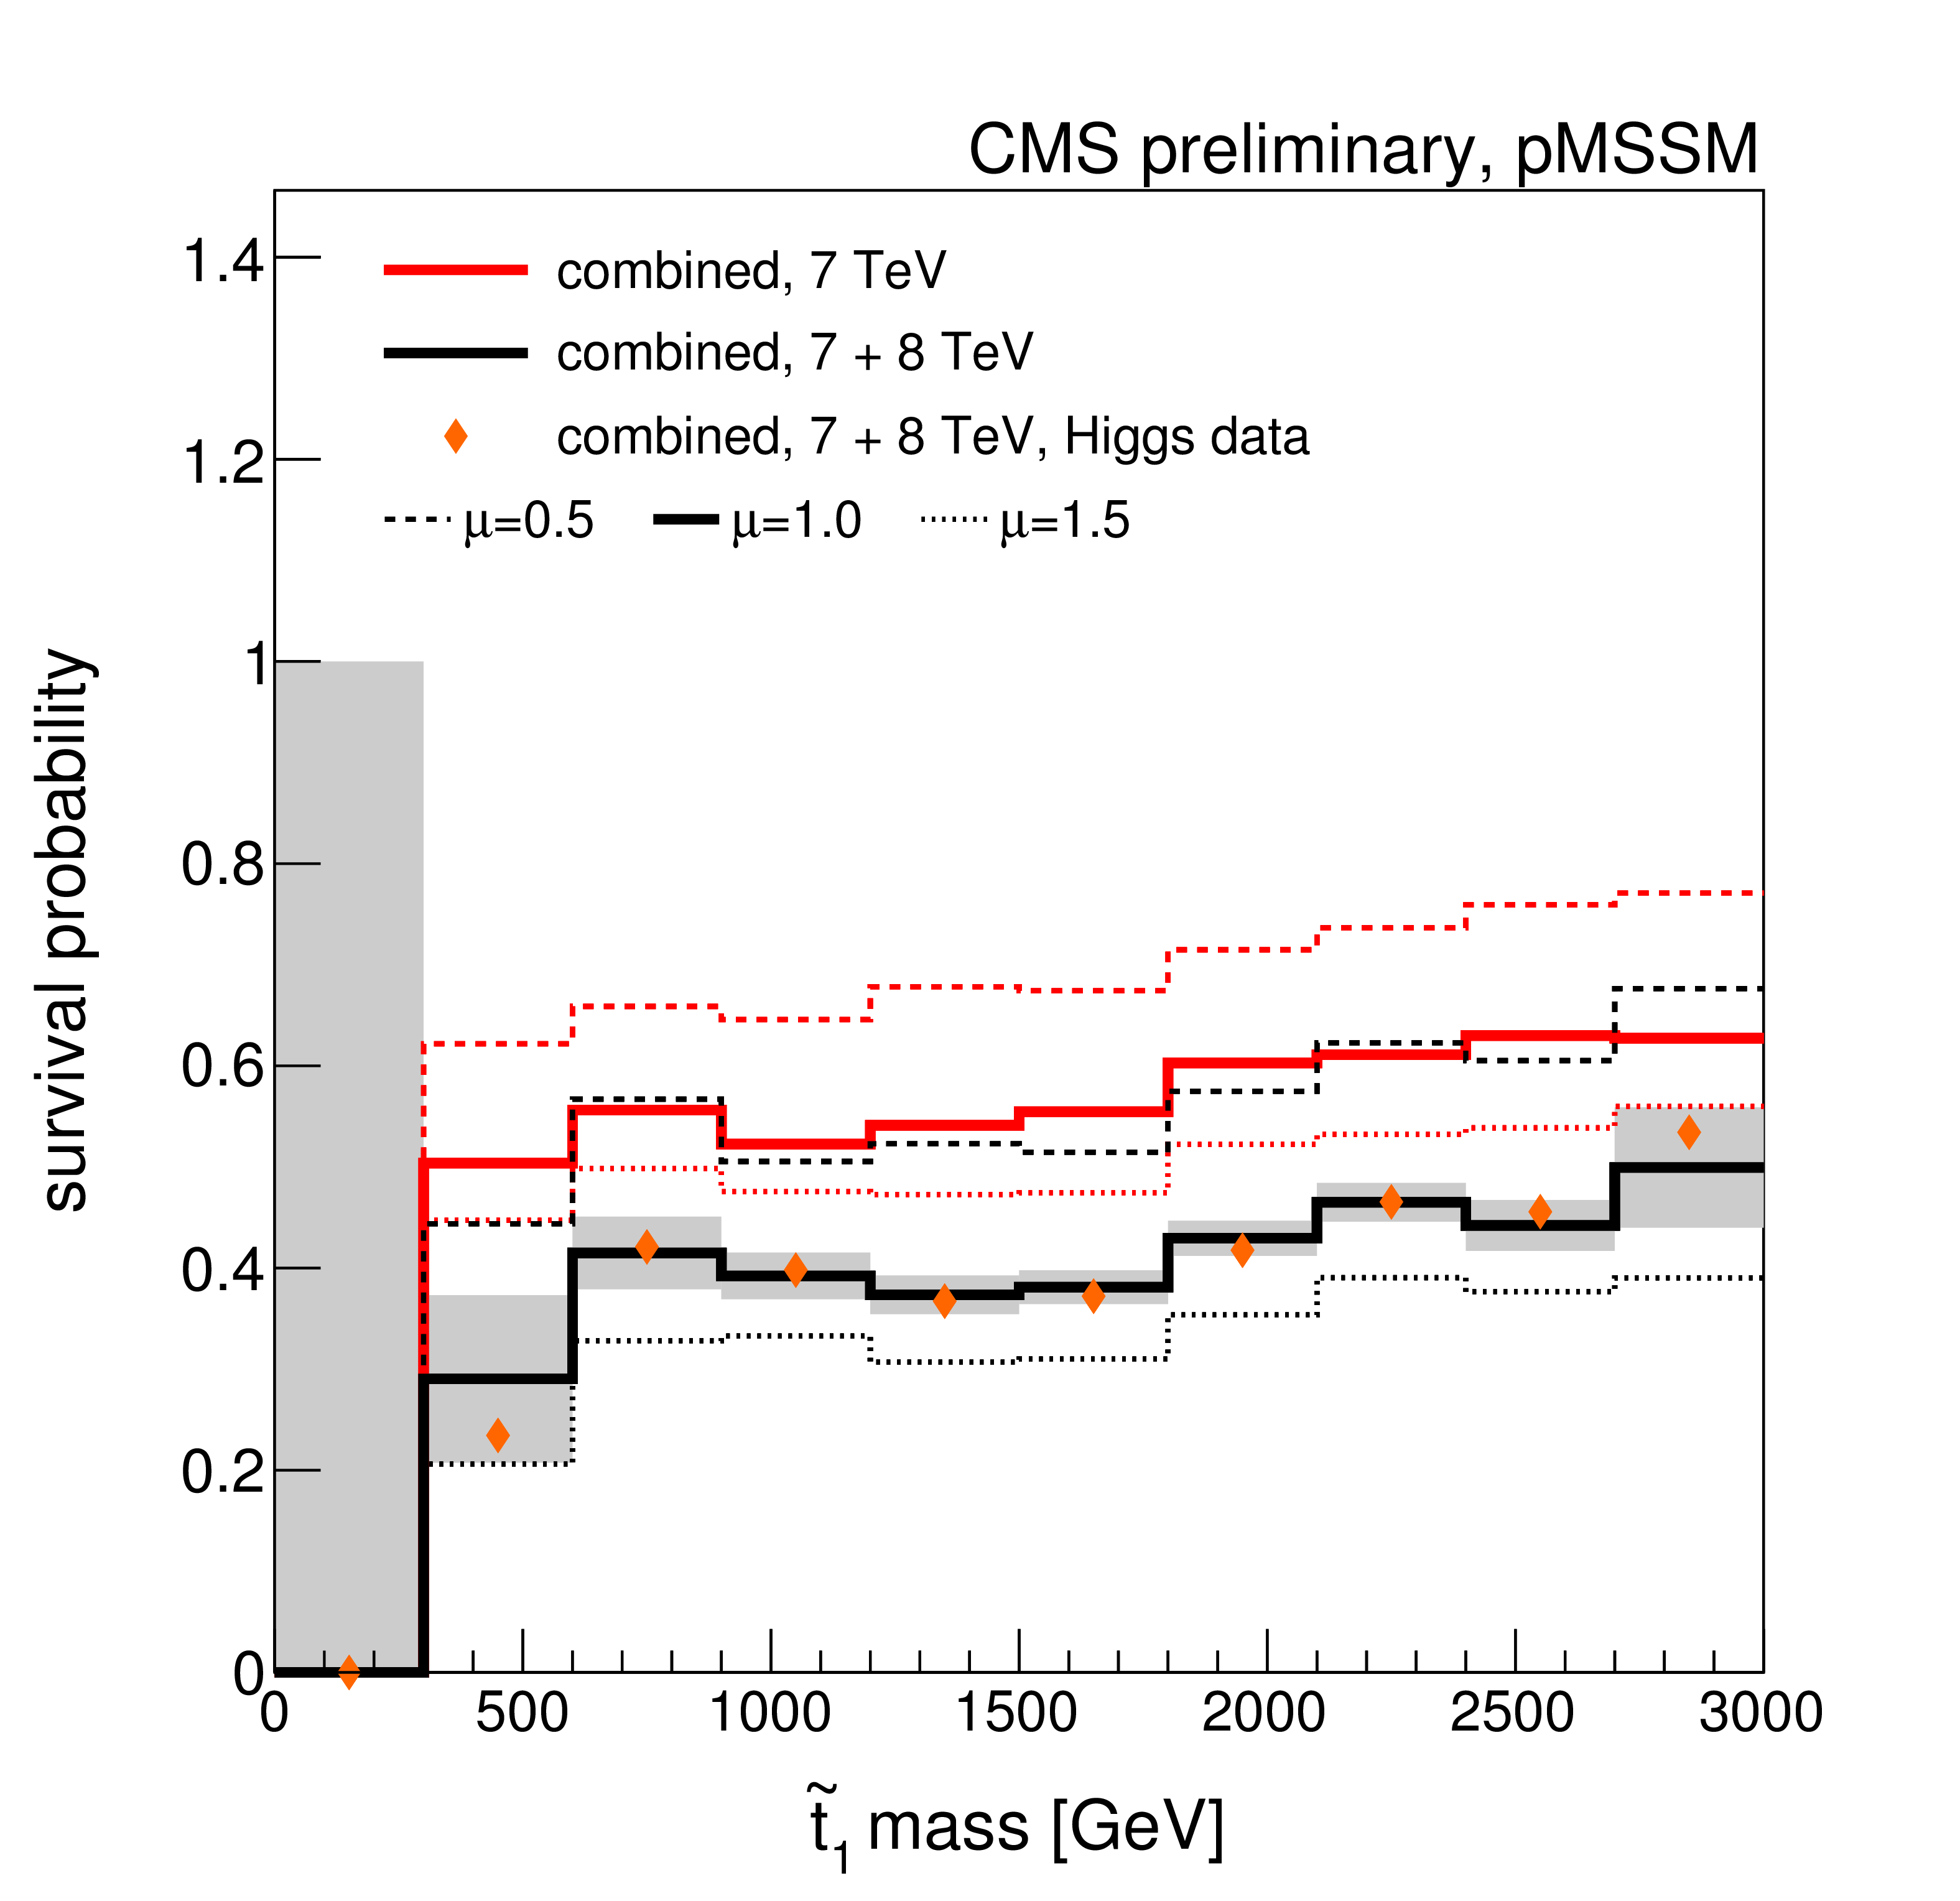
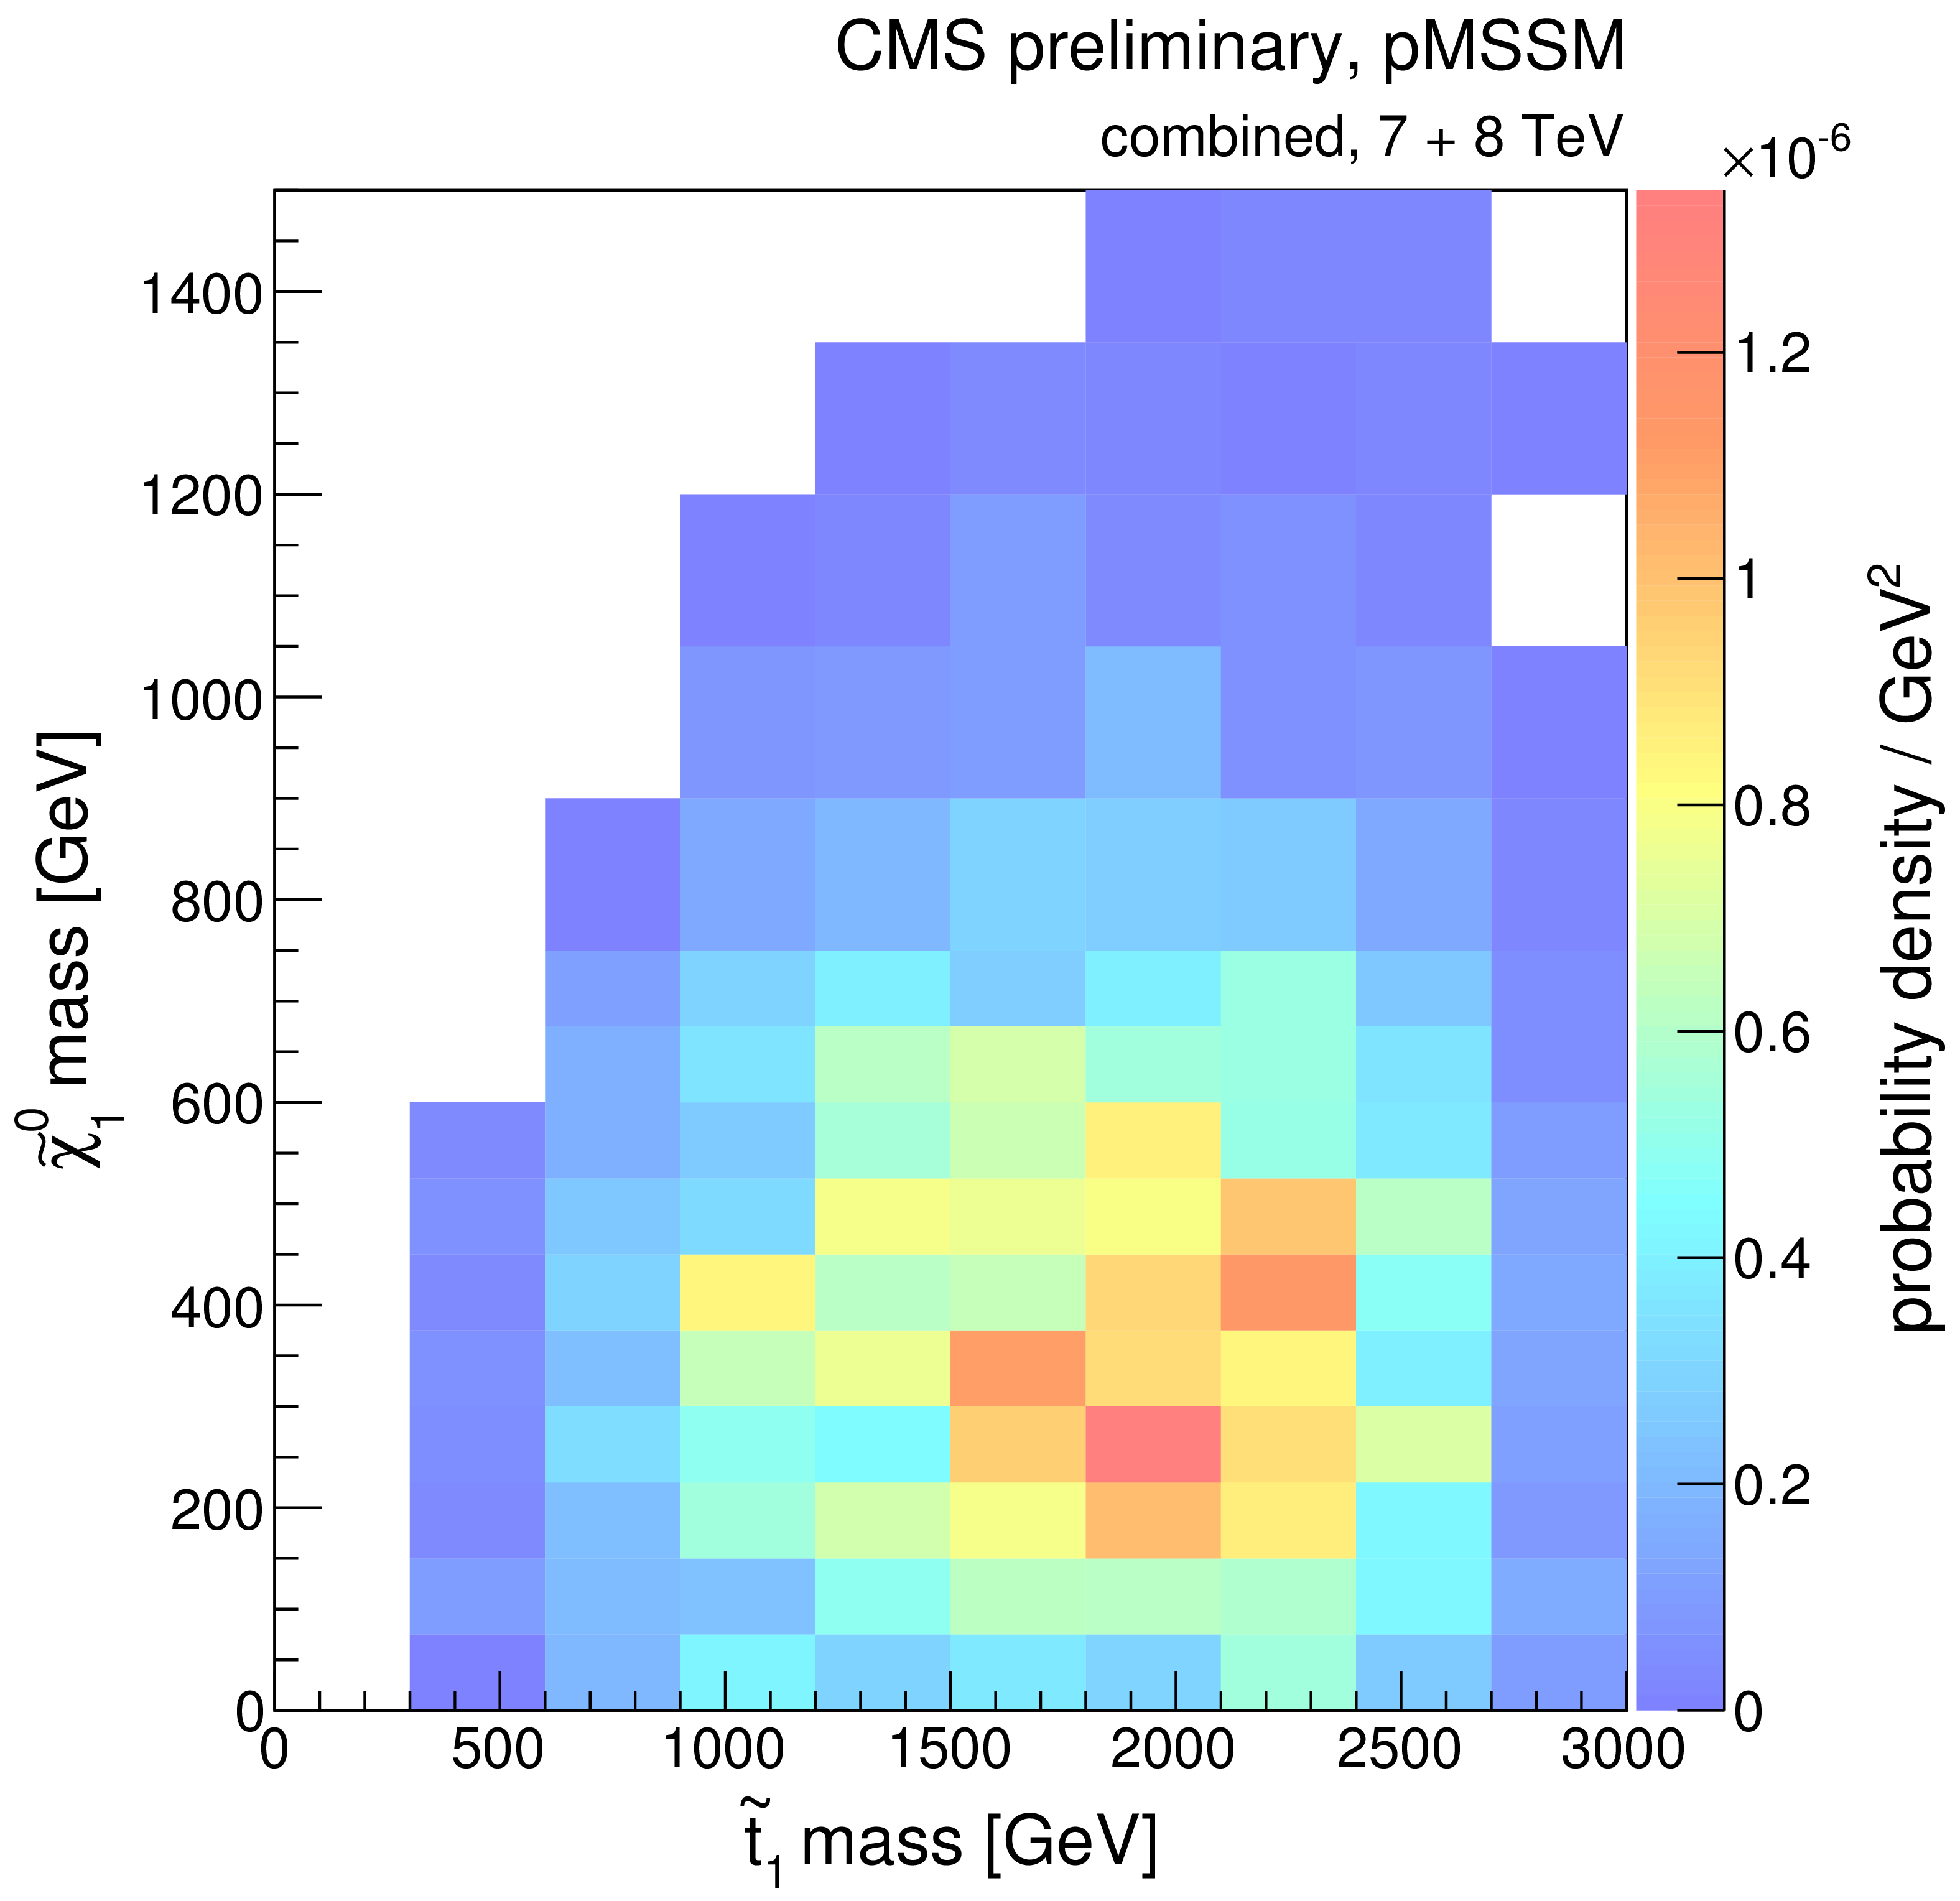
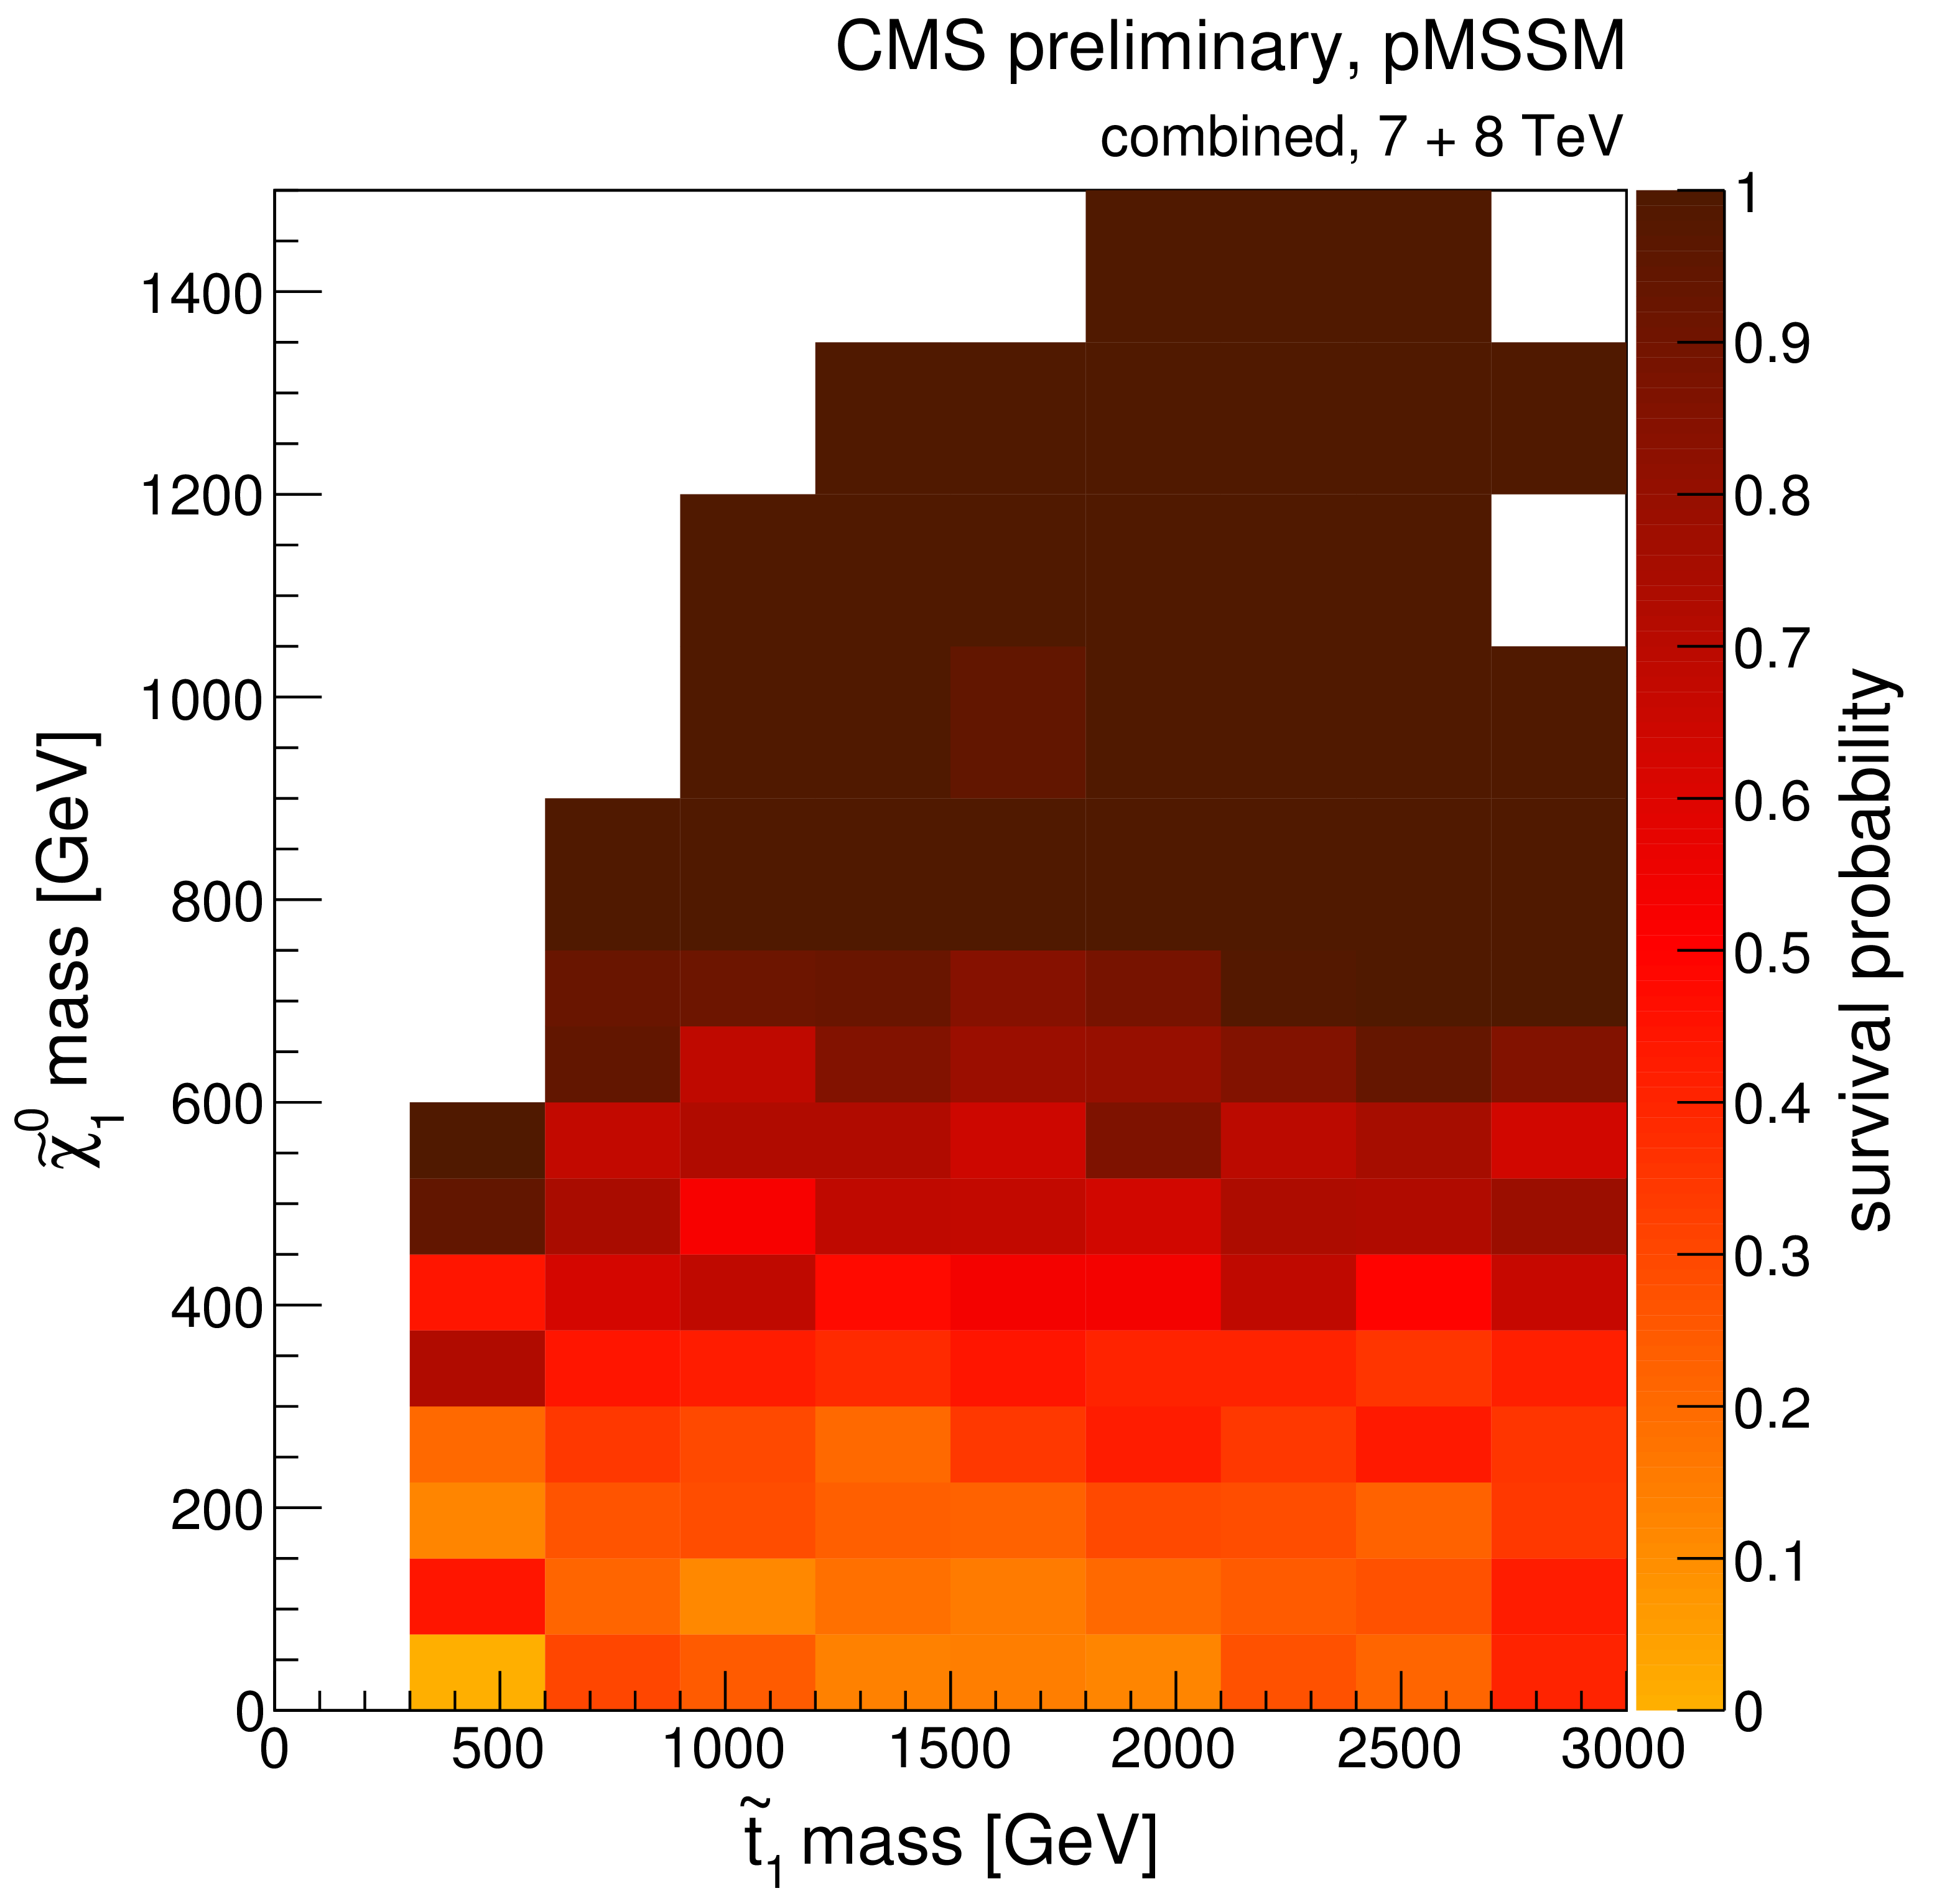
Figure 5-e:
A summary of the impact of CMS searches on our knowledge of the $\tilde{t}_1$ quark mass in the pMSSM parameter space. Plots (a)-(d) compare the non-DCS prior distribution of the $\tilde{t}_1$ quark mass to posterior distributions after data from various CMS searches, where (d) shows the combined effect of CMS searches and the Higgs boson results. Plot (e) shows survival probabilities as a function of the $\tilde{t}_1$ quark mass for various combinations of CMS data and data from Higgs boson measurements. Plot (f) shows the distribution of the $\tilde{t}_1$ quark mass versus the $Z$-significance calculated from the combination of all searches. See Fig.2 for a description of the shading. |
png ; pdf |
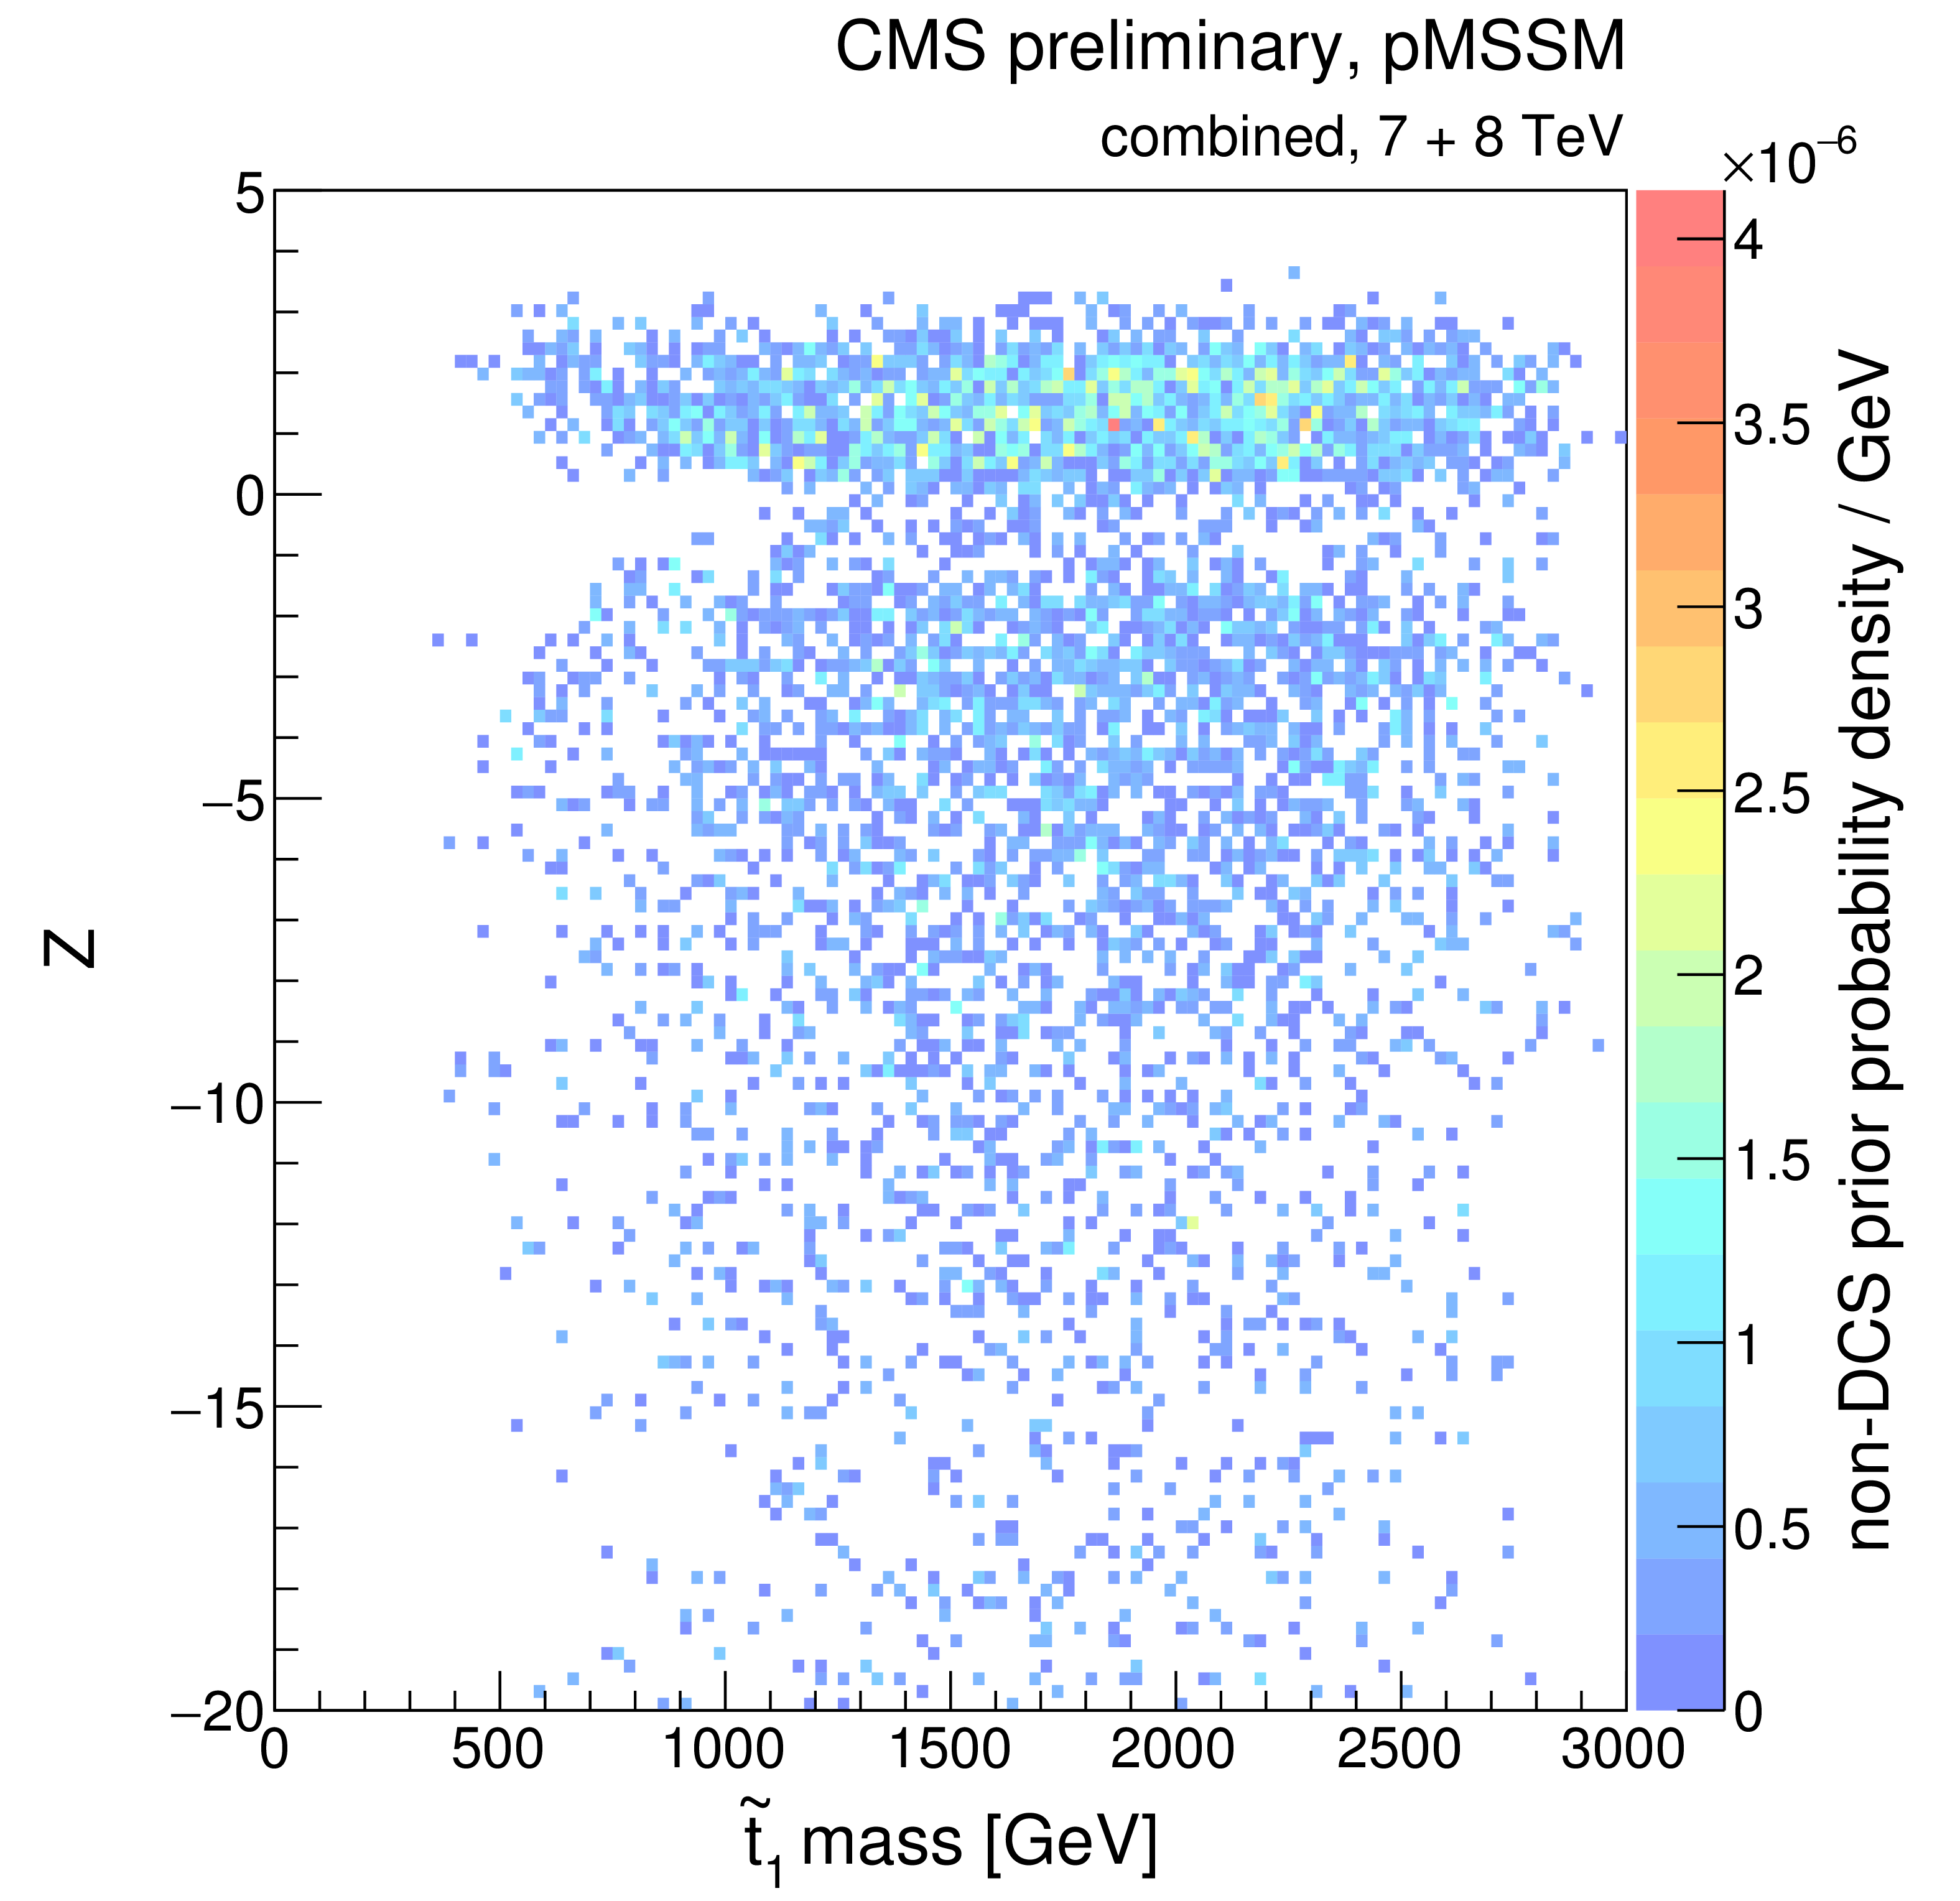
Figure 5-f:
A summary of the impact of CMS searches on our knowledge of the $\tilde{t}_1$ quark mass in the pMSSM parameter space. Plots (a)-(d) compare the non-DCS prior distribution of the $\tilde{t}_1$ quark mass to posterior distributions after data from various CMS searches, where (d) shows the combined effect of CMS searches and the Higgs boson results. Plot (e) shows survival probabilities as a function of the $\tilde{t}_1$ quark mass for various combinations of CMS data and data from Higgs boson measurements. Plot (f) shows the distribution of the $\tilde{t}_1$ quark mass versus the $Z$-significance calculated from the combination of all searches. See Fig.2 for a description of the shading. |
png ; pdf |
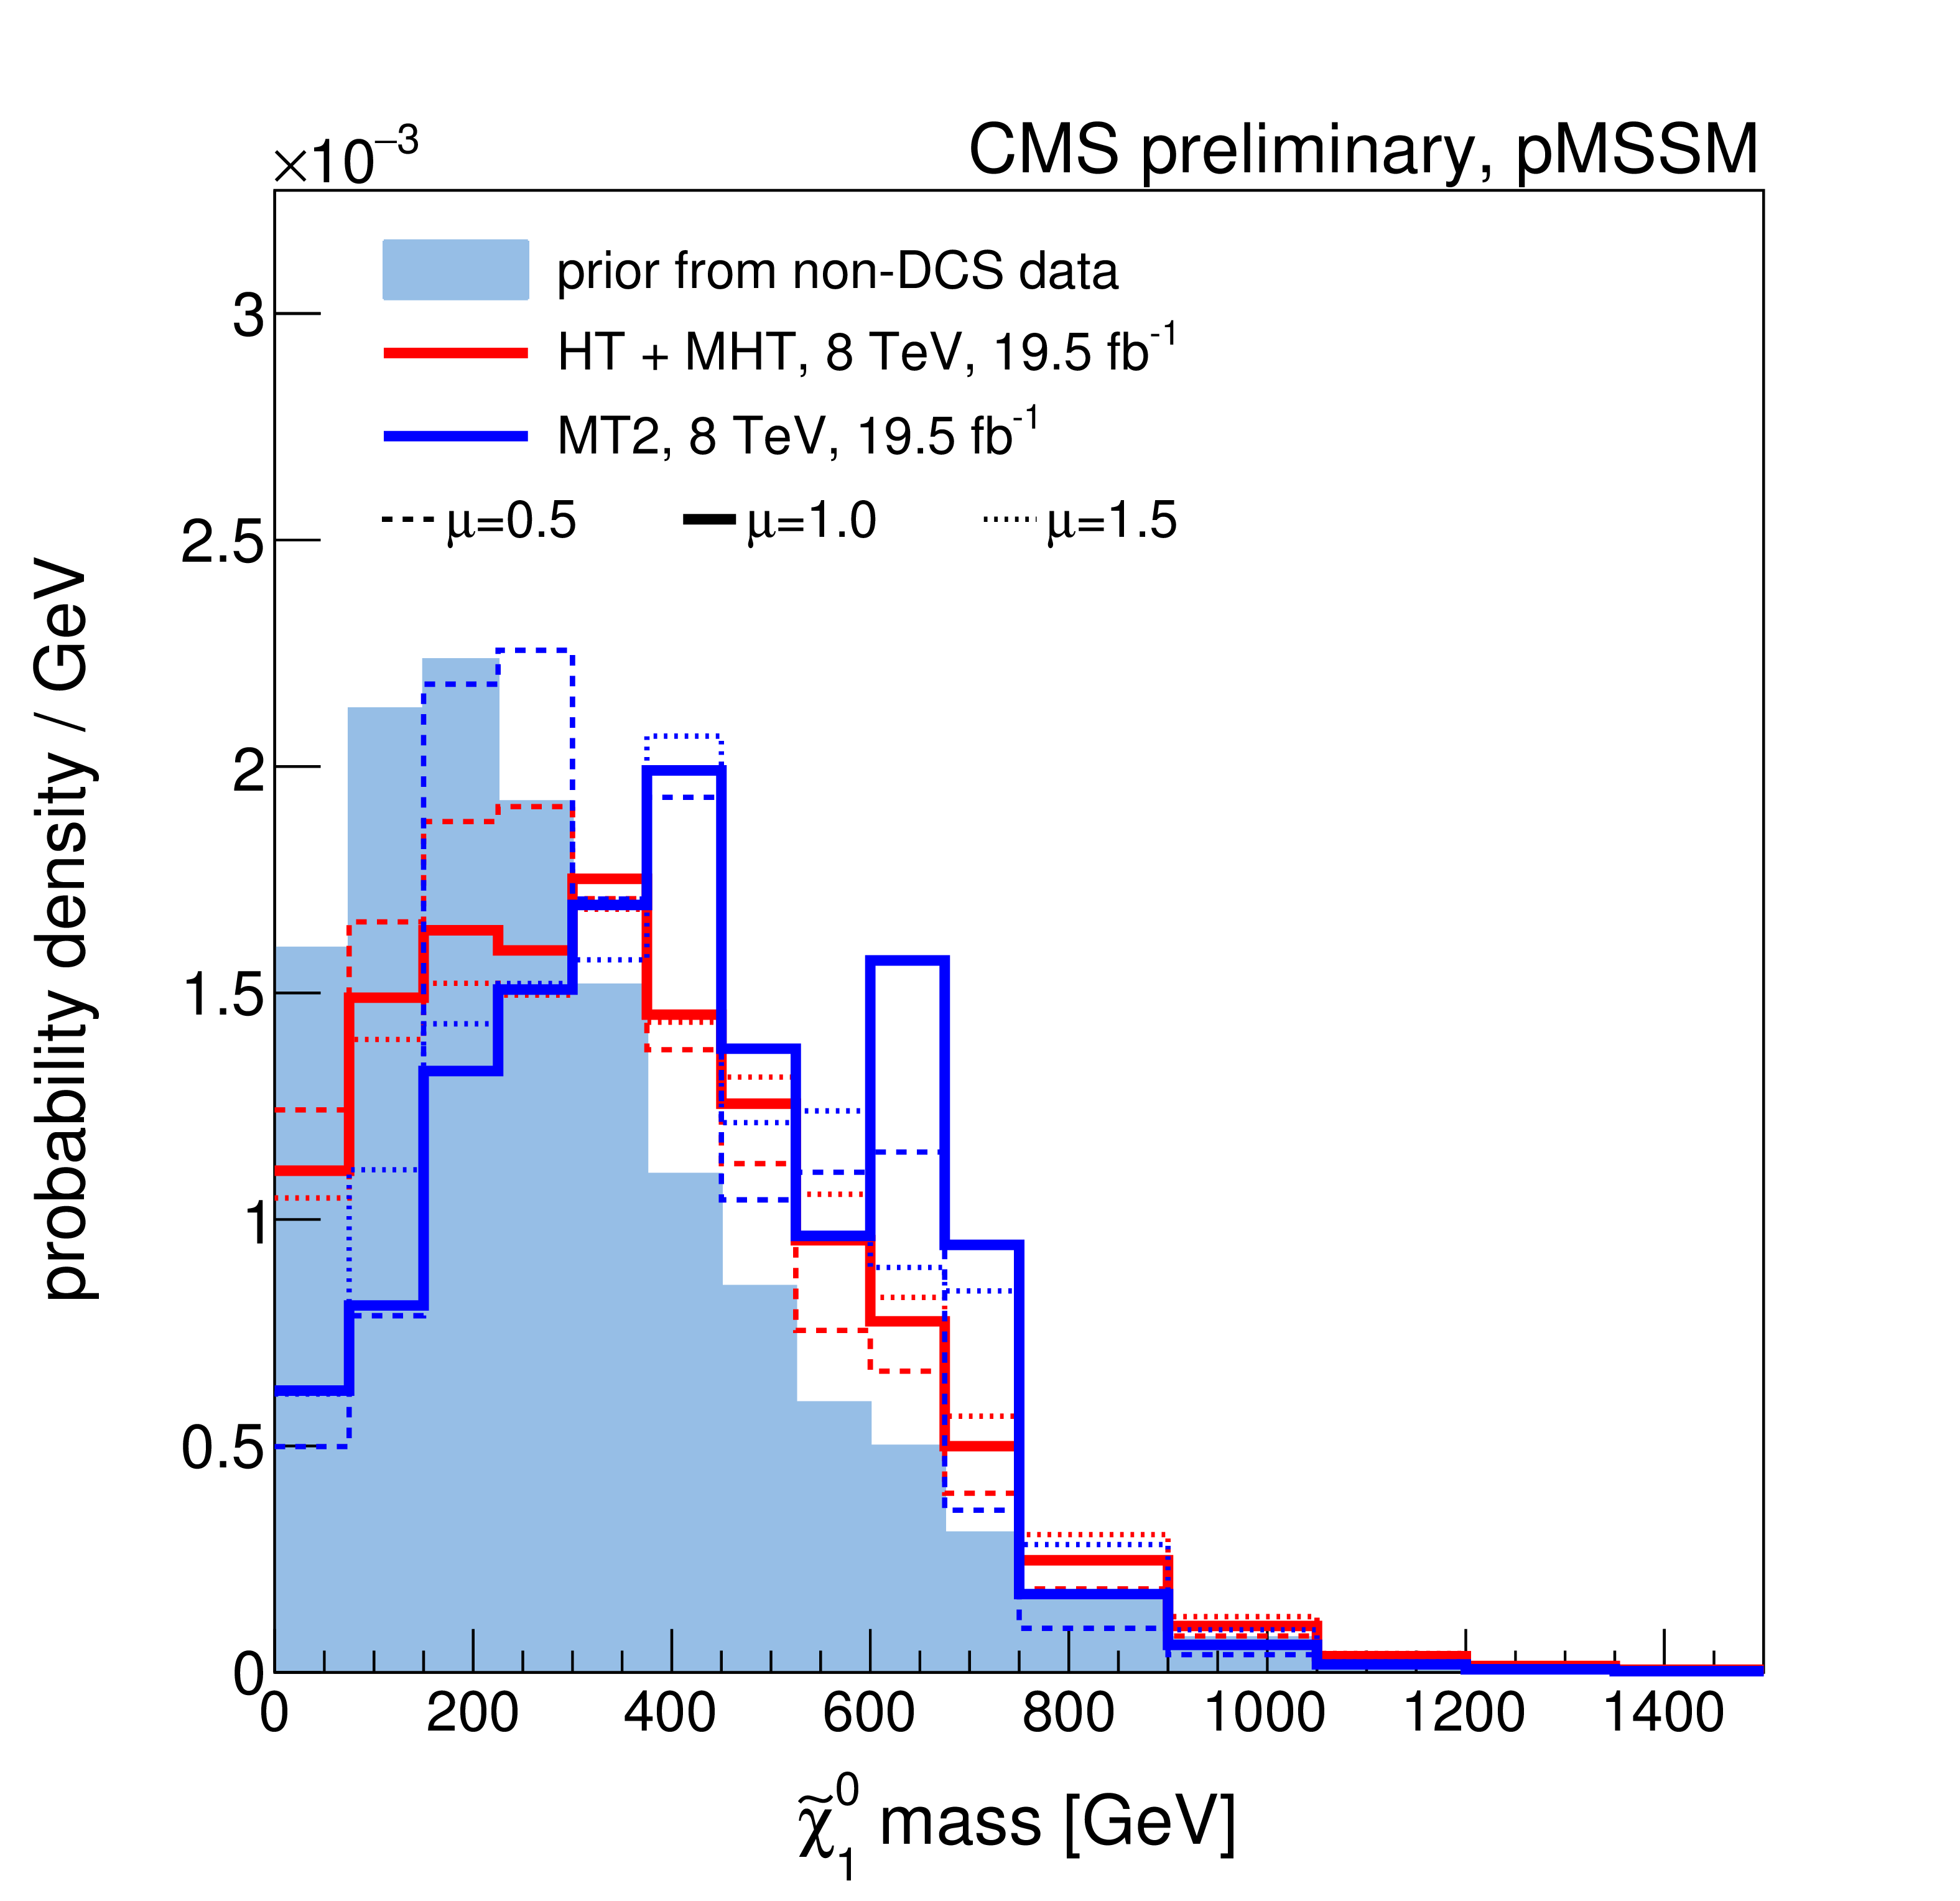
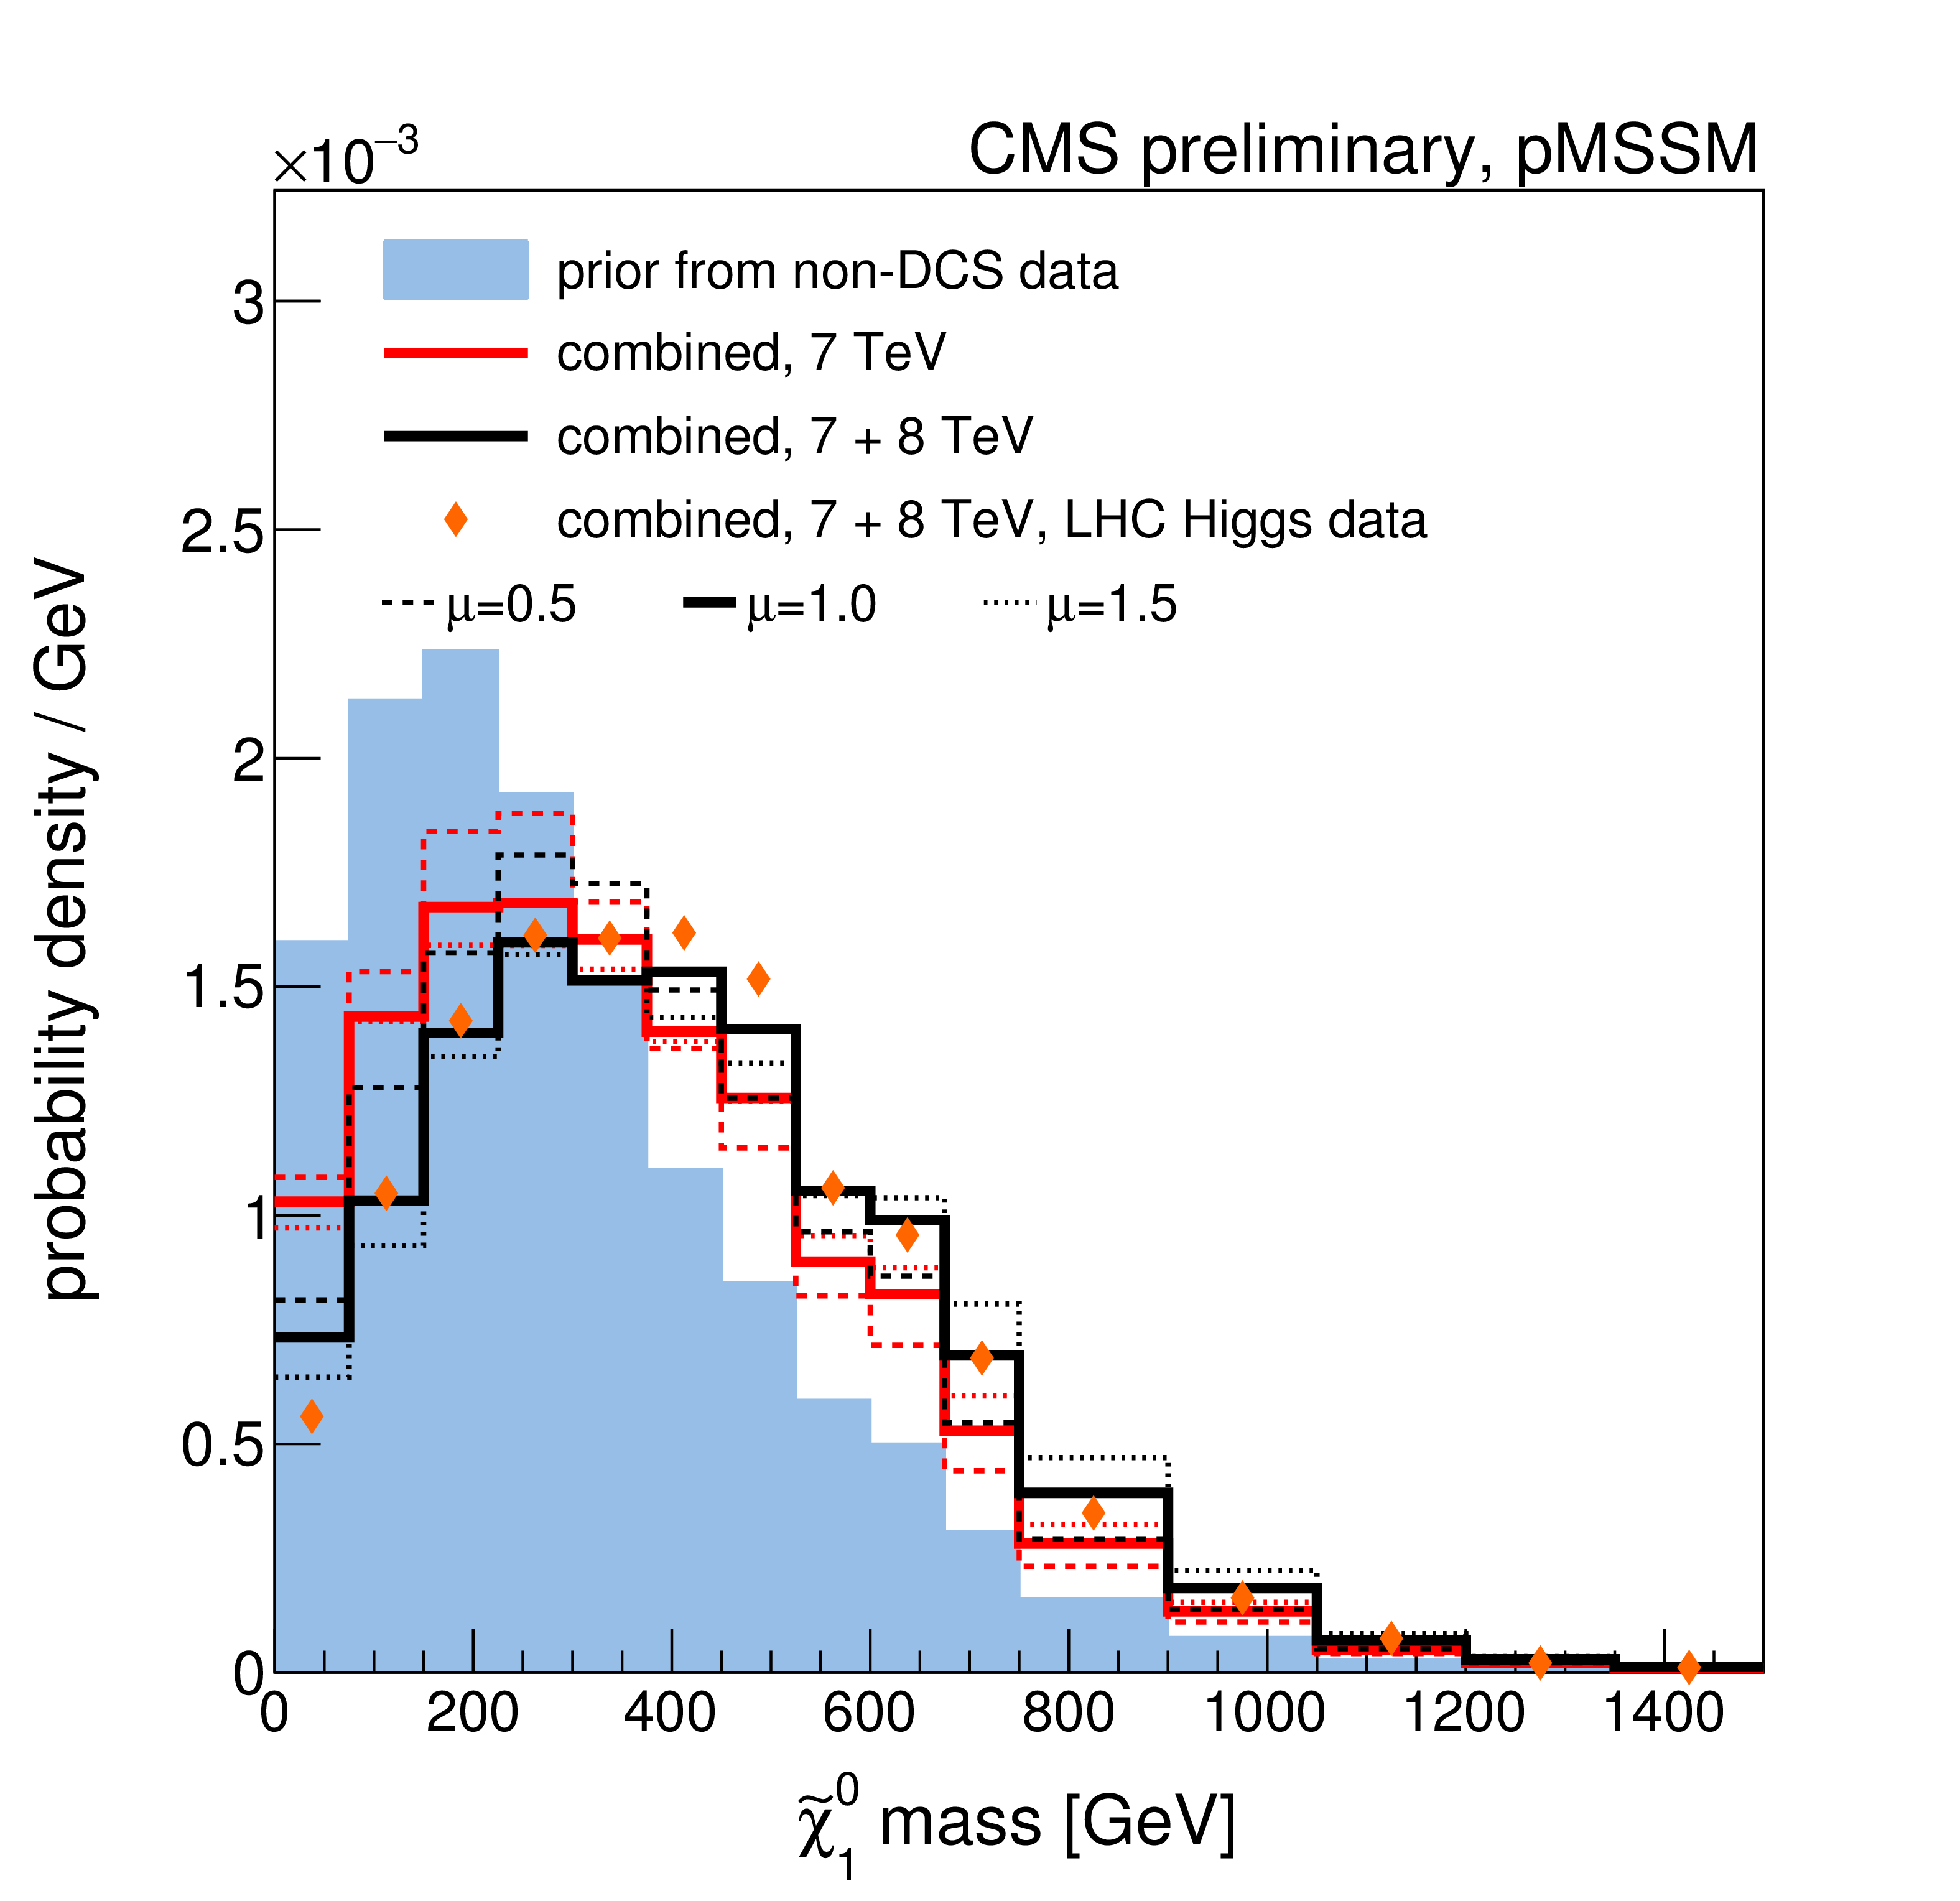
Figure 6-a:
A summary of the impact of CMS searches on our knowledge of the $\tilde{ \chi }_1^0$ mass in the pMSSM parameter space. Plots (a)-(d) compare the non-DCS prior distribution of the $\tilde{ \chi }_1^0$ mass to posterior distributions after data from various CMS searches, where (d) shows the combined effect of CMS searches and the Higgs boson results. Plot (e) shows survival probabilities as a function of the $\tilde{ \chi }_1^0$ mass for various combinations of CMS data and data from Higgs boson measurements. Plot (f) shows the distribution of the $\tilde{ \chi }_1^0$ mass versus the $Z$-significance calculated from the combination of all searches. See Fig.2 for a description of the shading. |

png ; pdf |
Figure 6-b:
A summary of the impact of CMS searches on our knowledge of the $\tilde{ \chi }_1^0$ mass in the pMSSM parameter space. Plots (a)-(d) compare the non-DCS prior distribution of the $\tilde{ \chi }_1^0$ mass to posterior distributions after data from various CMS searches, where (d) shows the combined effect of CMS searches and the Higgs boson results. Plot (e) shows survival probabilities as a function of the $\tilde{ \chi }_1^0$ mass for various combinations of CMS data and data from Higgs boson measurements. Plot (f) shows the distribution of the $\tilde{ \chi }_1^0$ mass versus the $Z$-significance calculated from the combination of all searches. See Fig.2 for a description of the shading. |

png ; pdf |
Figure 6-c:
A summary of the impact of CMS searches on our knowledge of the $\tilde{ \chi }_1^0$ mass in the pMSSM parameter space. Plots (a)-(d) compare the non-DCS prior distribution of the $\tilde{ \chi }_1^0$ mass to posterior distributions after data from various CMS searches, where (d) shows the combined effect of CMS searches and the Higgs boson results. Plot (e) shows survival probabilities as a function of the $\tilde{ \chi }_1^0$ mass for various combinations of CMS data and data from Higgs boson measurements. Plot (f) shows the distribution of the $\tilde{ \chi }_1^0$ mass versus the $Z$-significance calculated from the combination of all searches. See Fig.2 for a description of the shading. |
png ; pdf |
Figure 6-d:
A summary of the impact of CMS searches on our knowledge of the $\tilde{ \chi }_1^0$ mass in the pMSSM parameter space. Plots (a)-(d) compare the non-DCS prior distribution of the $\tilde{ \chi }_1^0$ mass to posterior distributions after data from various CMS searches, where (d) shows the combined effect of CMS searches and the Higgs boson results. Plot (e) shows survival probabilities as a function of the $\tilde{ \chi }_1^0$ mass for various combinations of CMS data and data from Higgs boson measurements. Plot (f) shows the distribution of the $\tilde{ \chi }_1^0$ mass versus the $Z$-significance calculated from the combination of all searches. See Fig.2 for a description of the shading. |
png ; pdf |
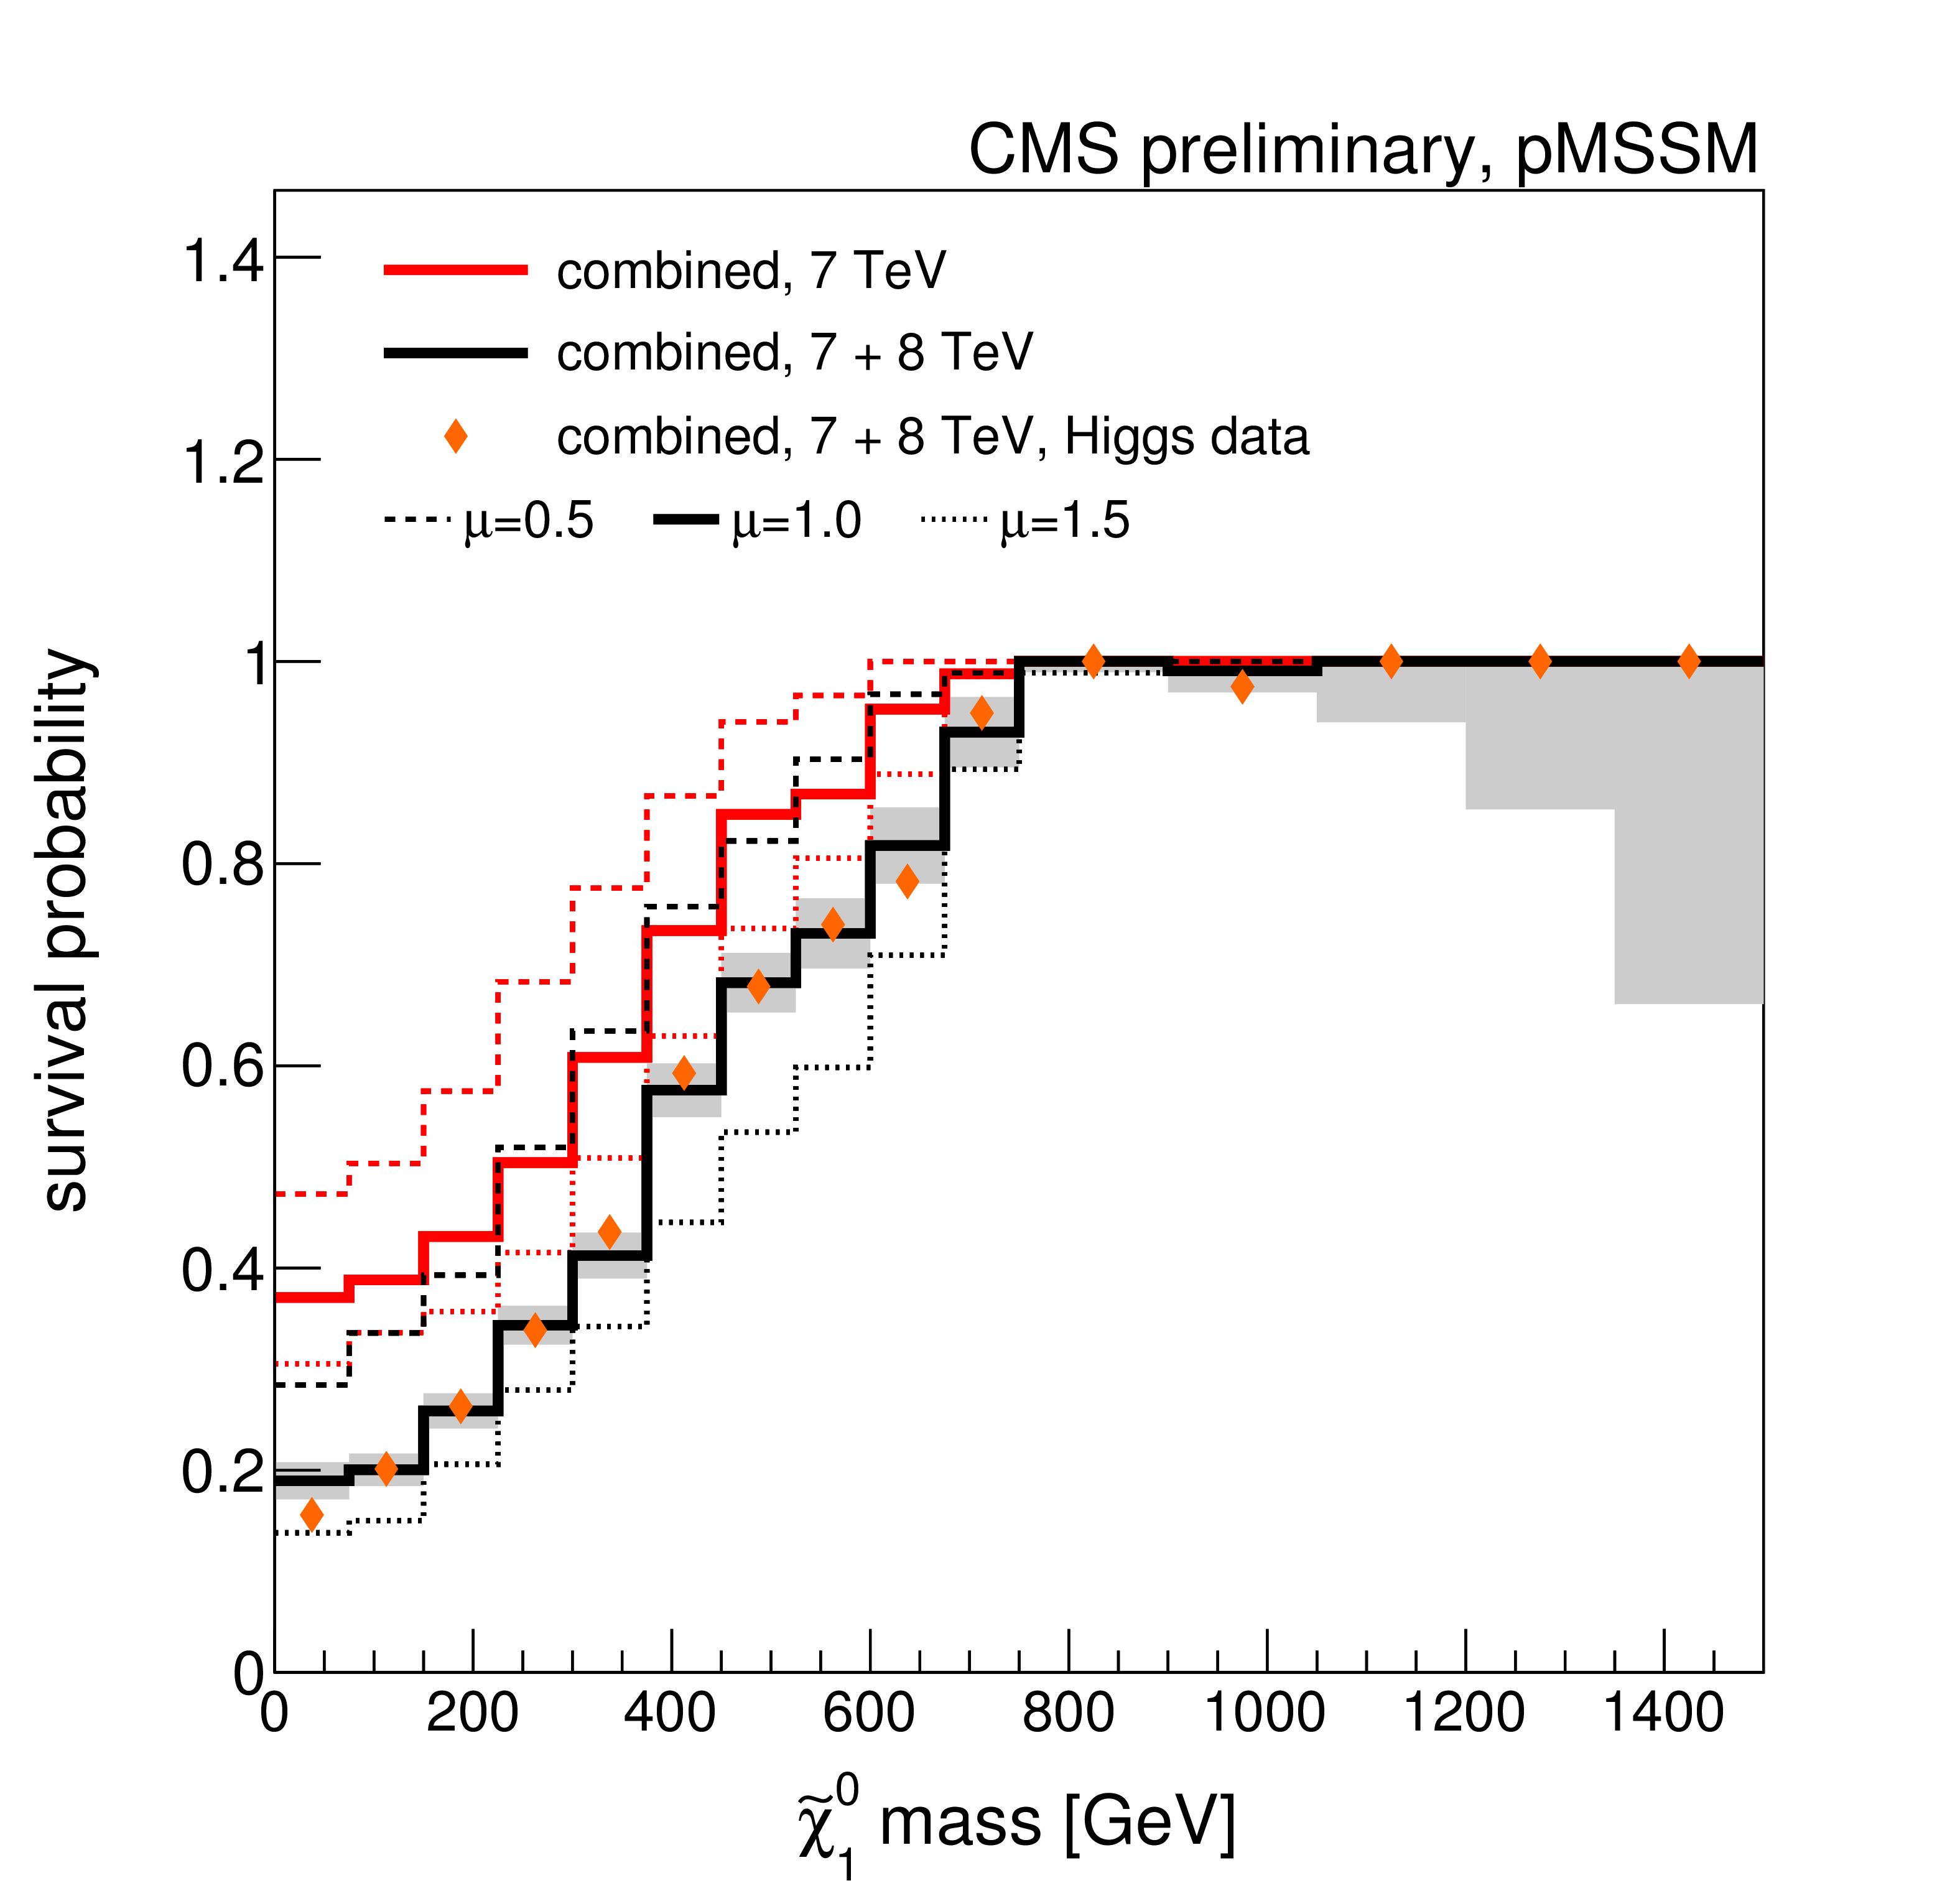
Figure 6-e:
A summary of the impact of CMS searches on our knowledge of the $\tilde{ \chi }_1^0$ mass in the pMSSM parameter space. Plots (a)-(d) compare the non-DCS prior distribution of the $\tilde{ \chi }_1^0$ mass to posterior distributions after data from various CMS searches, where (d) shows the combined effect of CMS searches and the Higgs boson results. Plot (e) shows survival probabilities as a function of the $\tilde{ \chi }_1^0$ mass for various combinations of CMS data and data from Higgs boson measurements. Plot (f) shows the distribution of the $\tilde{ \chi }_1^0$ mass versus the $Z$-significance calculated from the combination of all searches. See Fig.2 for a description of the shading. |
png ; pdf |
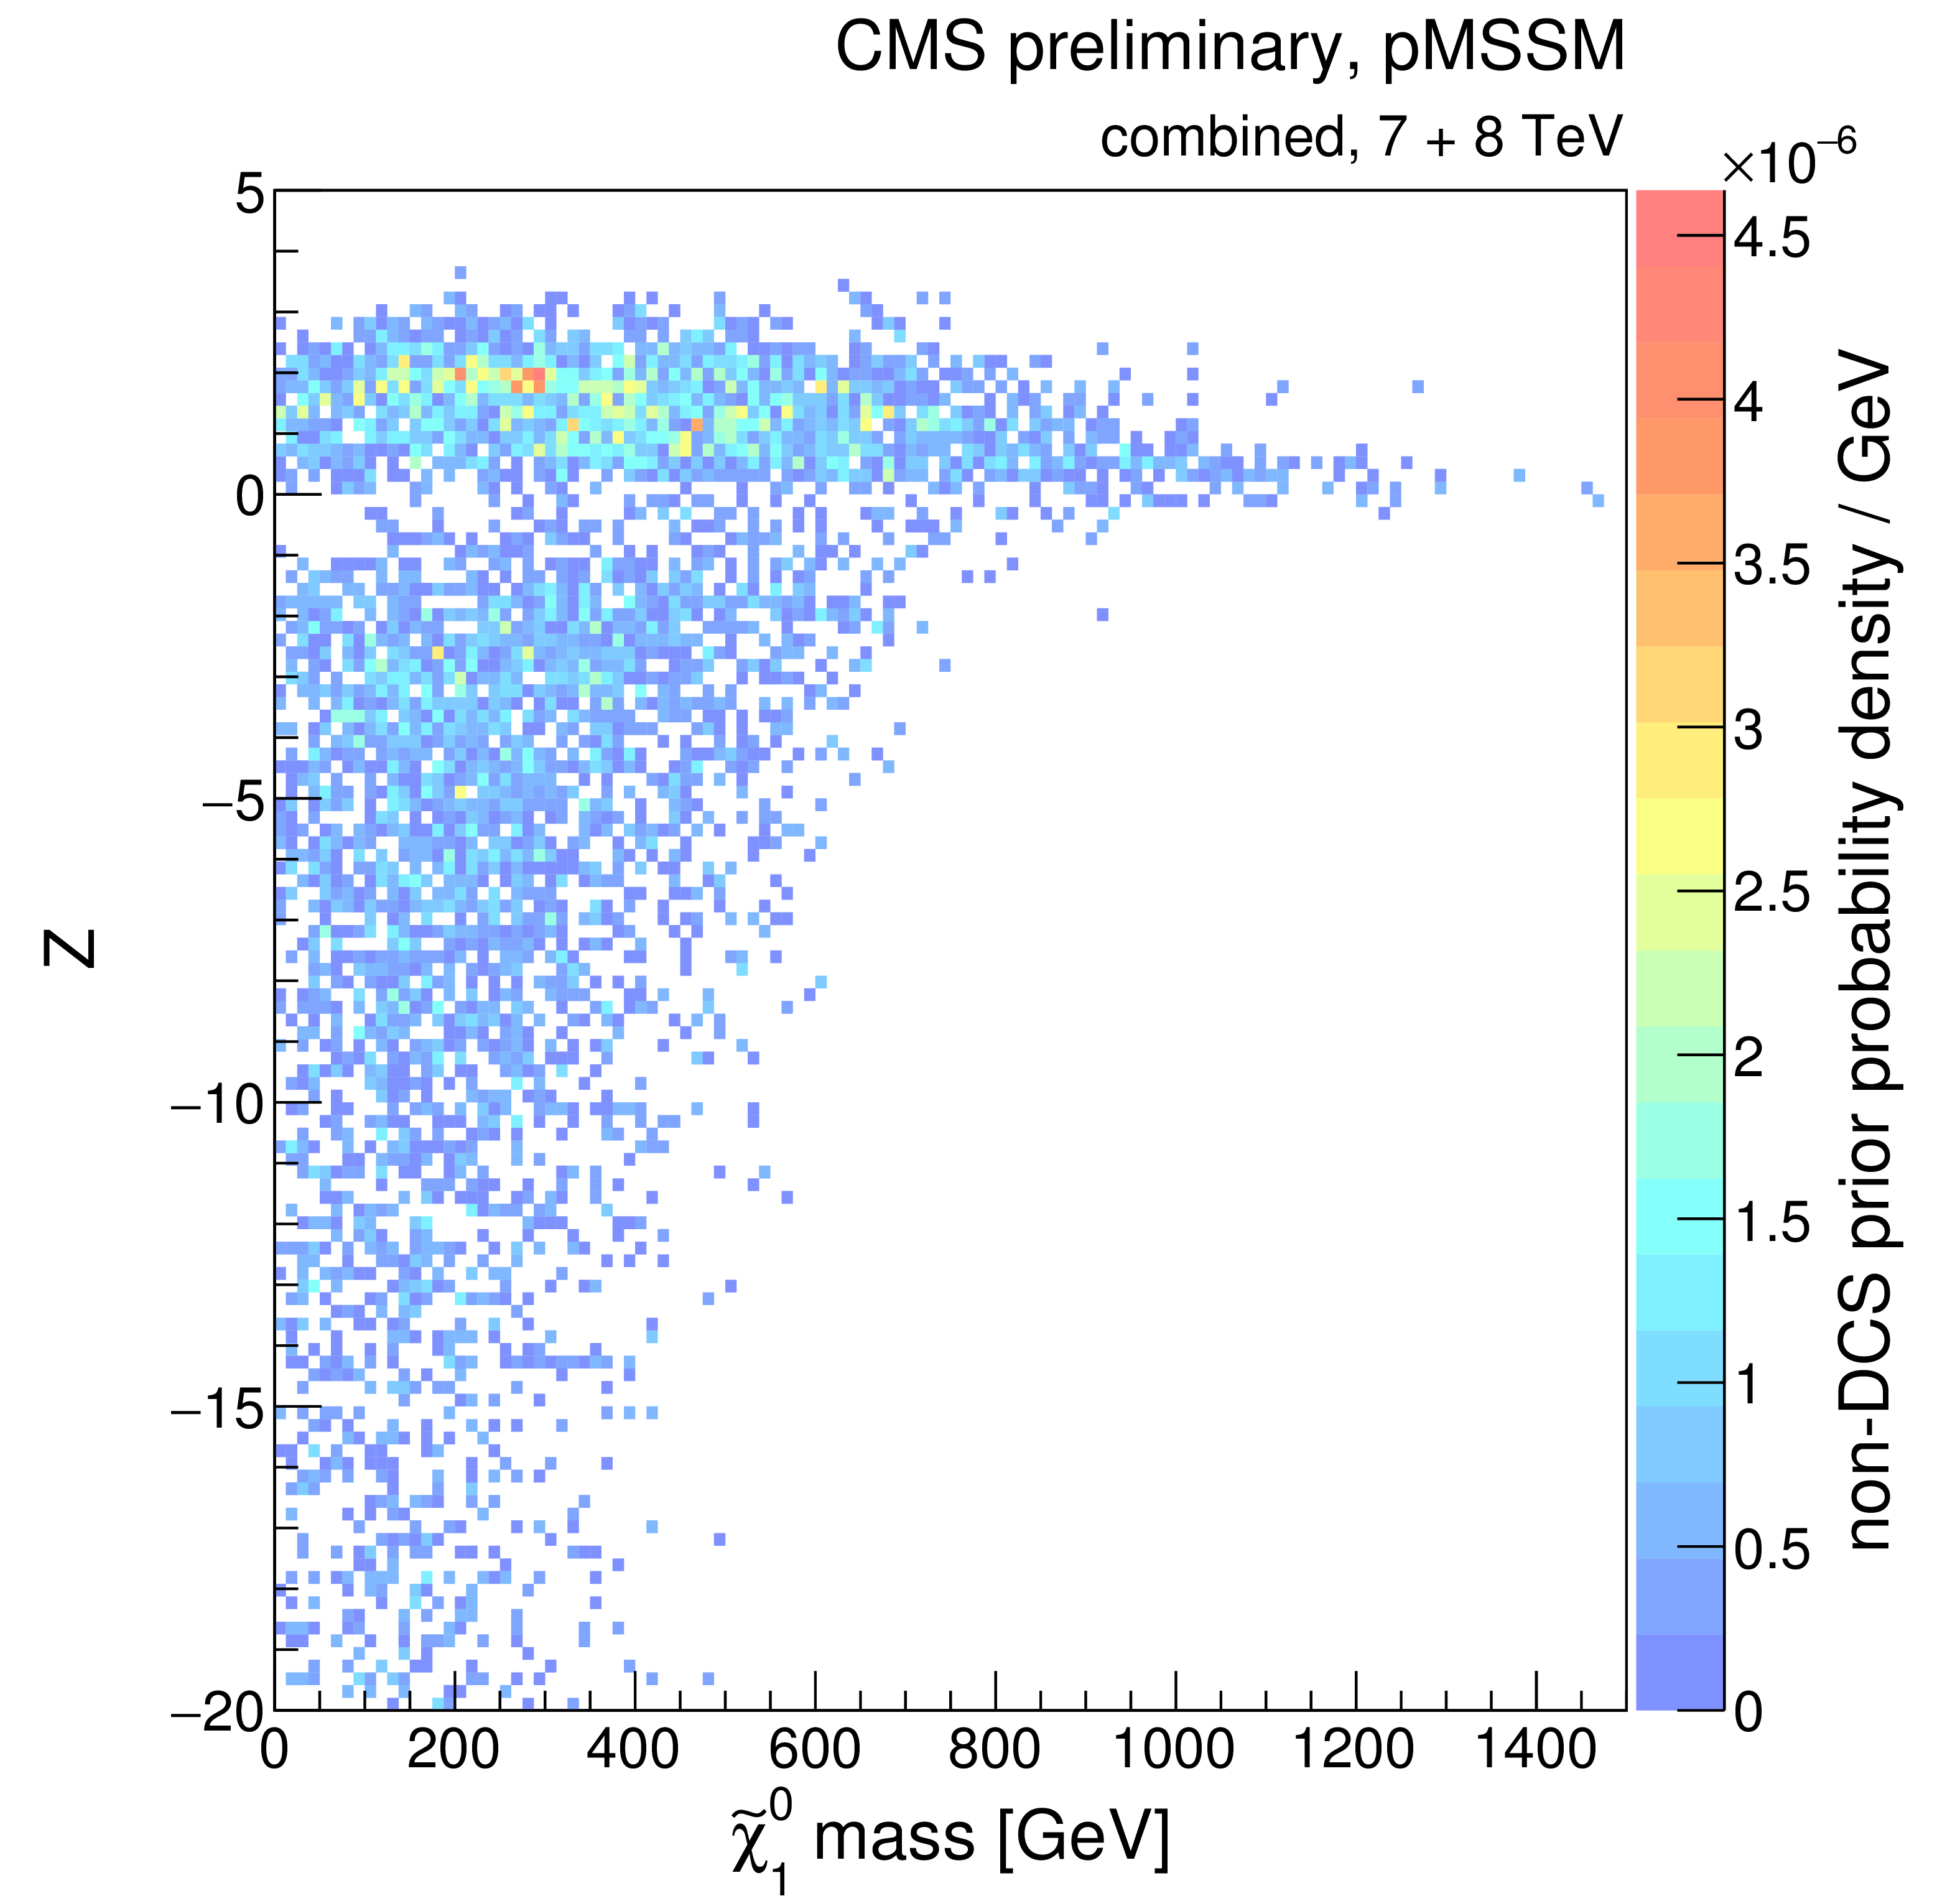
Figure 6-f:
A summary of the impact of CMS searches on our knowledge of the $\tilde{ \chi }_1^0$ mass in the pMSSM parameter space. Plots (a)-(d) compare the non-DCS prior distribution of the $\tilde{ \chi }_1^0$ mass to posterior distributions after data from various CMS searches, where (d) shows the combined effect of CMS searches and the Higgs boson results. Plot (e) shows survival probabilities as a function of the $\tilde{ \chi }_1^0$ mass for various combinations of CMS data and data from Higgs boson measurements. Plot (f) shows the distribution of the $\tilde{ \chi }_1^0$ mass versus the $Z$-significance calculated from the combination of all searches. See Fig.2 for a description of the shading. |
png ; pdf |
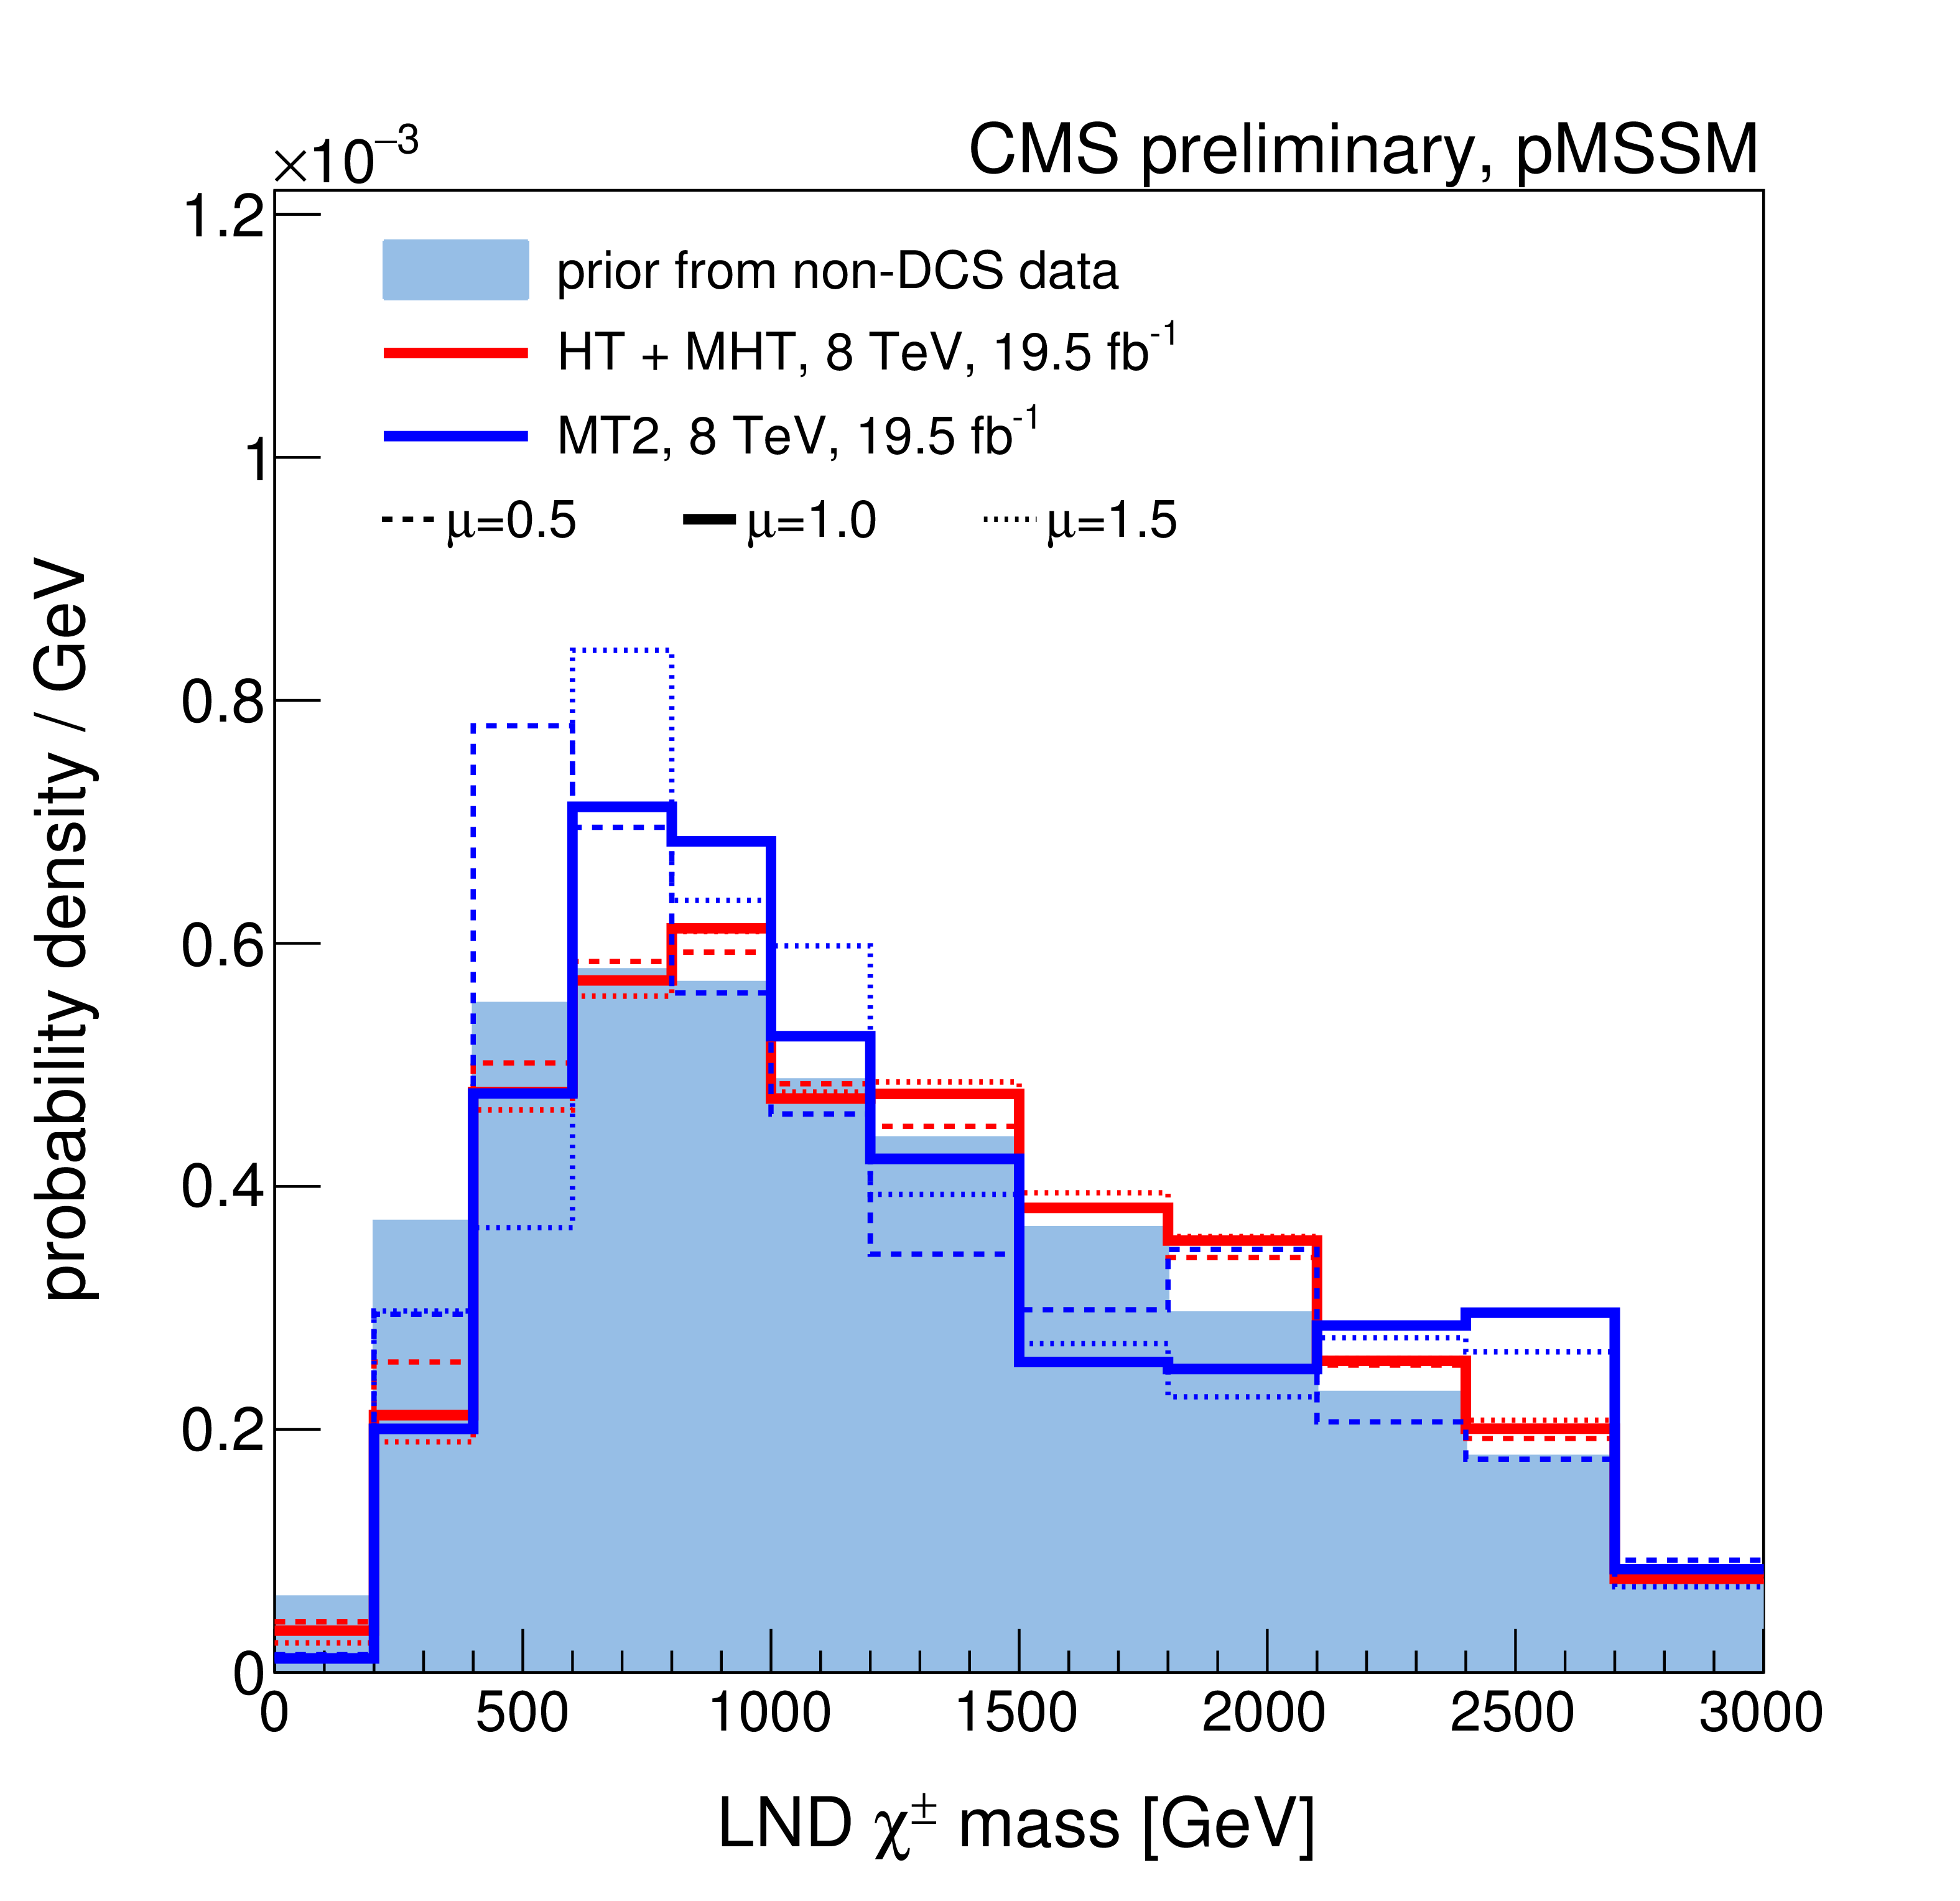
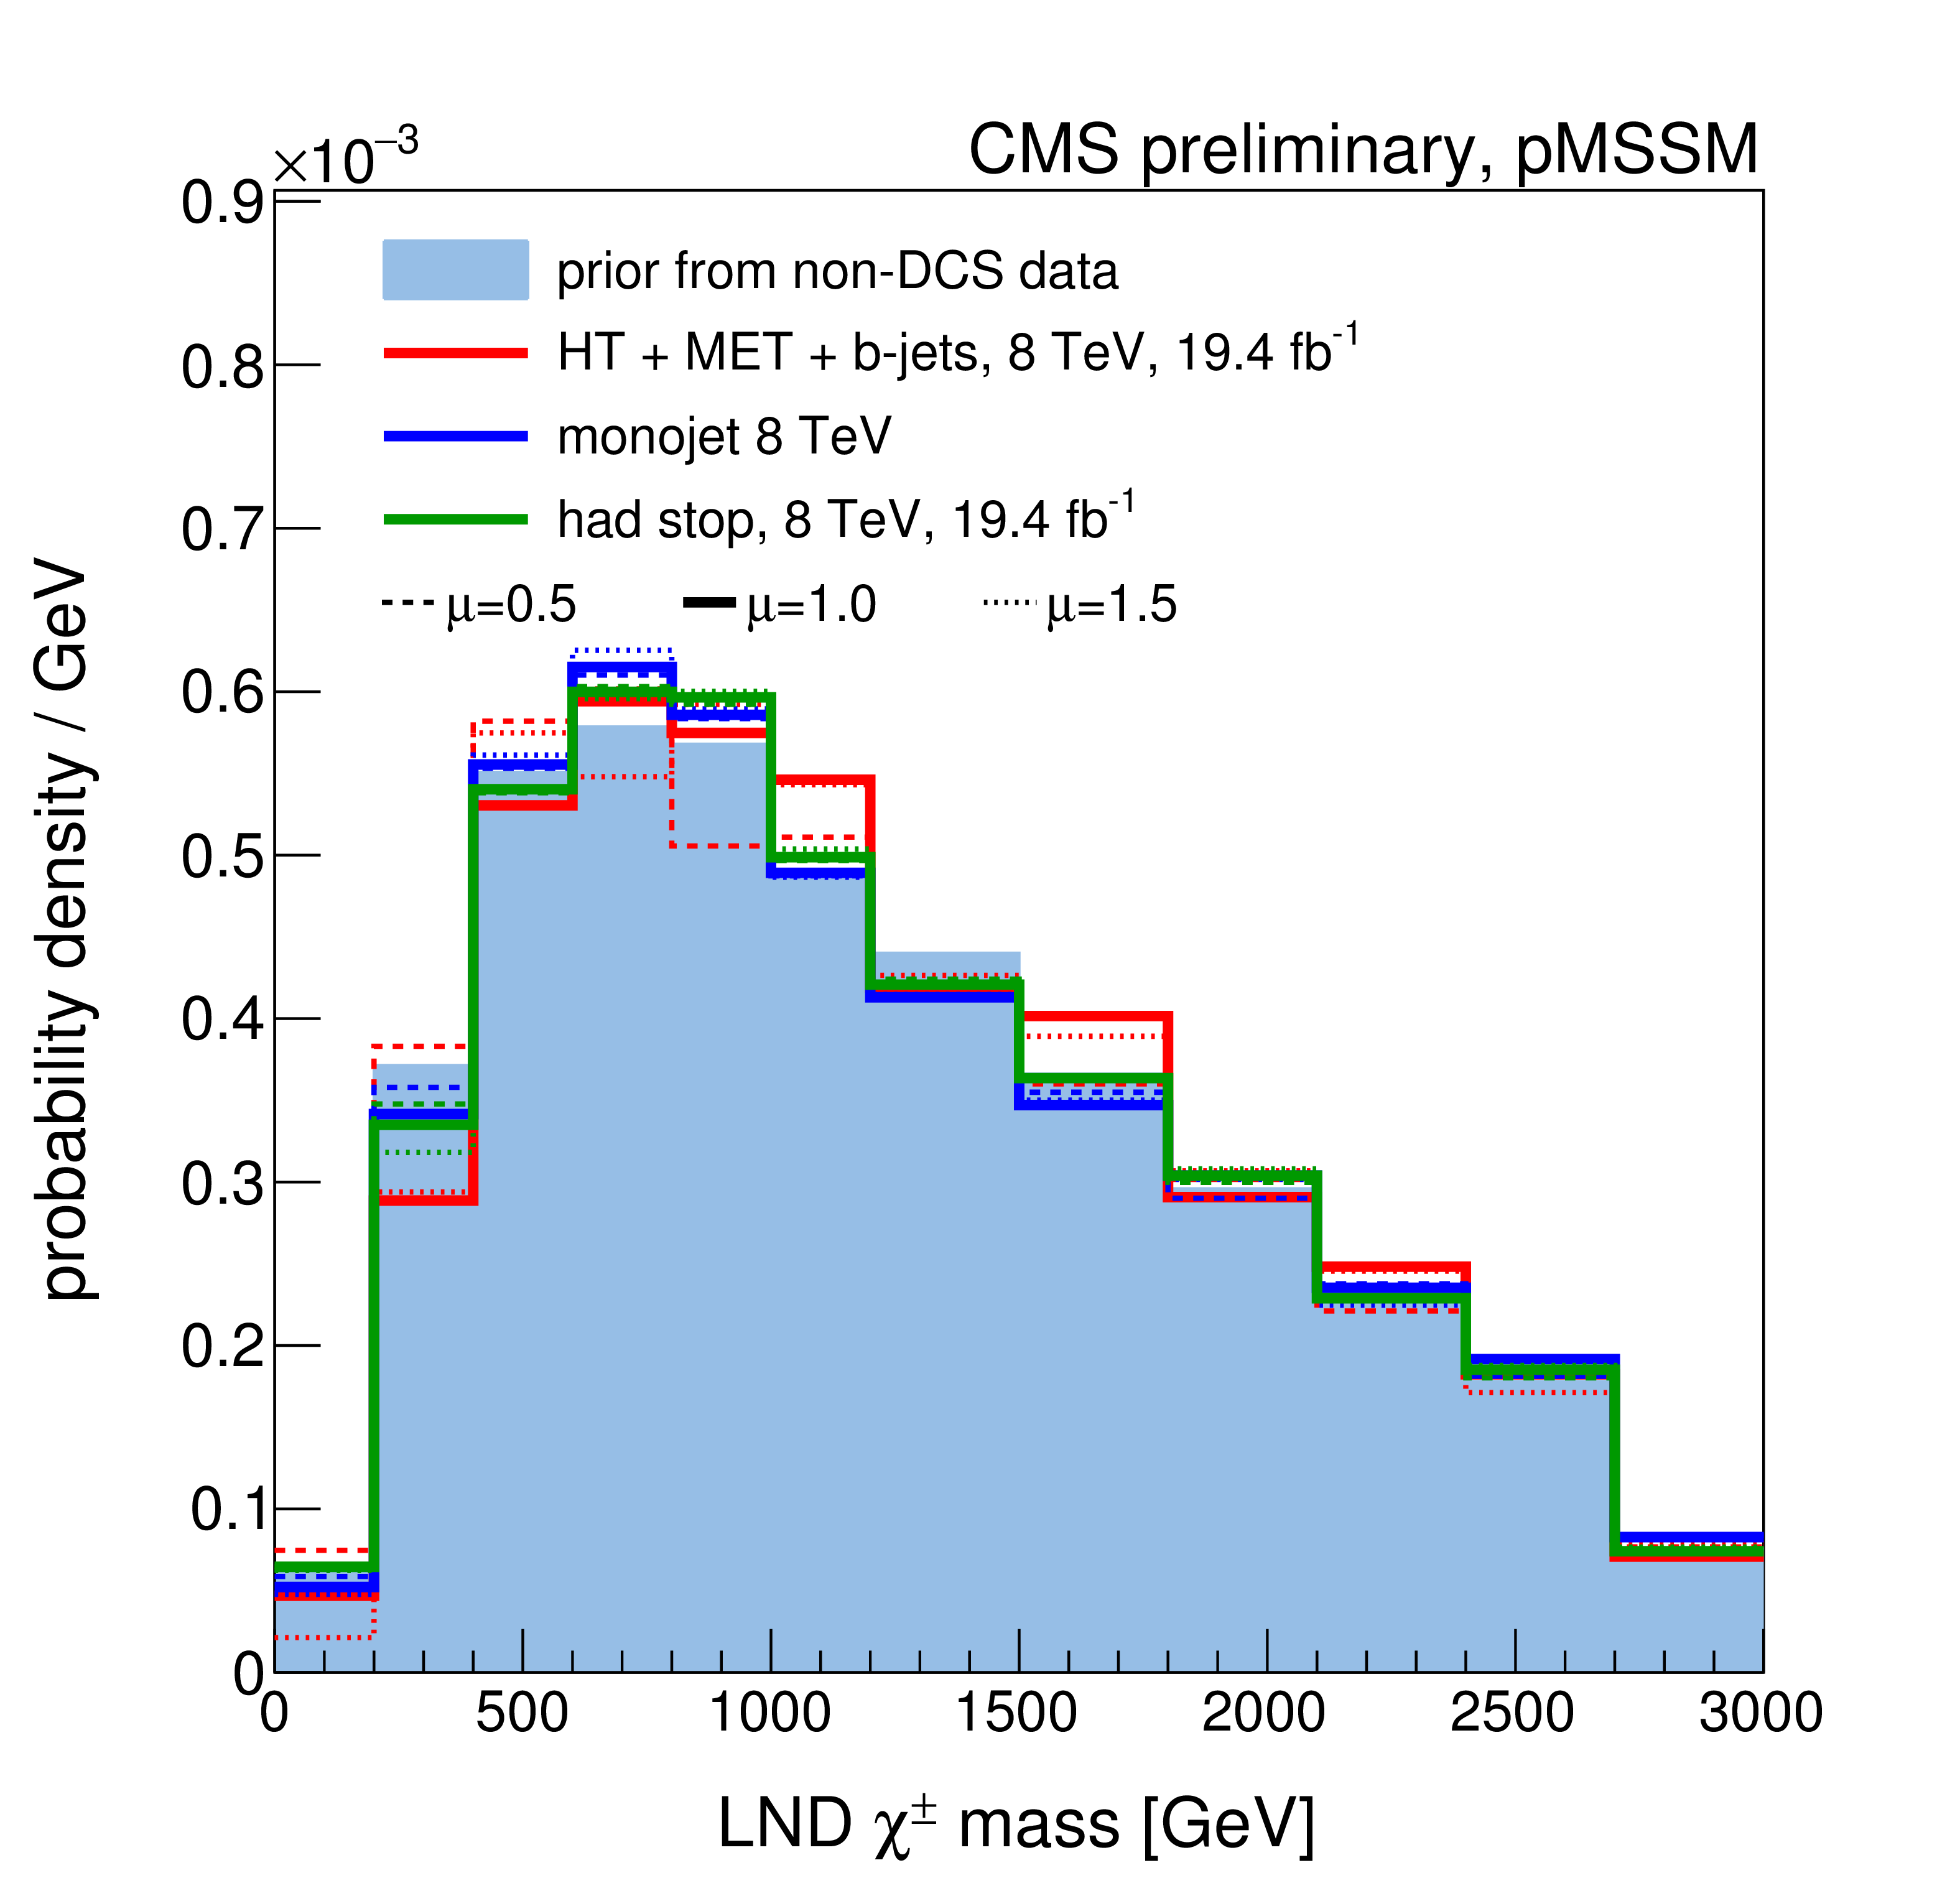
Figure 7-a:
A summary of the impact of CMS searches on our knowledge of the the mass of the Lightest Non Degenerate (LND) chargino in the pMSSM parameter space. Plots (a)-(d) compare the non-DCS prior distribution of the LND $\tilde{ \chi}^{\pm}$ mass to posterior distributions after data from various CMS searches, where (d) shows the combined effect of CMS searches and the Higgs boson results. Plot (e) shows survival probabilities as a function of the LND $\tilde{ \chi}^{\pm}$ mass for various combinations of CMS data and data from Higgs boson measurements. Plot (f) shows the distribution of the LND $\tilde{ \chi}^{\pm}$ mass versus the $Z$-significance calculated from the combination of all searches. See Fig.2 for a description of the shading. |
png ; pdf |
Figure 7-b:
A summary of the impact of CMS searches on our knowledge of the the mass of the Lightest Non Degenerate (LND) chargino in the pMSSM parameter space. Plots (a)-(d) compare the non-DCS prior distribution of the LND $\tilde{ \chi}^{\pm}$ mass to posterior distributions after data from various CMS searches, where (d) shows the combined effect of CMS searches and the Higgs boson results. Plot (e) shows survival probabilities as a function of the LND $\tilde{ \chi}^{\pm}$ mass for various combinations of CMS data and data from Higgs boson measurements. Plot (f) shows the distribution of the LND $\tilde{ \chi}^{\pm}$ mass versus the $Z$-significance calculated from the combination of all searches. See Fig.2 for a description of the shading. |

png ; pdf |
Figure 7-c:
A summary of the impact of CMS searches on our knowledge of the the mass of the Lightest Non Degenerate (LND) chargino in the pMSSM parameter space. Plots (a)-(d) compare the non-DCS prior distribution of the LND $\tilde{ \chi}^{\pm}$ mass to posterior distributions after data from various CMS searches, where (d) shows the combined effect of CMS searches and the Higgs boson results. Plot (e) shows survival probabilities as a function of the LND $\tilde{ \chi}^{\pm}$ mass for various combinations of CMS data and data from Higgs boson measurements. Plot (f) shows the distribution of the LND $\tilde{ \chi}^{\pm}$ mass versus the $Z$-significance calculated from the combination of all searches. See Fig.2 for a description of the shading. |
png ; pdf |
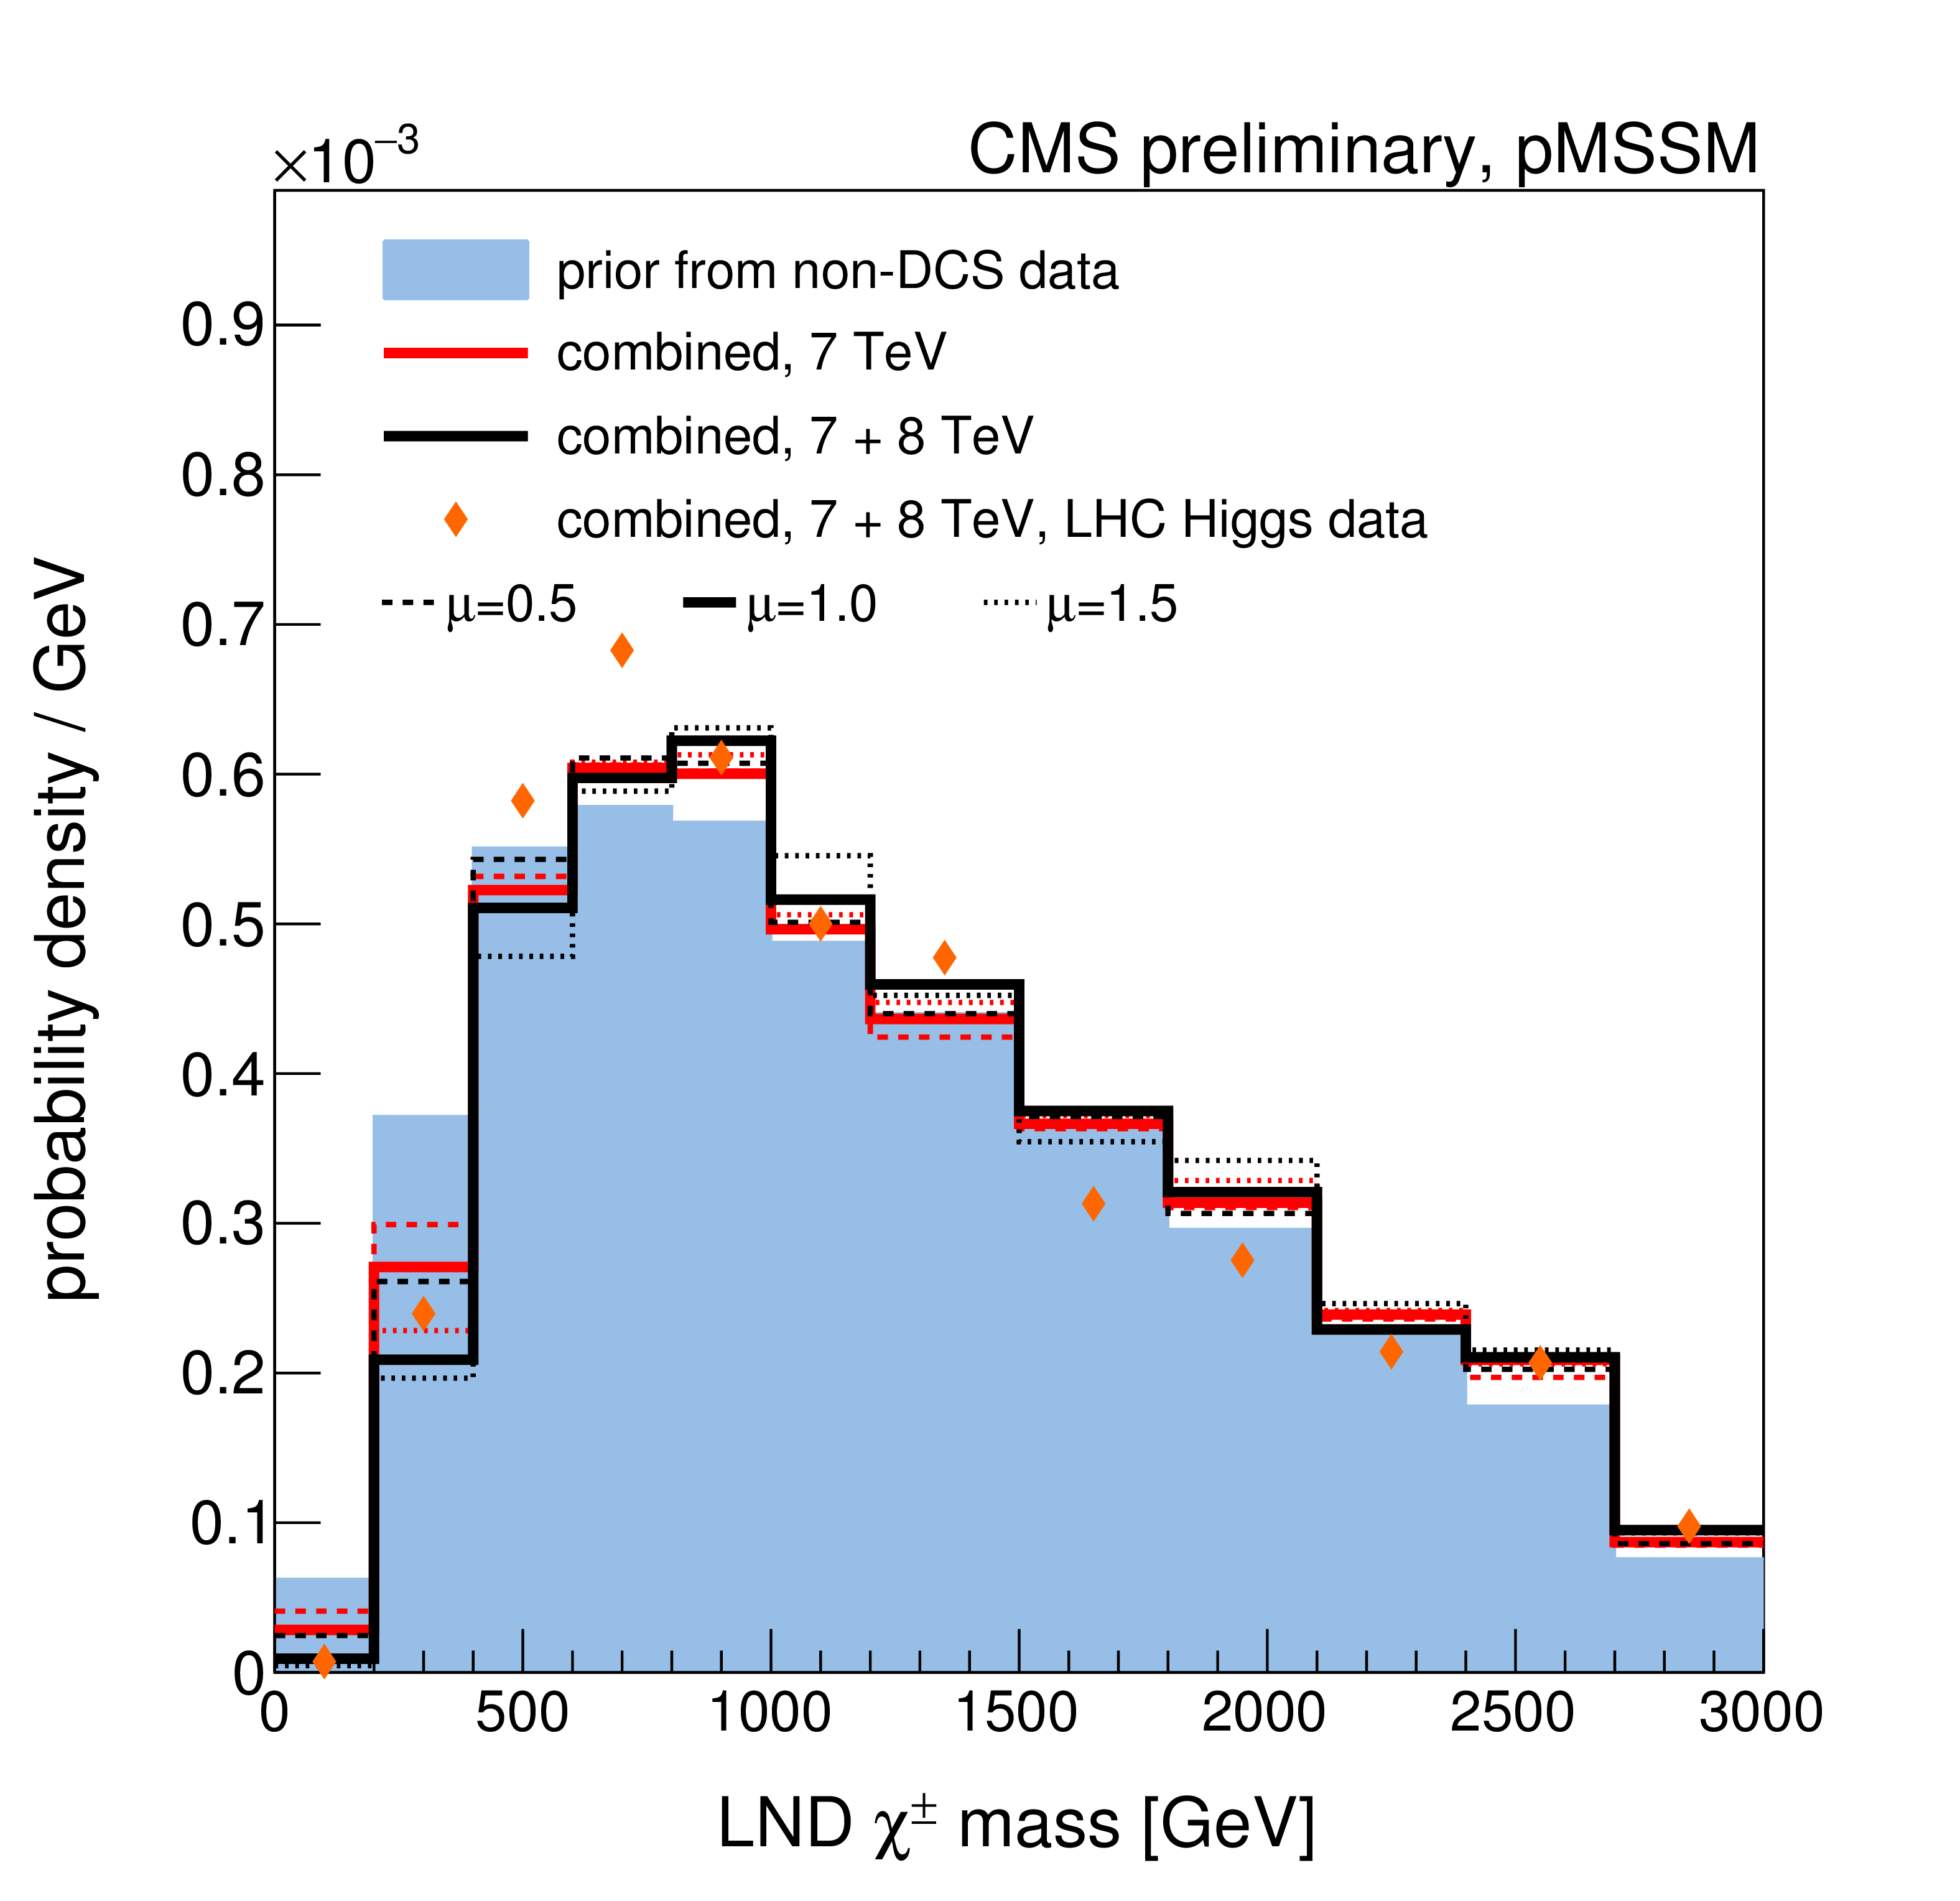
Figure 7-d:
A summary of the impact of CMS searches on our knowledge of the the mass of the Lightest Non Degenerate (LND) chargino in the pMSSM parameter space. Plots (a)-(d) compare the non-DCS prior distribution of the LND $\tilde{ \chi}^{\pm}$ mass to posterior distributions after data from various CMS searches, where (d) shows the combined effect of CMS searches and the Higgs boson results. Plot (e) shows survival probabilities as a function of the LND $\tilde{ \chi}^{\pm}$ mass for various combinations of CMS data and data from Higgs boson measurements. Plot (f) shows the distribution of the LND $\tilde{ \chi}^{\pm}$ mass versus the $Z$-significance calculated from the combination of all searches. See Fig.2 for a description of the shading. |
png ; pdf |
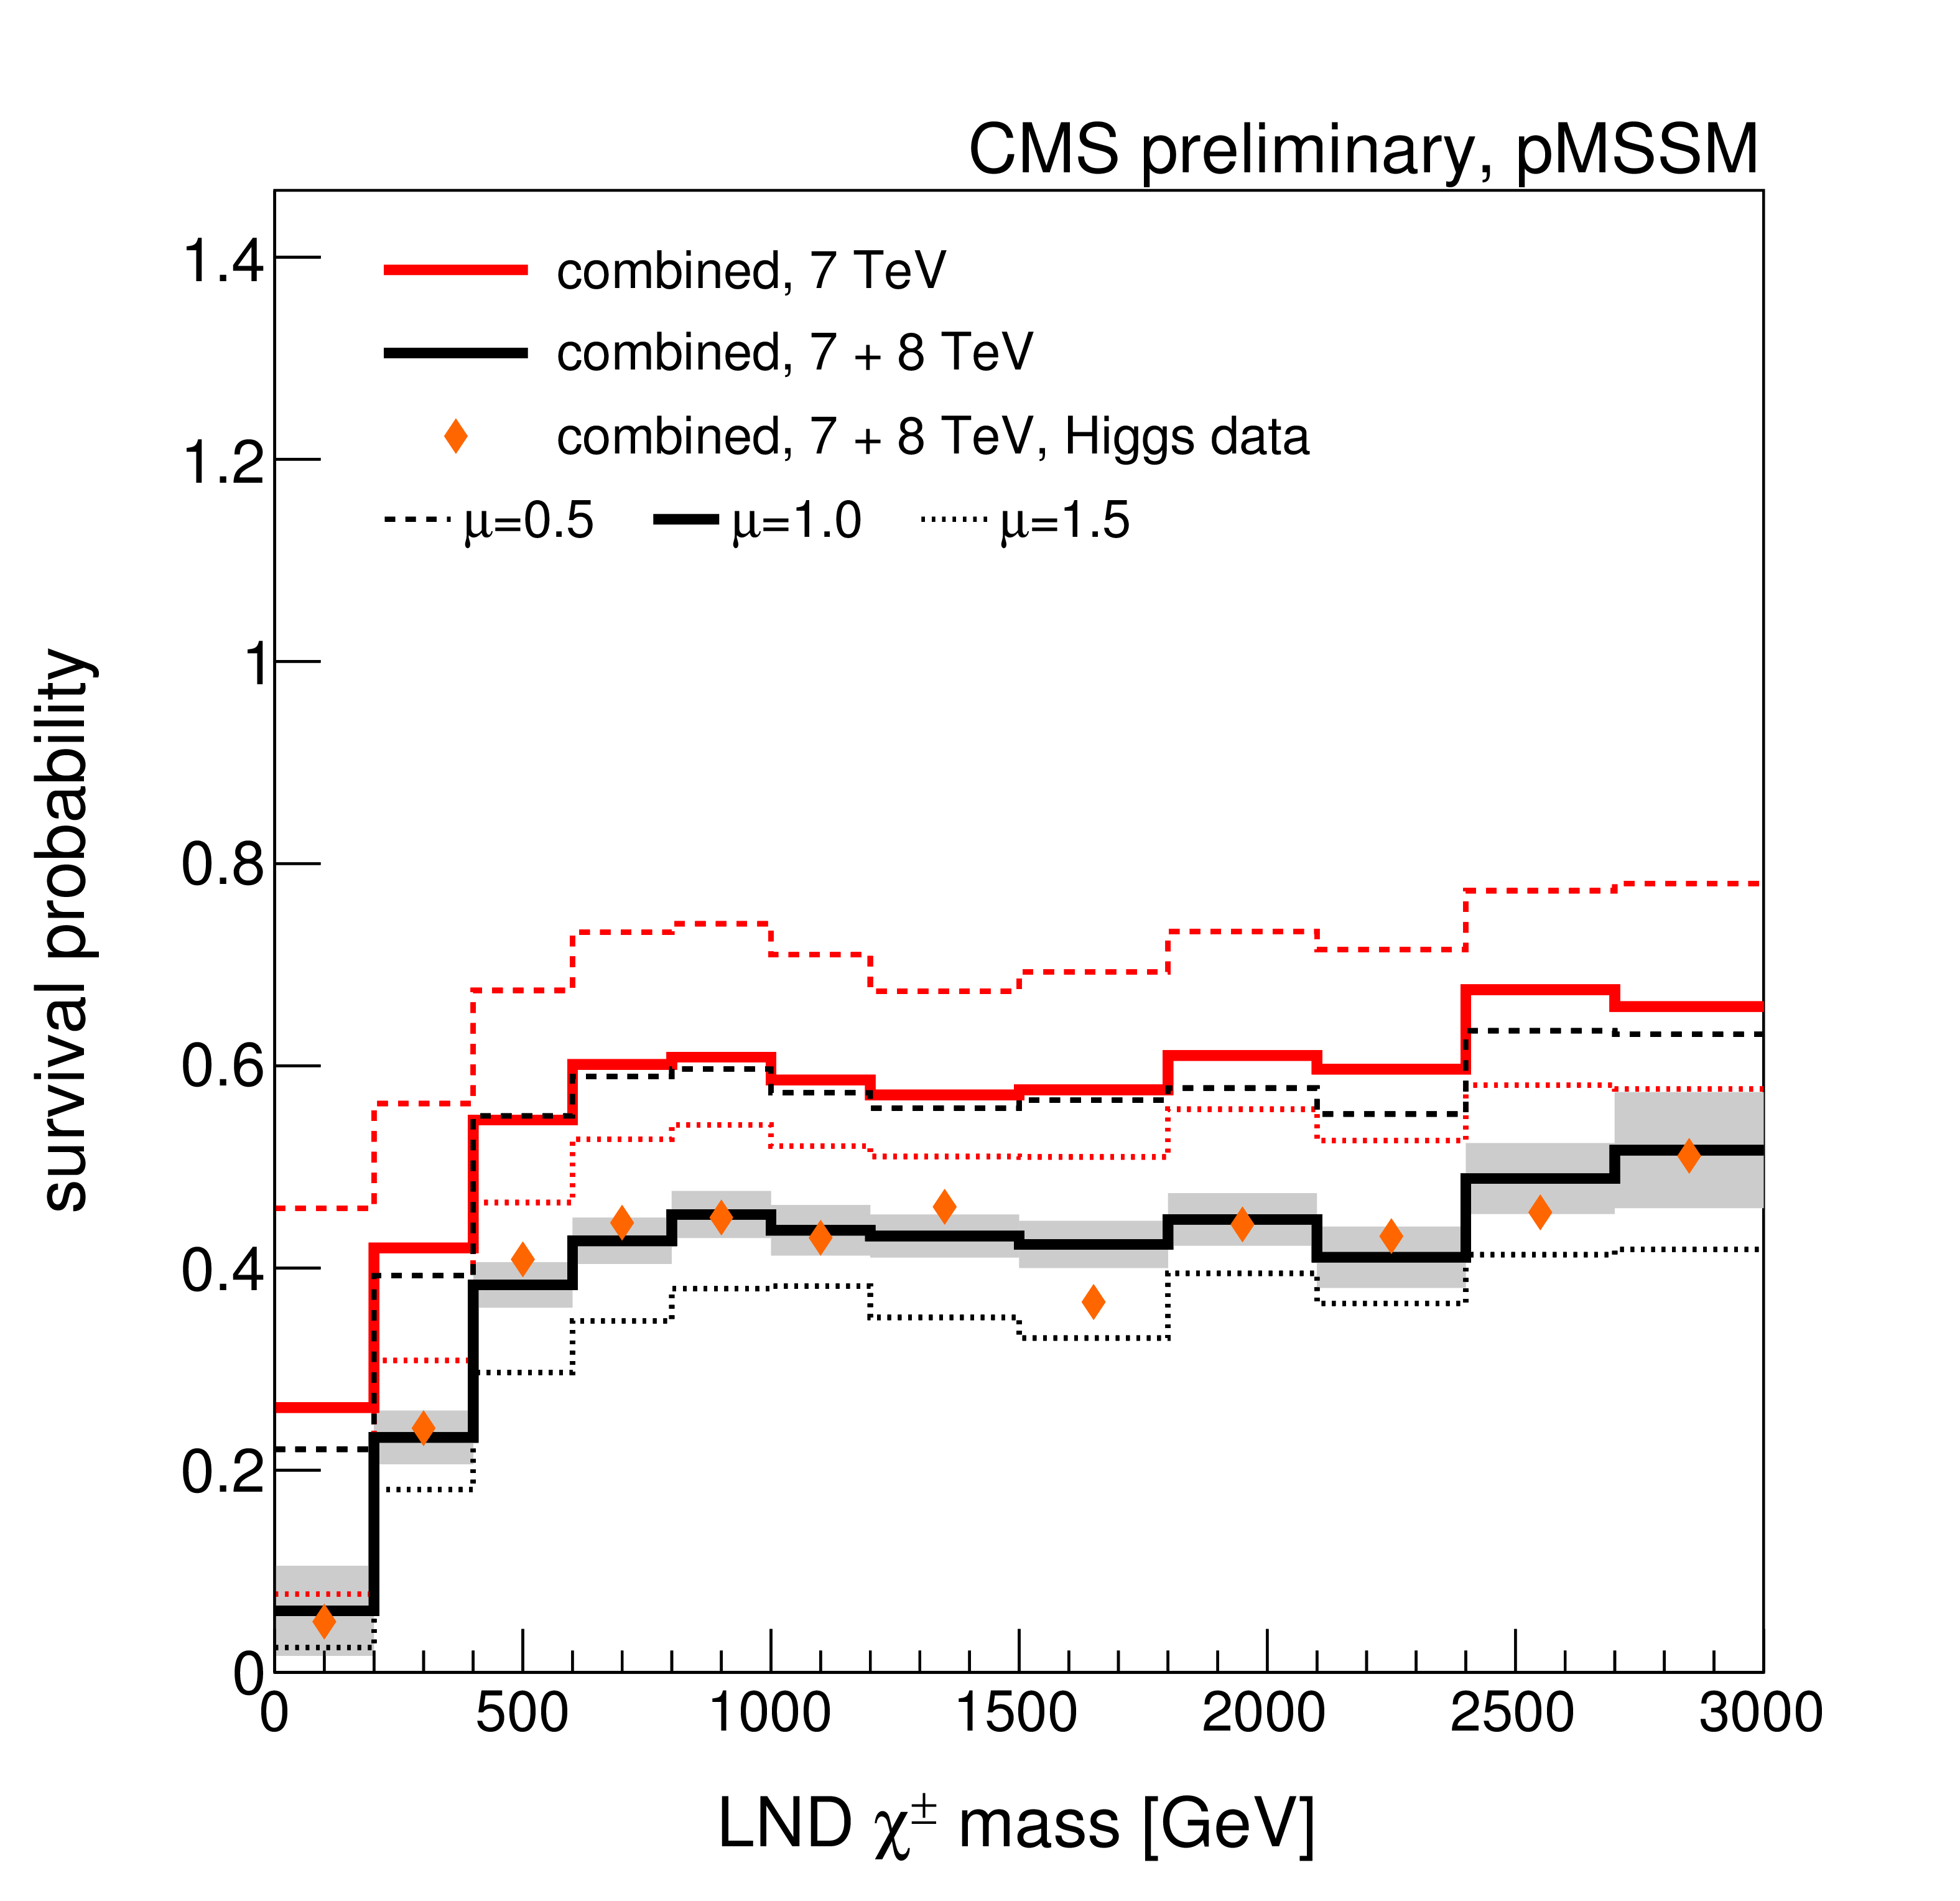
Figure 7-e:
A summary of the impact of CMS searches on our knowledge of the the mass of the Lightest Non Degenerate (LND) chargino in the pMSSM parameter space. Plots (a)-(d) compare the non-DCS prior distribution of the LND $\tilde{ \chi}^{\pm}$ mass to posterior distributions after data from various CMS searches, where (d) shows the combined effect of CMS searches and the Higgs boson results. Plot (e) shows survival probabilities as a function of the LND $\tilde{ \chi}^{\pm}$ mass for various combinations of CMS data and data from Higgs boson measurements. Plot (f) shows the distribution of the LND $\tilde{ \chi}^{\pm}$ mass versus the $Z$-significance calculated from the combination of all searches. See Fig.2 for a description of the shading. |
png ; pdf |
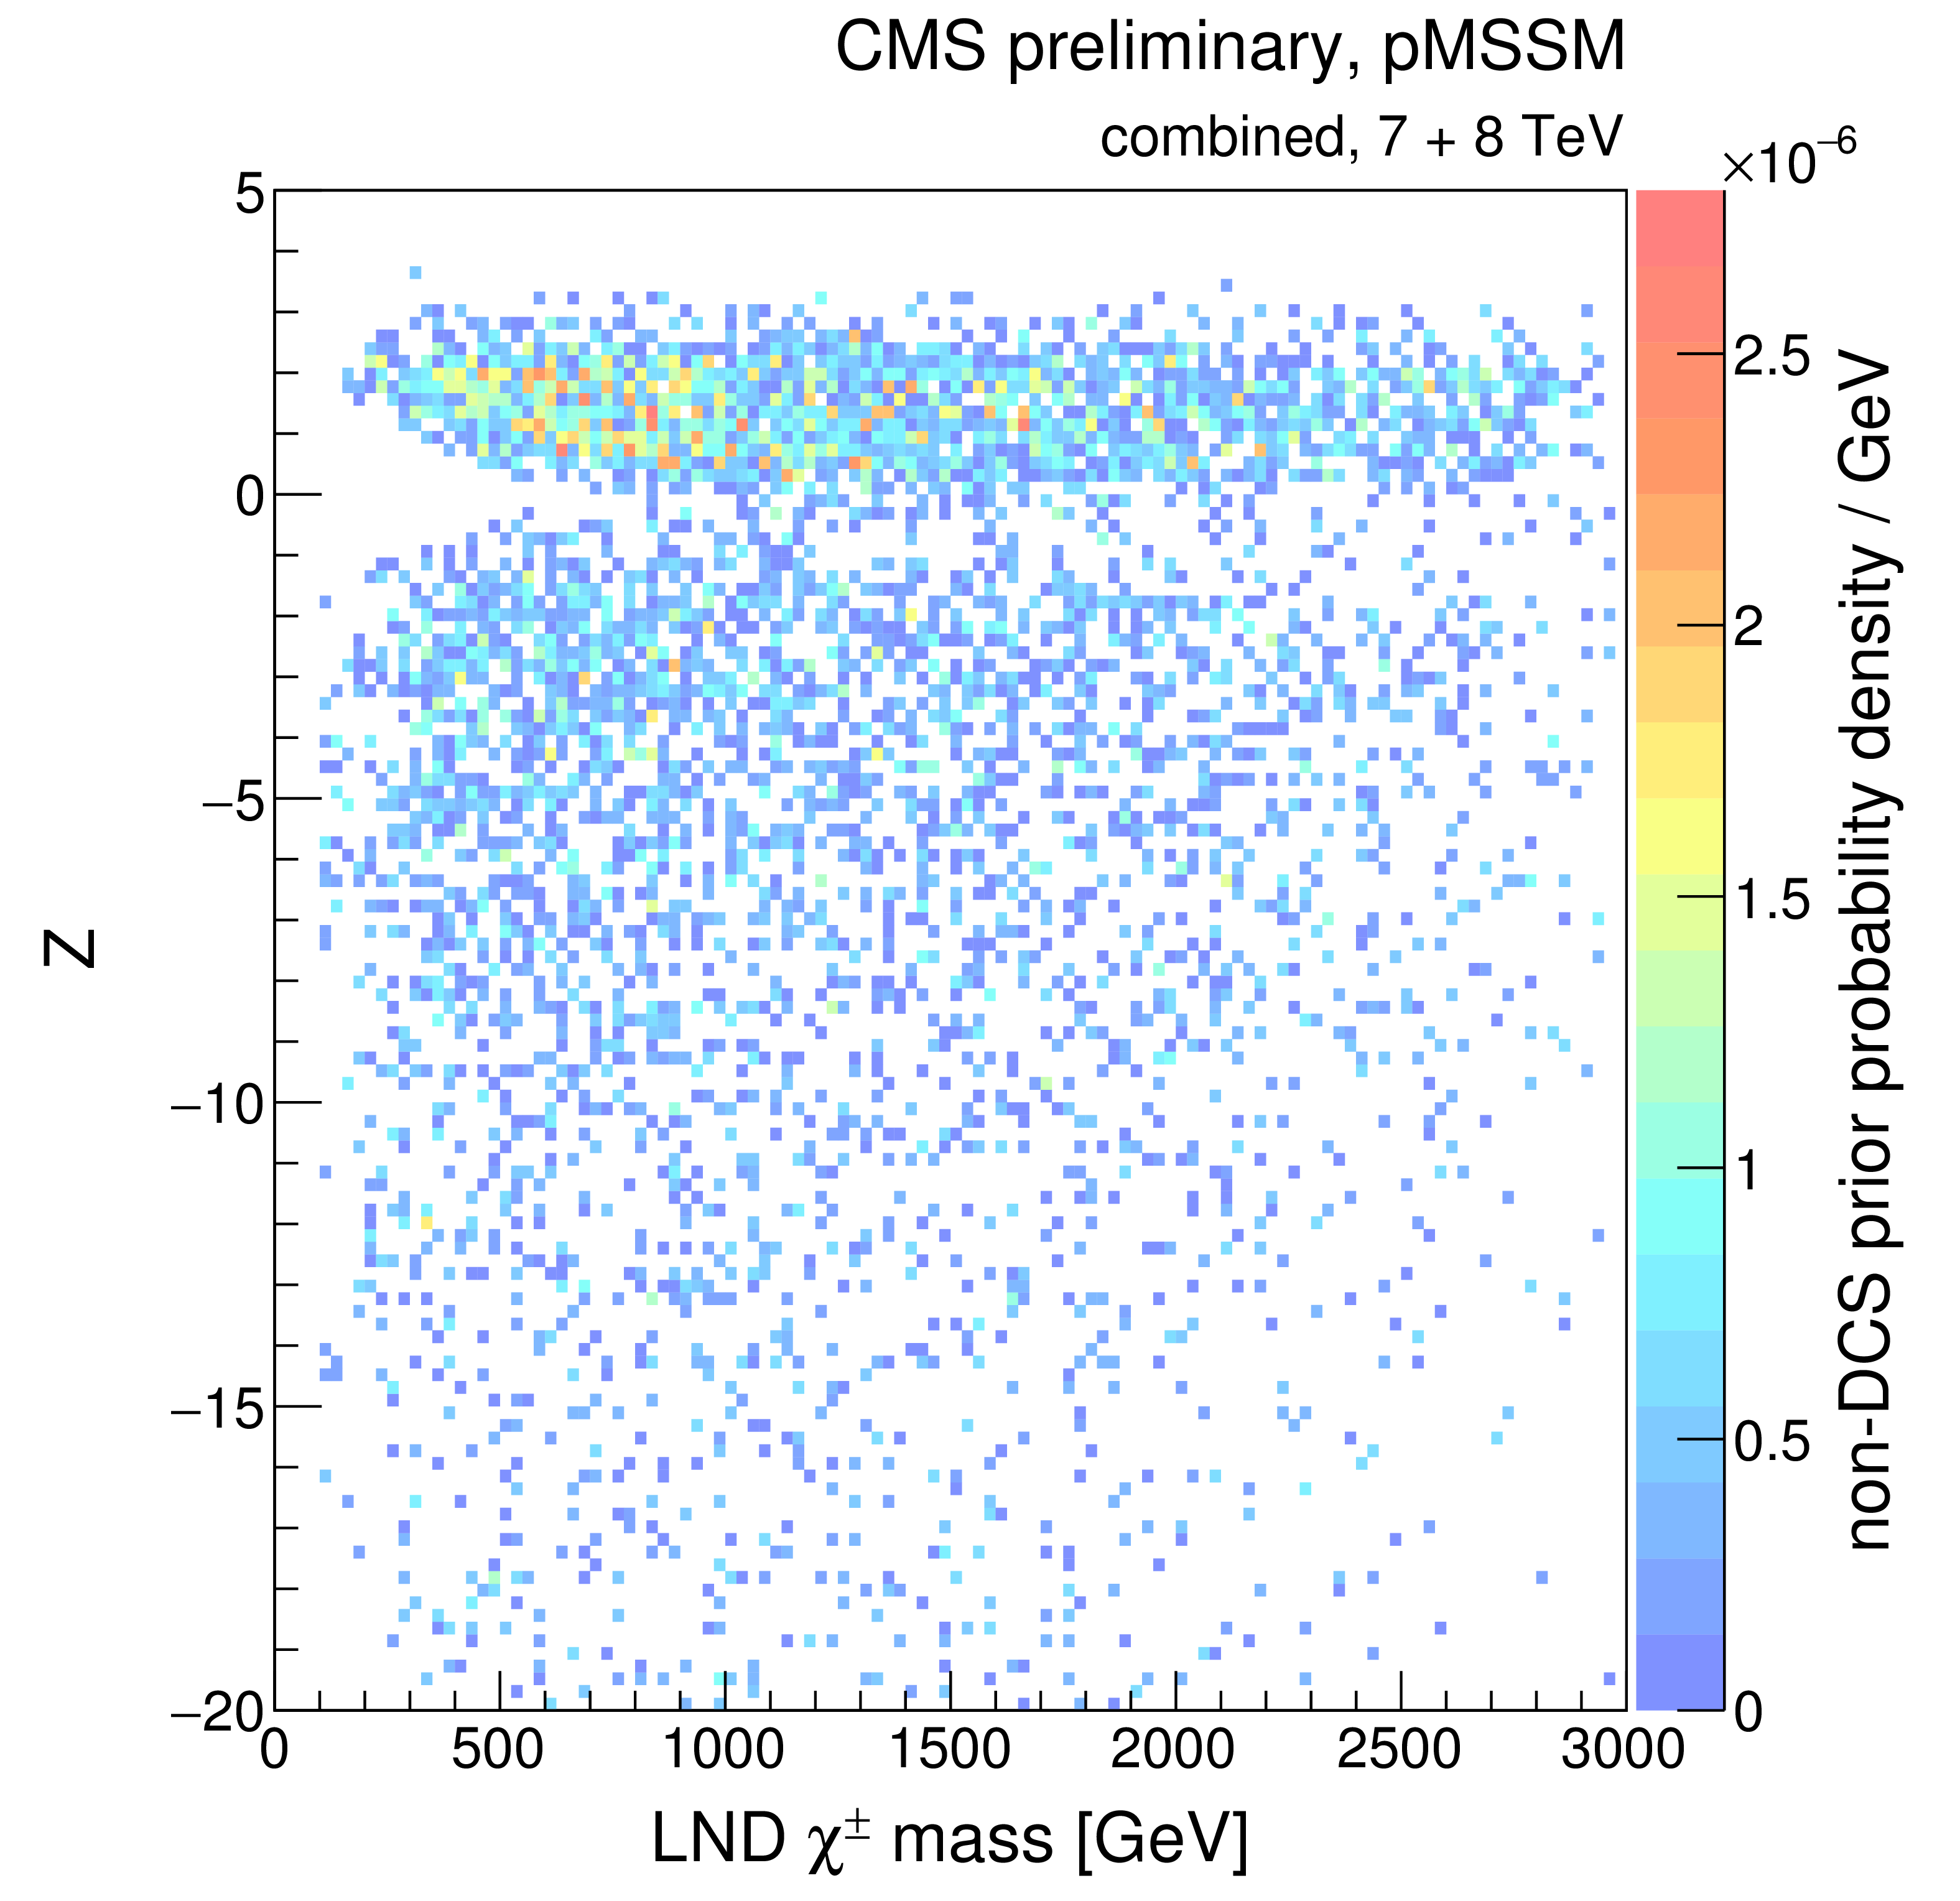
Figure 7-f:
A summary of the impact of CMS searches on our knowledge of the the mass of the Lightest Non Degenerate (LND) chargino in the pMSSM parameter space. Plots (a)-(d) compare the non-DCS prior distribution of the LND $\tilde{ \chi}^{\pm}$ mass to posterior distributions after data from various CMS searches, where (d) shows the combined effect of CMS searches and the Higgs boson results. Plot (e) shows survival probabilities as a function of the LND $\tilde{ \chi}^{\pm}$ mass for various combinations of CMS data and data from Higgs boson measurements. Plot (f) shows the distribution of the LND $\tilde{ \chi}^{\pm}$ mass versus the $Z$-significance calculated from the combination of all searches. See Fig.2 for a description of the shading. |
png ; pdf |
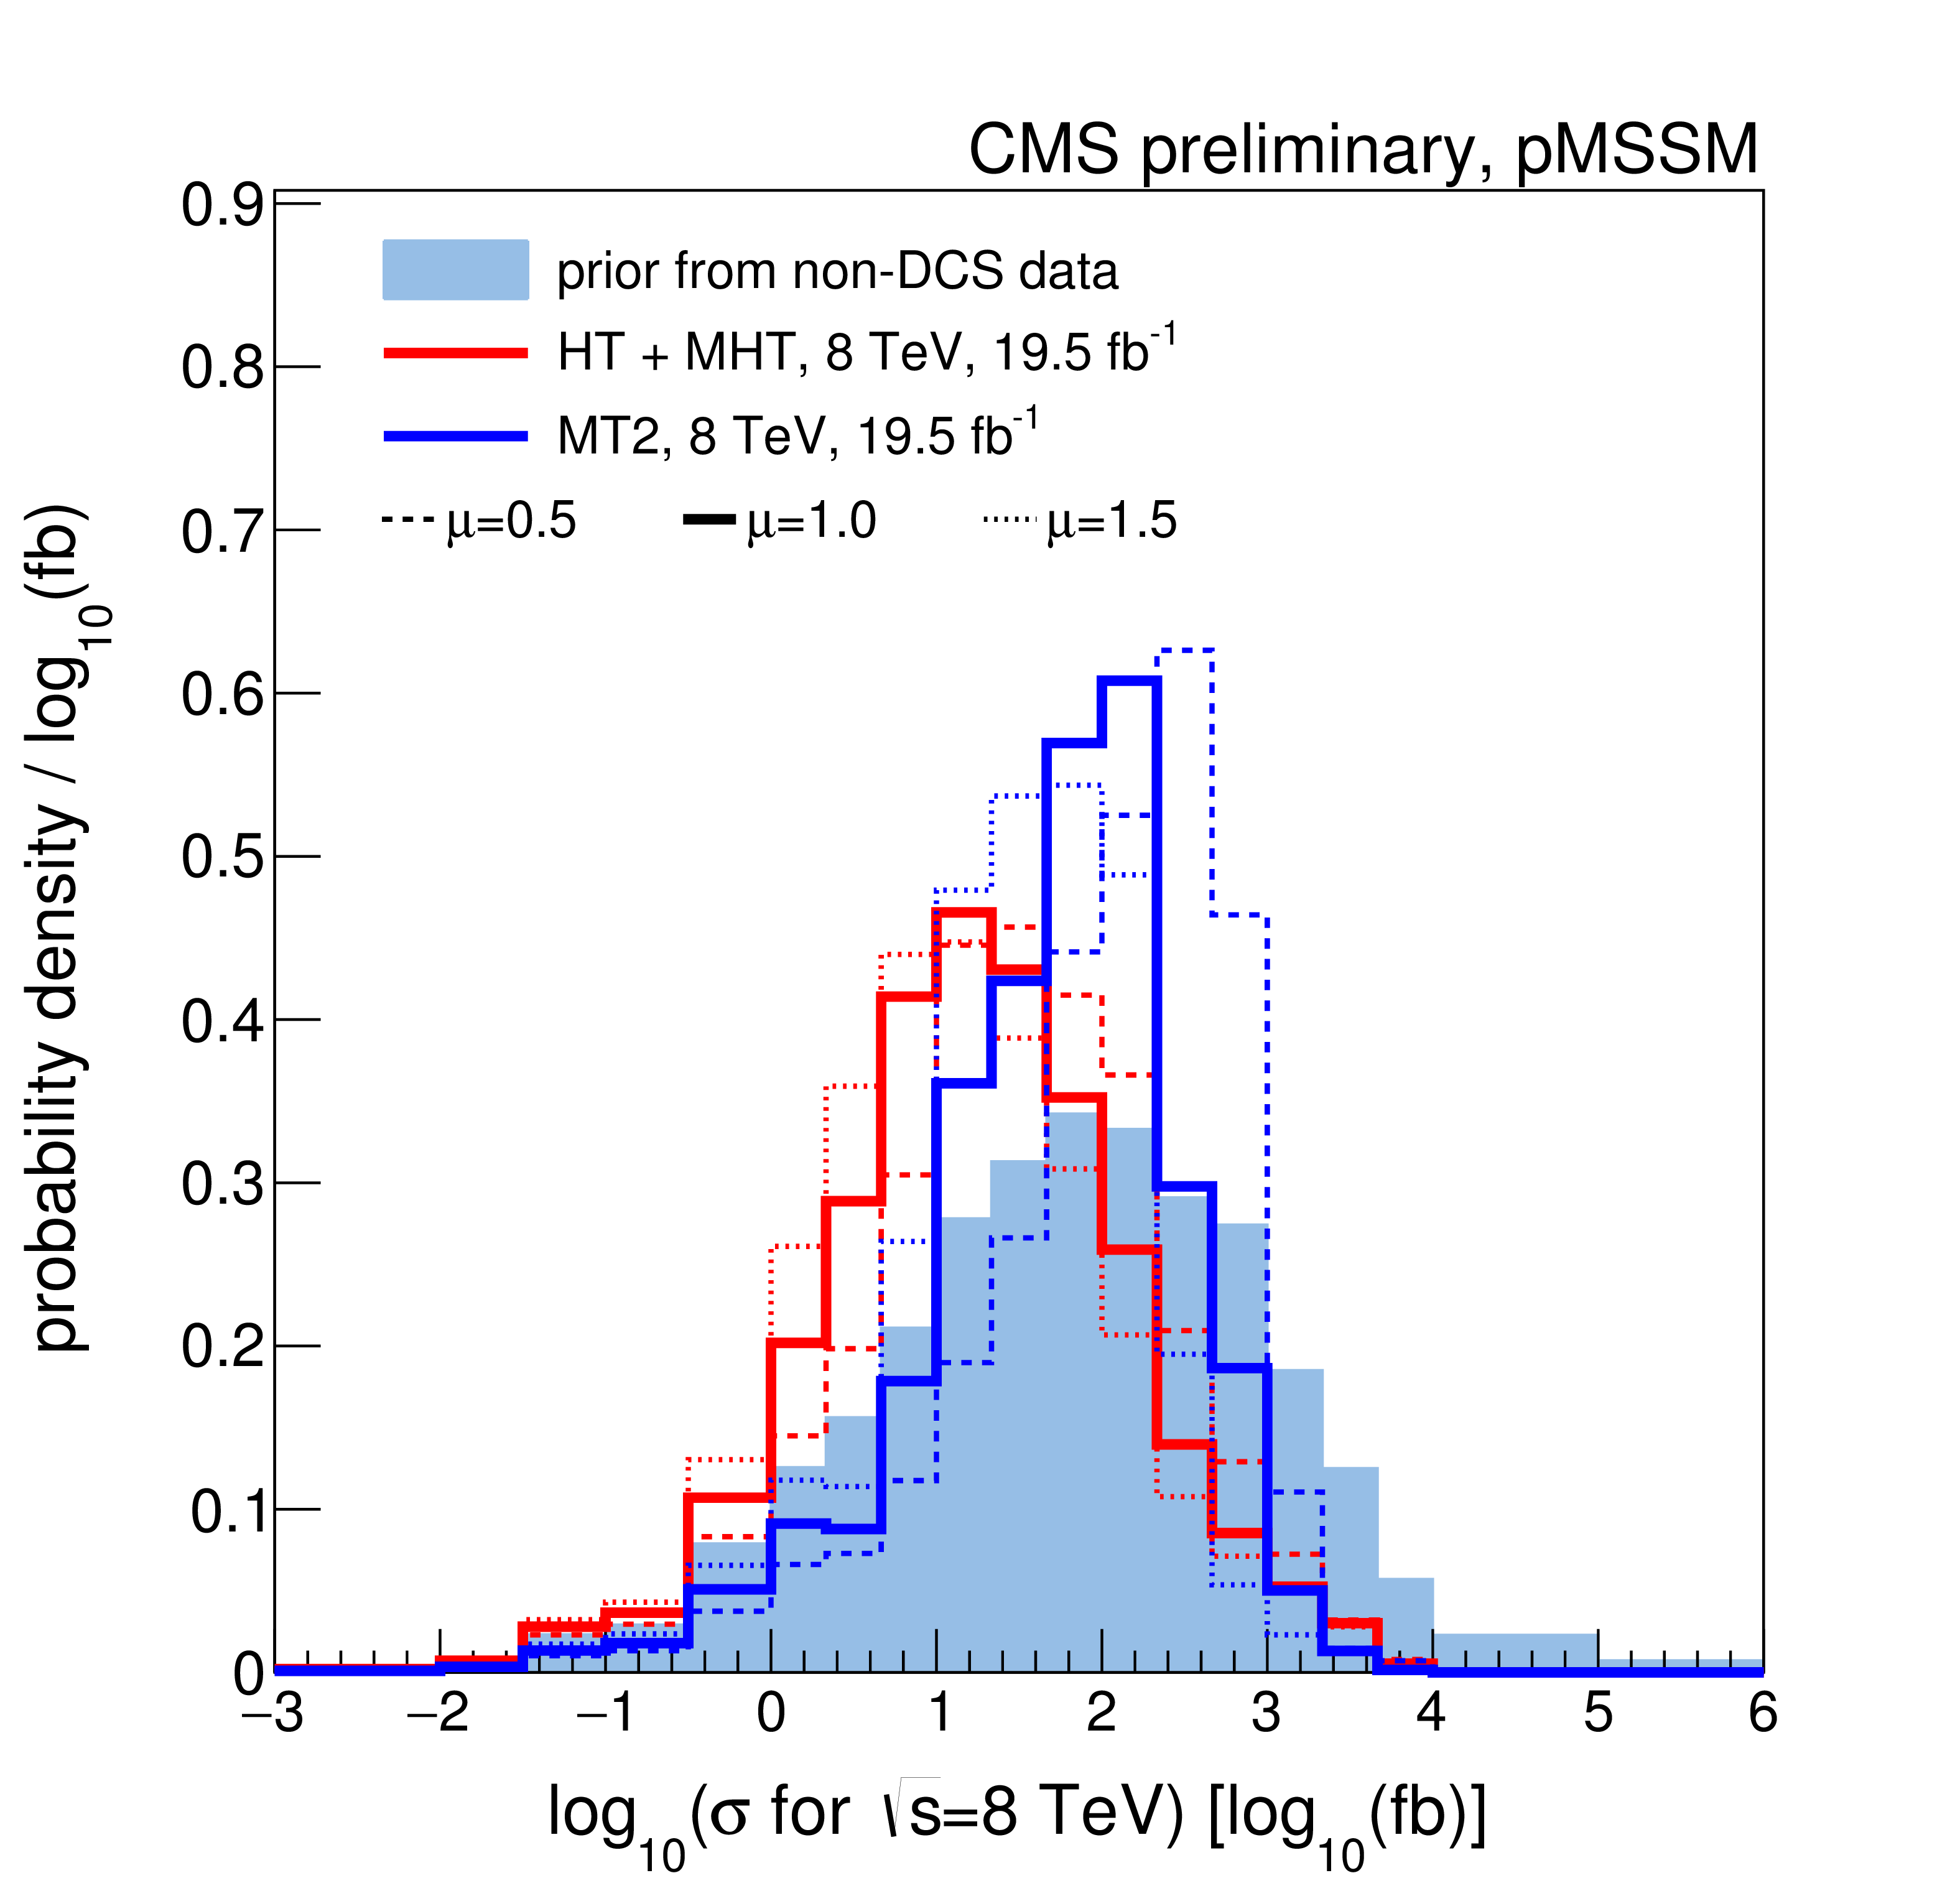
Figure 8-a:
A summary of the impact of CMS searches on our knowledge of the the logarithm of inclusive cross section for inclusive sparticle production in 8 TeV pp collisions, $\log_{10}$($\sigma$ for $\sqrt {s}=$ 8 TeV), in the pMSSM parameter space. Plots (a)-(d) compare the non-DCS prior distribution of the $\log_{10}$($\sigma$ for $\sqrt {s}=$ 8 TeV) to posterior distributions after data from various CMS searches, where (d) shows the combined effect of CMS searches and the Higgs boson results. Plot (e) shows survival probabilities as a function of the $\log_{10}$($\sigma$ for $\sqrt {s}=$ 8 TeV) for various combinations of CMS data and data from Higgs boson measurements. Plot (f) shows the distribution of the $\log_{10}$($\sigma$ for $\sqrt {s}=$ 8 TeV) versus the $Z$-significance calculated from the combination of all searches. See Fig.2 for a description of the shading. |
png ; pdf |
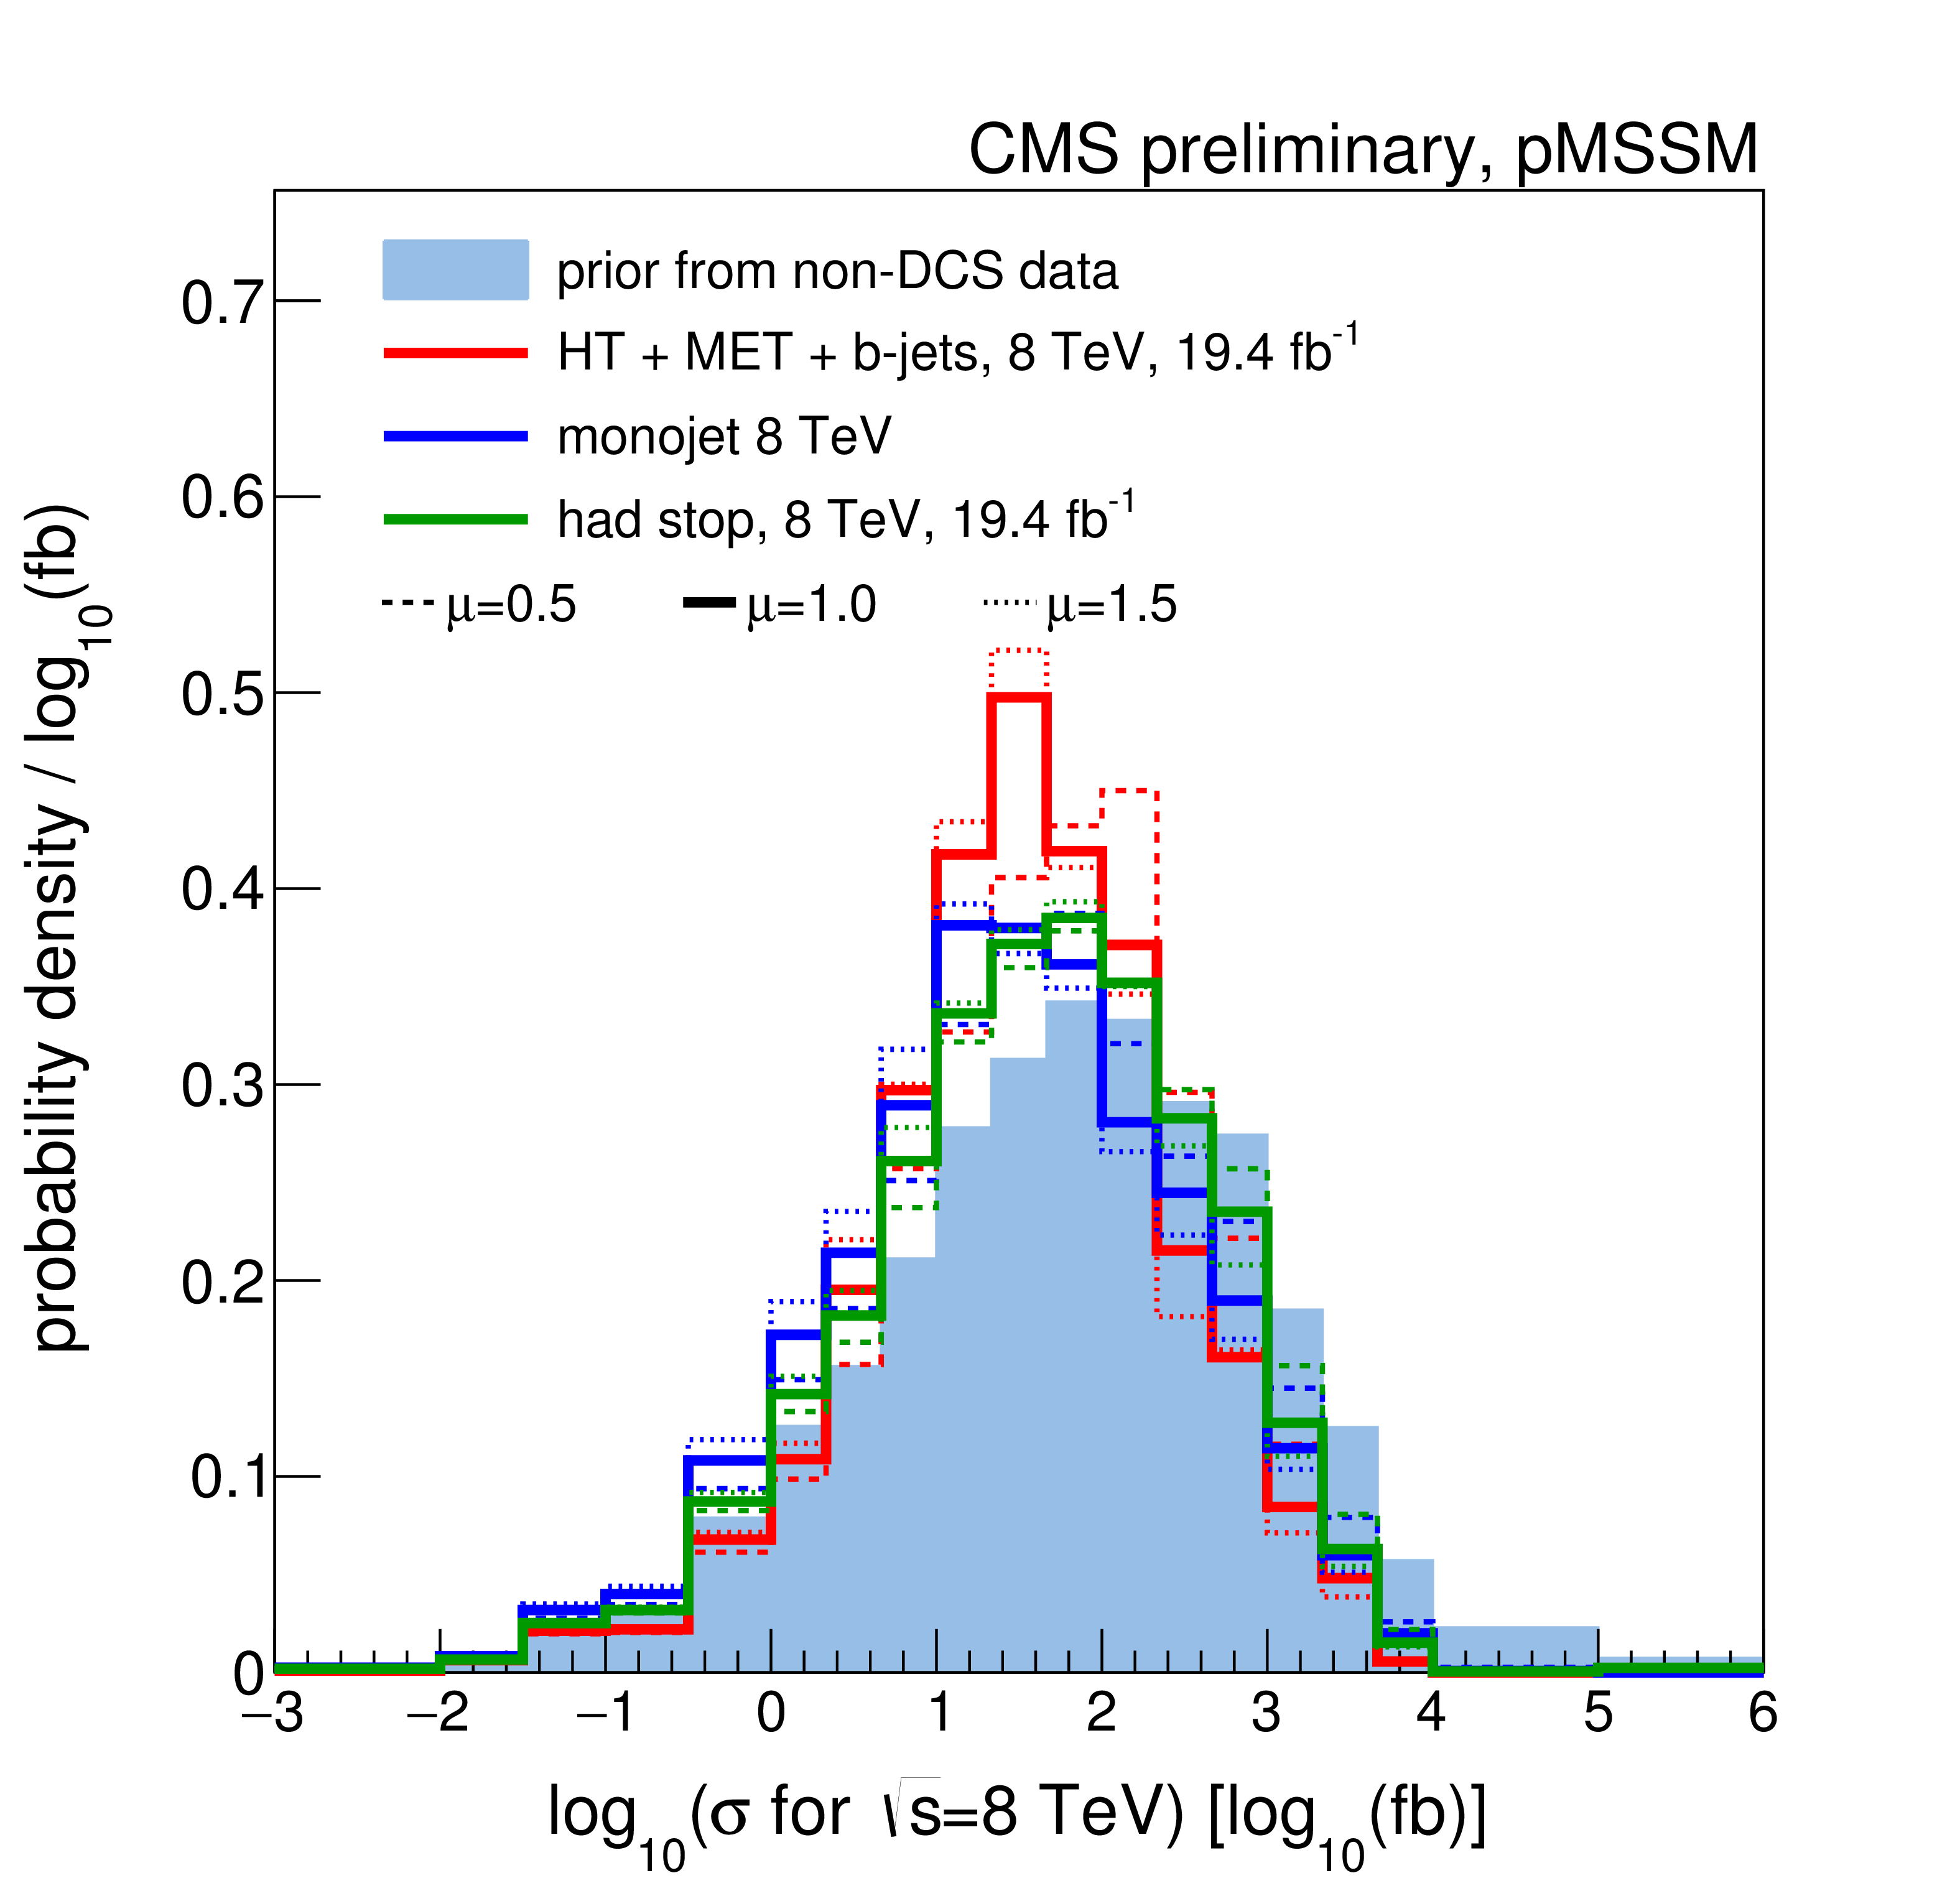
Figure 8-b:
A summary of the impact of CMS searches on our knowledge of the the logarithm of inclusive cross section for inclusive sparticle production in 8 TeV pp collisions, $\log_{10}$($\sigma$ for $\sqrt {s}=$ 8 TeV), in the pMSSM parameter space. Plots (a)-(d) compare the non-DCS prior distribution of the $\log_{10}$($\sigma$ for $\sqrt {s}=$ 8 TeV) to posterior distributions after data from various CMS searches, where (d) shows the combined effect of CMS searches and the Higgs boson results. Plot (e) shows survival probabilities as a function of the $\log_{10}$($\sigma$ for $\sqrt {s}=$ 8 TeV) for various combinations of CMS data and data from Higgs boson measurements. Plot (f) shows the distribution of the $\log_{10}$($\sigma$ for $\sqrt {s}=$ 8 TeV) versus the $Z$-significance calculated from the combination of all searches. See Fig.2 for a description of the shading. |
png ; pdf |
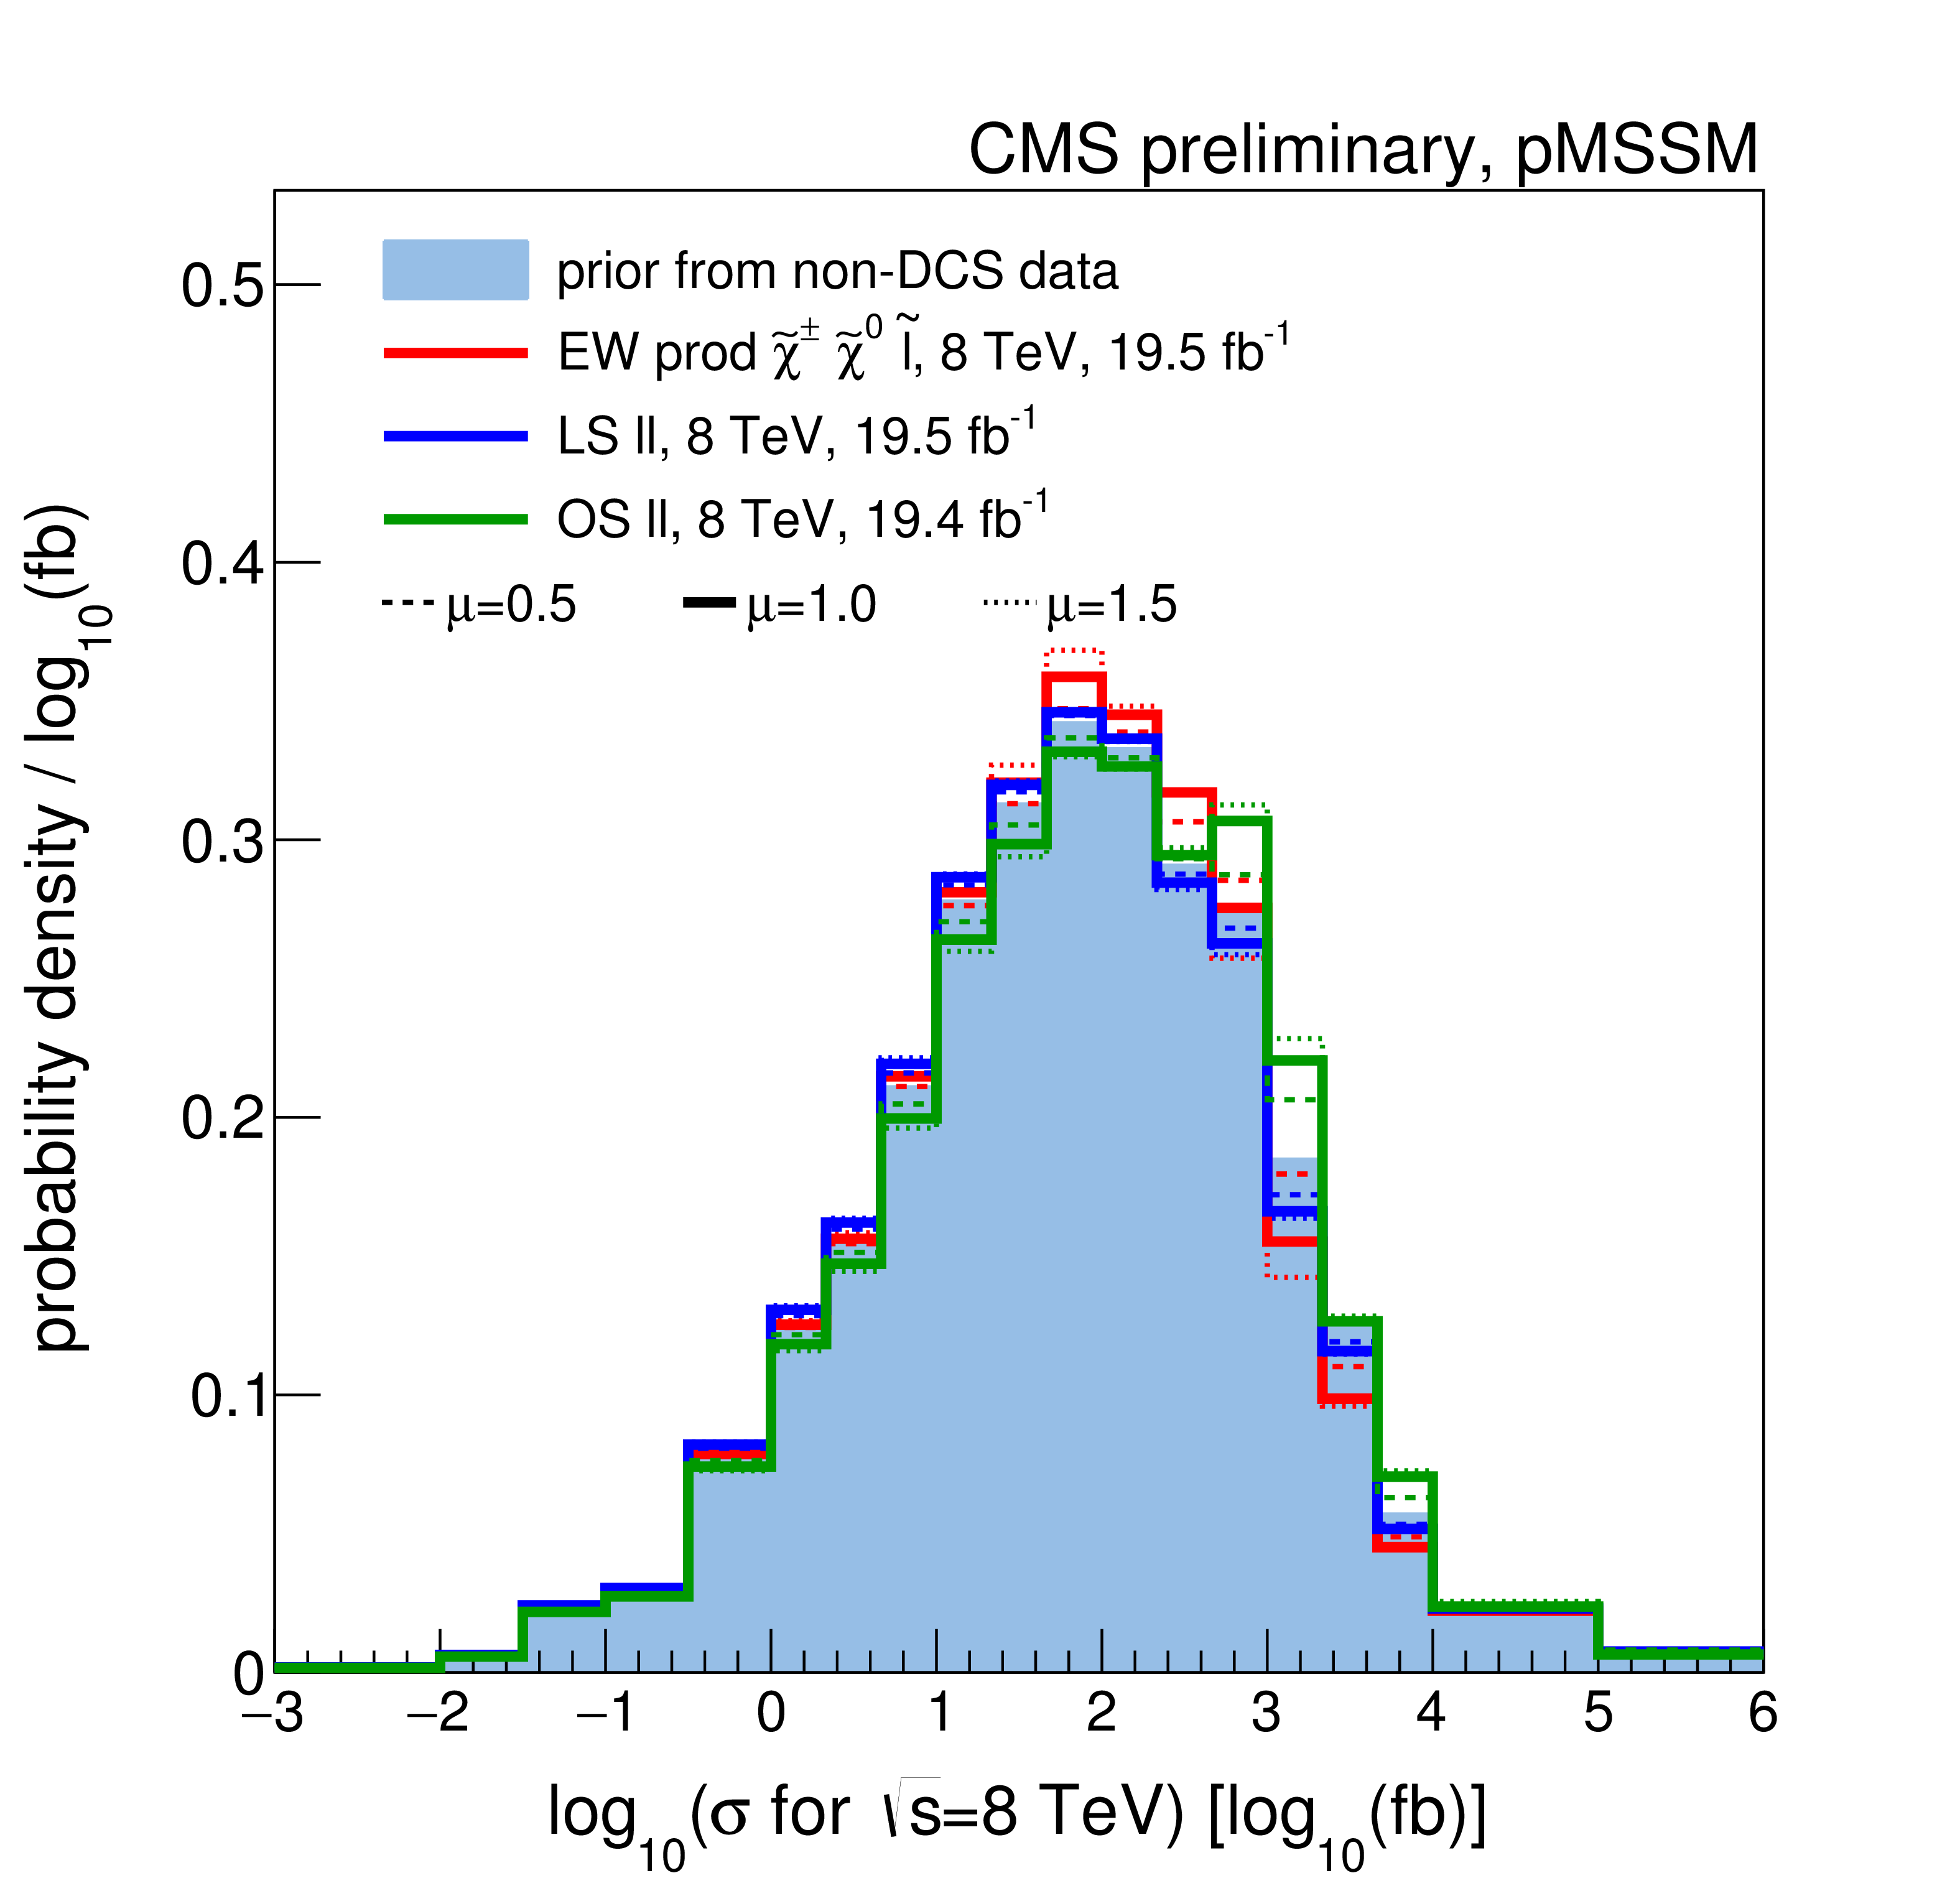
Figure 8-c:
A summary of the impact of CMS searches on our knowledge of the the logarithm of inclusive cross section for inclusive sparticle production in 8 TeV pp collisions, $\log_{10}$($\sigma$ for $\sqrt {s}=$ 8 TeV), in the pMSSM parameter space. Plots (a)-(d) compare the non-DCS prior distribution of the $\log_{10}$($\sigma$ for $\sqrt {s}=$ 8 TeV) to posterior distributions after data from various CMS searches, where (d) shows the combined effect of CMS searches and the Higgs boson results. Plot (e) shows survival probabilities as a function of the $\log_{10}$($\sigma$ for $\sqrt {s}=$ 8 TeV) for various combinations of CMS data and data from Higgs boson measurements. Plot (f) shows the distribution of the $\log_{10}$($\sigma$ for $\sqrt {s}=$ 8 TeV) versus the $Z$-significance calculated from the combination of all searches. See Fig.2 for a description of the shading. |
png ; pdf |
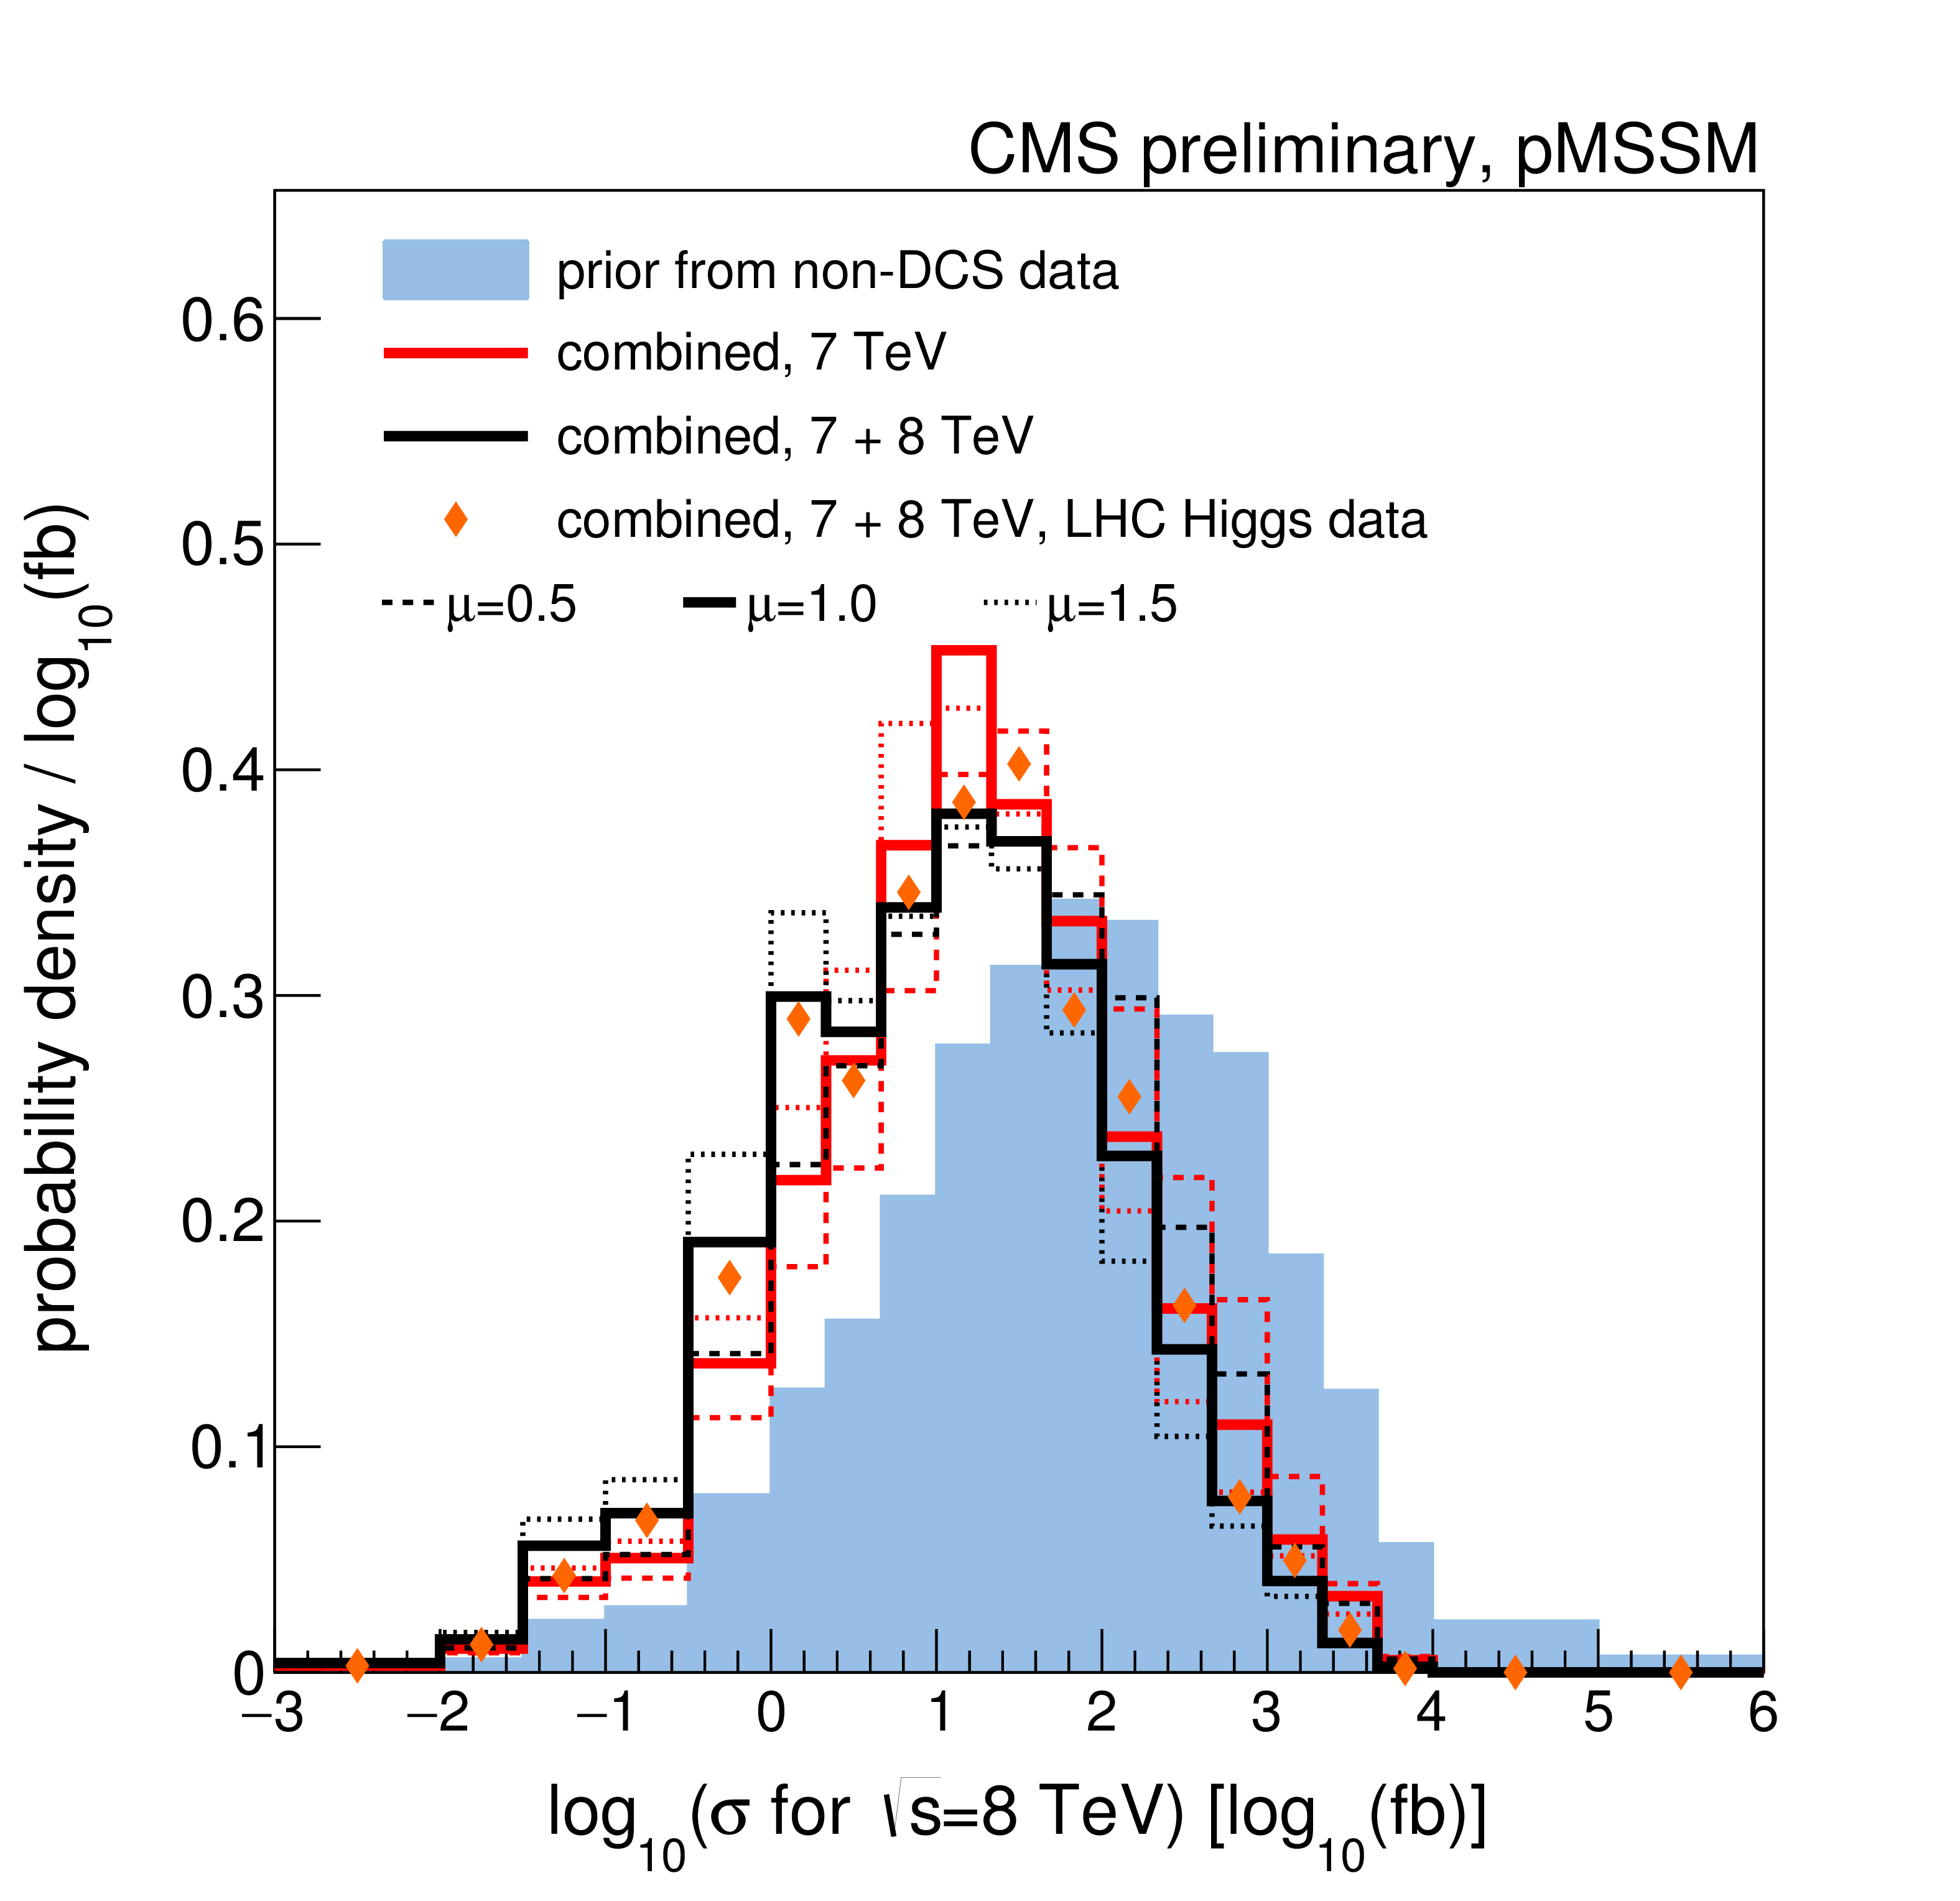
Figure 8-d:
A summary of the impact of CMS searches on our knowledge of the the logarithm of inclusive cross section for inclusive sparticle production in 8 TeV pp collisions, $\log_{10}$($\sigma$ for $\sqrt {s}=$ 8 TeV), in the pMSSM parameter space. Plots (a)-(d) compare the non-DCS prior distribution of the $\log_{10}$($\sigma$ for $\sqrt {s}=$ 8 TeV) to posterior distributions after data from various CMS searches, where (d) shows the combined effect of CMS searches and the Higgs boson results. Plot (e) shows survival probabilities as a function of the $\log_{10}$($\sigma$ for $\sqrt {s}=$ 8 TeV) for various combinations of CMS data and data from Higgs boson measurements. Plot (f) shows the distribution of the $\log_{10}$($\sigma$ for $\sqrt {s}=$ 8 TeV) versus the $Z$-significance calculated from the combination of all searches. See Fig.2 for a description of the shading. |
png ; pdf |
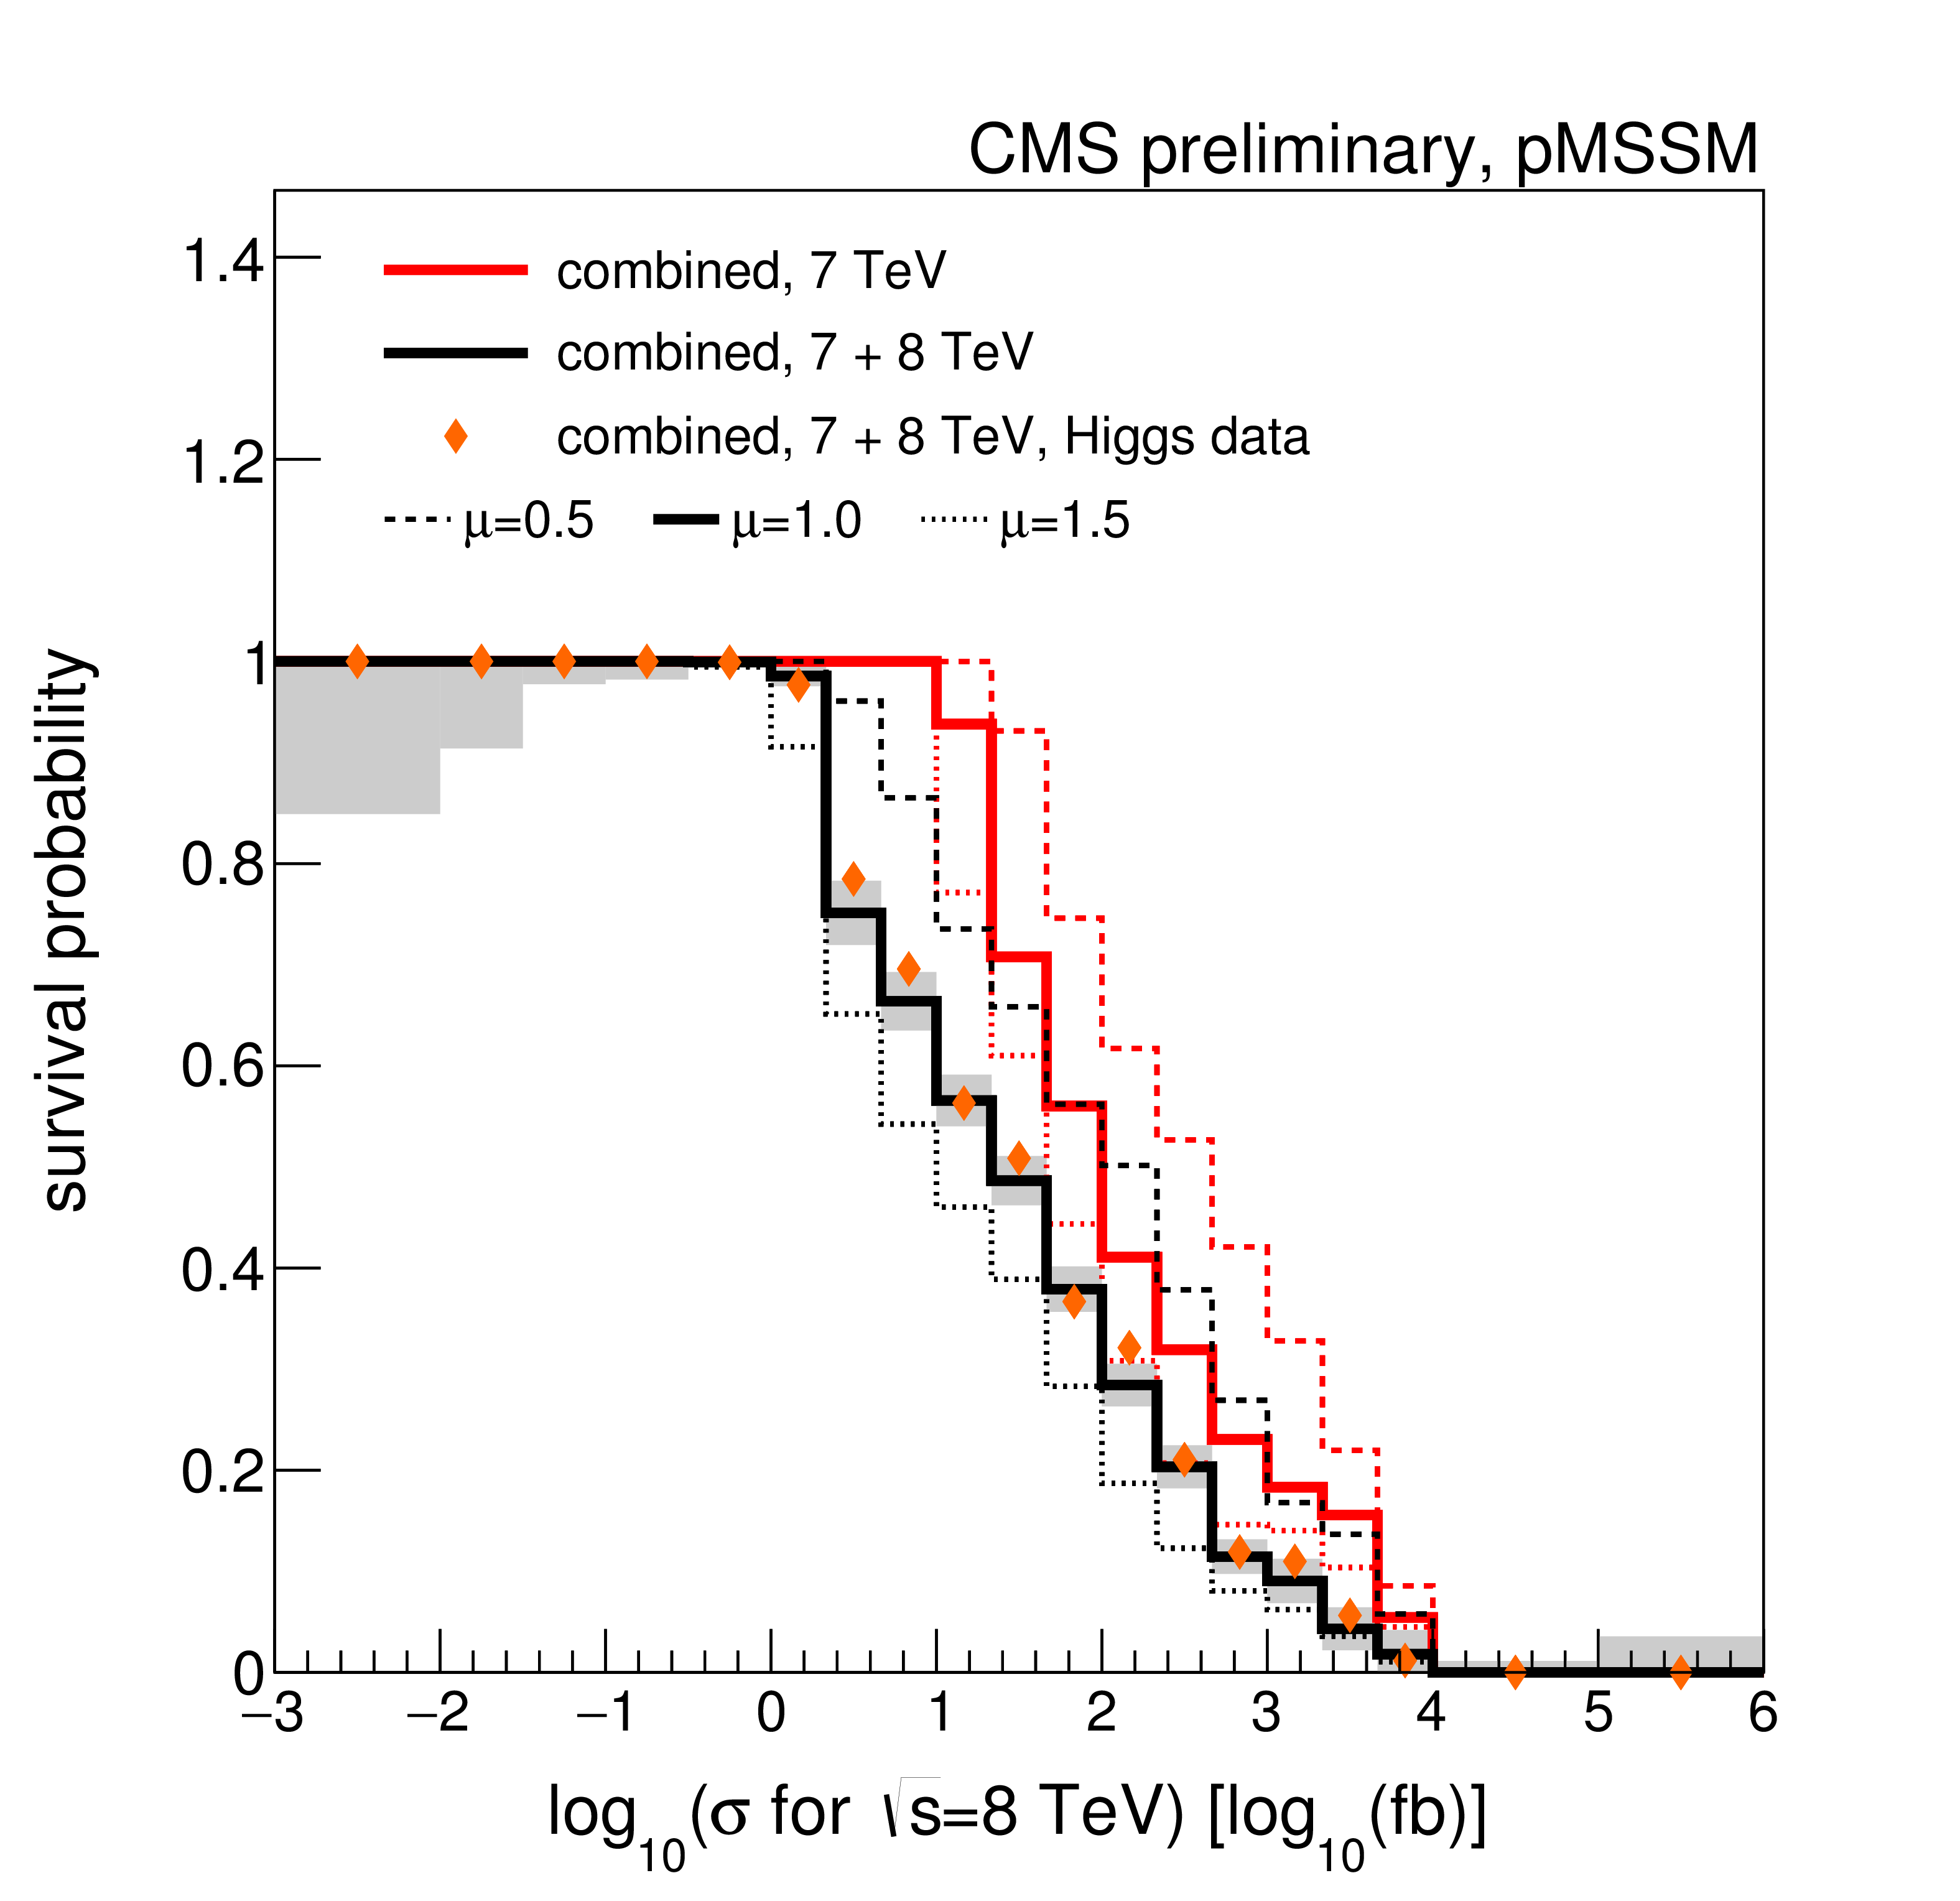
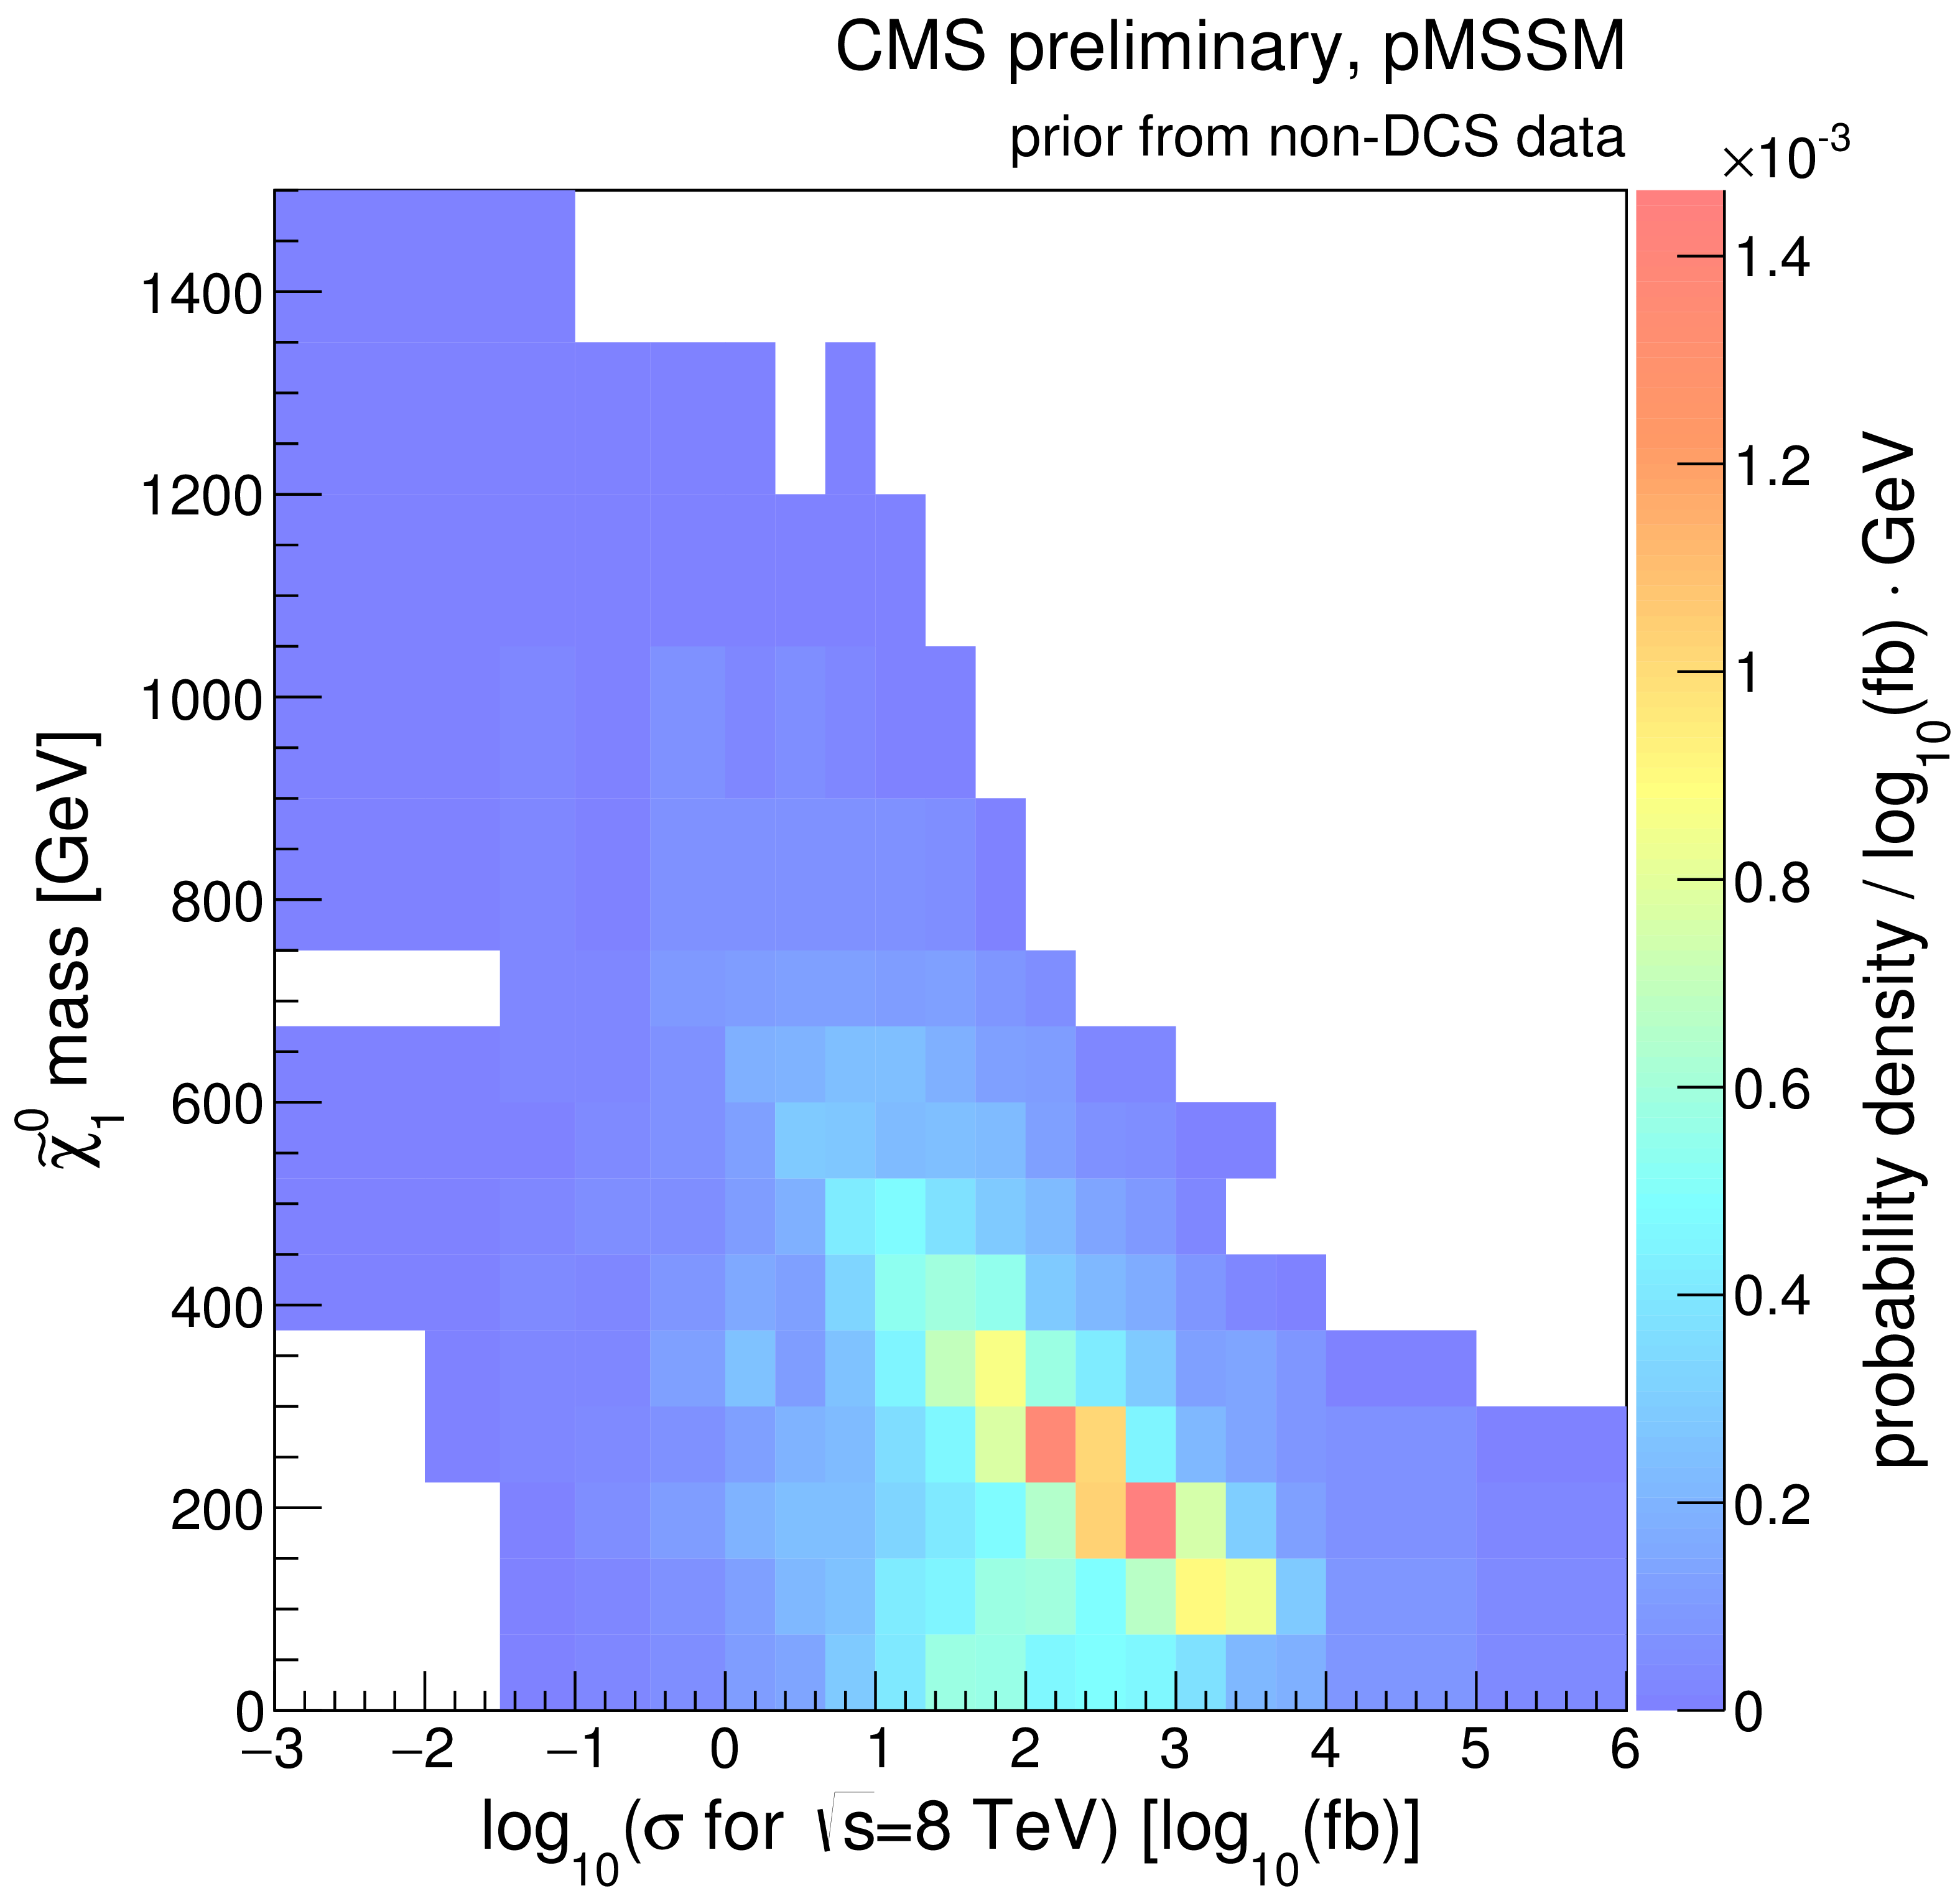
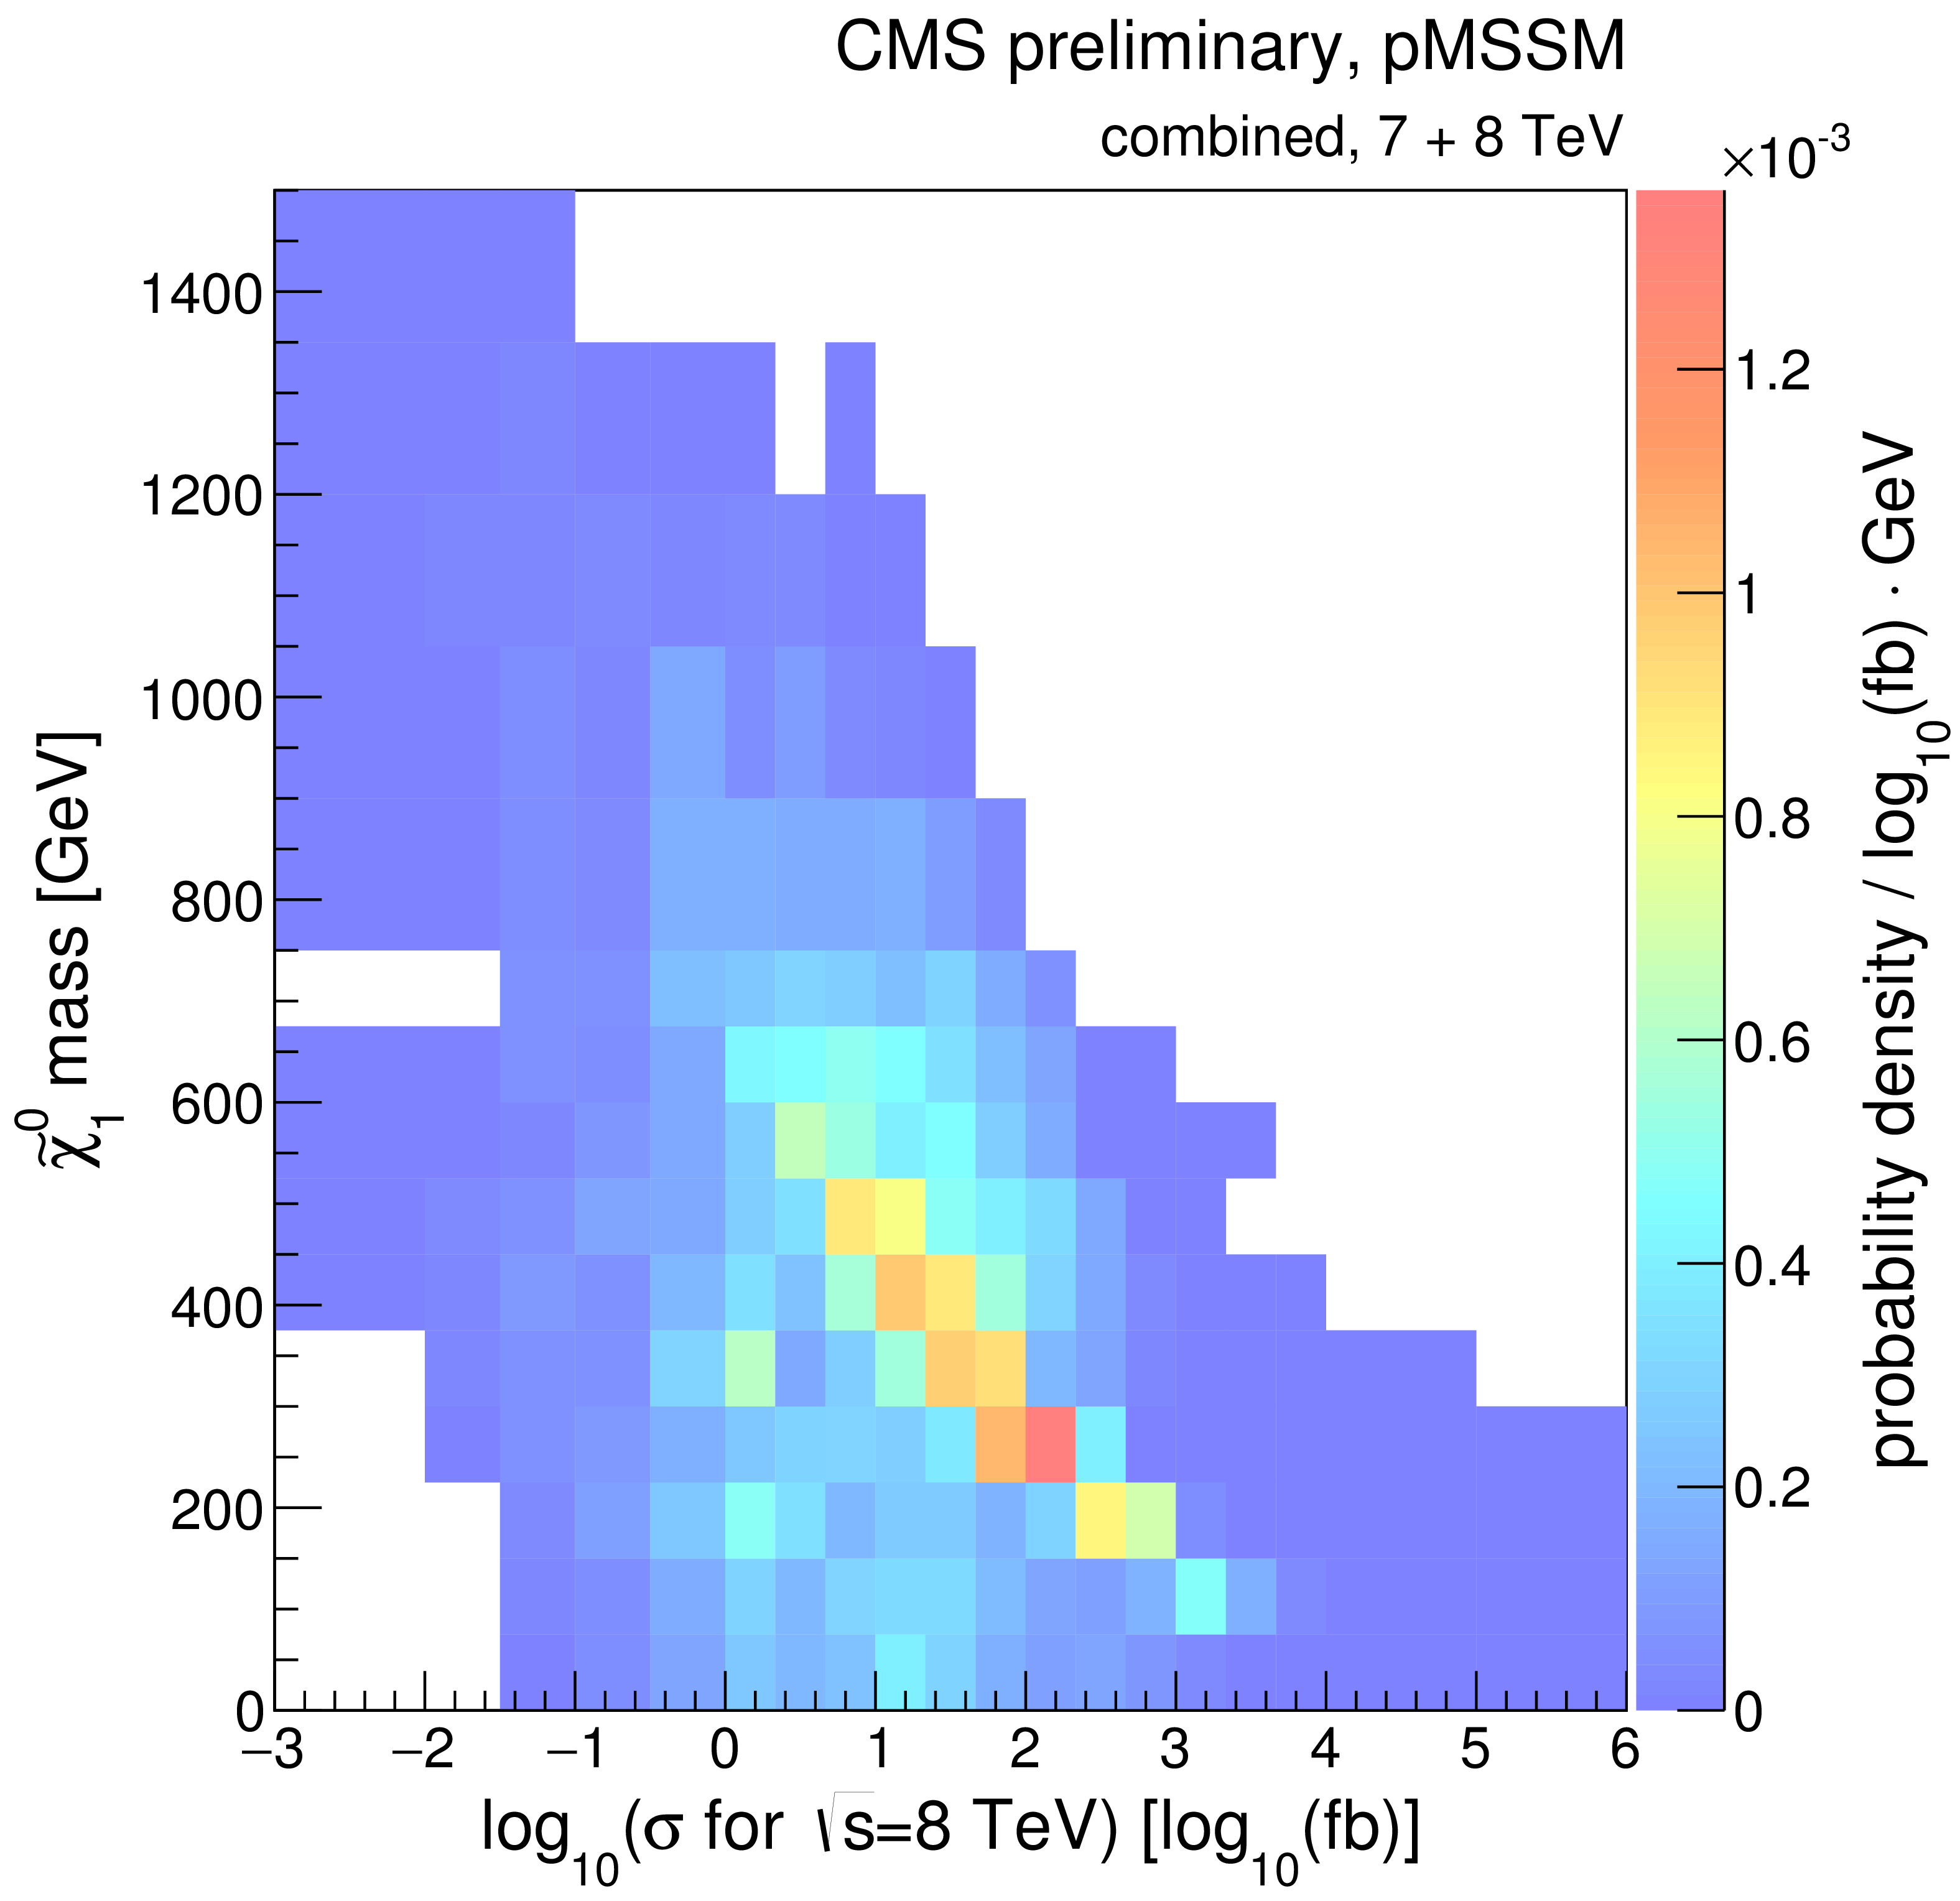
Figure 8-e:
A summary of the impact of CMS searches on our knowledge of the the logarithm of inclusive cross section for inclusive sparticle production in 8 TeV pp collisions, $\log_{10}$($\sigma$ for $\sqrt {s}=$ 8 TeV), in the pMSSM parameter space. Plots (a)-(d) compare the non-DCS prior distribution of the $\log_{10}$($\sigma$ for $\sqrt {s}=$ 8 TeV) to posterior distributions after data from various CMS searches, where (d) shows the combined effect of CMS searches and the Higgs boson results. Plot (e) shows survival probabilities as a function of the $\log_{10}$($\sigma$ for $\sqrt {s}=$ 8 TeV) for various combinations of CMS data and data from Higgs boson measurements. Plot (f) shows the distribution of the $\log_{10}$($\sigma$ for $\sqrt {s}=$ 8 TeV) versus the $Z$-significance calculated from the combination of all searches. See Fig.2 for a description of the shading. |
png ; pdf |
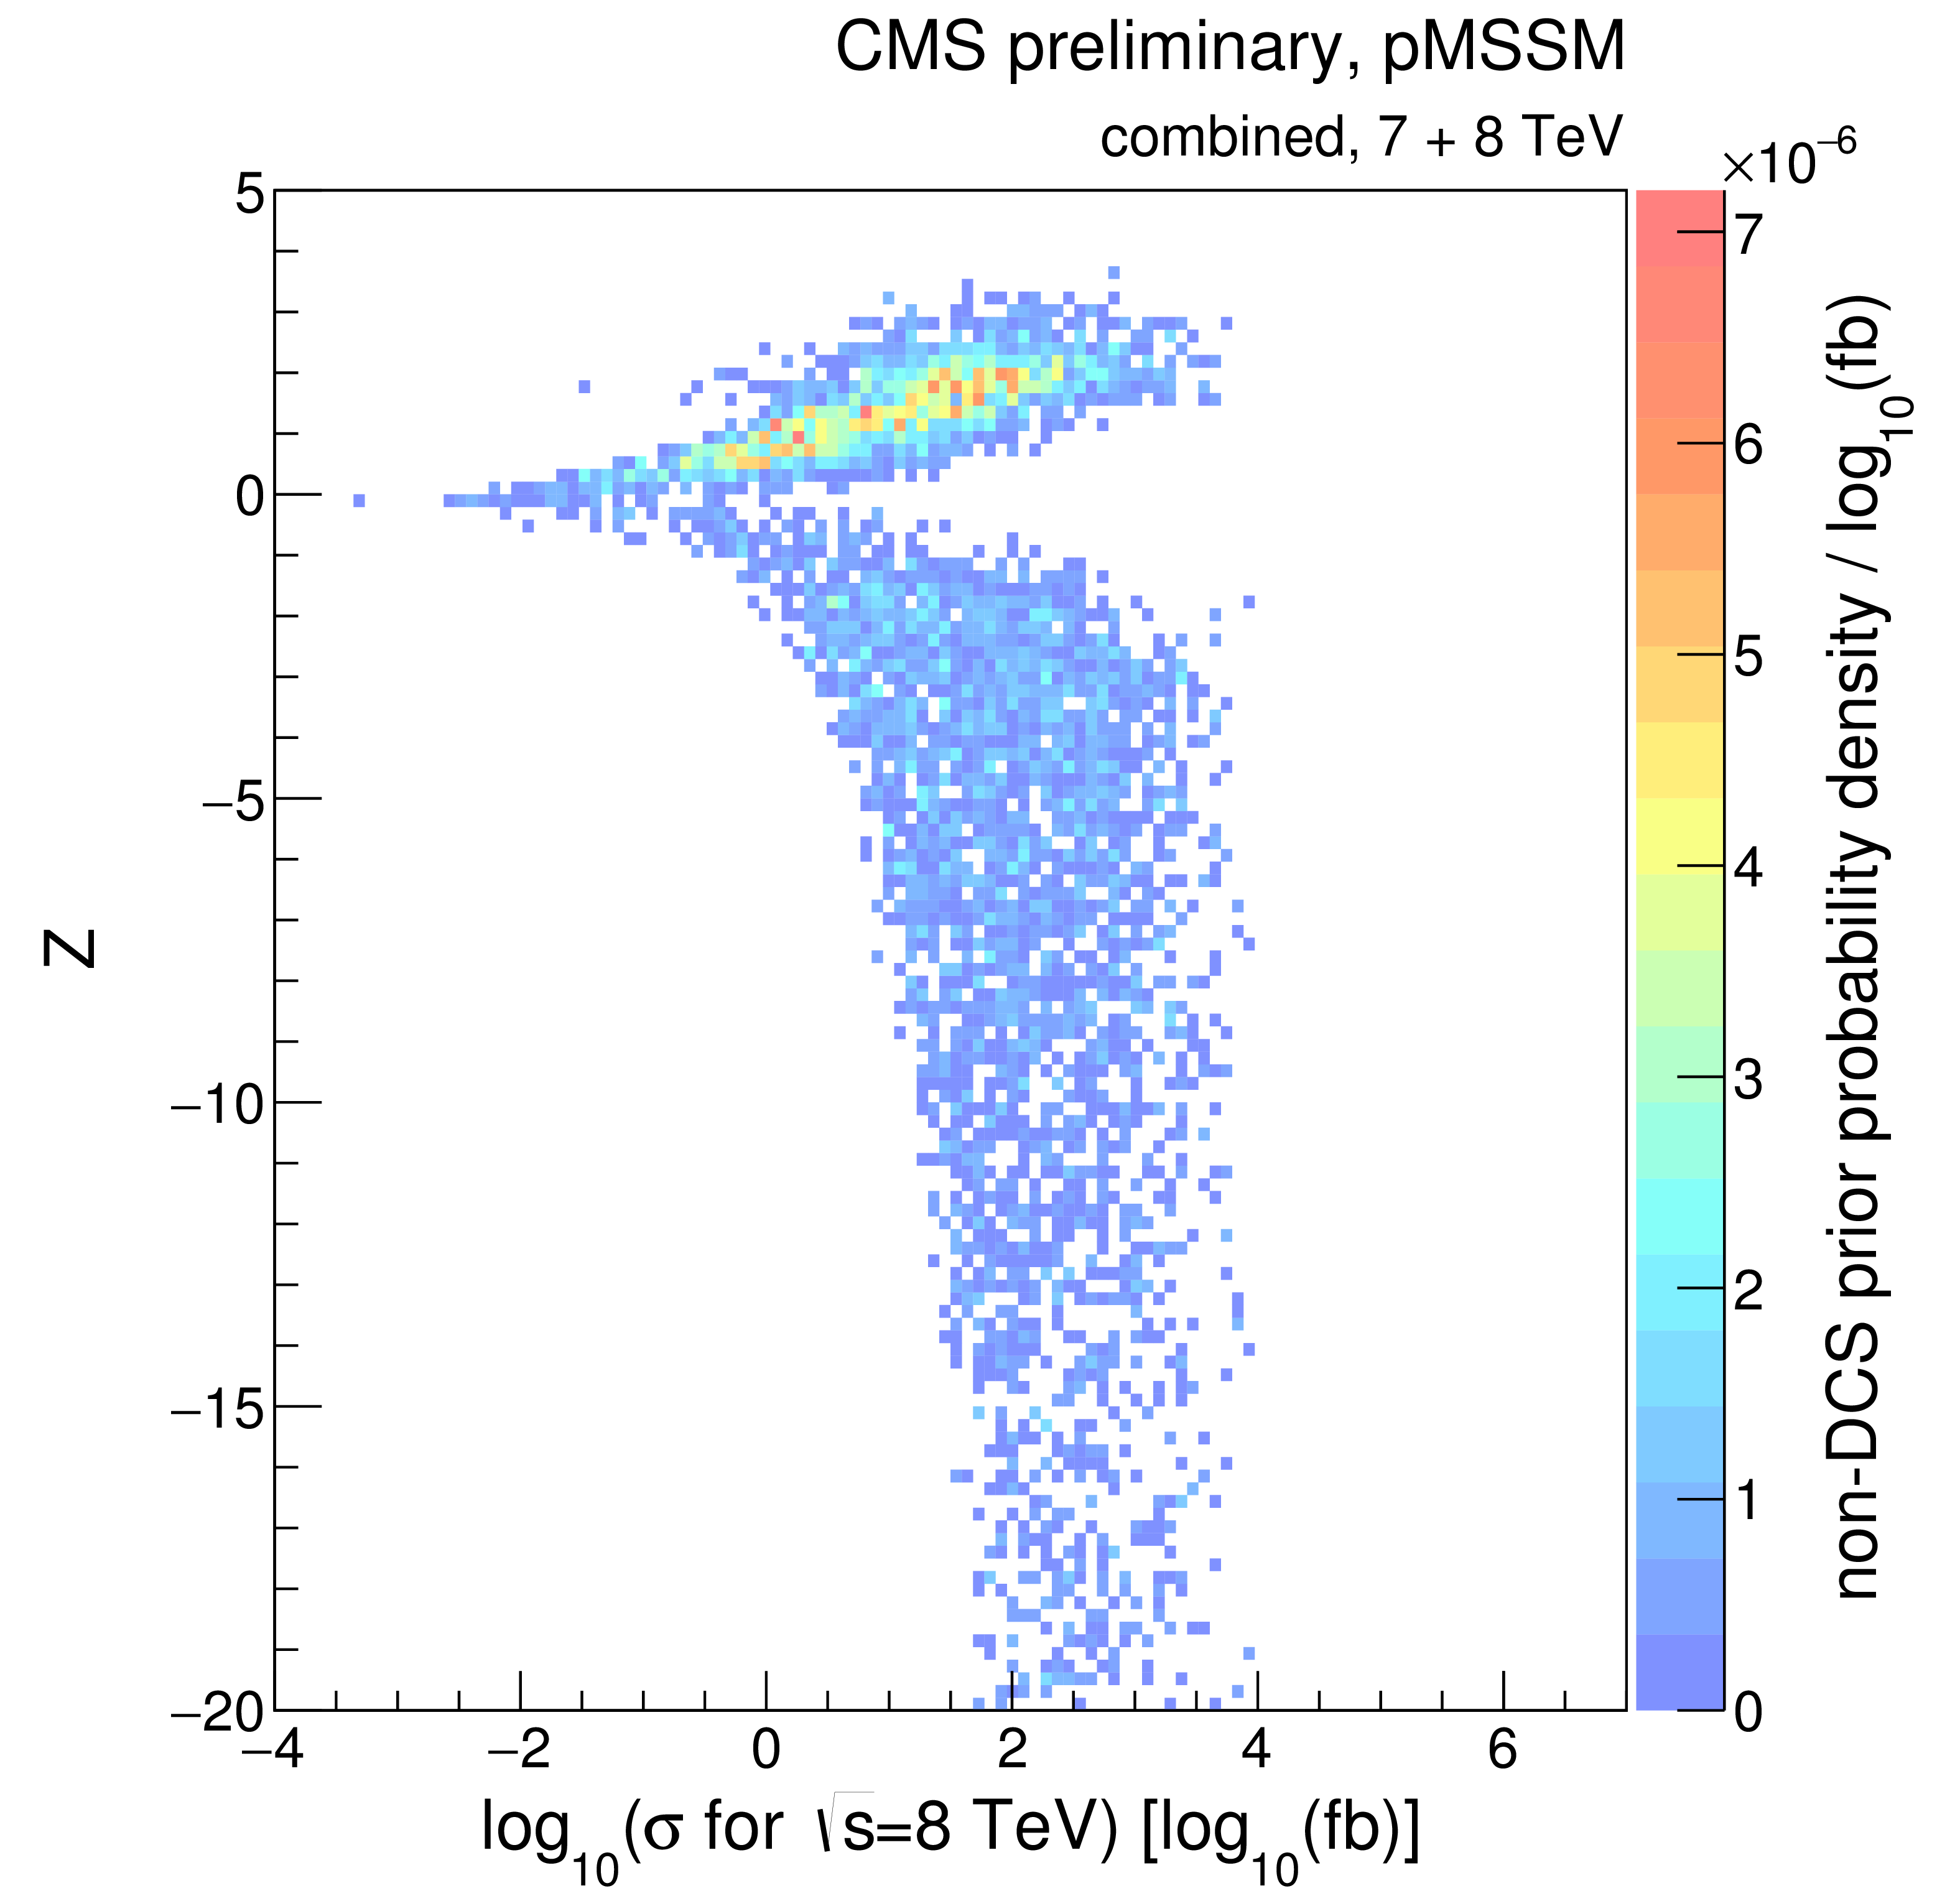
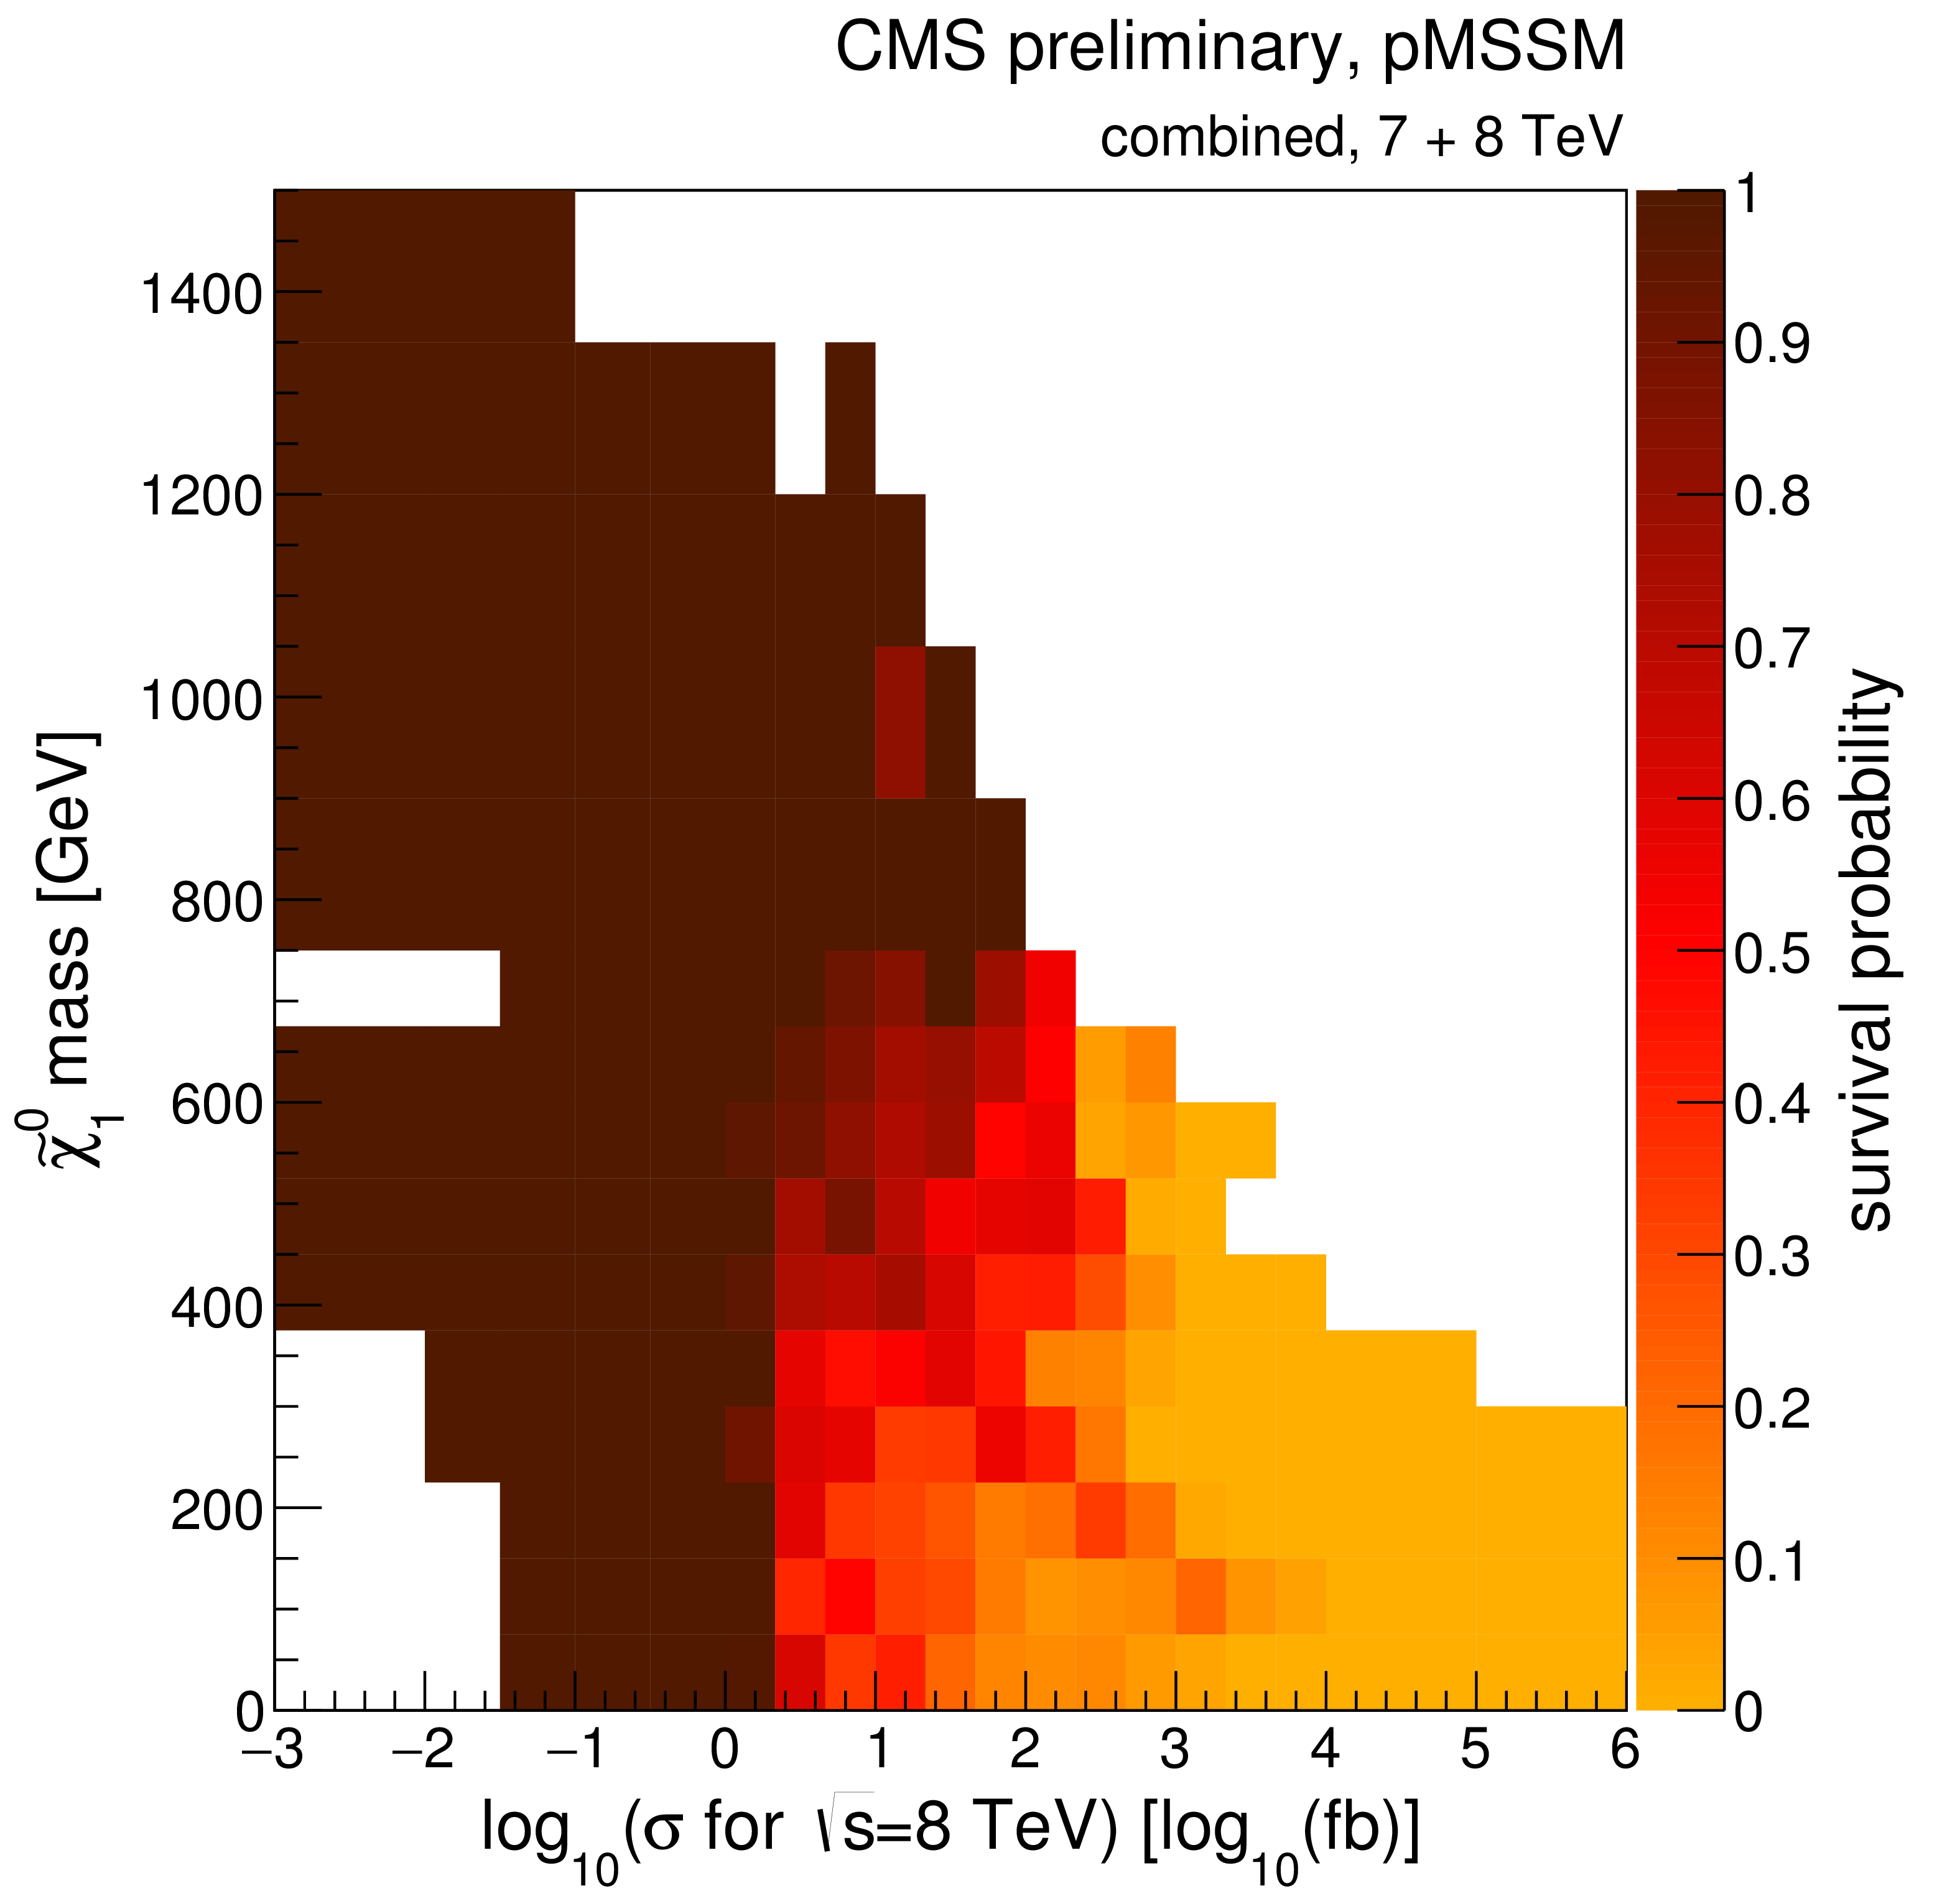
Figure 8-f:
A summary of the impact of CMS searches on our knowledge of the the logarithm of inclusive cross section for inclusive sparticle production in 8 TeV pp collisions, $\log_{10}$($\sigma$ for $\sqrt {s}=$ 8 TeV), in the pMSSM parameter space. Plots (a)-(d) compare the non-DCS prior distribution of the $\log_{10}$($\sigma$ for $\sqrt {s}=$ 8 TeV) to posterior distributions after data from various CMS searches, where (d) shows the combined effect of CMS searches and the Higgs boson results. Plot (e) shows survival probabilities as a function of the $\log_{10}$($\sigma$ for $\sqrt {s}=$ 8 TeV) for various combinations of CMS data and data from Higgs boson measurements. Plot (f) shows the distribution of the $\log_{10}$($\sigma$ for $\sqrt {s}=$ 8 TeV) versus the $Z$-significance calculated from the combination of all searches. See Fig.2 for a description of the shading. |
png ; pdf |
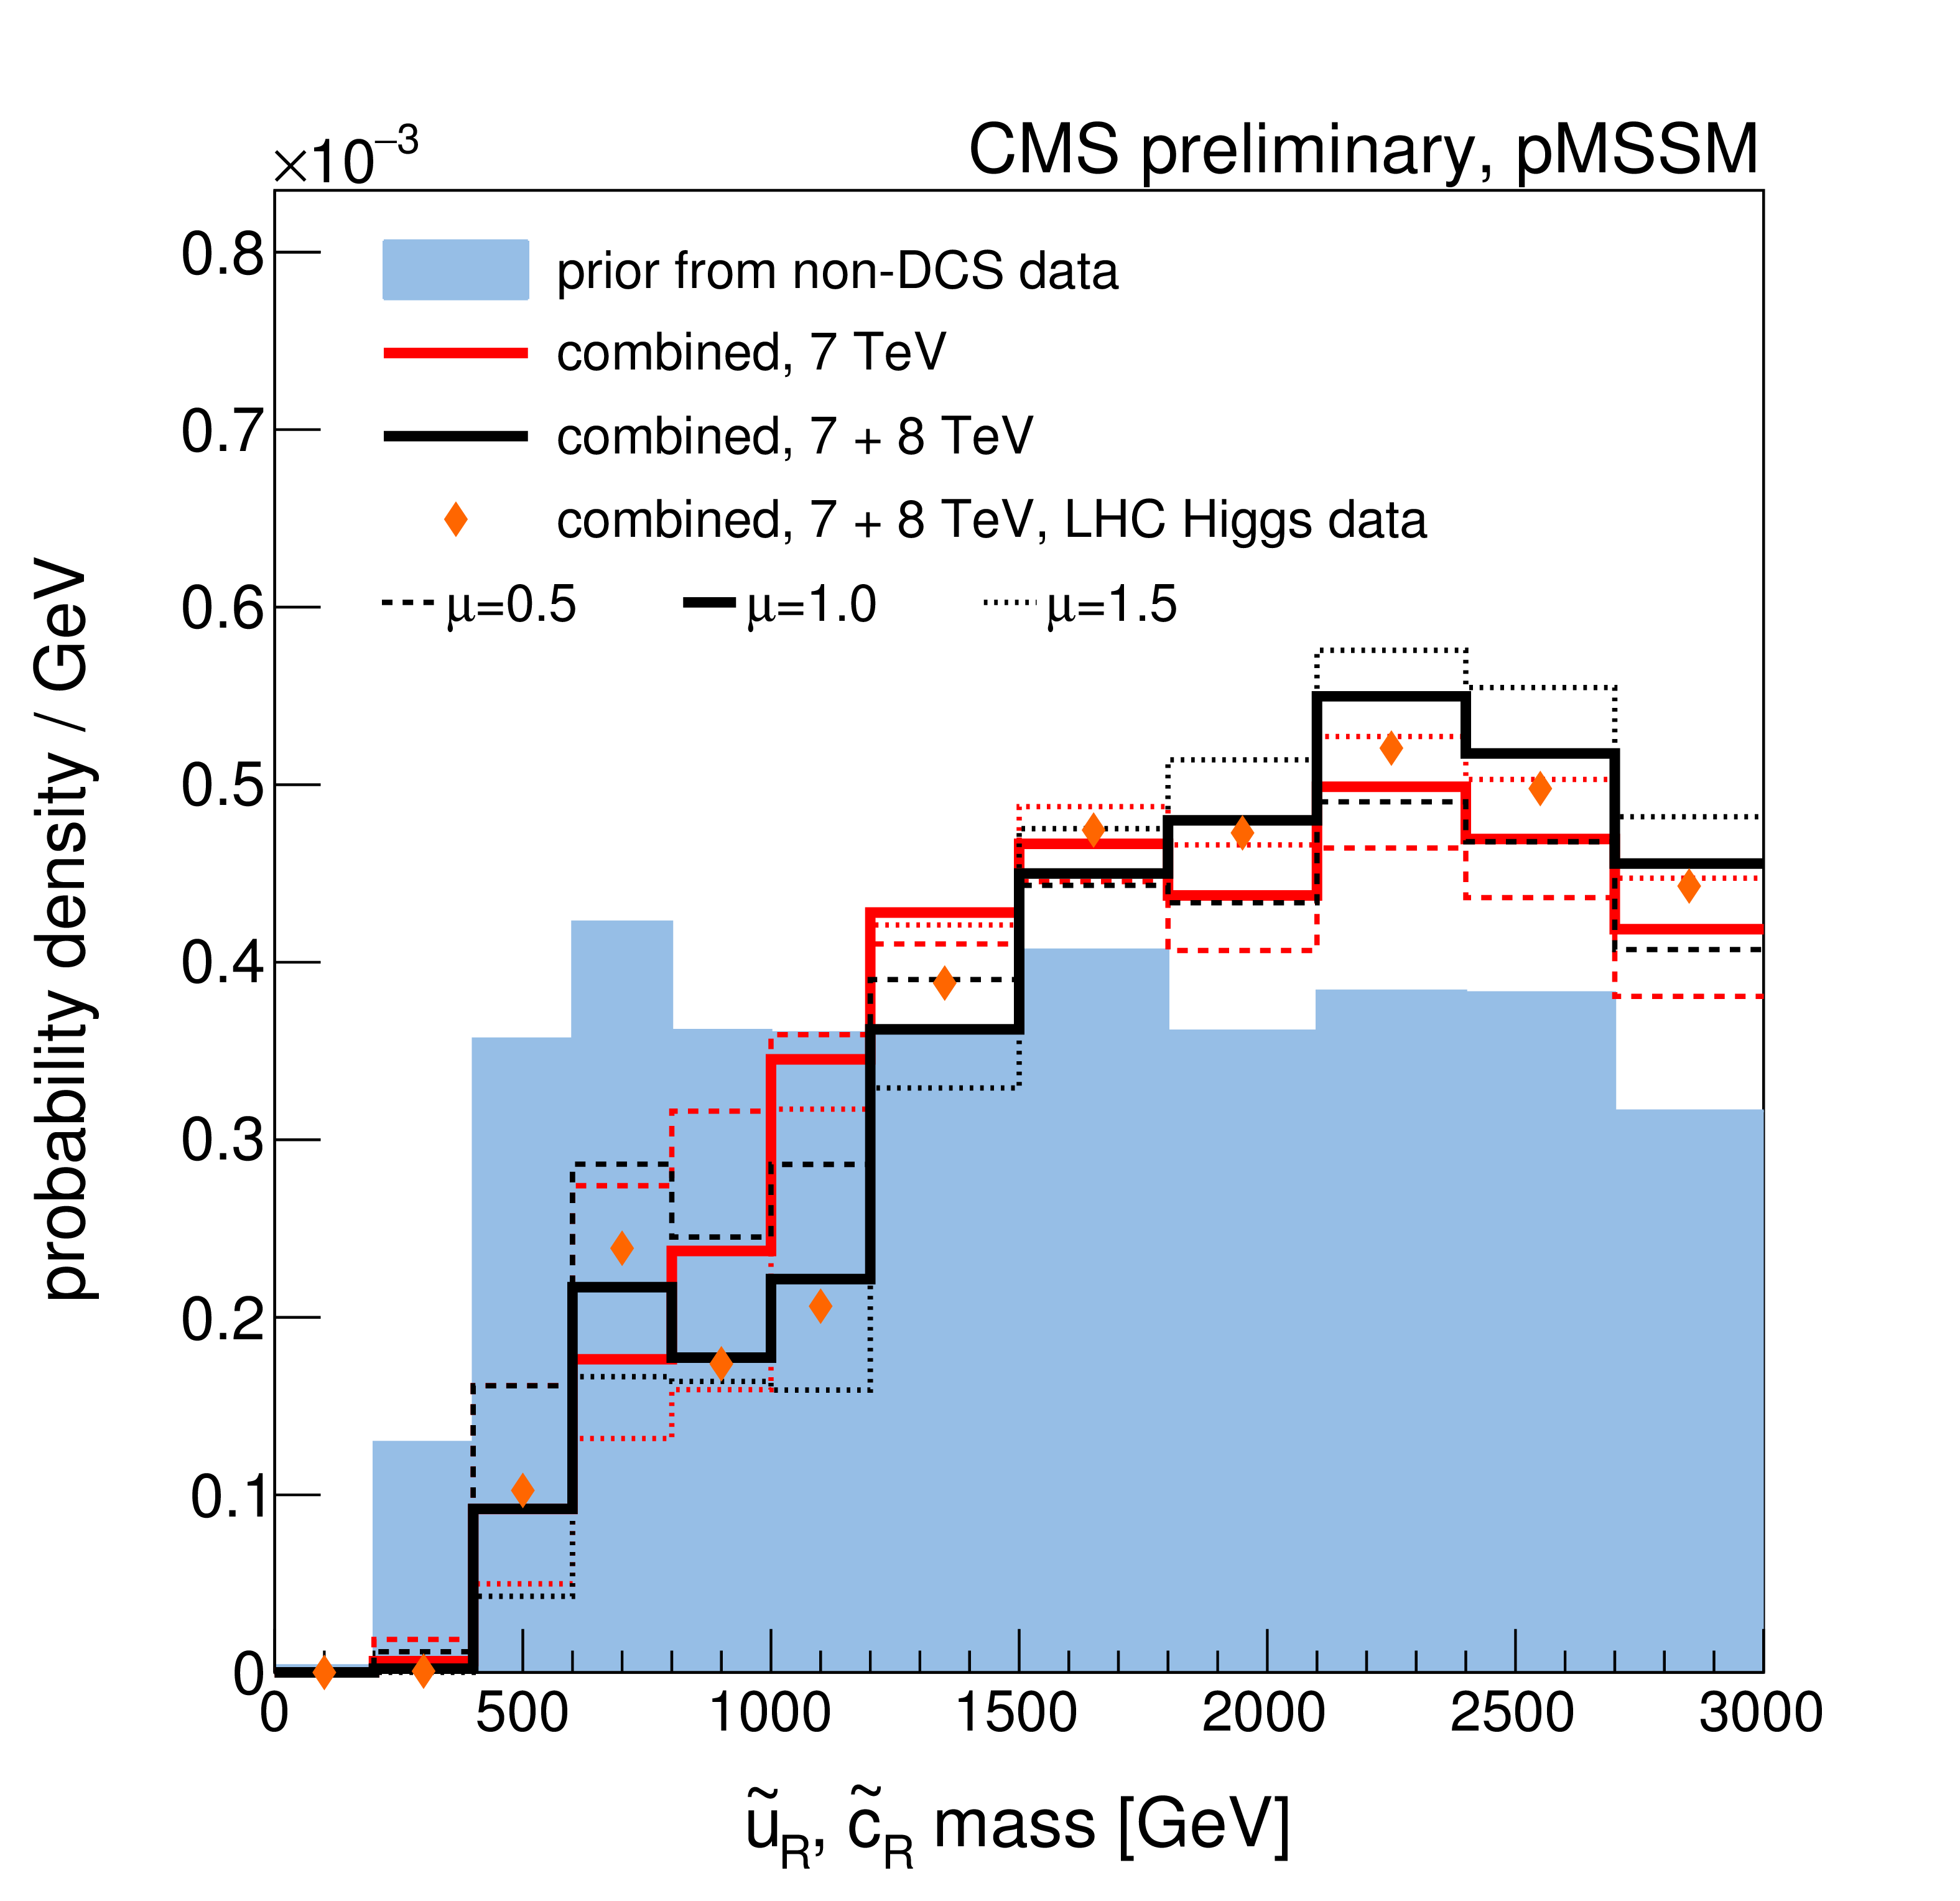
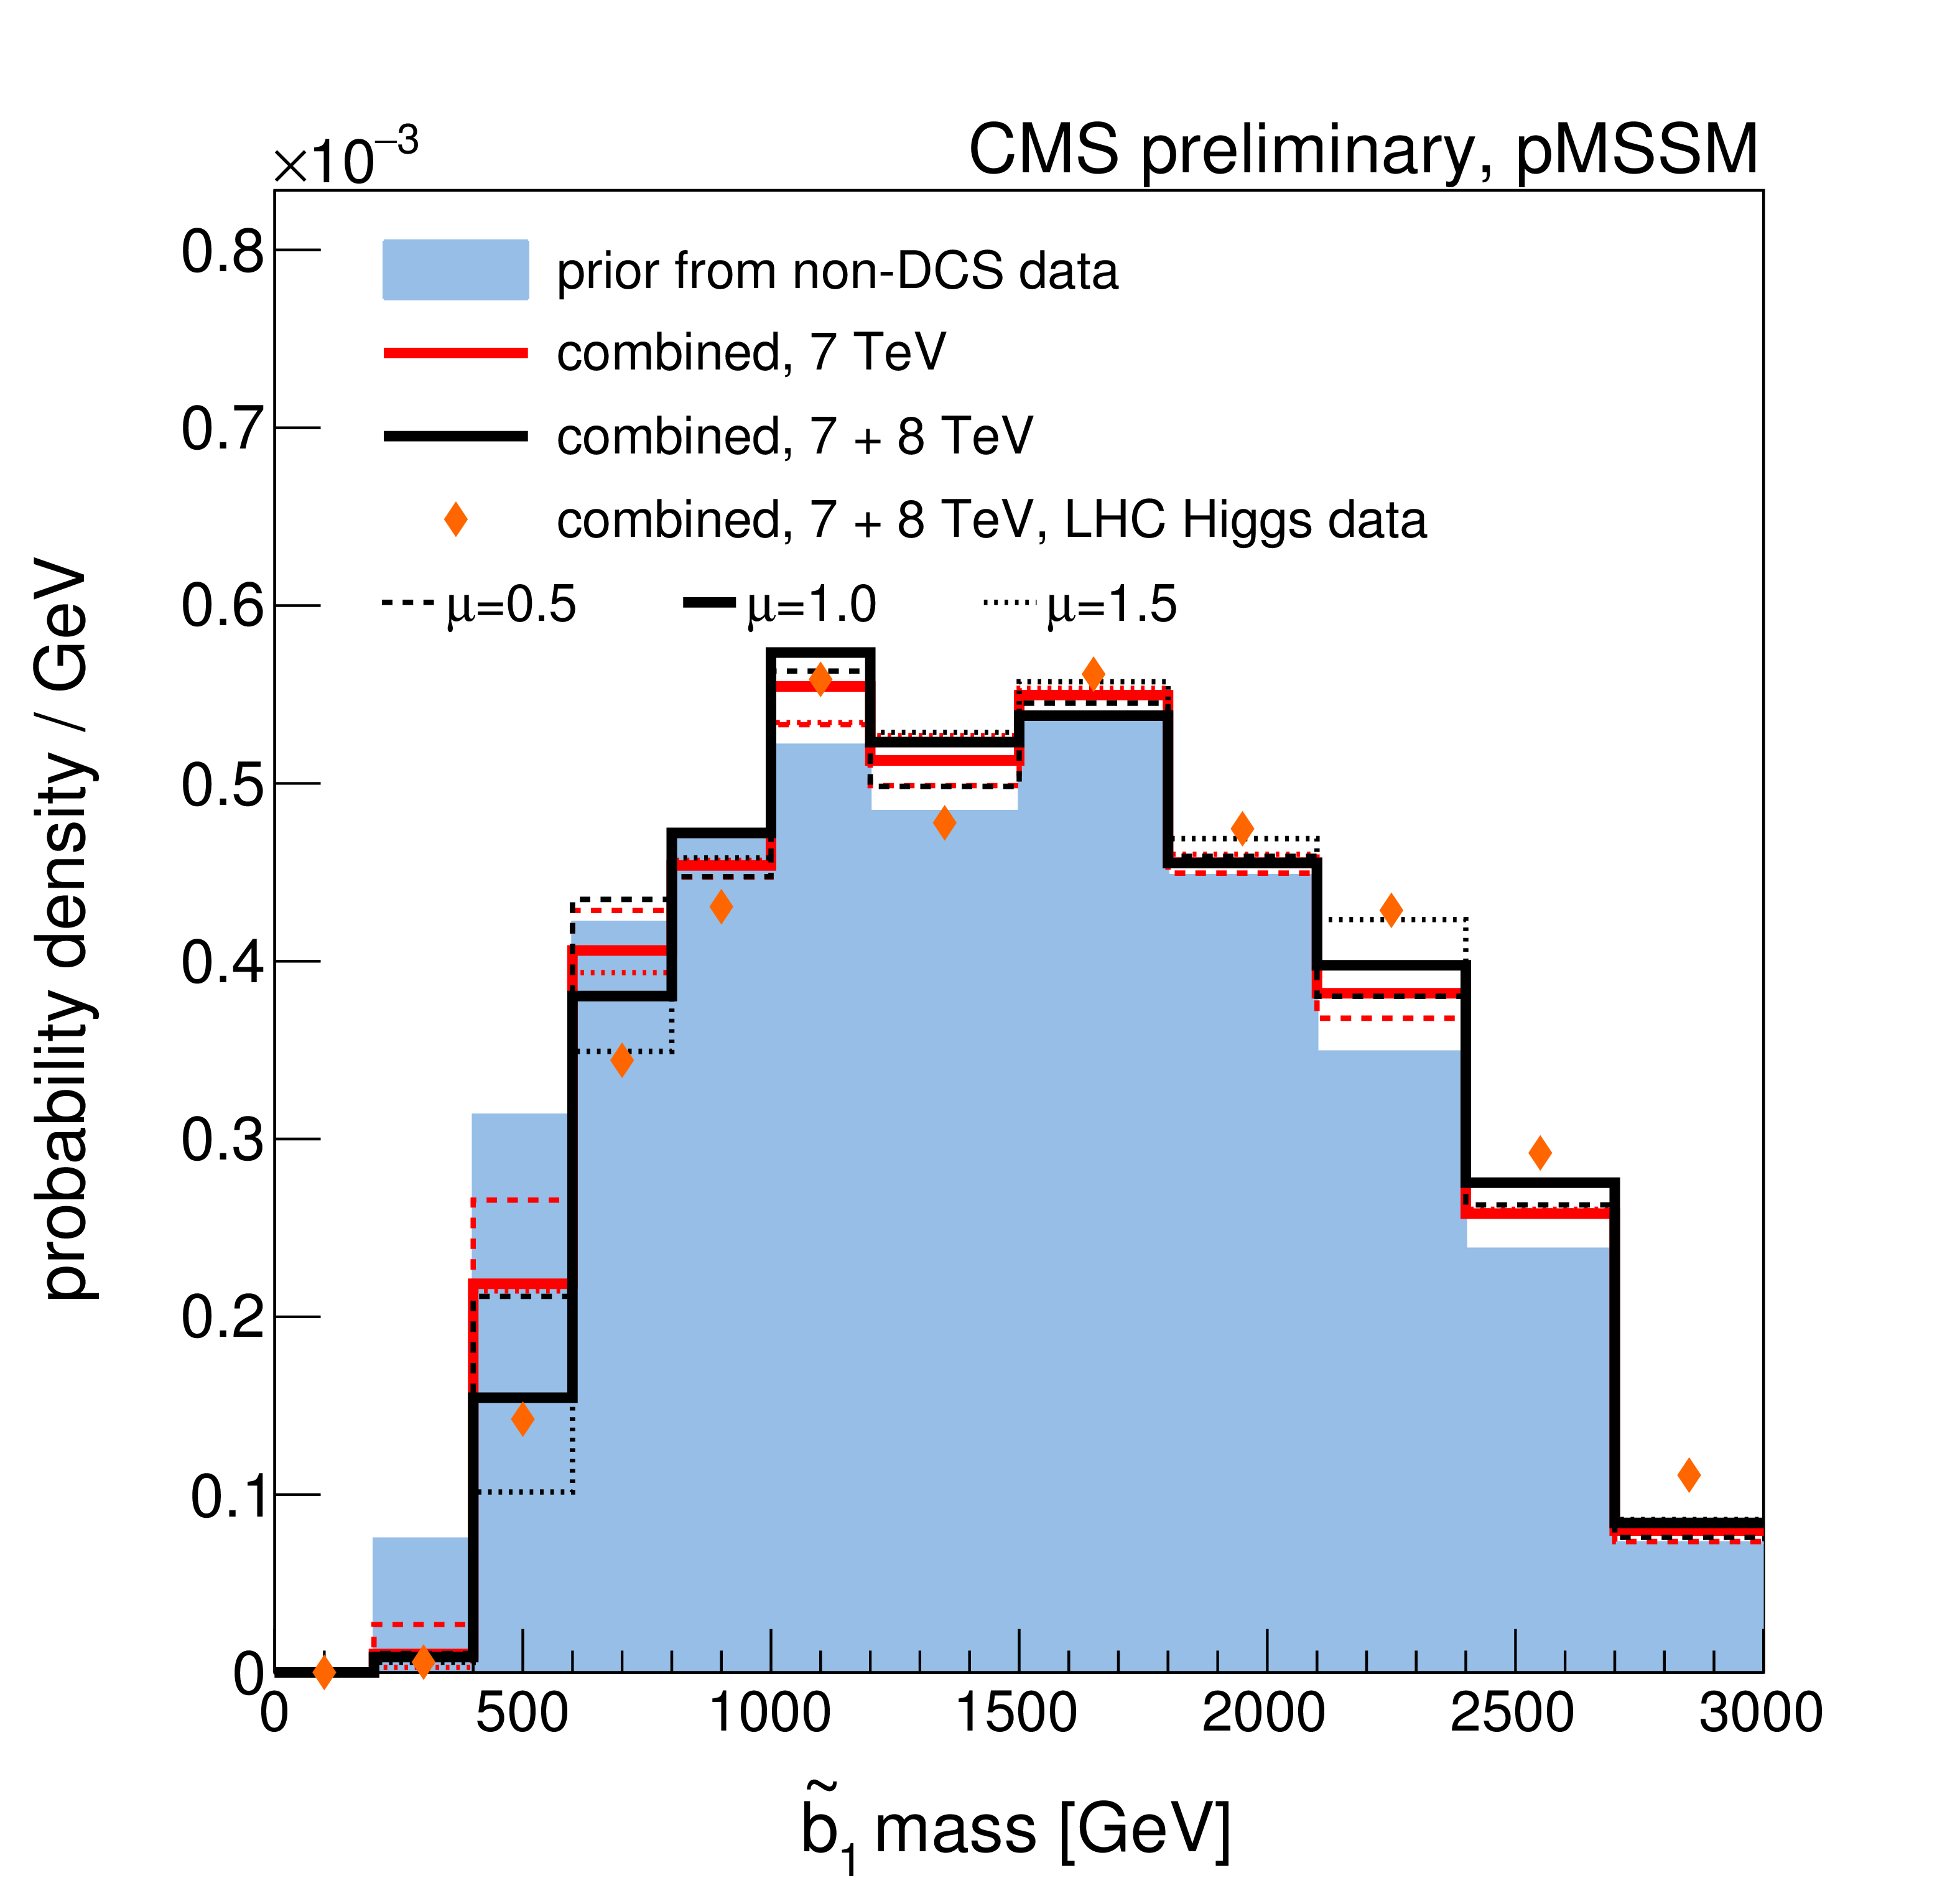
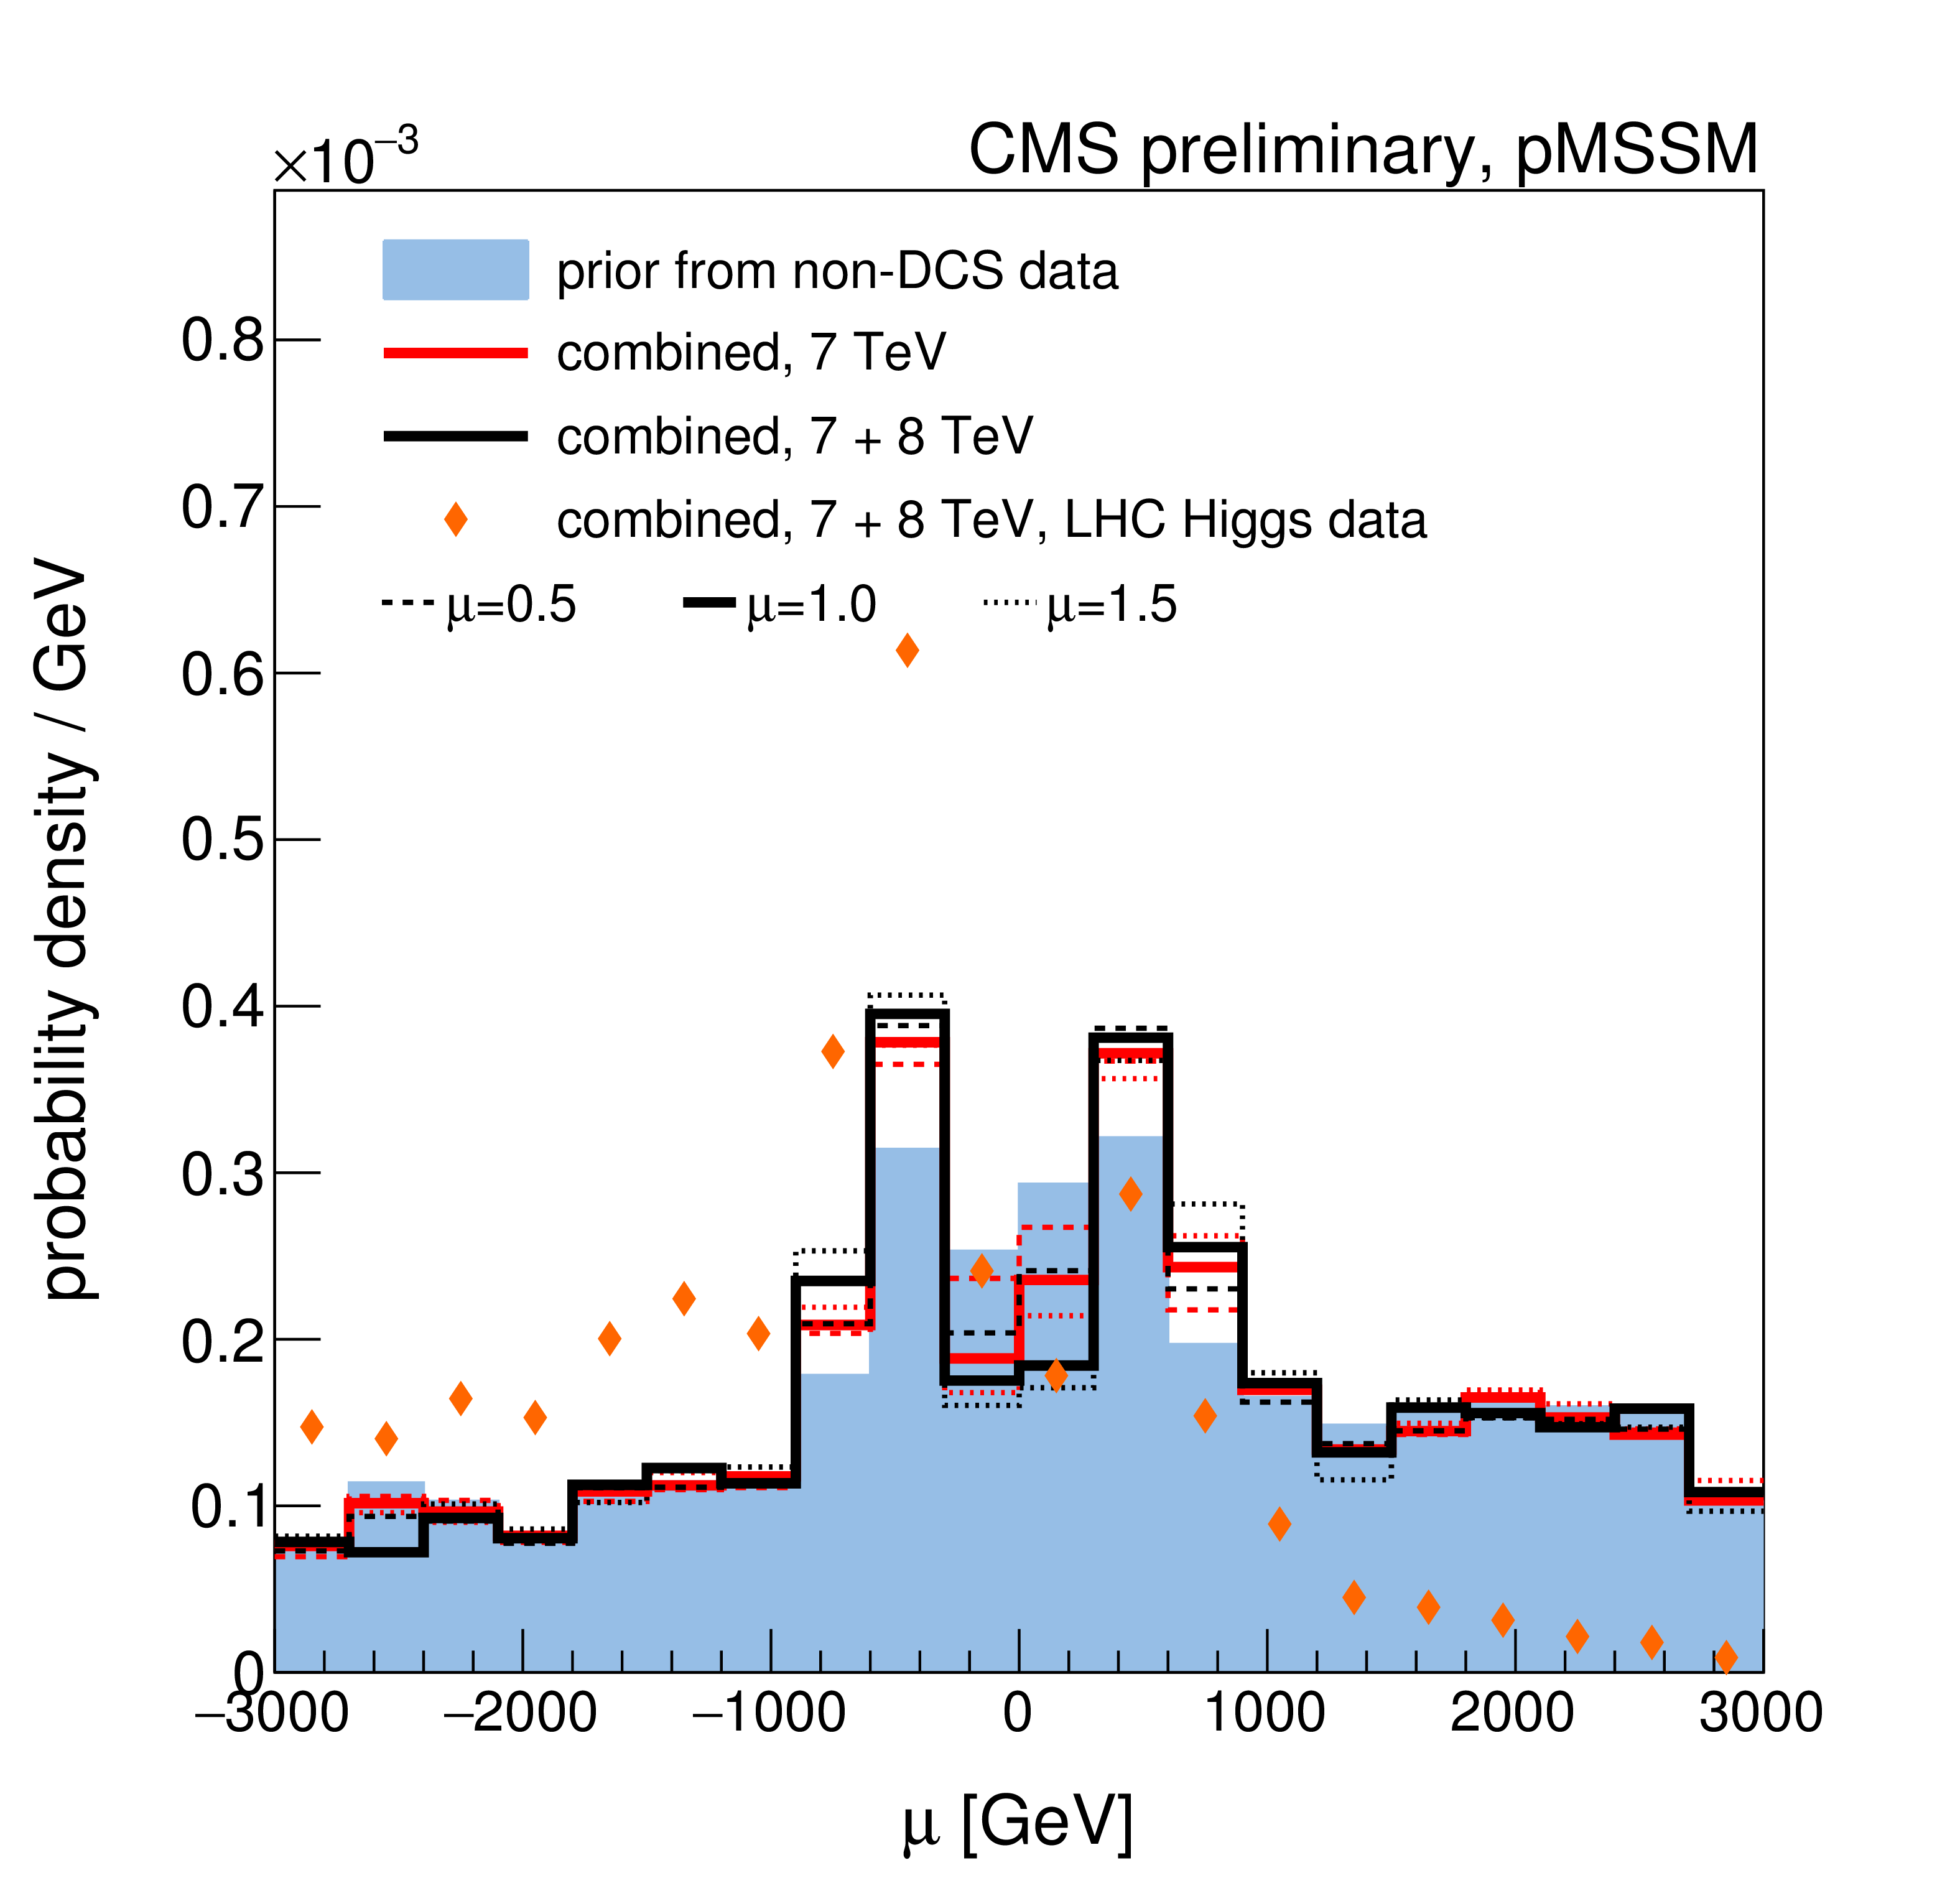
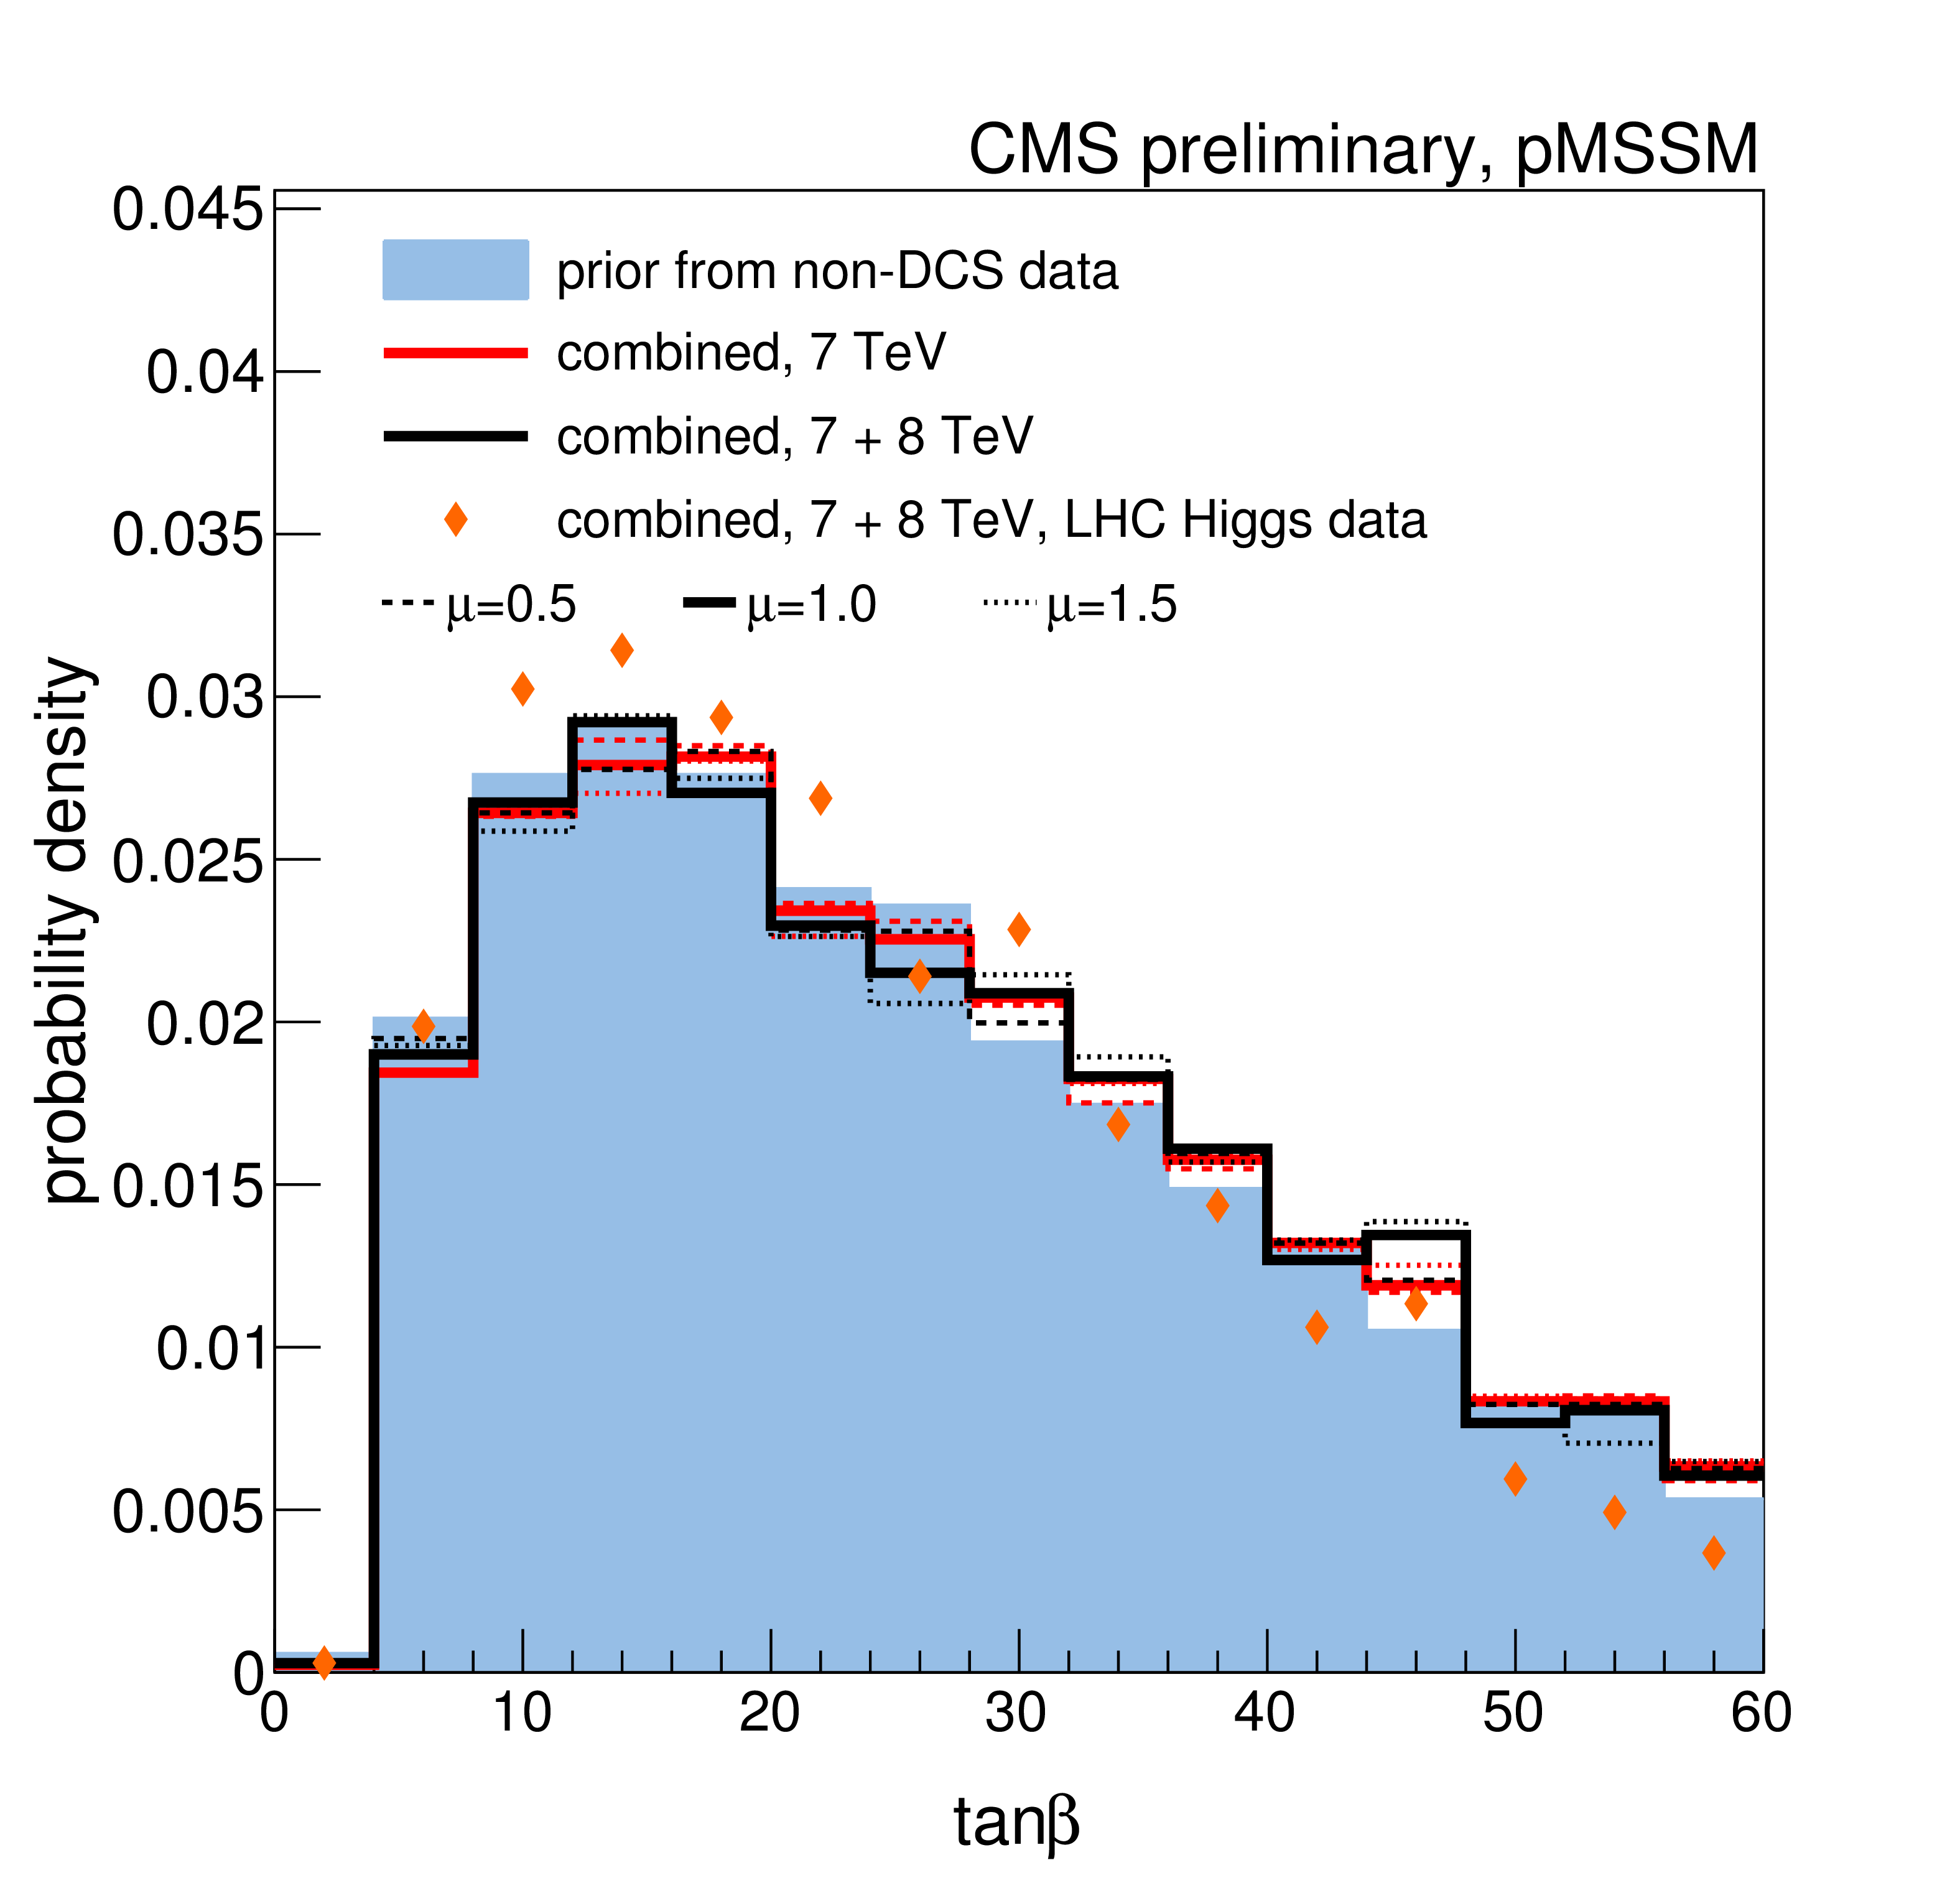
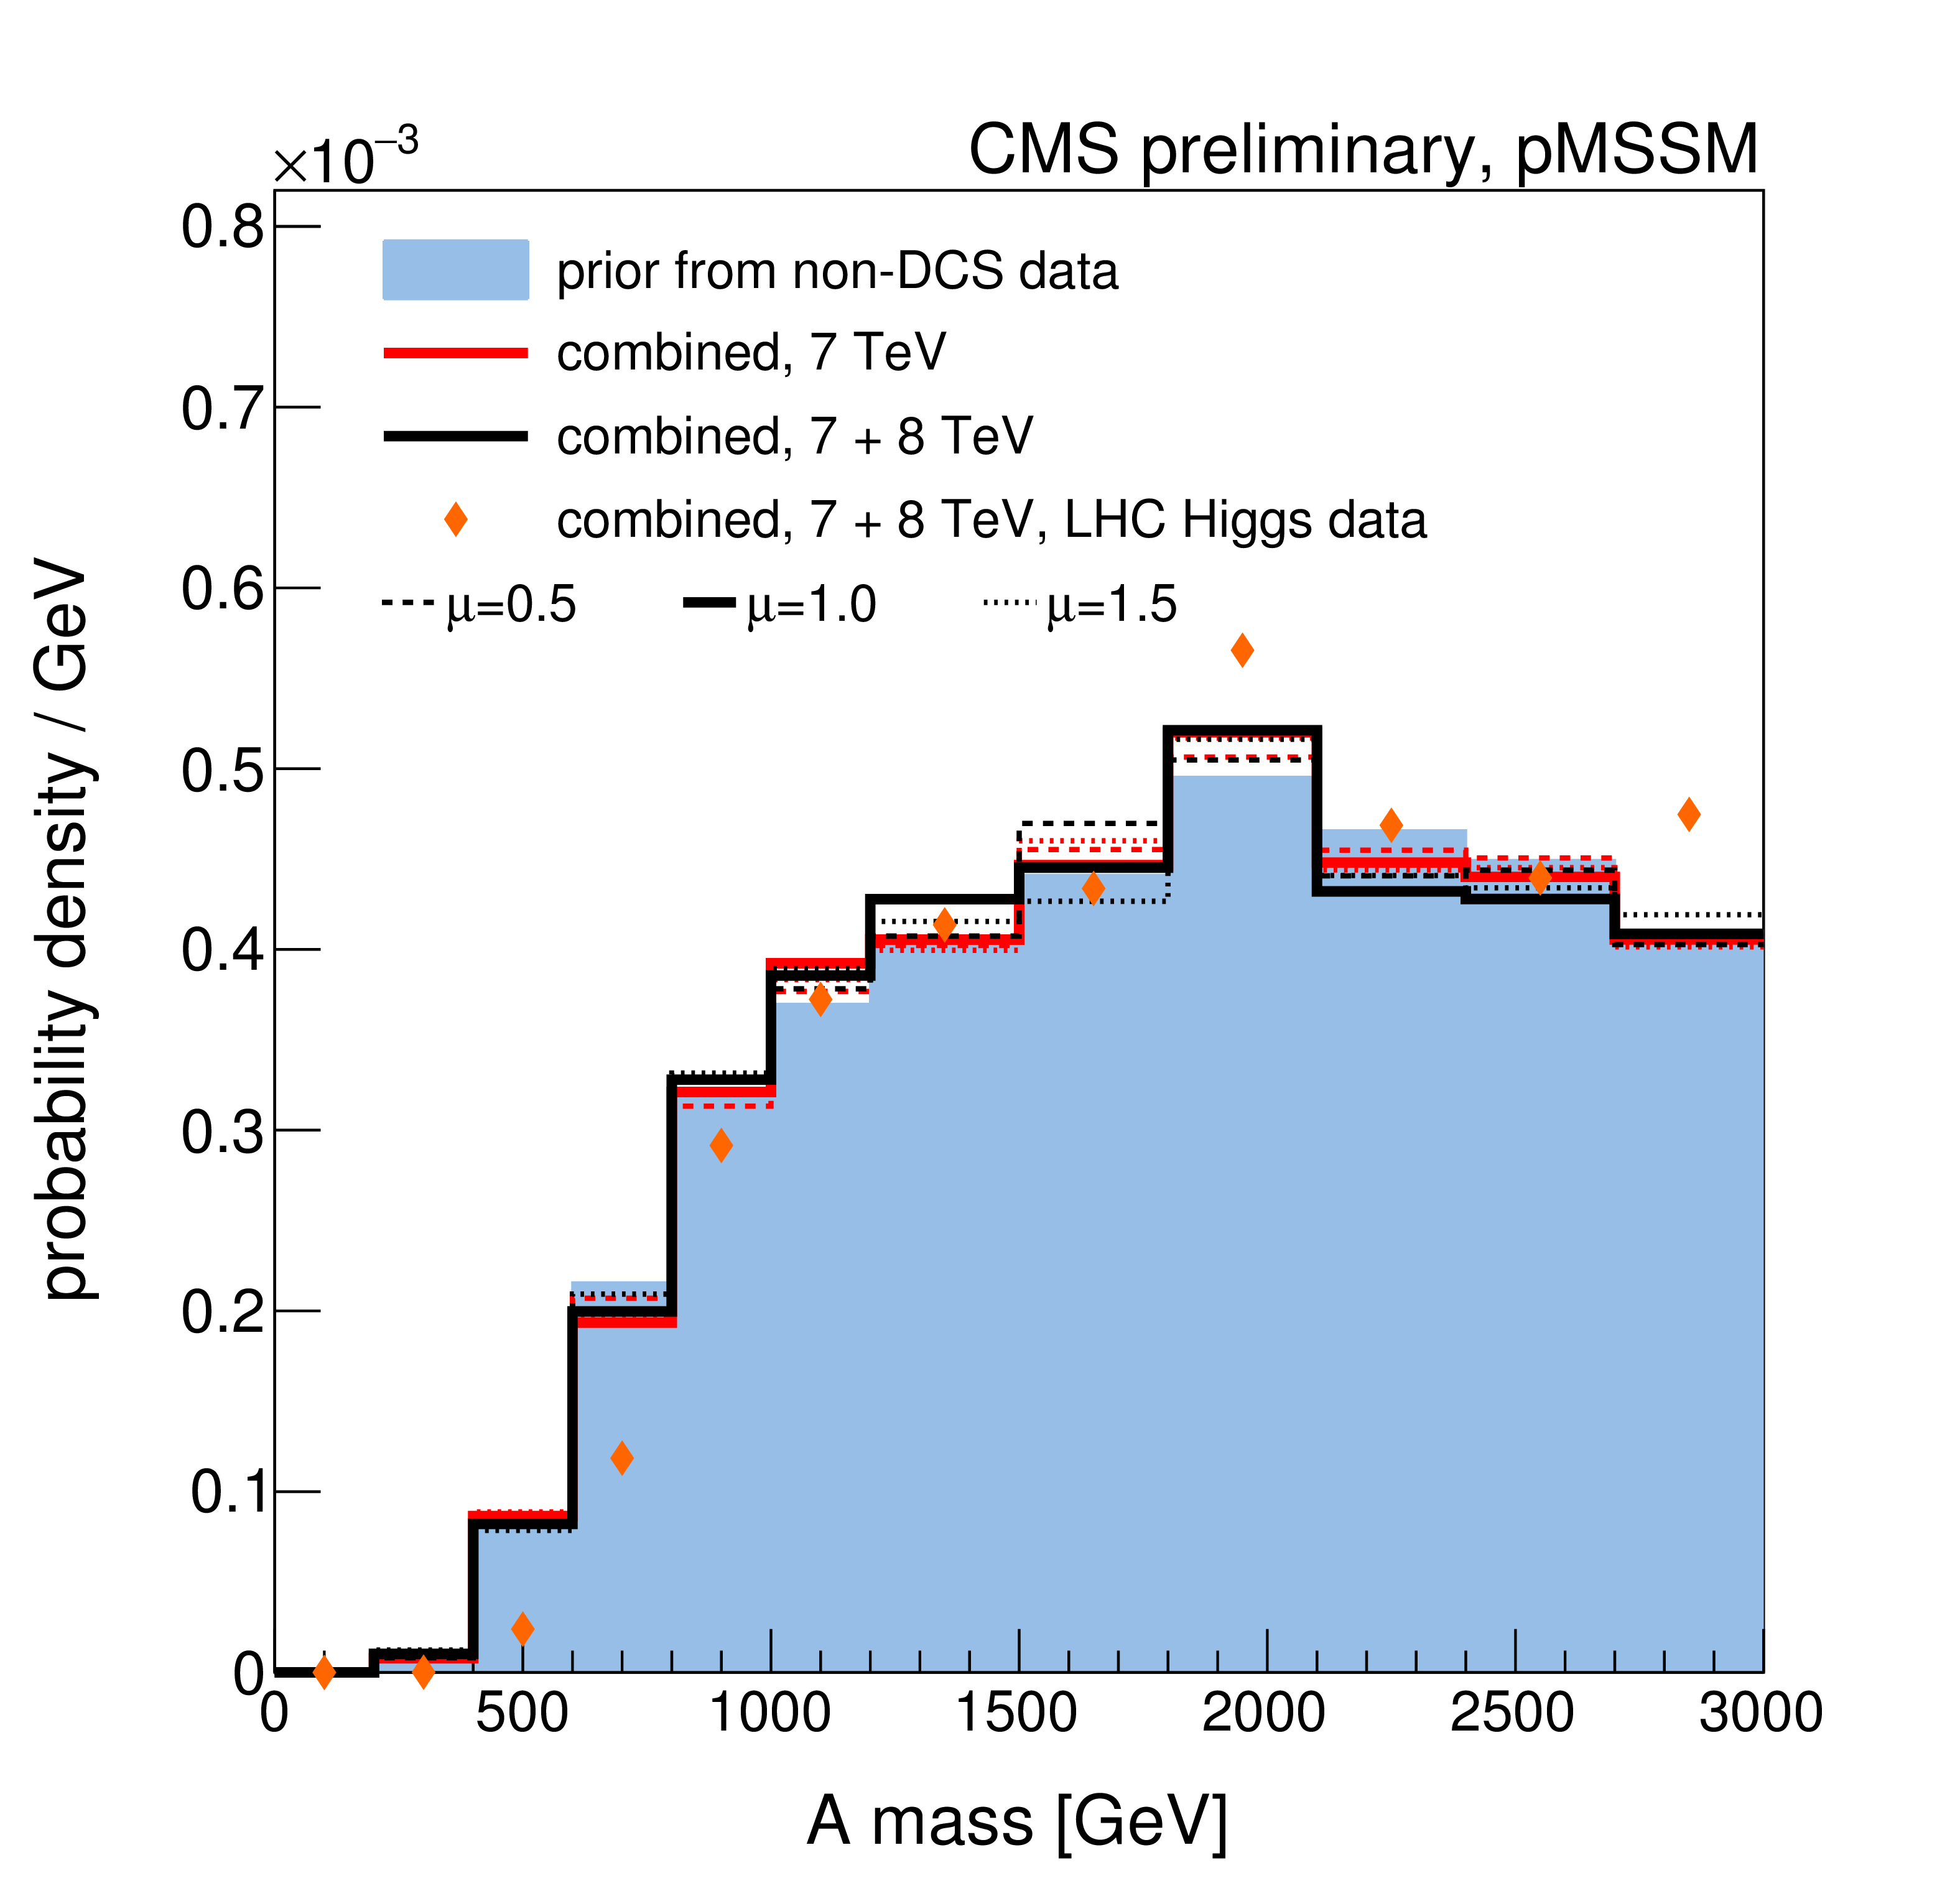
Figure 9-a:
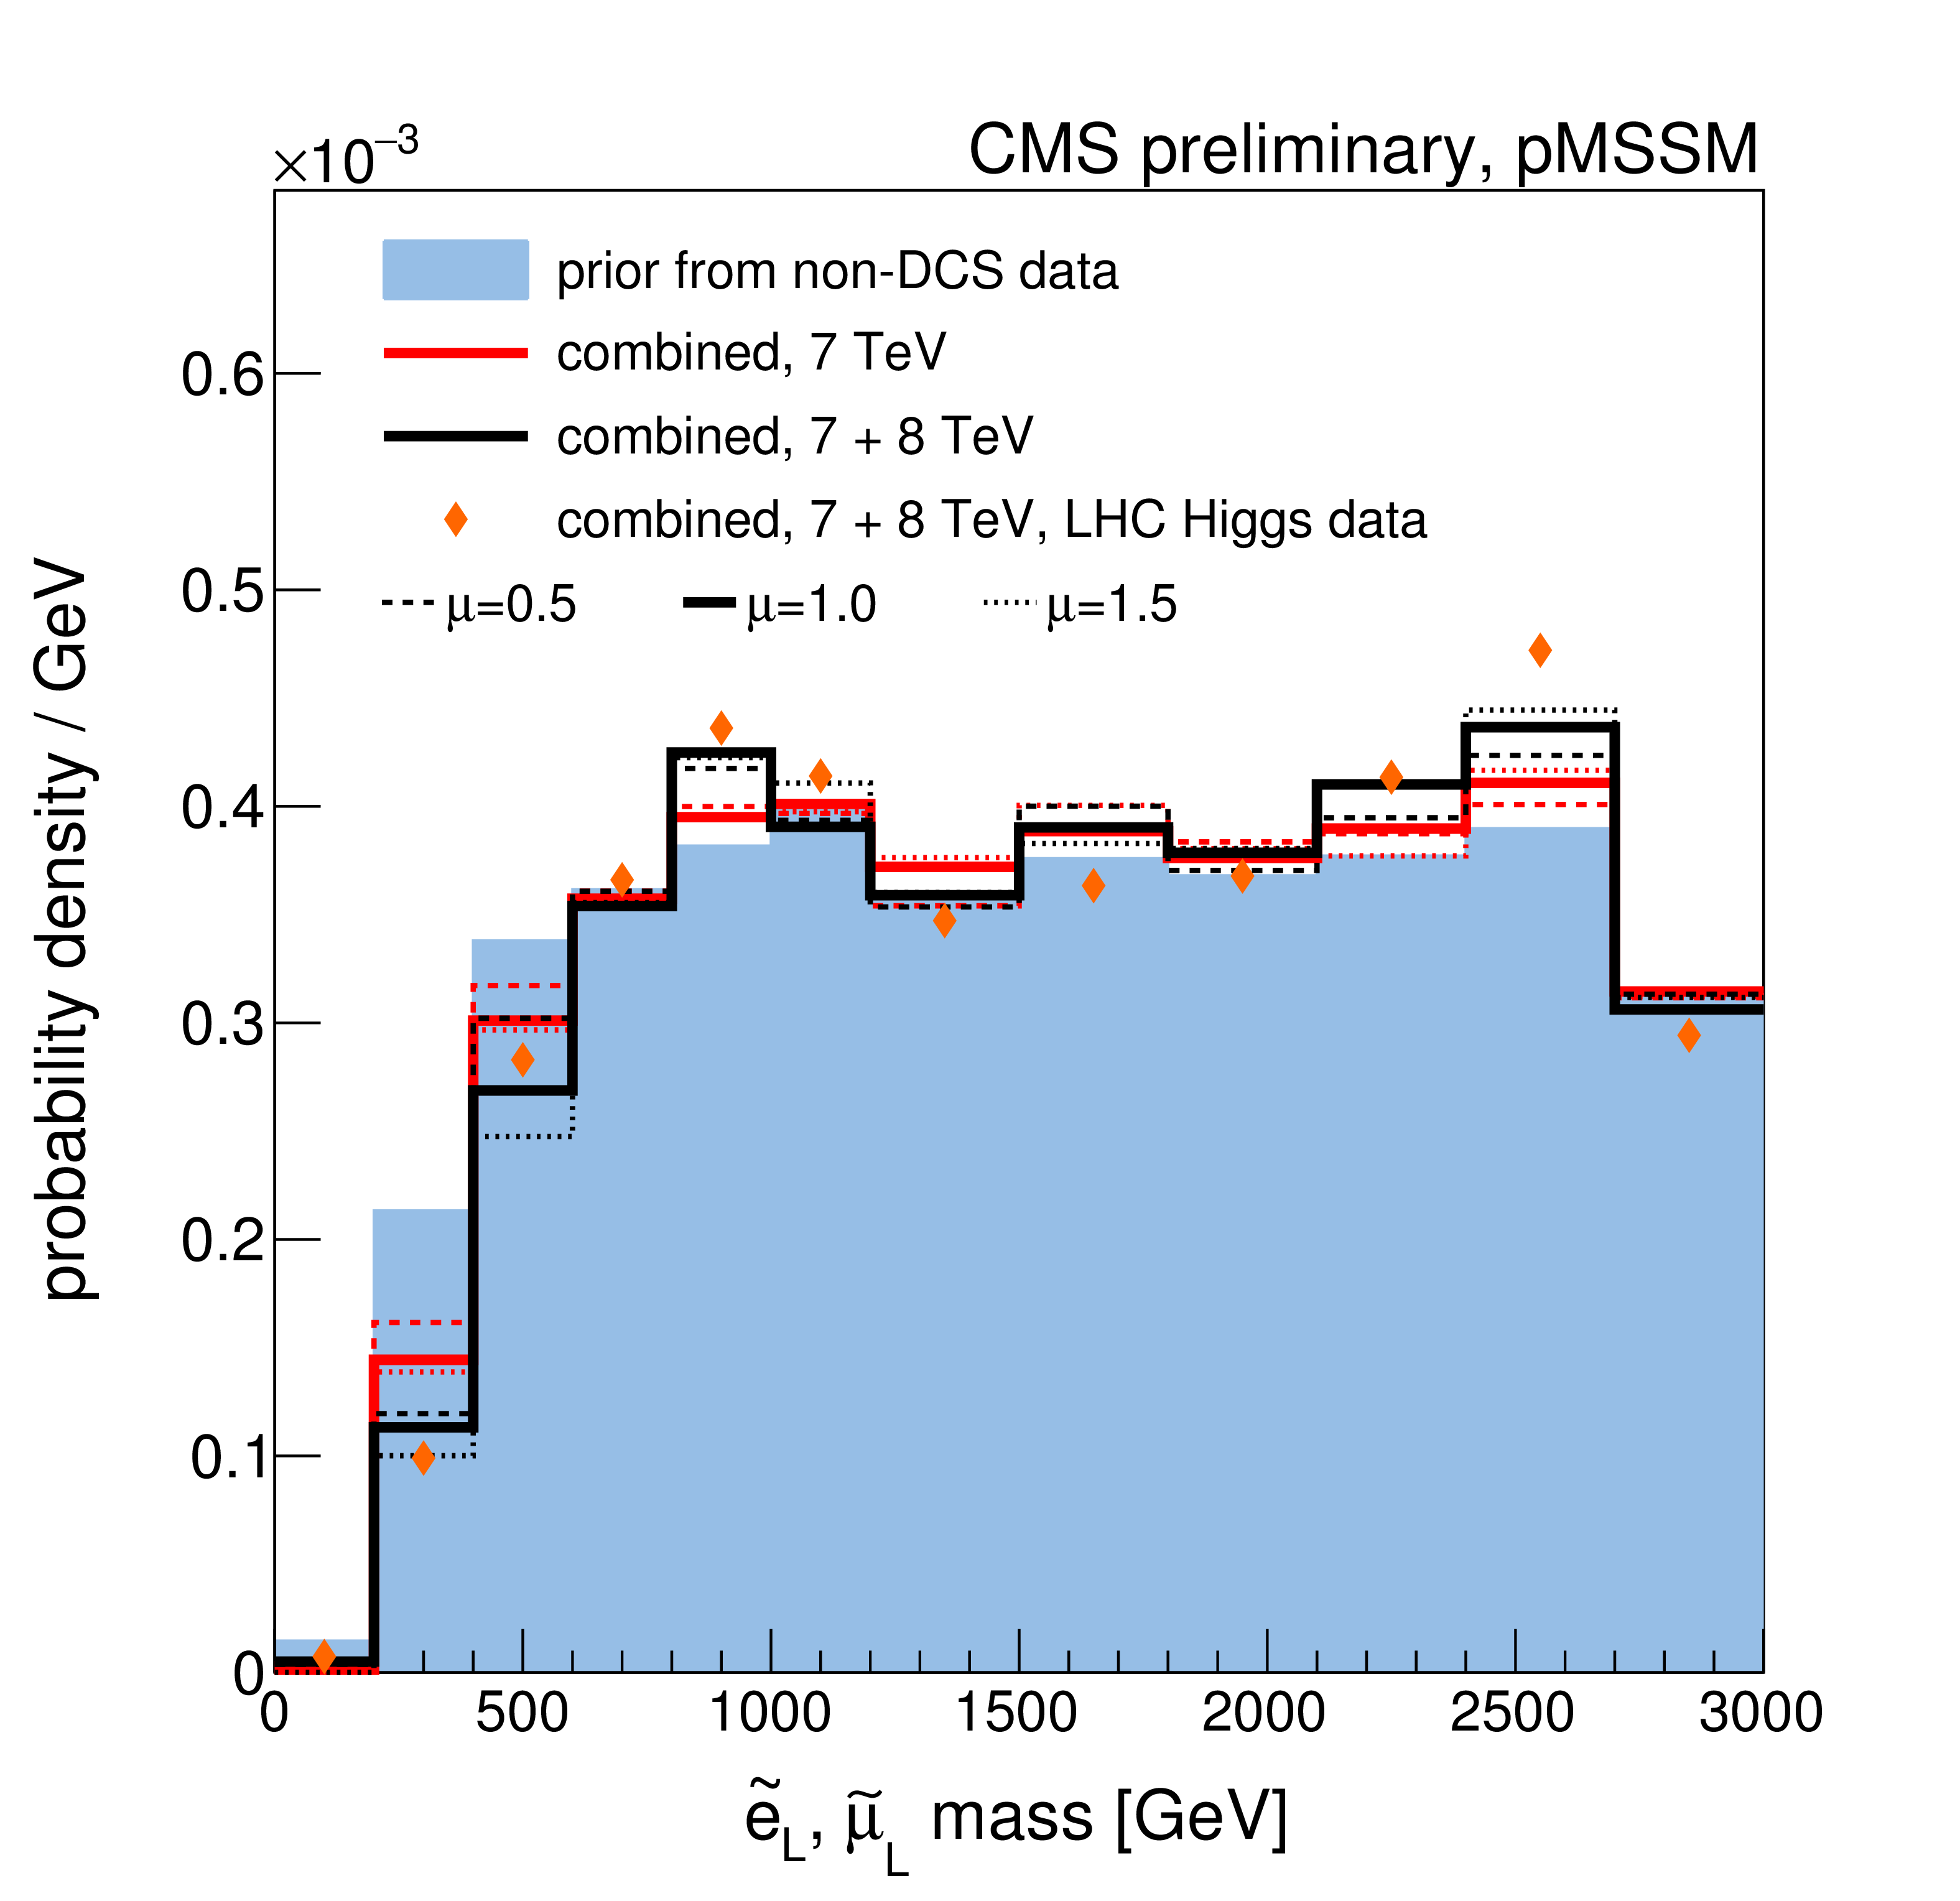
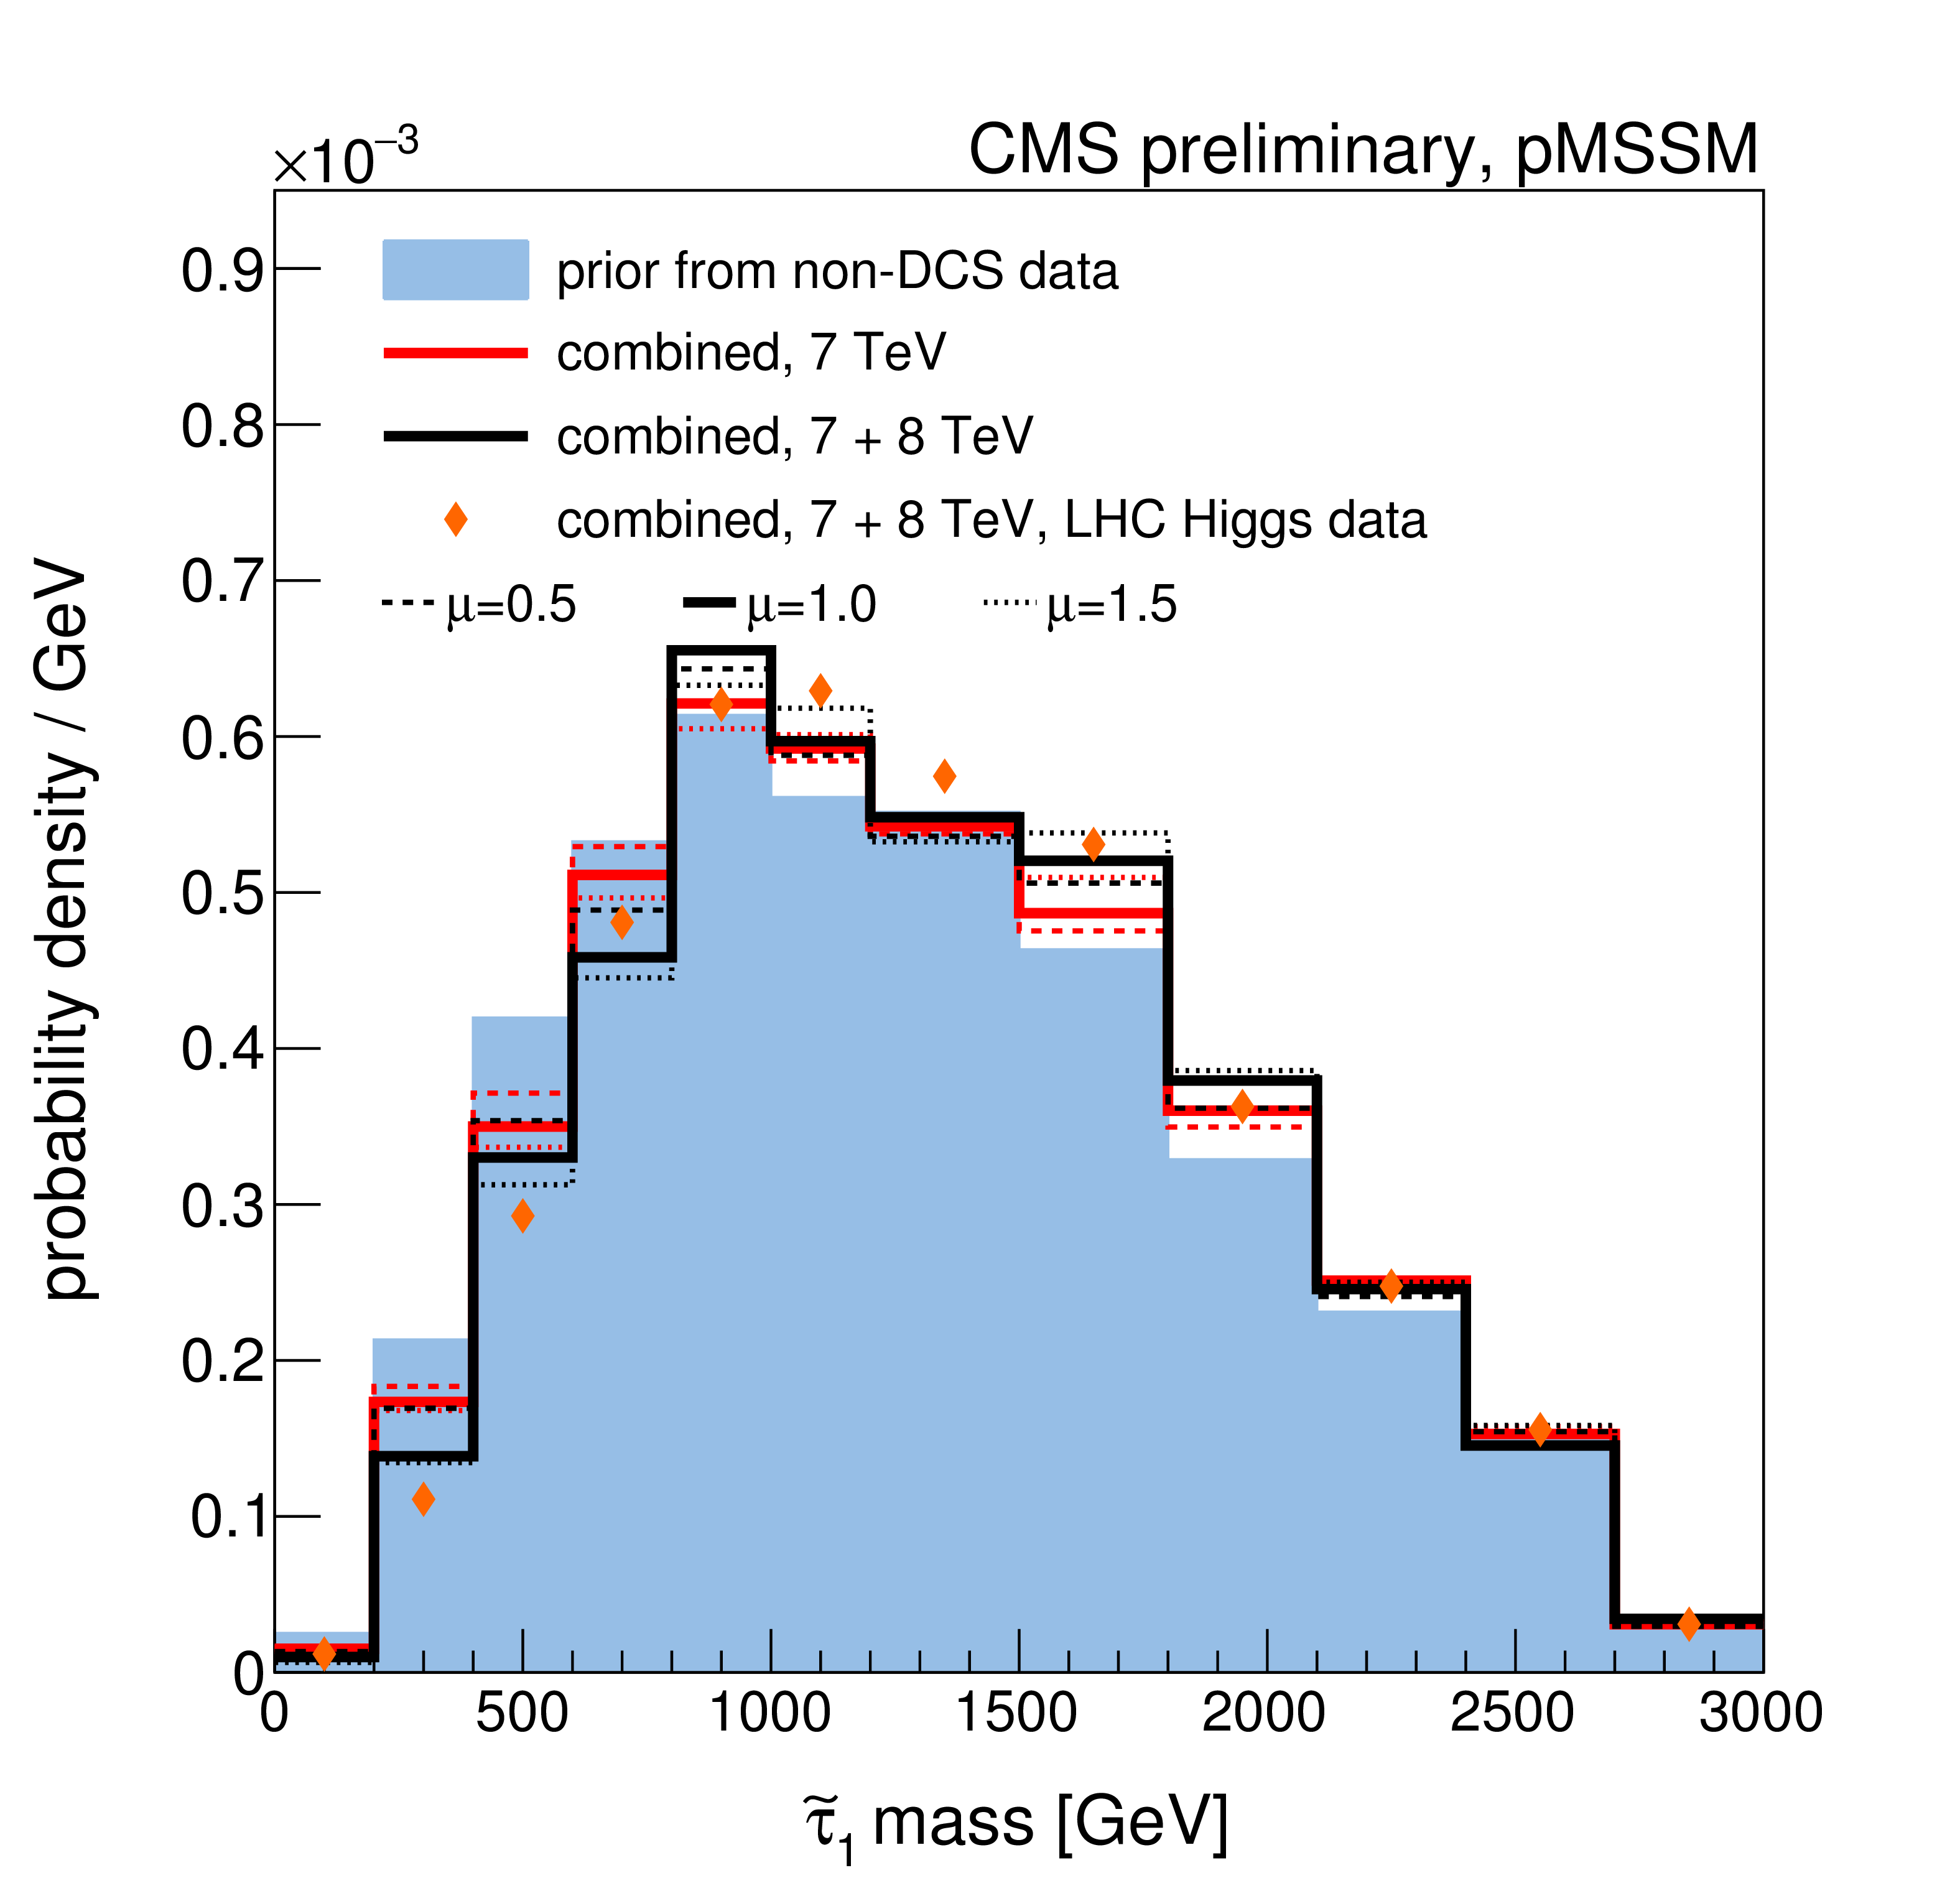
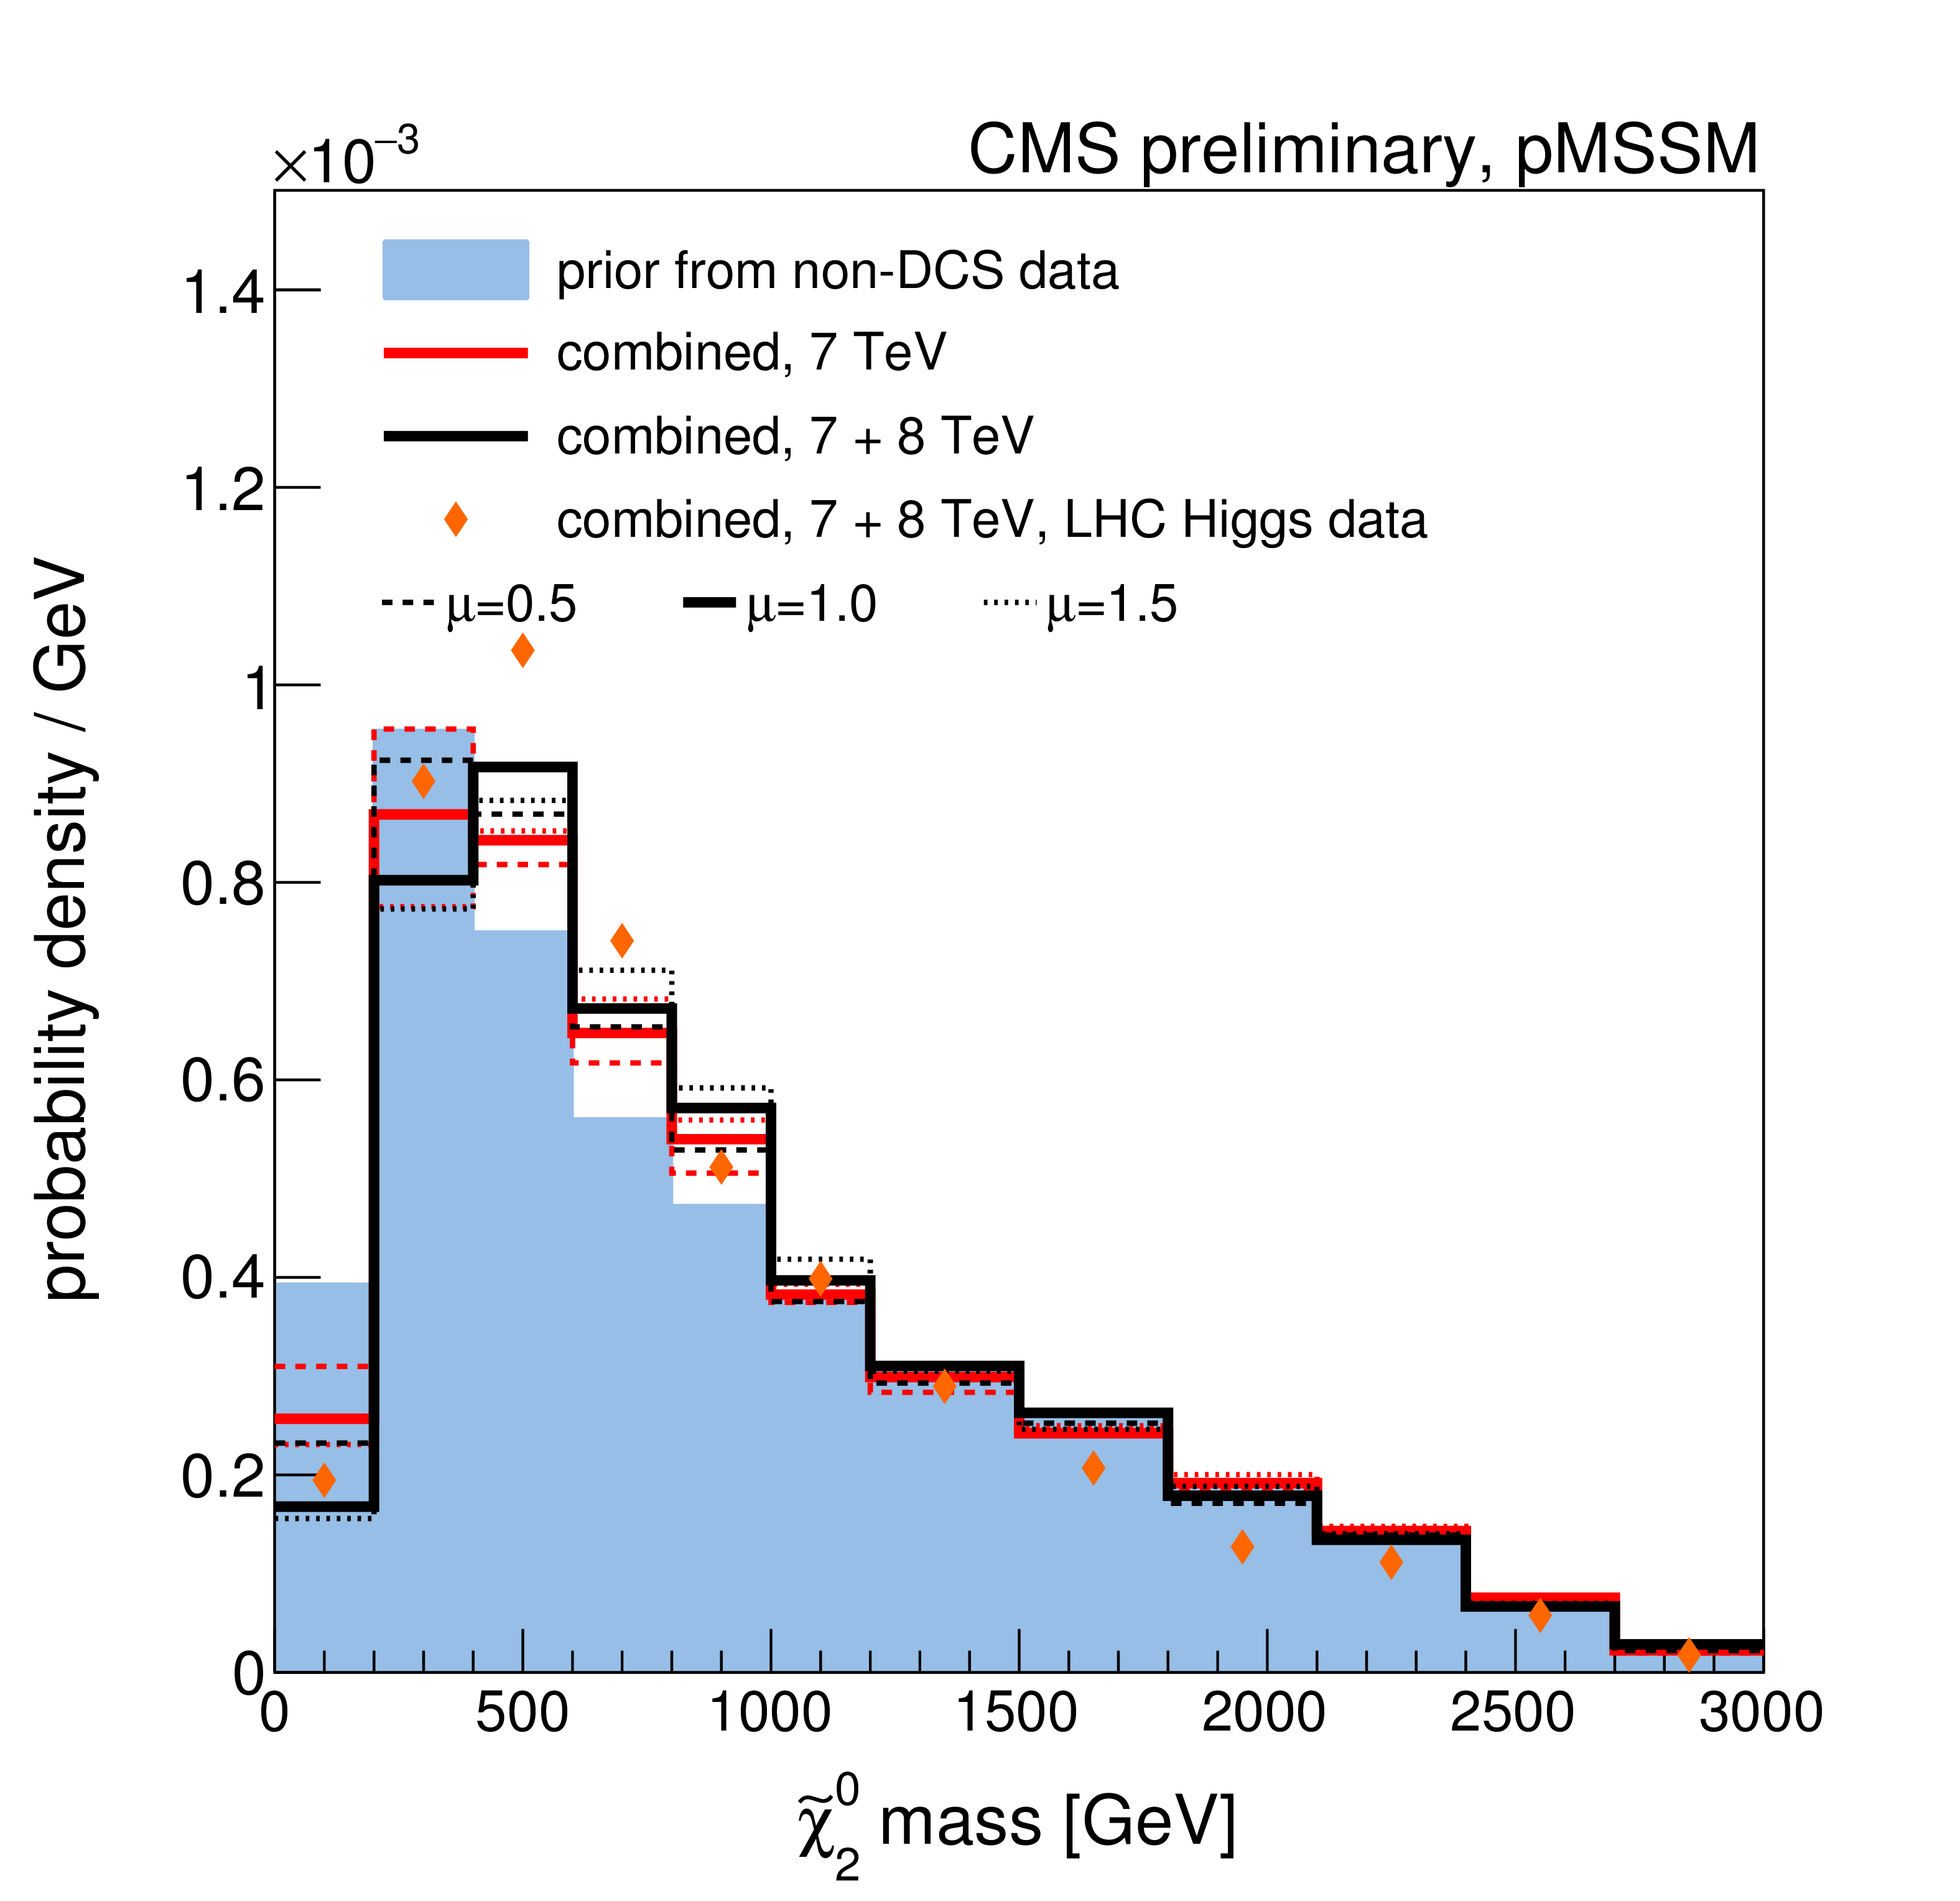
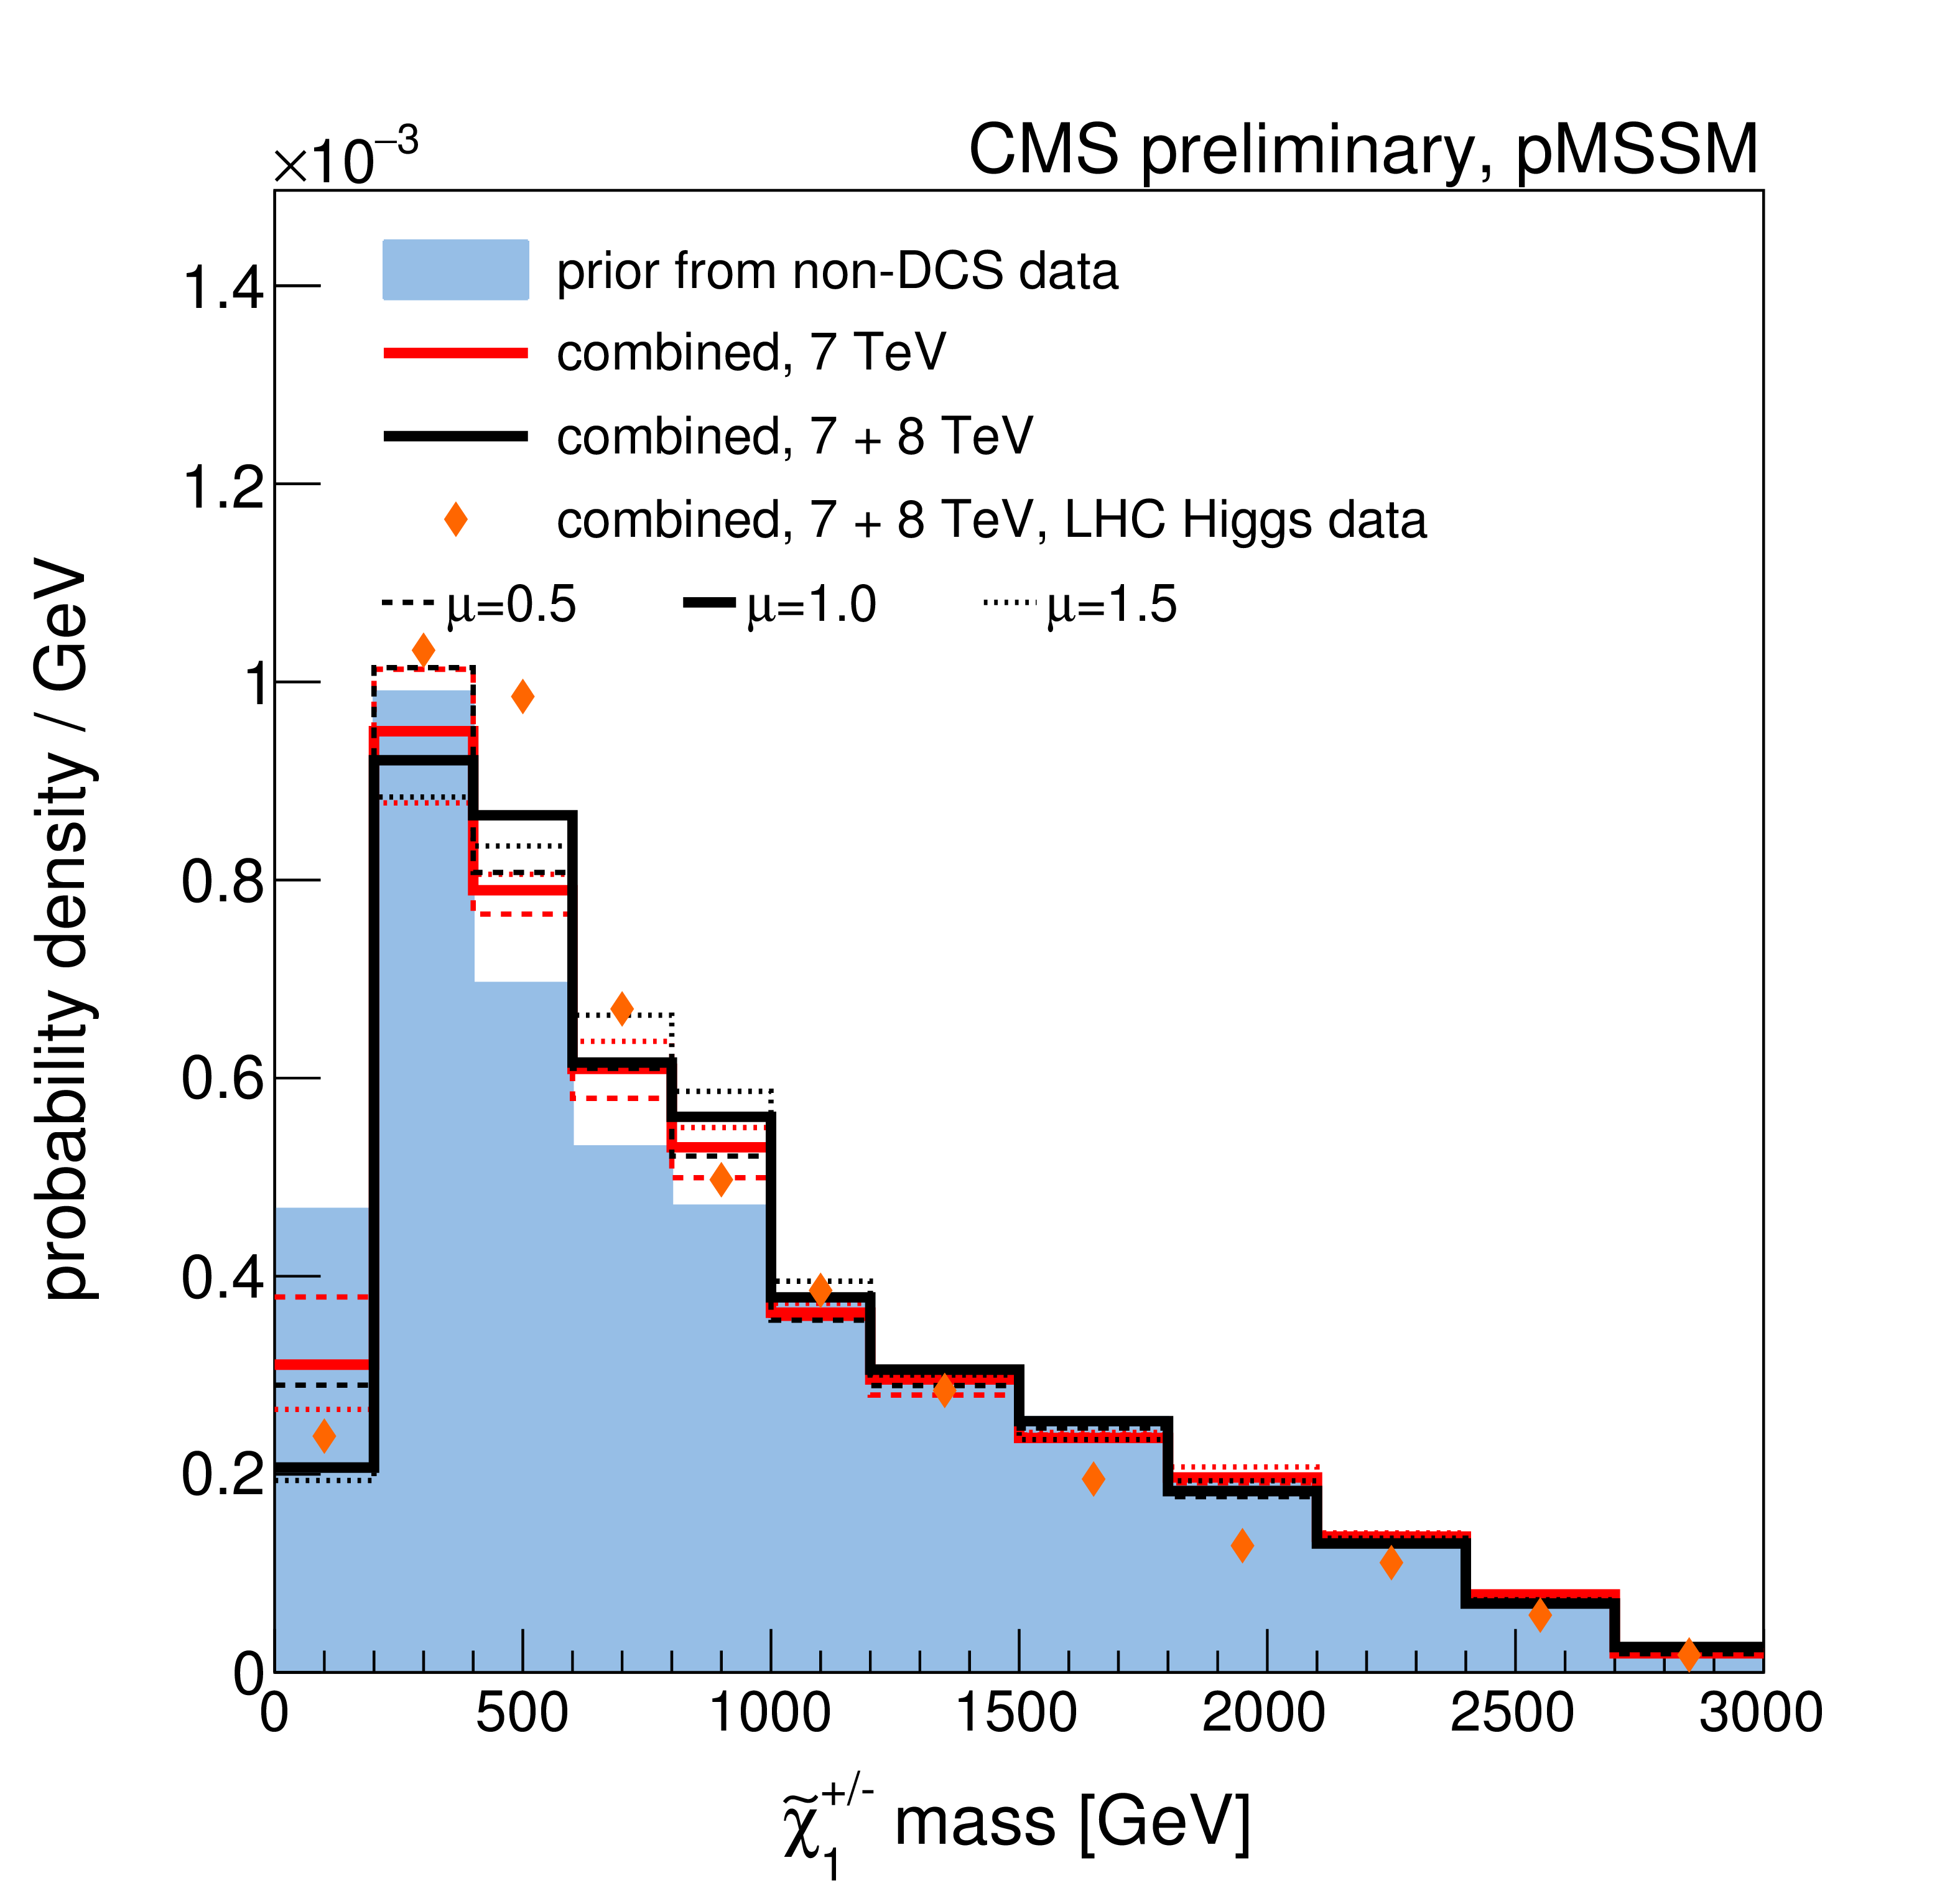
Comparison of prior and posterior distributions after several combinations of data from the CMS searches for the $\tilde{u}_R,\tilde{c}_R$ mass, $\tilde{b}_1$ mass, $\tilde{e}_L,\tilde{\mu }_L$ mass, $\tilde{\tau }_1$ mass, $\tilde{\chi}^0_2$ mass, $\tilde{ \chi}^{\pm}_1$ mass, $\mu $ parameter, $\tan\beta $, and $A$ mass. |
png ; pdf |
Figure 9-b:
Comparison of prior and posterior distributions after several combinations of data from the CMS searches for the $\tilde{u}_R,\tilde{c}_R$ mass, $\tilde{b}_1$ mass, $\tilde{e}_L,\tilde{\mu }_L$ mass, $\tilde{\tau }_1$ mass, $\tilde{\chi}^0_2$ mass, $\tilde{ \chi}^{\pm}_1$ mass, $\mu $ parameter, $\tan\beta $, and $A$ mass. |
png ; pdf |
Figure 9-c:
Comparison of prior and posterior distributions after several combinations of data from the CMS searches for the $\tilde{u}_R,\tilde{c}_R$ mass, $\tilde{b}_1$ mass, $\tilde{e}_L,\tilde{\mu }_L$ mass, $\tilde{\tau }_1$ mass, $\tilde{\chi}^0_2$ mass, $\tilde{ \chi}^{\pm}_1$ mass, $\mu $ parameter, $\tan\beta $, and $A$ mass. |
png ; pdf |
Figure 9-d:
Comparison of prior and posterior distributions after several combinations of data from the CMS searches for the $\tilde{u}_R,\tilde{c}_R$ mass, $\tilde{b}_1$ mass, $\tilde{e}_L,\tilde{\mu }_L$ mass, $\tilde{\tau }_1$ mass, $\tilde{\chi}^0_2$ mass, $\tilde{ \chi}^{\pm}_1$ mass, $\mu $ parameter, $\tan\beta $, and $A$ mass. |
png ; pdf |
Figure 9-e:
Comparison of prior and posterior distributions after several combinations of data from the CMS searches for the $\tilde{u}_R,\tilde{c}_R$ mass, $\tilde{b}_1$ mass, $\tilde{e}_L,\tilde{\mu }_L$ mass, $\tilde{\tau }_1$ mass, $\tilde{\chi}^0_2$ mass, $\tilde{ \chi}^{\pm}_1$ mass, $\mu $ parameter, $\tan\beta $, and $A$ mass. |
png ; pdf |
Figure 9-f:
Comparison of prior and posterior distributions after several combinations of data from the CMS searches for the $\tilde{u}_R,\tilde{c}_R$ mass, $\tilde{b}_1$ mass, $\tilde{e}_L,\tilde{\mu }_L$ mass, $\tilde{\tau }_1$ mass, $\tilde{\chi}^0_2$ mass, $\tilde{ \chi}^{\pm}_1$ mass, $\mu $ parameter, $\tan\beta $, and $A$ mass. |
png ; pdf |
Figure 9-g:
Comparison of prior and posterior distributions after several combinations of data from the CMS searches for the $\tilde{u}_R,\tilde{c}_R$ mass, $\tilde{b}_1$ mass, $\tilde{e}_L,\tilde{\mu }_L$ mass, $\tilde{\tau }_1$ mass, $\tilde{\chi}^0_2$ mass, $\tilde{ \chi}^{\pm}_1$ mass, $\mu $ parameter, $\tan\beta $, and $A$ mass. |
png ; pdf |
Figure 9-h:
Comparison of prior and posterior distributions after several combinations of data from the CMS searches for the $\tilde{u}_R,\tilde{c}_R$ mass, $\tilde{b}_1$ mass, $\tilde{e}_L,\tilde{\mu }_L$ mass, $\tilde{\tau }_1$ mass, $\tilde{\chi}^0_2$ mass, $\tilde{ \chi}^{\pm}_1$ mass, $\mu $ parameter, $\tan\beta $, and $A$ mass. |
png ; pdf |
Figure 9-i:
Comparison of prior and posterior distributions after several combinations of data from the CMS searches for the $\tilde{u}_R,\tilde{c}_R$ mass, $\tilde{b}_1$ mass, $\tilde{e}_L,\tilde{\mu }_L$ mass, $\tilde{\tau }_1$ mass, $\tilde{\chi}^0_2$ mass, $\tilde{ \chi}^{\pm}_1$ mass, $\mu $ parameter, $\tan\beta $, and $A$ mass. |
png ; pdf |
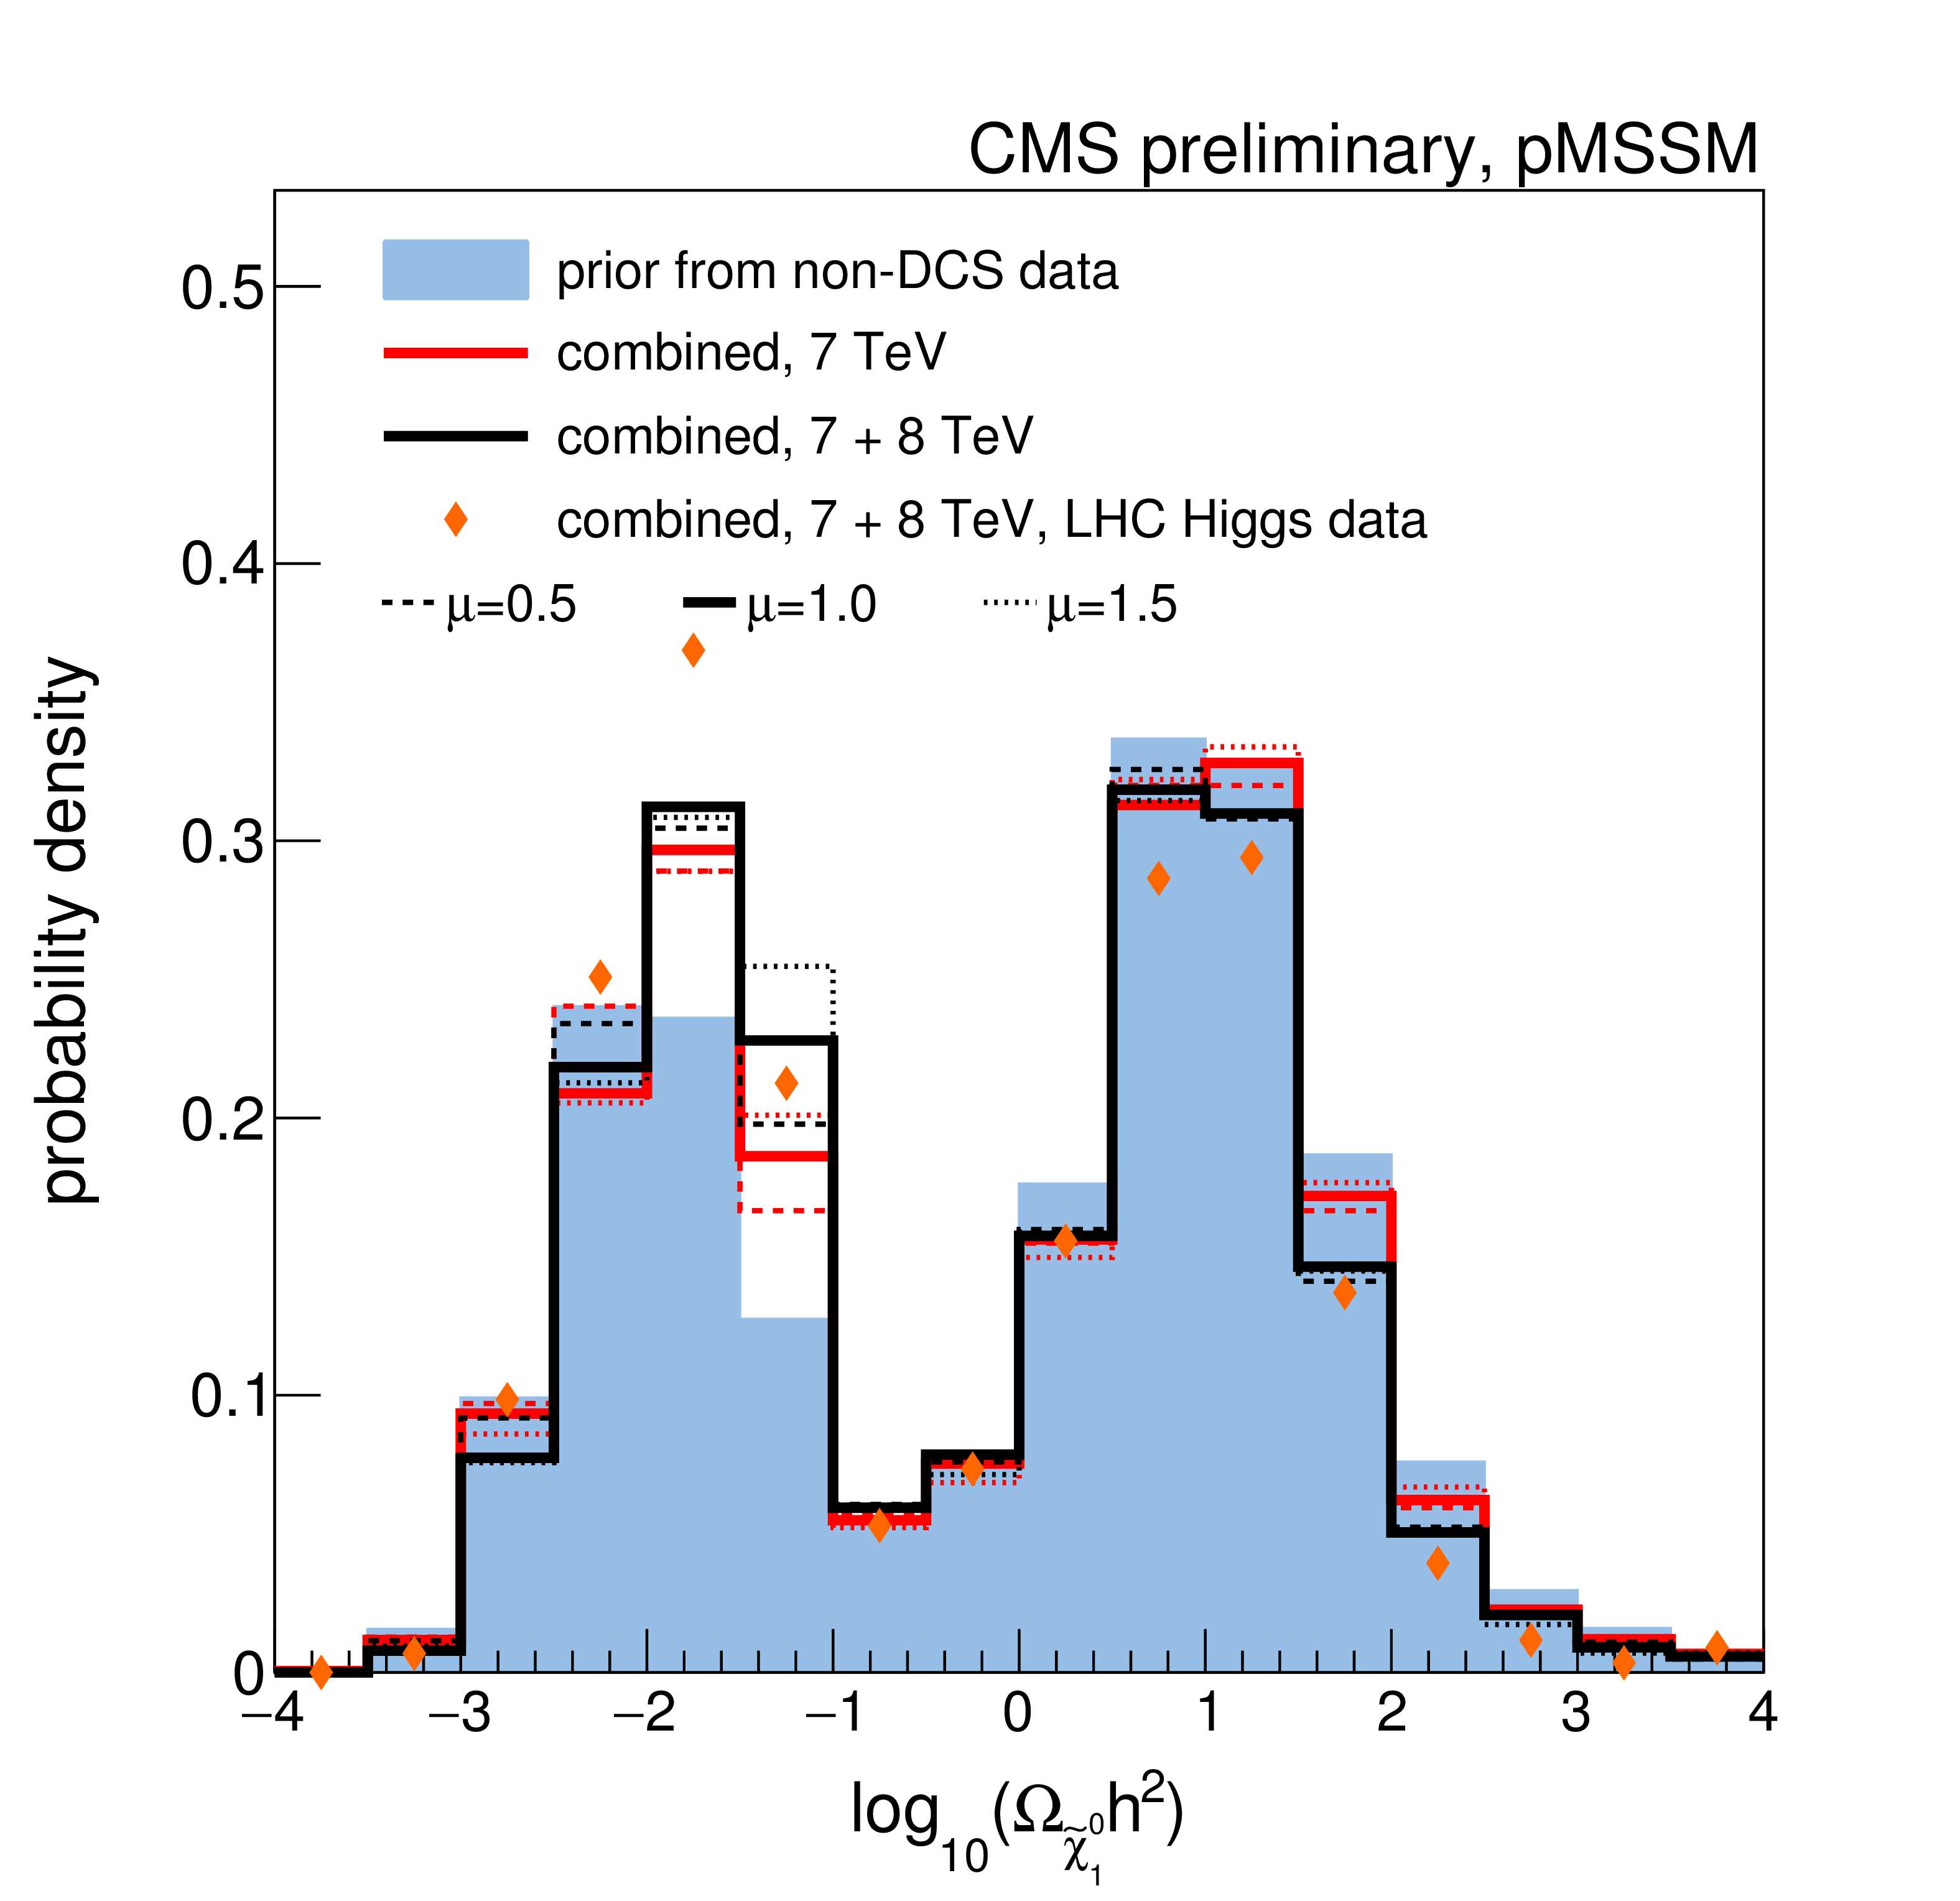
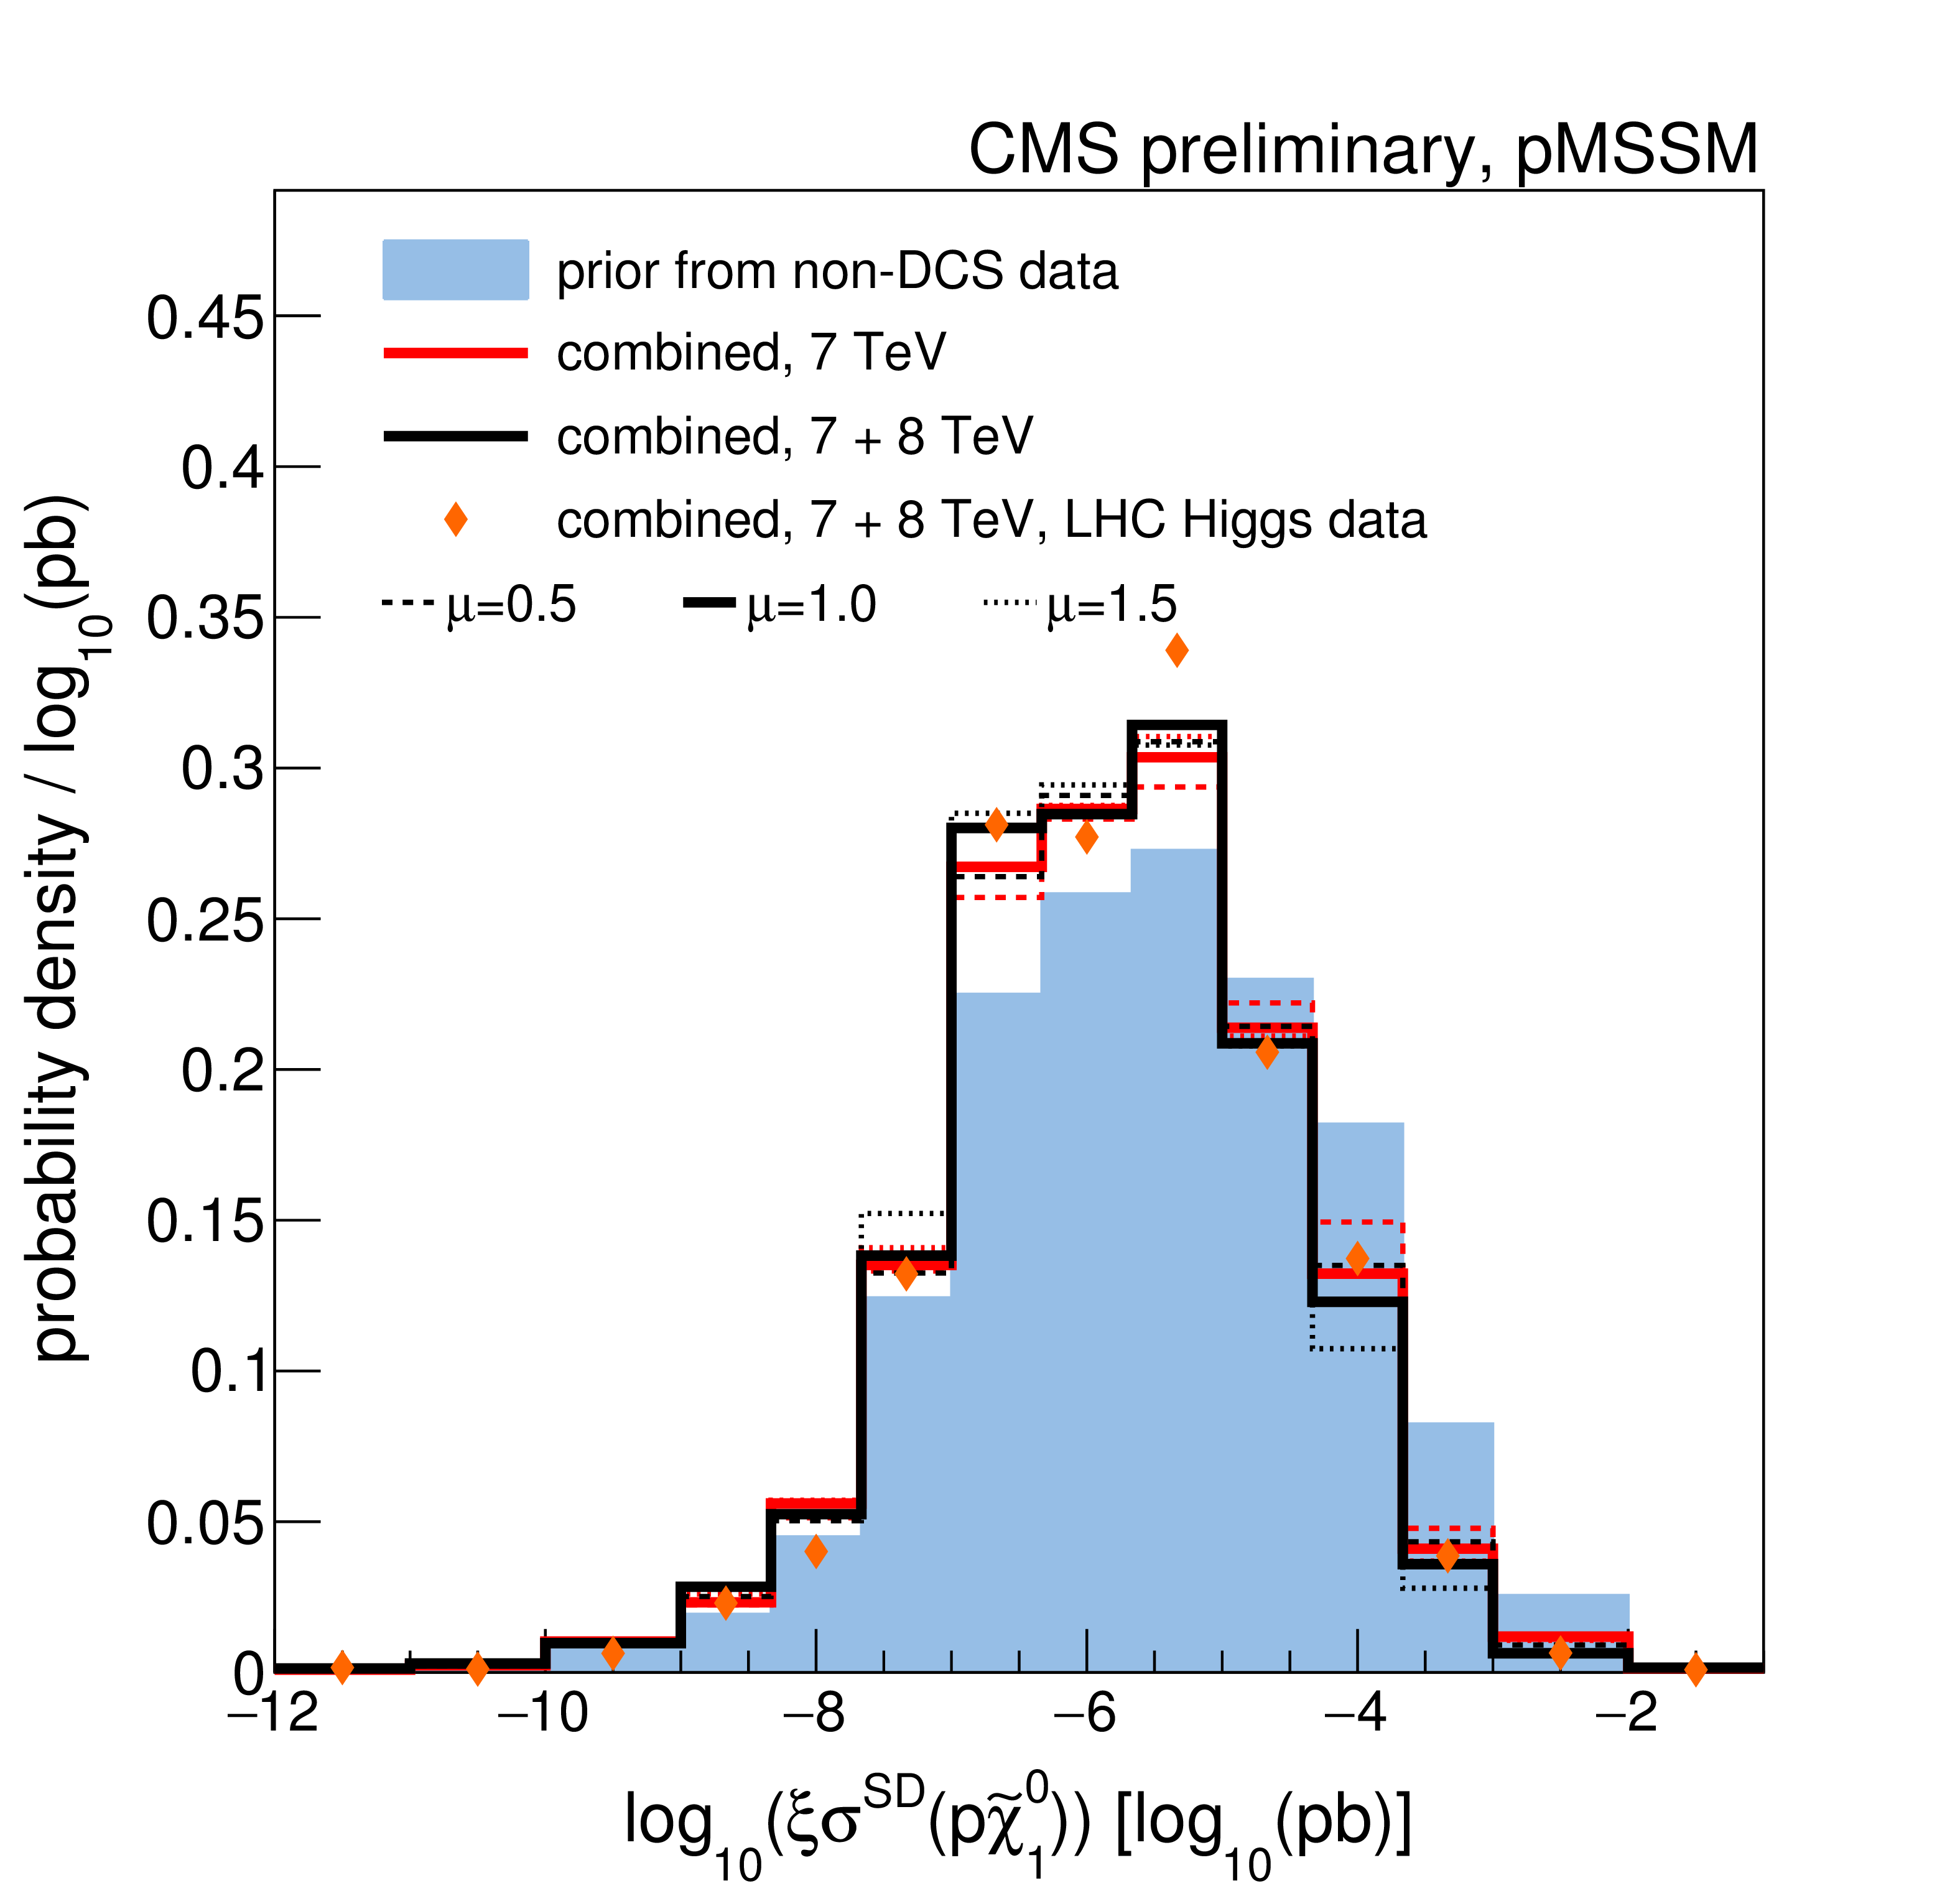
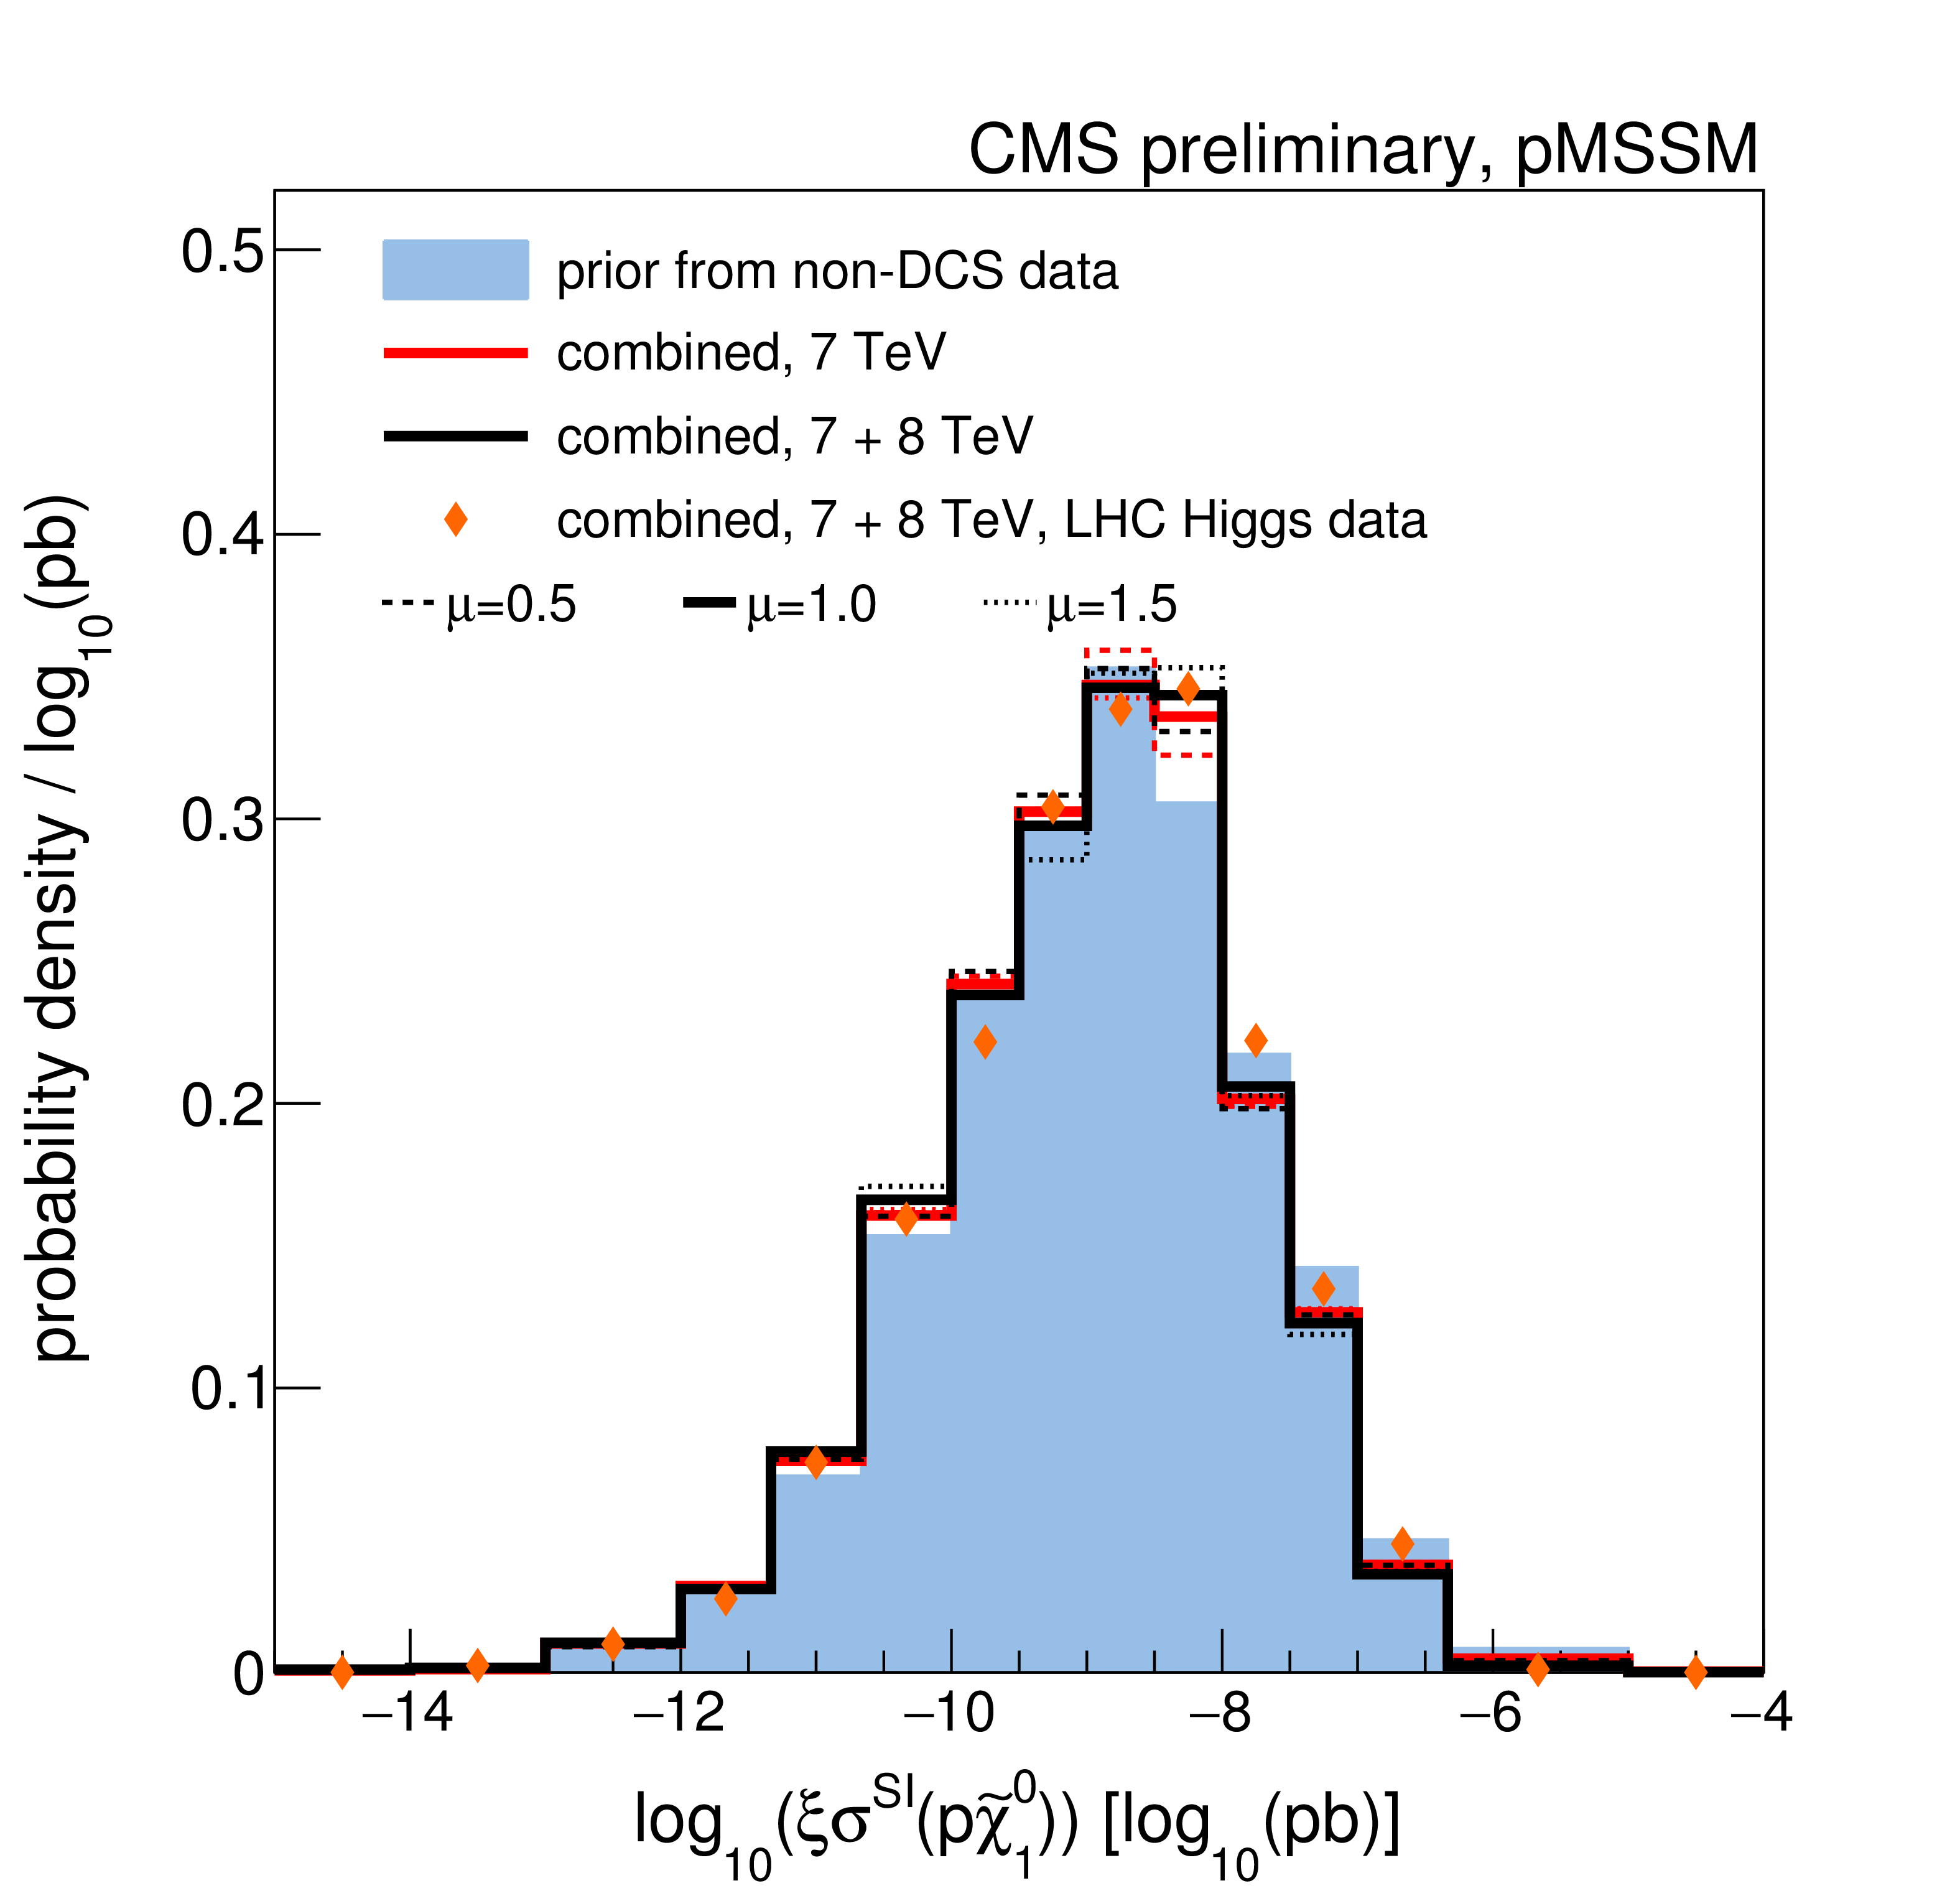
Figure 10-a:
Comparison of prior and posterior distributions after several combinations of data from the CMS searches for $\Omega _{\tilde{\chi }^{0}_{1}}h^{2}$, $\xi \sigma ^{SD}(p\tilde{\chi }_{1}^{0})$, and $\xi \sigma ^{SI}(p\tilde{\chi }_{1}^{0})$. |
png ; pdf |
Figure 10-b:
Comparison of prior and posterior distributions after several combinations of data from the CMS searches for $\Omega _{\tilde{\chi }^{0}_{1}}h^{2}$, $\xi \sigma ^{SD}(p\tilde{\chi }_{1}^{0})$, and $\xi \sigma ^{SI}(p\tilde{\chi }_{1}^{0})$. |
png ; pdf |
Figure 10-c:
Comparison of prior and posterior distributions after several combinations of data from the CMS searches for $\Omega _{\tilde{\chi }^{0}_{1}}h^{2}$, $\xi \sigma ^{SD}(p\tilde{\chi }_{1}^{0})$, and $\xi \sigma ^{SI}(p\tilde{\chi }_{1}^{0})$. |
png ; pdf |
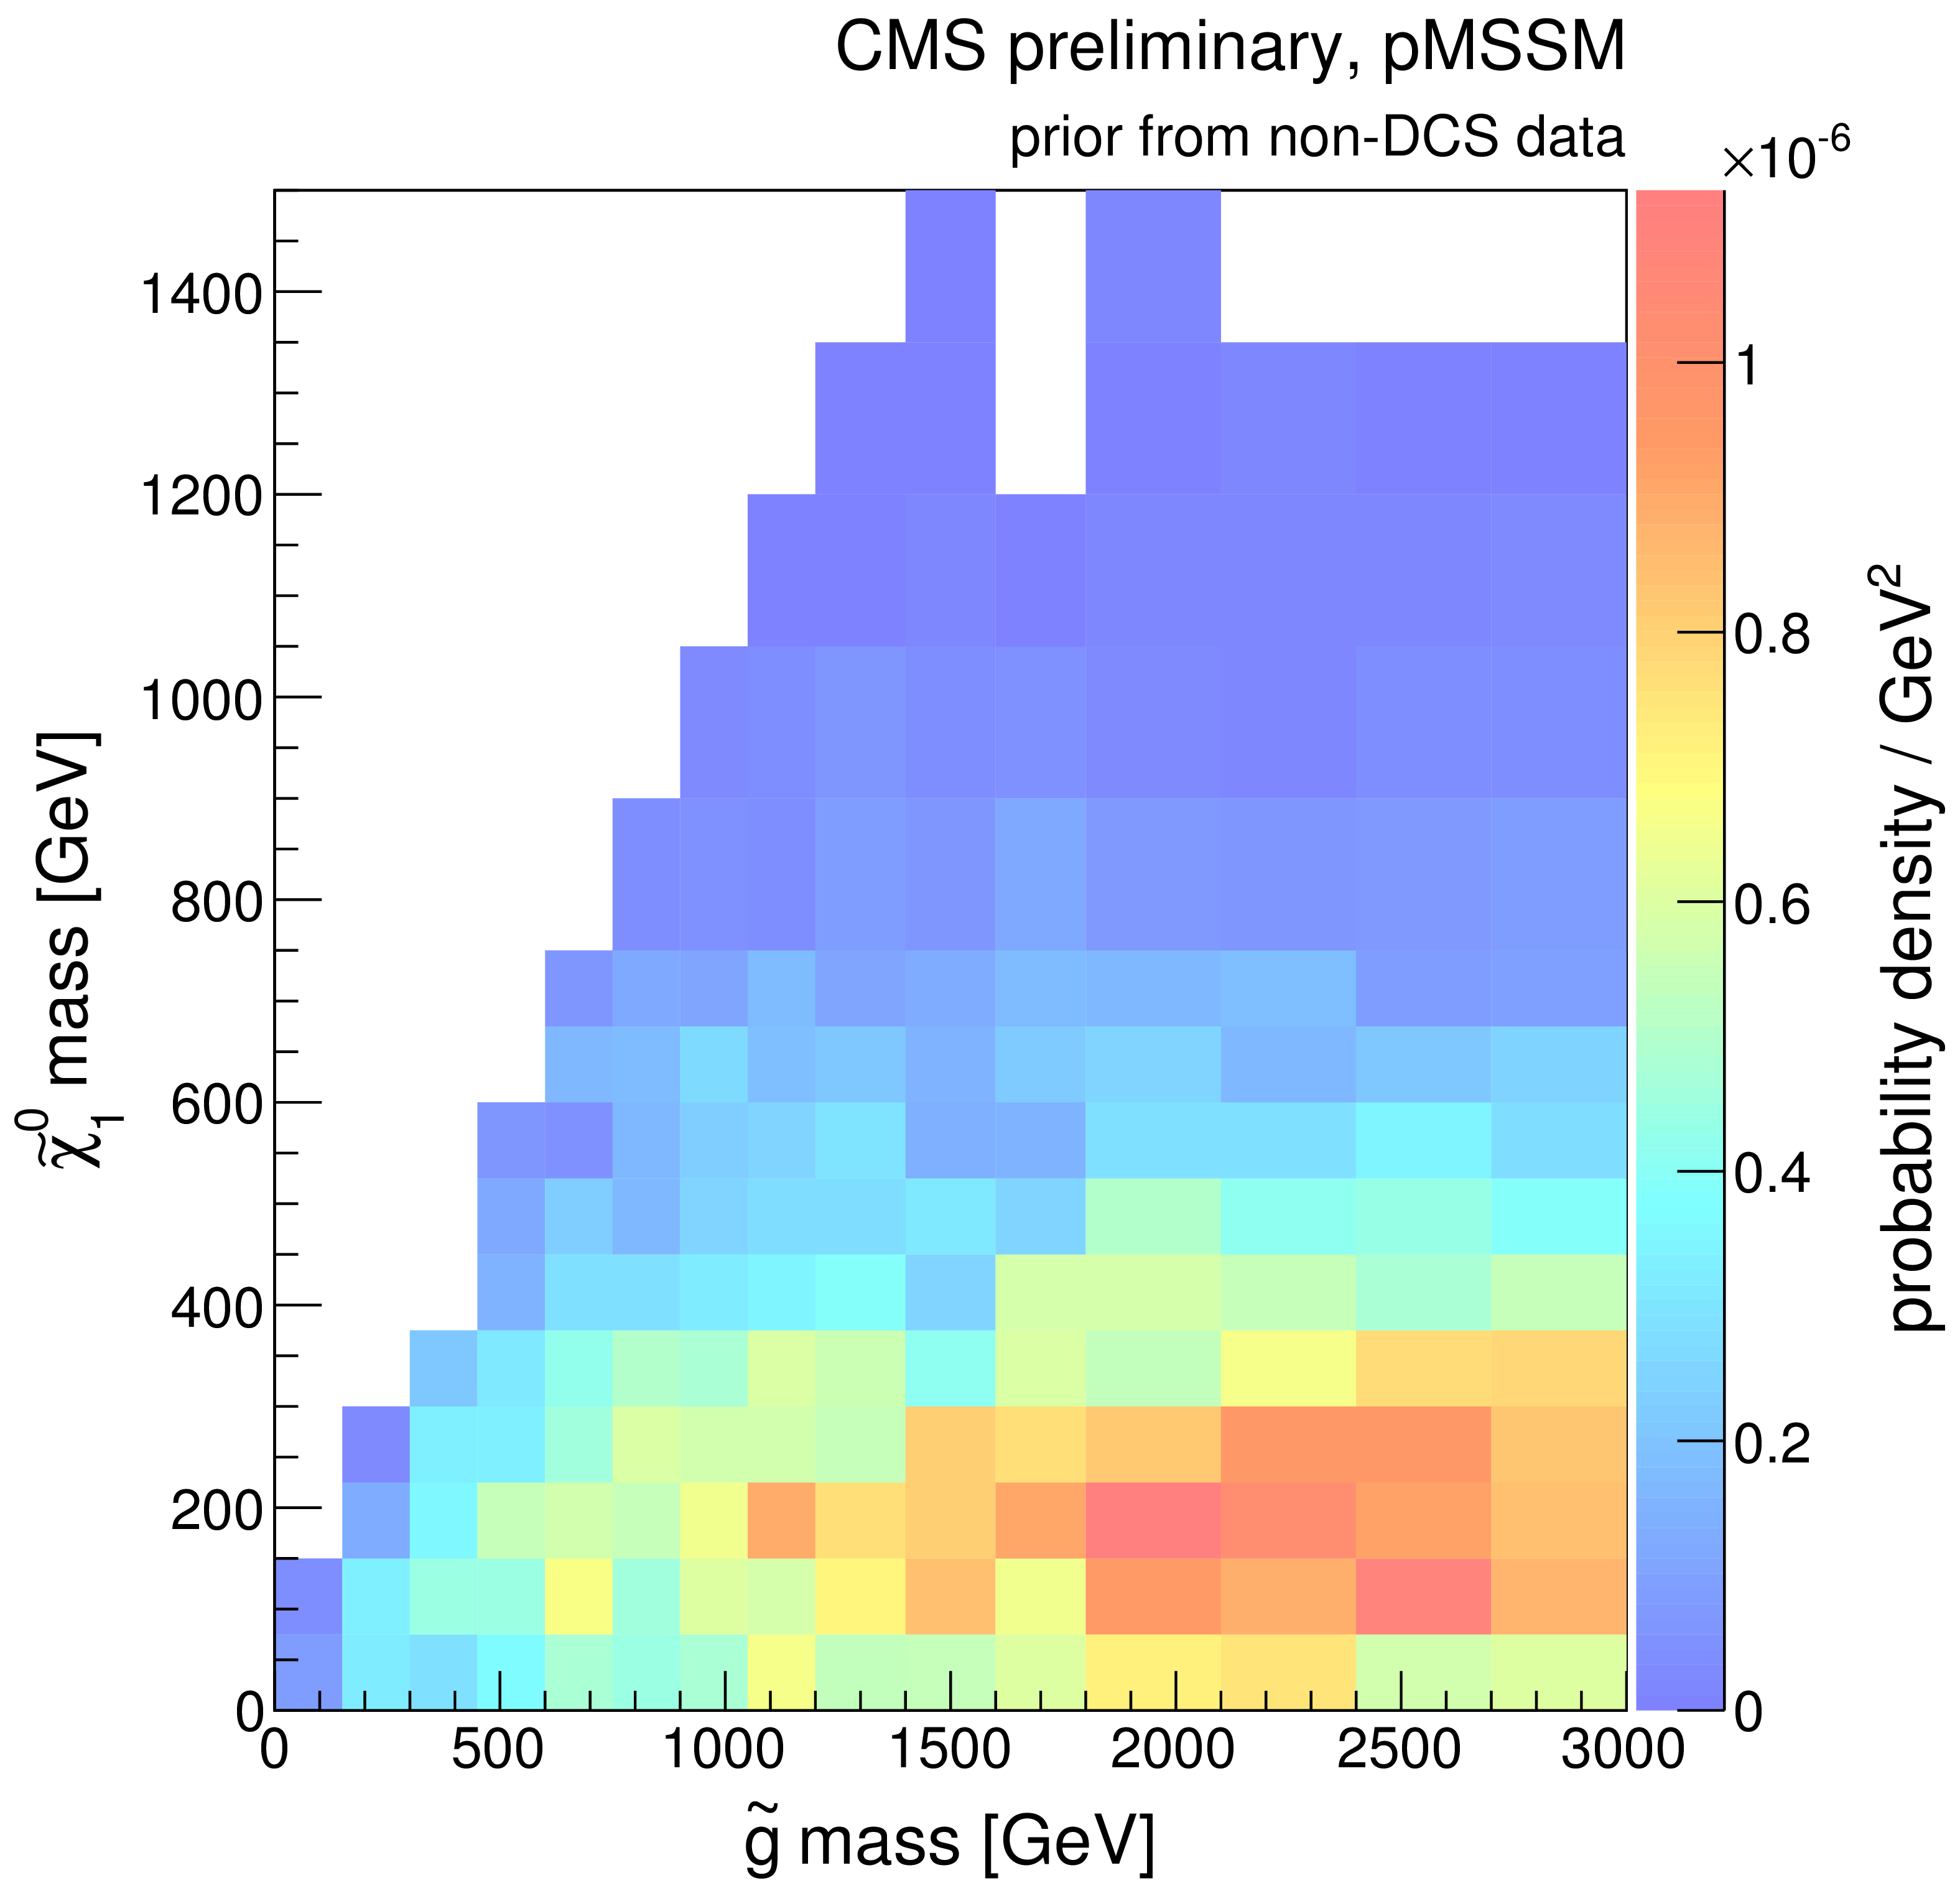
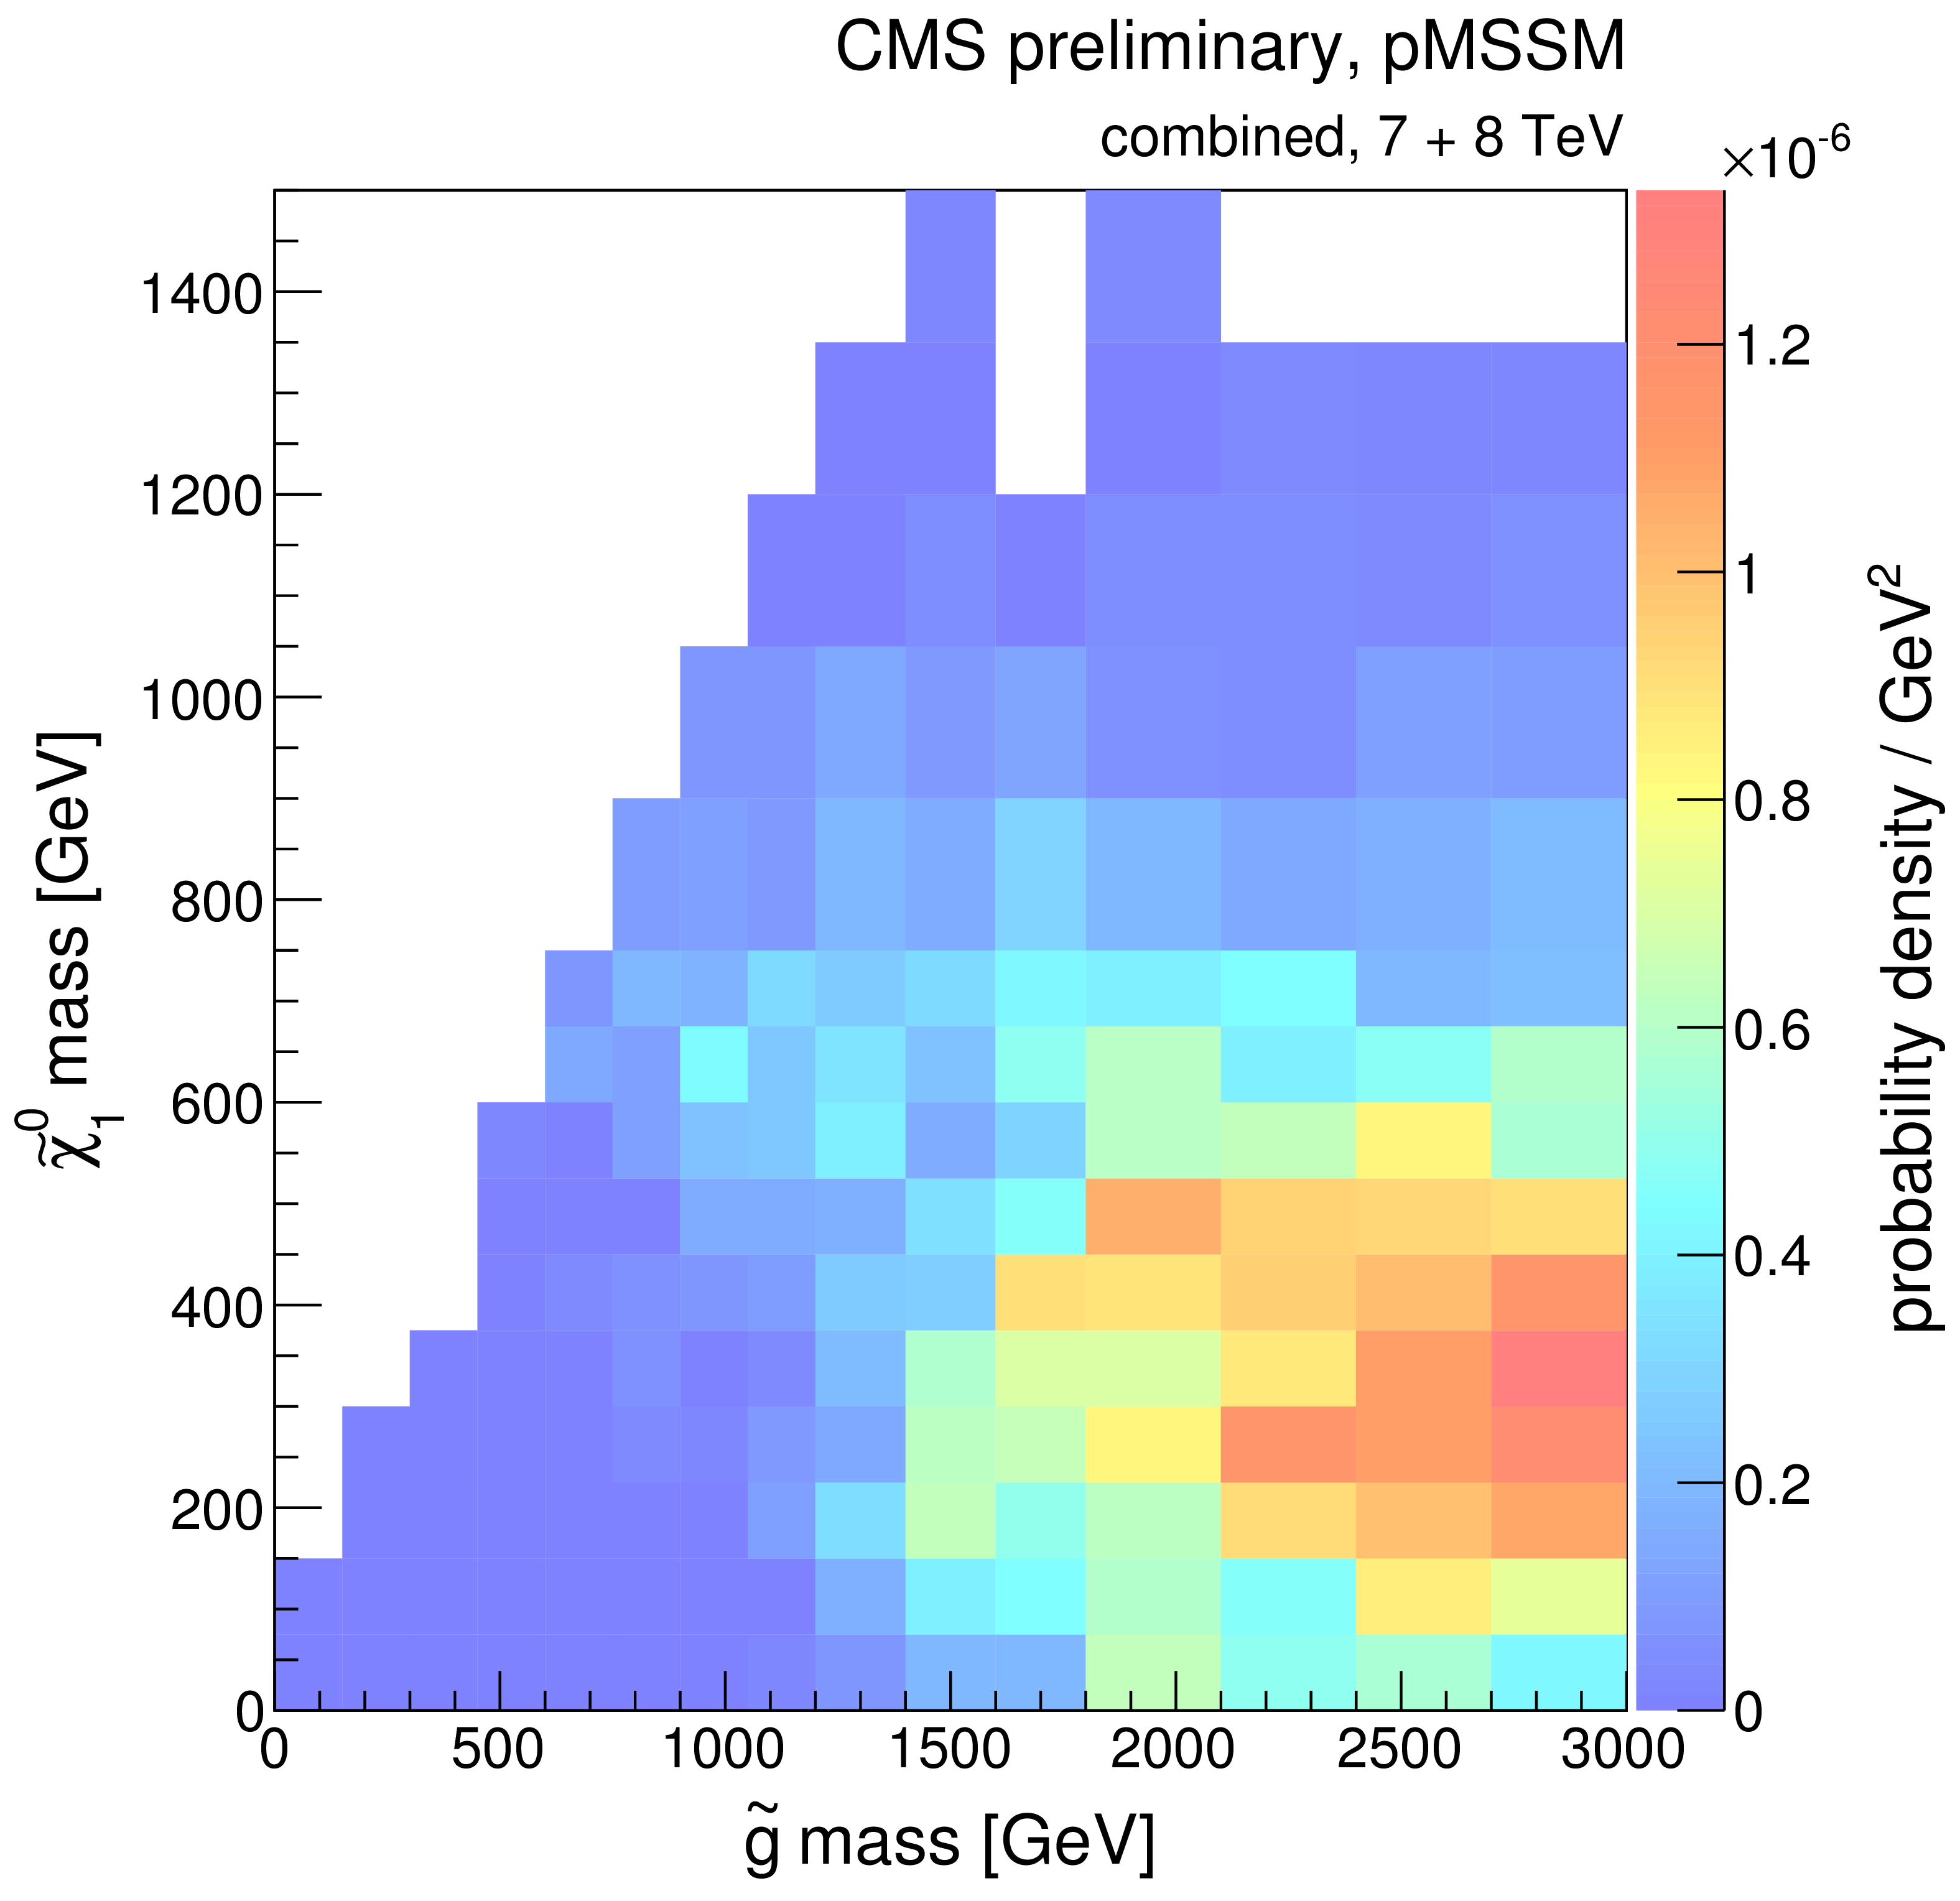
Figure 11-a:
Marginalized non-DCS distributions (first column), compared with posterior distributions (second column) and survival probabilities (third column) after inclusion of all CMS data, are shown for the $\tilde{ \chi }_1^0$ mass versus gluino mass (first row), versus the LCSP mass (second row), the stop (third row), and versus the logarithm of inclusive cross section for inclusive sparticle production at 8 TeV (bottom row). |
png ; pdf |
Figure 11-b:
Marginalized non-DCS distributions (first column), compared with posterior distributions (second column) and survival probabilities (third column) after inclusion of all CMS data, are shown for the $\tilde{ \chi }_1^0$ mass versus gluino mass (first row), versus the LCSP mass (second row), the stop (third row), and versus the logarithm of inclusive cross section for inclusive sparticle production at 8 TeV (bottom row). |

png ; pdf |
Figure 11-c:
Marginalized non-DCS distributions (first column), compared with posterior distributions (second column) and survival probabilities (third column) after inclusion of all CMS data, are shown for the $\tilde{ \chi }_1^0$ mass versus gluino mass (first row), versus the LCSP mass (second row), the stop (third row), and versus the logarithm of inclusive cross section for inclusive sparticle production at 8 TeV (bottom row). |
png ; pdf |
Figure 11-d:
Marginalized non-DCS distributions (first column), compared with posterior distributions (second column) and survival probabilities (third column) after inclusion of all CMS data, are shown for the $\tilde{ \chi }_1^0$ mass versus gluino mass (first row), versus the LCSP mass (second row), the stop (third row), and versus the logarithm of inclusive cross section for inclusive sparticle production at 8 TeV (bottom row). |
png ; pdf |
Figure 11-e:
Marginalized non-DCS distributions (first column), compared with posterior distributions (second column) and survival probabilities (third column) after inclusion of all CMS data, are shown for the $\tilde{ \chi }_1^0$ mass versus gluino mass (first row), versus the LCSP mass (second row), the stop (third row), and versus the logarithm of inclusive cross section for inclusive sparticle production at 8 TeV (bottom row). |
png ; pdf |
Figure 11-f:
Marginalized non-DCS distributions (first column), compared with posterior distributions (second column) and survival probabilities (third column) after inclusion of all CMS data, are shown for the $\tilde{ \chi }_1^0$ mass versus gluino mass (first row), versus the LCSP mass (second row), the stop (third row), and versus the logarithm of inclusive cross section for inclusive sparticle production at 8 TeV (bottom row). |
png ; pdf |
Figure 11-g:
Marginalized non-DCS distributions (first column), compared with posterior distributions (second column) and survival probabilities (third column) after inclusion of all CMS data, are shown for the $\tilde{ \chi }_1^0$ mass versus gluino mass (first row), versus the LCSP mass (second row), the stop (third row), and versus the logarithm of inclusive cross section for inclusive sparticle production at 8 TeV (bottom row). |
png ; pdf |
Figure 11-h:
Marginalized non-DCS distributions (first column), compared with posterior distributions (second column) and survival probabilities (third column) after inclusion of all CMS data, are shown for the $\tilde{ \chi }_1^0$ mass versus gluino mass (first row), versus the LCSP mass (second row), the stop (third row), and versus the logarithm of inclusive cross section for inclusive sparticle production at 8 TeV (bottom row). |
png ; pdf |
Figure 11-i:
Marginalized non-DCS distributions (first column), compared with posterior distributions (second column) and survival probabilities (third column) after inclusion of all CMS data, are shown for the $\tilde{ \chi }_1^0$ mass versus gluino mass (first row), versus the LCSP mass (second row), the stop (third row), and versus the logarithm of inclusive cross section for inclusive sparticle production at 8 TeV (bottom row). |
png ; pdf |
Figure 11-j:
Marginalized non-DCS distributions (first column), compared with posterior distributions (second column) and survival probabilities (third column) after inclusion of all CMS data, are shown for the $\tilde{ \chi }_1^0$ mass versus gluino mass (first row), versus the LCSP mass (second row), the stop (third row), and versus the logarithm of inclusive cross section for inclusive sparticle production at 8 TeV (bottom row). |
png ; pdf |
Figure 11-k:
Marginalized non-DCS distributions (first column), compared with posterior distributions (second column) and survival probabilities (third column) after inclusion of all CMS data, are shown for the $\tilde{ \chi }_1^0$ mass versus gluino mass (first row), versus the LCSP mass (second row), the stop (third row), and versus the logarithm of inclusive cross section for inclusive sparticle production at 8 TeV (bottom row). |
png ; pdf |
Figure 11-l:
Marginalized non-DCS distributions (first column), compared with posterior distributions (second column) and survival probabilities (third column) after inclusion of all CMS data, are shown for the $\tilde{ \chi }_1^0$ mass versus gluino mass (first row), versus the LCSP mass (second row), the stop (third row), and versus the logarithm of inclusive cross section for inclusive sparticle production at 8 TeV (bottom row). |

png ; pdf |
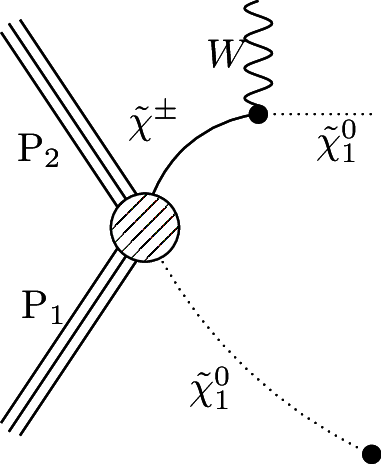
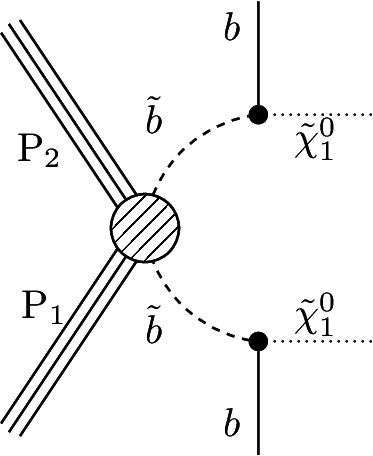
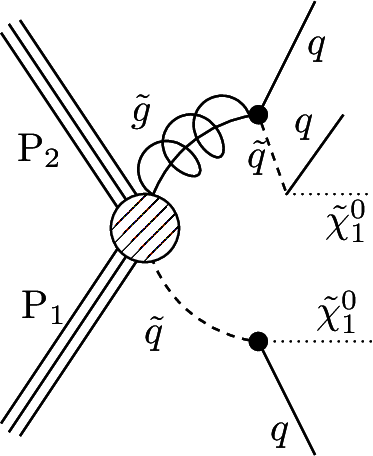
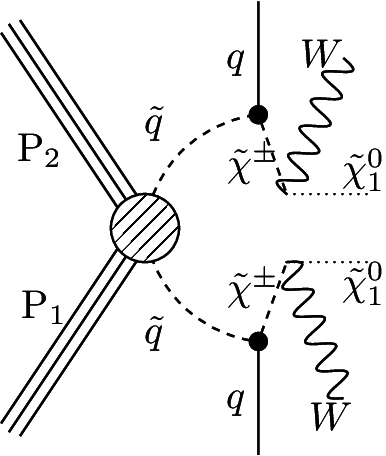
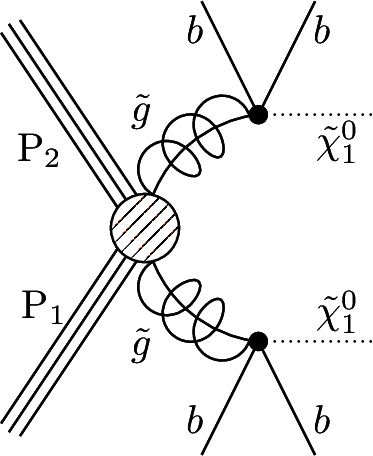
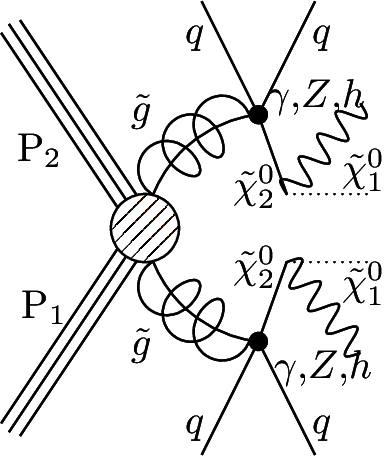
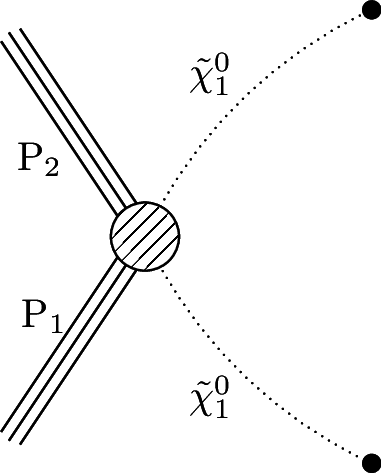
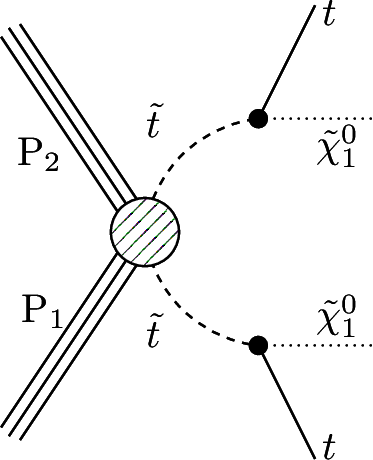
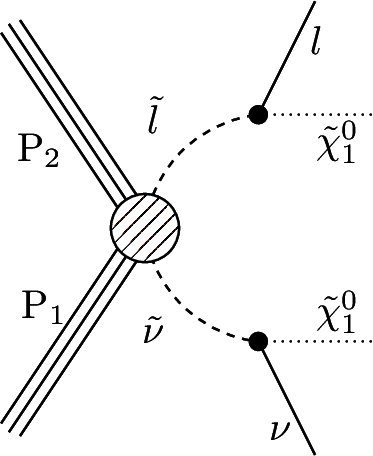
Figure 12-a:
The twelve most common principal processes in the pMSSM, listed in order of their frequency in the set of all studied model points. |
png ; pdf |
Figure 12-b:
The twelve most common principal processes in the pMSSM, listed in order of their frequency in the set of all studied model points. |

png ; pdf |
Figure 12-c:
The twelve most common principal processes in the pMSSM, listed in order of their frequency in the set of all studied model points. |
png ; pdf |
Figure 12-d:
The twelve most common principal processes in the pMSSM, listed in order of their frequency in the set of all studied model points. |

png ; pdf |
Figure 12-e:
The twelve most common principal processes in the pMSSM, listed in order of their frequency in the set of all studied model points. |
png ; pdf |
Figure 12-f:
The twelve most common principal processes in the pMSSM, listed in order of their frequency in the set of all studied model points. |
png ; pdf |
Figure 12-g:
The twelve most common principal processes in the pMSSM, listed in order of their frequency in the set of all studied model points. |
png ; pdf |
Figure 12-h:
The twelve most common principal processes in the pMSSM, listed in order of their frequency in the set of all studied model points. |
png ; pdf |
Figure 12-i:
The twelve most common principal processes in the pMSSM, listed in order of their frequency in the set of all studied model points. |
png ; pdf |
Figure 12-j:
The twelve most common principal processes in the pMSSM, listed in order of their frequency in the set of all studied model points. |
png ; pdf |
Figure 12-k:
The twelve most common principal processes in the pMSSM, listed in order of their frequency in the set of all studied model points. |
png ; pdf |
Figure 12-l:
The twelve most common principal processes in the pMSSM, listed in order of their frequency in the set of all studied model points. |
png ; pdf |
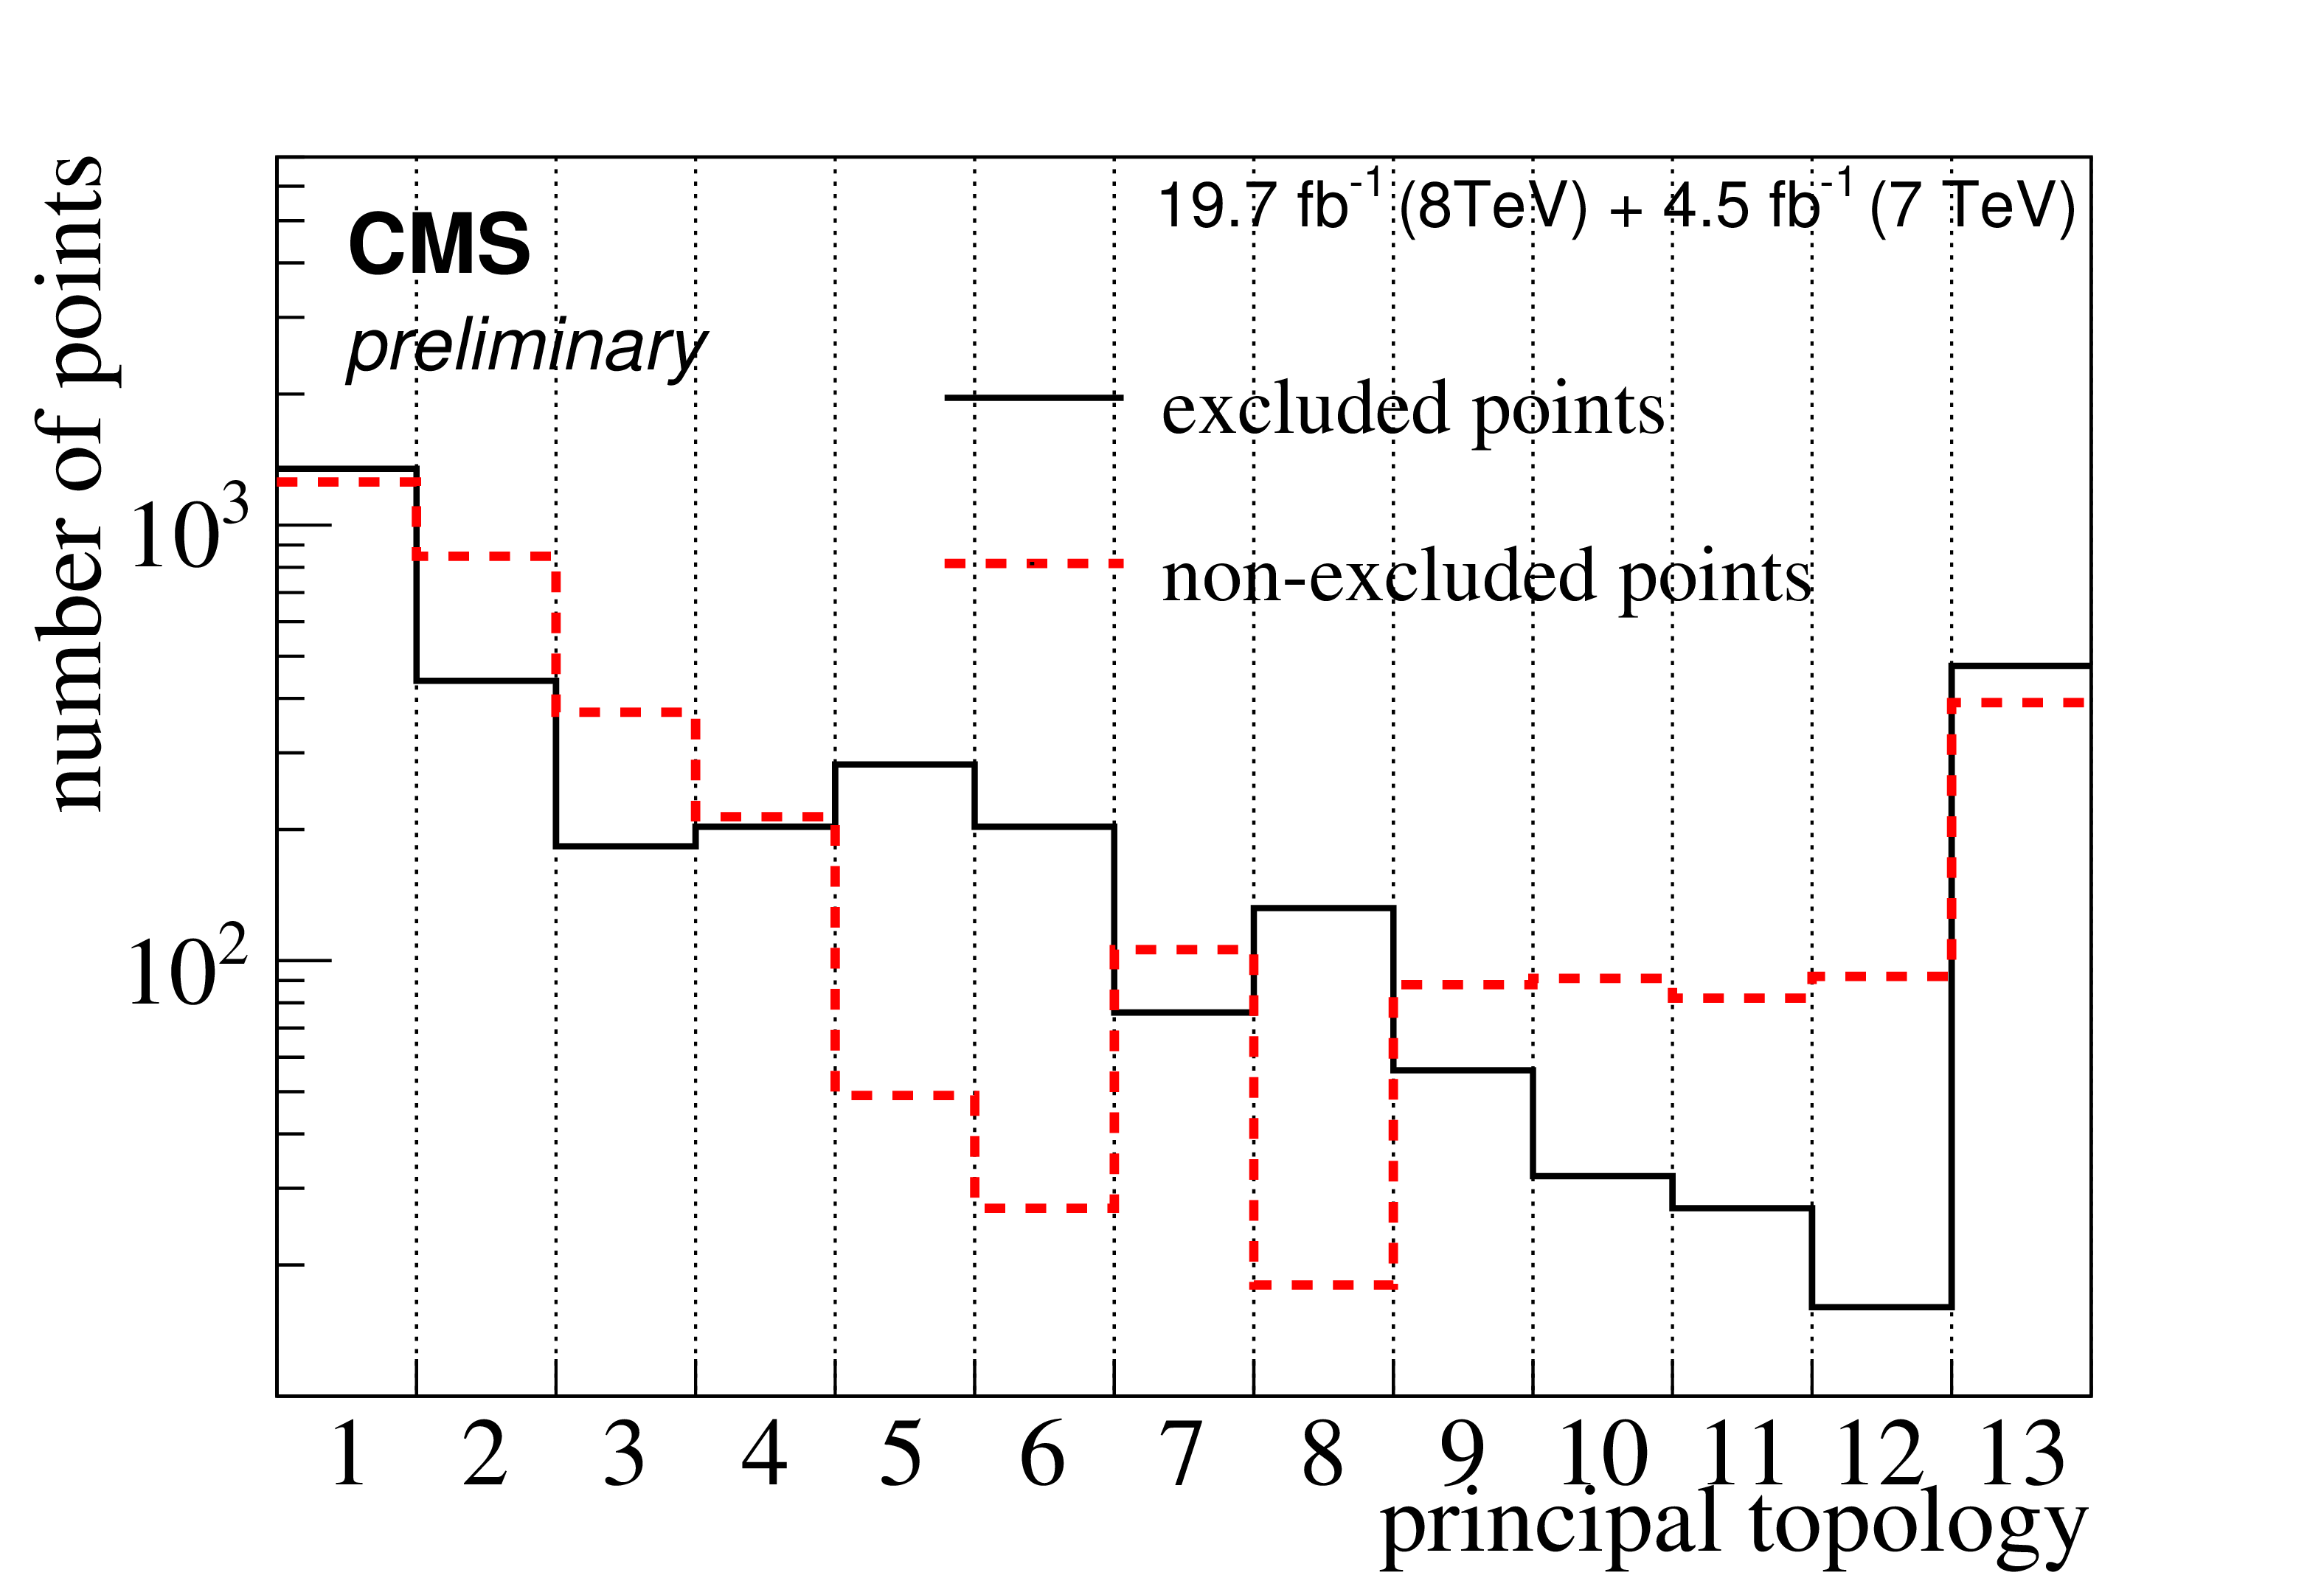
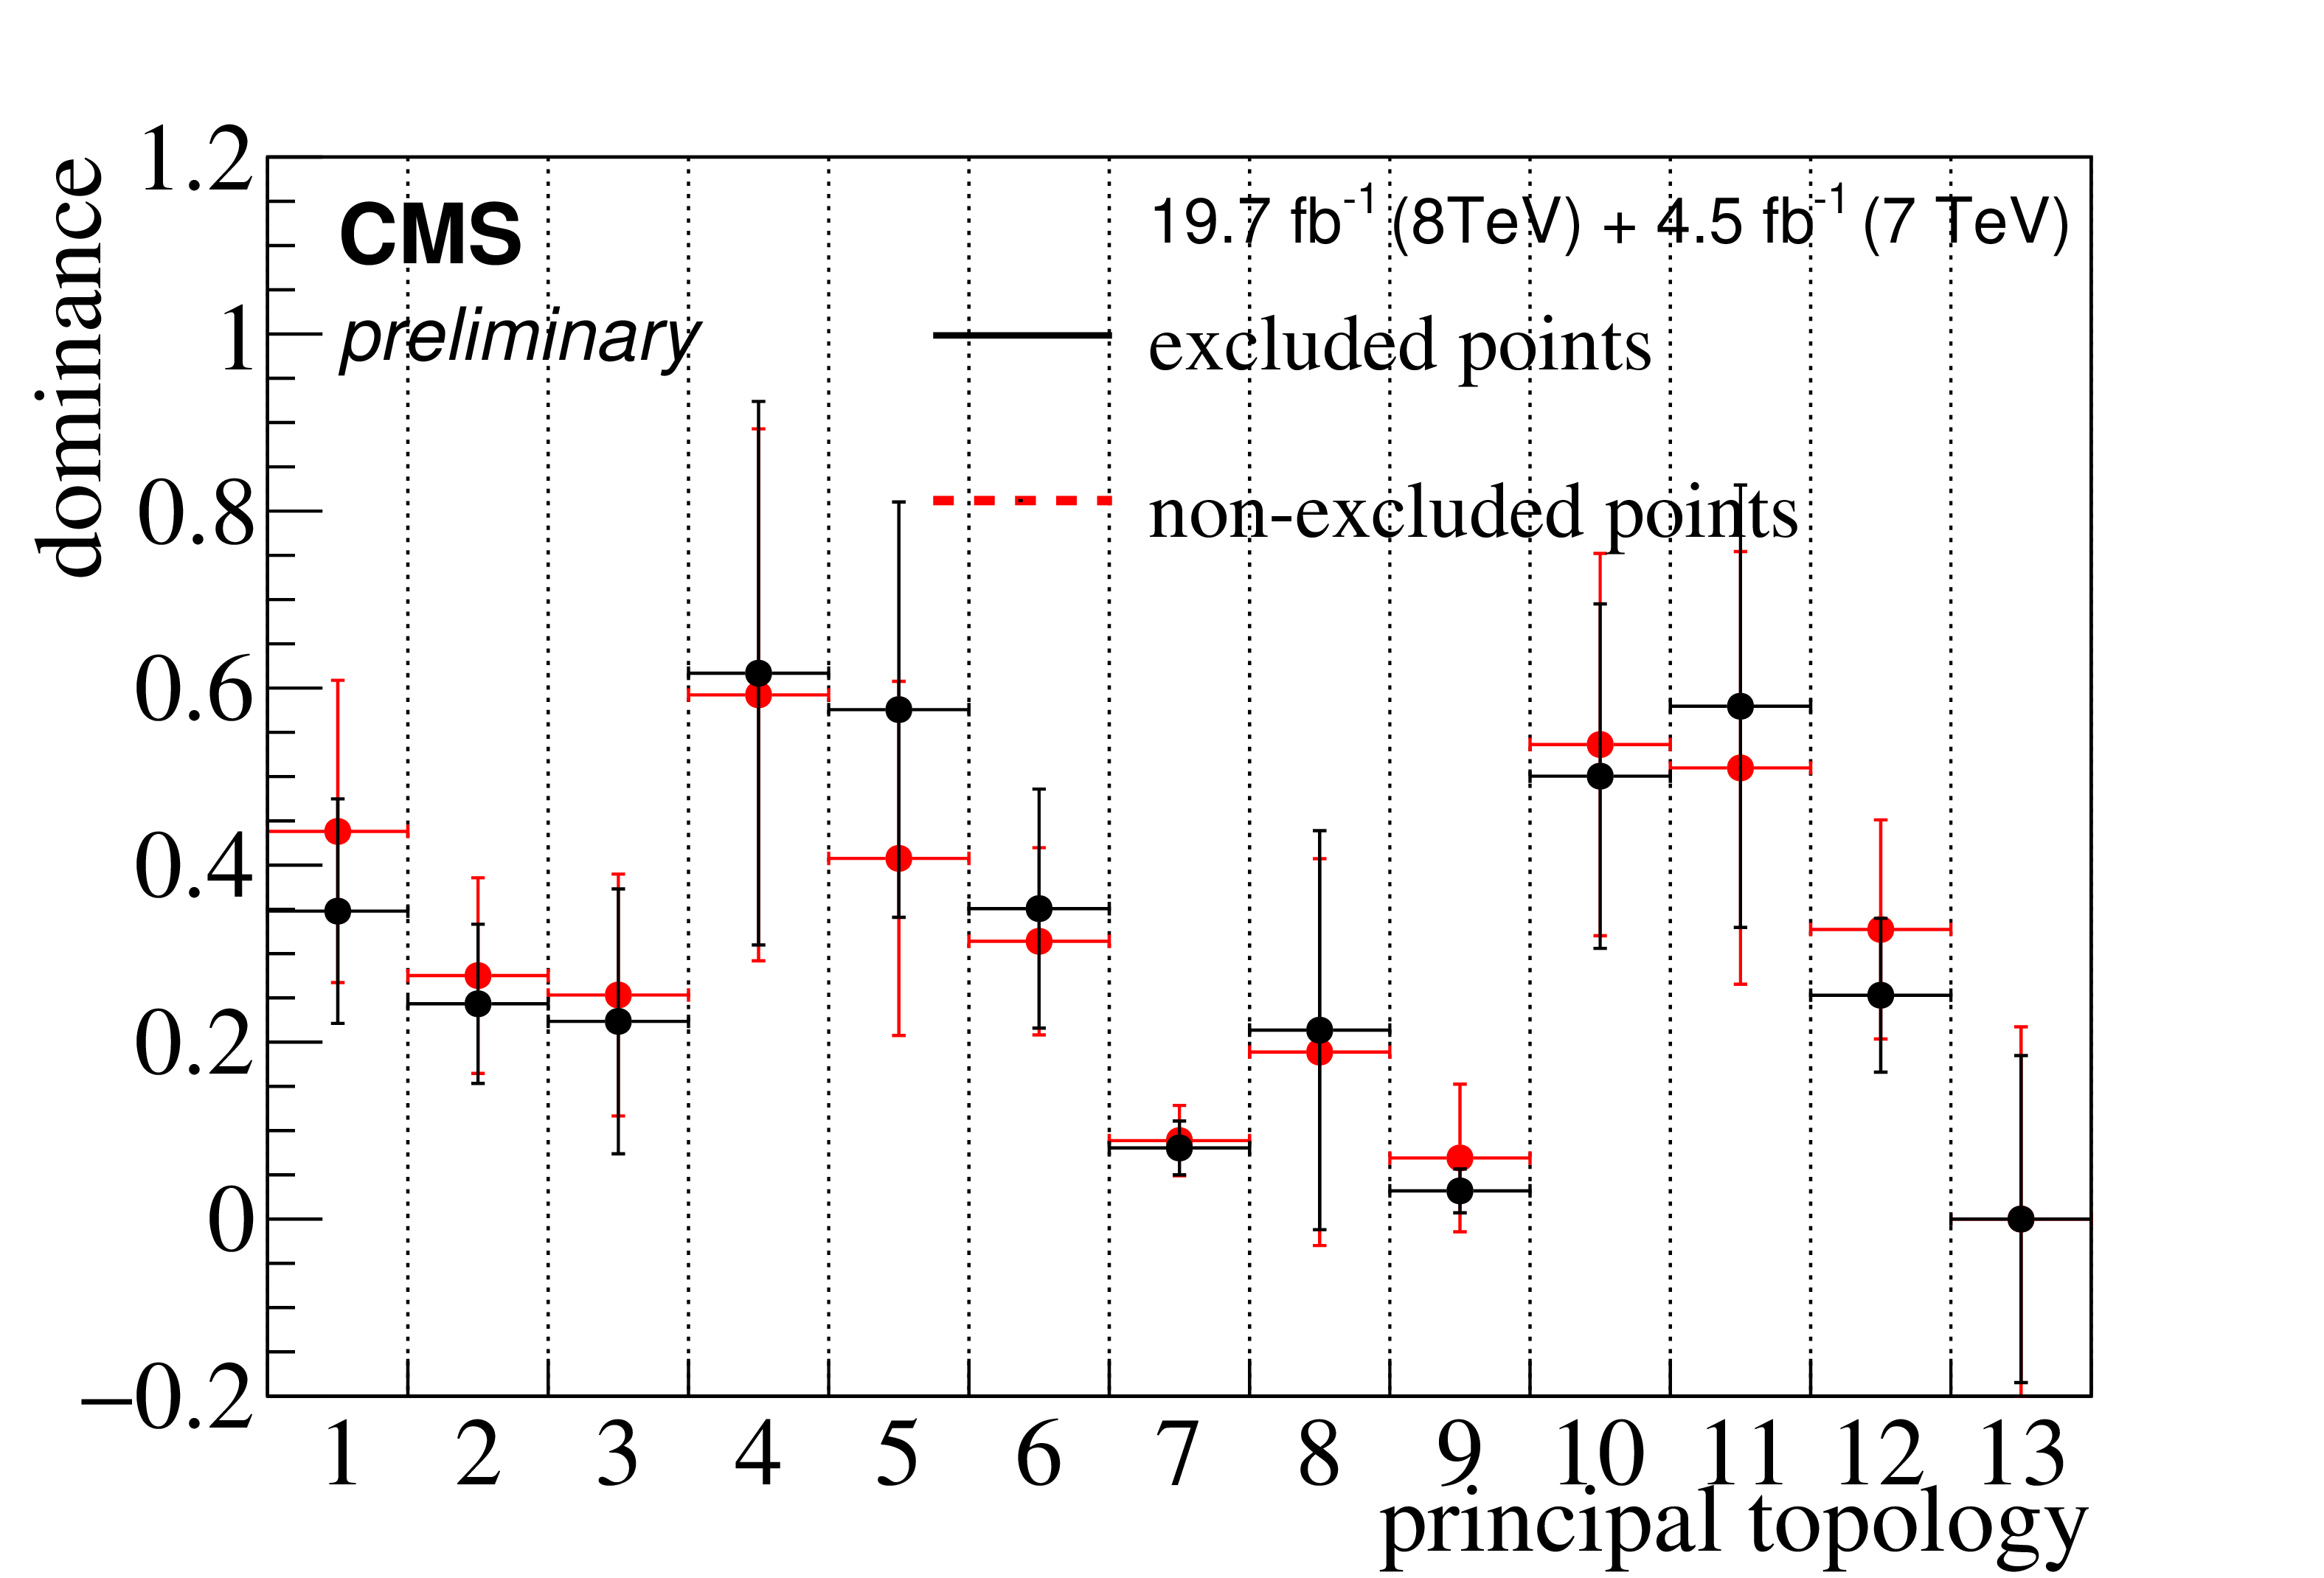
Figure 13-a:
The unweighted distribution of topologies for the excluded (black) and non-excluded (red) pMSSM points is given in (a). The dominance of the principal topologies is given in (b), where the value is the mean of the distribution of dominance values for all model points in the given bin, and the error bars are the RMS of this distribution. |
png ; pdf |
Figure 13-b:
The unweighted distribution of topologies for the excluded (black) and non-excluded (red) pMSSM points is given in (a). The dominance of the principal topologies is given in (b), where the value is the mean of the distribution of dominance values for all model points in the given bin, and the error bars are the RMS of this distribution. |
png ; pdf |
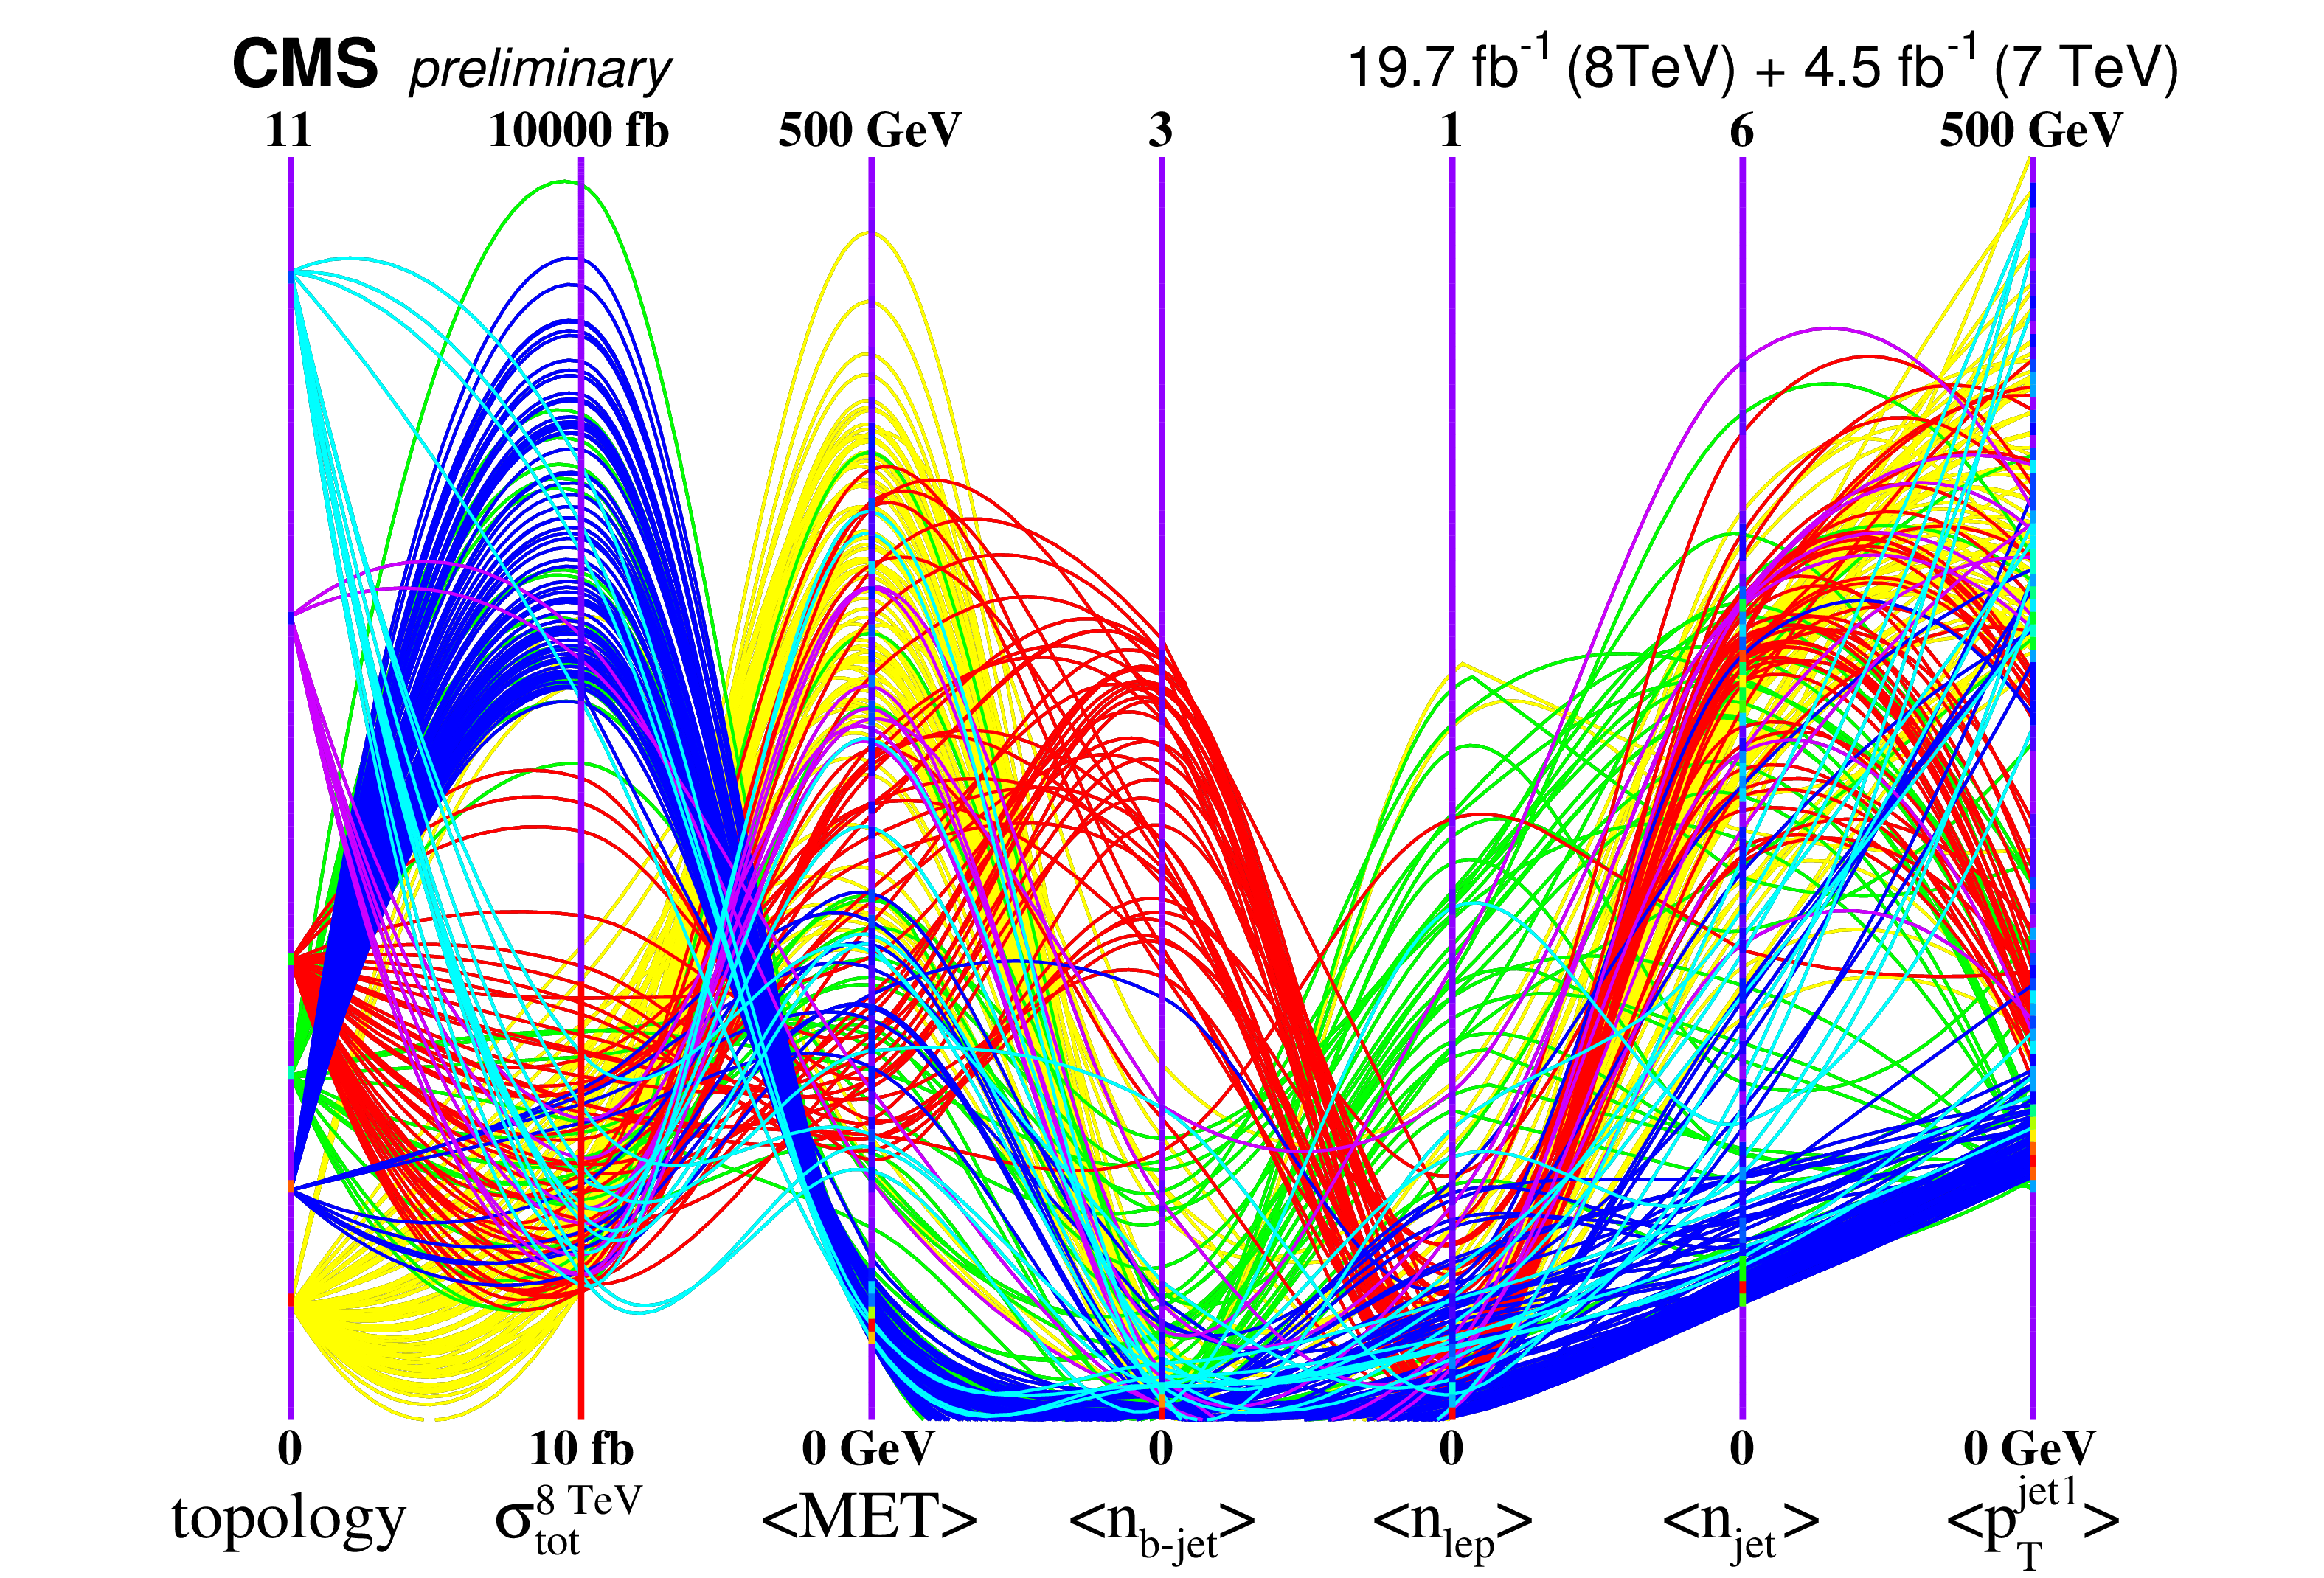
Figure 14:
A parallel coordinates plot showing a few hundred selected non-excluded model points for the six most common principal topologies, with seven key properties. Properties are represented by vertical parallel axes, and a single model point corresponds to a curved line traversing the plot from left to right, intersecting each axis at the parameter value taken by the model point. From the left, the selected properties are: the principal topology, the 8 TeV signal production cross section (in log$_{10}$ scale), the average value of the MET, the average number of b-jets, leptons, and jets, and finally, the average transverse momentum of the leading jet. Color is assigned based on the principal topology. Yellow codes for topology 1, blue for topology 2, green for 3, red for 4, violet for 7, and cyan for 10. Lines arching toward higher vertical positions typically indicate more ``discoverable'' scenarios. |
png ; pdf |
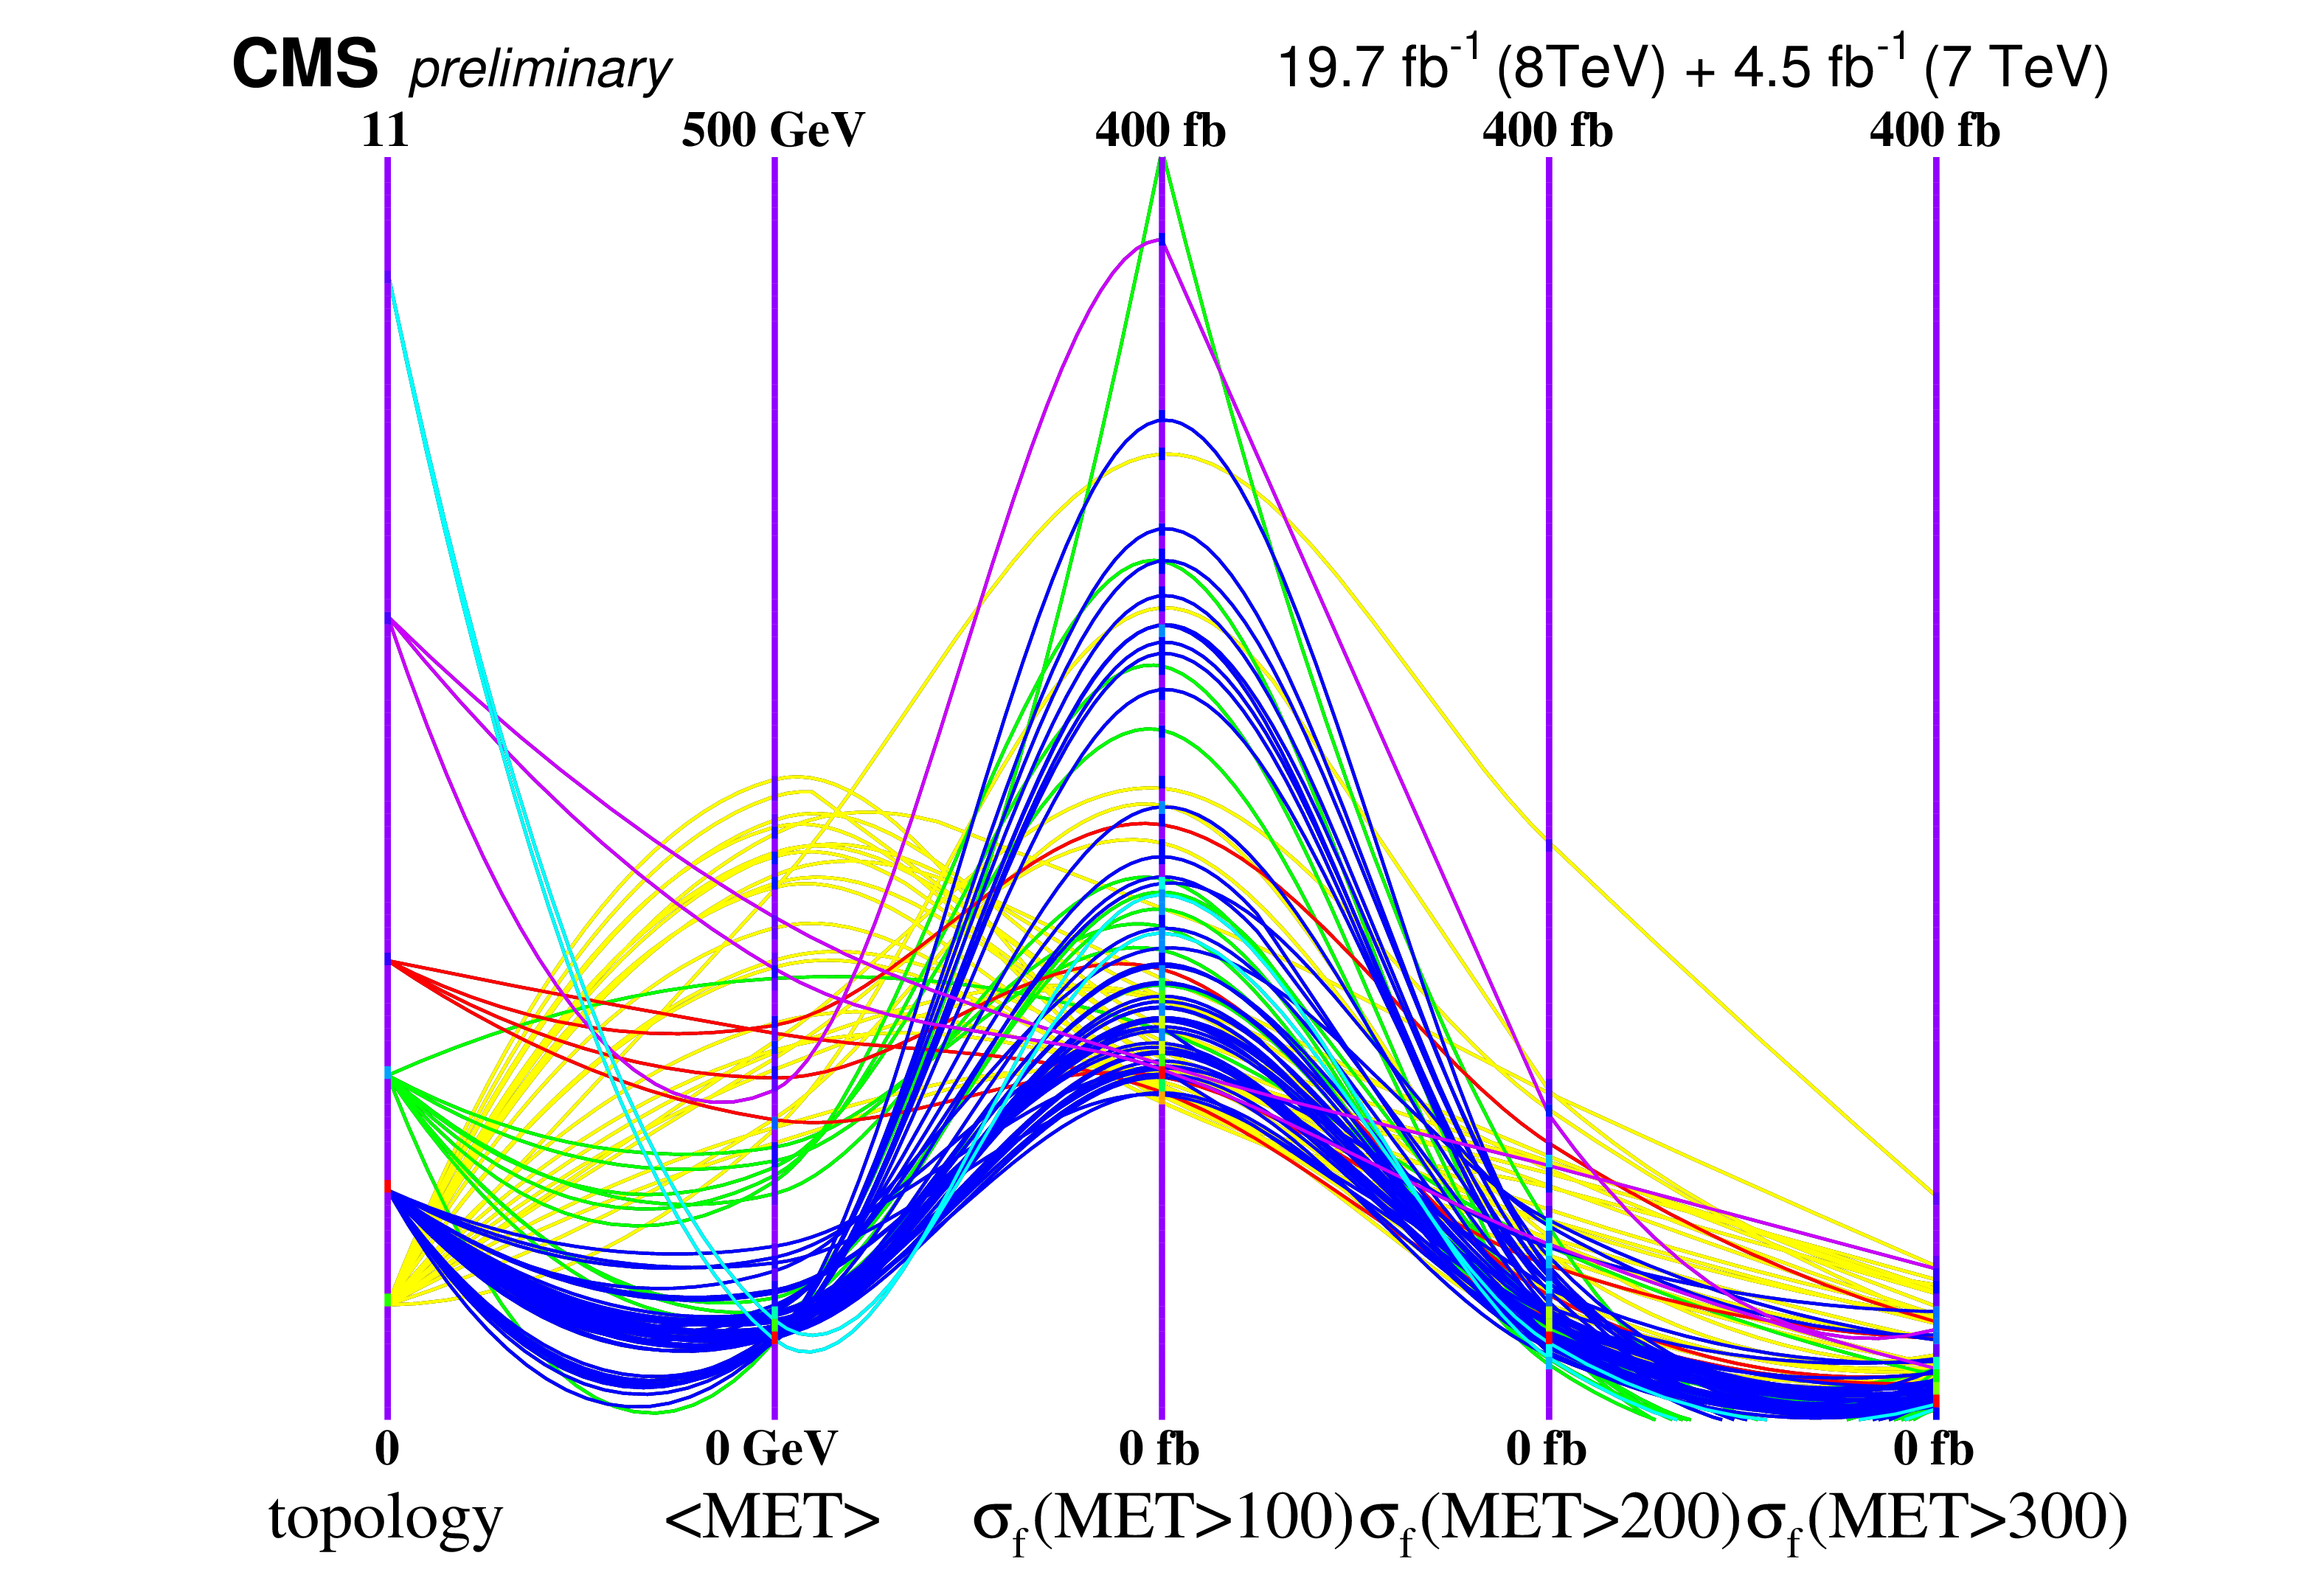
Figure 15:
A parallel coordinates plot of the non-excluded pMSSM points with the axes set as the principal topology, the average MET, and the fiducial cross section (in linear scale) for various thresholds on the MET. All non-excluded points corresponding to topologies 1, 2, 3, 4, 7, and 10 that have a loose fiducial cross section greater than 100 fb are shown. Color is assigned to values of the principal topology in the same manner as in Fig.14. Energy units are in GeV. |
png ; pdf |
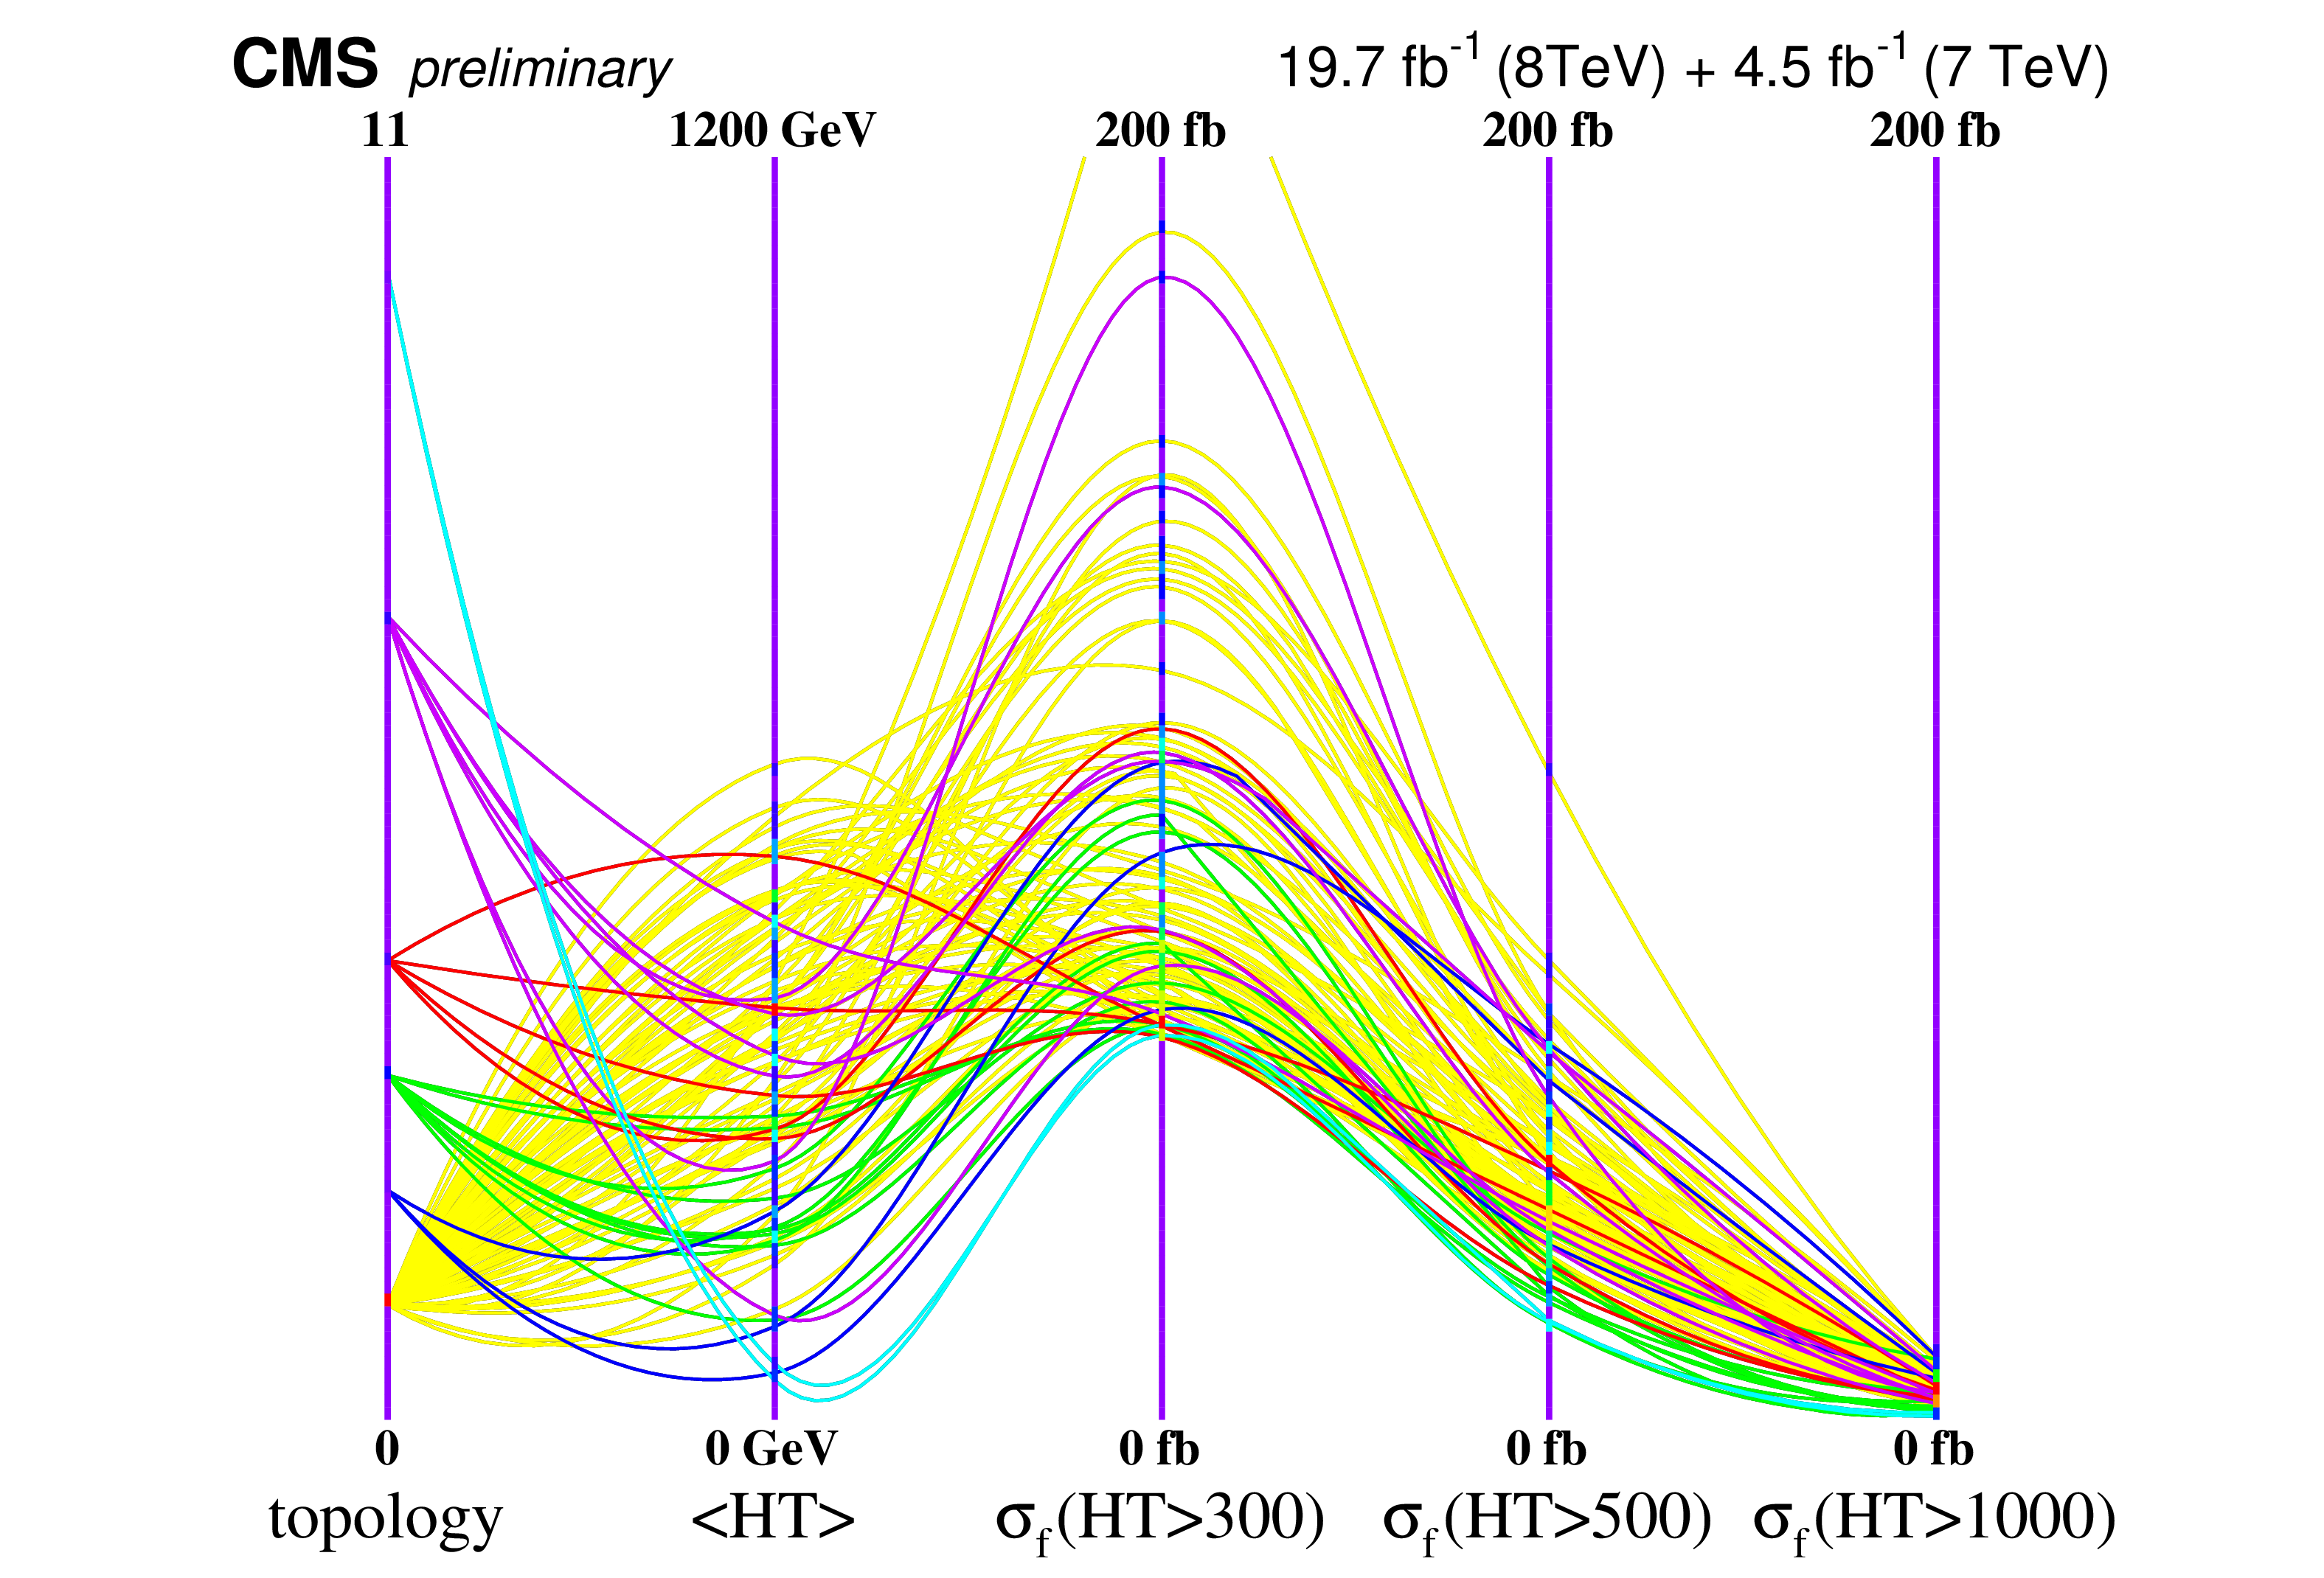
Figure 16:
A parallel coordinates plot of the non-excluded pMSSM points with the axes set as the principal topology, the average HT, and the fiducial cross section (in linear scale) for various thresholds on the HT. All non-excluded points corresponding to topologies 1, 2, 3, 4, 7, and 10 that have a loose fiducial cross section greater than 60 fb are shown. Color is assigned to values of the principal topology in the same manner as in Fig.14. Energy units are in GeV. |
png ; pdf |
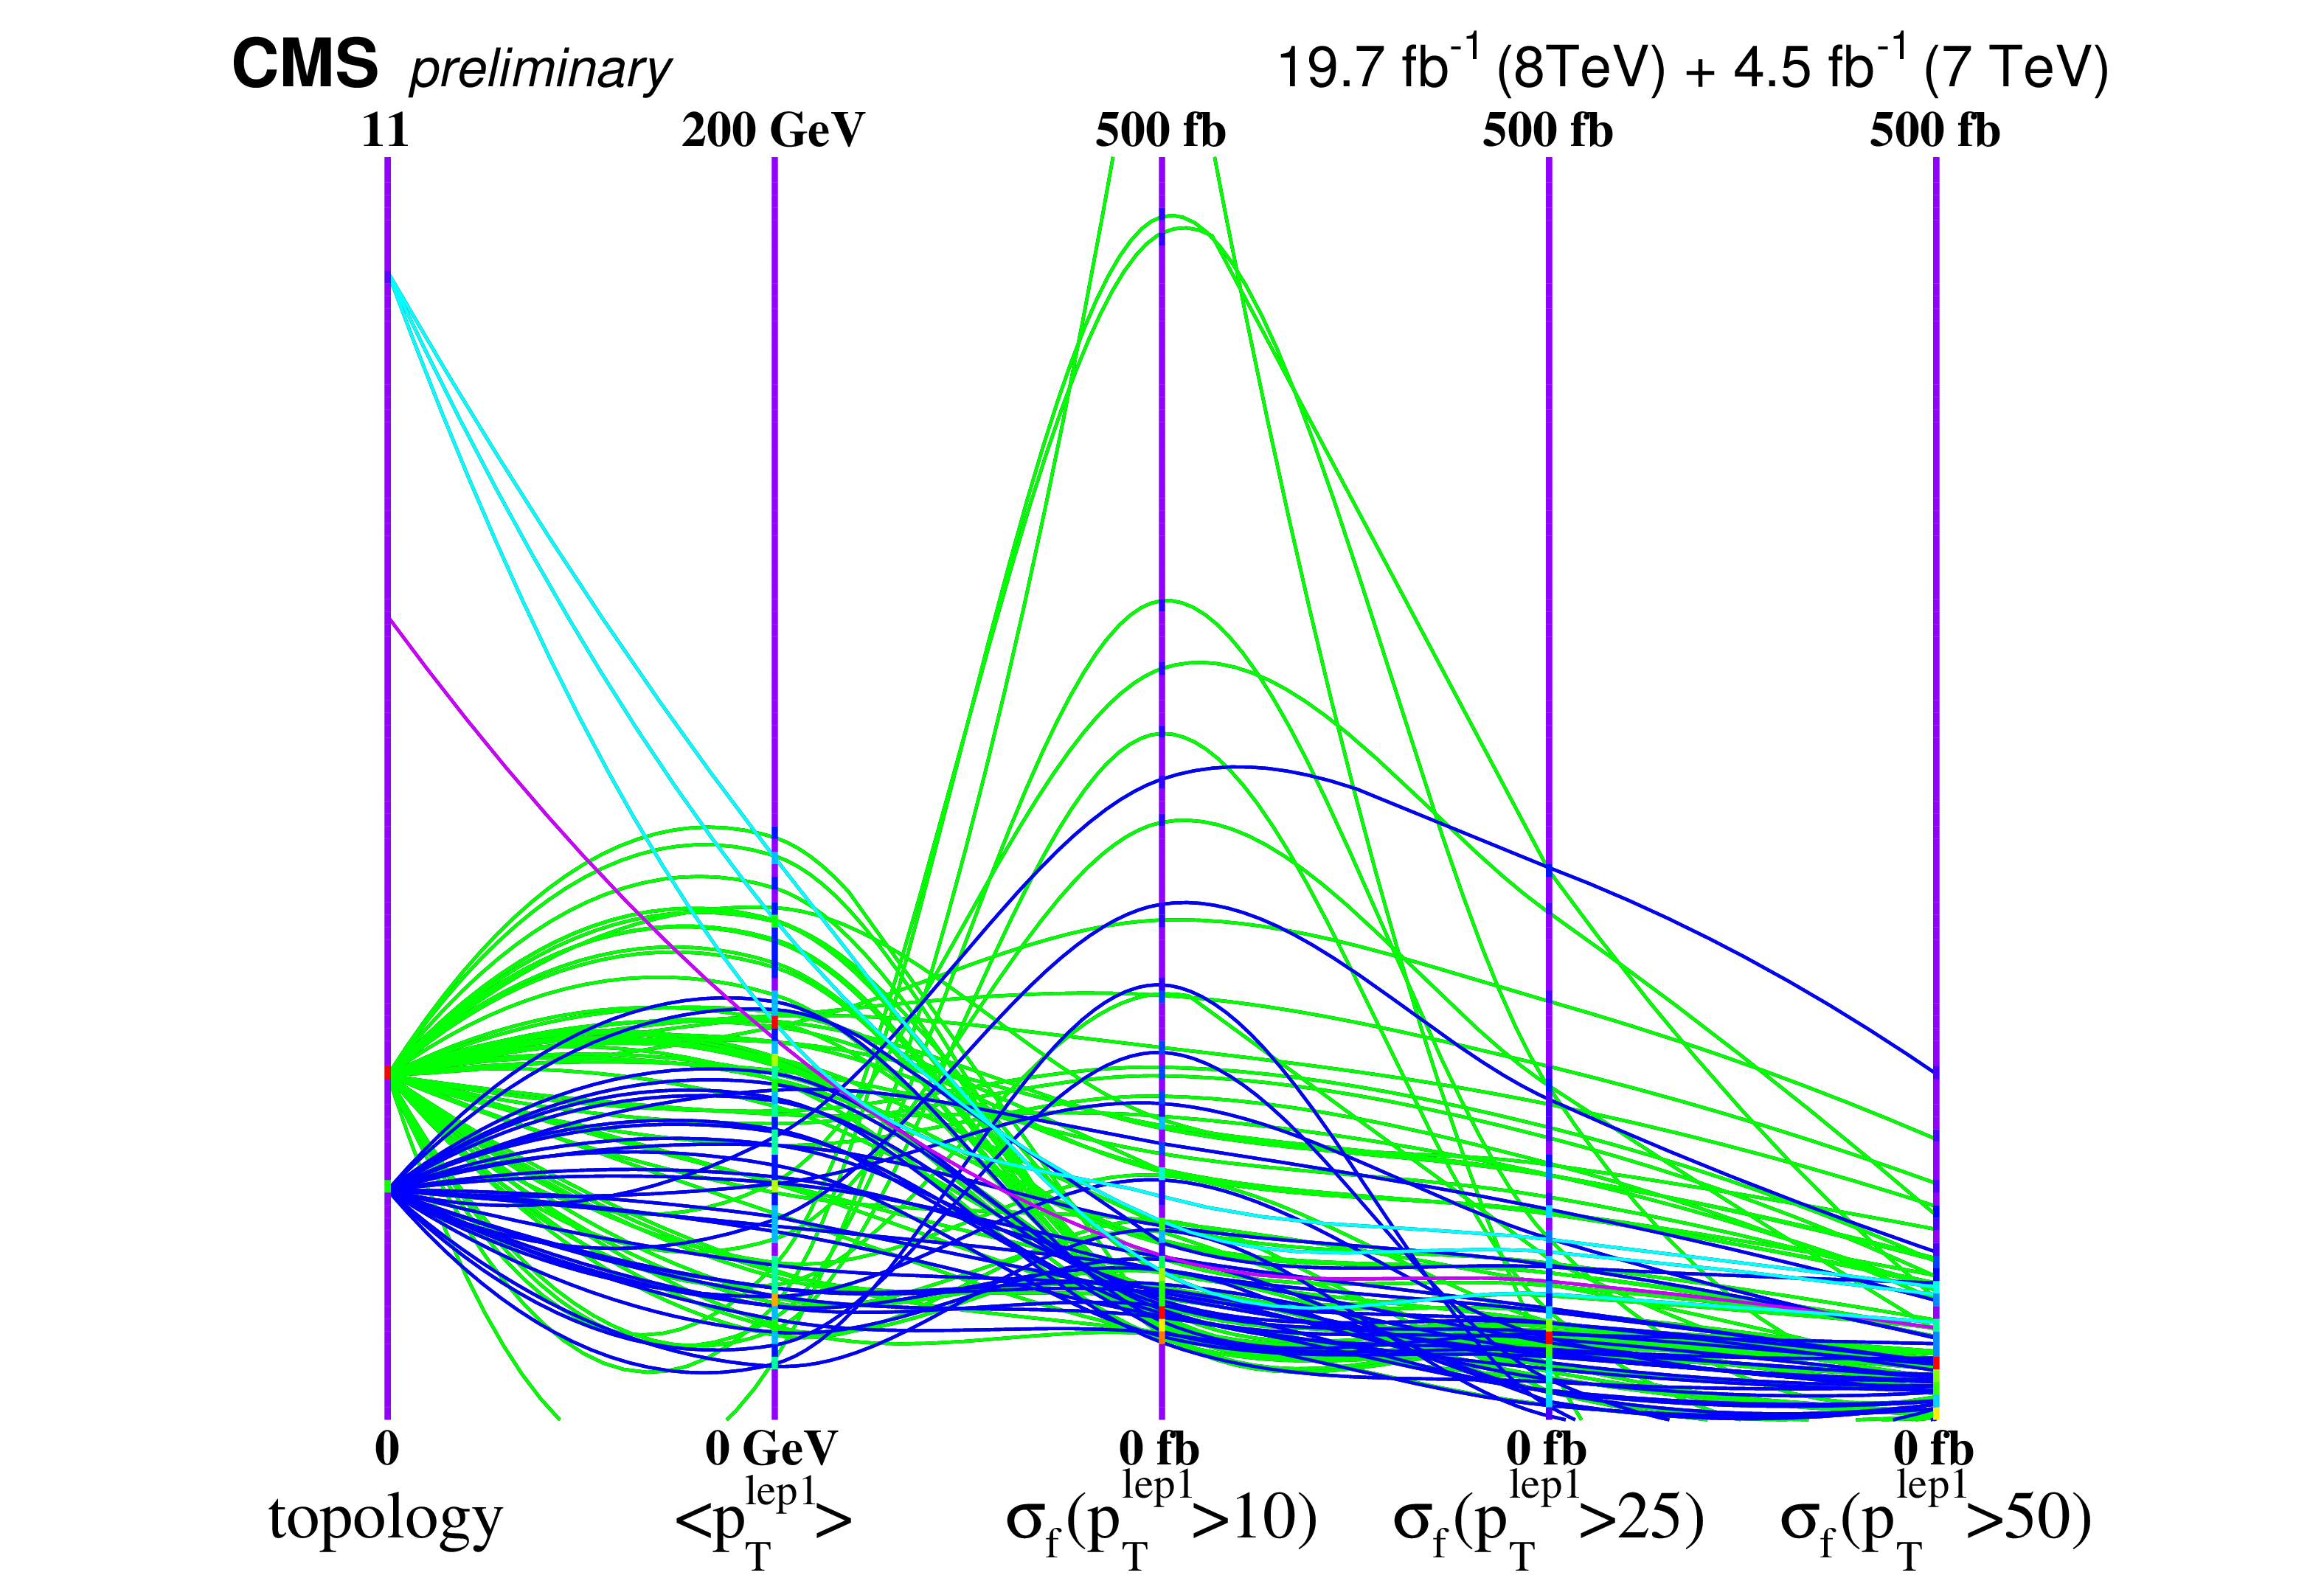
Figure 17:
A parallel coordinates plot of the non-excluded pMSSM points with the axes set as the principal topology, the average leading lepton $p_{\mathrm{T}}$, and the fiducial cross section (in linear scale) for various thresholds on the leading lepton $p_{\mathrm{T}}$. All non-excluded points corresponding to topologies 1, 2, 3, 4, 7, and 10 that have a loose fiducial cross section greater than 30 fb are shown. Color is assigned to values of the principal topology in the same manner as in Fig.14. Energy units are in GeV. |
| Tables | |
png ; pdf |
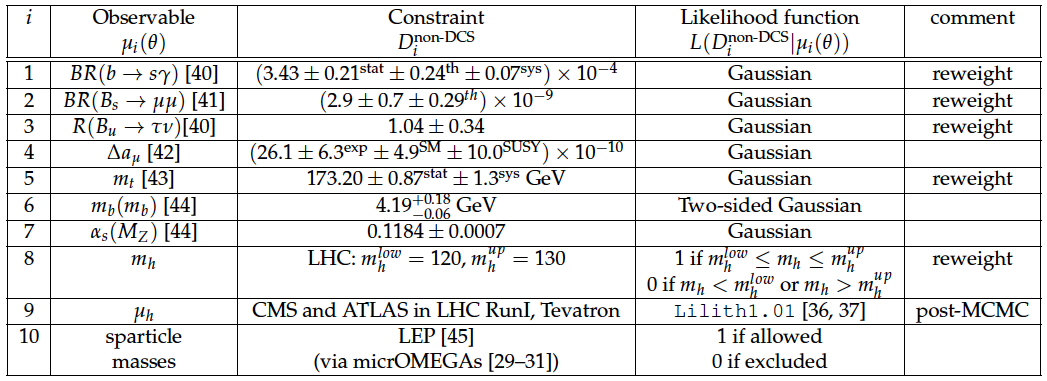
Table 1:
The measurements that are the basis of the non-DCS prior $p^{\textrm {non-DCS}}(\theta )$ for the pMSSM parameters. See text for details. |
png ; pdf |
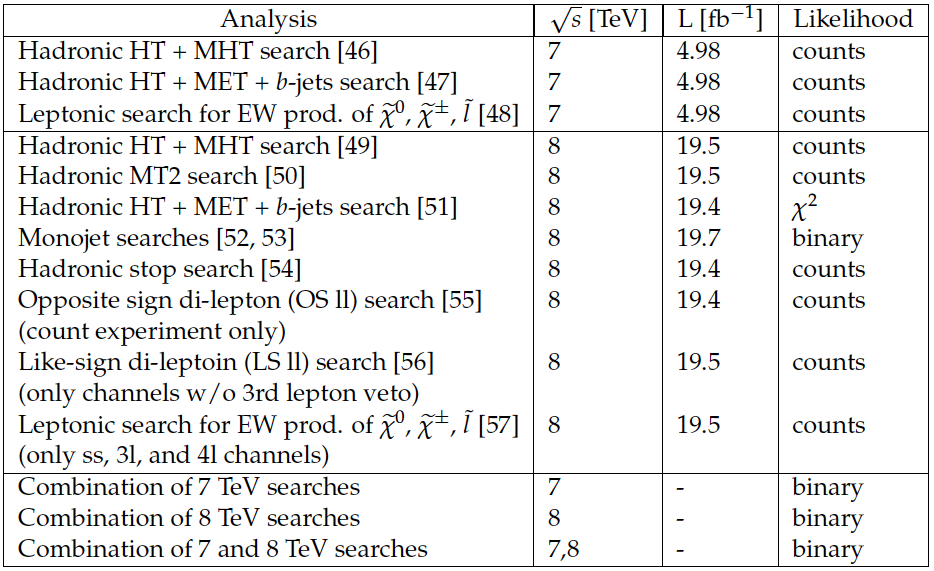
Table 2:
The CMS analyses considered in this study. Listed are the analyses (Analysis), the center-of-mass energy at which data were collected ($\sqrt {s}$), the associated integrated luminosity ($L$), the likelihood used (Likelihood), and the reference to the analysis documentation. |
png ; pdf |
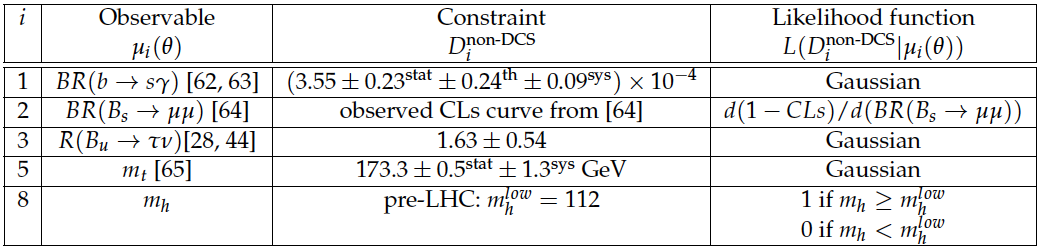
Table 3:
Original values for the non-DCS constraints used in the MCMC scan, which were later updated to the values in Table 1. |
| Summary |
| We have investigated the impact of a representative set of the 7+8 TeV CMS SUSY searches on a potentially accessible sub-space of the pMSSM, a 19-dimensional proxy for the R-parity conserving weak-scale MSSM, defined at the SUSY scale. The sub-space, which is sampled using an MCMC method and a prior that incorporates data from precision measurements and non-direct CMS searches, covers sparticle masses up to about 3 TeV. Because this study relies on a fast detector simulation that does not provide an accurate description of massive long-lived charged particles, we work within a subspace of the pMSSM where the chargino lifetime $c\tau(\tilde{\chi}^\pm_1)$ is less than 10 mm. The analyses included in this study span a variety of final states, which permit a broad exploration of the pMSSM, and by association the MSSM. The analyses include hadronic searches (HT + MHT, HT + MET + $b$-jets, MT2, monojets, stop), opposite-sign and like-sign leptonic searches, and leptonic searches for electroweak production of sparticles. We studied the effect of individual searches as well as various combinations including the combination of all the 7+8 TeV results. Searches based on the MT2 observable prove to be the most decisive in probing the mass of $\tilde{\chi}^0_1$, while, owing to the diversity of final states and decay chains to which they are sensitive, the HT+MHT searches make the largest overall contribution to our current state of knowledge of SUSY. We note that these statements are based on the observed impact of the searches in data, and not on their expected impact. The CMS searches exclude all pMSSM points with a gluino mass less than 500 GeV and probe pMSSM points with gluino masses up to the highest masses covered in this scan using production processes involving the other lighter states. All pMSSM points are excluded in which the lightest colored supersymmetric particle has a mass less than 300 GeV, but the CMS searches remain sensitive up to masses as high as $\sim$1.5 TeV. Little has been learned about the mass of the lighter top squark, $\tilde{t}_1$, in spite of the fact that the stop-targeted searches considered exclude $\tilde{t}_1$ up to approximately 500 GeV in an SMS context. Constraints from previous experiments suppress the probability density in the light top squark regime at the level of the prior, and so a limited impact is observed on $m_{\tilde{t}_1}$. However, it is noted that the dedicated stop searches have an important impact on the other parameters. Searches targeting direct sbottom and stau production are not included in this interpretation, and we note that the inclusion of these searches would further constrain the pMSSM. An interesting observation holds for the masses of the gluino, first and second generation squarks, charginos, and neutralinos; namely, that when the full diversity of SUSY spectra and decay chains are included, some of the existing limits purportedly placed on the masses of the SUSY particles are evaded. We should, therefore, exercise caution when drawing conclusions about what has been excluded using models based on simplified spectra, models that impose specific relationships between sparticle properties, or models that assume 100% branching ratios. The measurements of the Higgs boson mass and signal strengths do not alter the conclusions based on the CMS SUSY searches. We investigated the non-excluded parameter space and found that half of the surviving model points have cross sections greater than 10 fb. These points evade the analyses primarily because they are characterized by HT and MET that fall below the thresholds used in these analyses. The final states of non-excluded points have a significant contribution from Standard Model backgrounds, which presents a challenge for future analyses. Analyses that consider soft objects, small MET and HT, or new techniques to suppress or more precisely estimate background distributions, could have the potential to make an impact on the non-excluded points. The above conclusions are robust statements about what current data tell us and do not tell us about the MSSM and demonstrate that a great deal more work is needed either to confirm or refute the weak-scale SUSY hypothesis. |
|
|
Compact Muon Solenoid LHC, CERN |
|

|

|

|

|

|