

Compact Muon Solenoid
LHC, CERN
| CMS-PAS-SUS-15-008 | ||
| Search for SUSY in same-sign dilepton events at $ \sqrt{s} = $ 13 TeV | ||
| CMS Collaboration | ||
| December 2015 | ||
| Abstract: A search for new physics is performed using events with a pair of isolated same-sign leptons and jets in the final state using the CMS detector. Results are based on a sample of proton-proton collisions at a centre-of-mass energy of 13 TeV at the LHC corresponding to an integrated luminosity of 2.2 fb$^{-1}$. In order to be sensitive to a wide variety of possible signals beyond the standard model, we consider multiple search regions defined by the missing transverse energy, the hadronic transverse energy, the transverse mass, the number of jets and b quark jets, and the transverse momenta of the leptons in the event. No excess above the standard model background expectation is observed and constraints are set on the gluino pair production cross section; model independent limits and selection efficiencies are also provided for additional model testing. | ||
|
Links:
CDS record (PDF) ;
CADI line (restricted) ;
These preliminary results are superseded in this paper, EPJC 76 (2016) 439. The superseded preliminary plots can be found here. |
||
| Figures | |
png ; pdf ; |
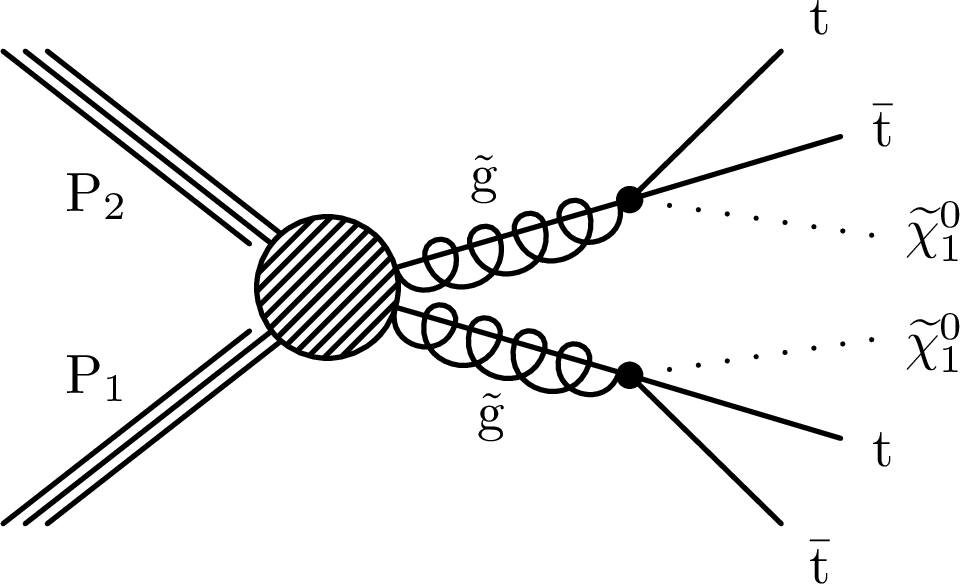
Figure 1-a:
Diagrams for possible SUSY processes yielding two same-sign leptons in the final state. |
png ; pdf ; |
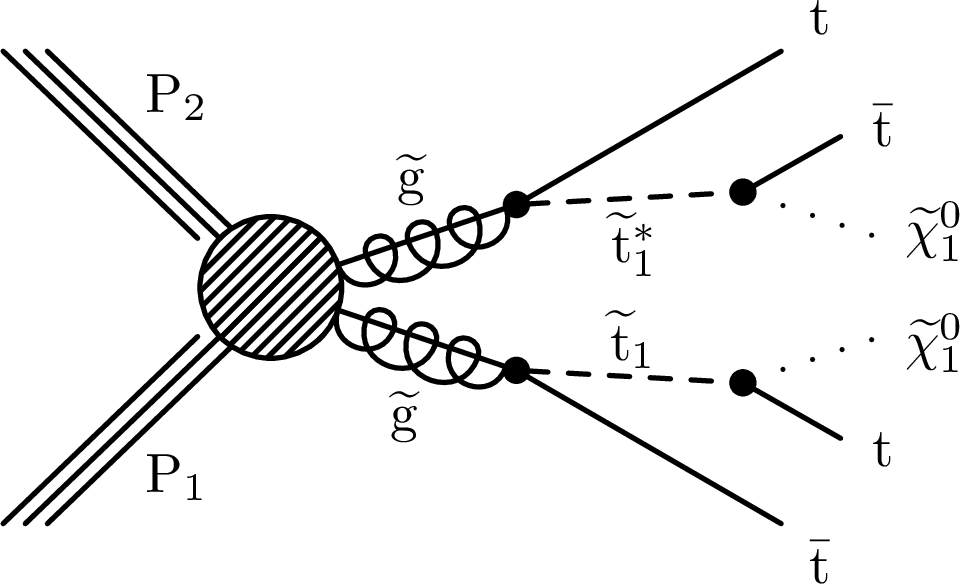
Figure 1-b:
Diagrams for possible SUSY processes yielding two same-sign leptons in the final state. |
png ; pdf ; |
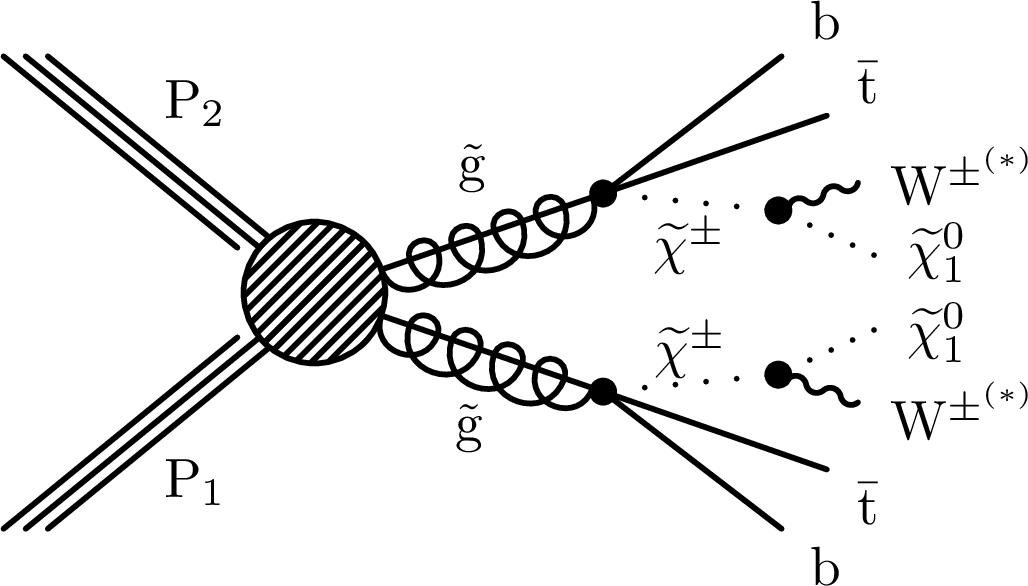
Figure 1-c:
Diagrams for possible SUSY processes yielding two same-sign leptons in the final state. |
png ; pdf ; |
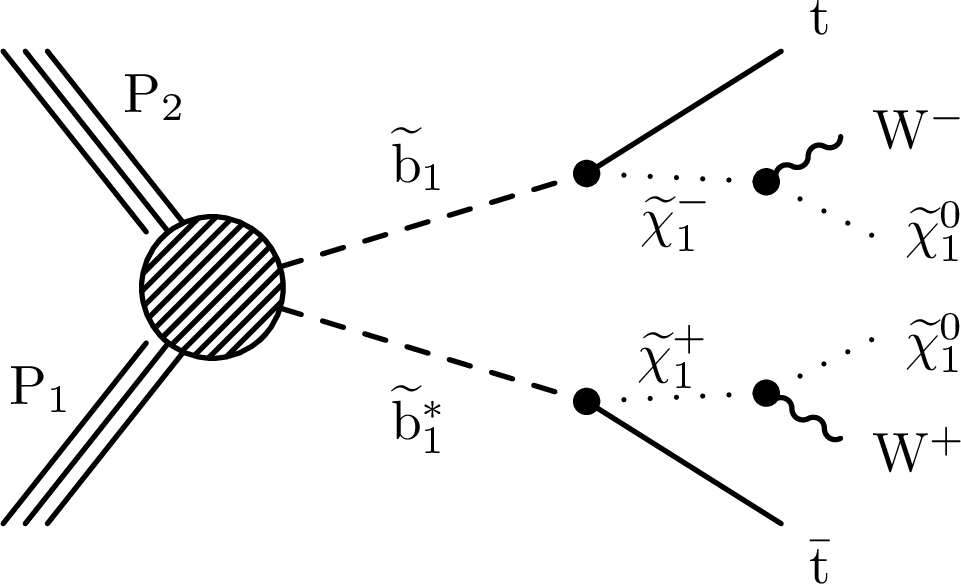
Figure 1-d:
Diagrams for possible SUSY processes yielding two same-sign leptons in the final state. |

png ; pdf ; |
Figure 1-e:
Diagrams for possible SUSY processes yielding two same-sign leptons in the final state. |
png ; pdf ; |
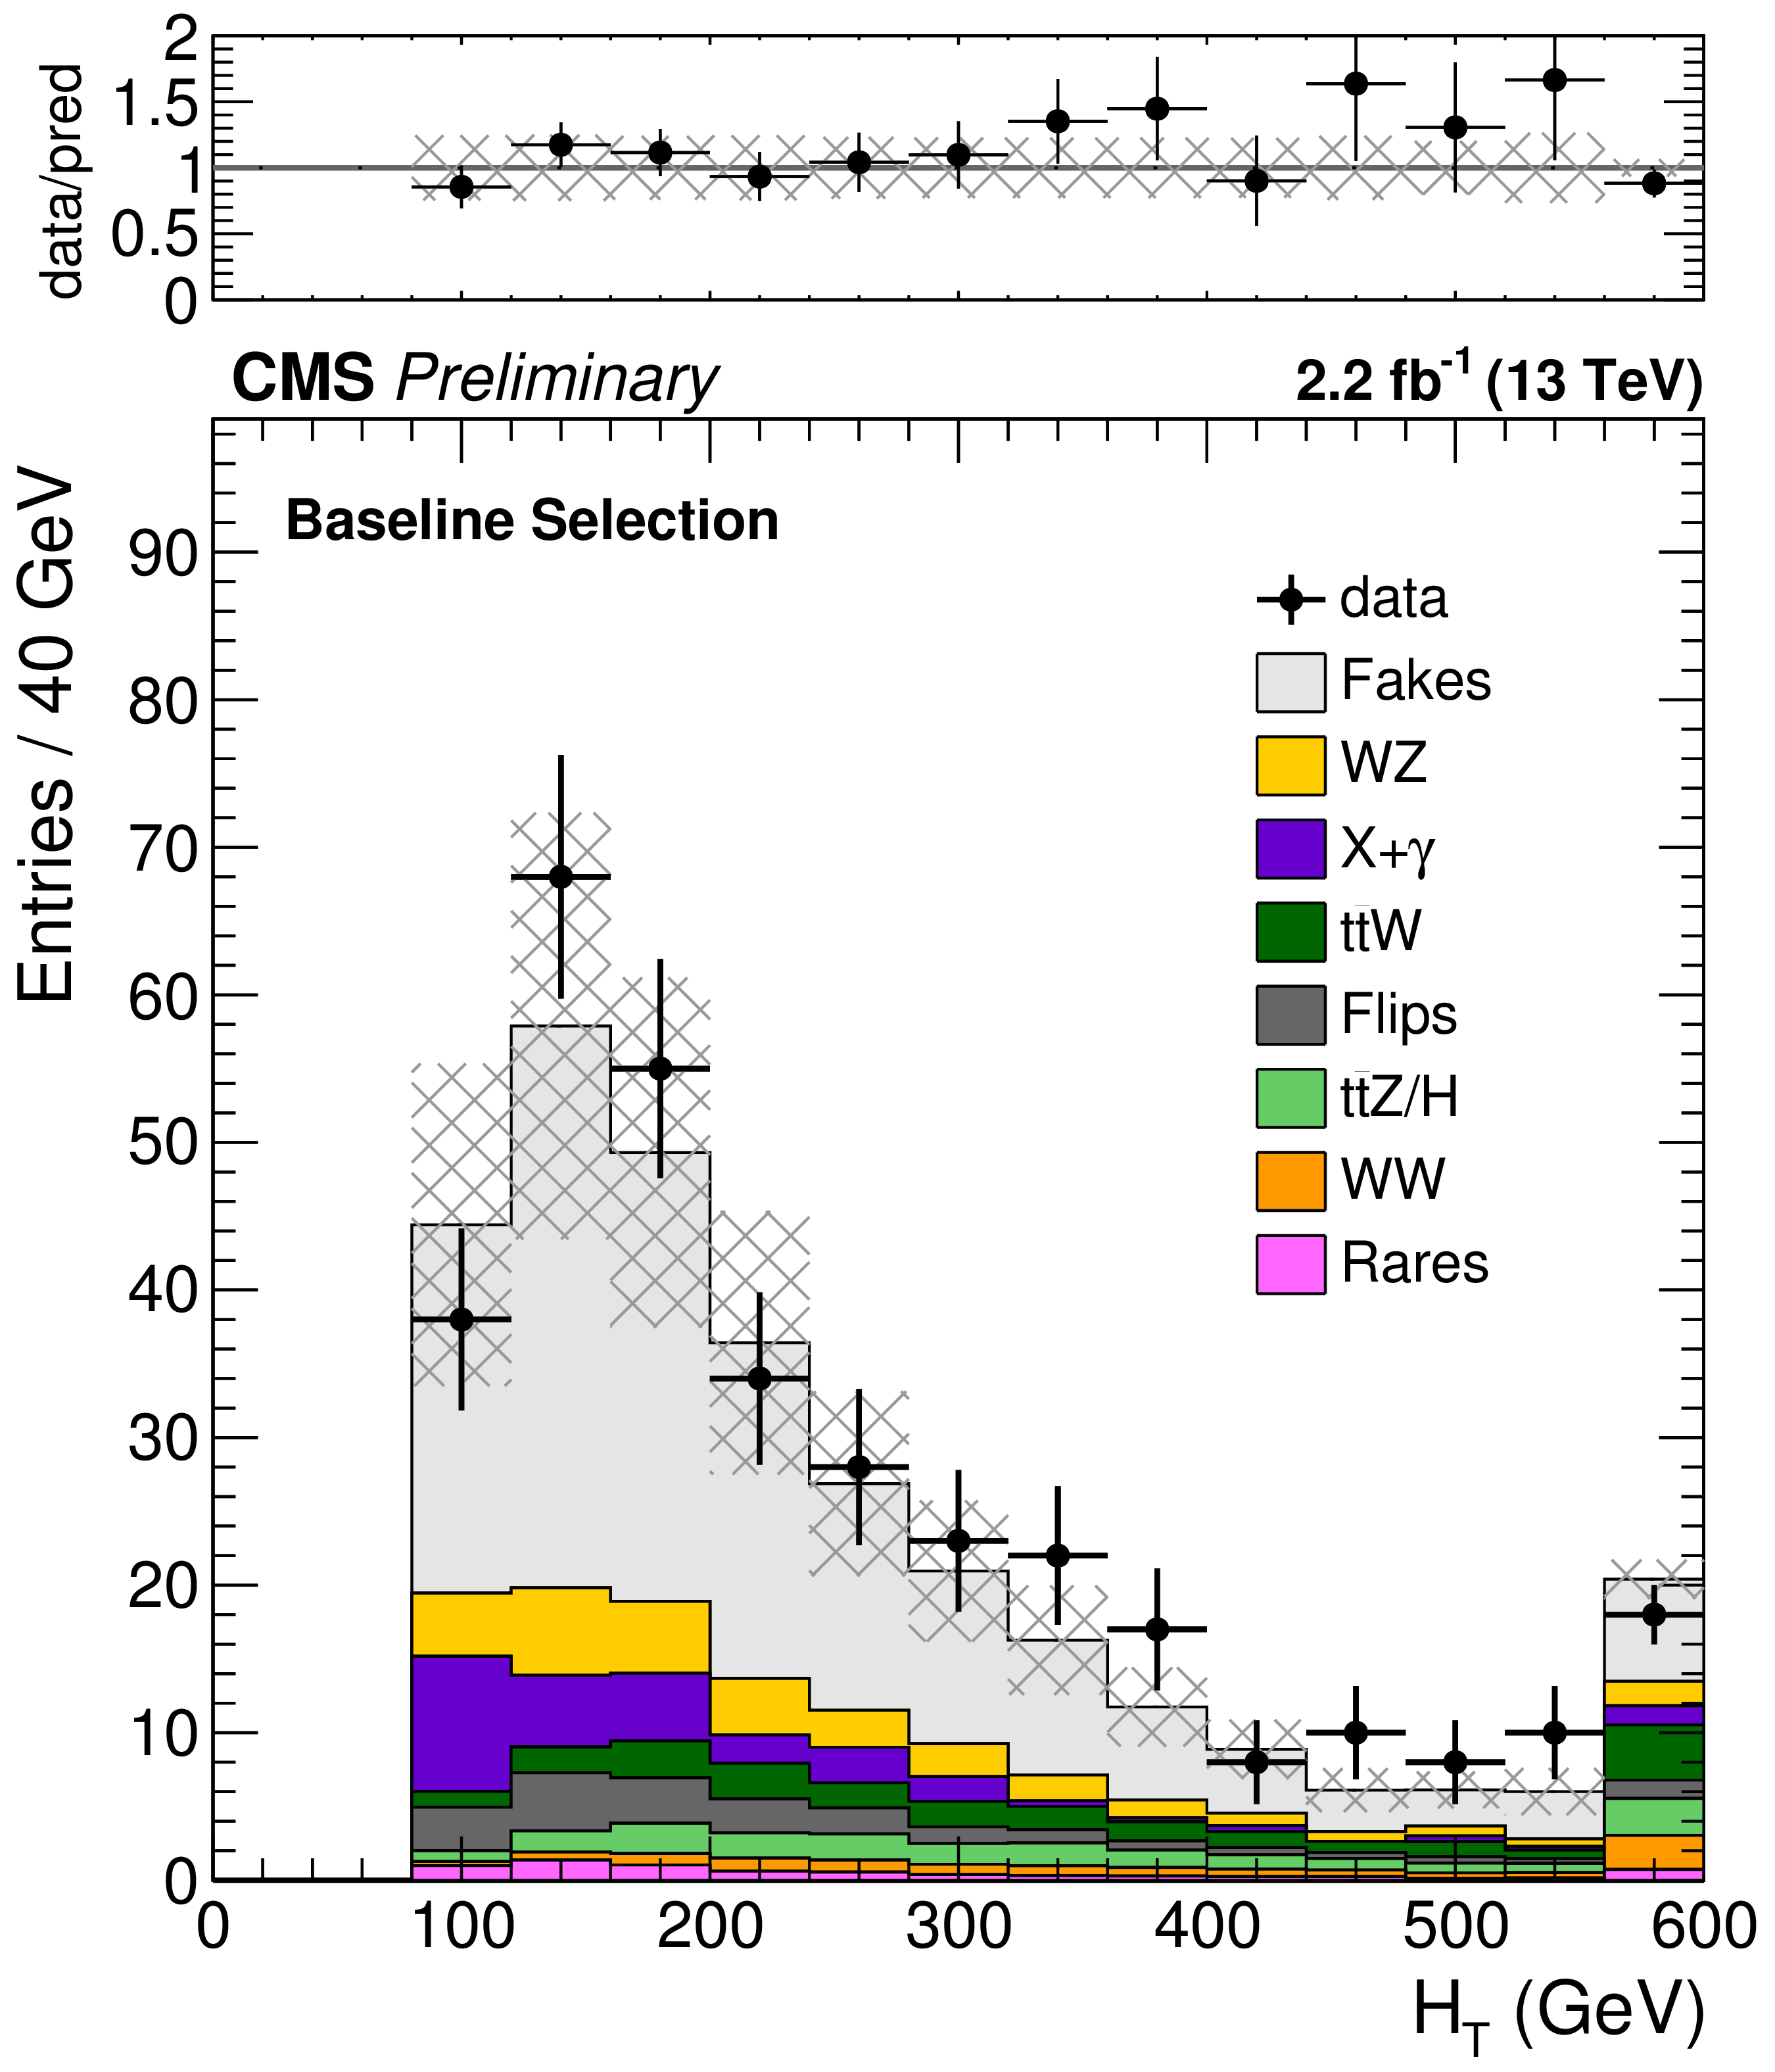
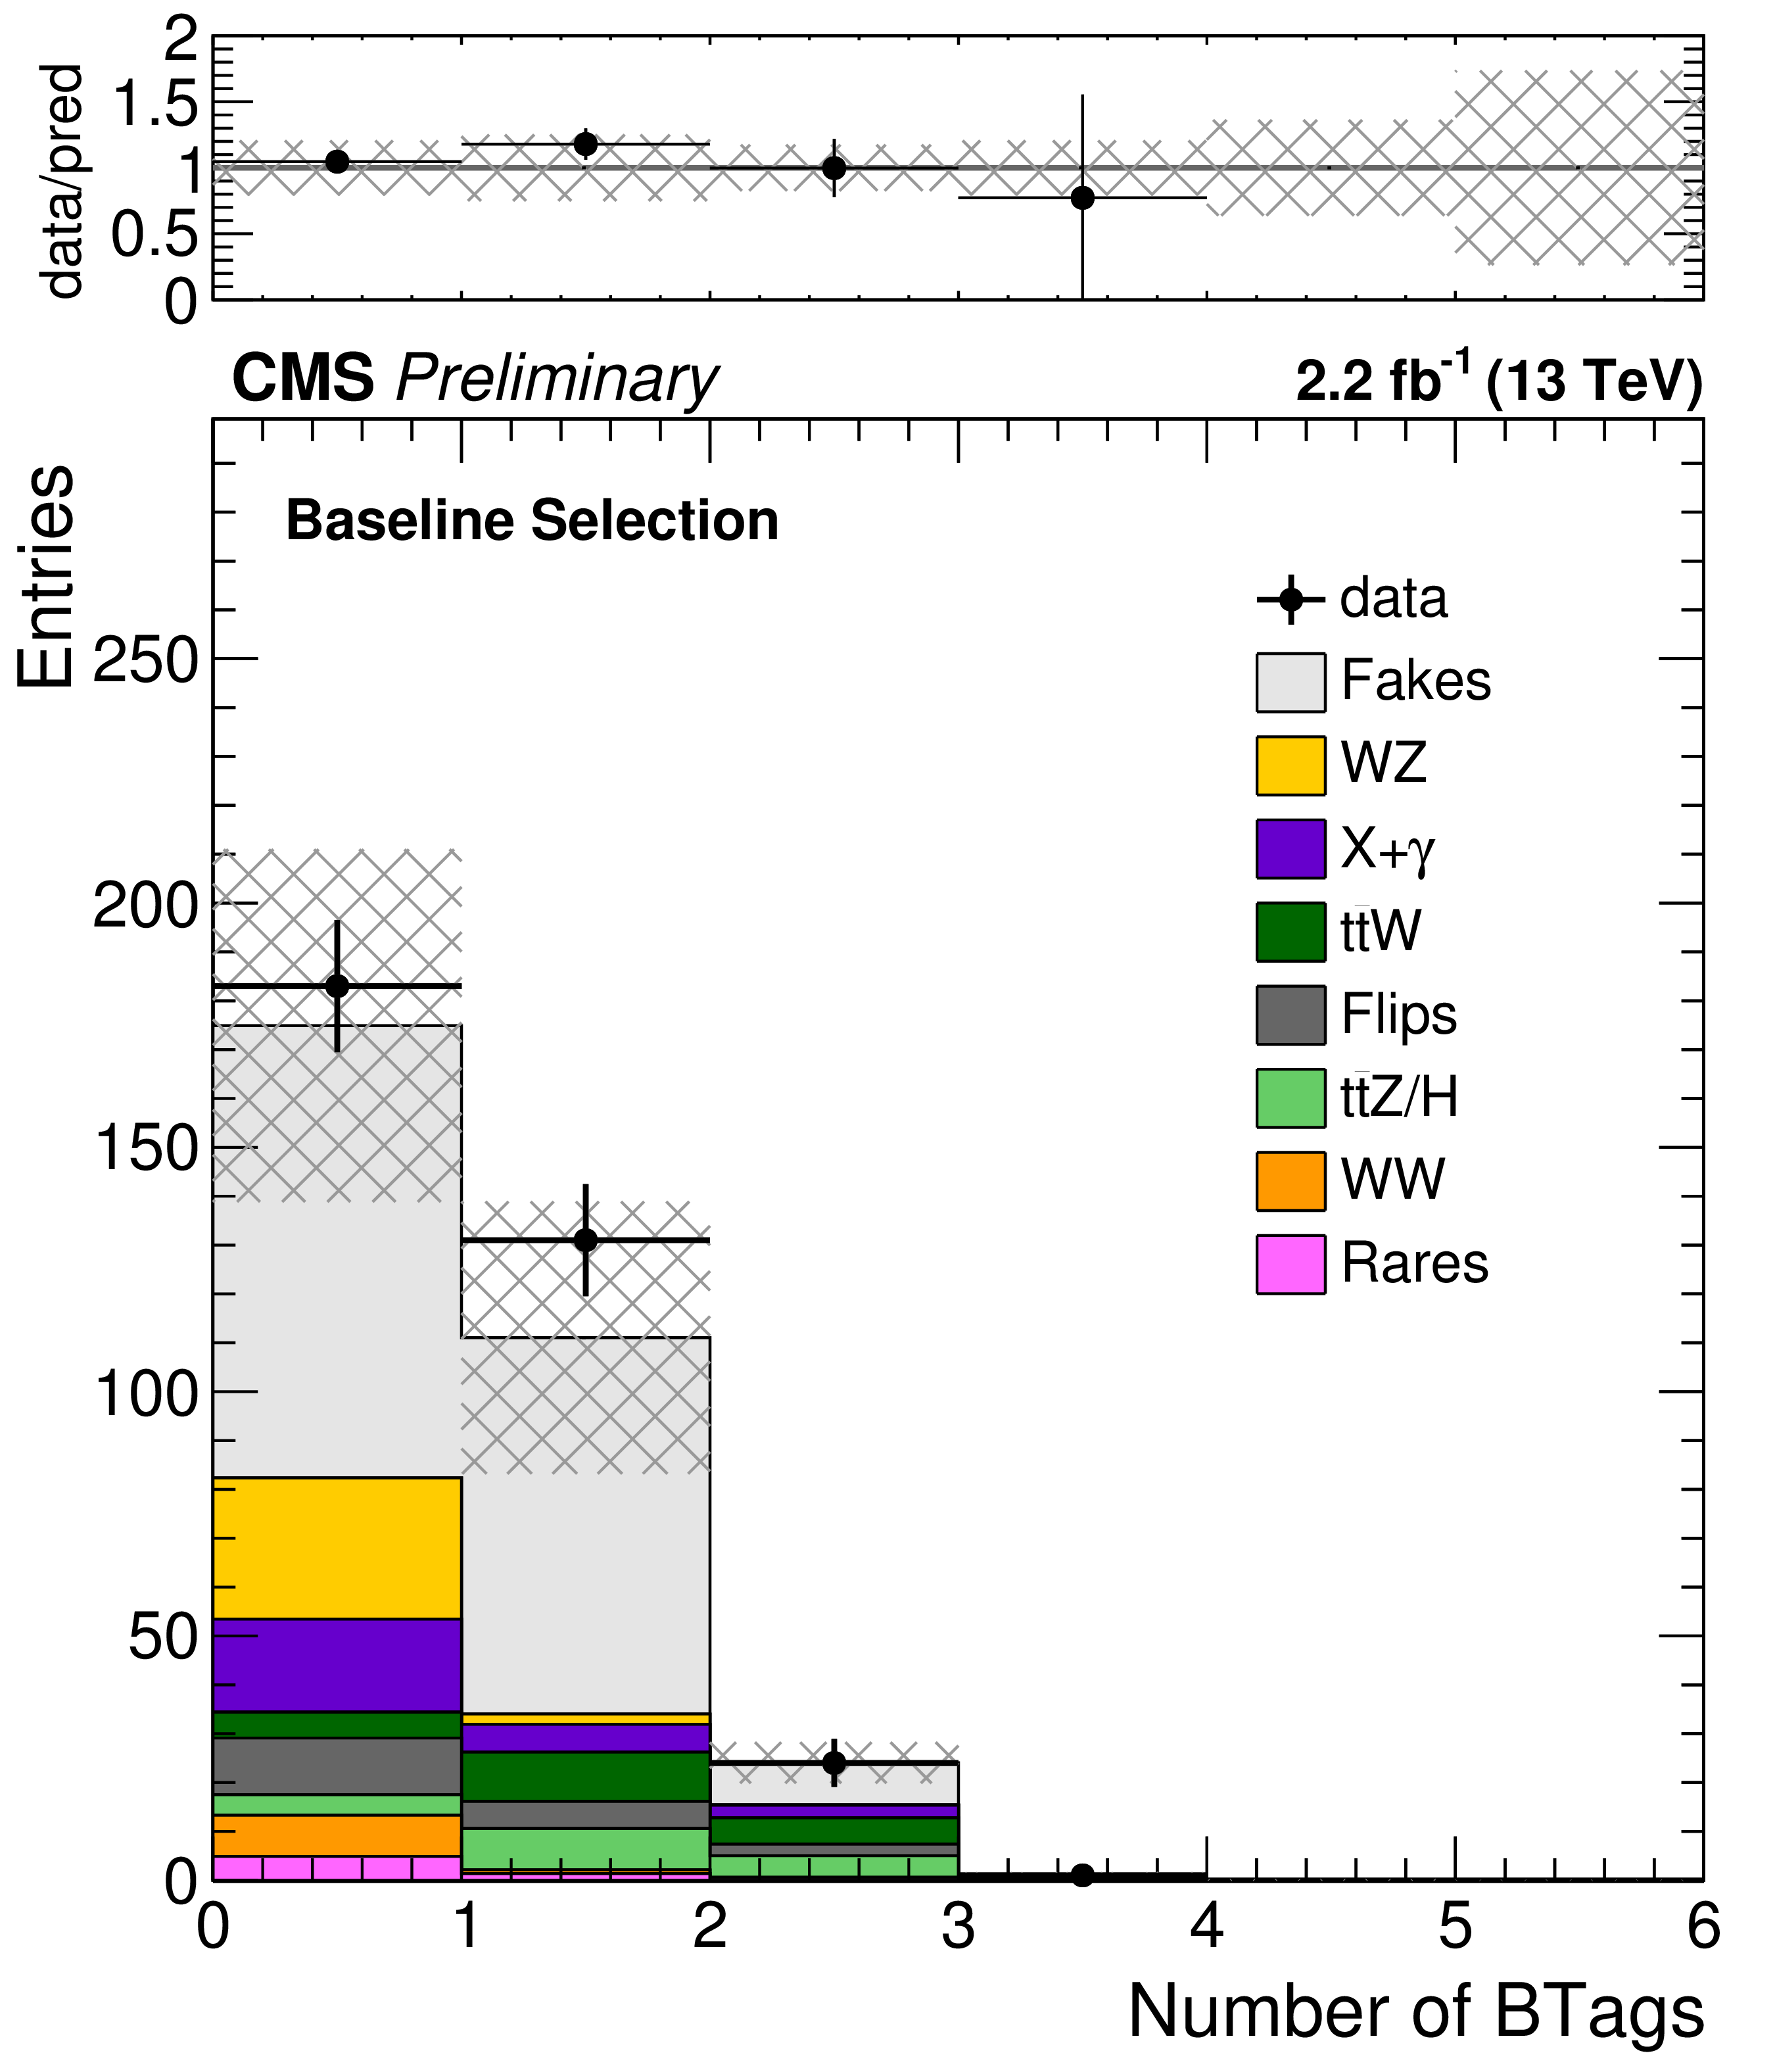
Figure 2-a:
Distributions for the main analysis variables after the baseline selection with $ {\mathcal {L}} =$ 2.2 fb$^{-1}$. The shaded area represents the total uncertainty in the background prediction. |
png ; pdf ; |
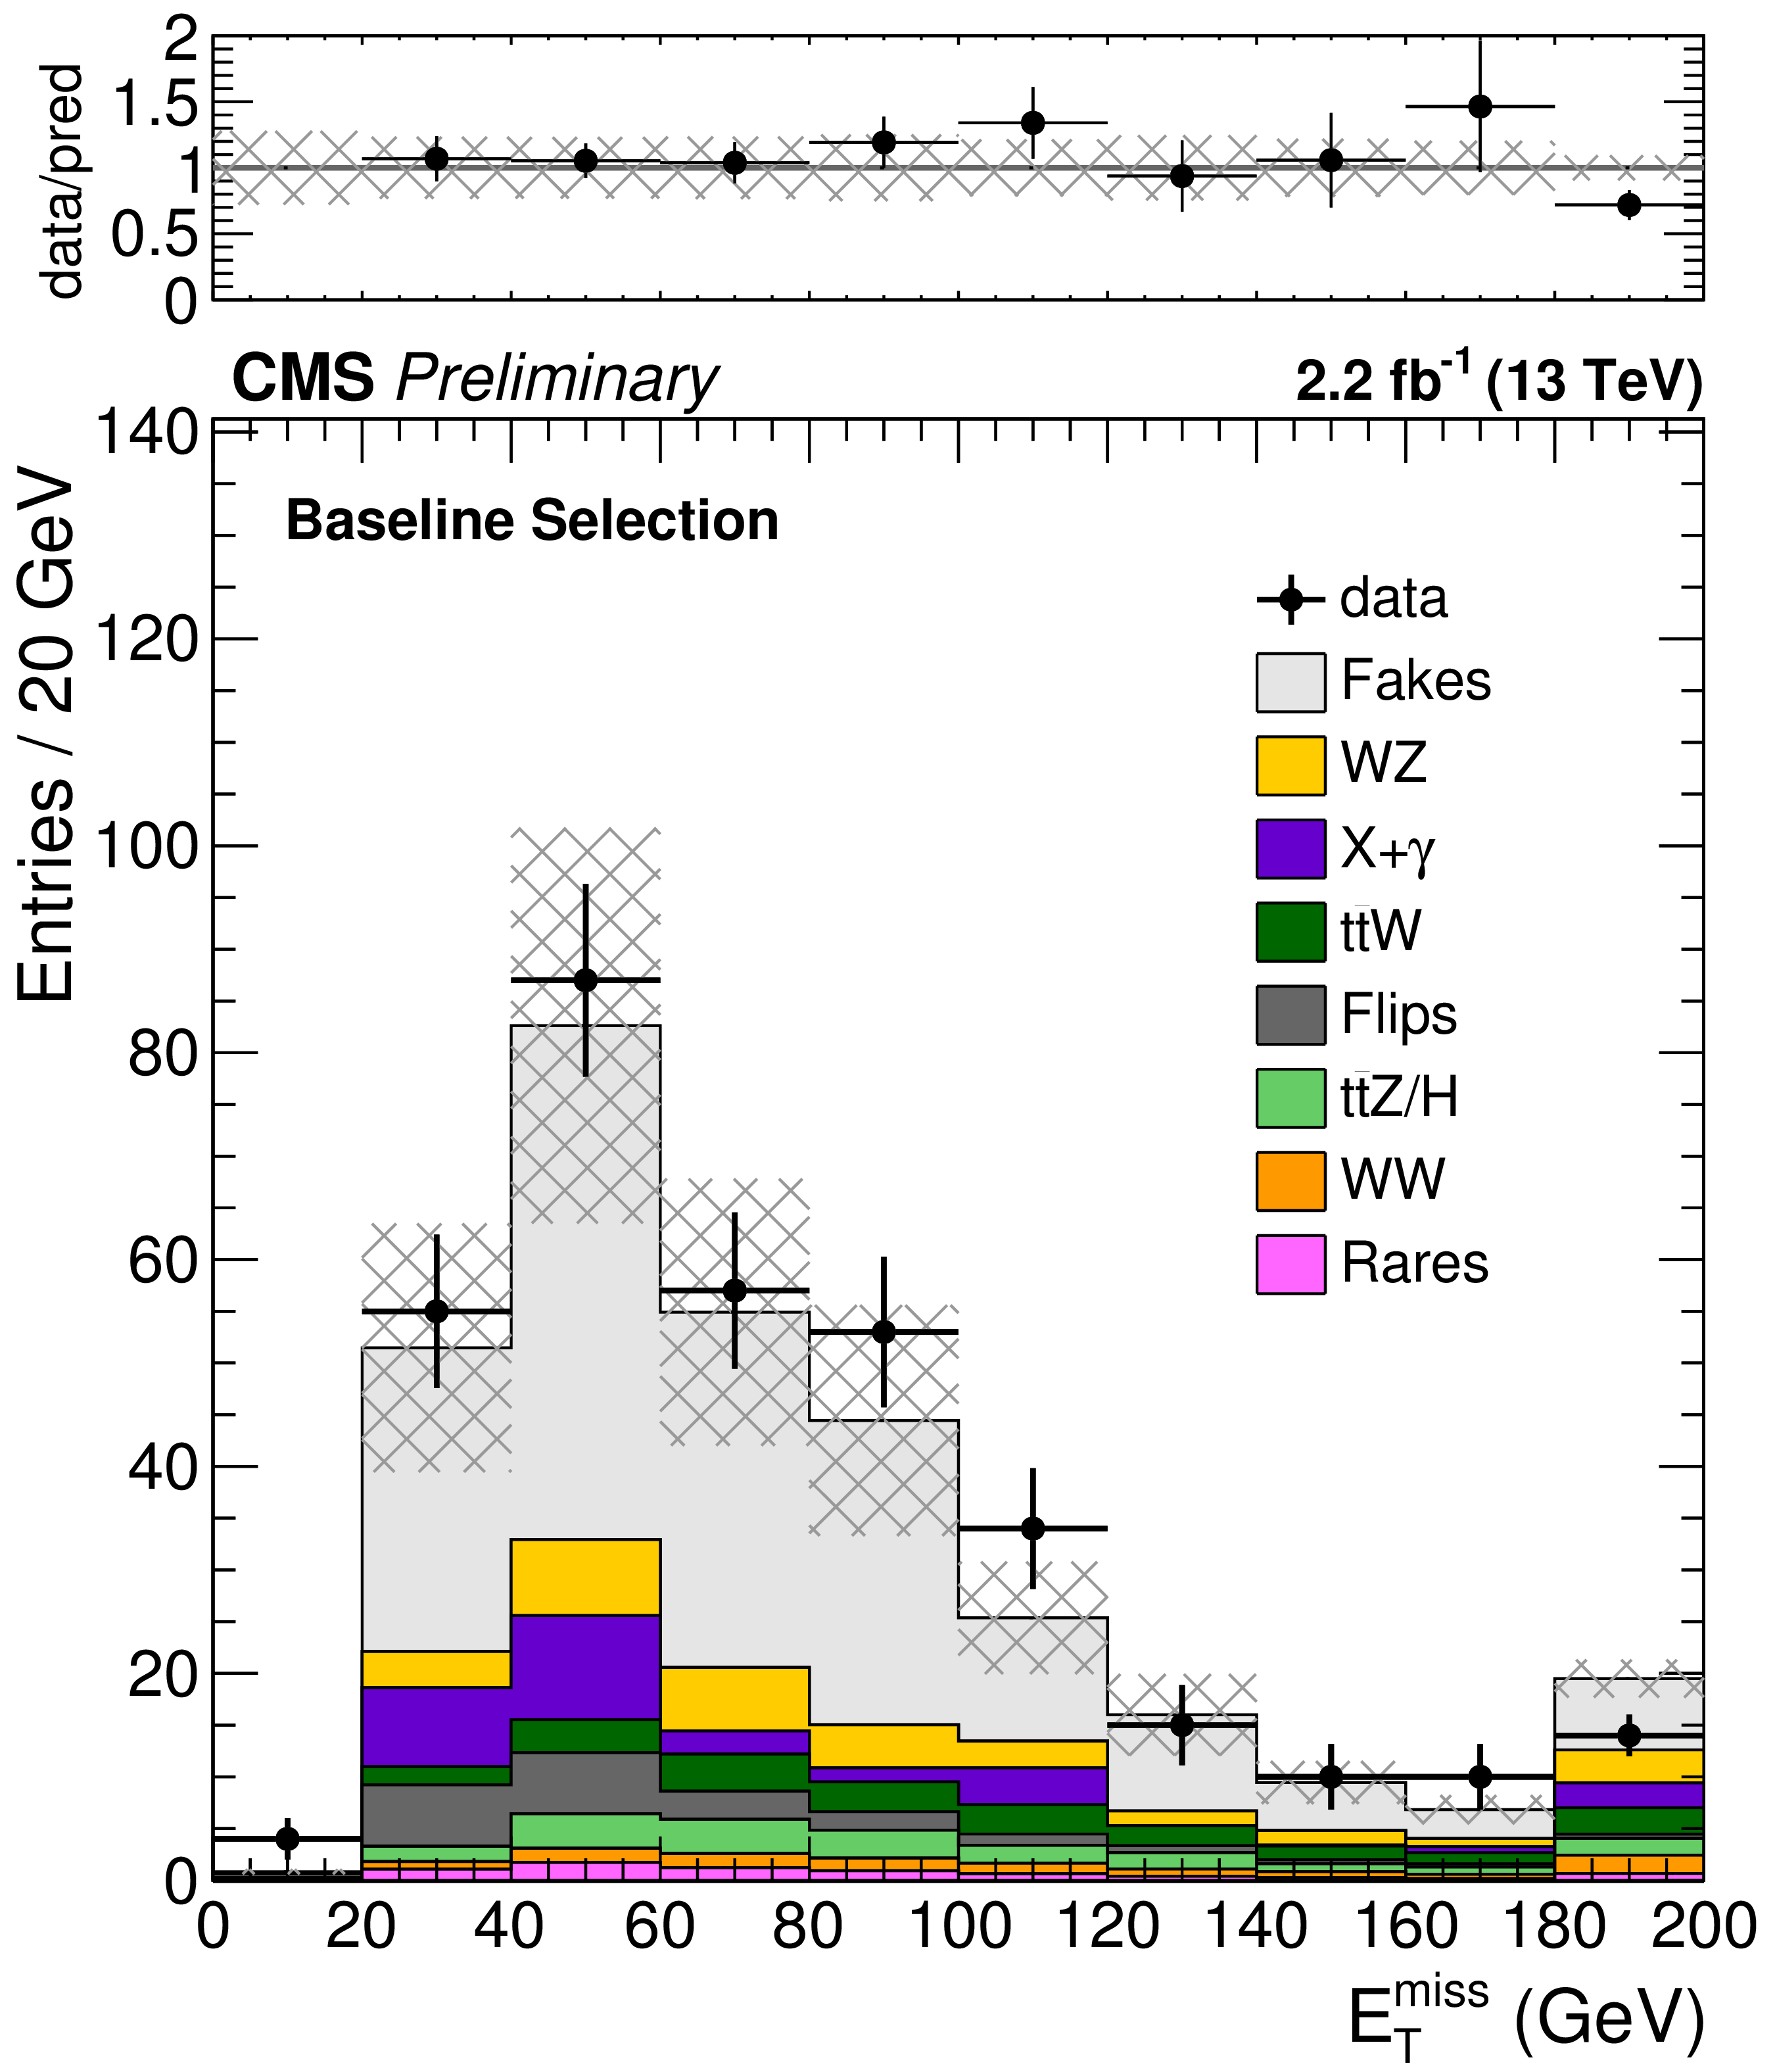
Figure 2-b:
Distributions for the main analysis variables after the baseline selection with $ {\mathcal {L}} =$ 2.2 fb$^{-1}$. The shaded area represents the total uncertainty in the background prediction. |
png ; pdf ; |
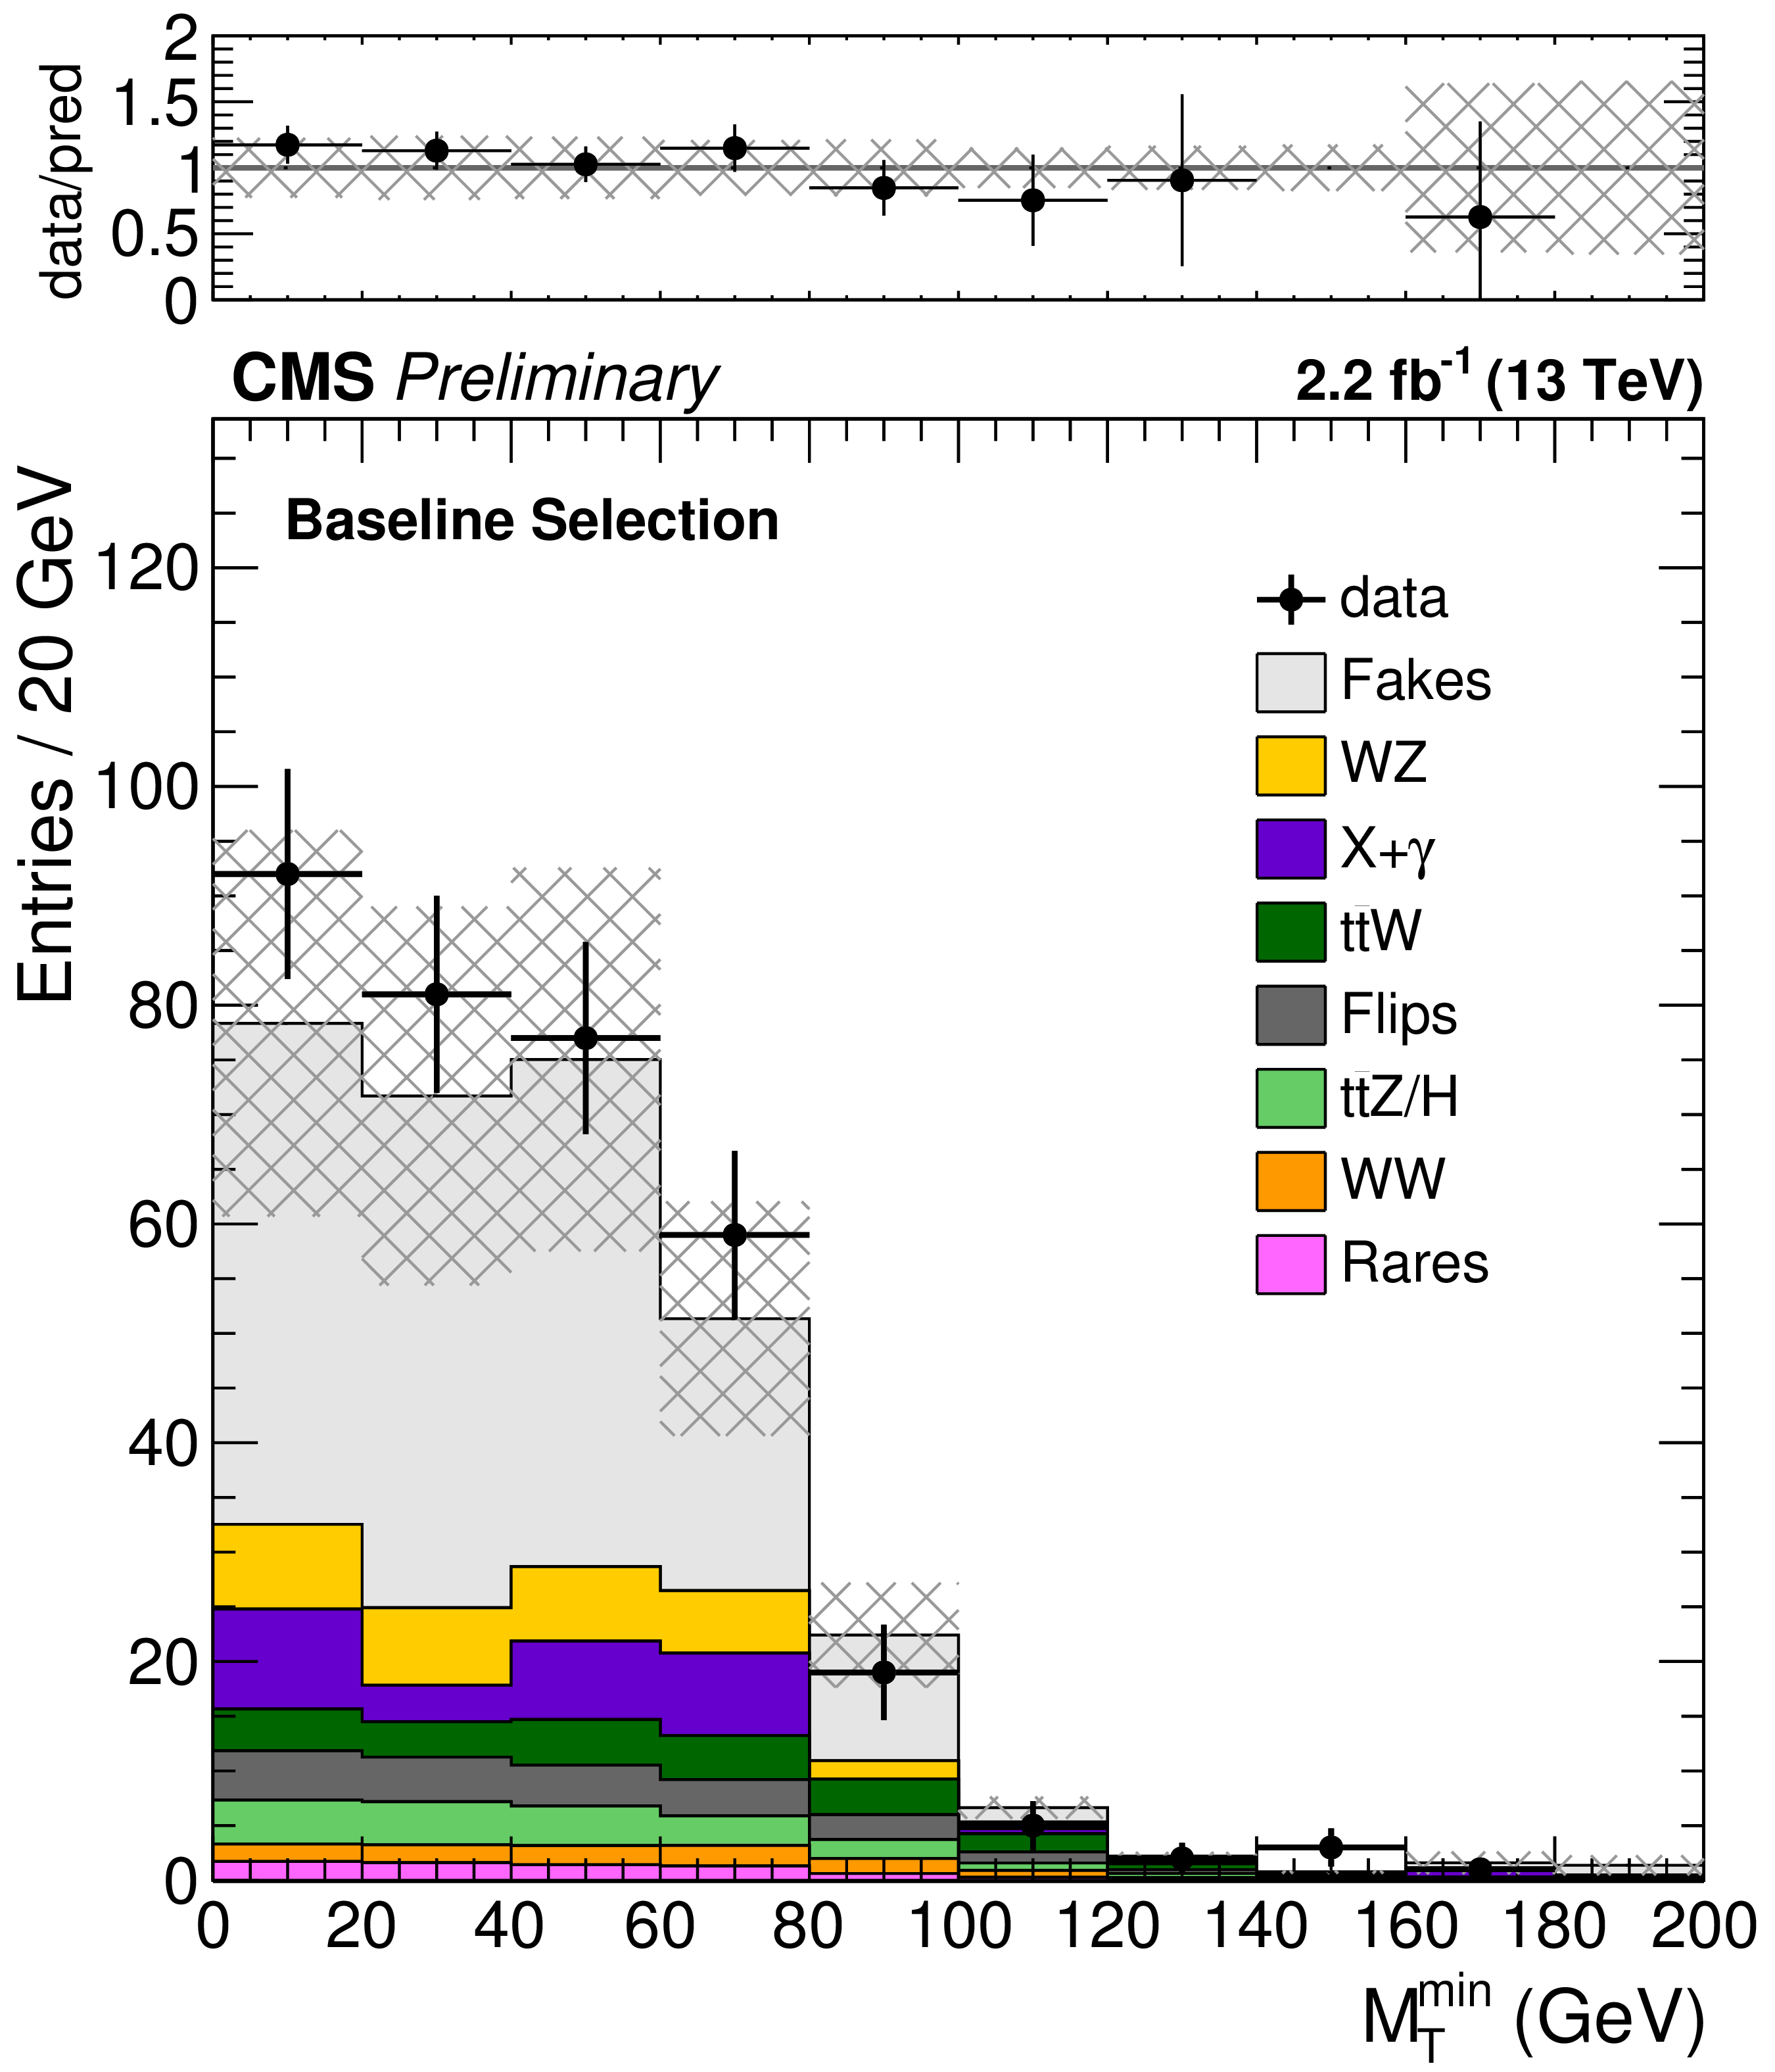
Figure 2-c:
Distributions for the main analysis variables after the baseline selection with $ {\mathcal {L}} =$ 2.2 fb$^{-1}$. The shaded area represents the total uncertainty in the background prediction. |
png ; pdf ; |
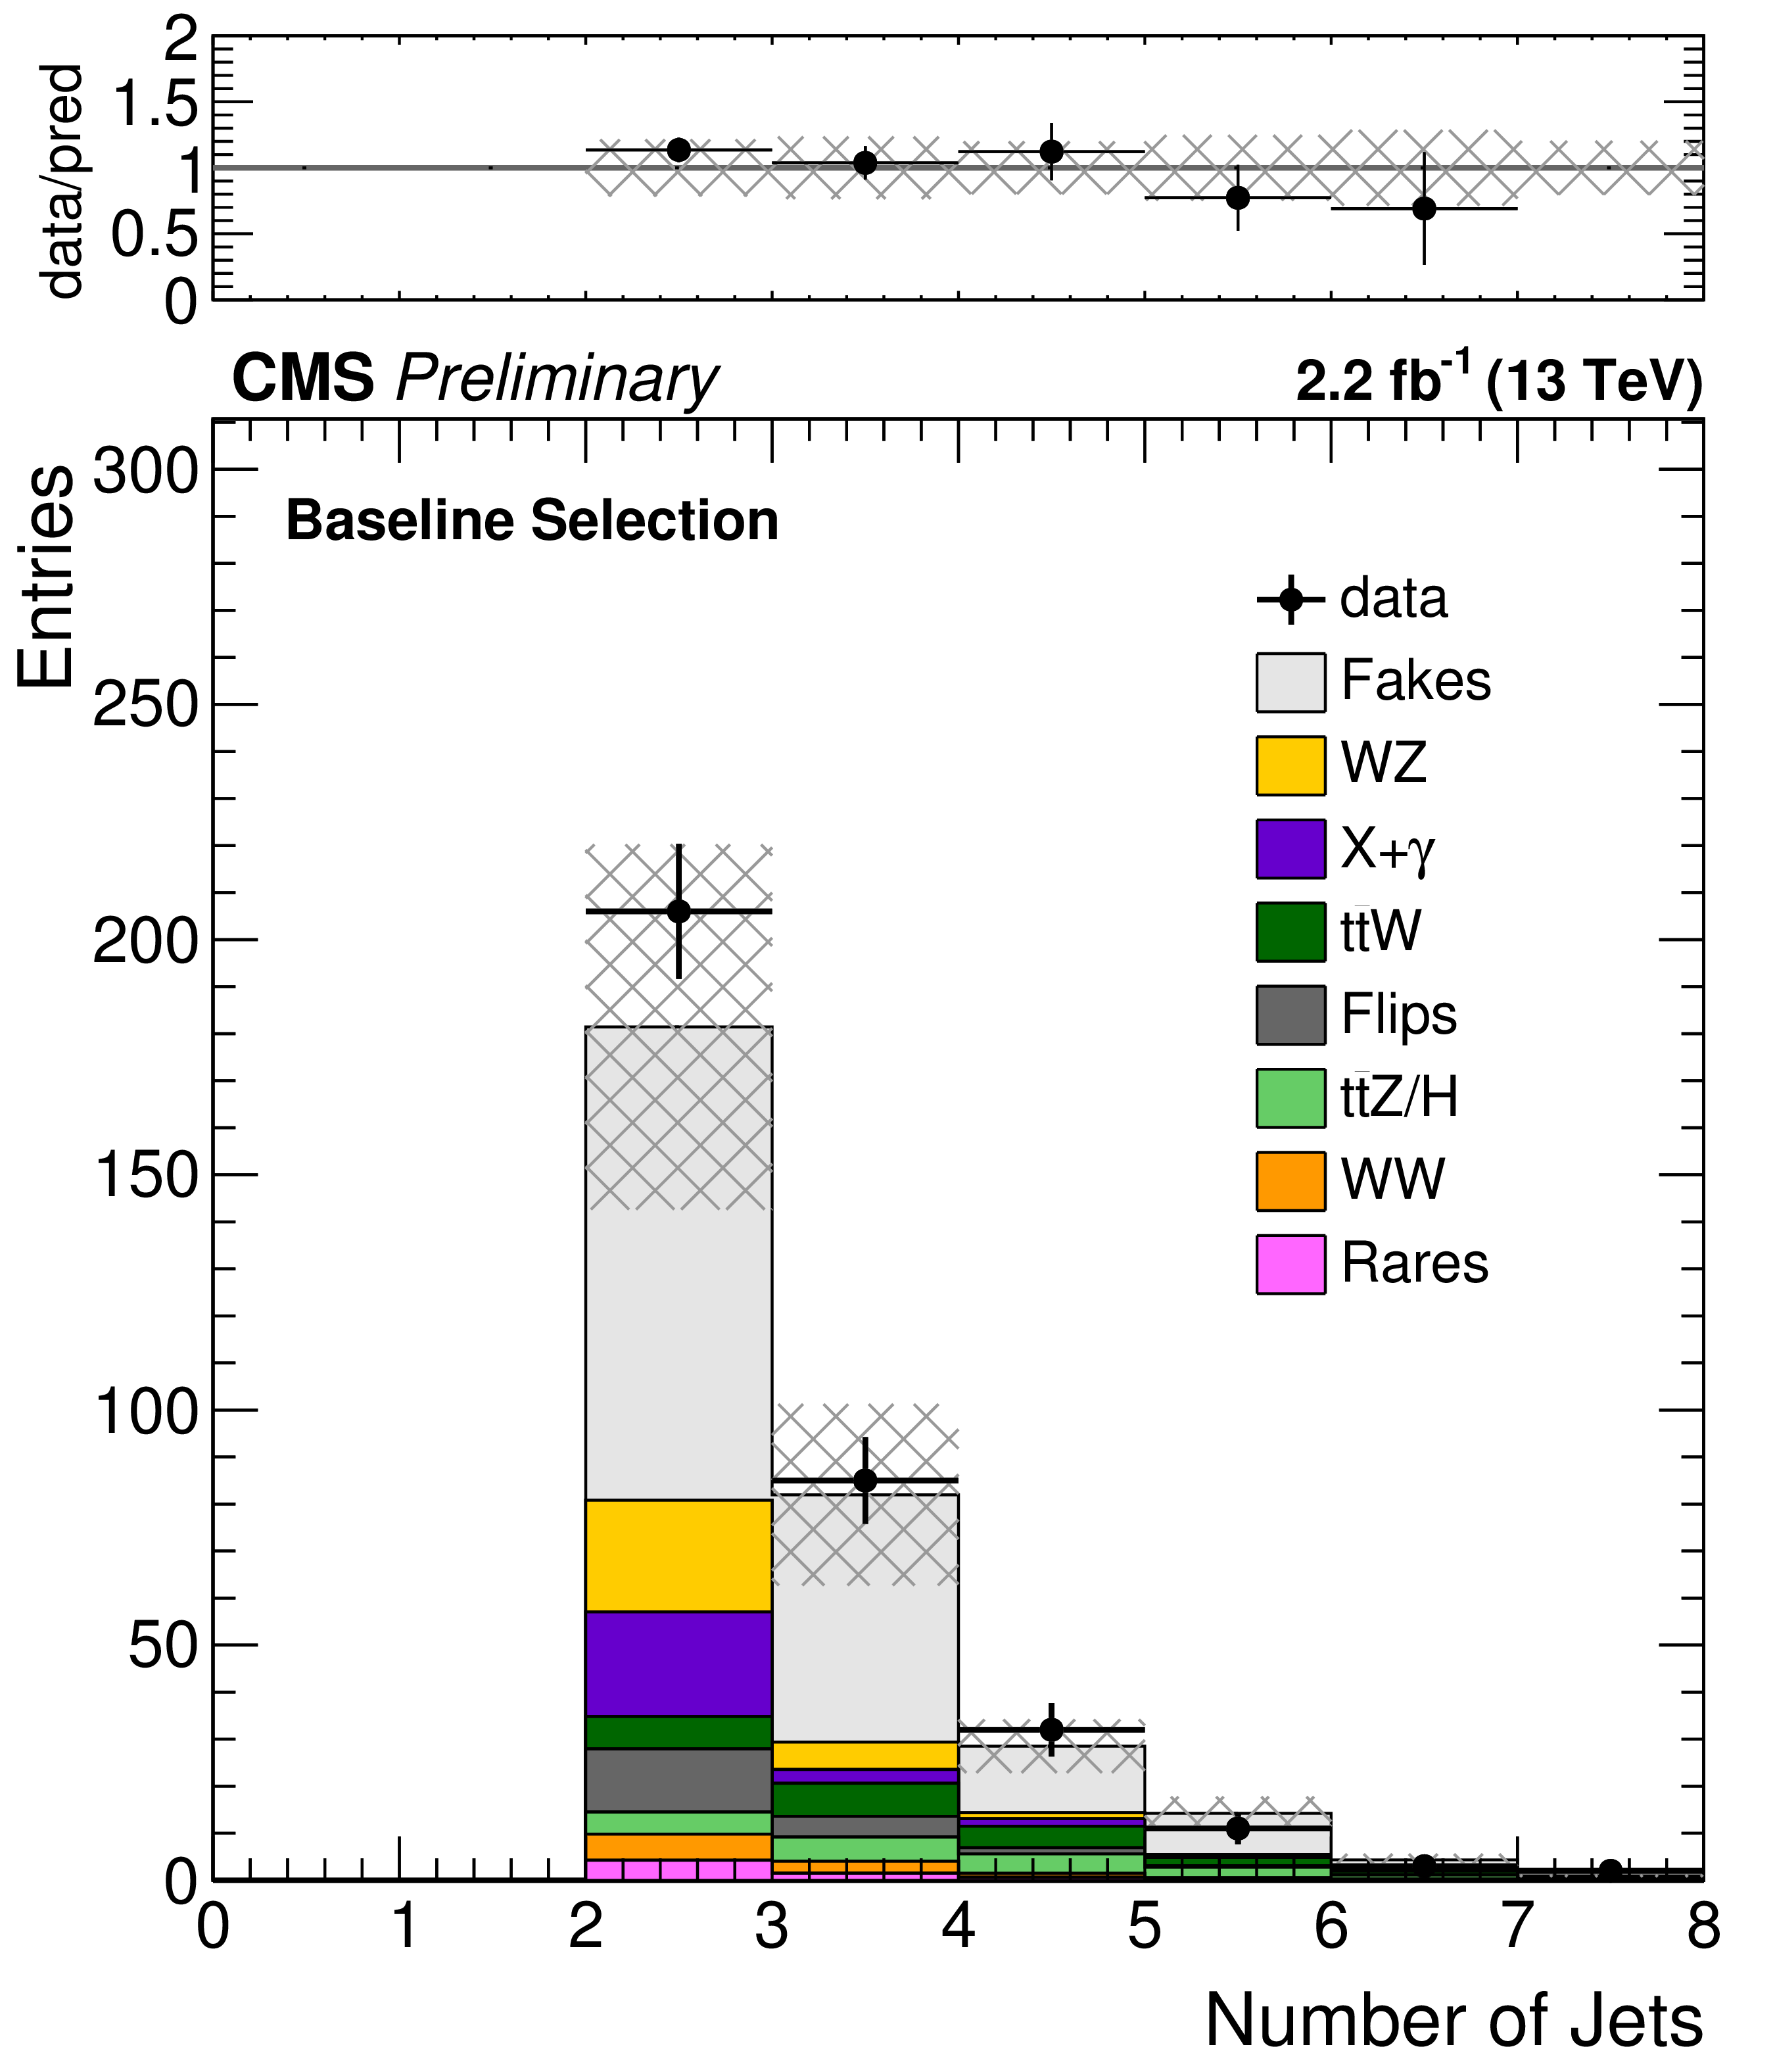
Figure 2-d:
Distributions for the main analysis variables after the baseline selection with $ {\mathcal {L}} =$ 2.2 fb$^{-1}$. The shaded area represents the total uncertainty in the background prediction. |
png ; pdf ; |
Figure 2-e:
Distributions for the main analysis variables after the baseline selection with $ {\mathcal {L}} =$ 2.2 fb$^{-1}$. The shaded area represents the total uncertainty in the background prediction. |
png ; pdf ; |
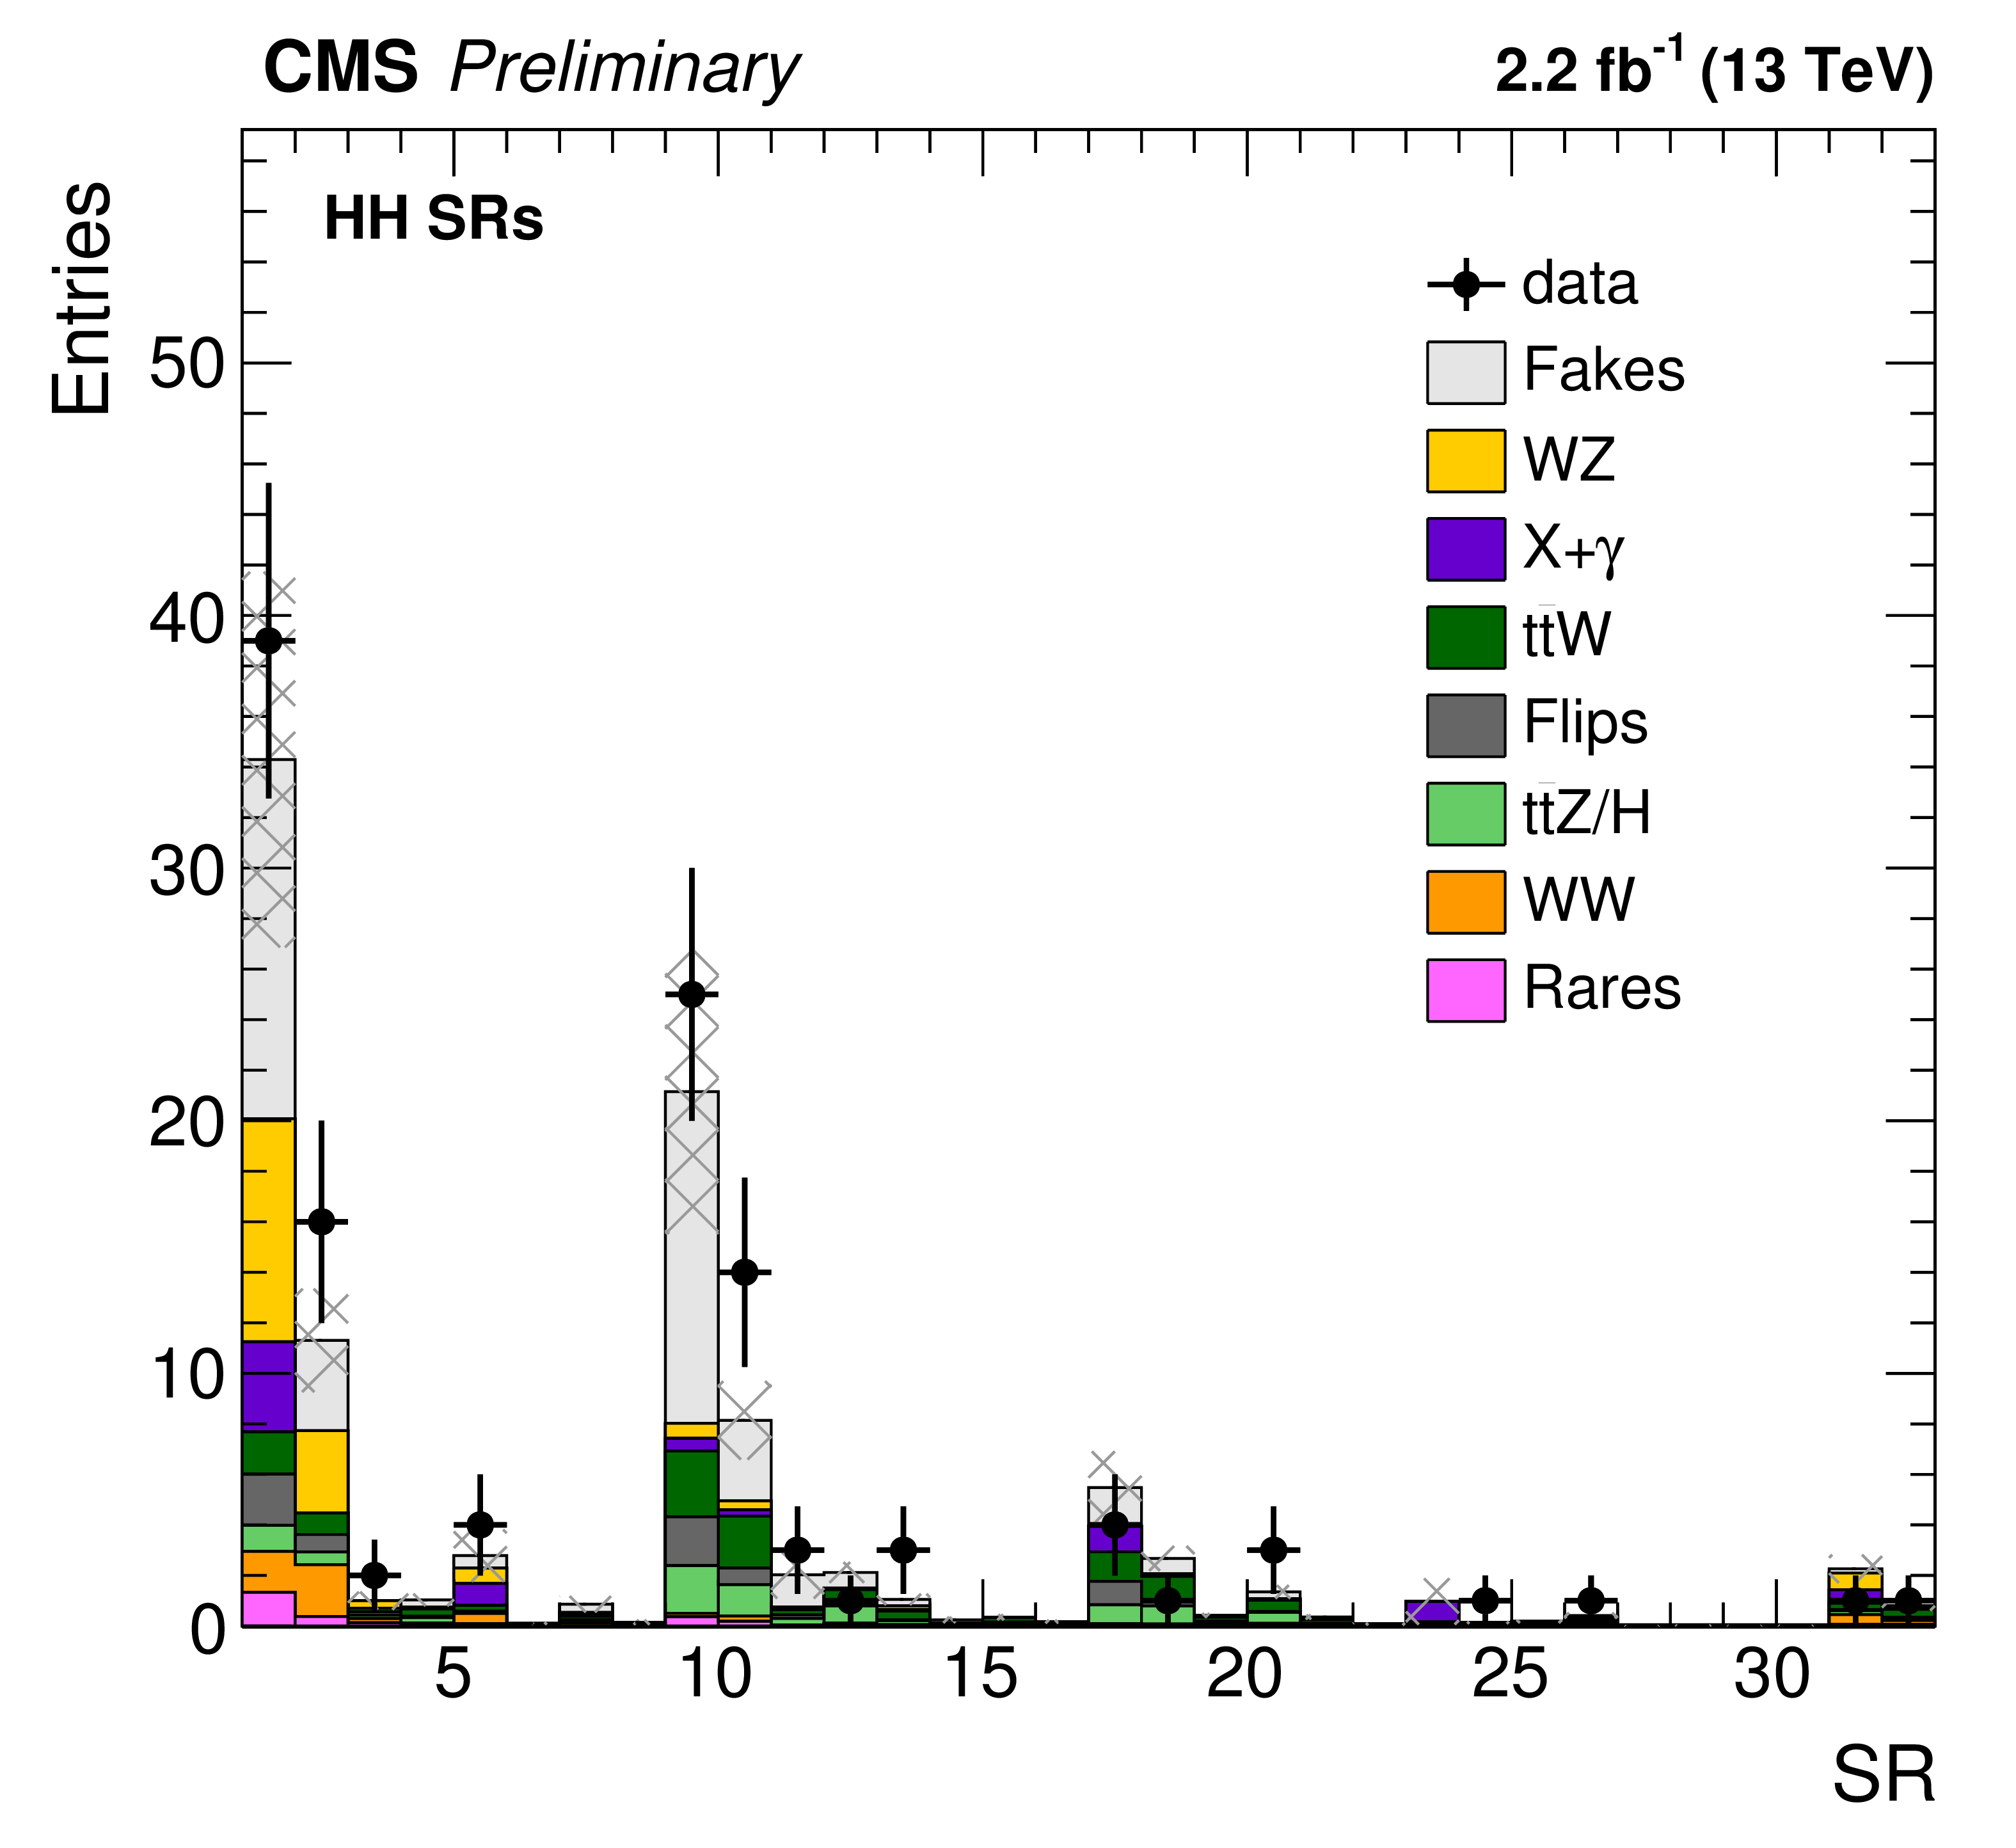
Figure 3-a:
Event yields in HH (a), HL (b), and LL (c) signal regions with $ {\mathcal {L}} =$ 2.2 fb$^{-1}$. The shaded area represents the total uncertainty in the background prediction. |
png ; pdf ; |
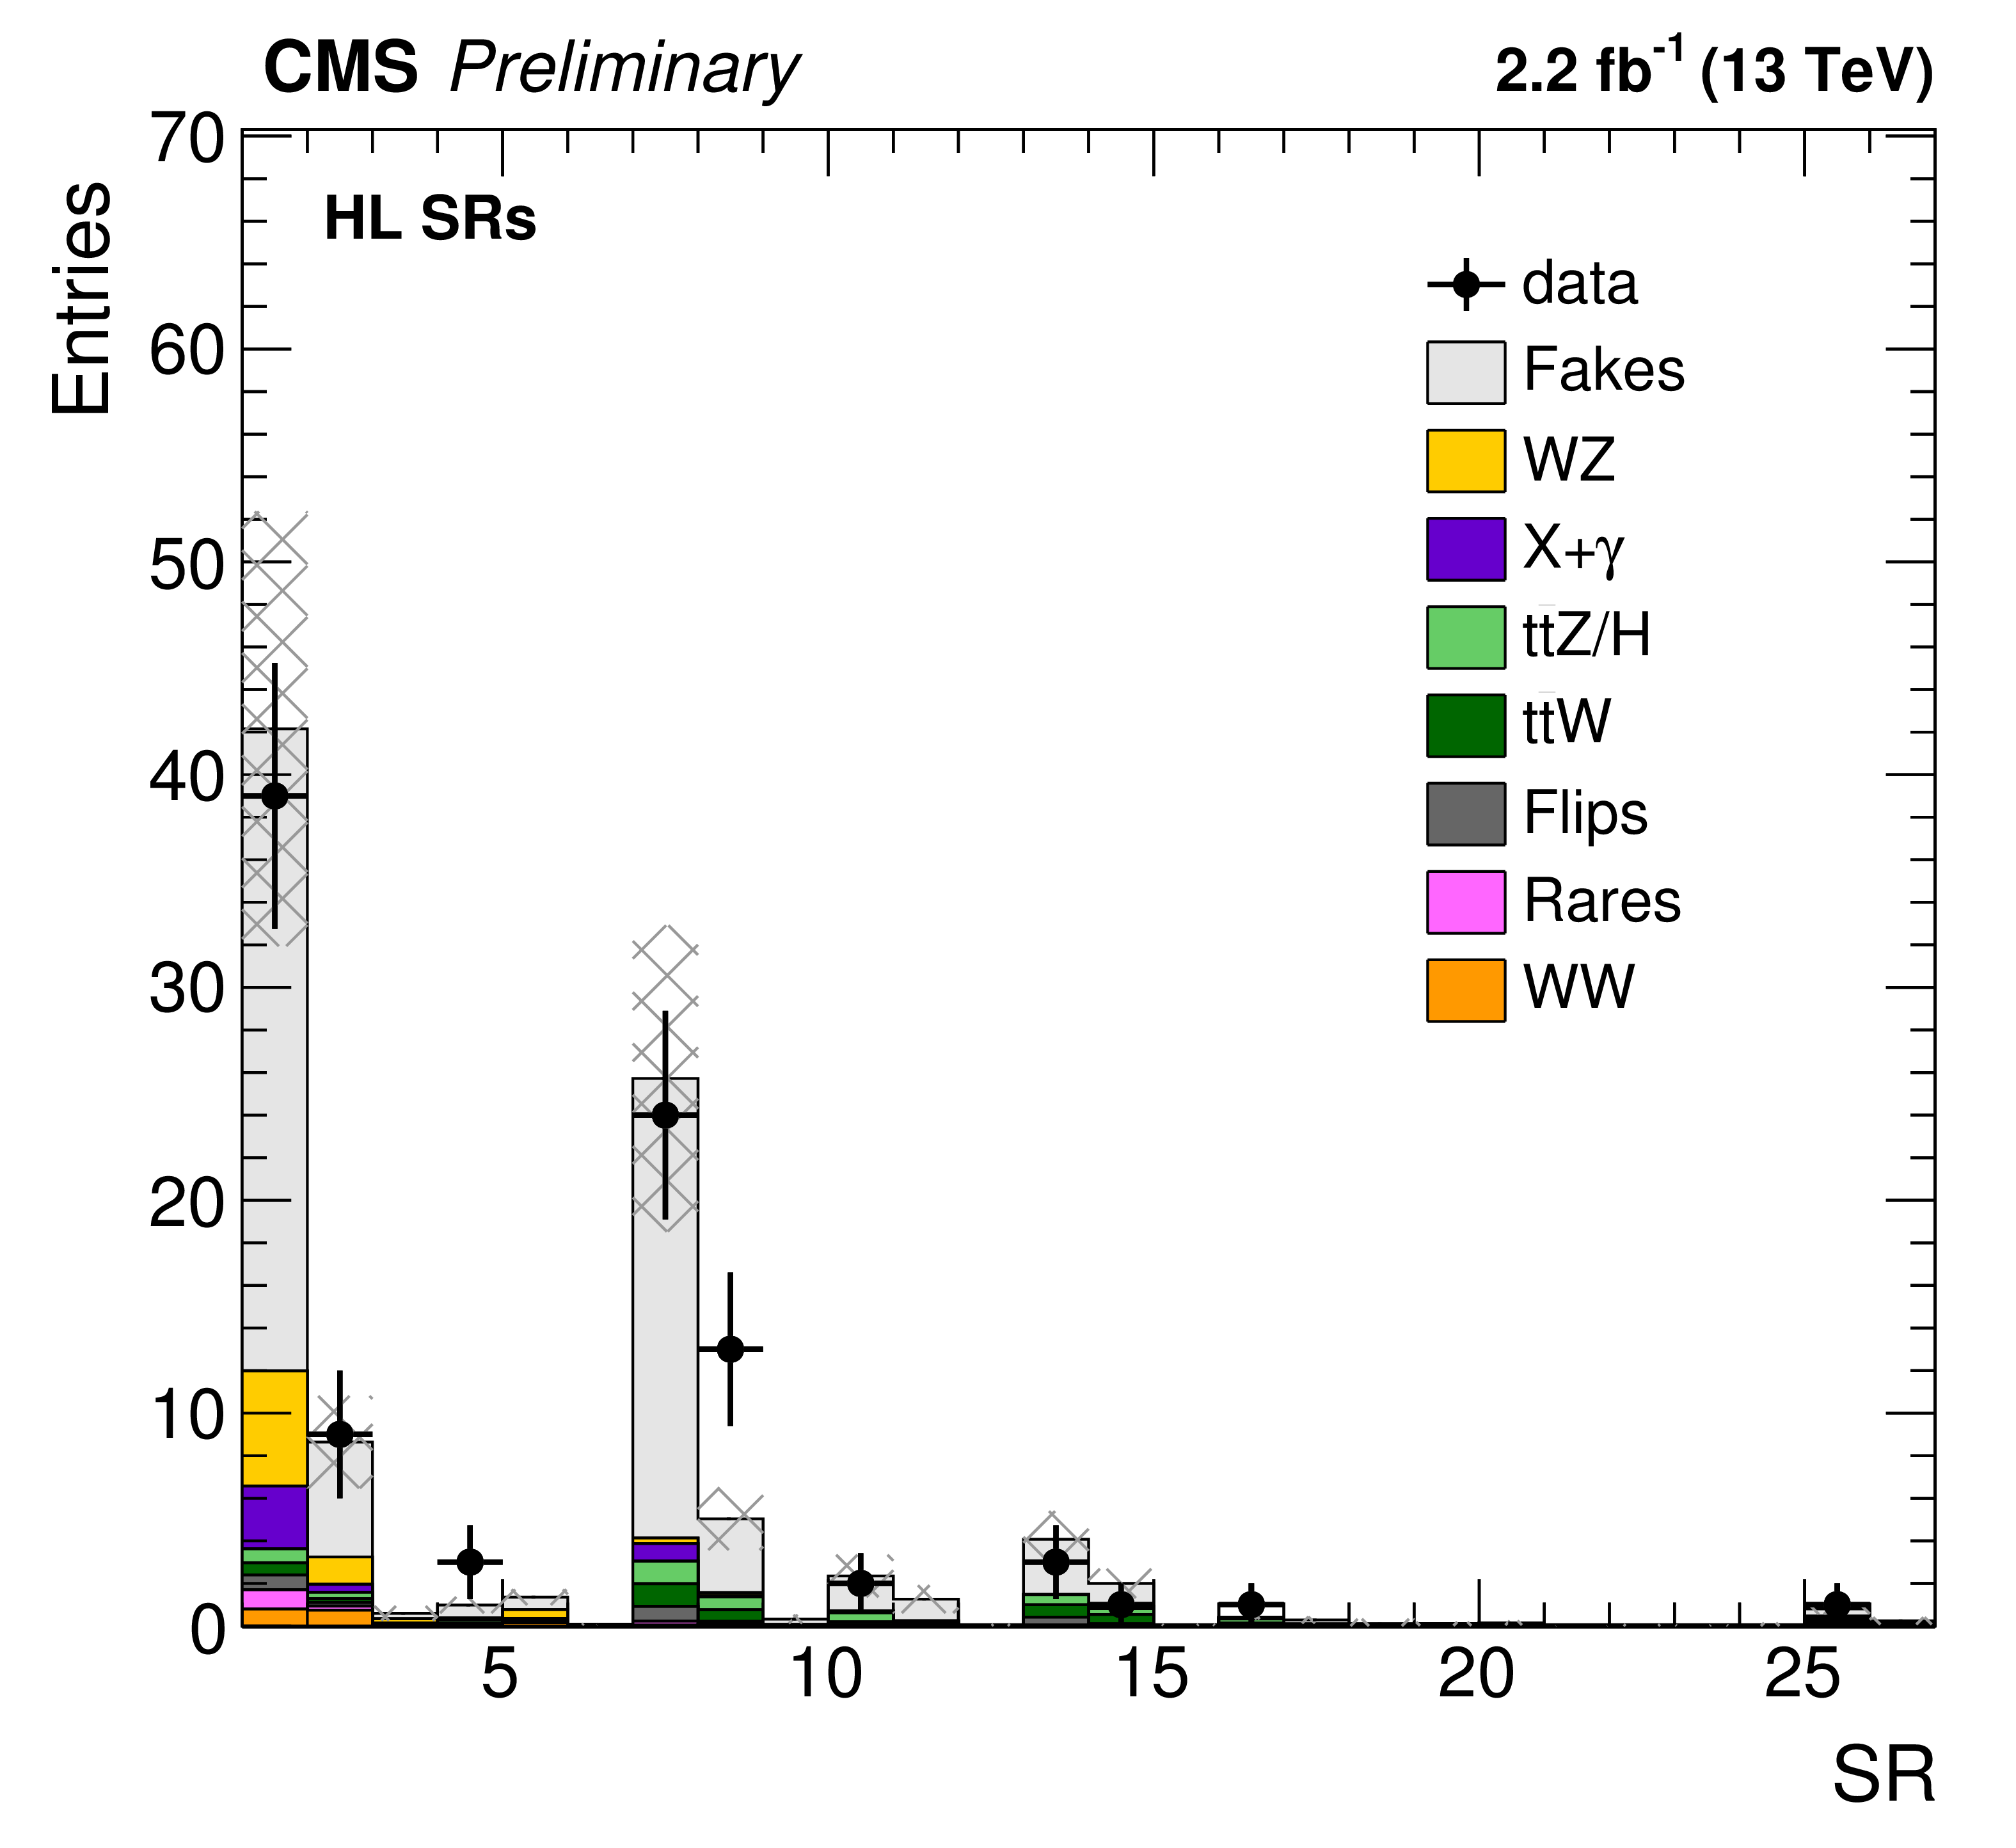
Figure 3-b:
Event yields in HH (a), HL (b), and LL (c) signal regions with $ {\mathcal {L}} =$ 2.2 fb$^{-1}$. The shaded area represents the total uncertainty in the background prediction. |
png ; pdf ; |
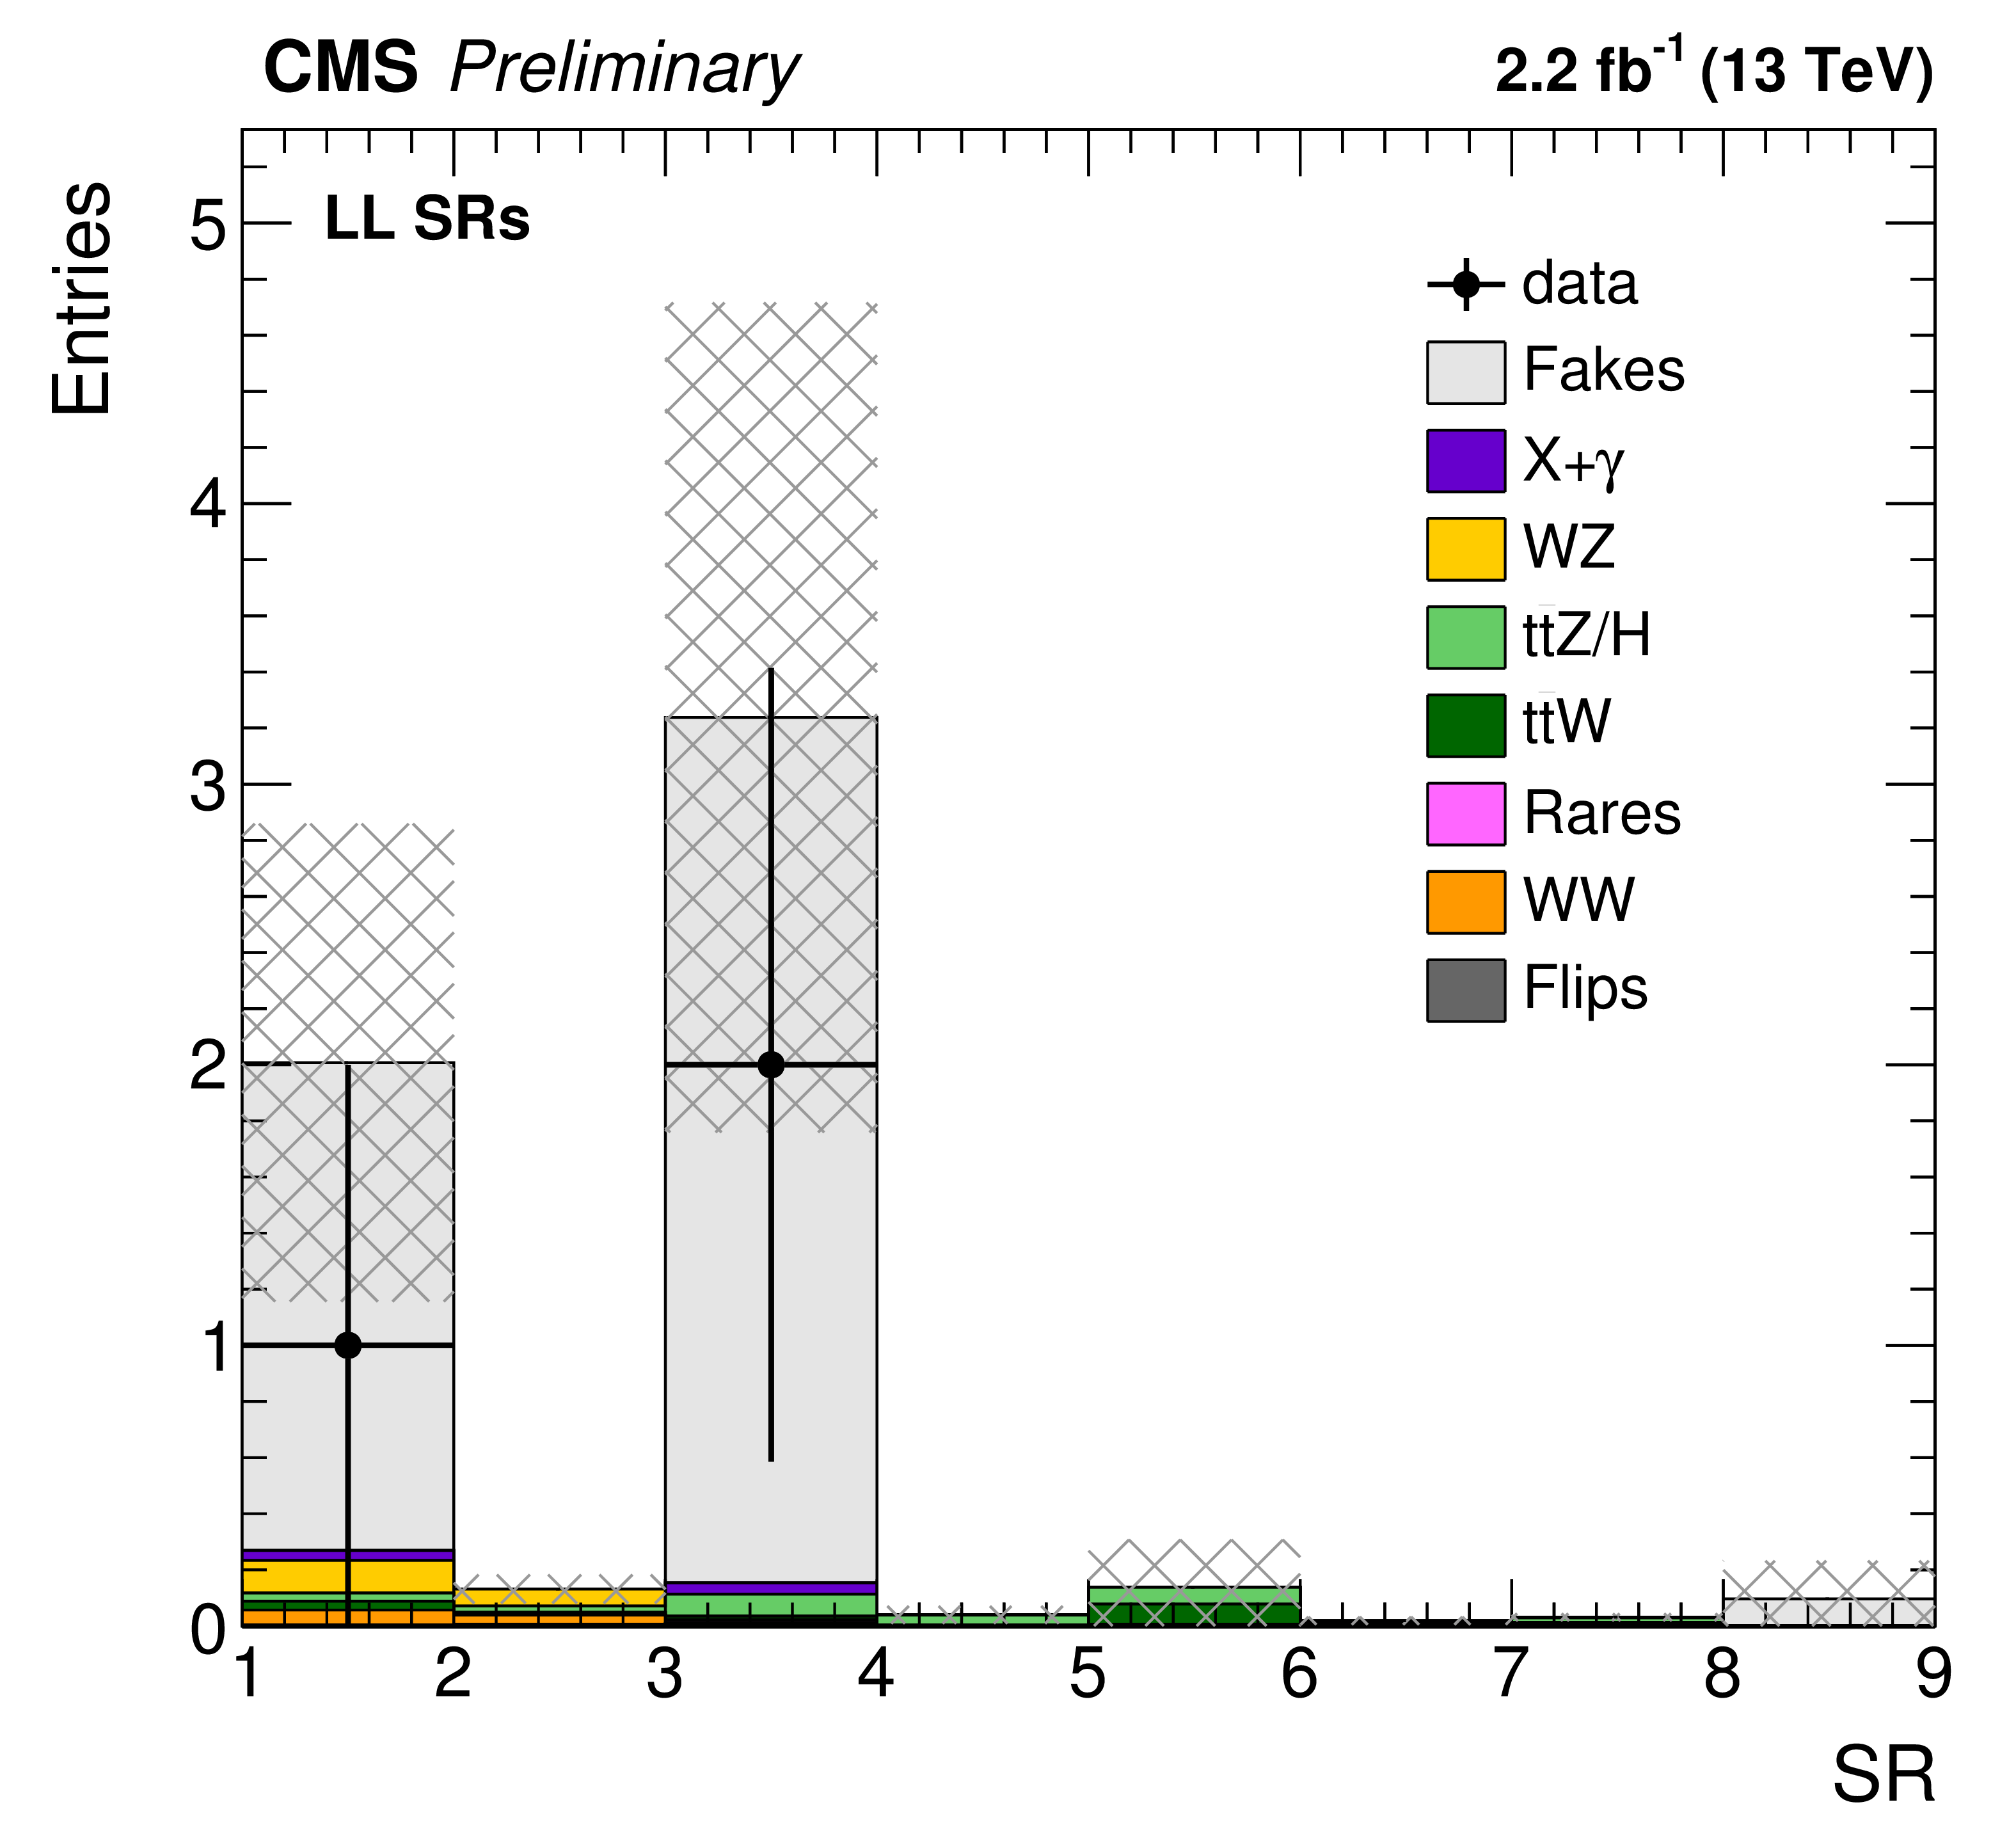
Figure 3-c:
Event yields in HH (a), HL (b), and LL (c) signal regions with $ {\mathcal {L}} =$ 2.2 fb$^{-1}$. The shaded area represents the total uncertainty in the background prediction. |
png ; pdf ; |
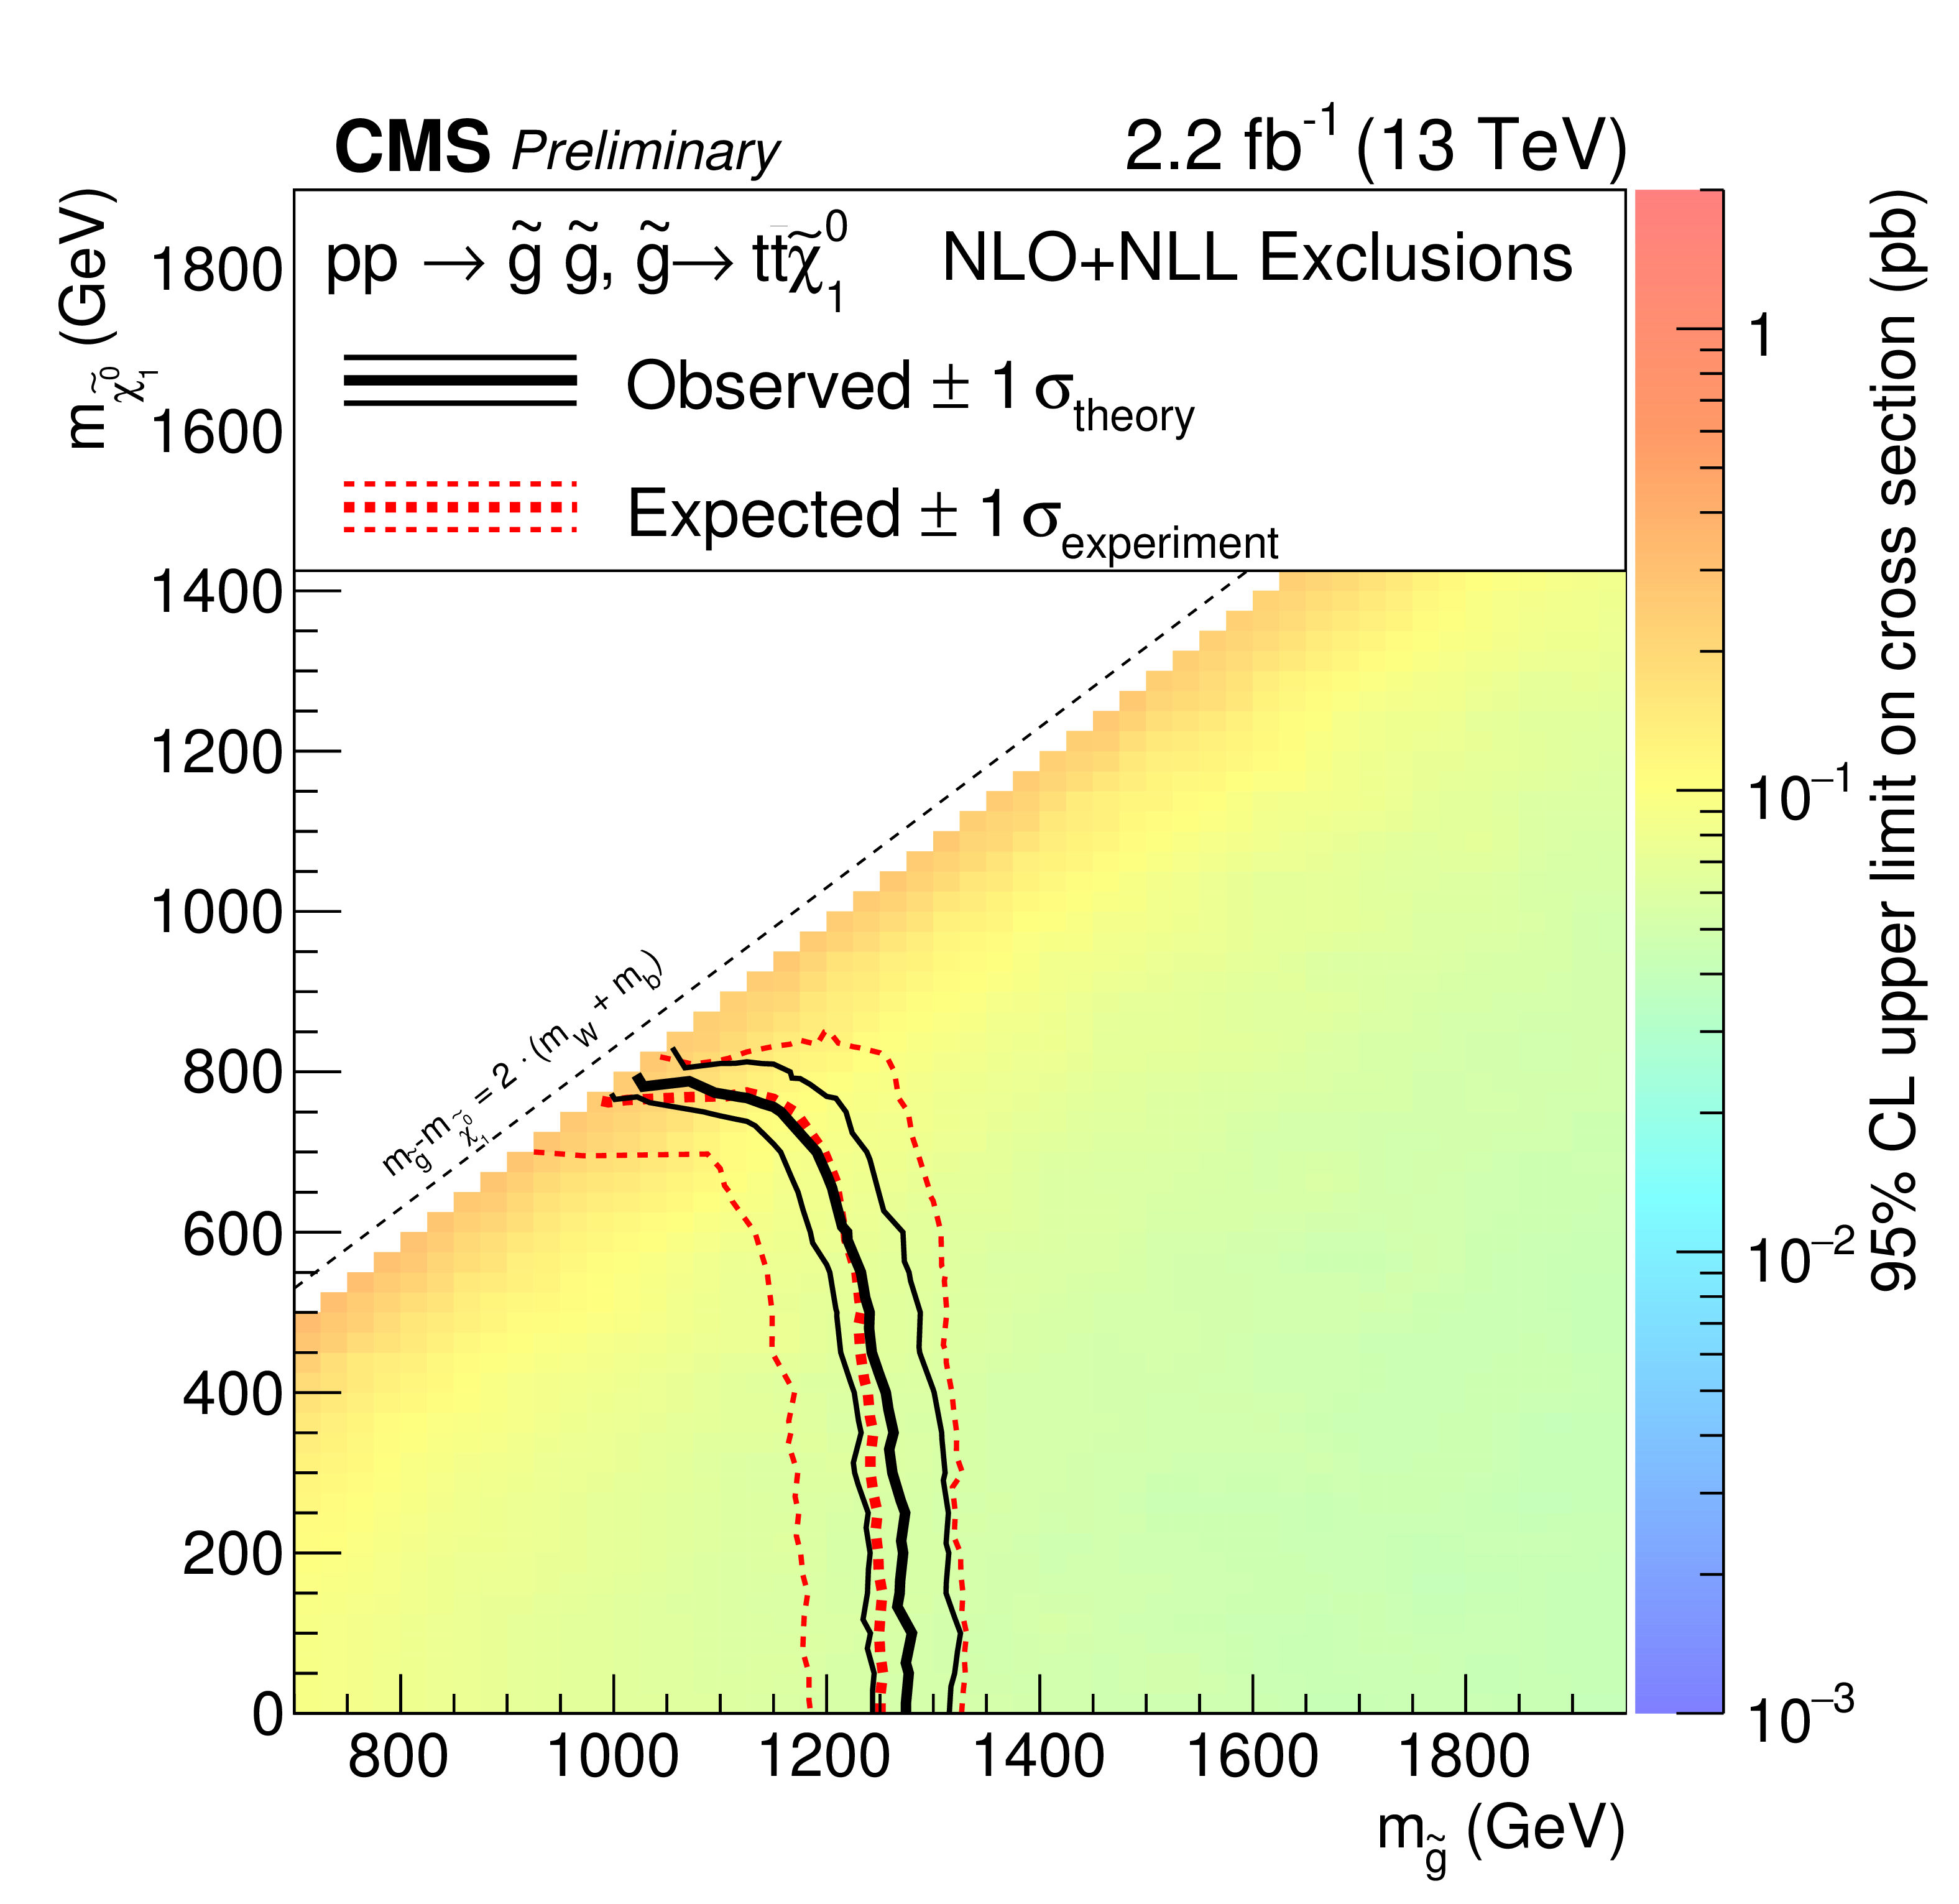
Figure 4:
Exclusion regions at a 95% CL in the plane of $m( \tilde{\chi}^0 )$ versus $m( \tilde{g} )$ for the T1tttt simplified model. The right-hand-side color scale indicates the excluded cross section values for a given point in the SUSY particle mass plane. Observed and expected limit lines indicate the boundaries of excluded regions (to the left and below the curve). |
png ; pdf ; |
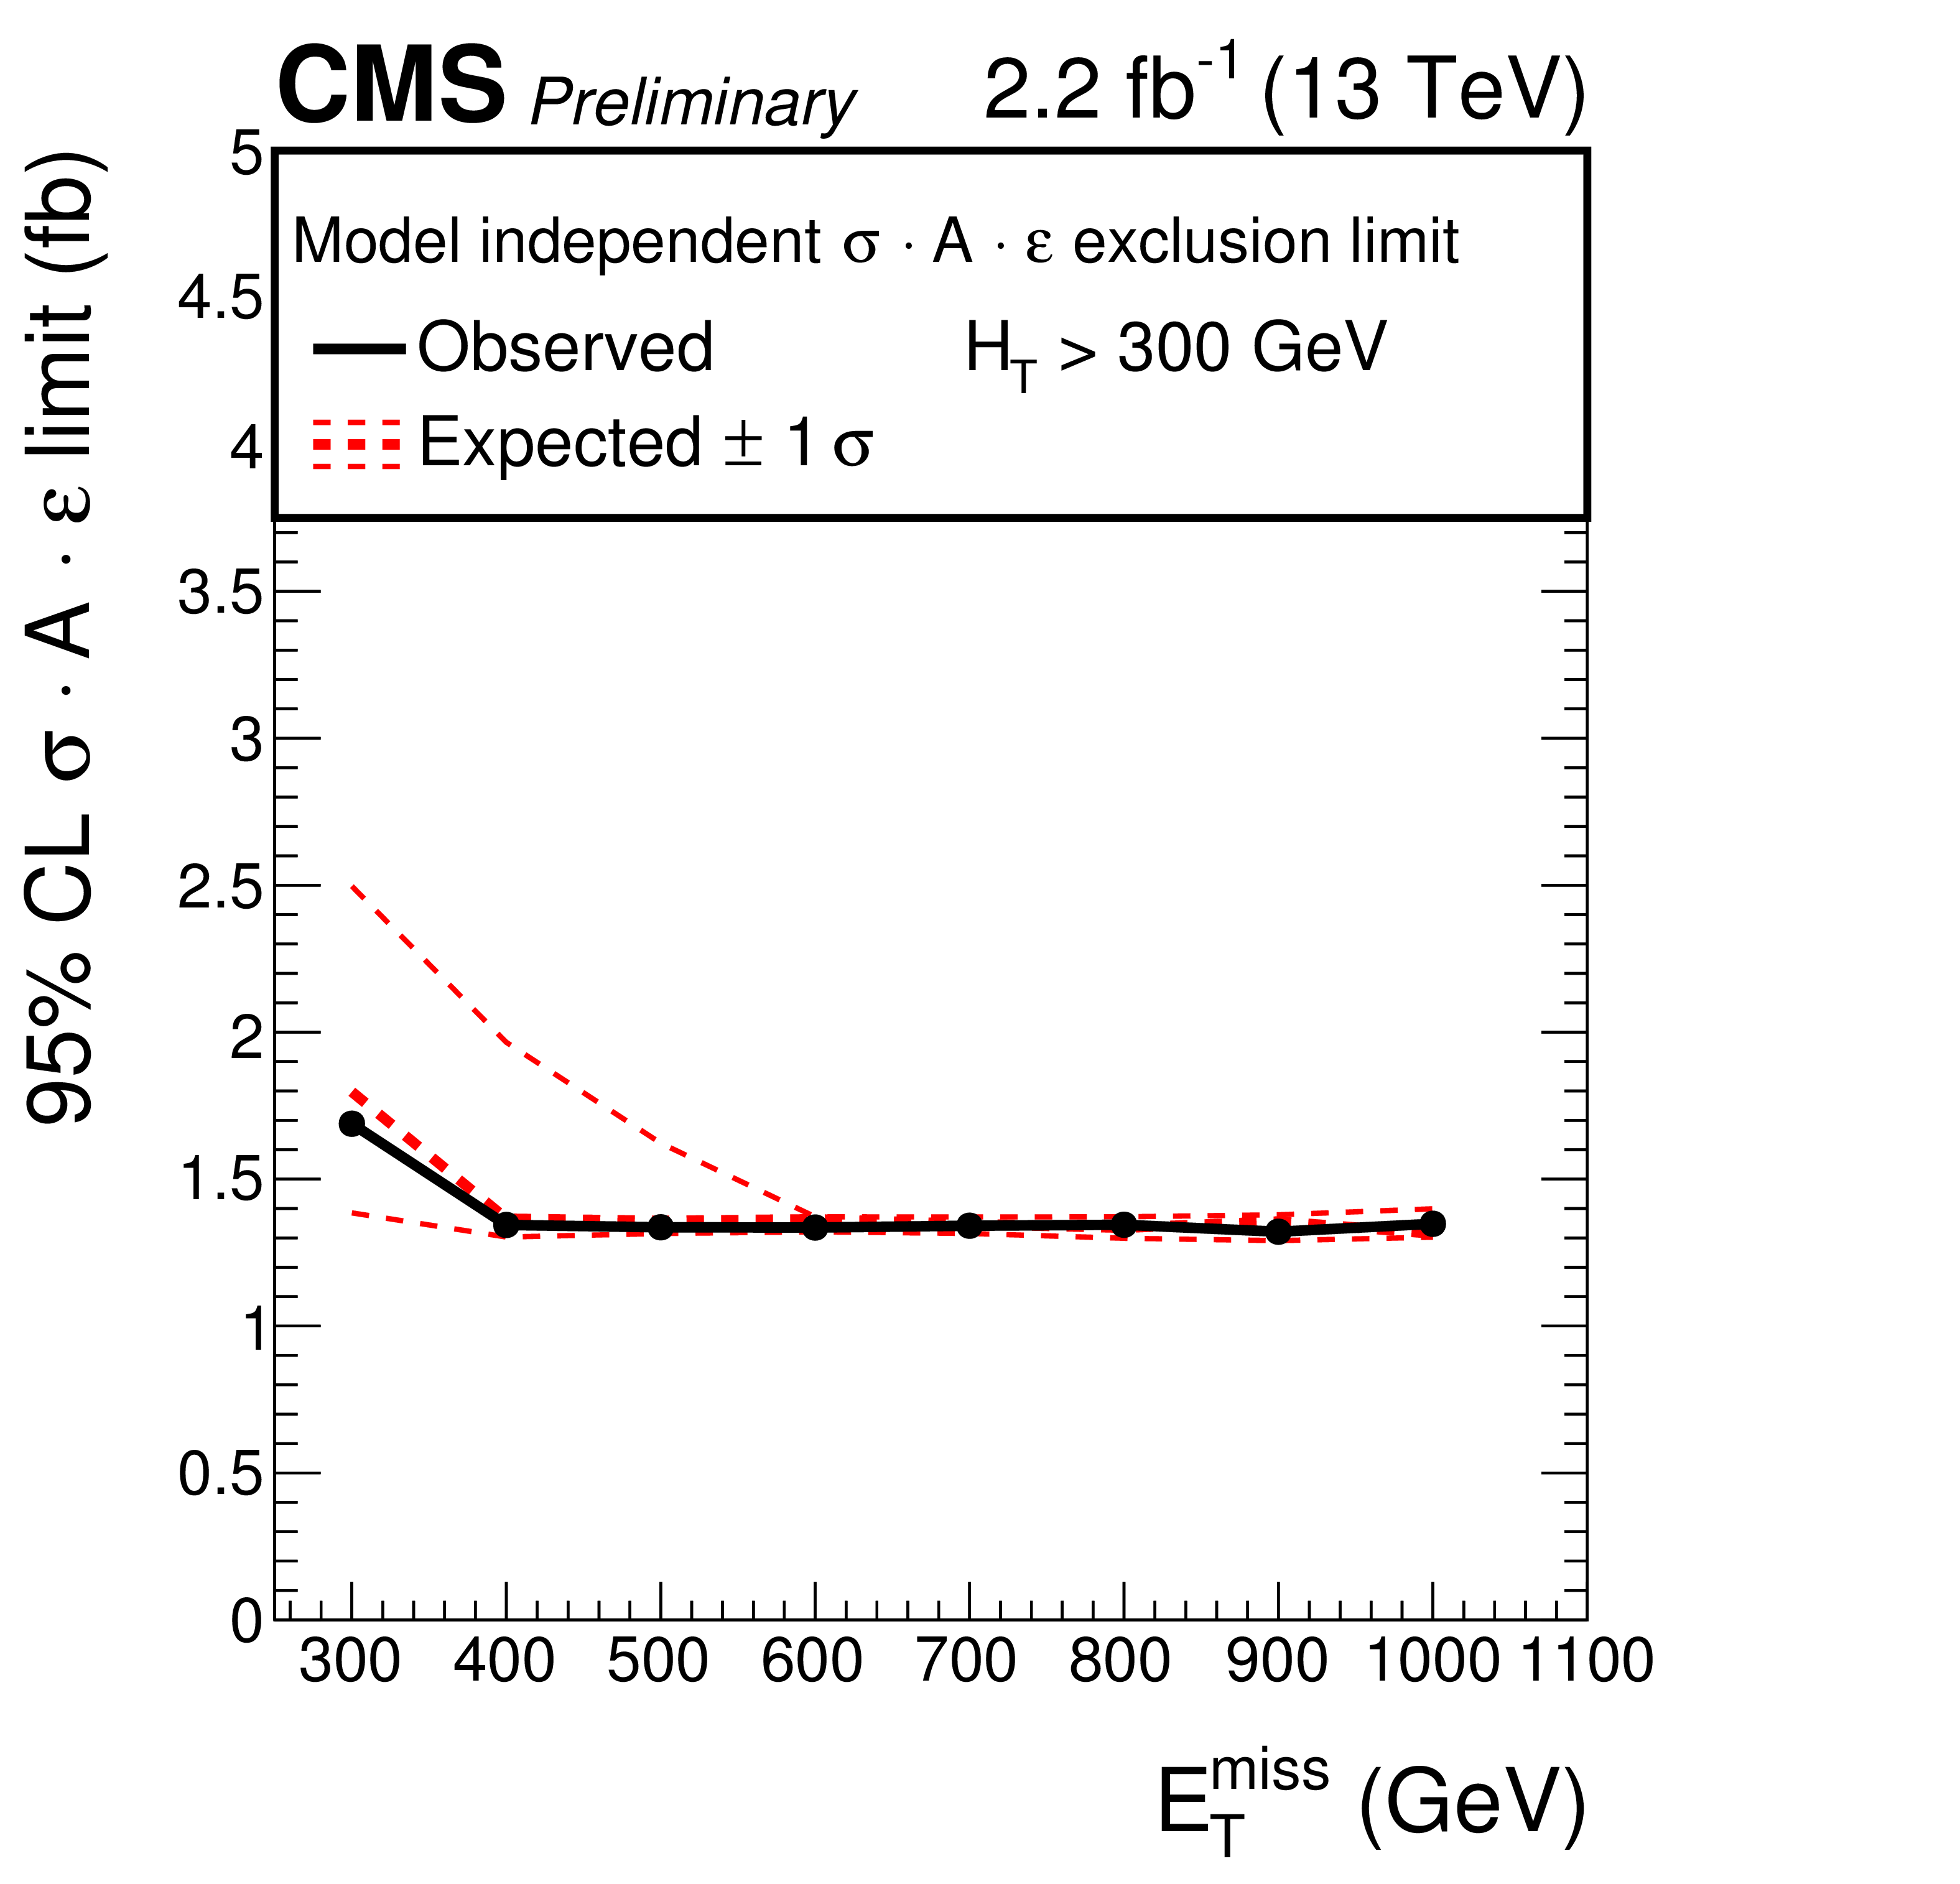
Figure 5-a:
Limits on $\sigma \cdot \mathcal {A} \cdot \epsilon $ at 95% CL with $ {\mathcal {L}} =$ 2.2 fb$^{-1}$. |
png ; pdf ; |
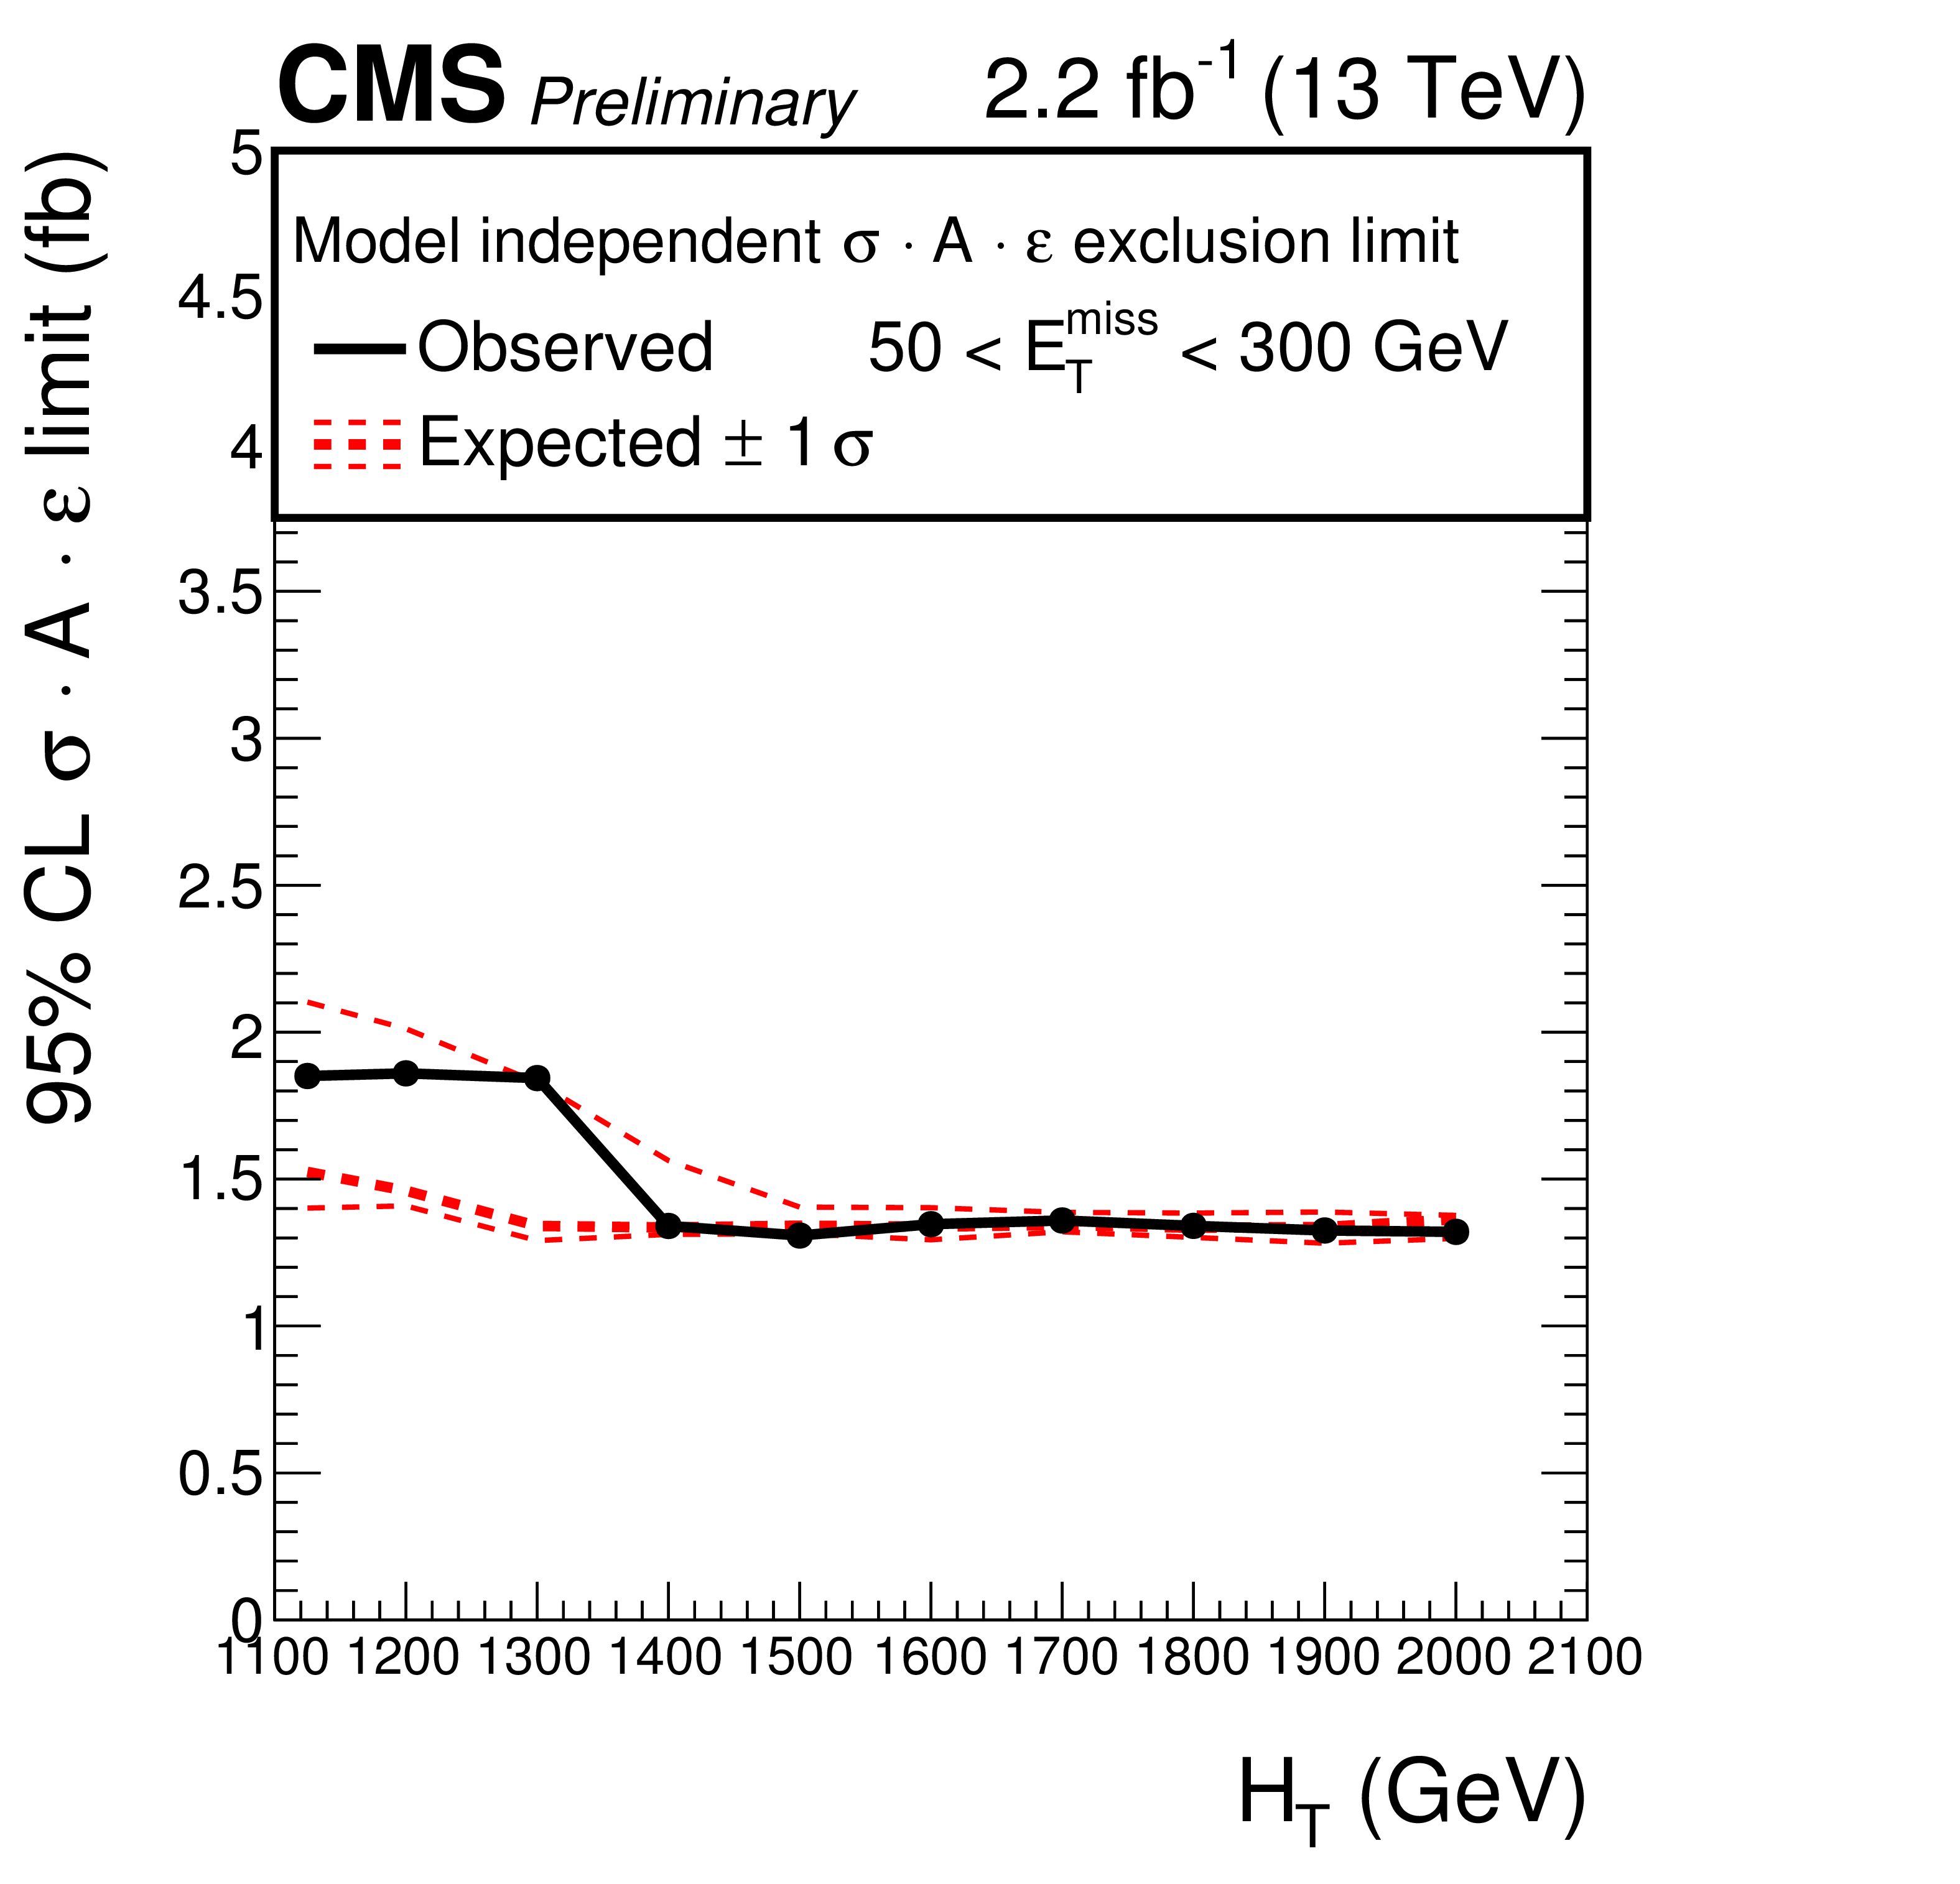
Figure 5-b:
Limits on $\sigma \cdot \mathcal {A} \cdot \epsilon $ at 95% CL with $ {\mathcal {L}} =$ 2.2 fb$^{-1}$. |
|
|
Compact Muon Solenoid LHC, CERN |
|

|

|

|

|

|