

Compact Muon Solenoid
LHC, CERN
| CMS-PAS-SUS-14-022 | ||
| Search for electroweak production of charginos in final states with two tau leptons in pp collisions at $\sqrt{s}= $ 8 TeV | ||
| CMS Collaboration | ||
| March 2016 | ||
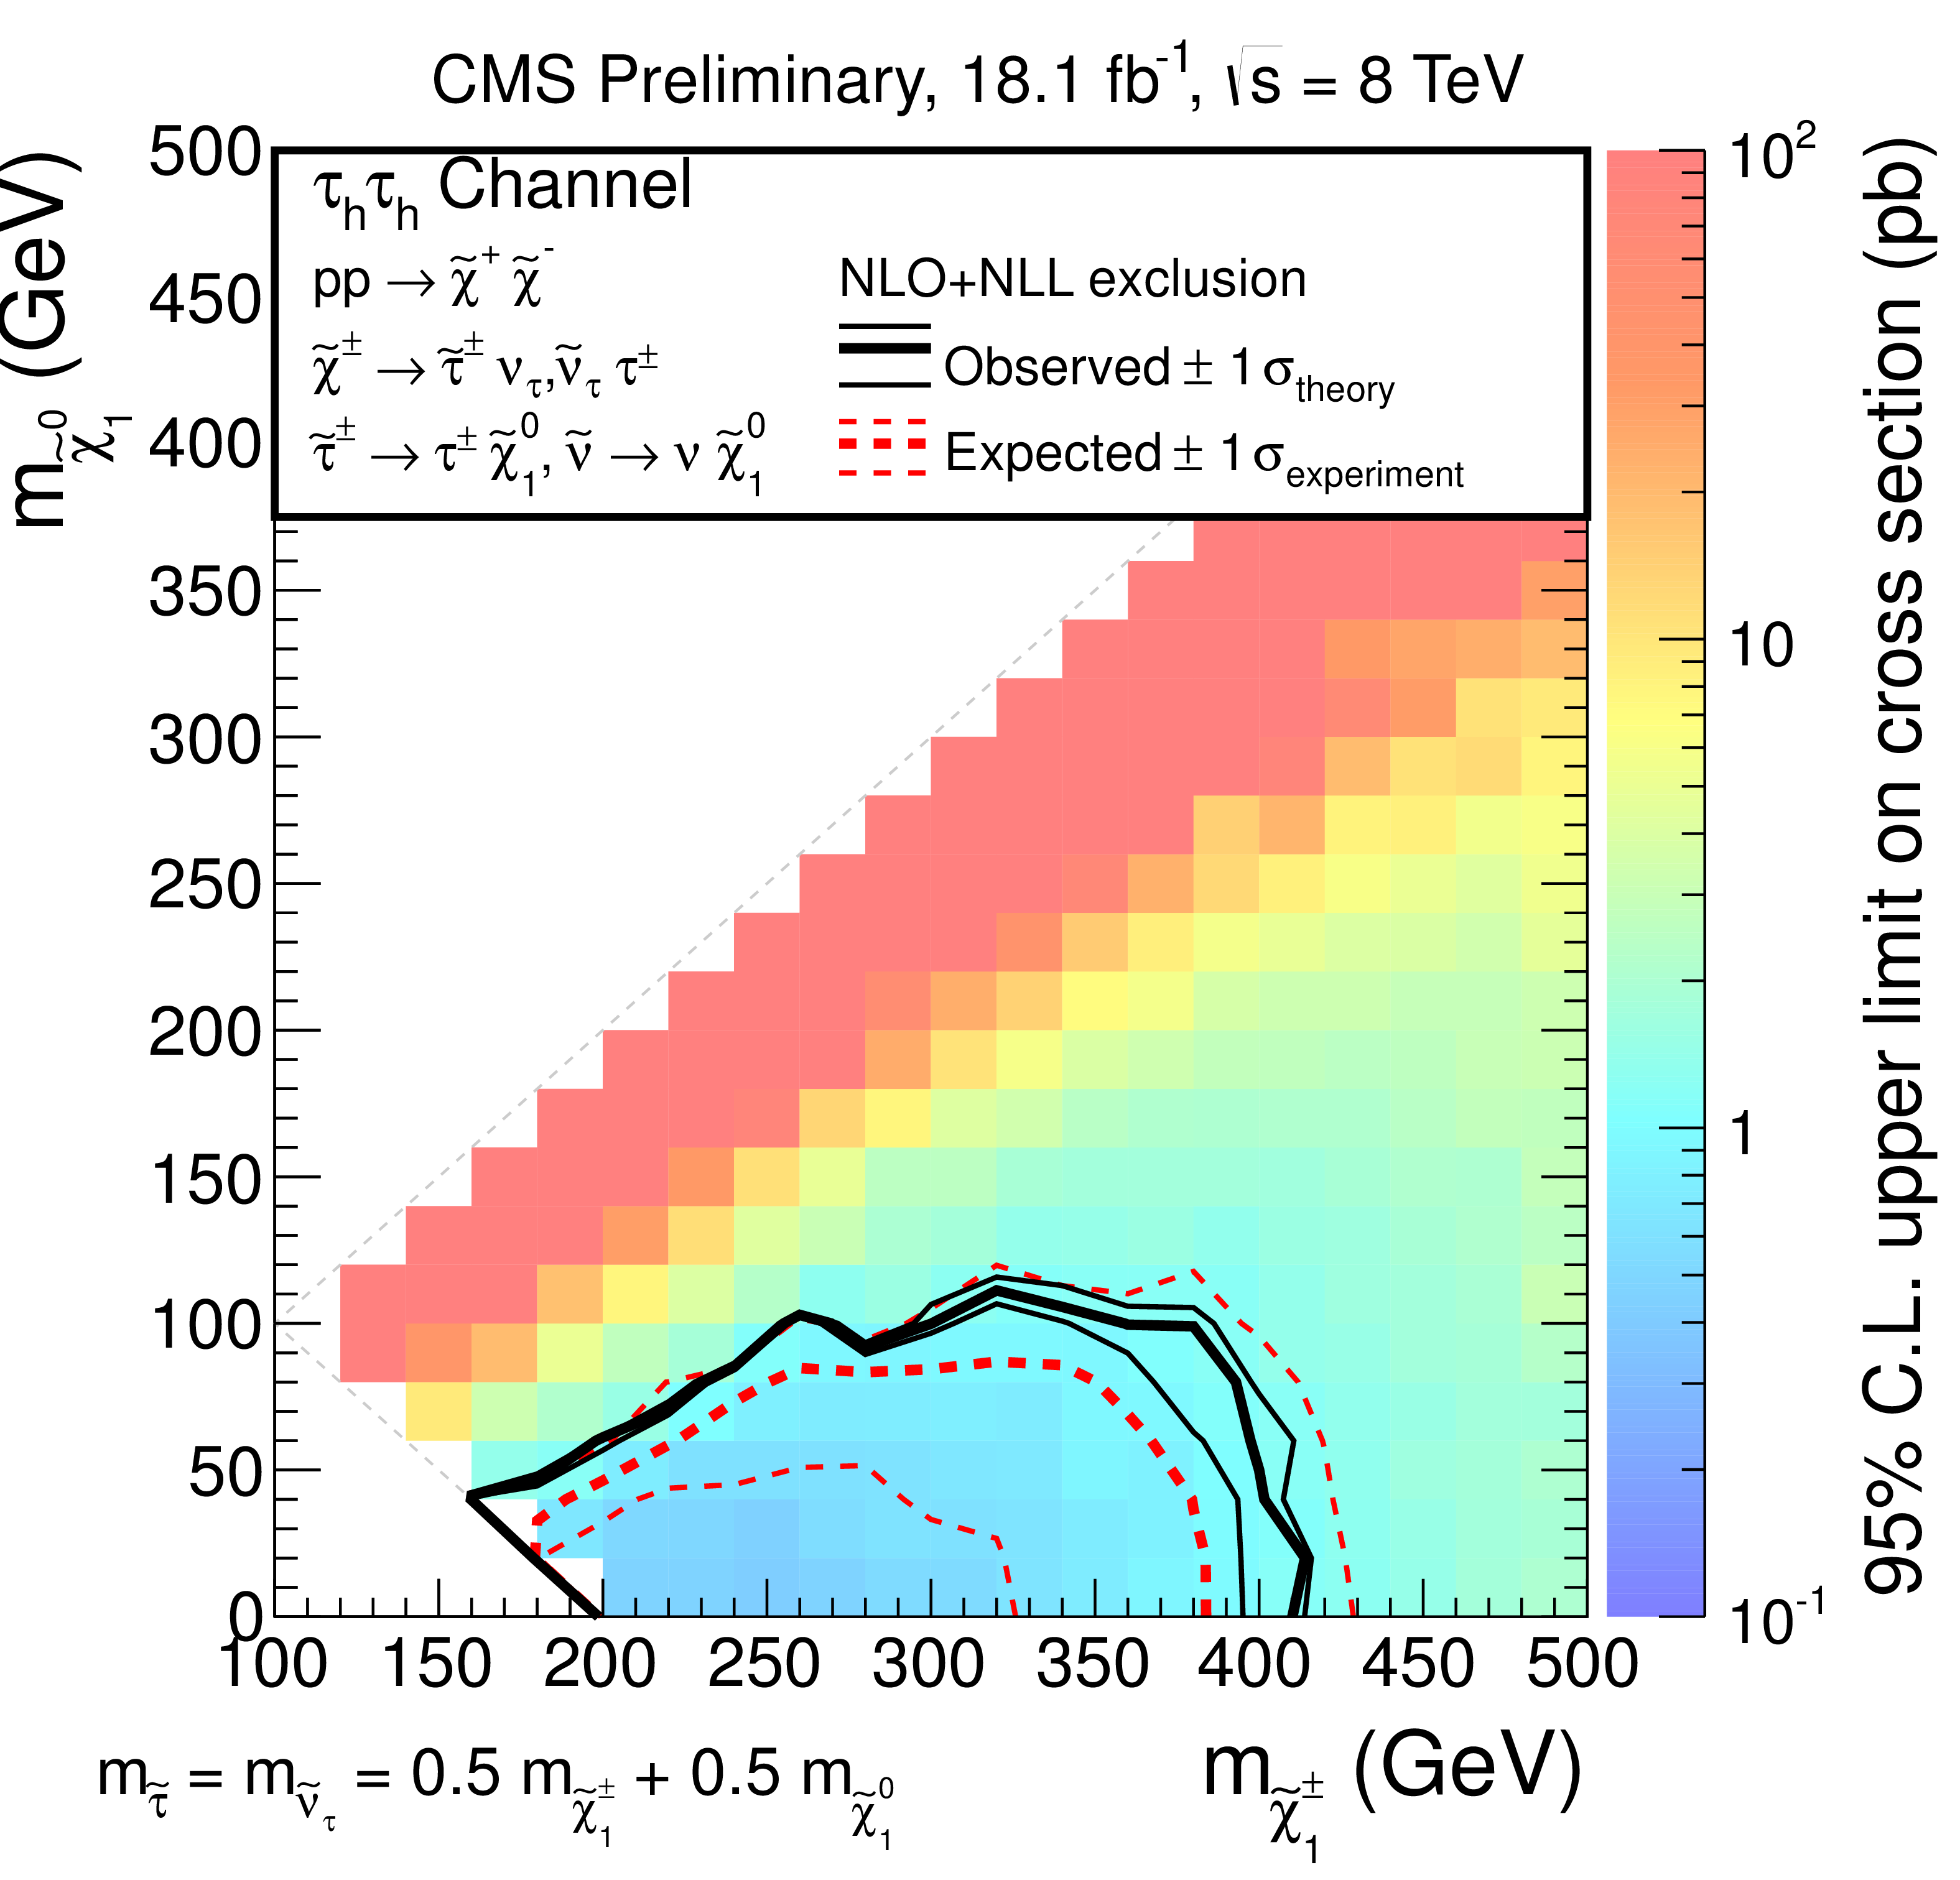
| Abstract: A search for electroweak production of supersymmetric particles is performed with two tau leptons in the final state. These results are based on 18.1 to 19.6 fb$^{-1}$ of proton-proton collisions at $\sqrt{s} =$ 8 TeV, collected with the CMS detector at the CERN Large Hadron Collider. The observed events are found to be consistent with the standard model prediction. Upper limits are set on the masses of the lightest chargino and the lightest neutralino, assuming the third generation sleptons are the lightest sleptons and their masses are at a middle point between the chargino and the neutralino. In the context of simplified model spectra, charginos lighter than 417 GeV are excluded at 95% confidence level in the case of massless neutralino. | ||
|
Links:
CDS record (PDF) ;
CADI line (restricted) ;
These preliminary results are superseded in this paper, JHEP 04 (2017) 018. |
||
| Figures | |
png pdf |
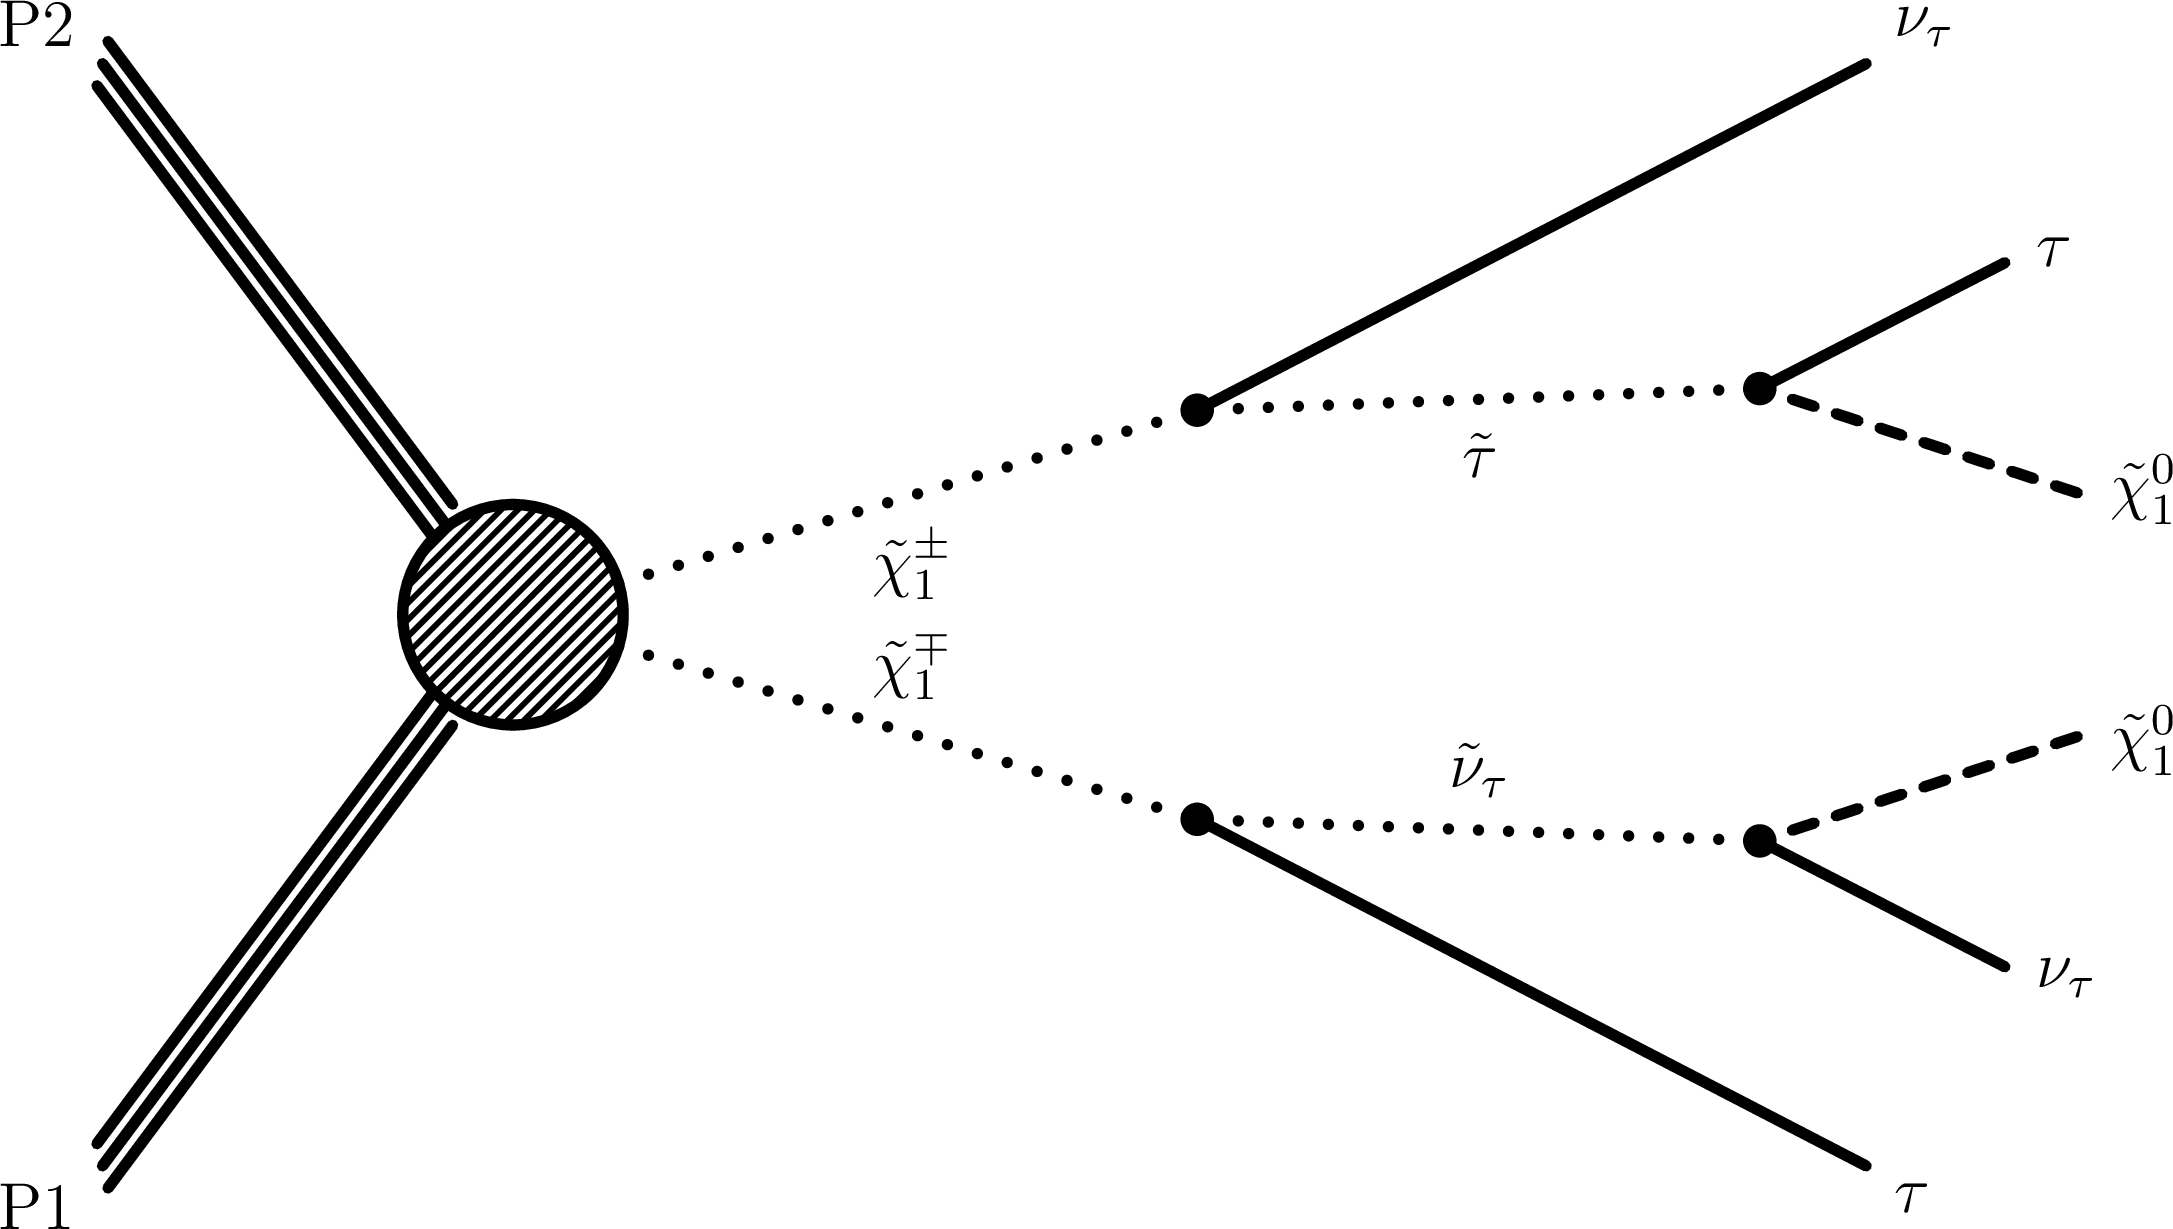
Figure 1-a:
Schematic production of double $\tau $ from chargino pair and stau pair. |

png pdf |
Figure 1-b:
Schematic production of double $\tau $ from chargino pair and stau pair. |

png pdf |
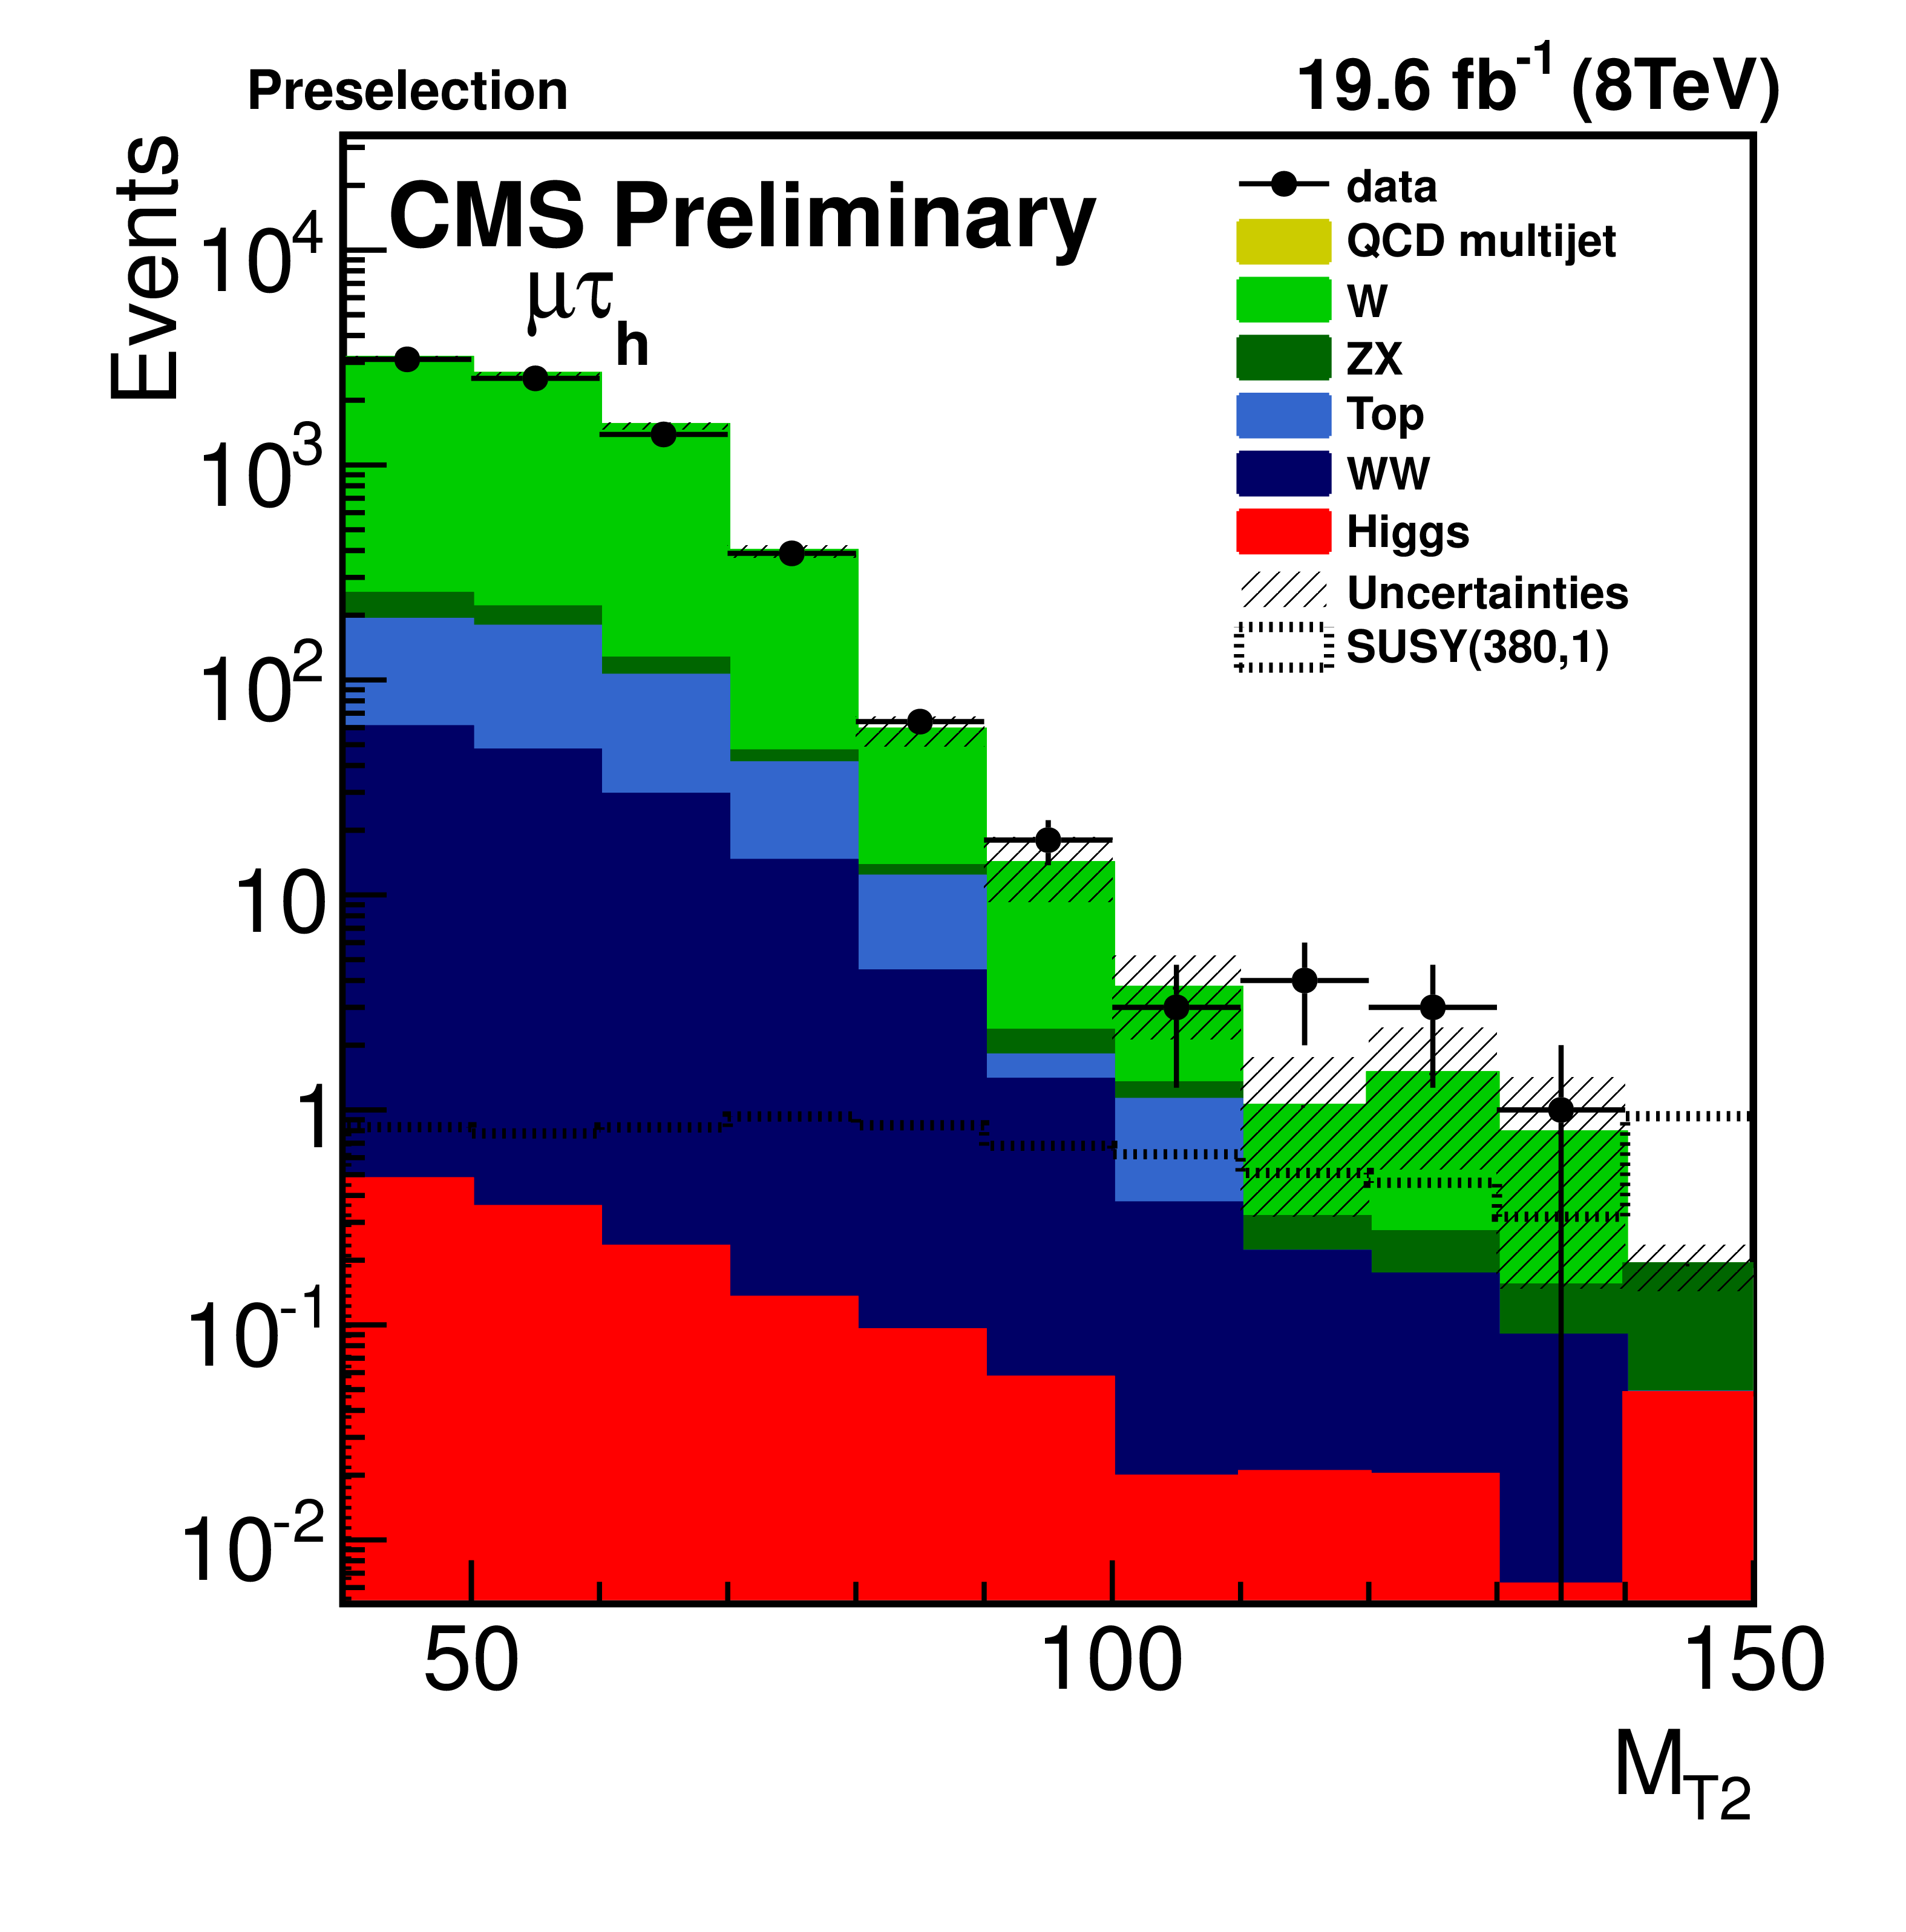
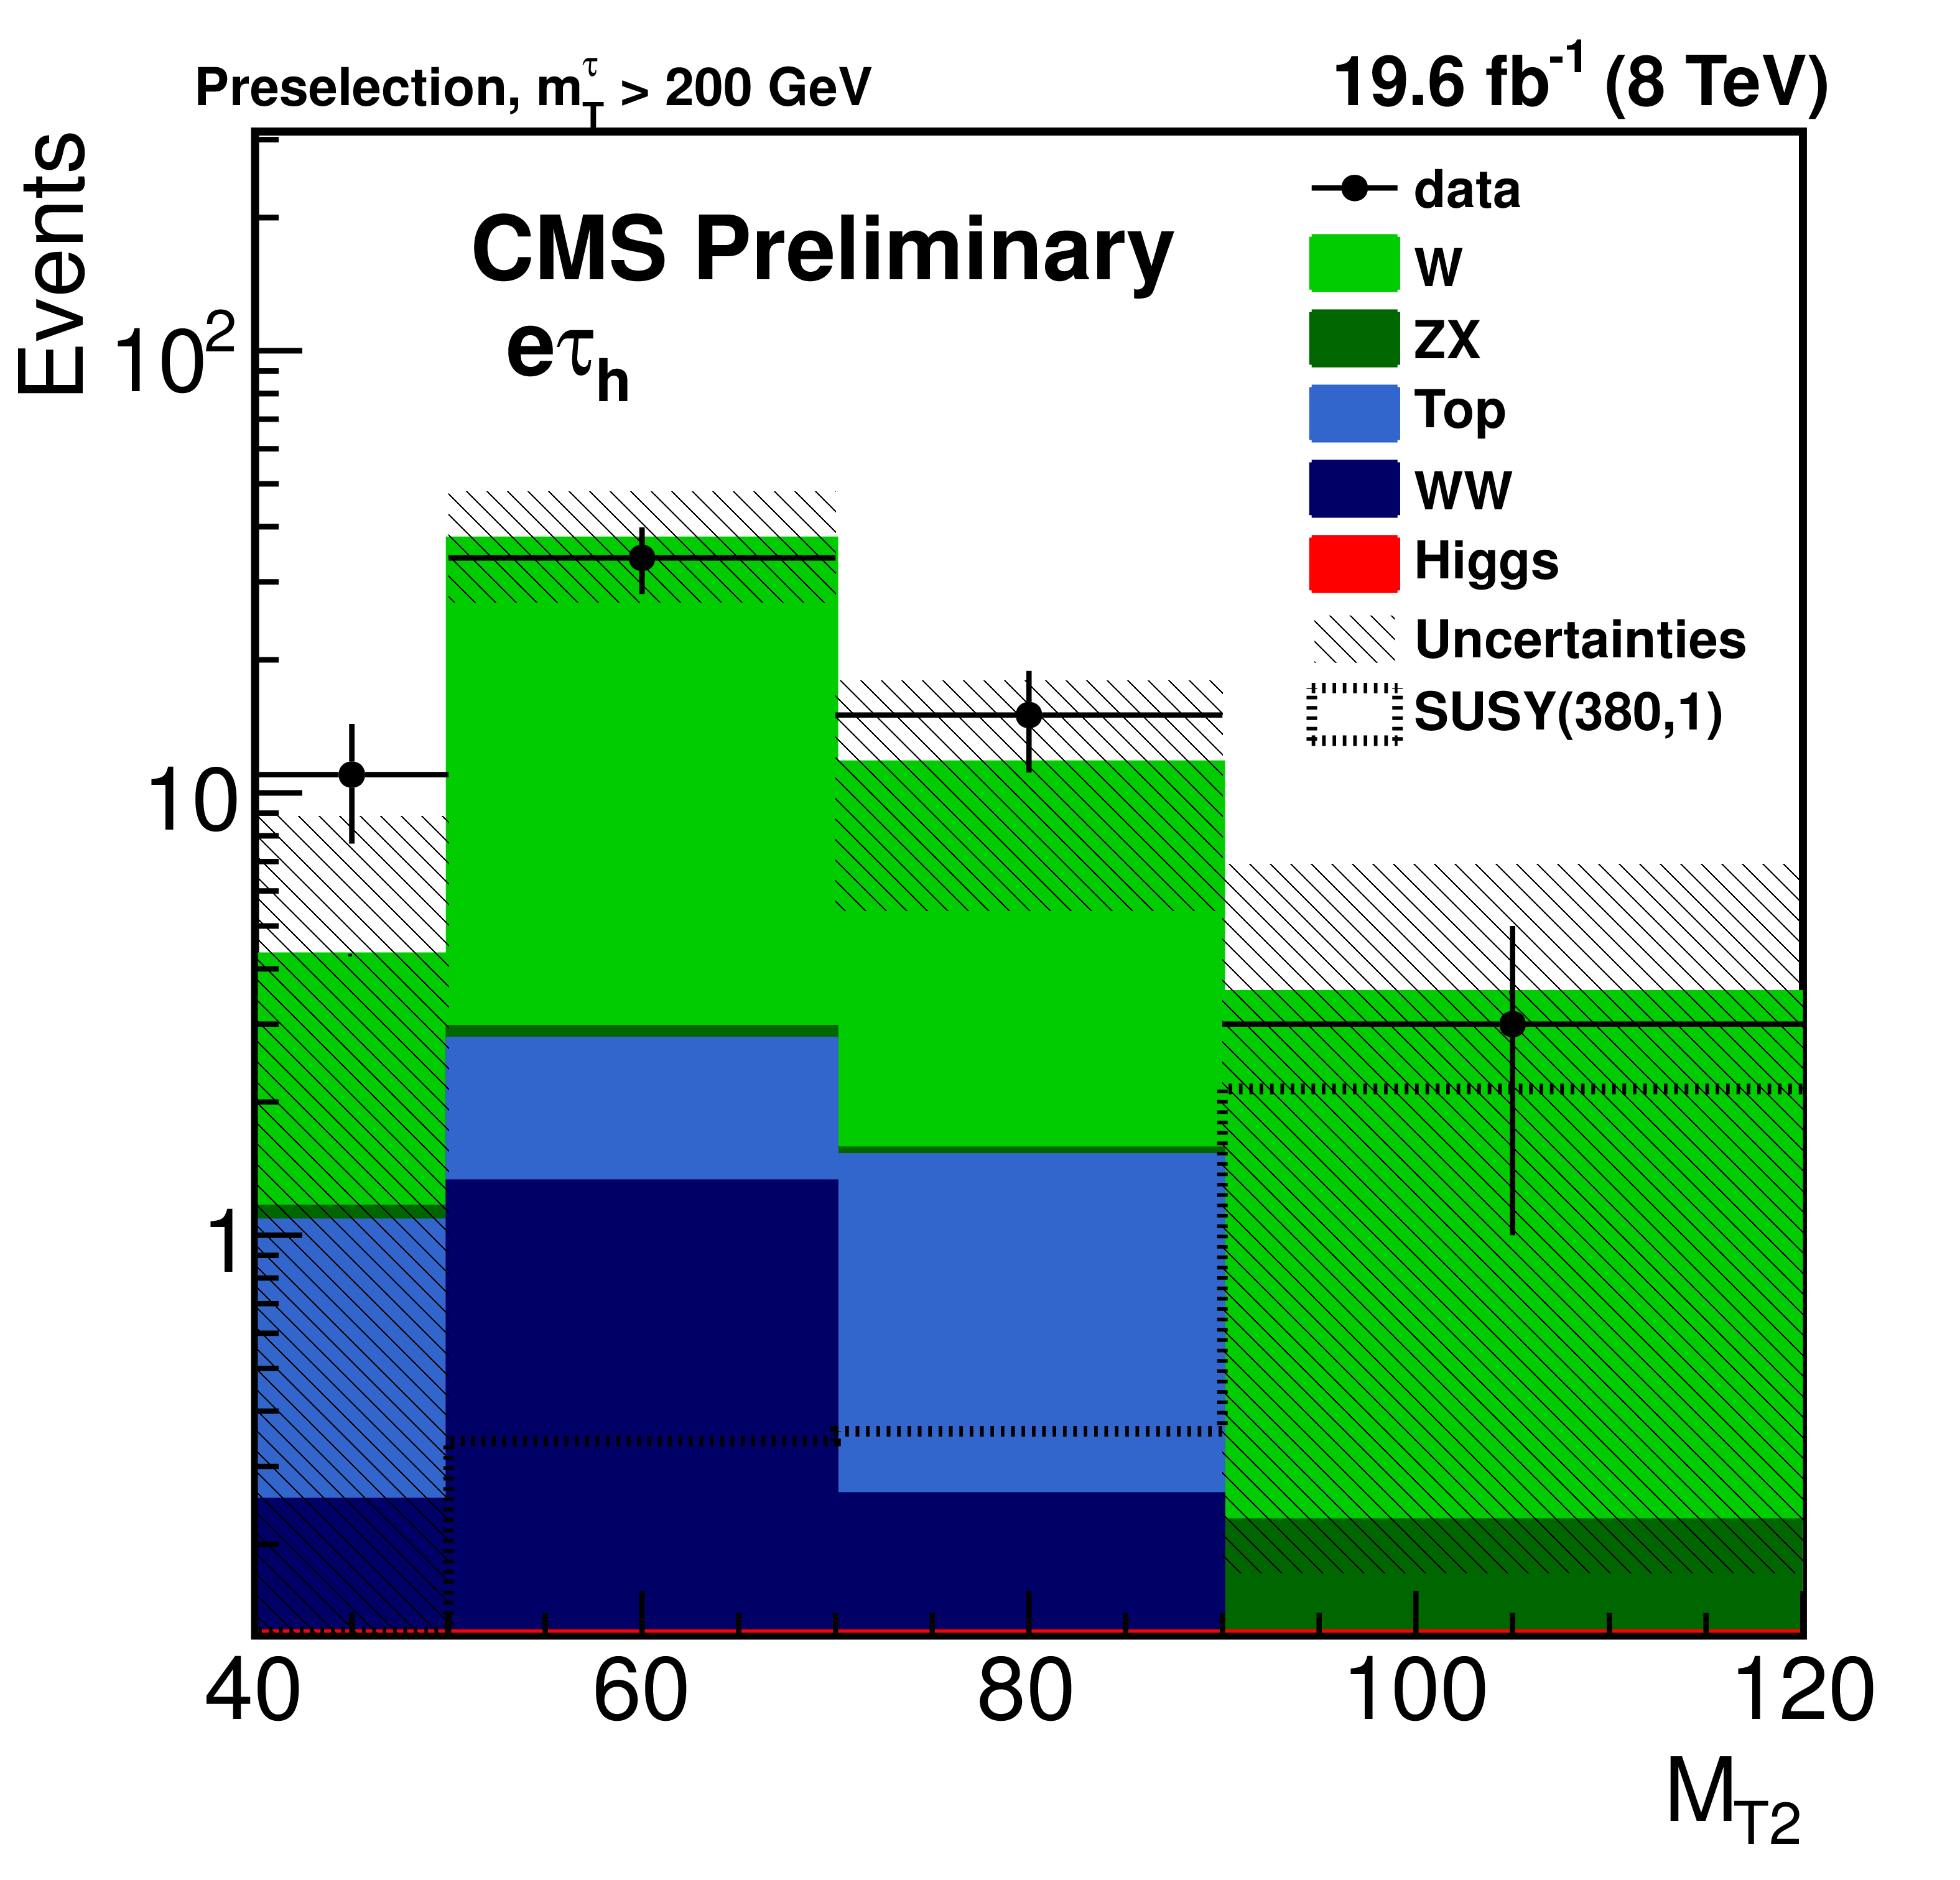
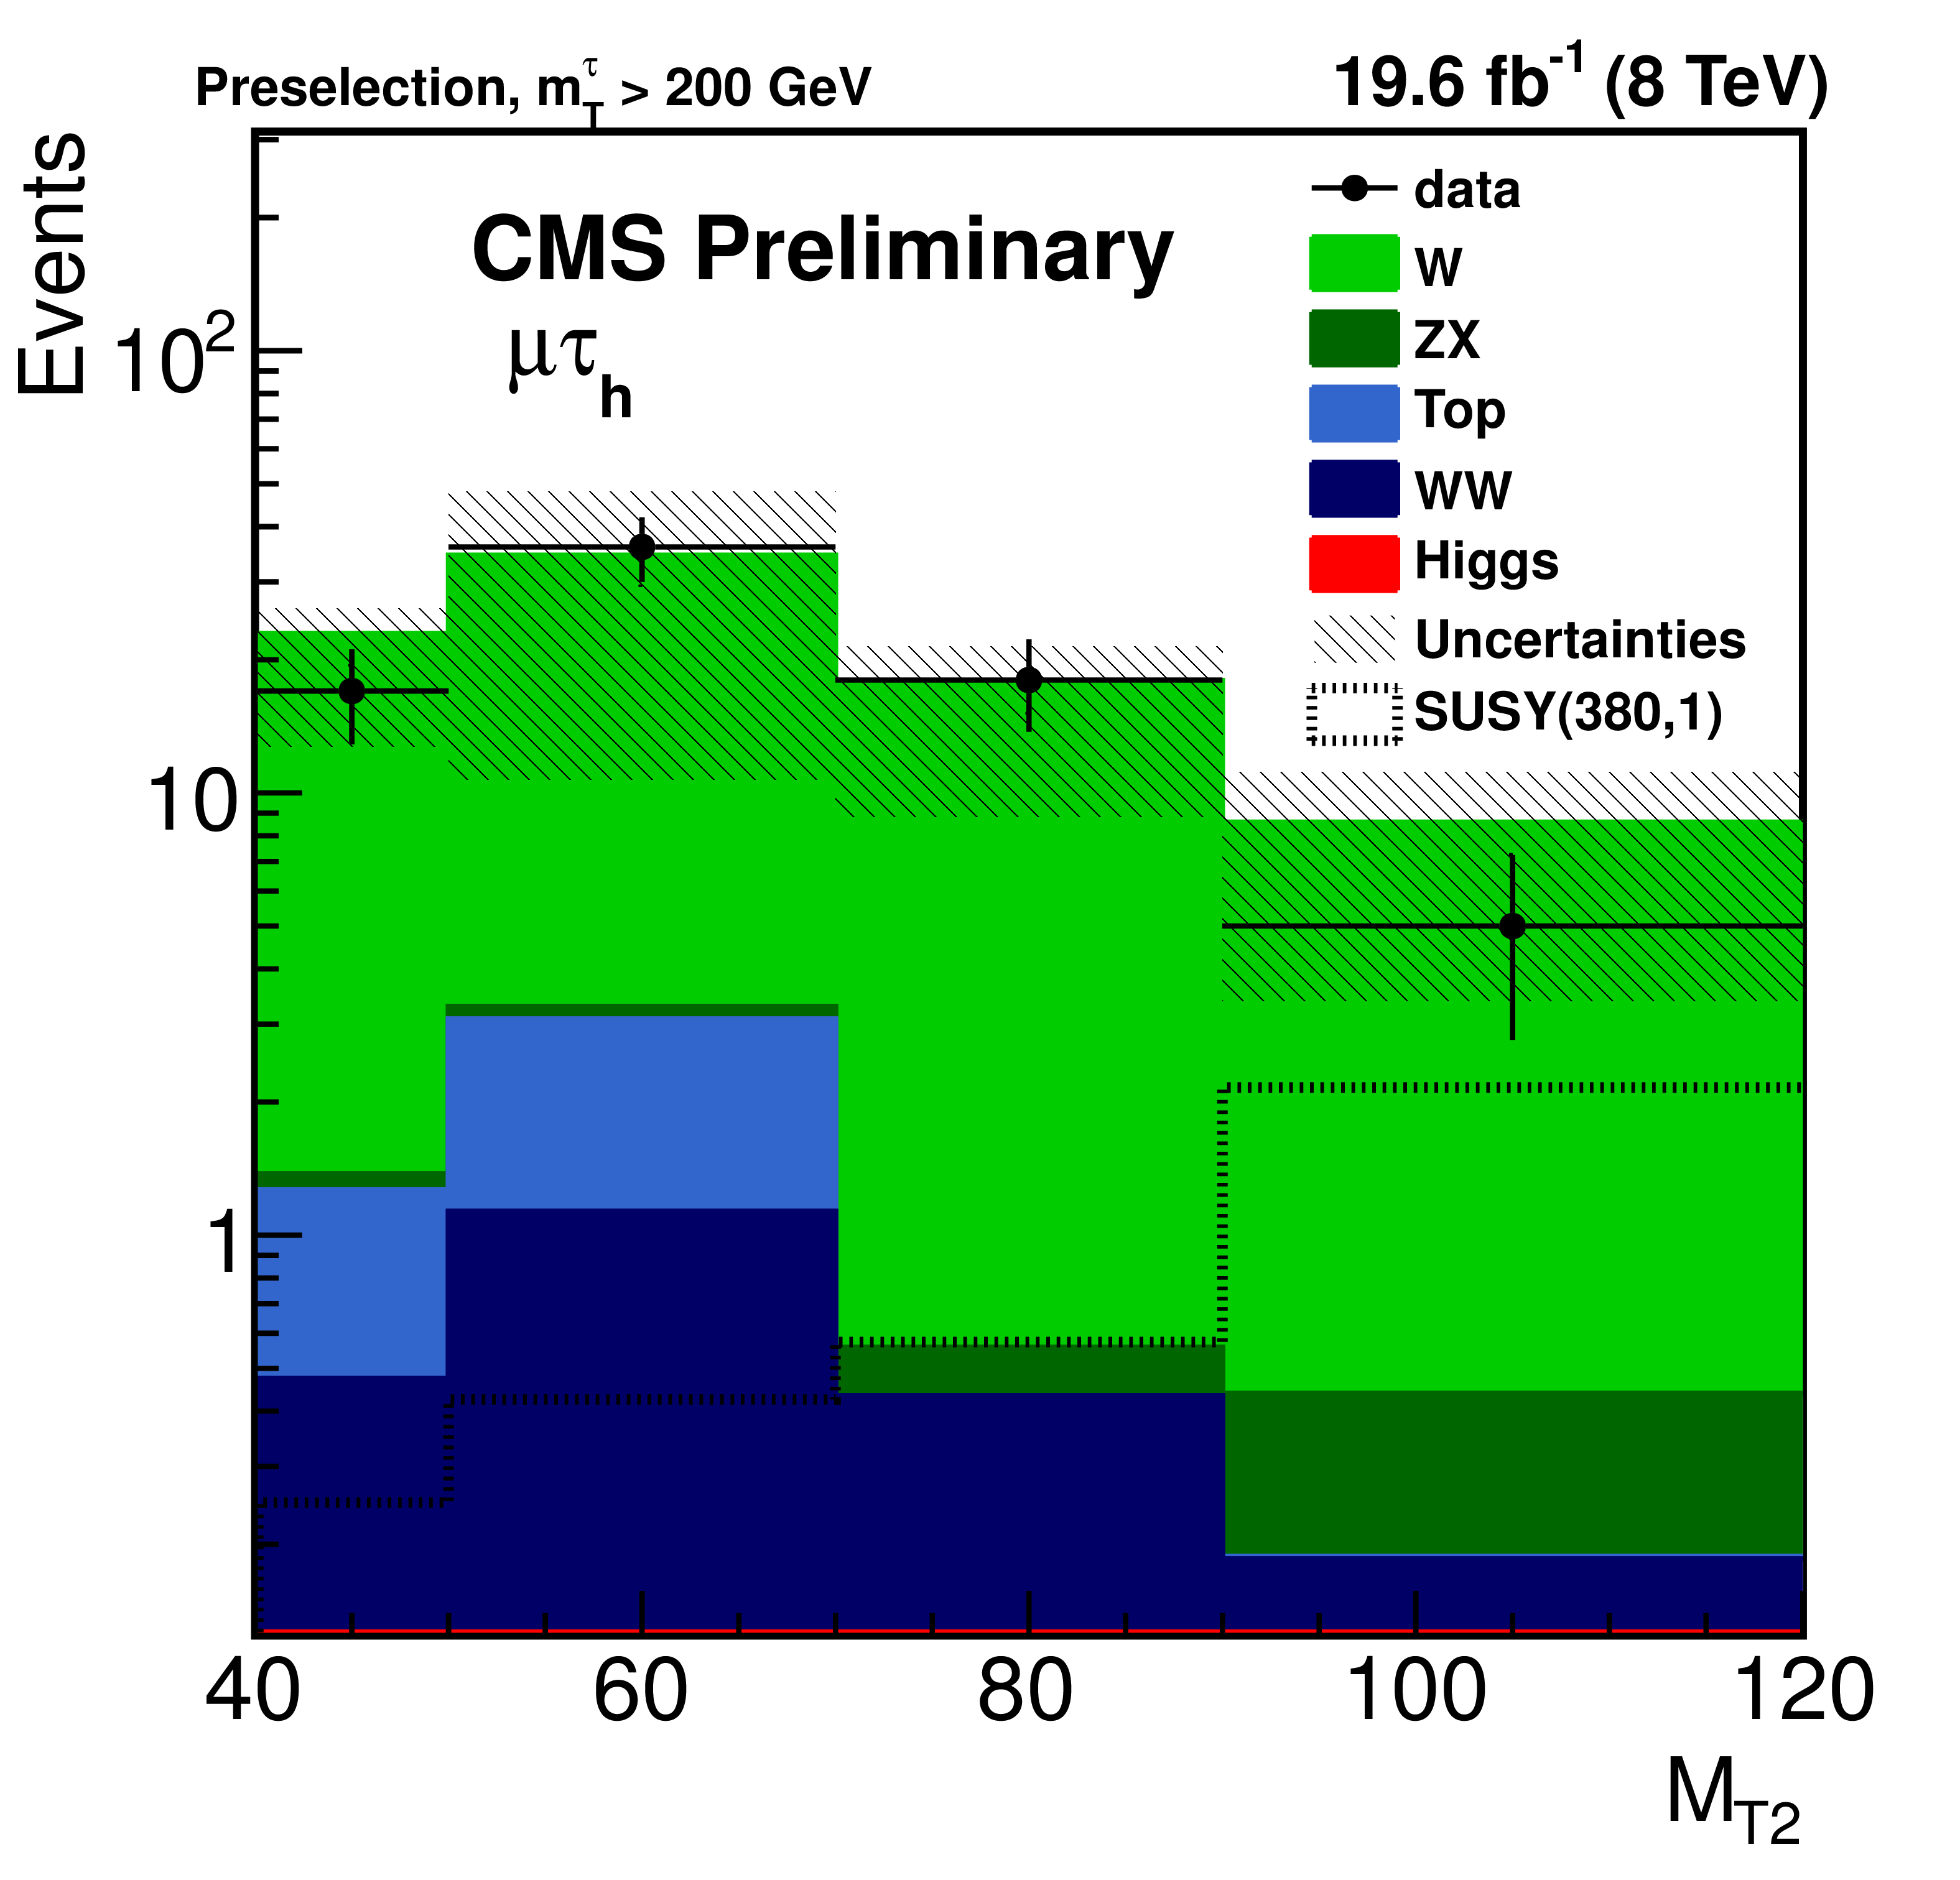
Figure 2-a:
$ {{M_{\rm T2}}} $ distributions for events in the sample after preselection, compared to SM expectation in (a) $ \mathrm{e} {\tau _{\rm h}} $ and (b) $ \mu {\tau _{\rm h}} $ channels. The signal distribution is shown for $m_{ {\tilde{\chi}^{\pm }_1} }=$ 380 GeV, $m_{ \tilde{\chi}^0_1} =$ 1 GeV. |
png pdf |
Figure 2-b:
$ {{M_{\rm T2}}} $ distributions for events in the sample after preselection, compared to SM expectation in (a) $ \mathrm{e} {\tau _{\rm h}} $ and (b) $ \mu {\tau _{\rm h}} $ channels. The signal distribution is shown for $m_{ {\tilde{\chi}^{\pm }_1} }=$ 380 GeV, $m_{ \tilde{\chi}^0_1} =$ 1 GeV. |
png pdf |
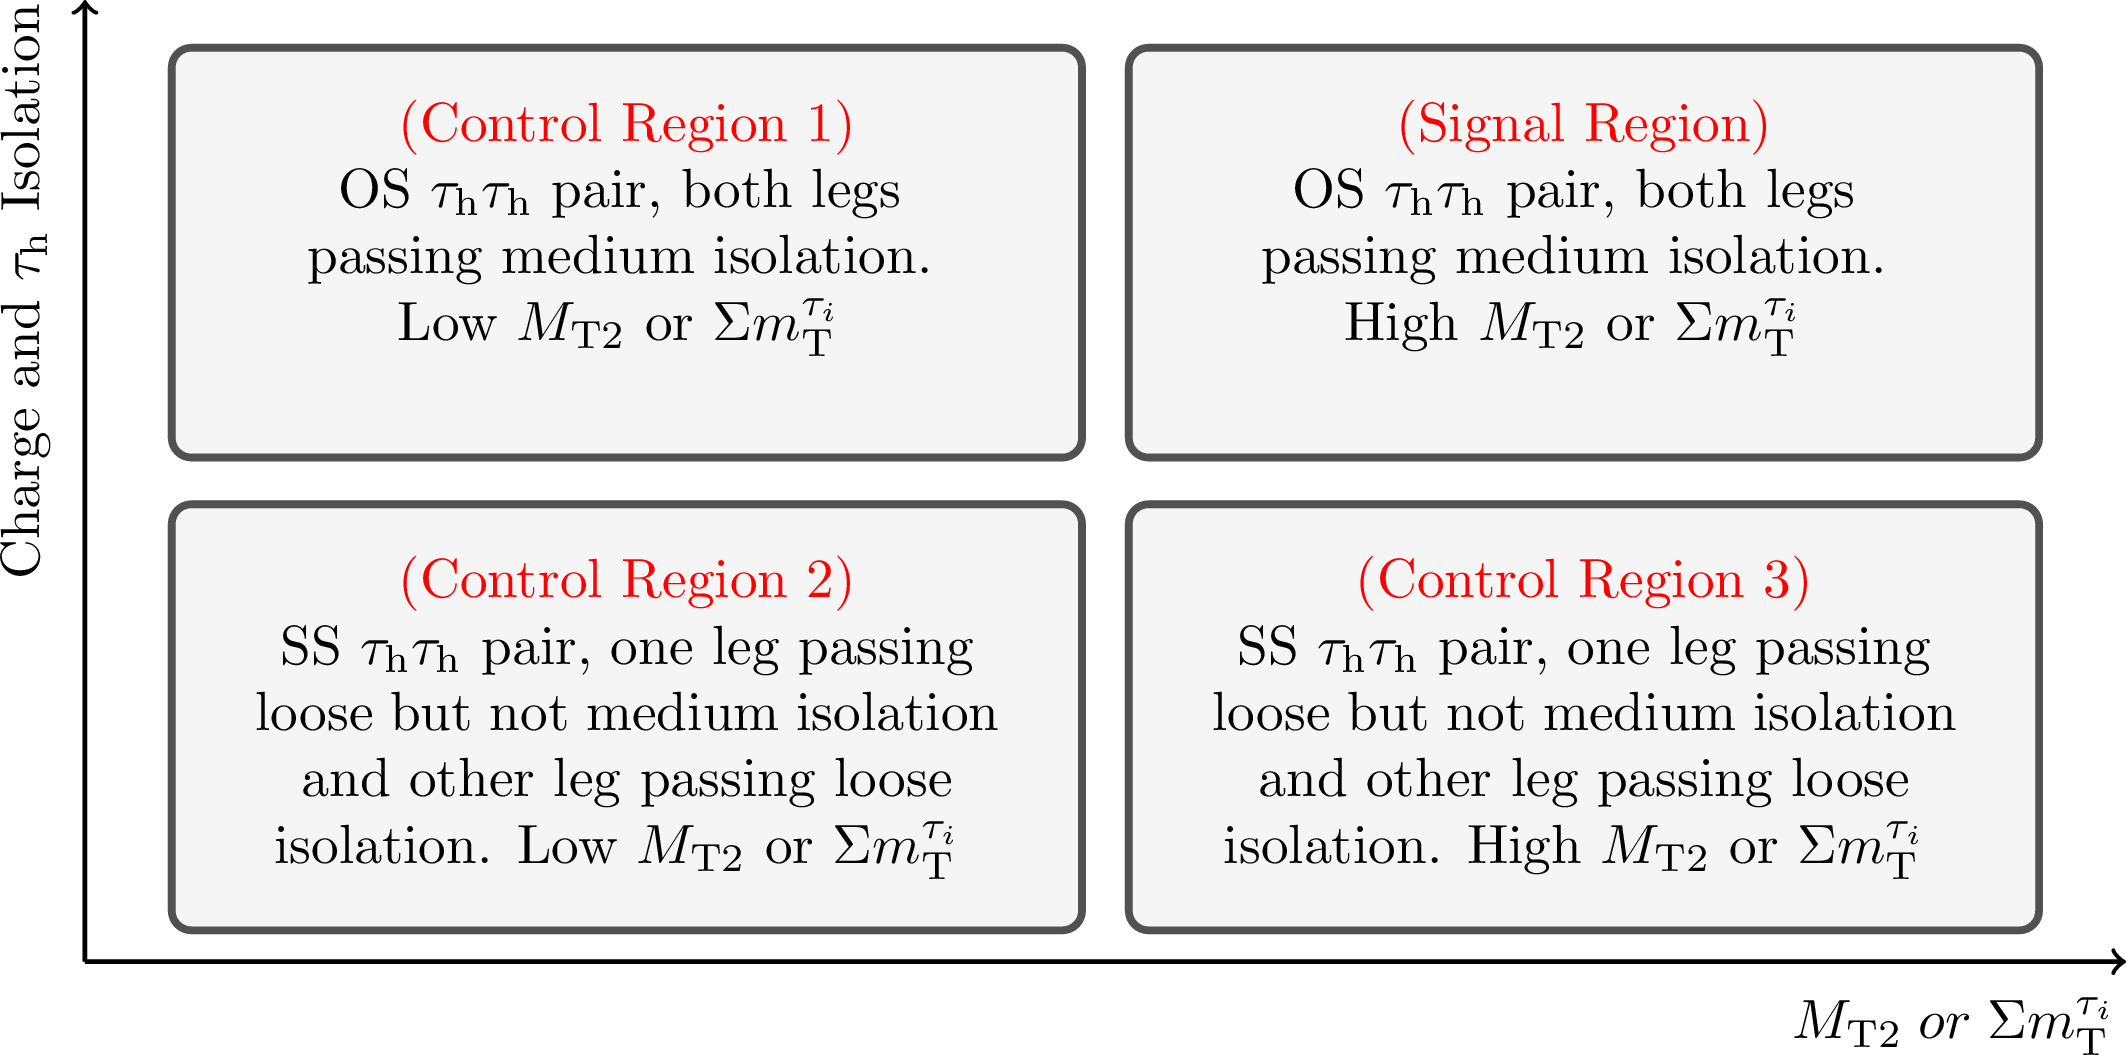
Figure 3:
Schematic illustration of four control regions used to estimate the QCD backgrounds. SS and OS stand for same-sign and opposite-sign pairs. |
png pdf |
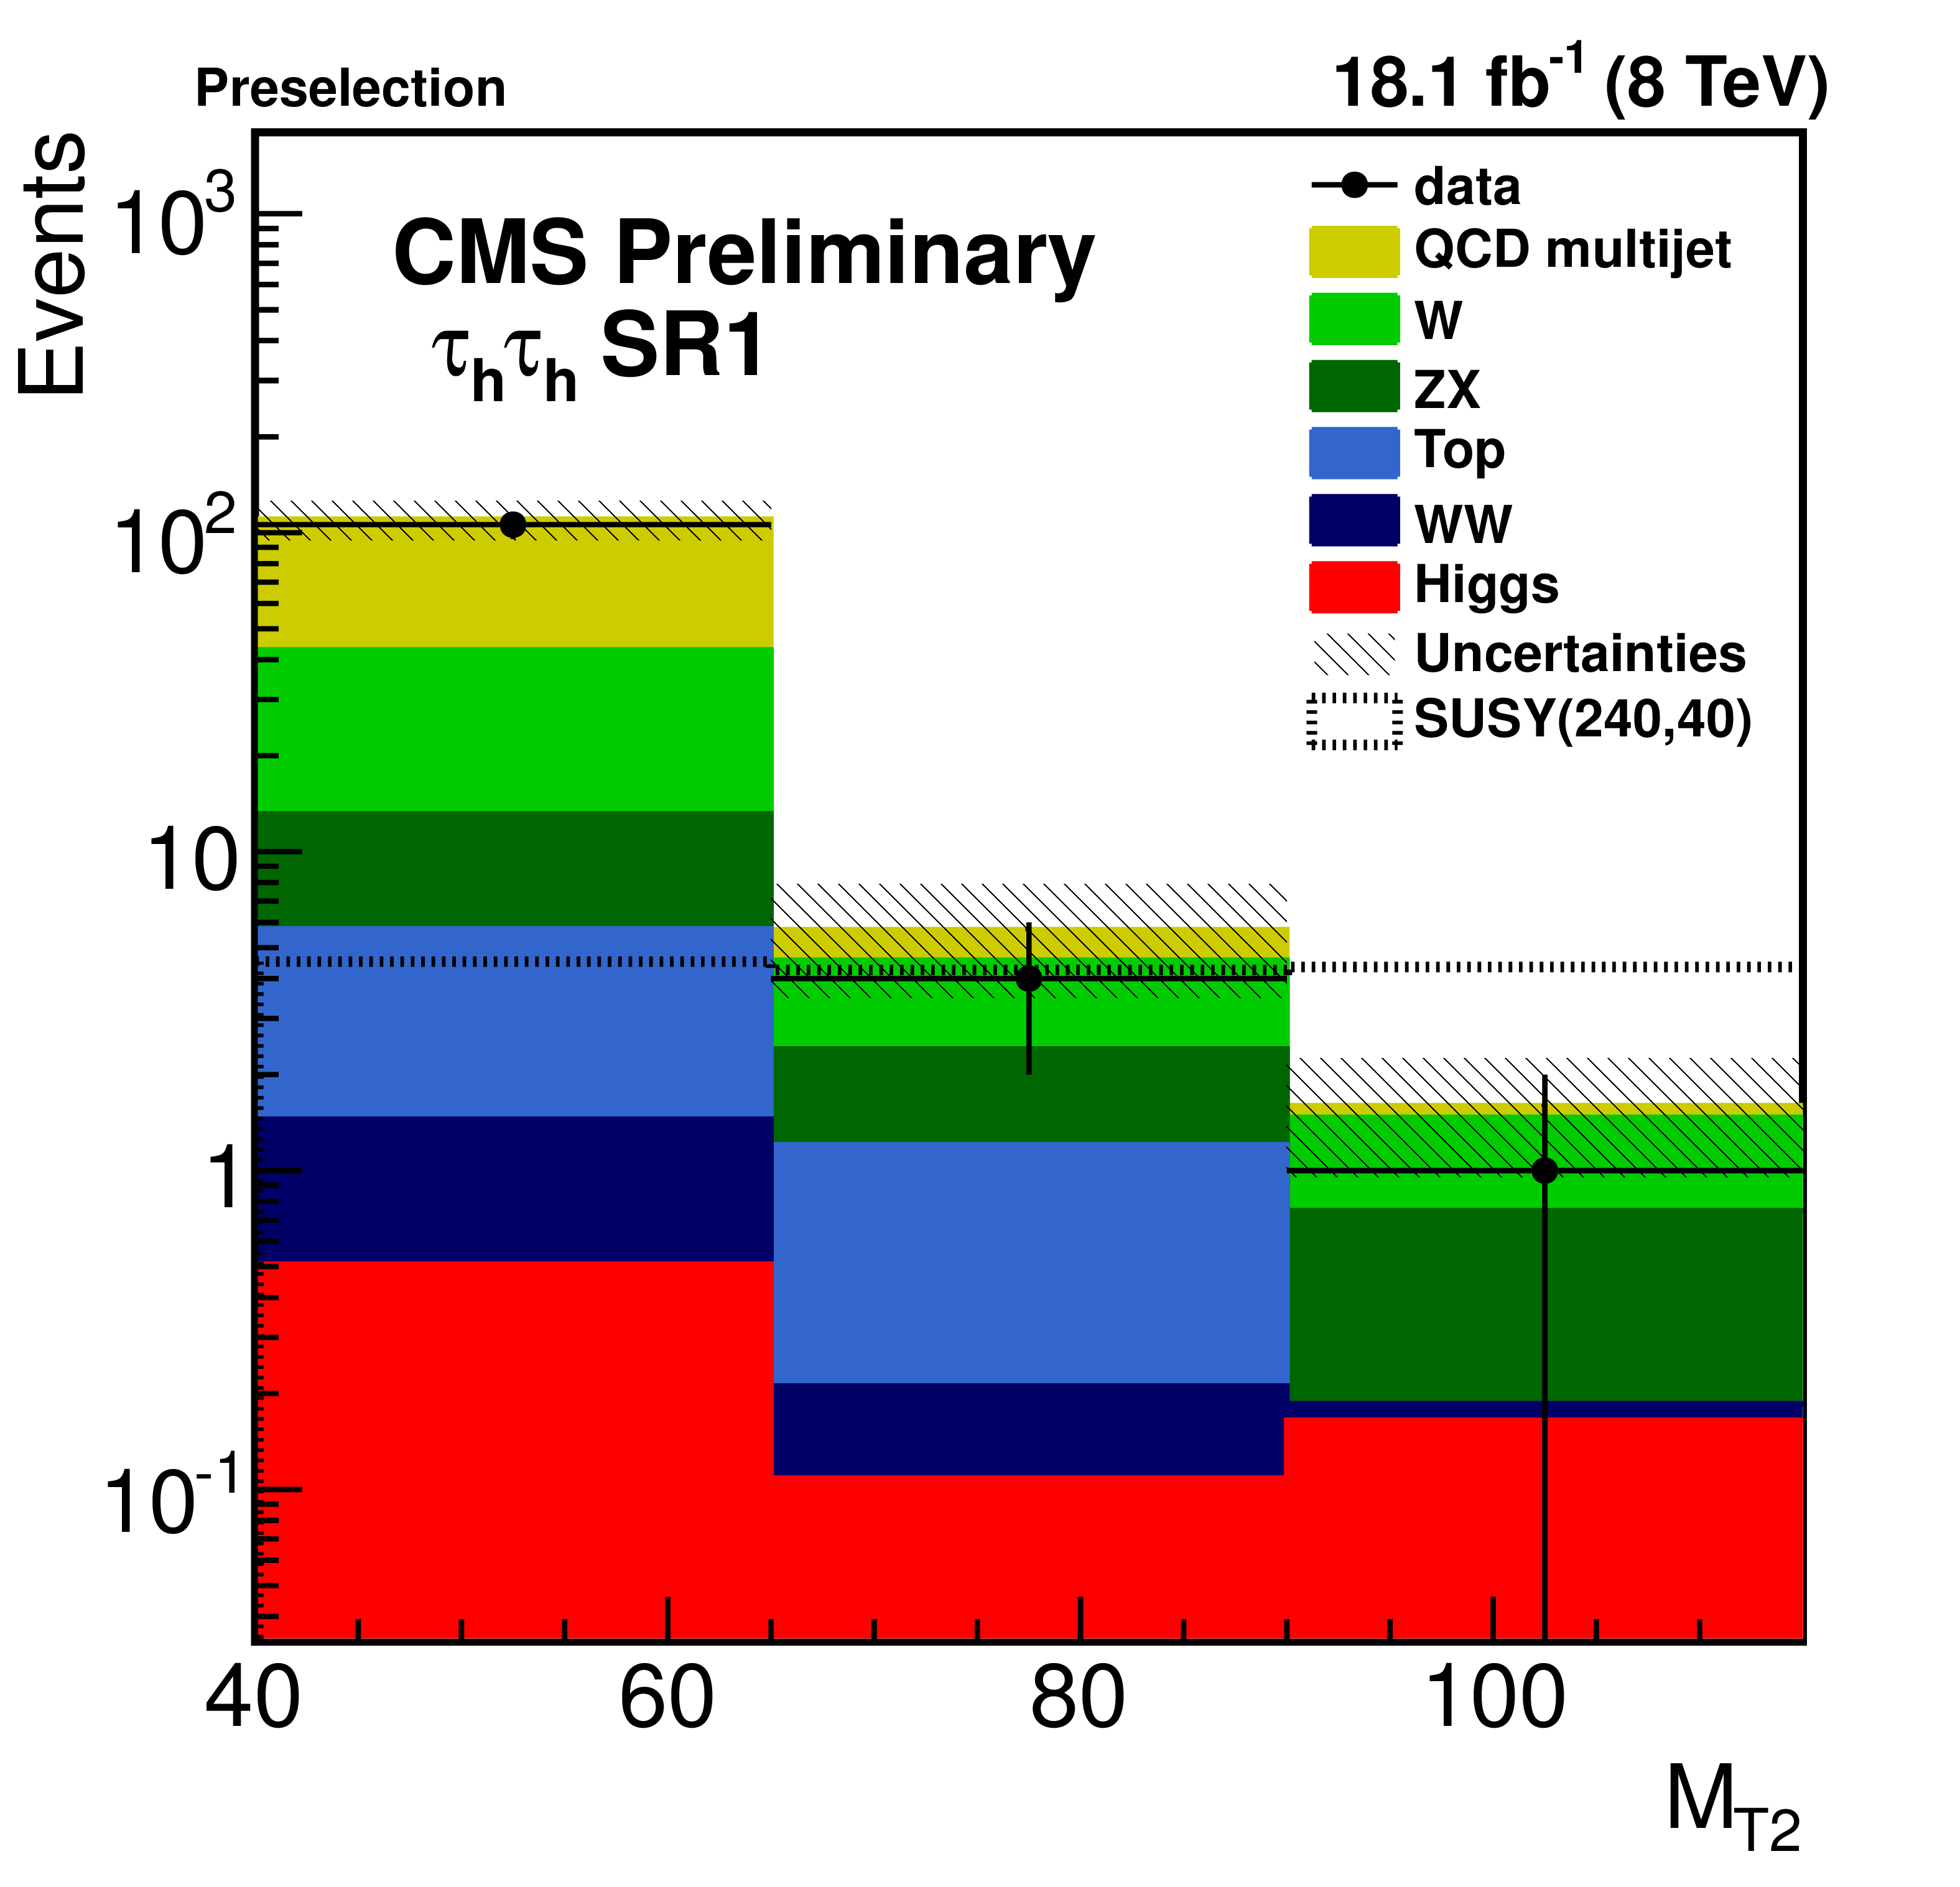
Figure 4-a:
The data yield is compared with the SM expectation. In different signal regions, when a data driven background is available, it is used instead of the pure simulation. For more details read the text. |
png pdf |
Figure 4-b:
The data yield is compared with the SM expectation. In different signal regions, when a data driven background is available, it is used instead of the pure simulation. For more details read the text. |
png pdf |
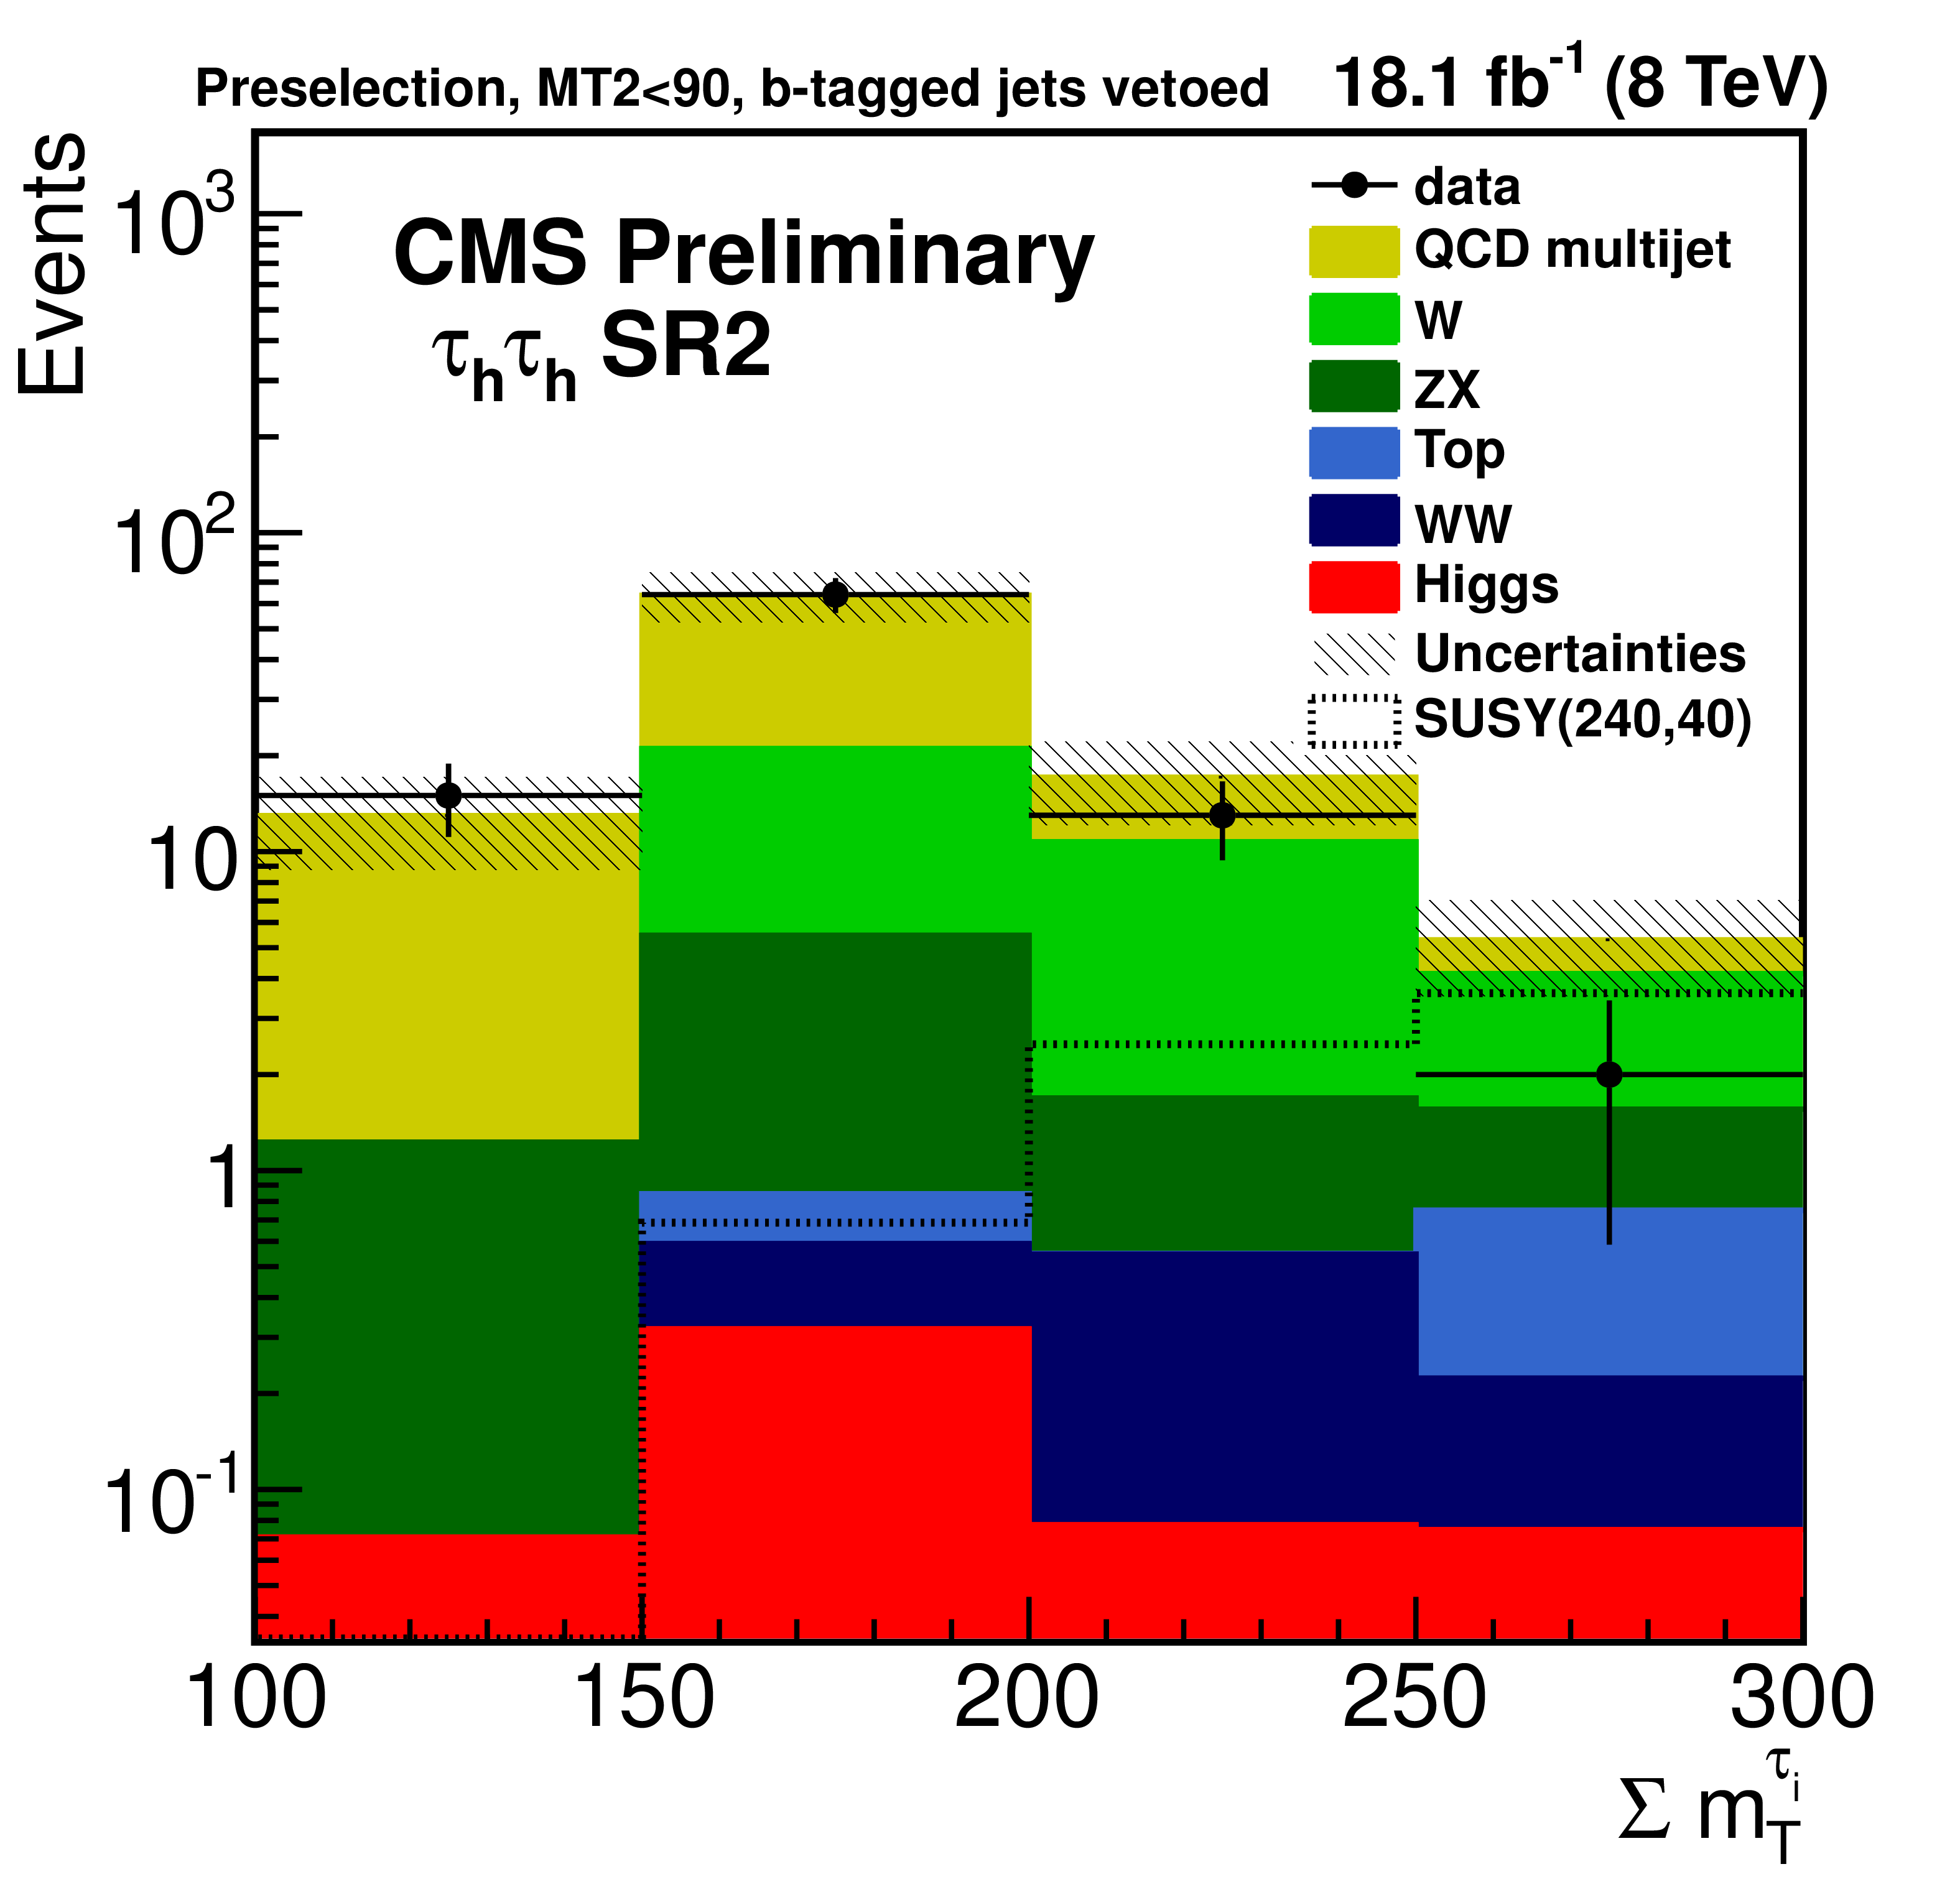
Figure 4-c:
The data yield is compared with the SM expectation. In different signal regions, when a data driven background is available, it is used instead of the pure simulation. For more details read the text. |
png pdf |
Figure 4-d:
The data yield is compared with the SM expectation. In different signal regions, when a data driven background is available, it is used instead of the pure simulation. For more details read the text. |
png pdf |
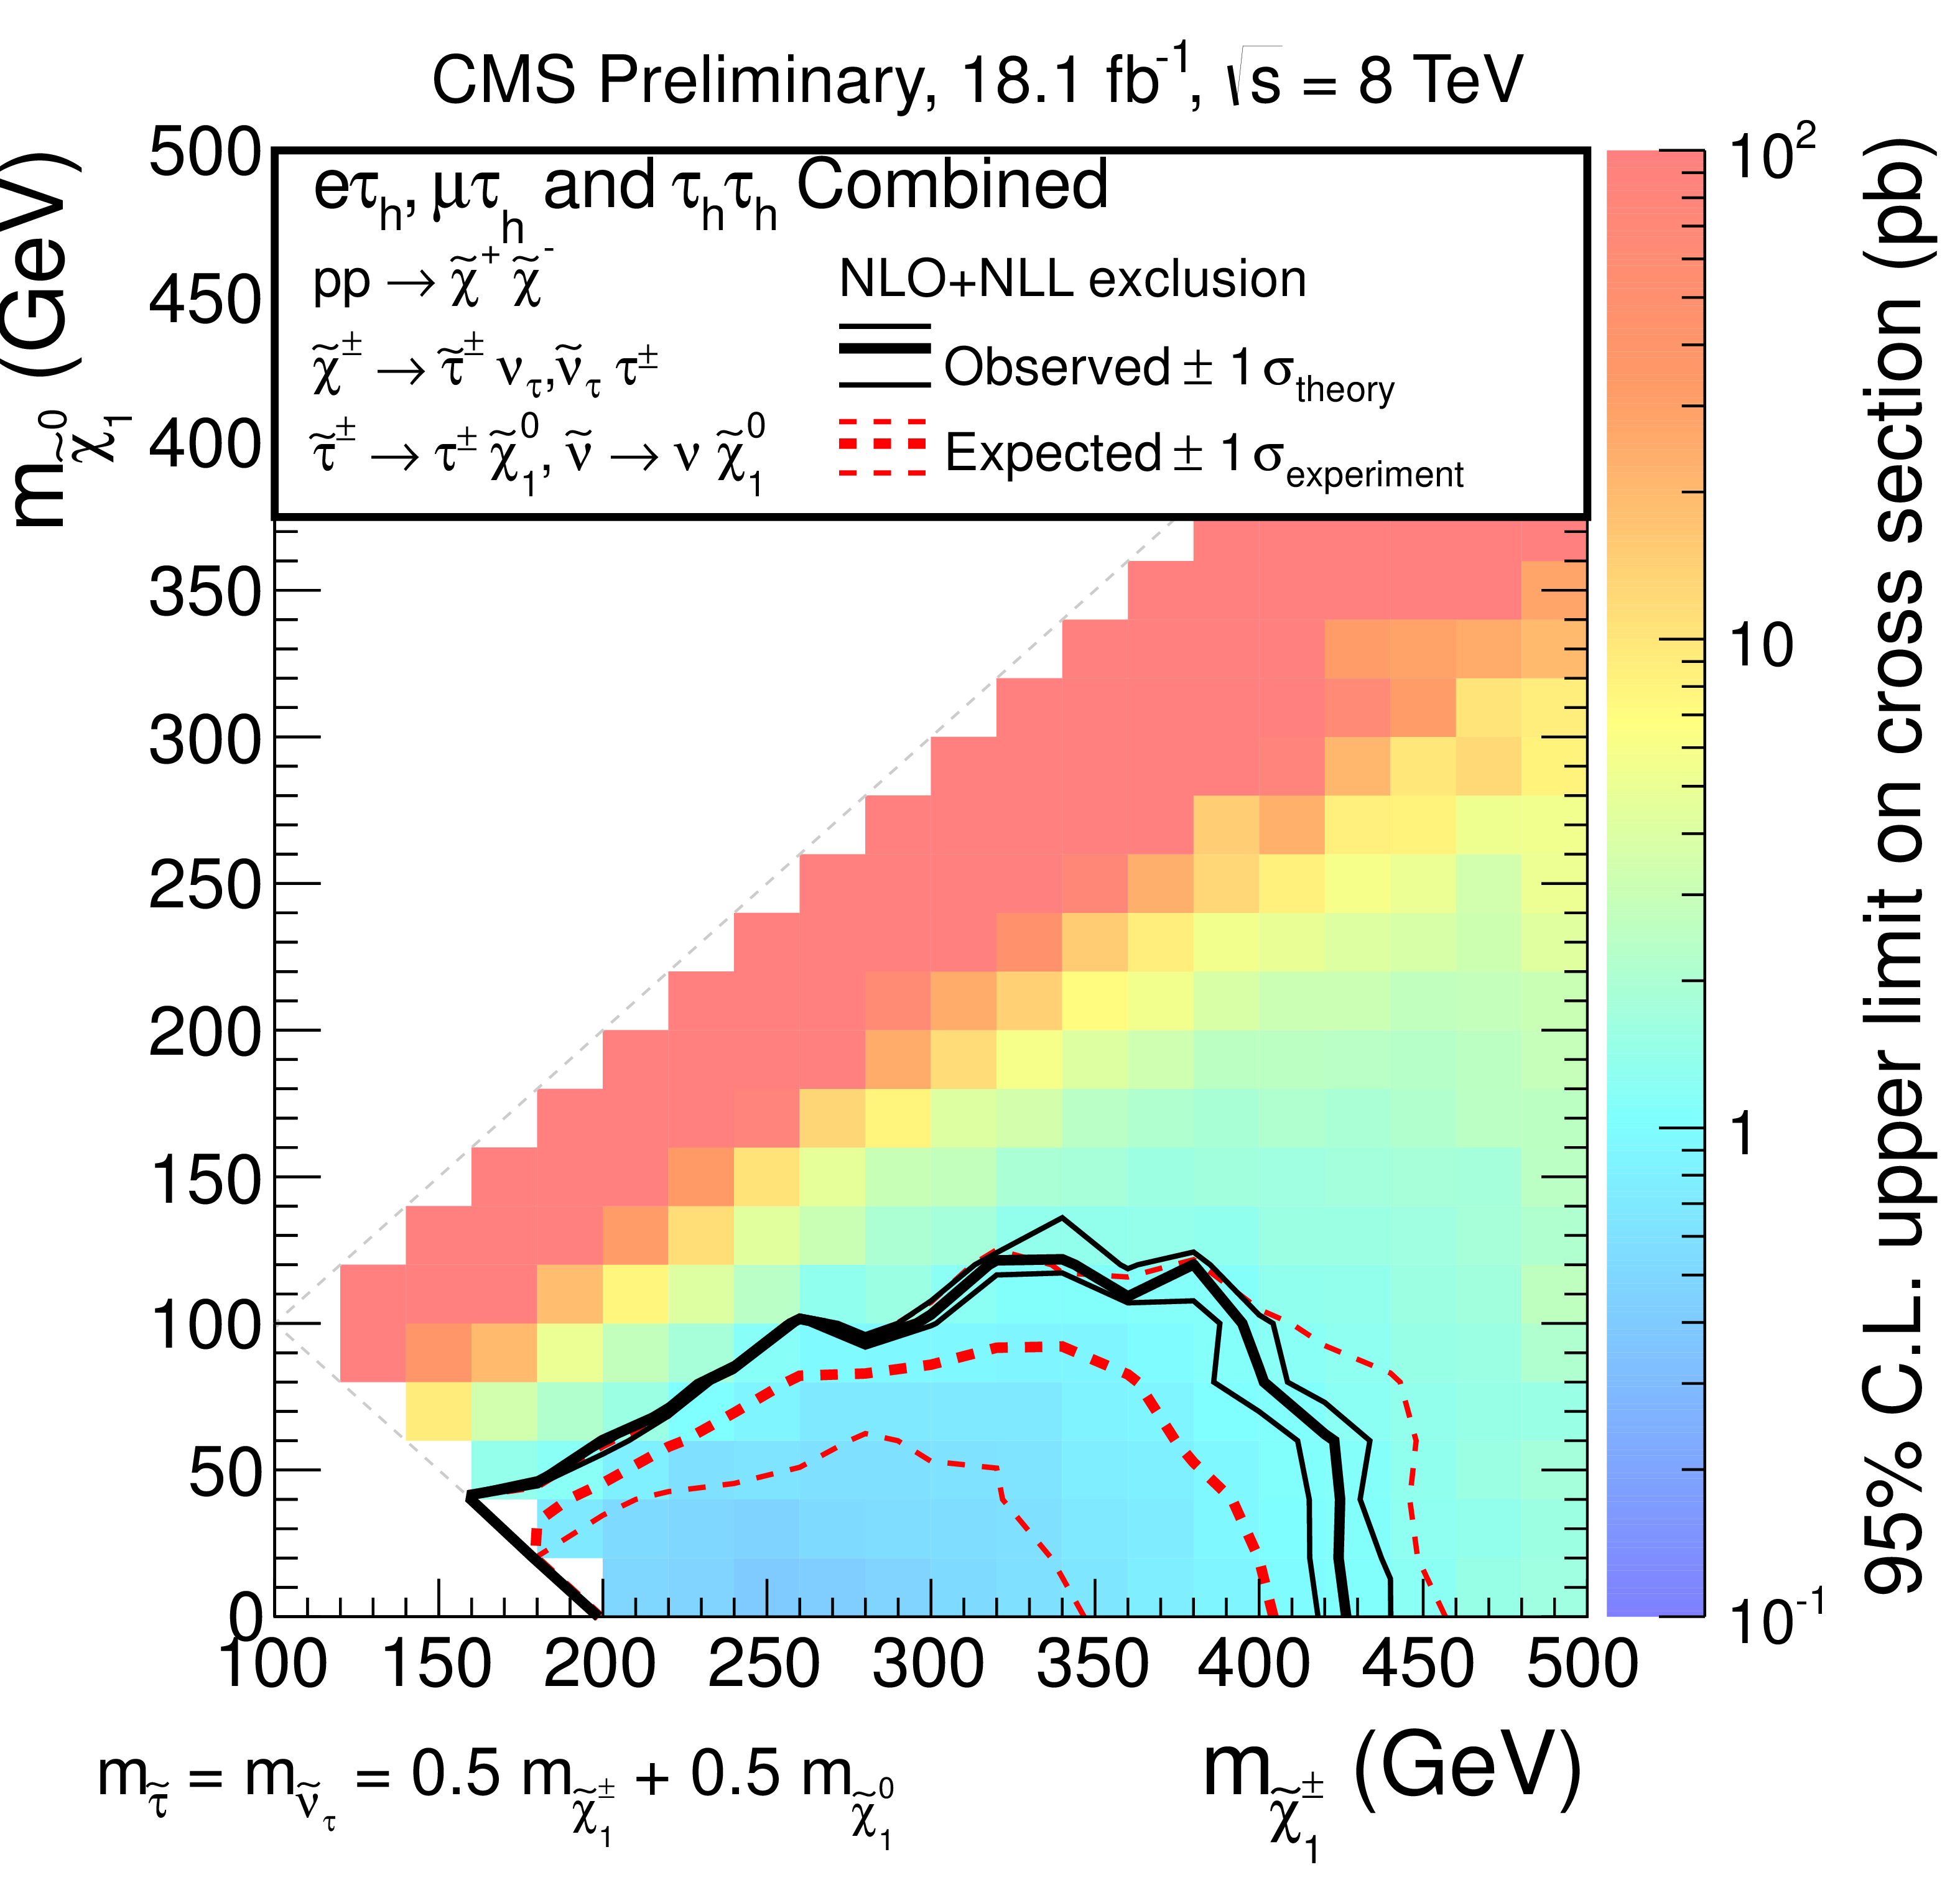
Figure 5:
Expected and observed exclusion regions in terms of Simplified Models of chargino pair production with the total dataset of 2012. The bottom-left triangle was excluded by LEP $\tilde{\tau} $ searches. The diagonal line denotes the boundary for $m_{ {\tilde{\chi}^{\pm }_1} } = m_{\tau } + m_{ \tilde{\chi }^{0}_1 }$. The $\pm $1 standard deviations of the expected (observed) exclusions introduced by the experimental (theoretical) uncertainties are also shown. |
png pdf |
Figure 6:
Expected and observed exclusion regions in terms of Simplified Models in $ { {\tau _{\rm h}} {\tau _{\rm h}} } $ channel. The conventions are same as Fig. 5. |
png pdf |
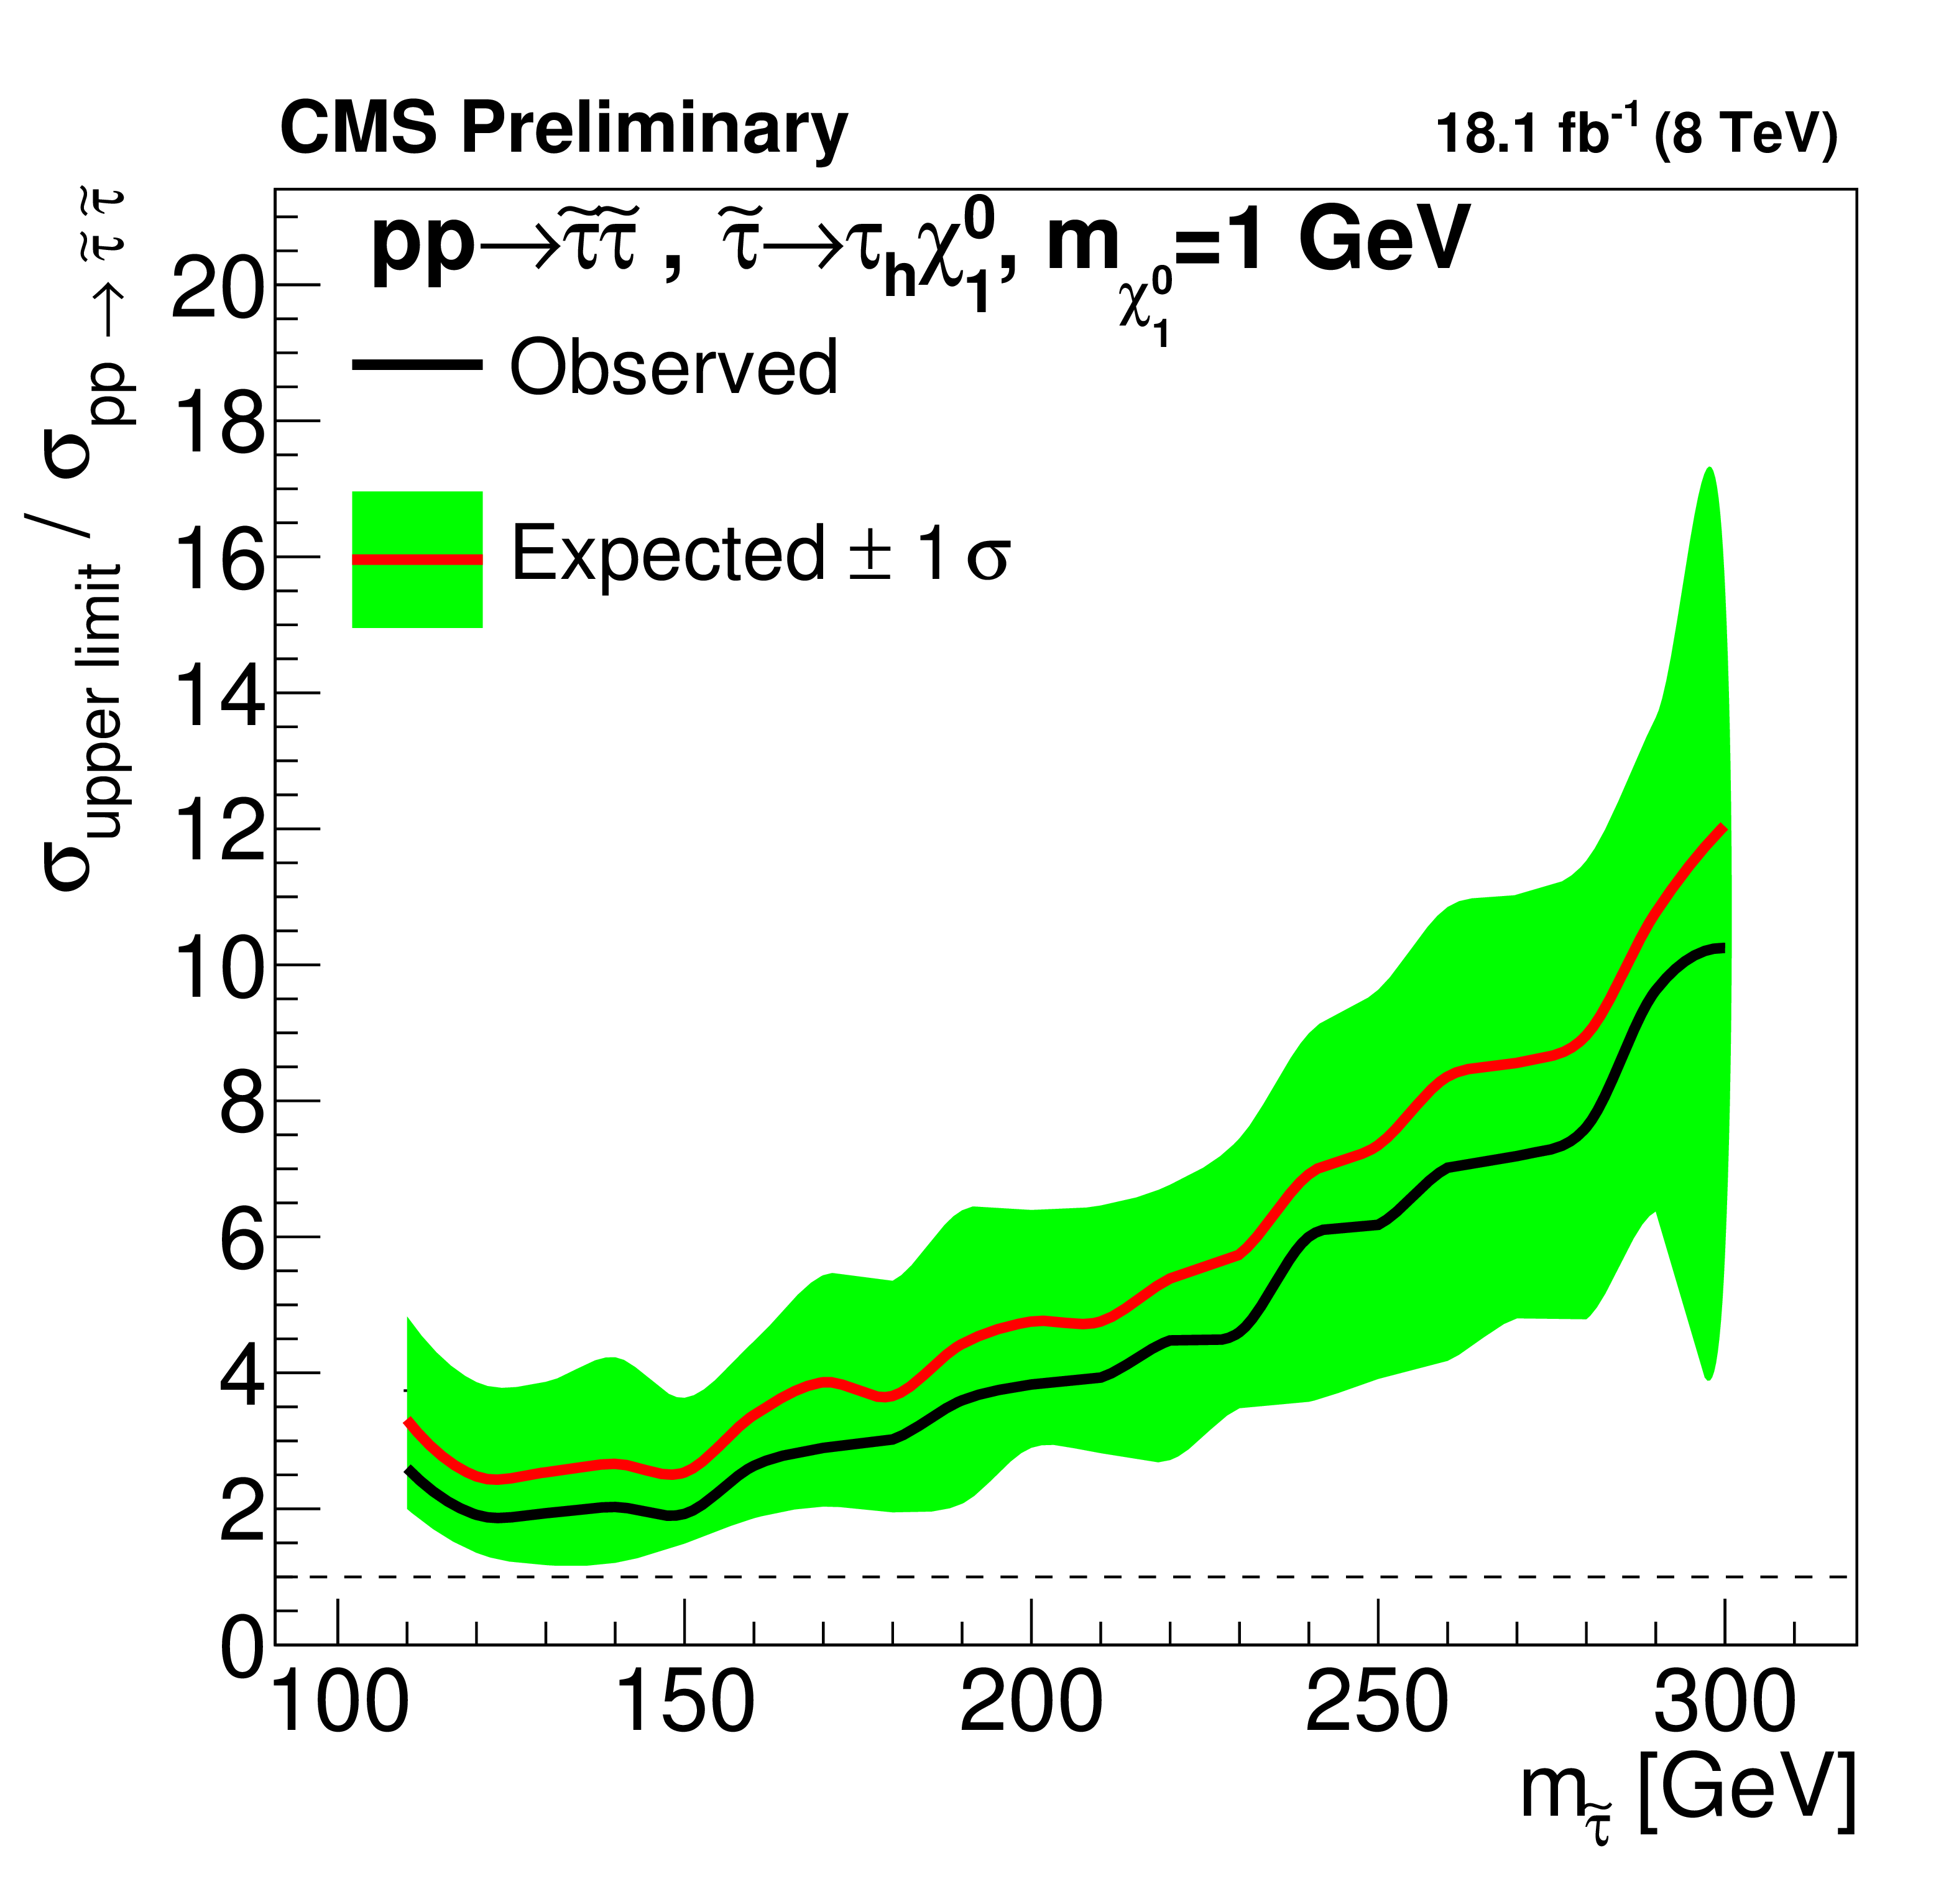
Figure 7:
Upper limits on $\tilde{\tau} \tilde{\tau} $ production cross section in $ { {\tau _{\rm h}} {\tau _{\rm h}} } $ channel. The mass of $\tilde{\chi}^0_1 $ is 1 GeV. |
| Tables | |
png pdf |
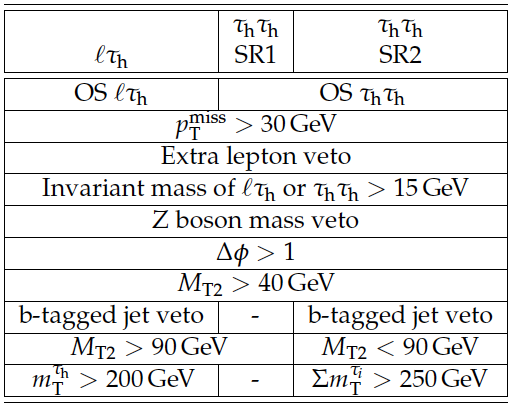
Table 1:
Definition of different signal regions. OS stands for opposite-sign pairs. |

png pdf |
Table 2:
The estimated QCD multijet background event yields in the $ { {\tau _{\rm h}} {\tau _{\rm h}} } $ channel. The first two uncertainties are statistical and systematic uncertainties of the method, the last uncertainty is the extra systematic uncertainty due to correlation assumptions. |
png pdf |
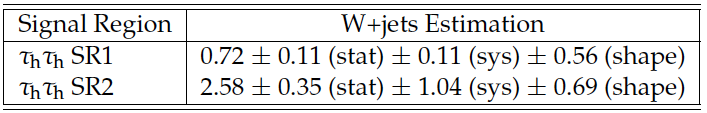
Table 3:
The W+jets estimation results in both search regions. The systematic uncertainty ``sys'' comes from the maximum variation of the estimation found from varying the $ {\tau _{\rm h}} $ energy scale within its uncertainty. The ``shape'' takes into account the difference between the shape of the search variable distribution in data and simulation. |
png pdf |
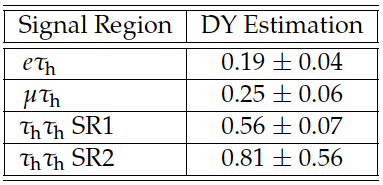
Table 4:
DY background yield expected in four signal regions. Only the statistical uncertainties are reported. |

png pdf |
Table 5:
Estimation of the misidentified $ {\tau _{\rm h}} $ contribution in the signal region of the $ {\ell {\tau _{\rm h}} } $ channels. The total systematic is the quadrature sum of the fractional systematics. All uncertainties are relative. $r_{\rm Fake}$ ($r_{\rm Real}$) is shorthand for fake (real) rate. |
png pdf |
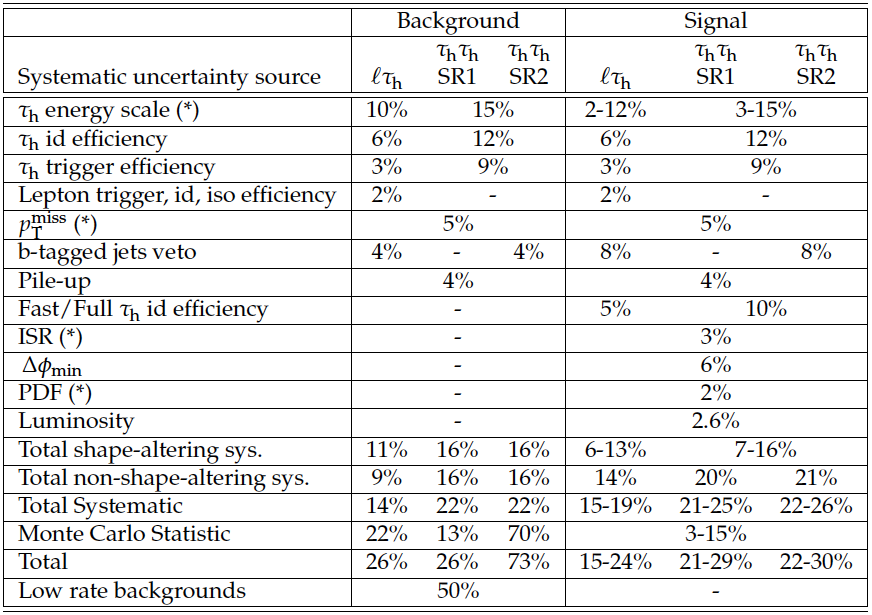
Table 6:
Summary of systematic uncertainties that affect the signal event selection efficiency and the background normalization and their shape. The sources that alter the shape are indicated by (*) next to their names. The shape-altering sources are considered correlated between two signal regions of $ { {\tau _{\rm h}} {\tau _{\rm h}} } $ in the final statistical combination. |
png pdf |
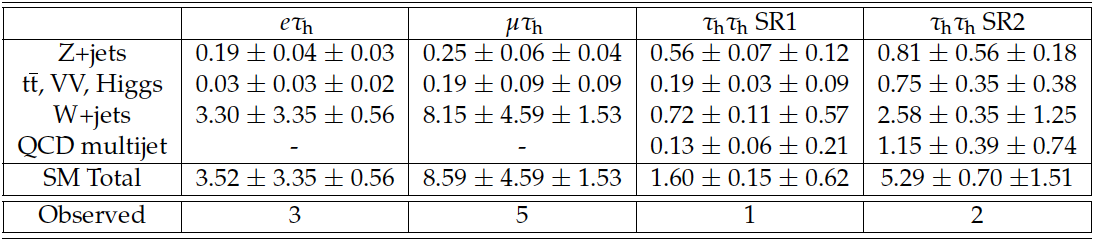
Table 7:
Data yields and background predictions with uncertainties in the four signal regions of the search. The uncertainties are reported in two parts, which are statistics and systematic uncertainty, respectively. The main backgrounds (W+jets and QCD multijet) are derived from data as described in Section 7. ``VV'' is a shorthand for diboson events. |
|
|
Compact Muon Solenoid LHC, CERN |
|

|

|

|

|

|