

Compact Muon Solenoid
LHC, CERN
| CMS-PAS-SUS-14-003 | ||
| Search for R-parity-violating supersymmetry in proton-proton collisions at $\sqrt{s} =$ 8 TeV in events with large jet and b-jet multiplicity | ||
| CMS Collaboration | ||
| September 2015 | ||
| Abstract: Preliminary results are reported from a search for new physics beyond the standard model (SM) in proton-proton collisions at a center-of-mass energy $ \sqrt{s}= $ 8 TeV, focusing on the signature of large multiplicity of jets and b-tagged jets. The data sample comprises an integrated luminosity of 19.5 fb$^{-1}$ recorded by the CMS experiment at the Large Hadron Collider (LHC). The results are used to exclude gluinos with $m_{\rm gluino} <$ 980 GeV in an R-parity violating supersymmetric extension of the standard model in which each gluino decays via $ \mathrm{ \widetilde{ g} \to {tbs} } $. | ||
|
Links:
CDS record (PDF) ;
CADI line (restricted) ; Figures are also available from the CDS record. These preliminary results are superseded in this paper, PRD 94 (2016) 112009. The superseded preliminary plots can be found here. |
||
| Figures | |
png ; pdf |
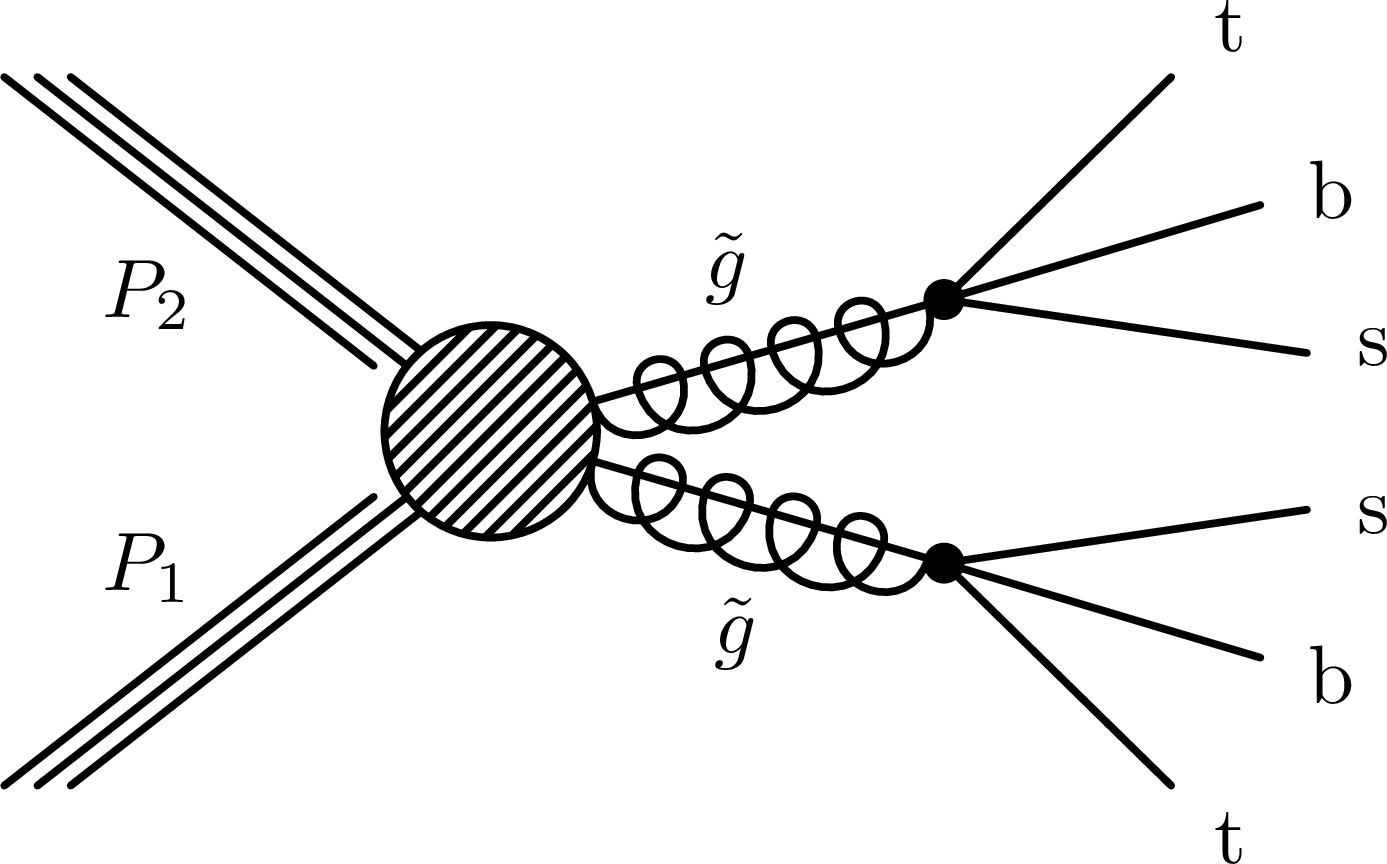
Figure 1:
Feynman diagram for pair production of gluinos decaying to $ {\mathrm {t}} {\mathrm {b}} {\mathrm {s}}$. |
png ; pdf |
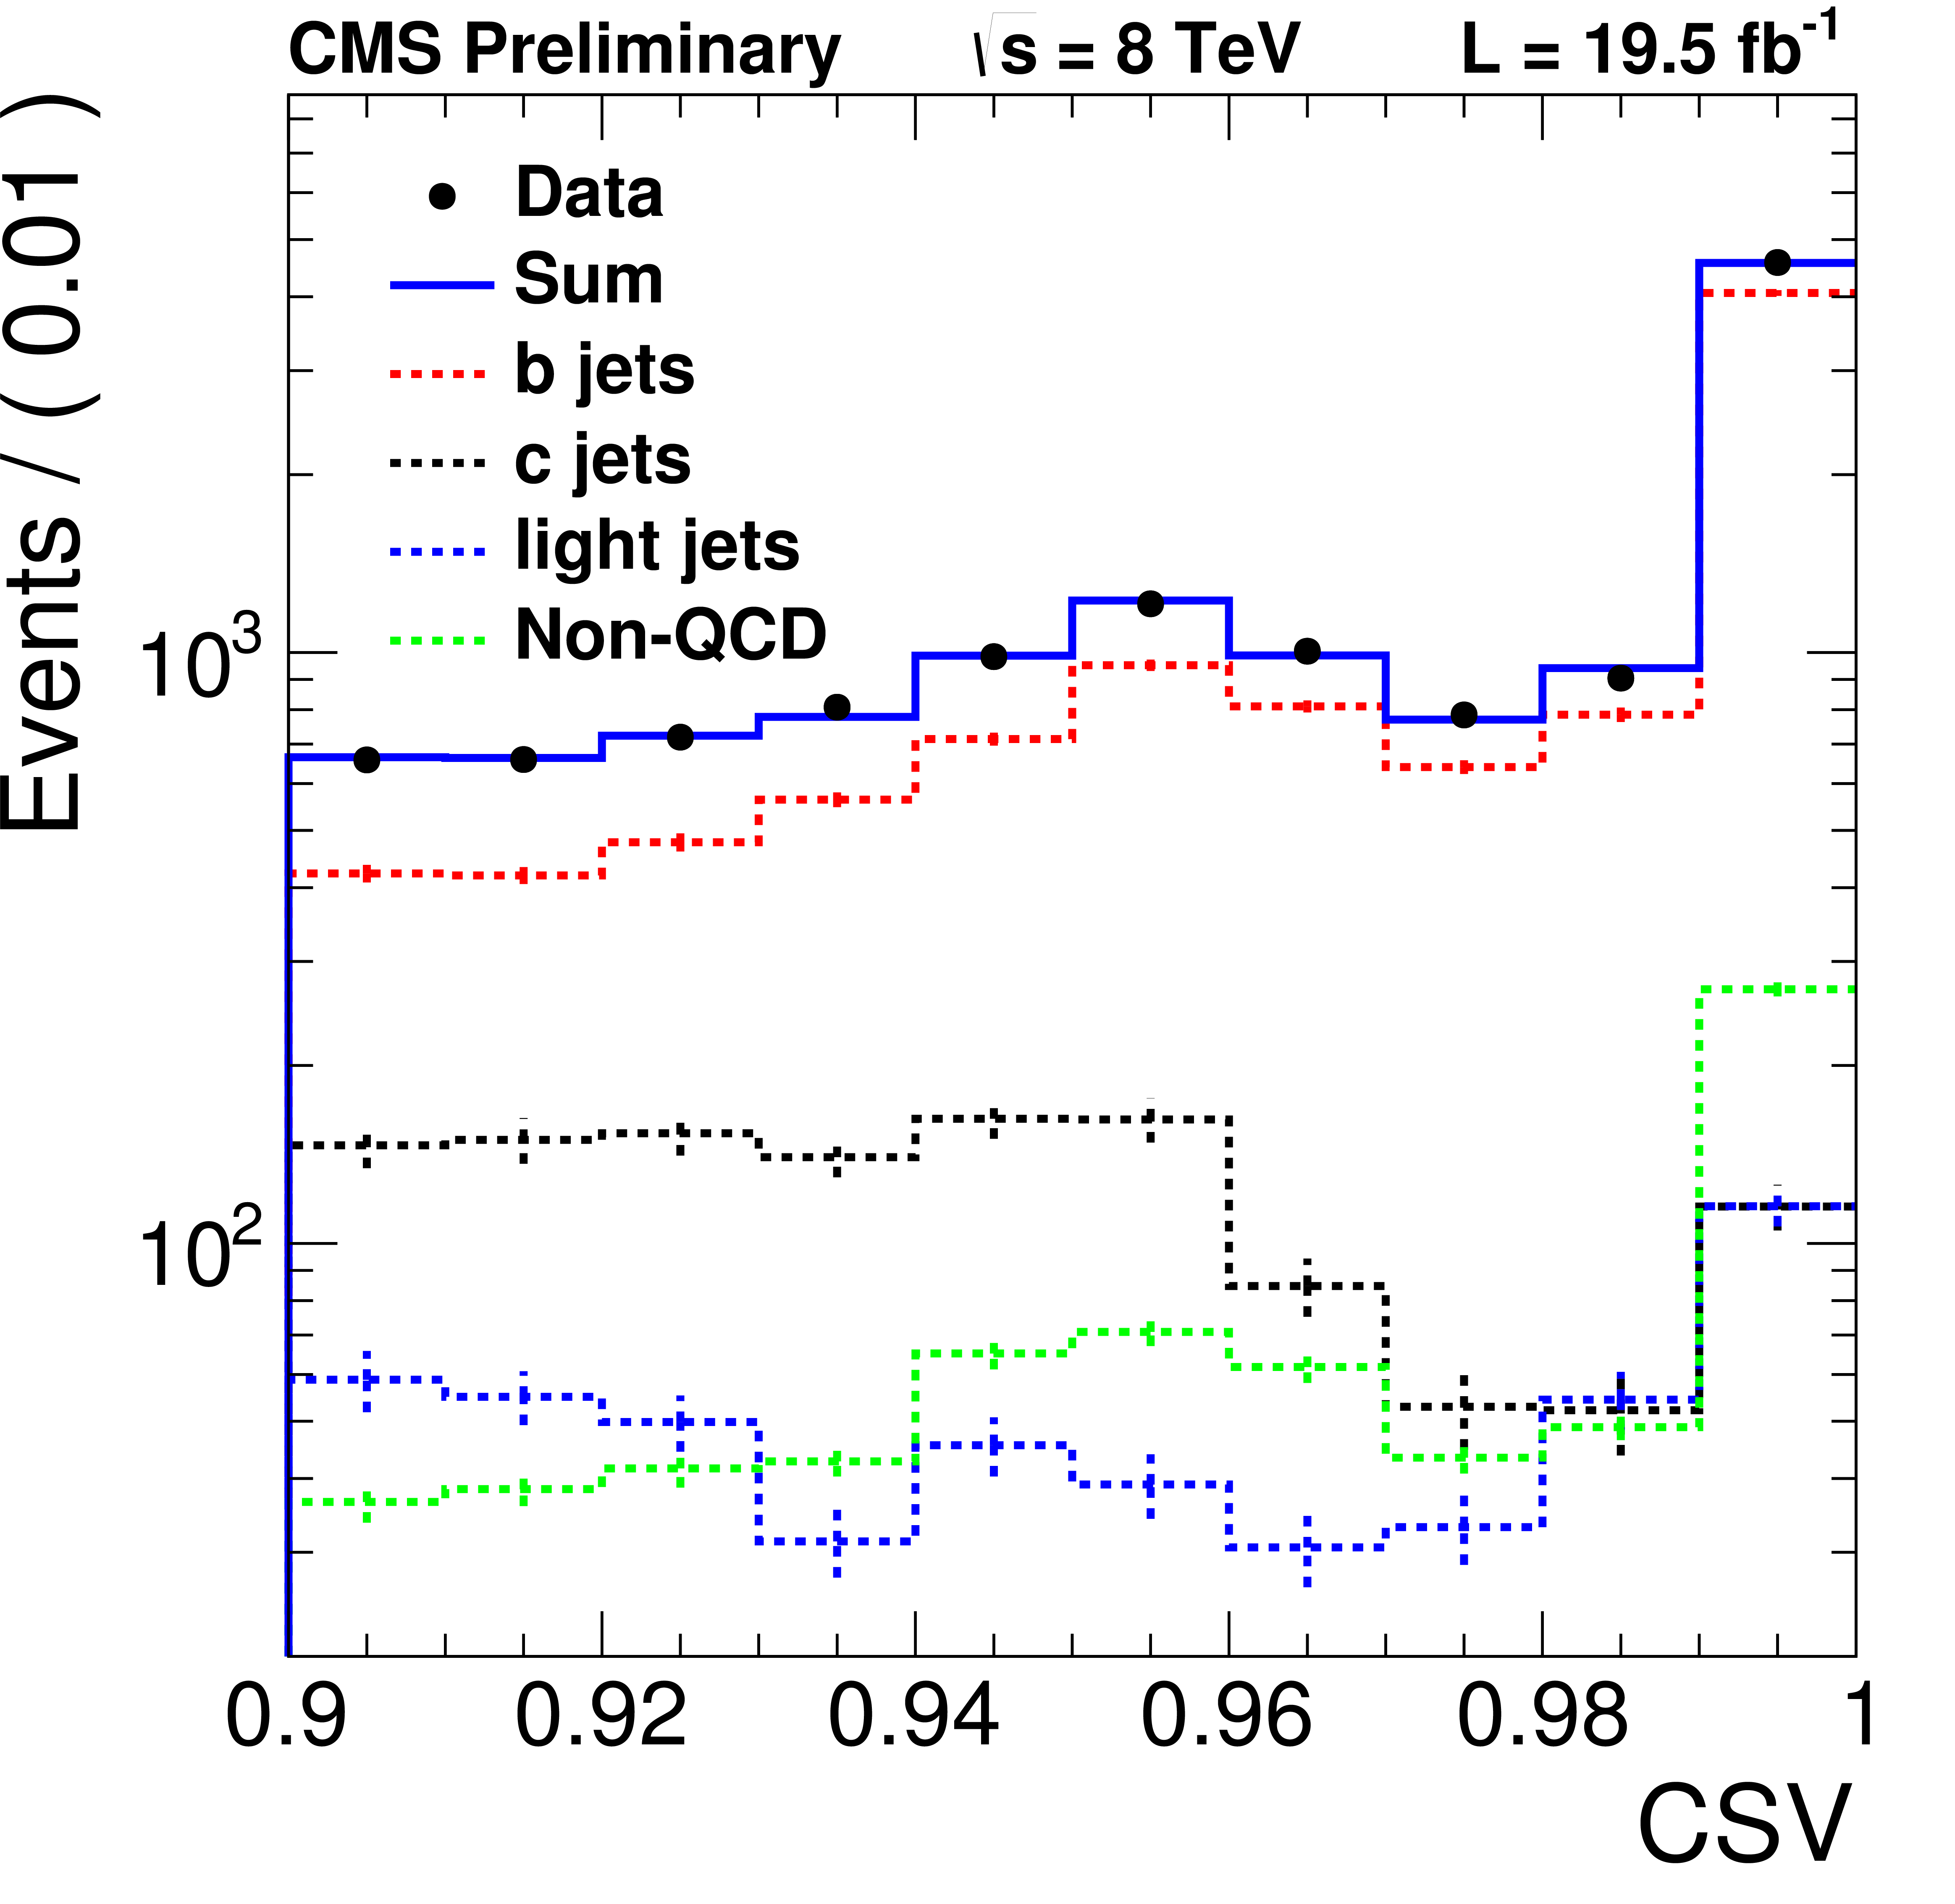
Figure 2:
Fit to the CSV distribution in data for 4 $ \le N_{\rm jet}\le $ 5, $H_{T}>$ 1.1 TeV and ${\rm CSV}>$ 0.9. Error bars indicate the statistical uncertainty arising from MC statistics. |
png ; pdf |
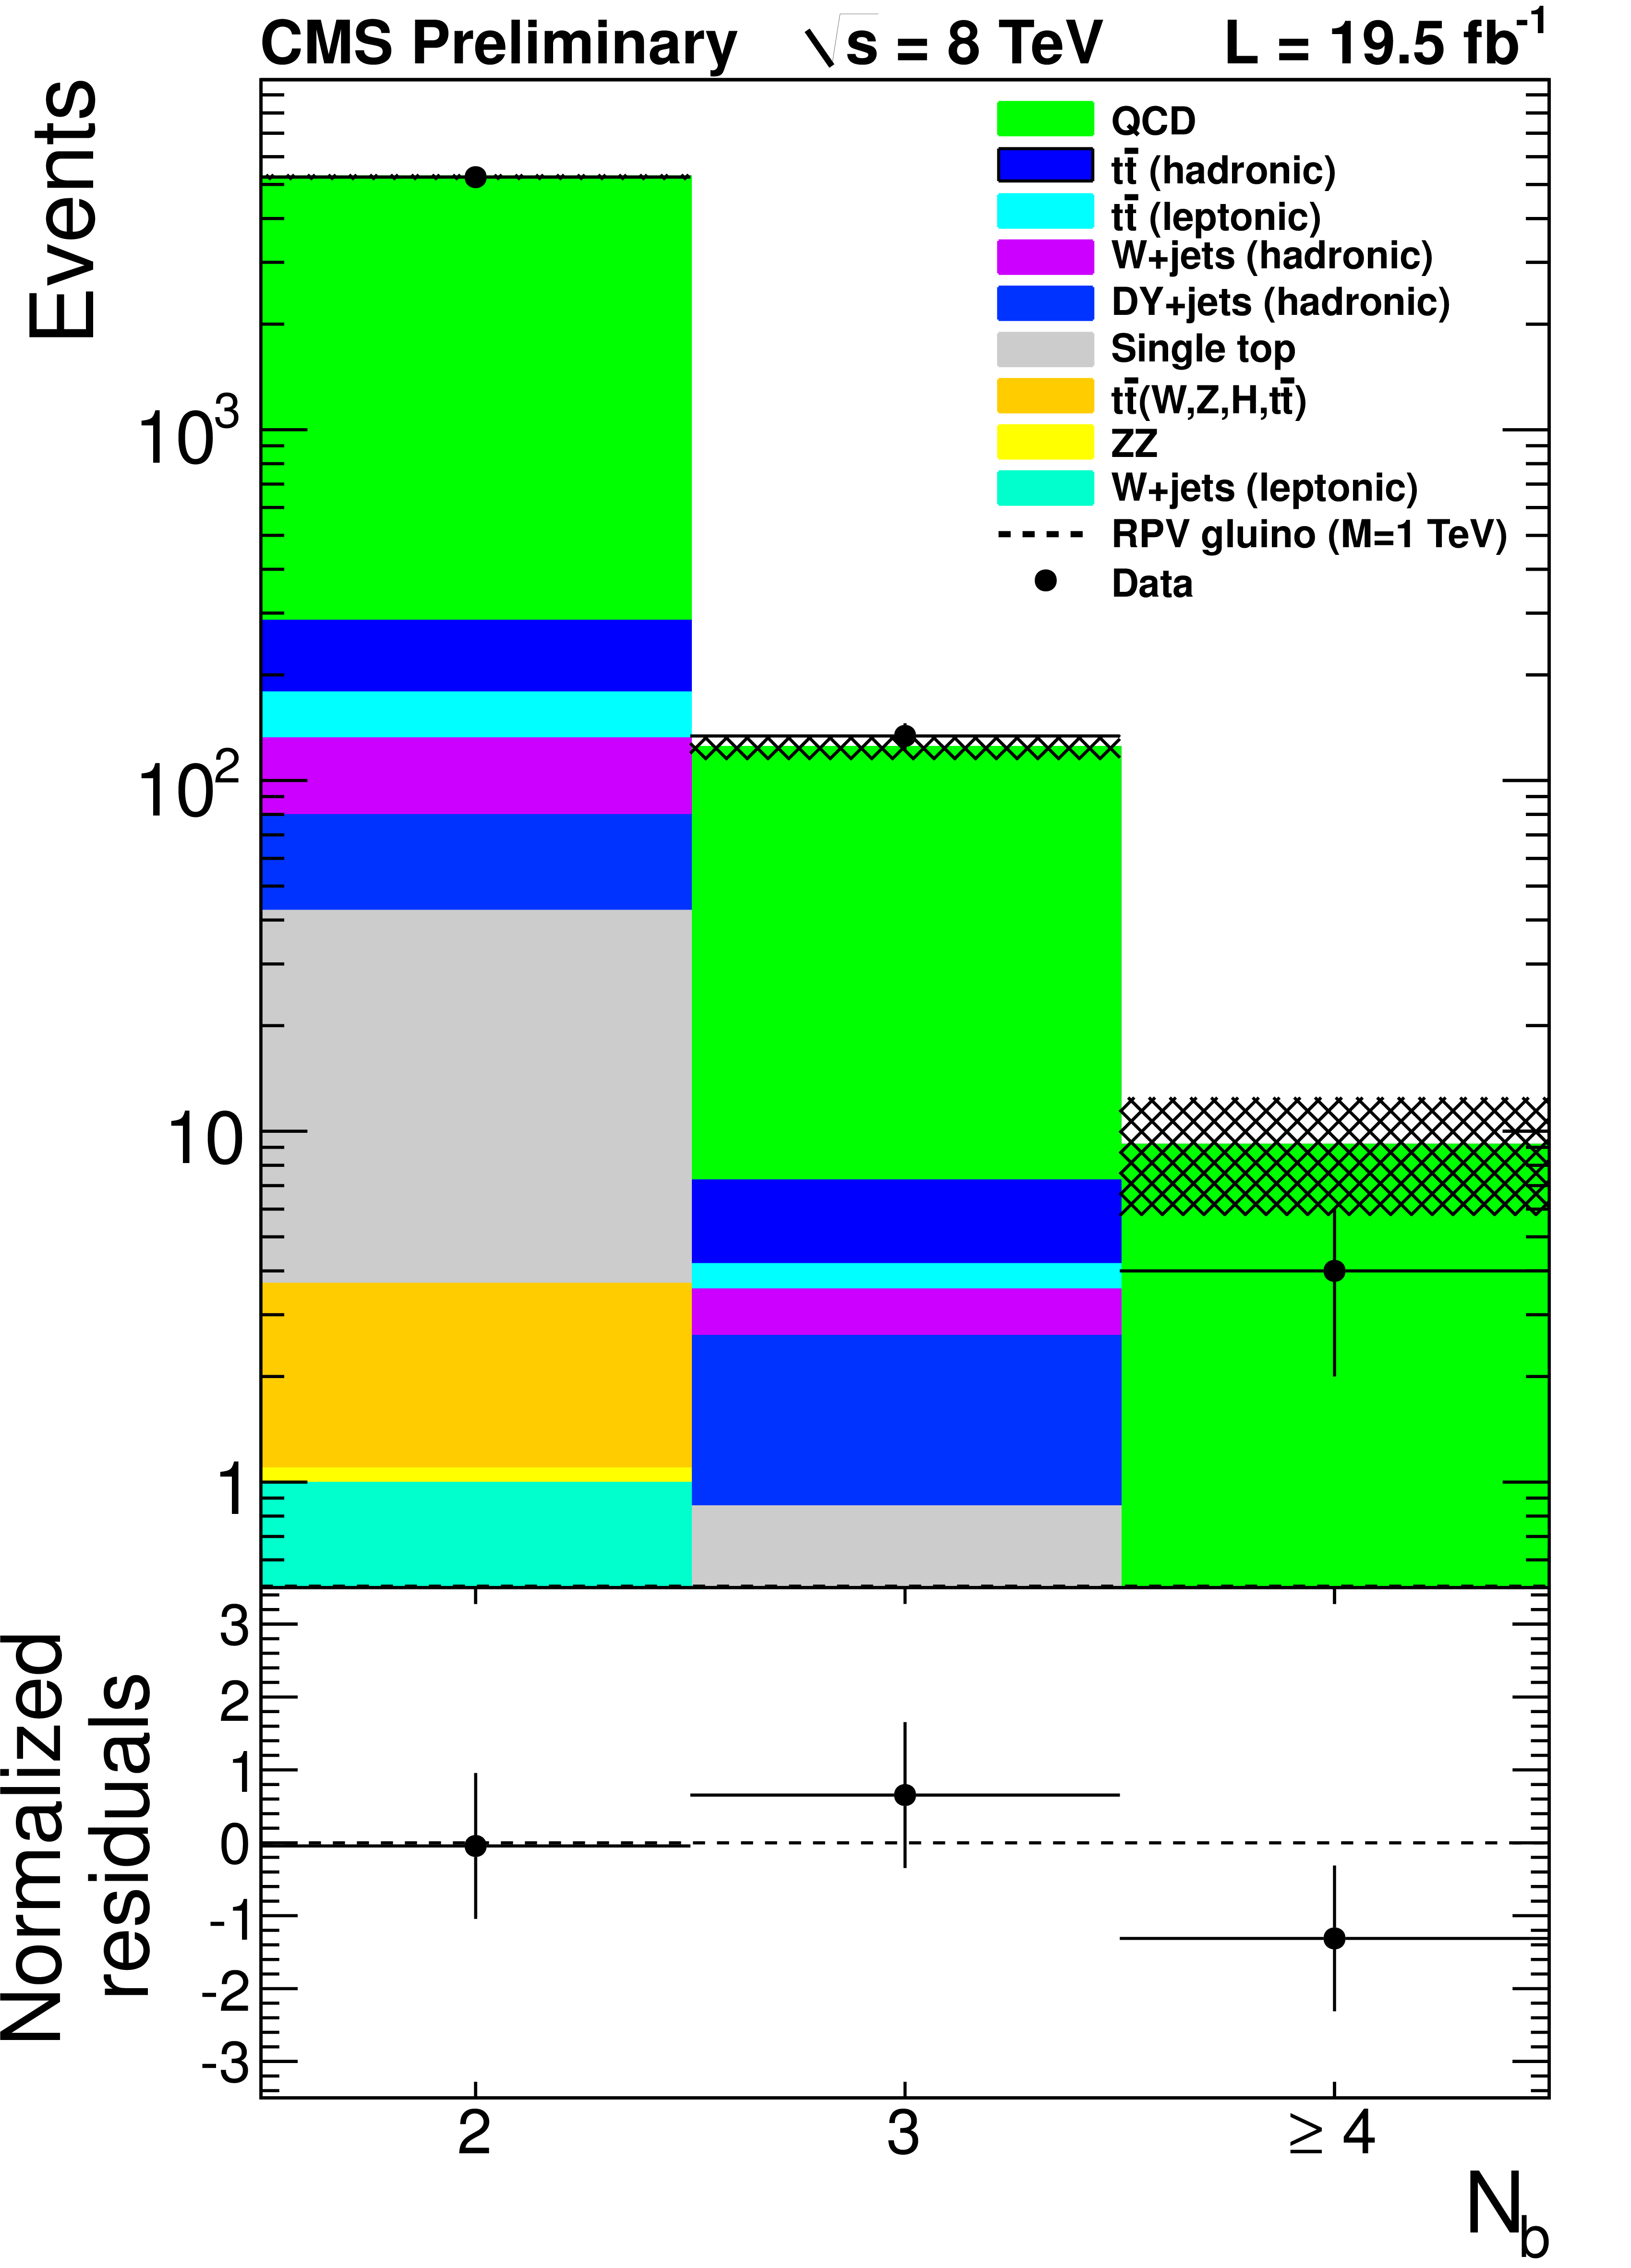
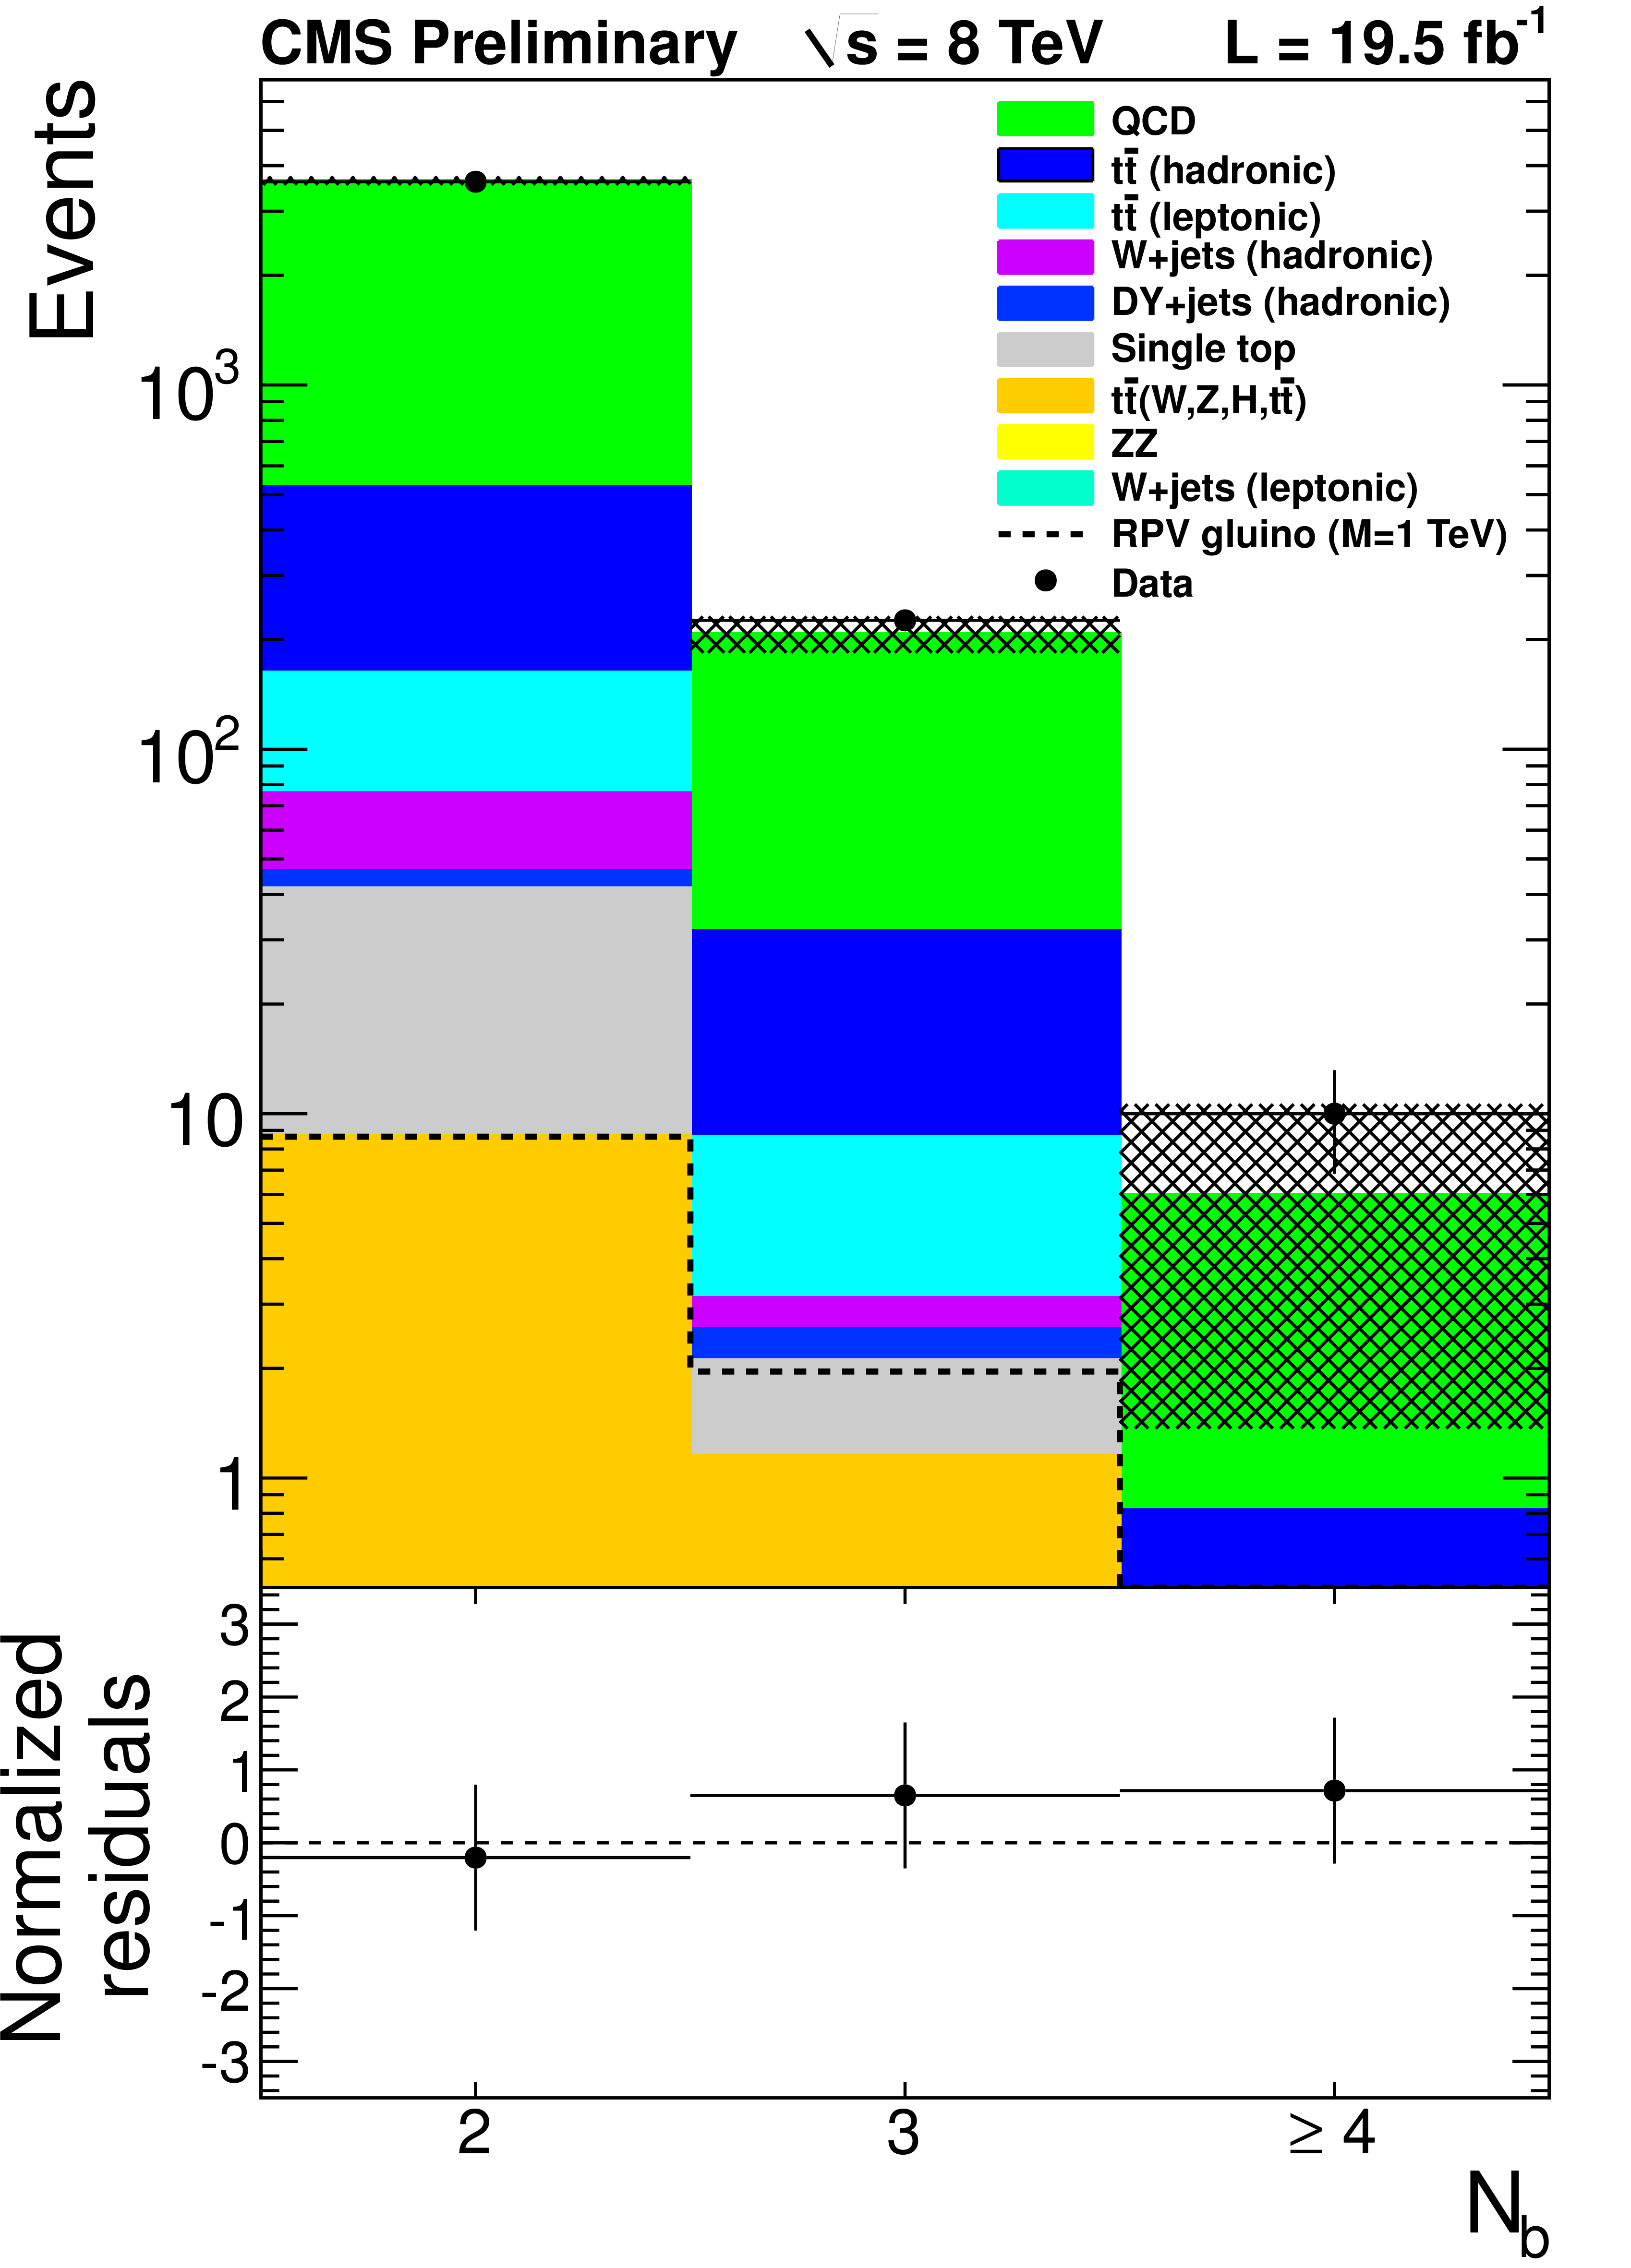
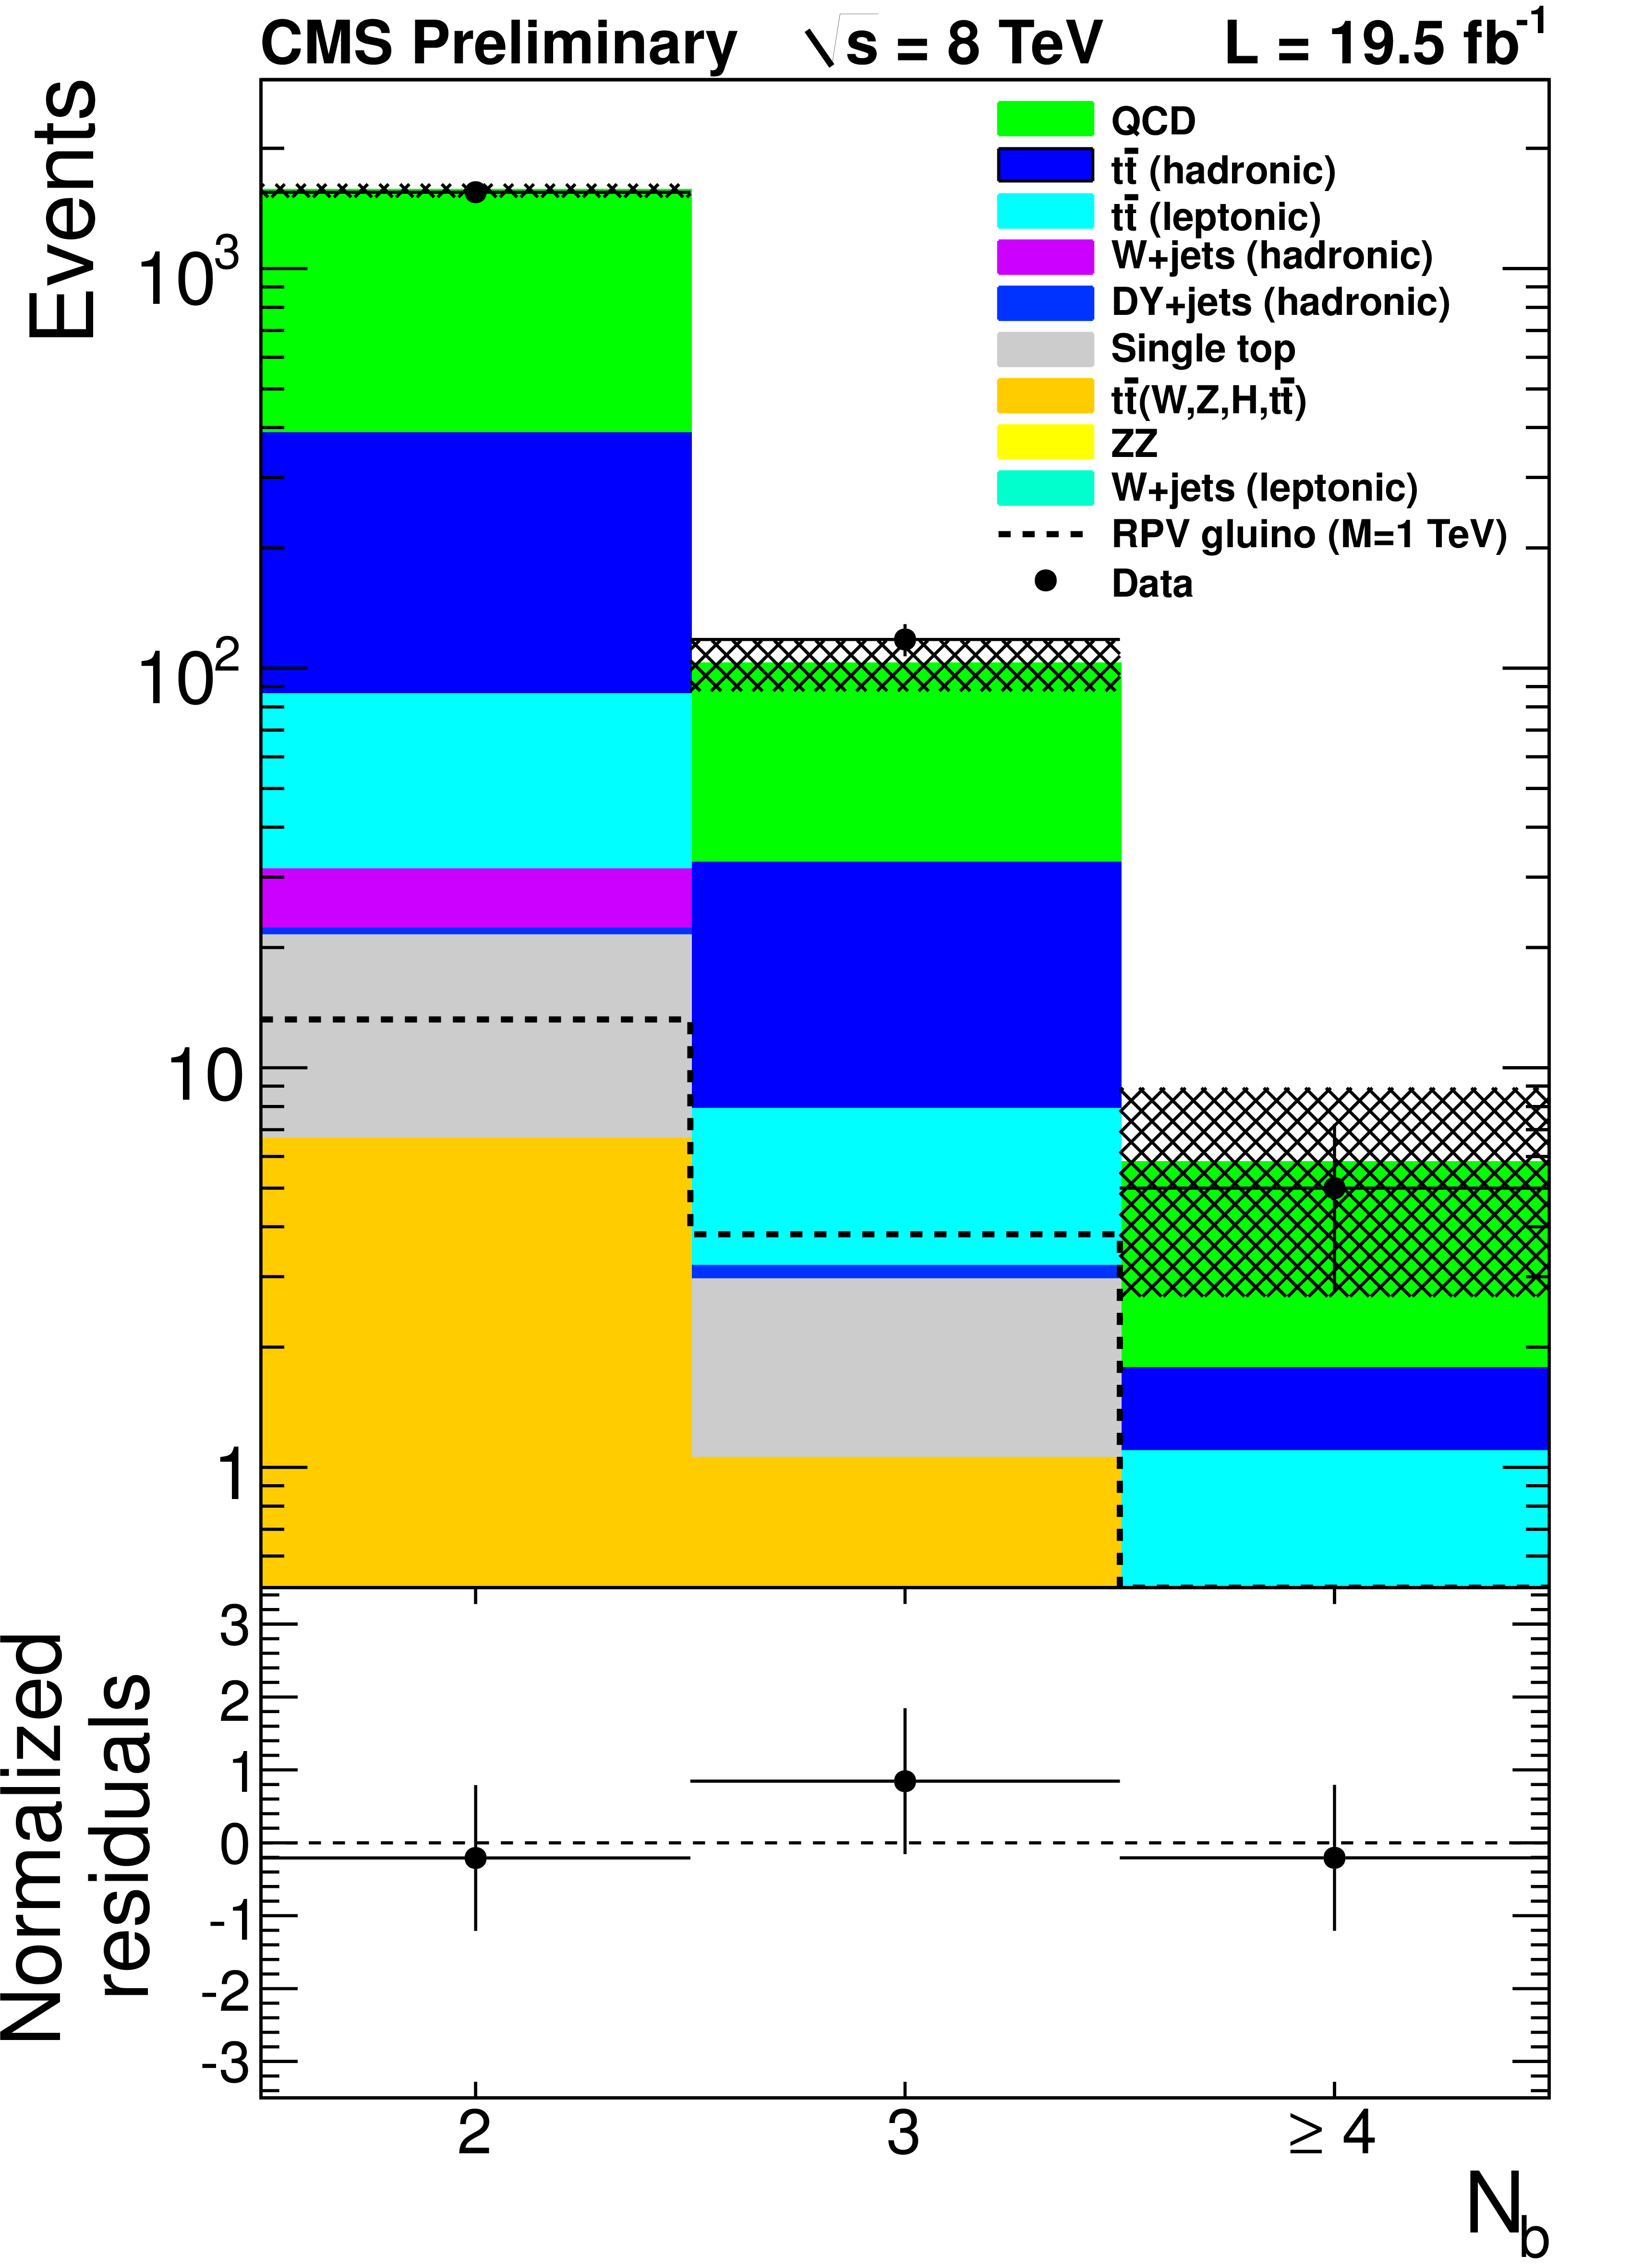
Figure 3-a:
Data (dots with error bars) and the corrected prediction of the $N_{b}$ distribution are shown. The shaded band shows the MC statistical uncertainty. The a,b,c (d,e,t) series of plots shows data in which events are required to have 1000 $ |
png ; pdf |
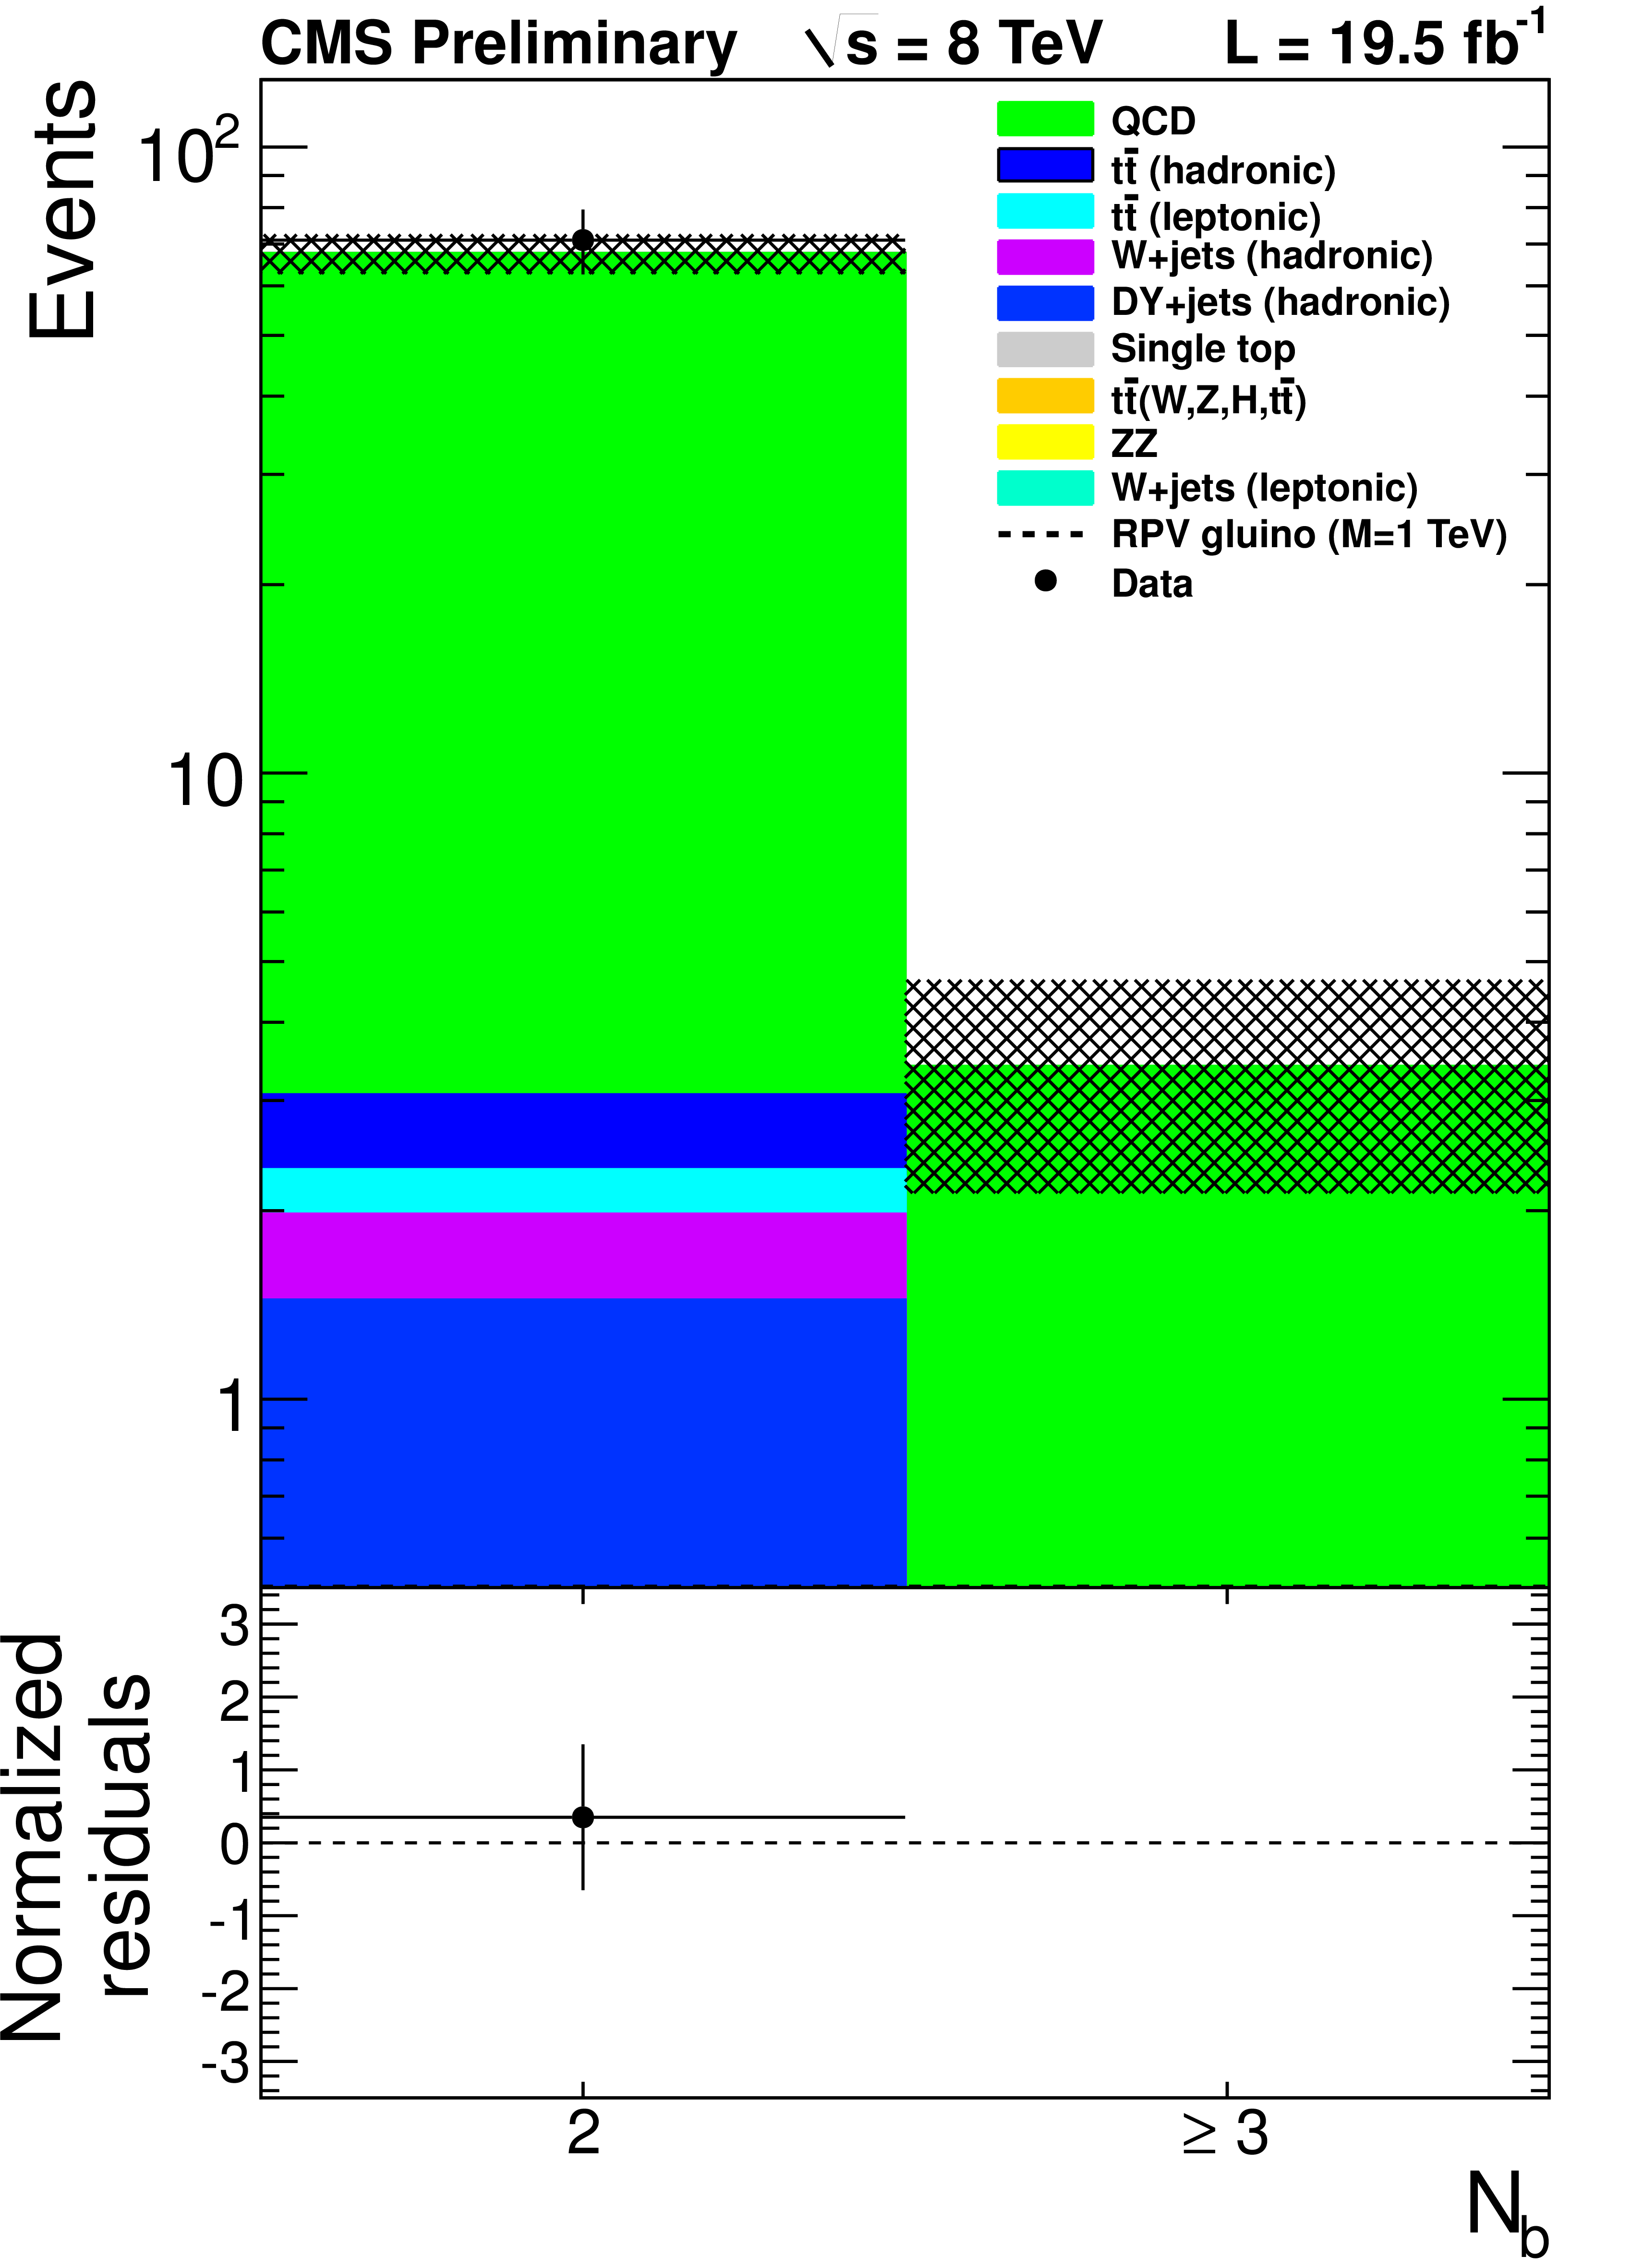
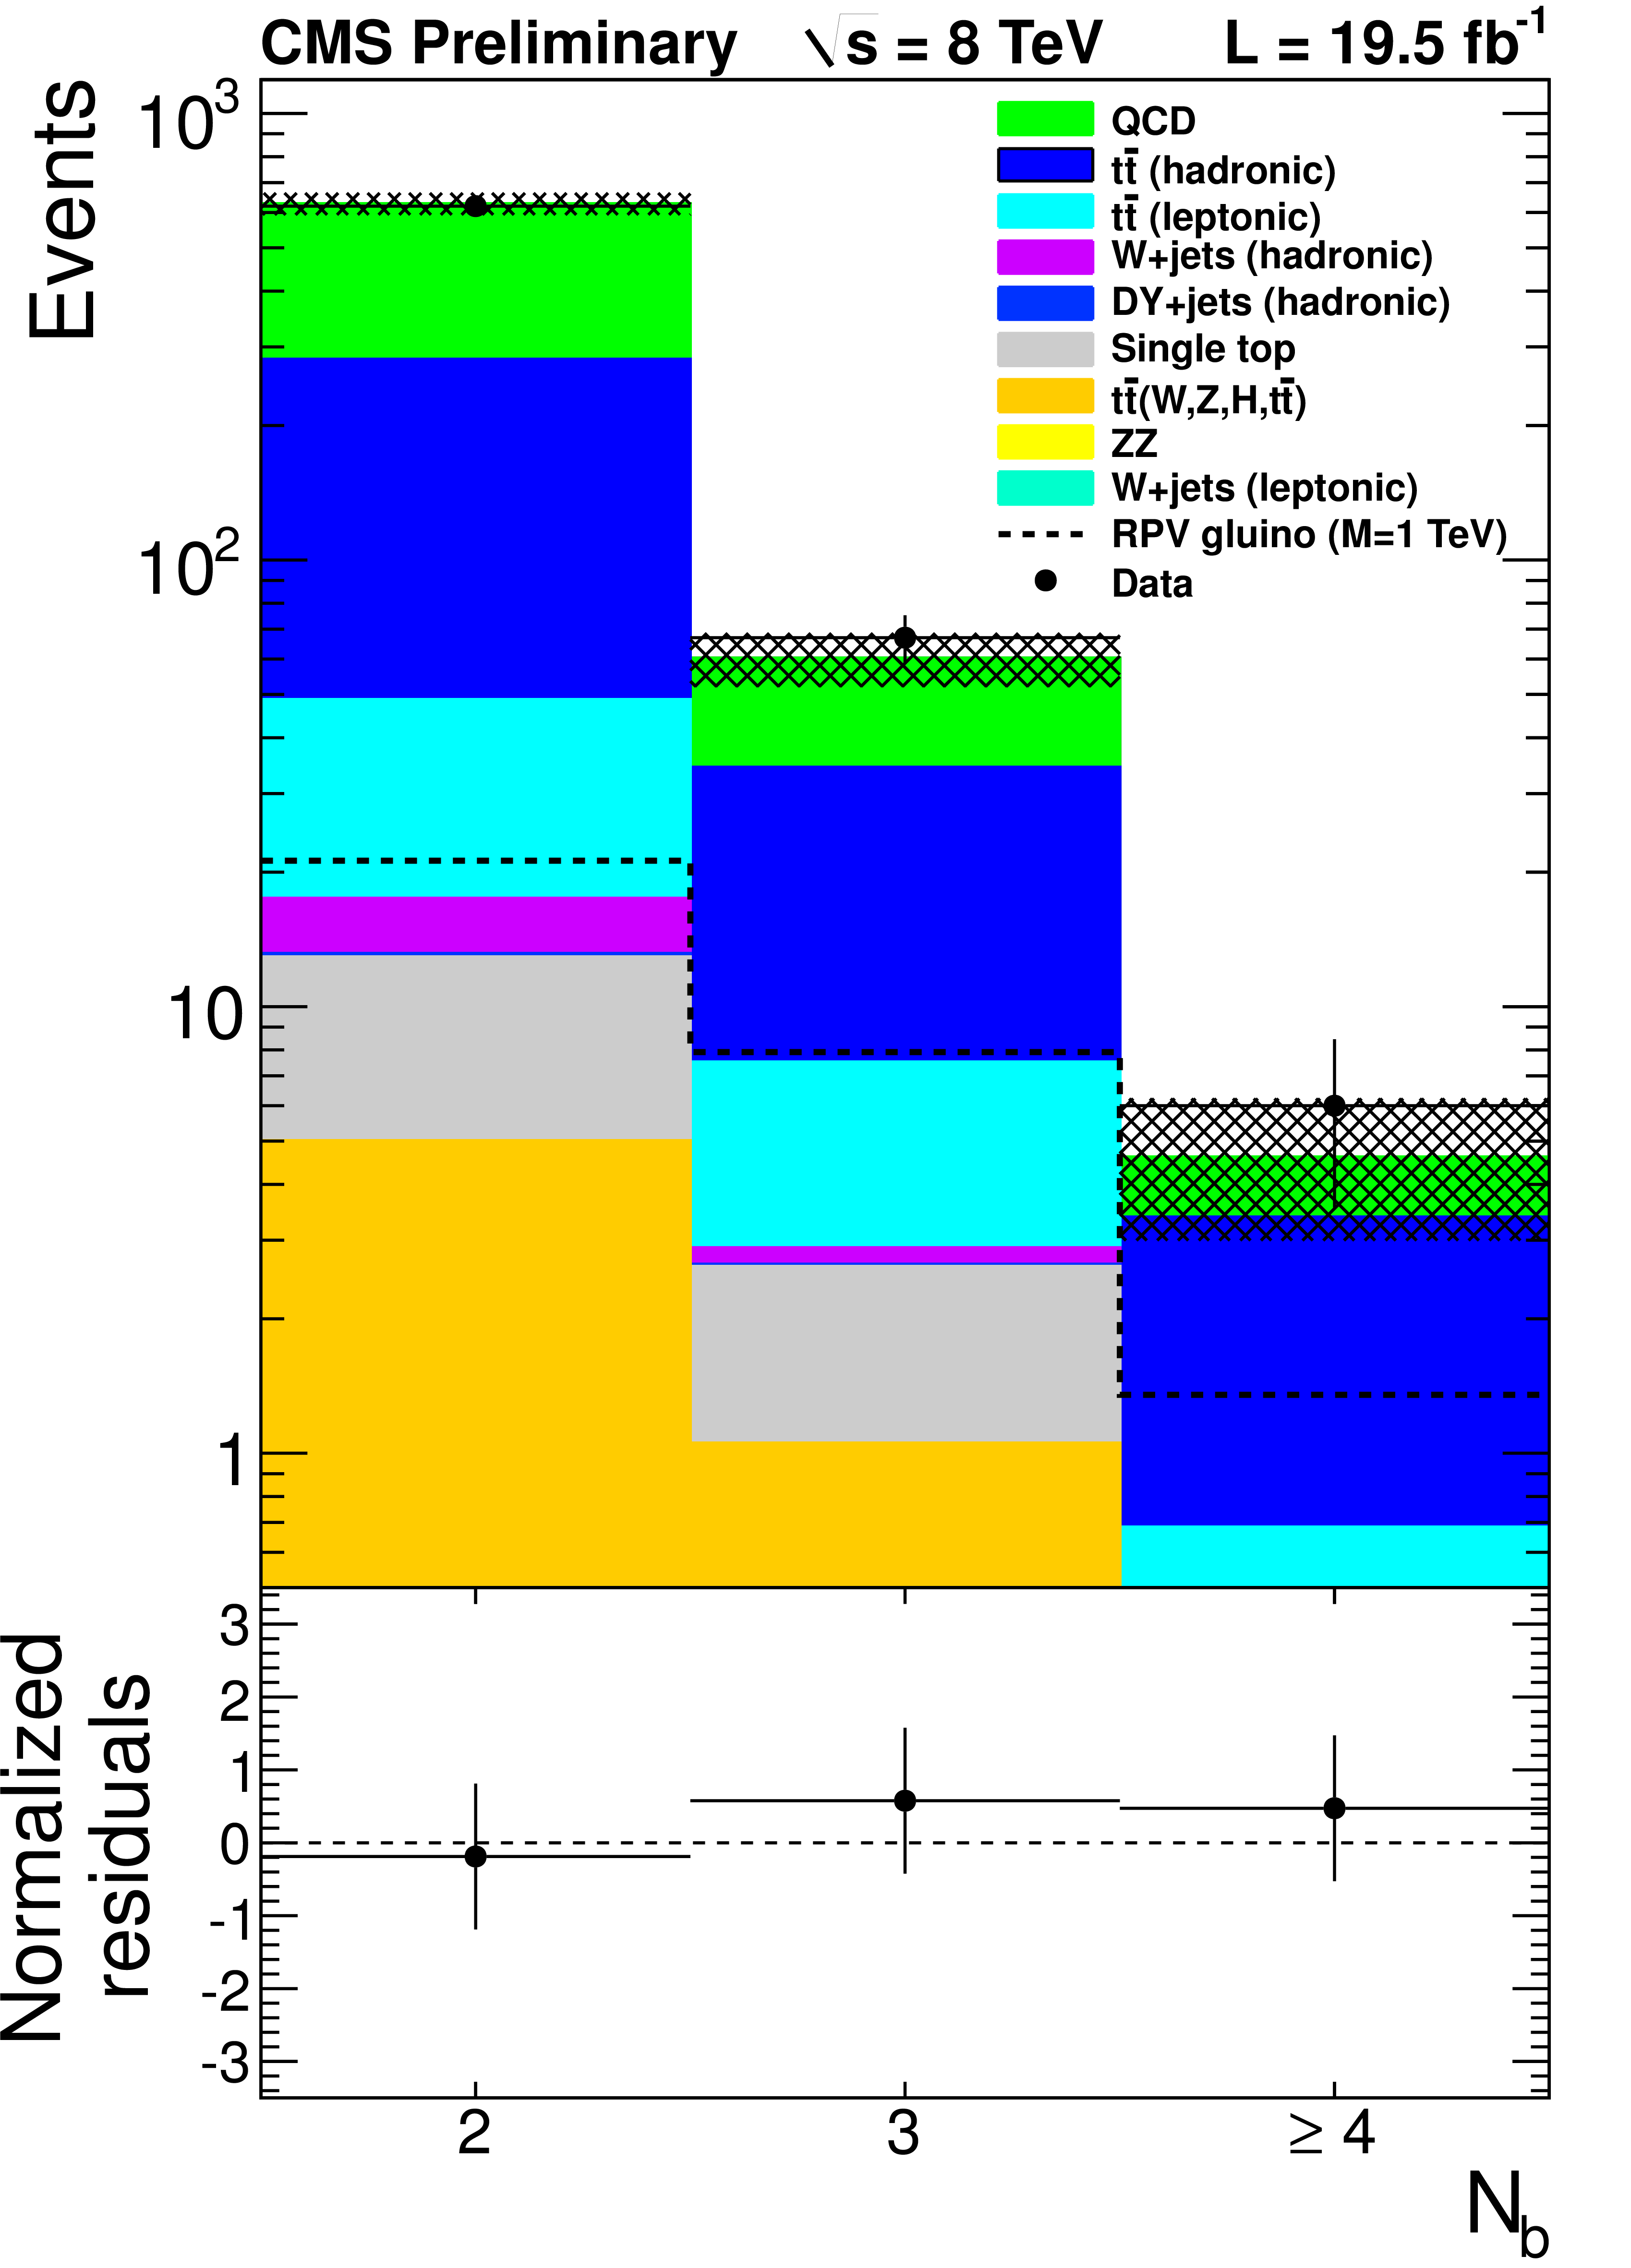
Figure 3-b:
Data (dots with error bars) and the corrected prediction of the $N_{b}$ distribution are shown. The shaded band shows the MC statistical uncertainty. The a,b,c (d,e,t) series of plots shows data in which events are required to have 1000 $ |
png ; pdf |
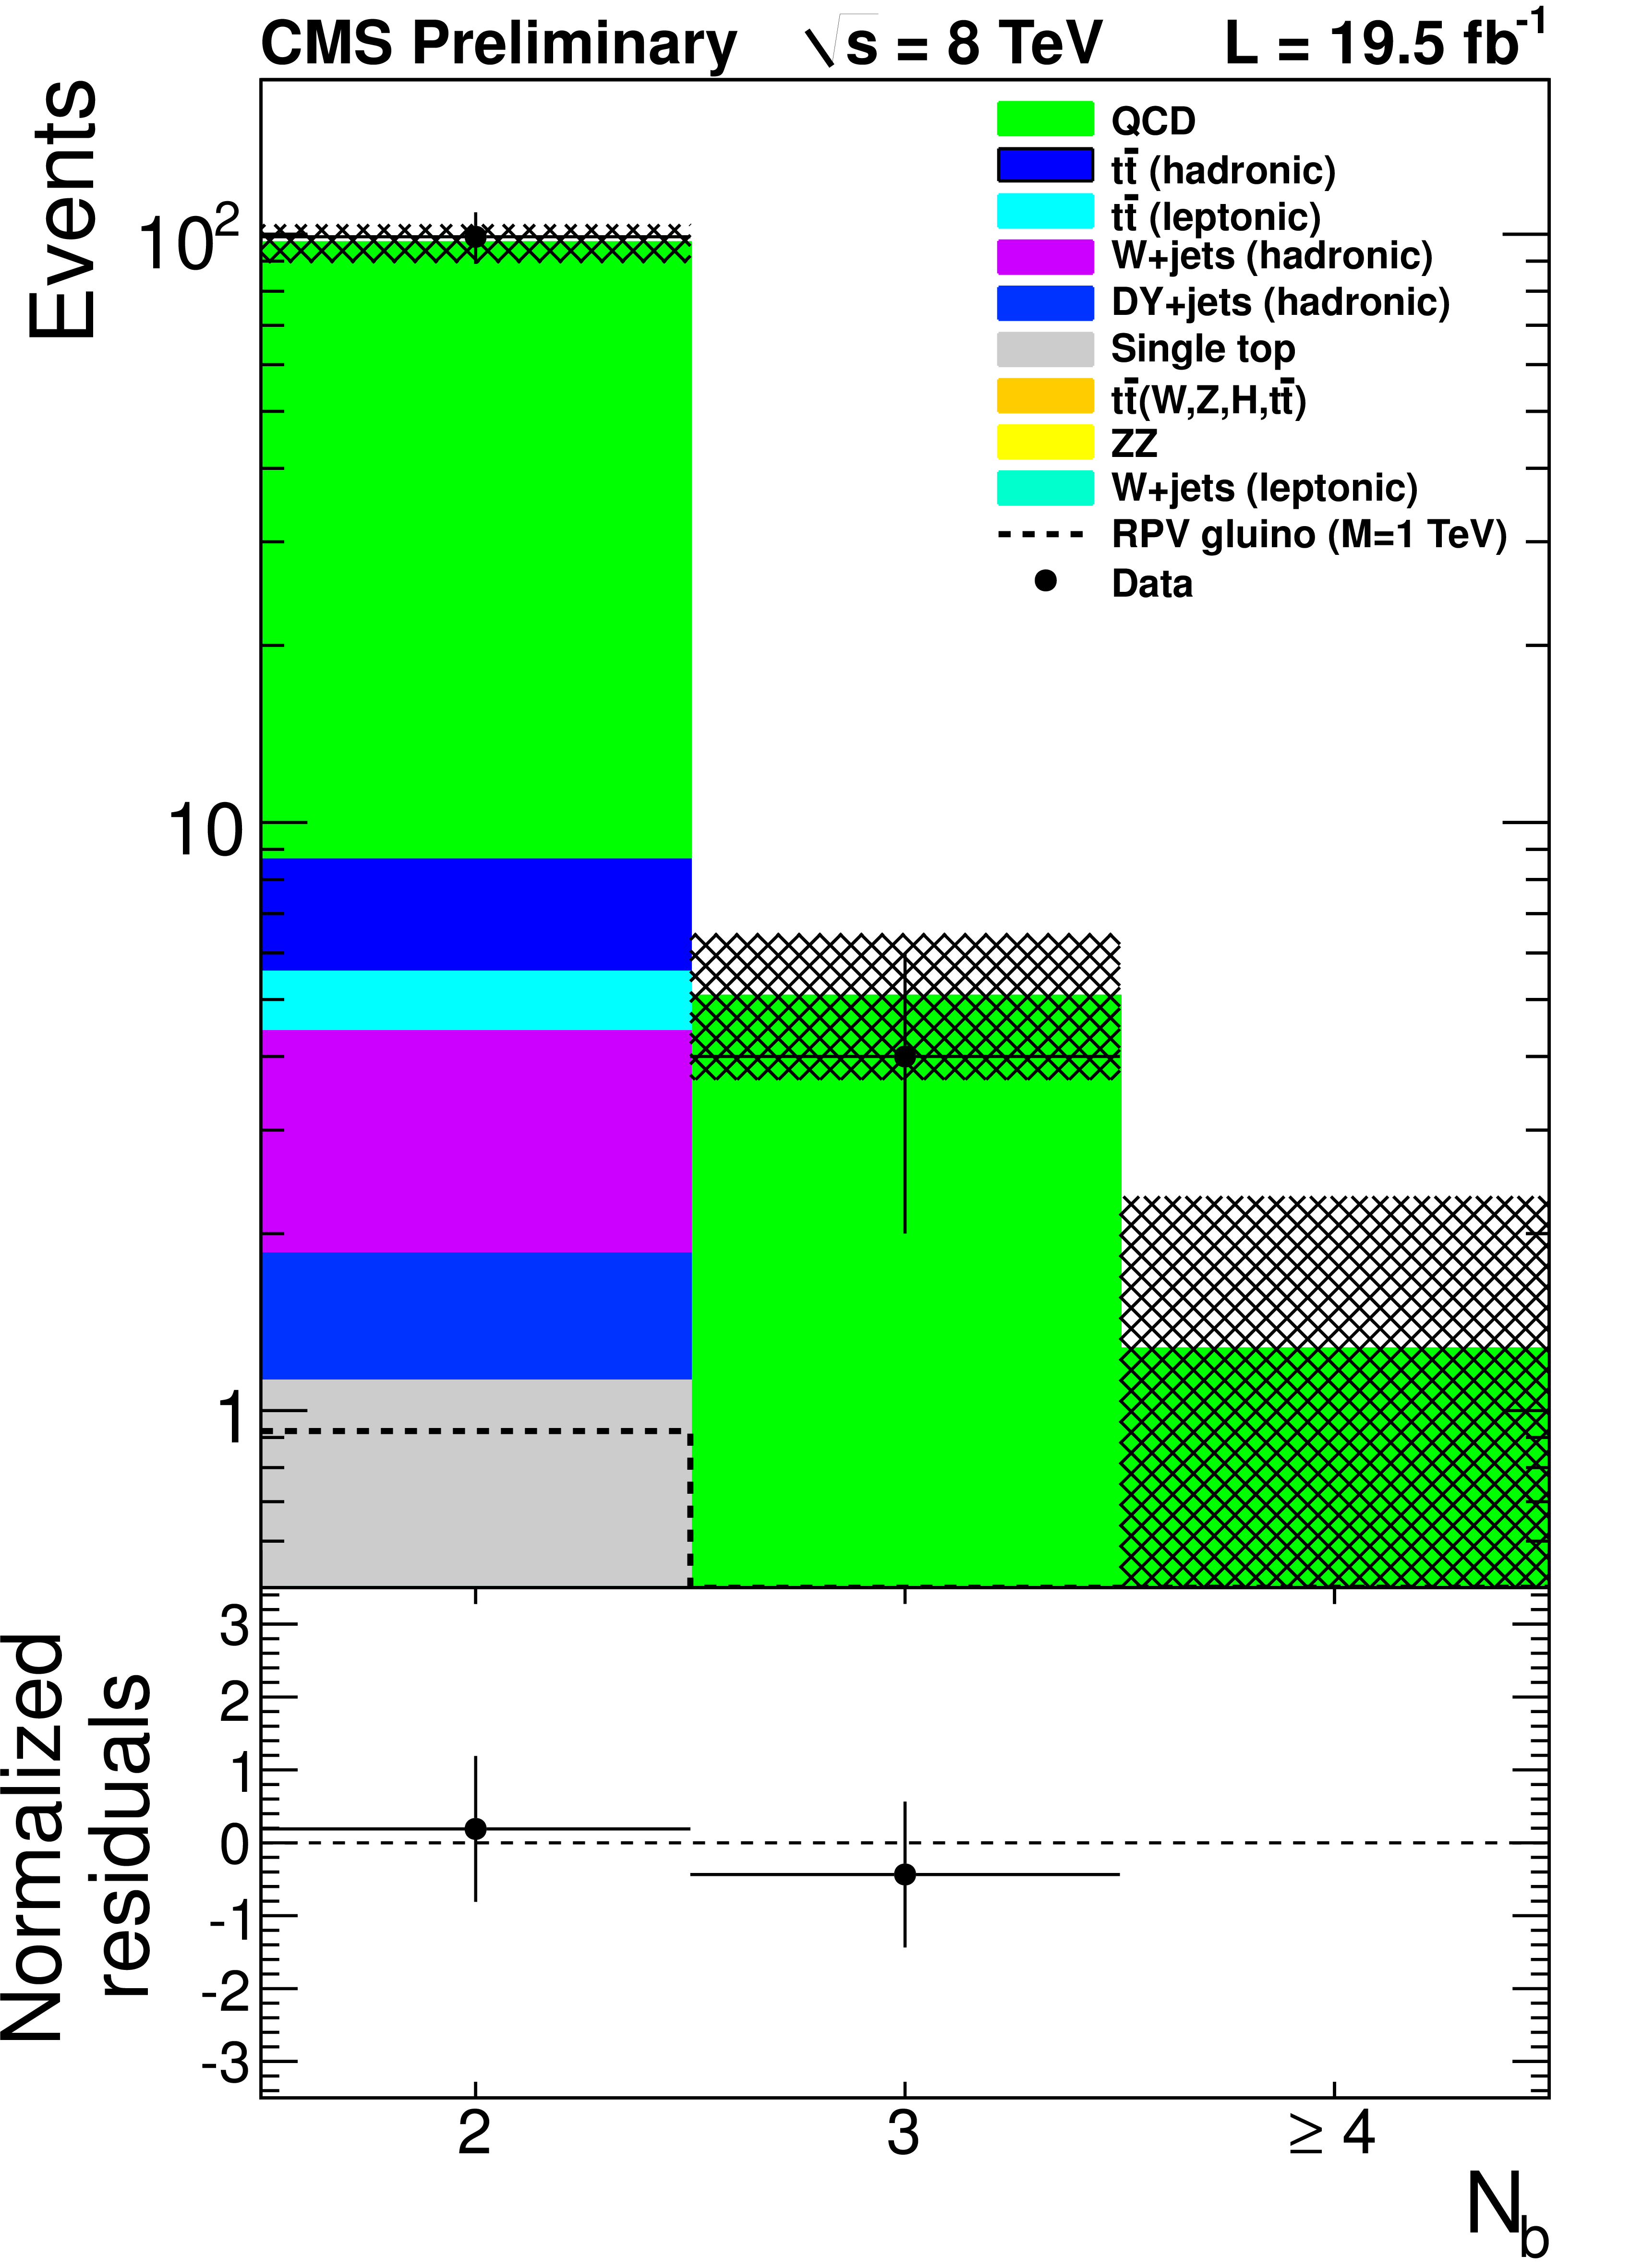
Figure 3-c:
Data (dots with error bars) and the corrected prediction of the $N_{b}$ distribution are shown. The shaded band shows the MC statistical uncertainty. The a,b,c (d,e,t) series of plots shows data in which events are required to have 1000 $ |
png ; pdf |
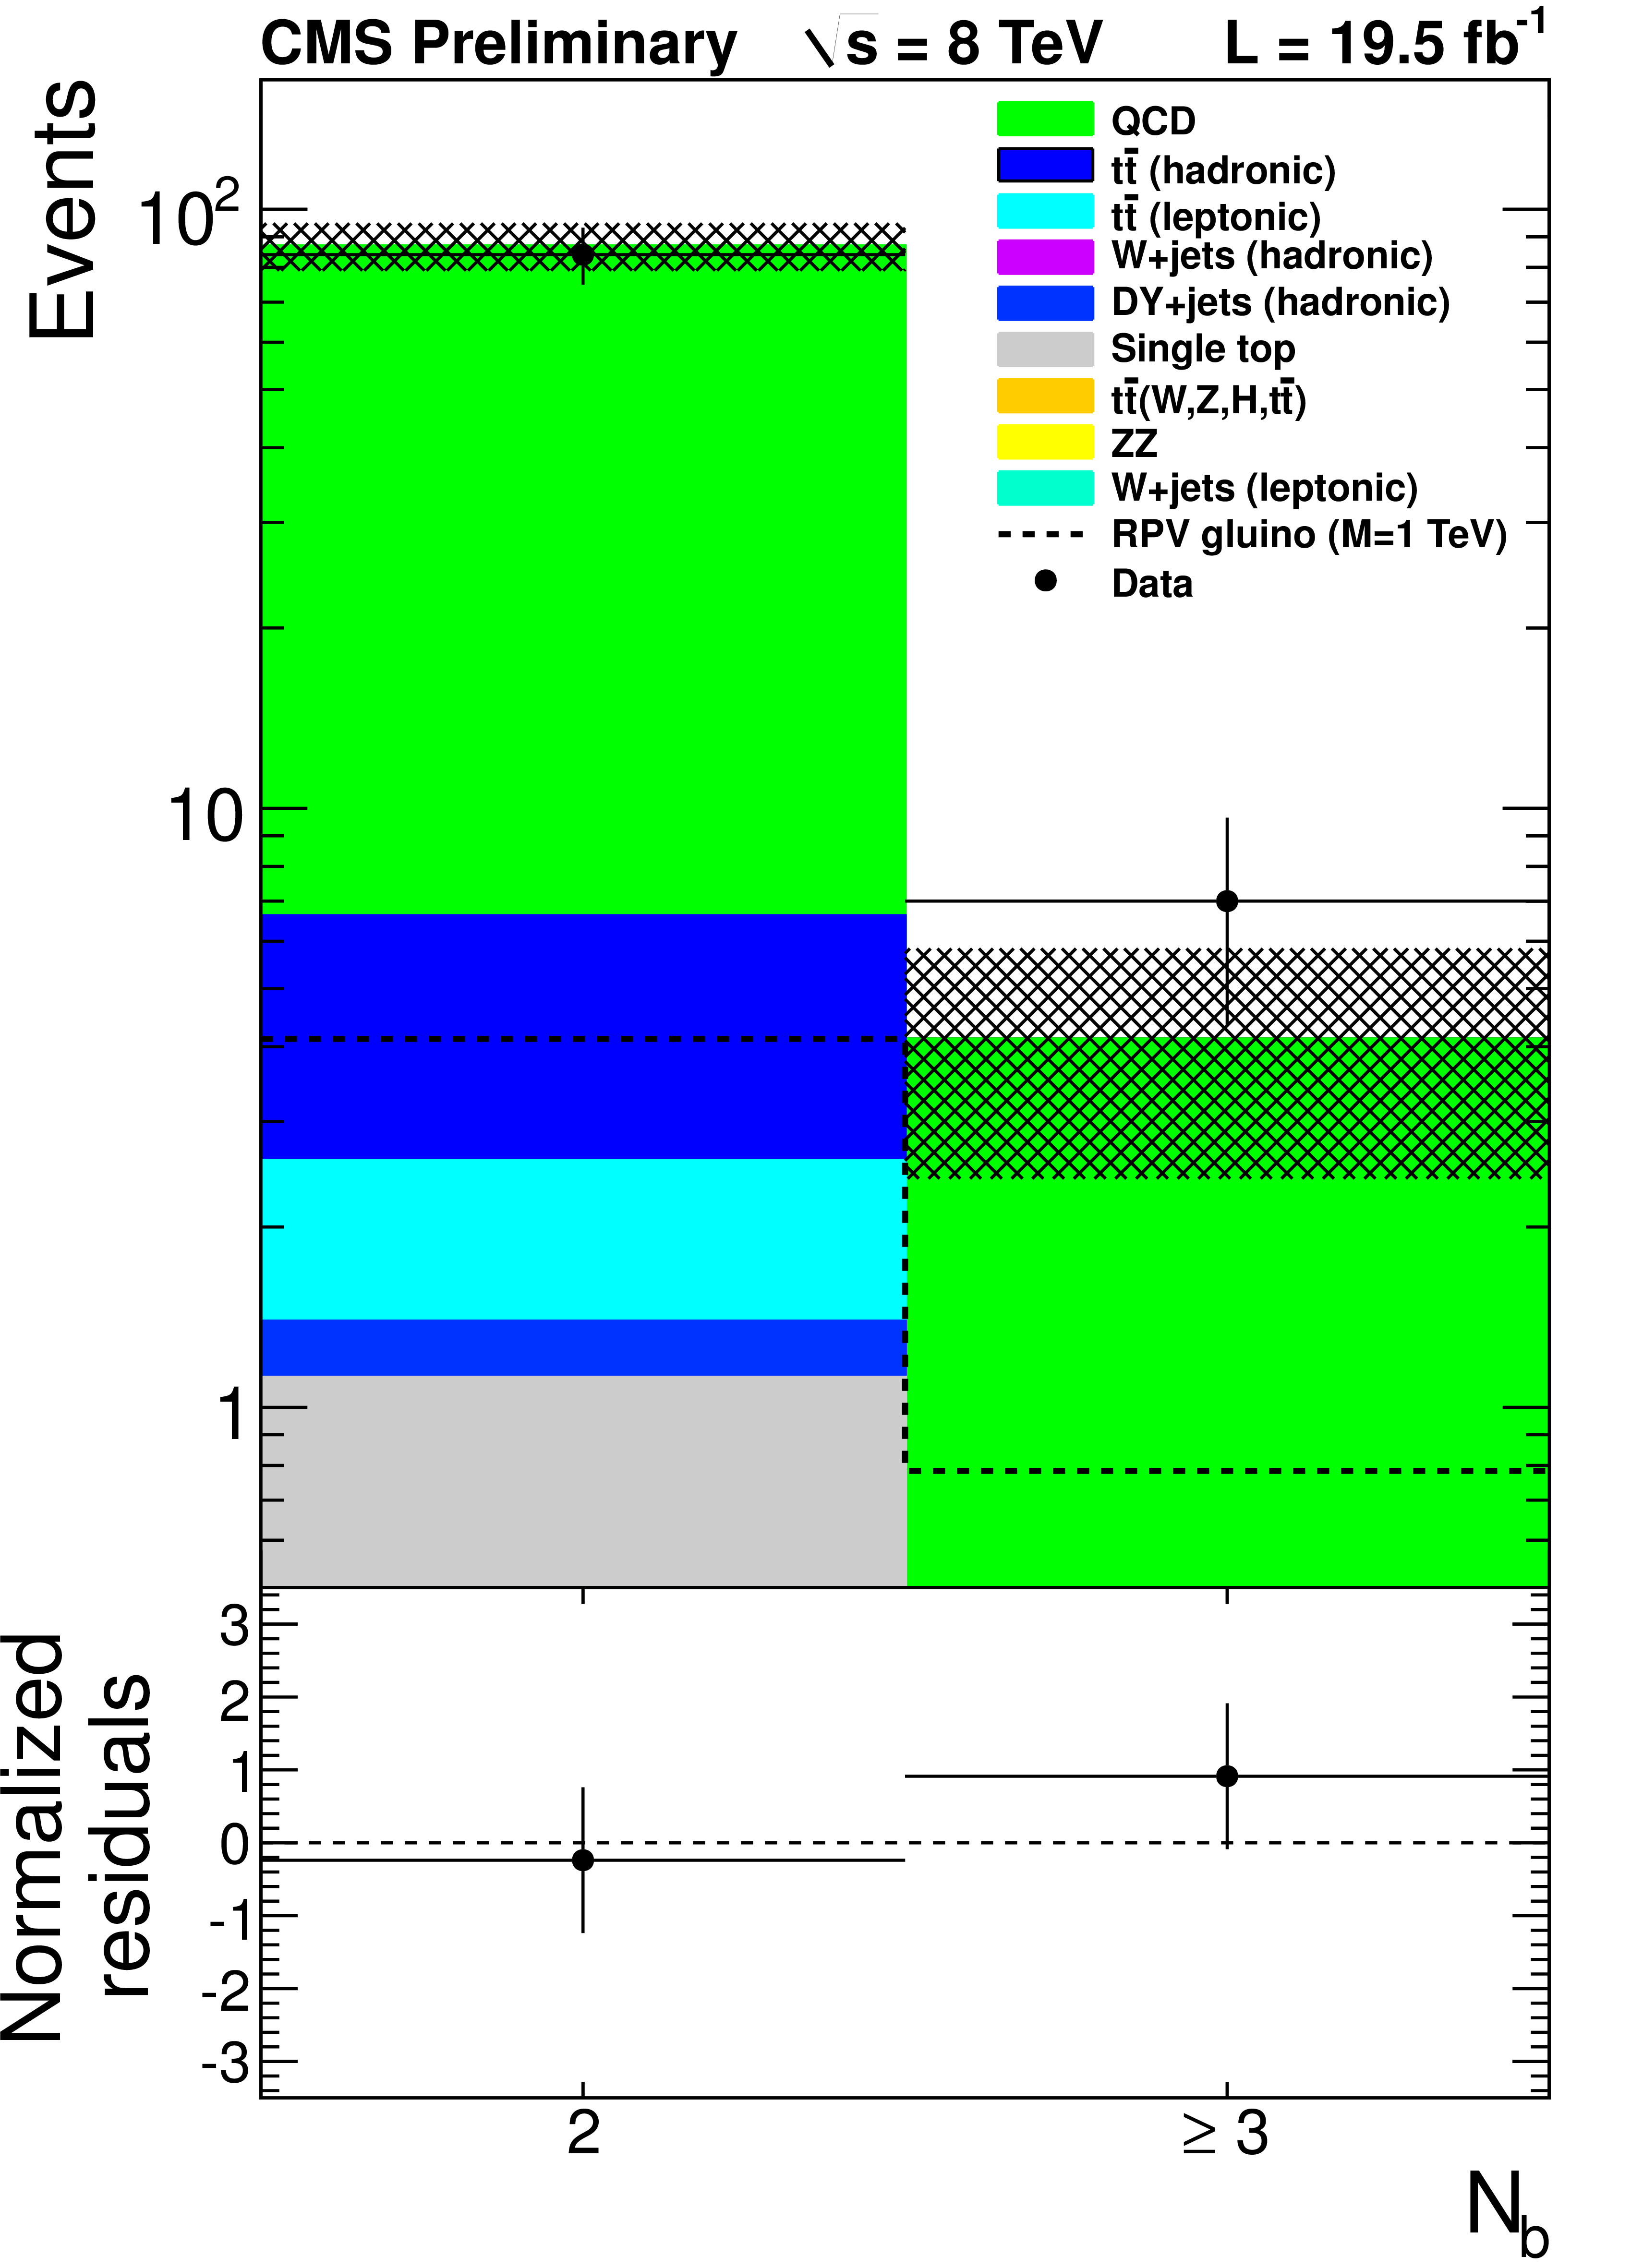
Figure 3-d:
Data (dots with error bars) and the corrected prediction of the $N_{b}$ distribution are shown. The shaded band shows the MC statistical uncertainty. The a,b,c (d,e,t) series of plots shows data in which events are required to have 1000 $ |
png ; pdf |
Figure 3-e:
Data (dots with error bars) and the corrected prediction of the $N_{b}$ distribution are shown. The shaded band shows the MC statistical uncertainty. The a,b,c (d,e,t) series of plots shows data in which events are required to have 1000 $ |
png ; pdf |
Figure 3-f:
Data (dots with error bars) and the corrected prediction of the $N_{b}$ distribution are shown. The shaded band shows the MC statistical uncertainty. The a,b,c (d,e,t) series of plots shows data in which events are required to have 1000 $ |
png ; pdf |
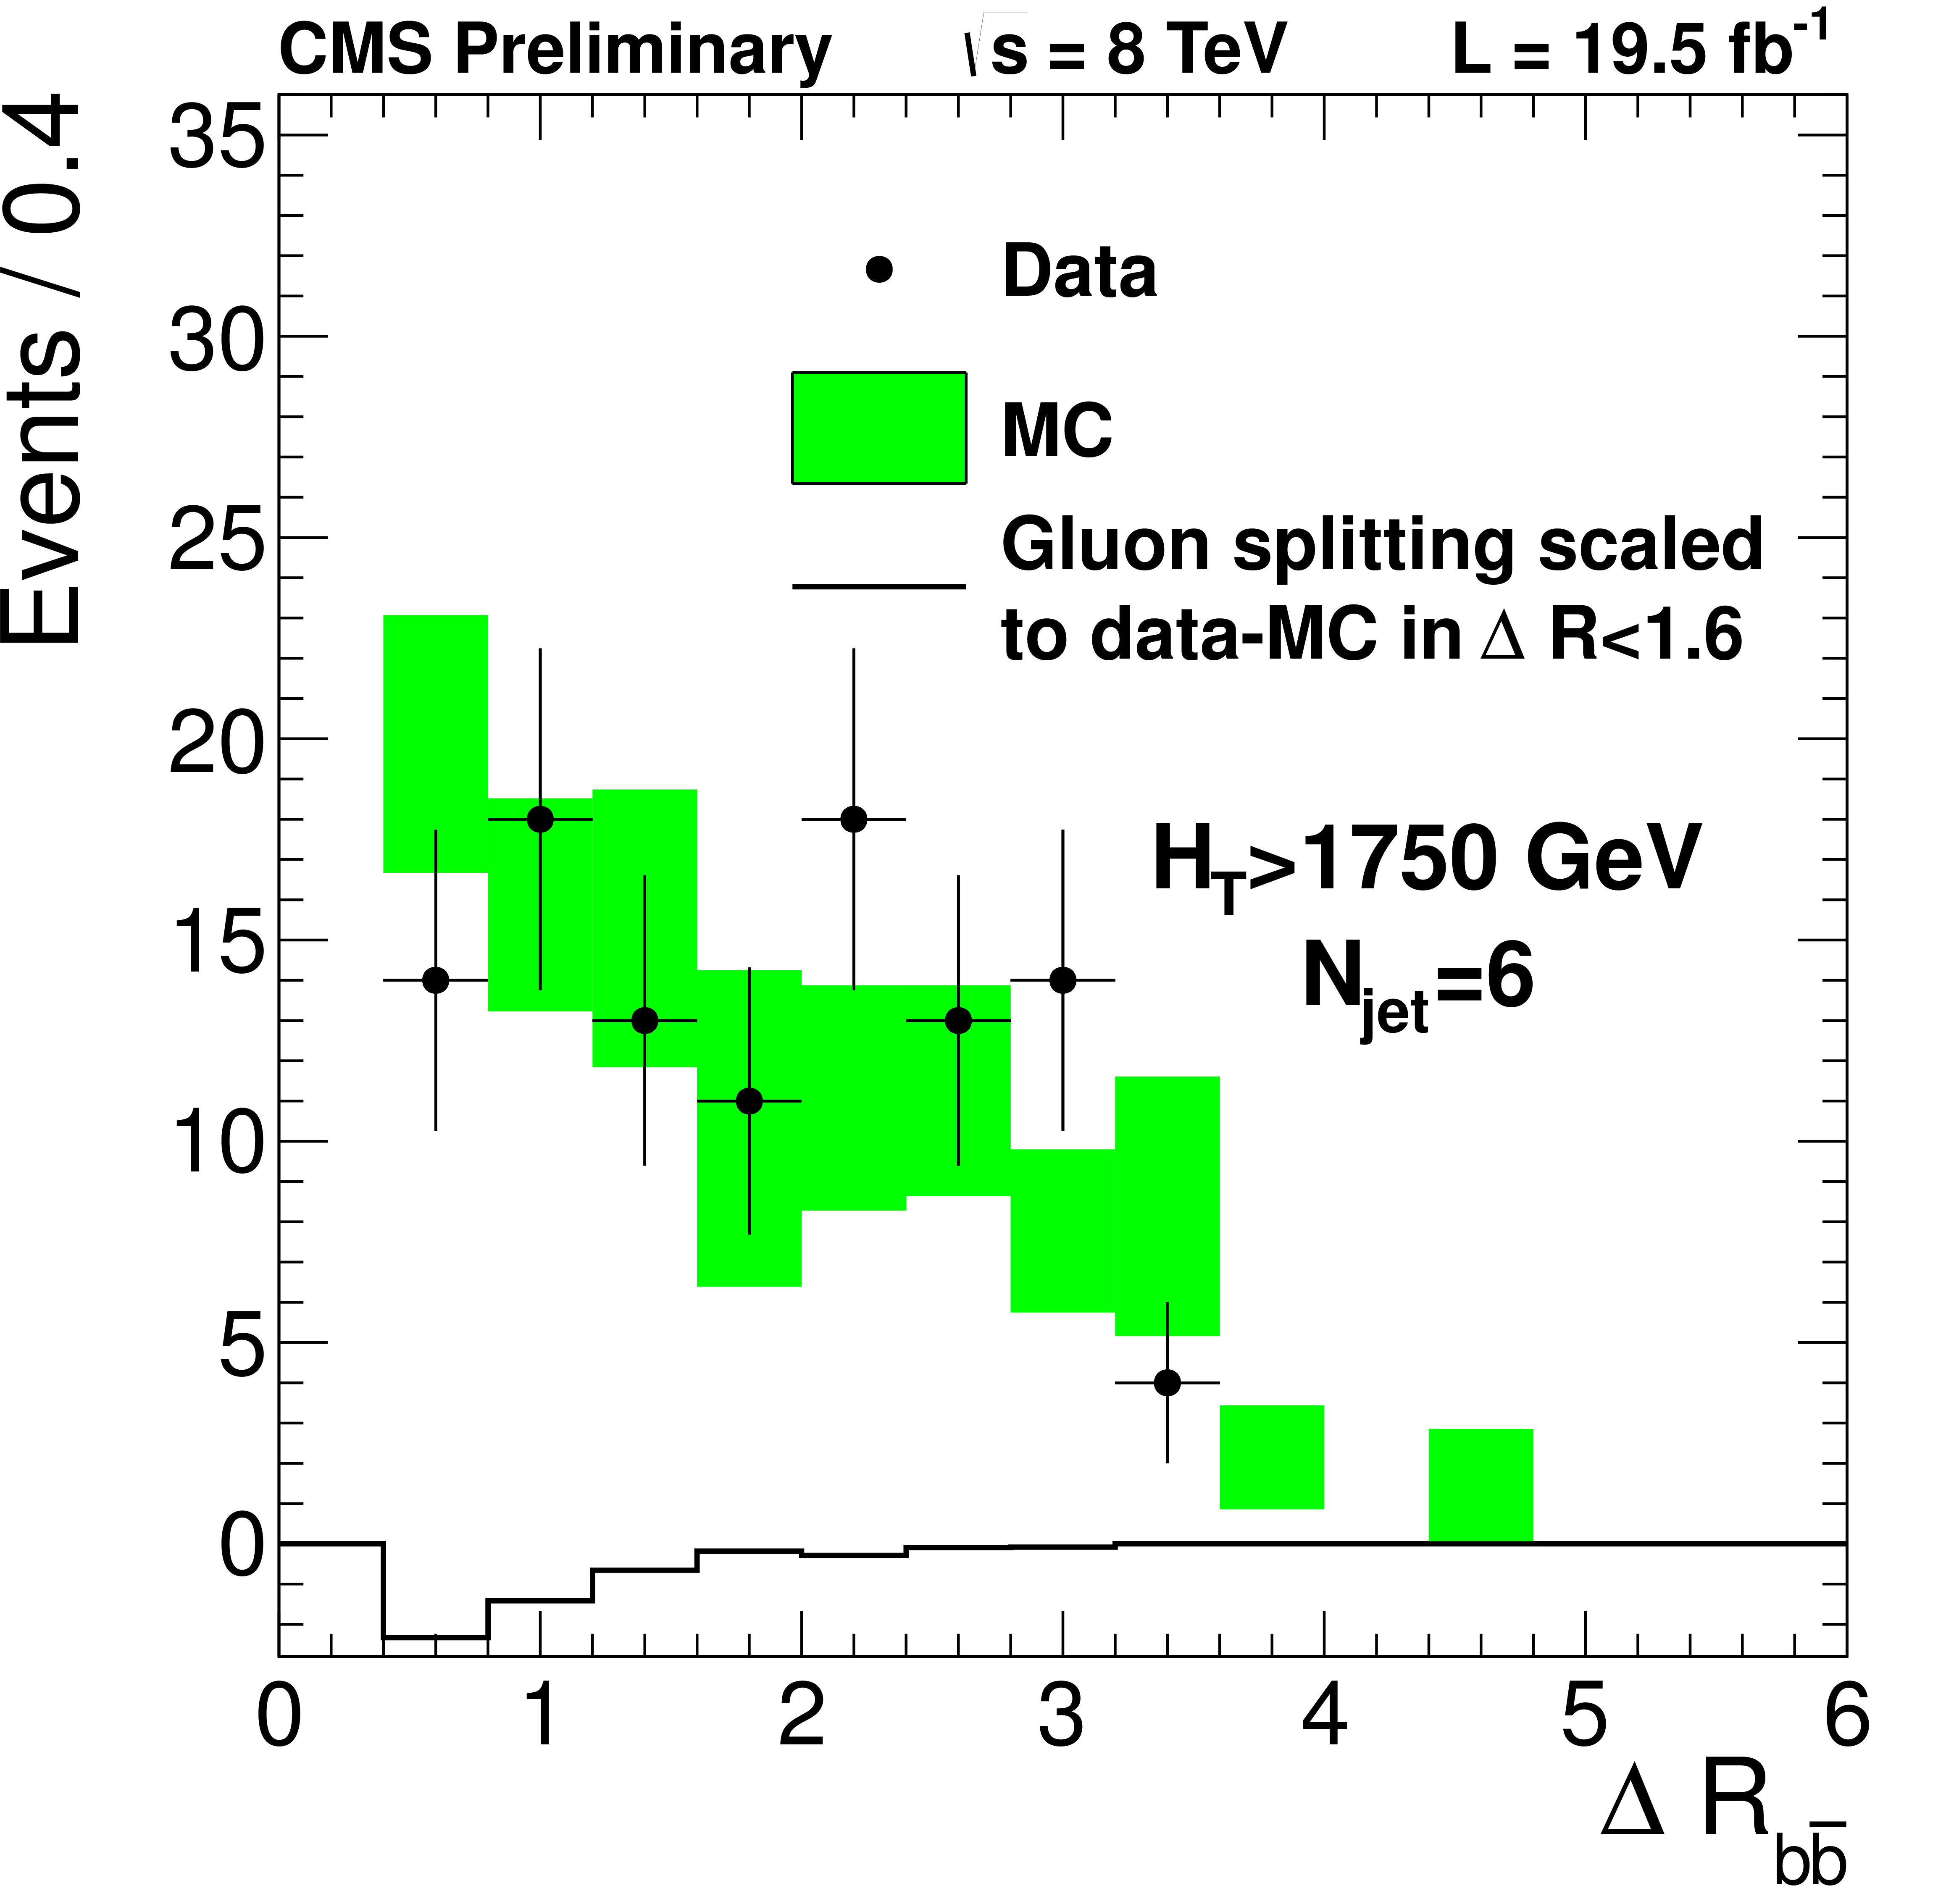
Figure 4:
Data (dots with error bars), uncorrected MC prediction (band), and truth-matched gluon splitting events scaled to the data-MC difference in $\Delta R<$ 1.6 (histogram) in a typical signal region corresponding to $H_{T}>$ 1750 GeV and $N_{\rm jet}=$ 6. |
png ; pdf |
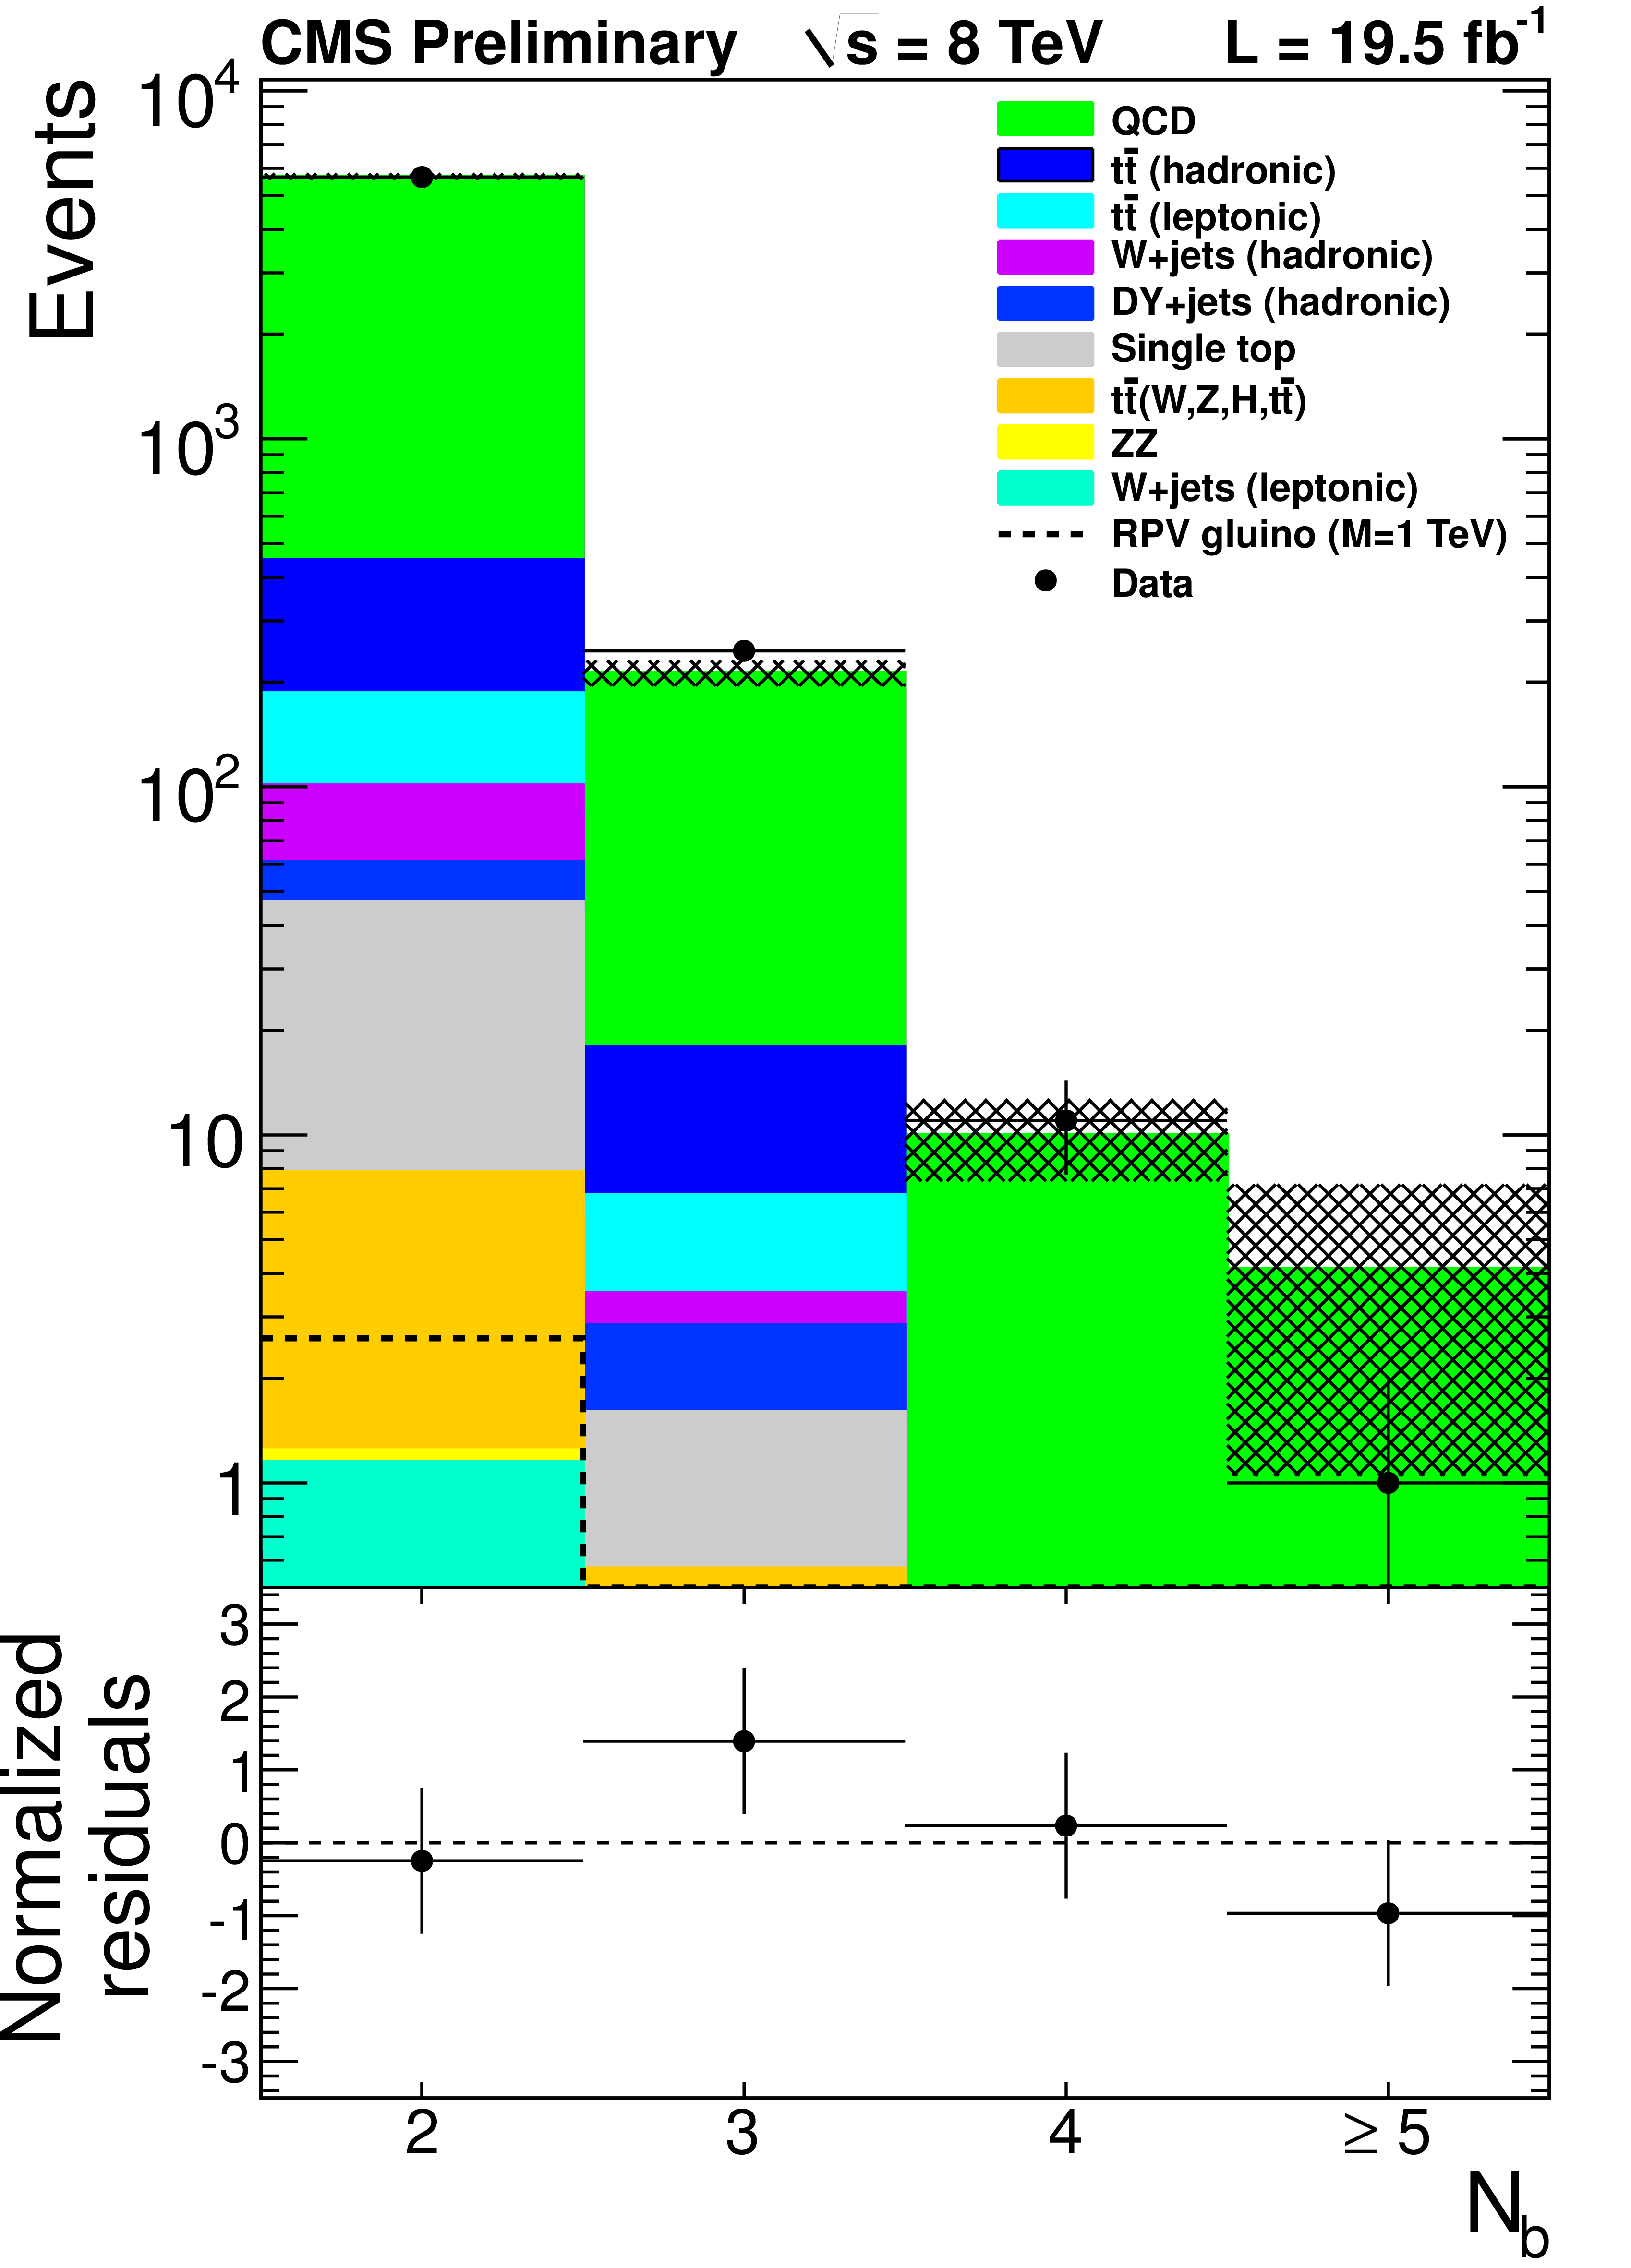
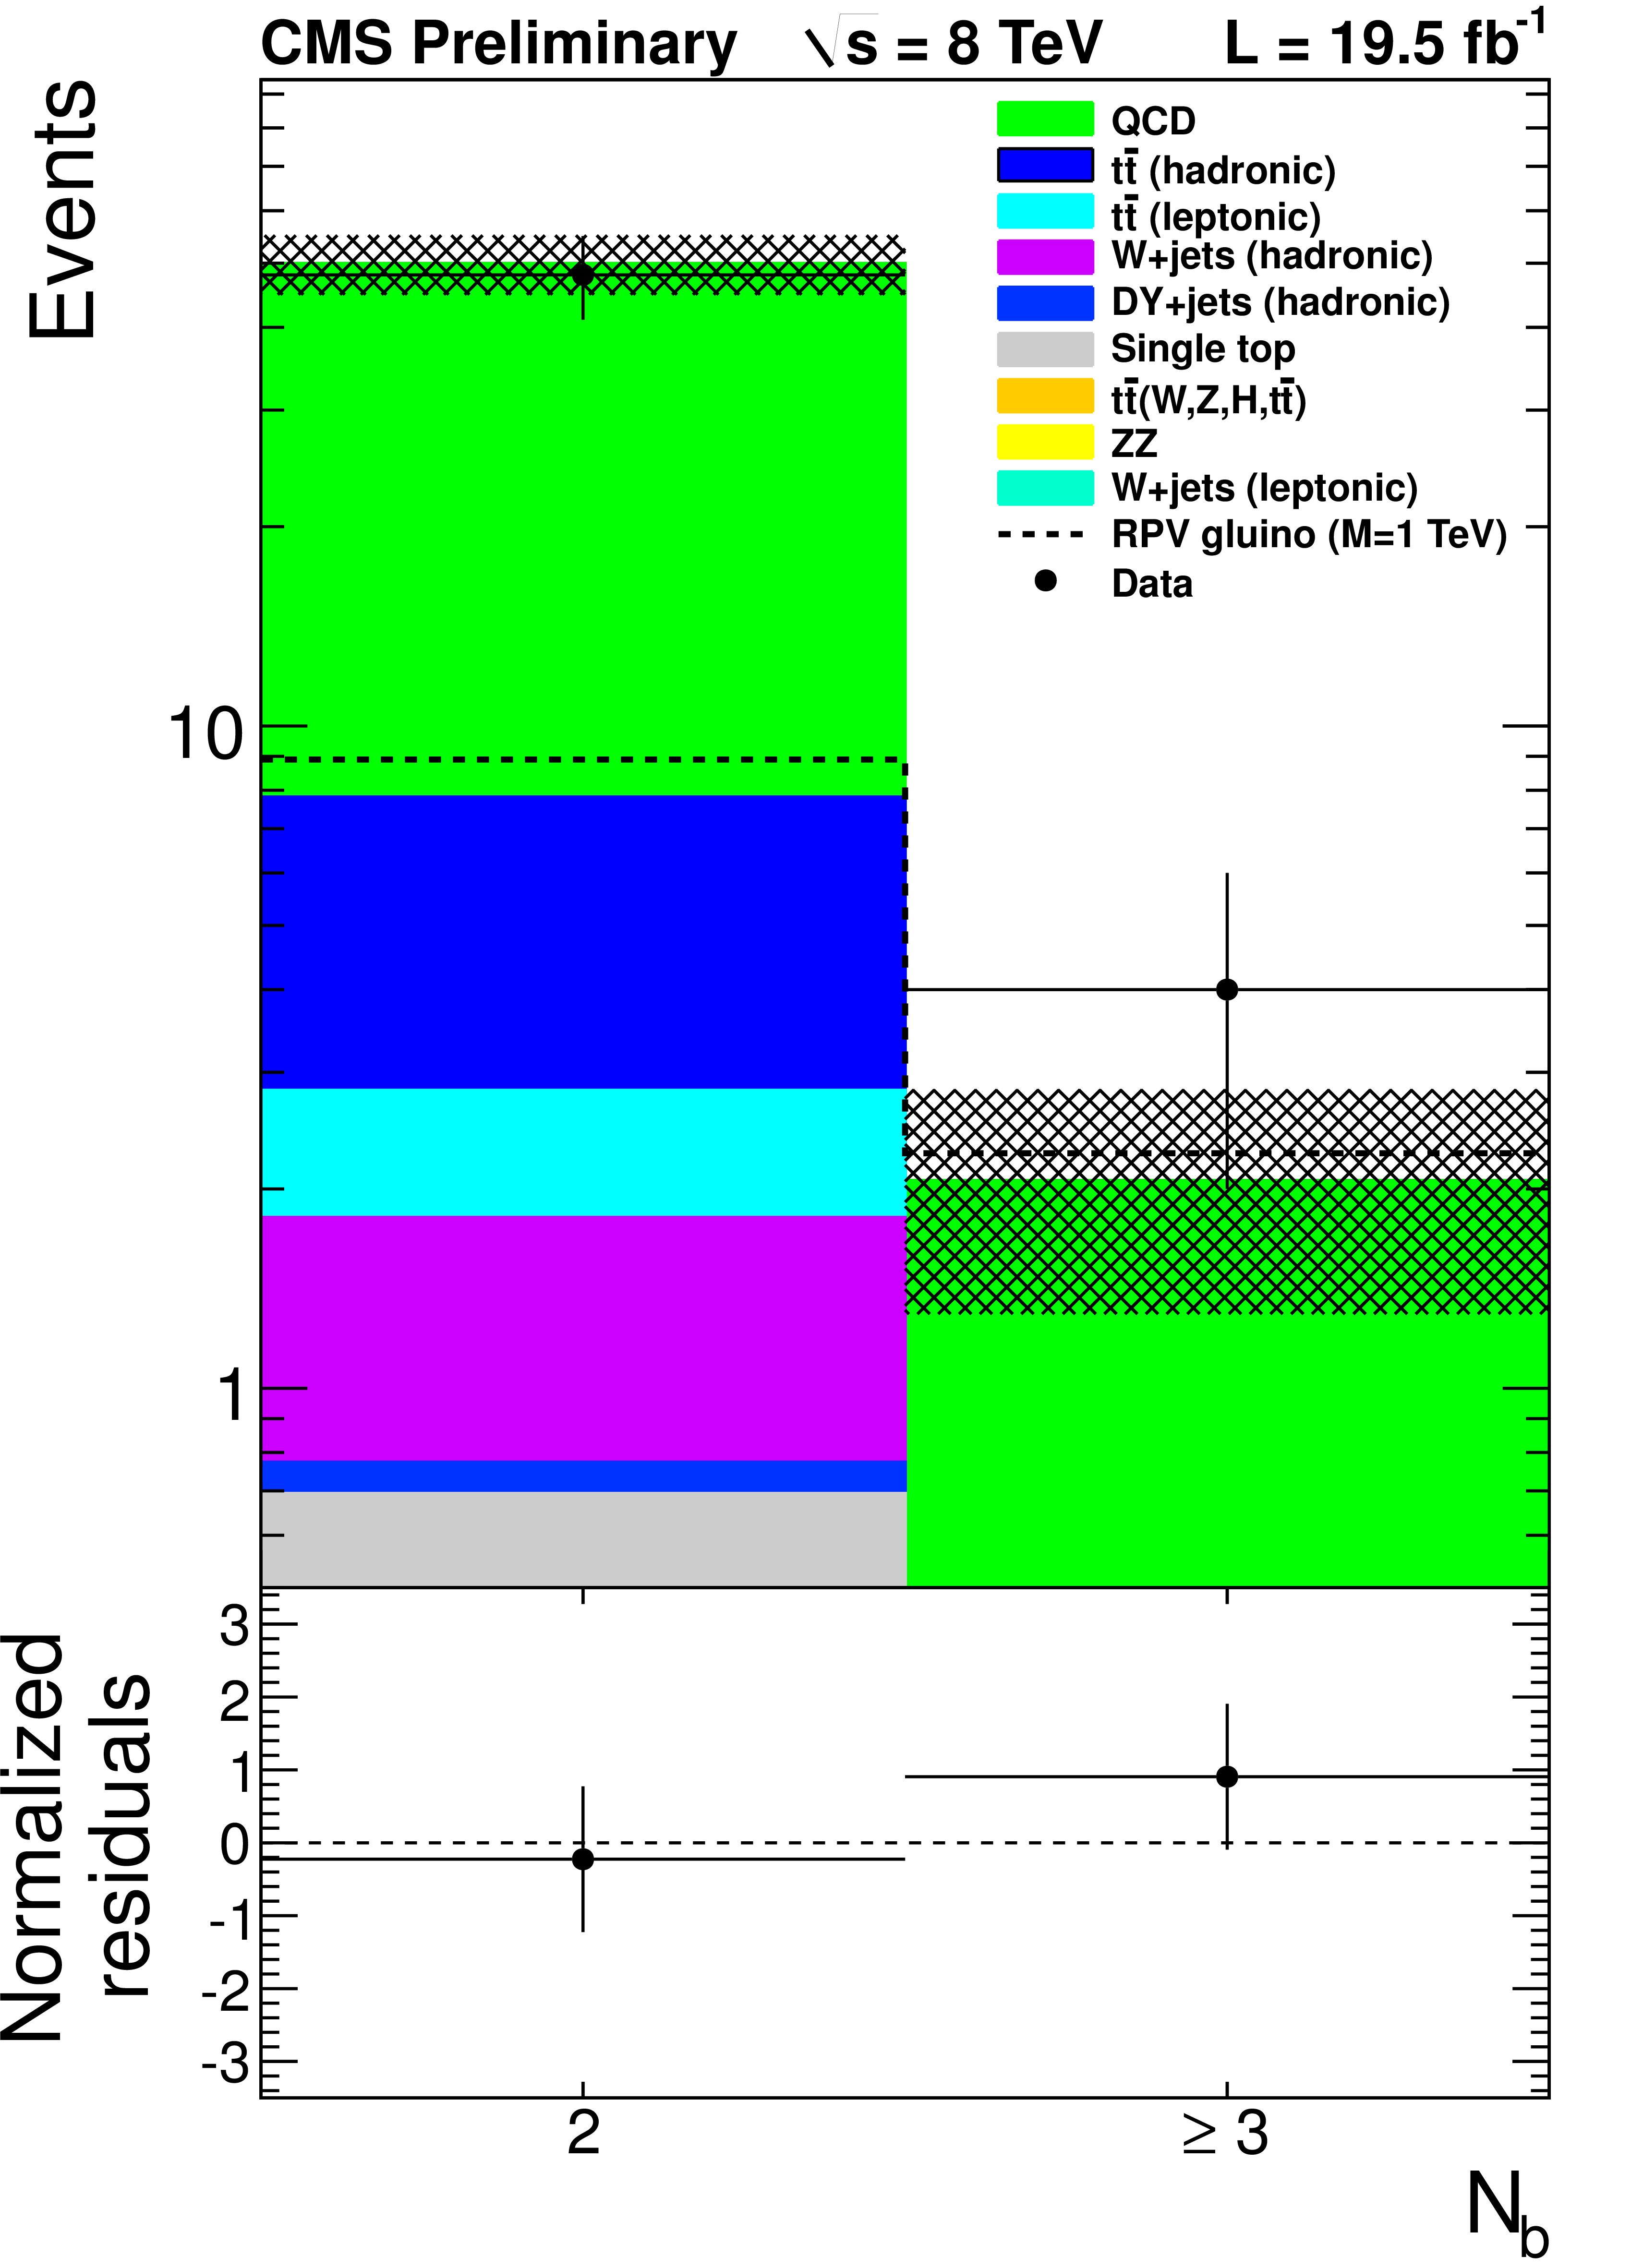
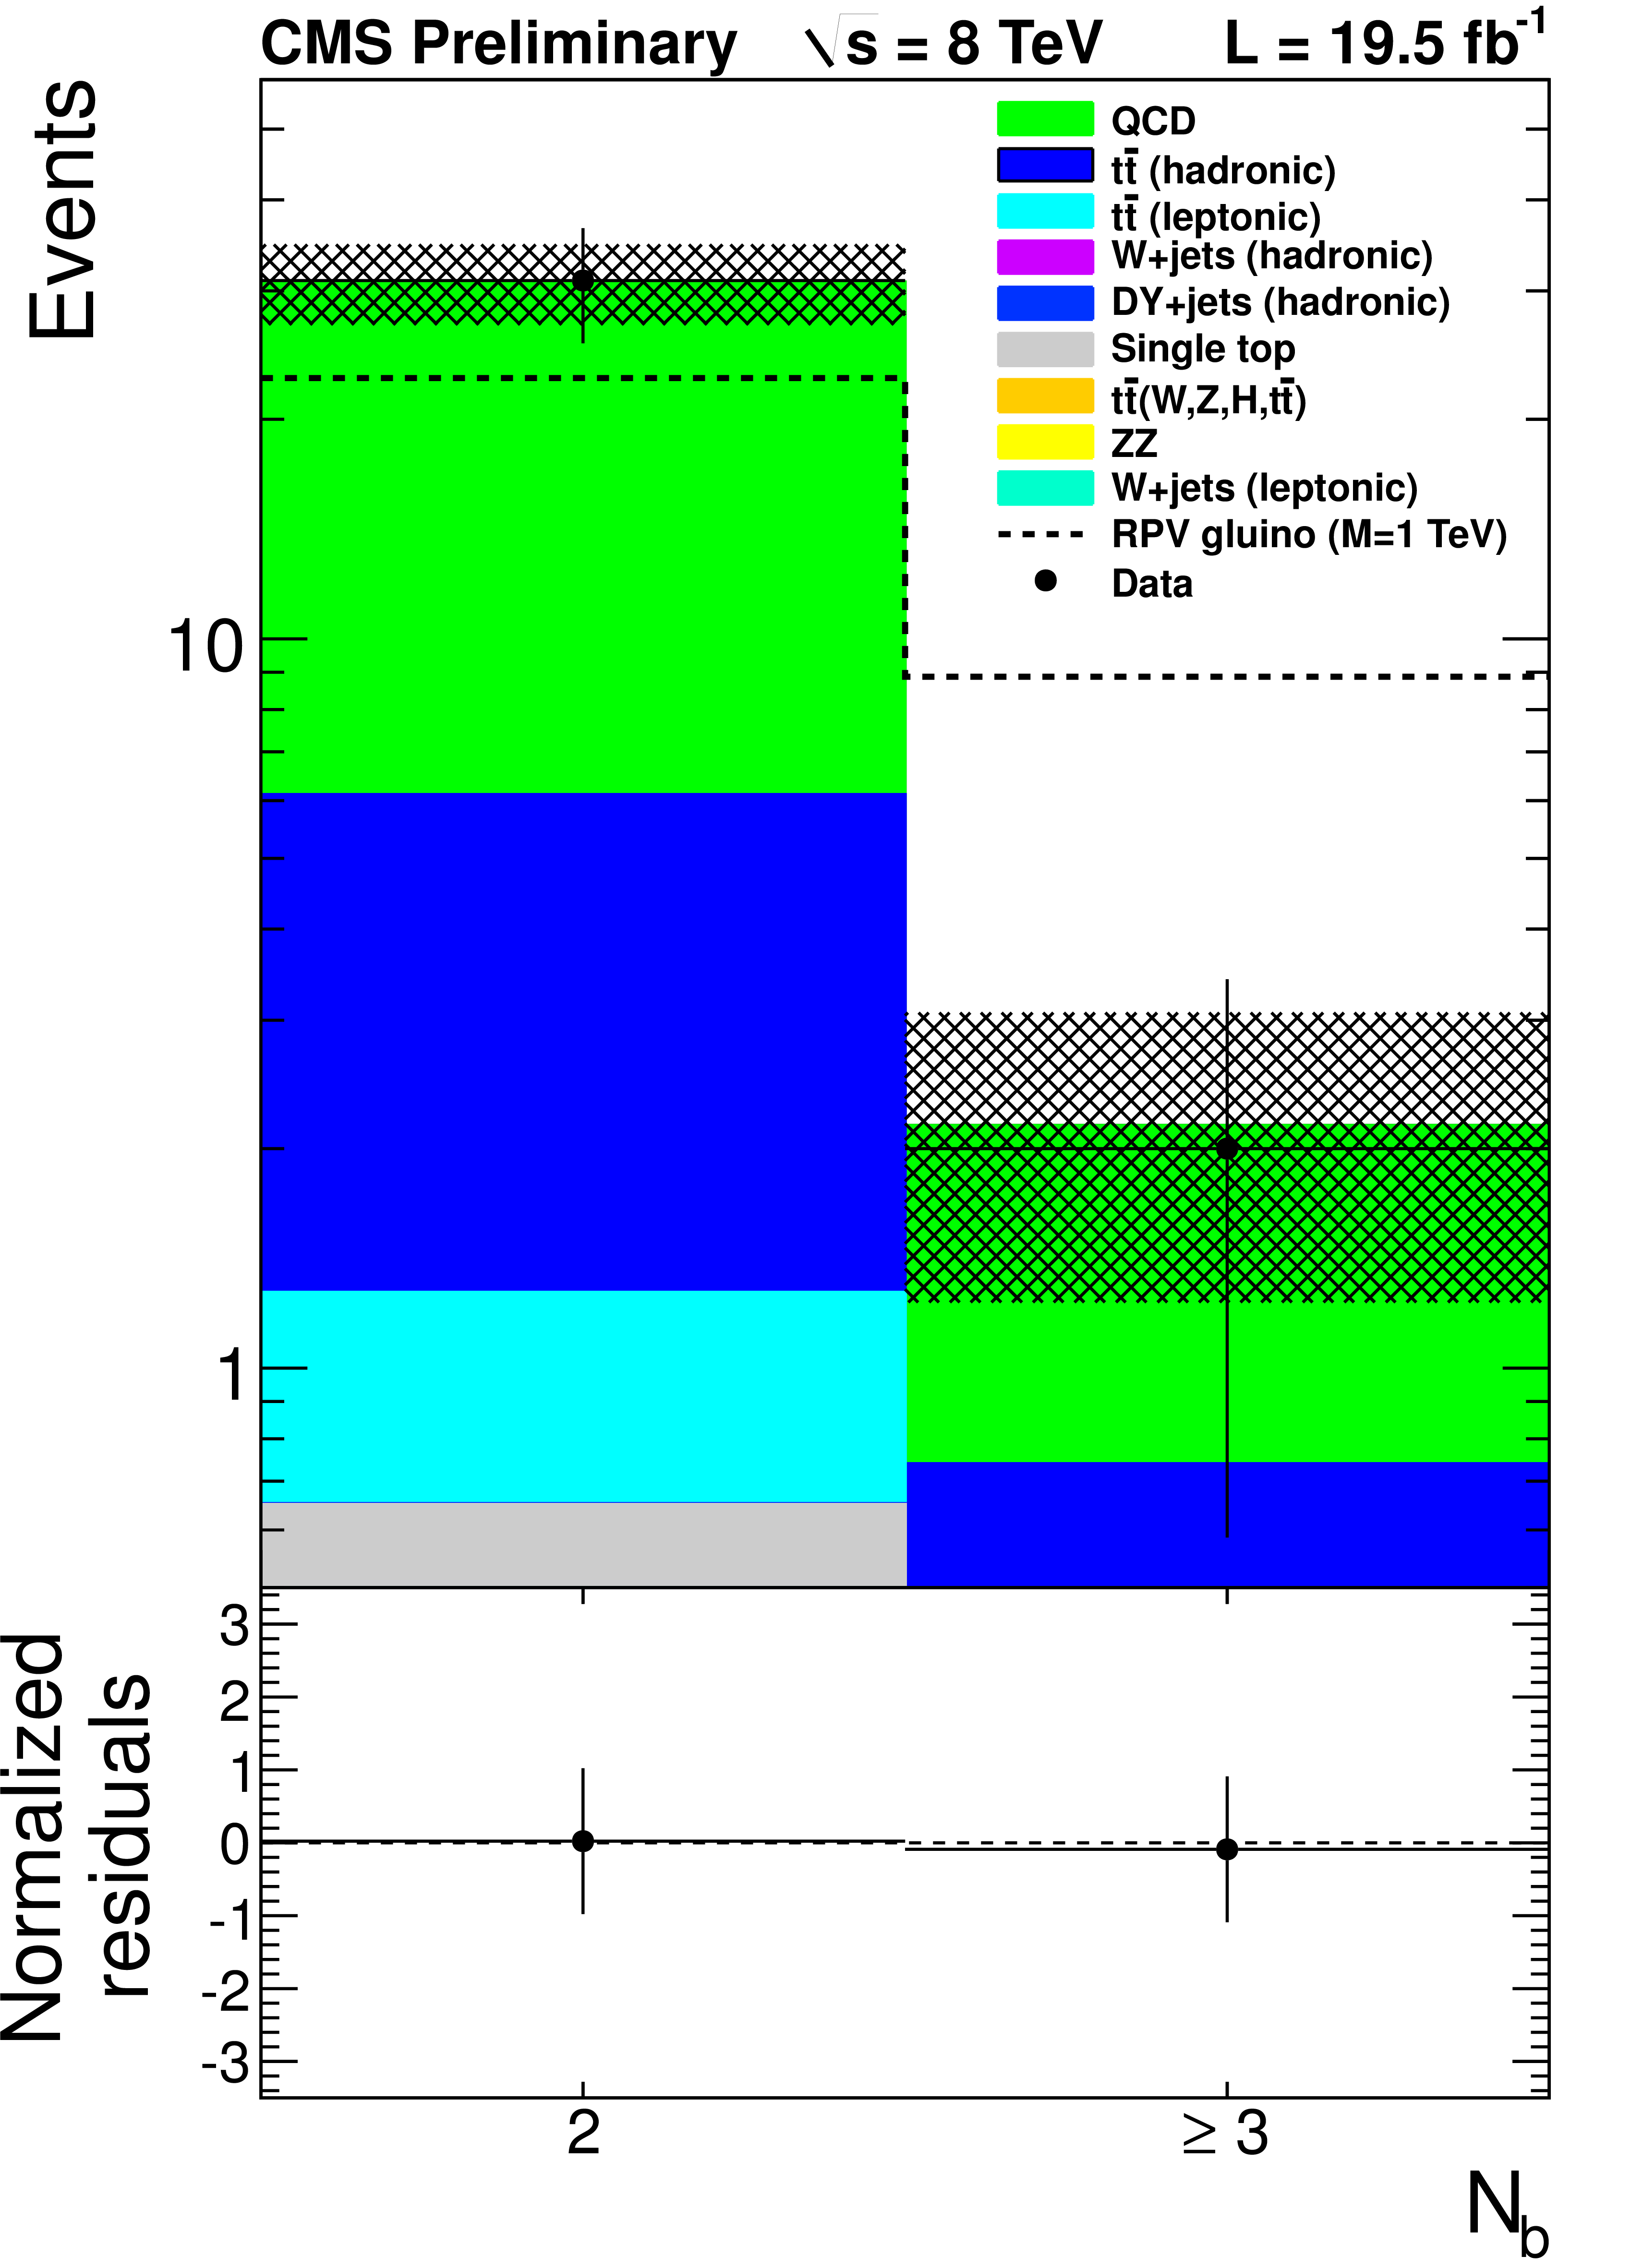
Figure 5-a:
Data (dots with error bars) and the corrected prediction of the $N_{b}$ distribution in the high $N_{\textrm {jet}}$ signal region. The shaded band shows the MC statistical uncertainty. The a,b (c,d) series of plots shows data in which events are required to have 1000 $ |
png ; pdf |
Figure 5-b:
Data (dots with error bars) and the corrected prediction of the $N_{b}$ distribution in the high $N_{\textrm {jet}}$ signal region. The shaded band shows the MC statistical uncertainty. The a,b (c,d) series of plots shows data in which events are required to have 1000 $ |
png ; pdf |
Figure 5-c:
Data (dots with error bars) and the corrected prediction of the $N_{b}$ distribution in the high $N_{\textrm {jet}}$ signal region. The shaded band shows the MC statistical uncertainty. The a,b (c,d) series of plots shows data in which events are required to have 1000 $ |
png ; pdf |
Figure 5-d:
Data (dots with error bars) and the corrected prediction of the $N_{b}$ distribution in the high $N_{\textrm {jet}}$ signal region. The shaded band shows the MC statistical uncertainty. The a,b (c,d) series of plots shows data in which events are required to have 1000 $ |
png ; pdf |
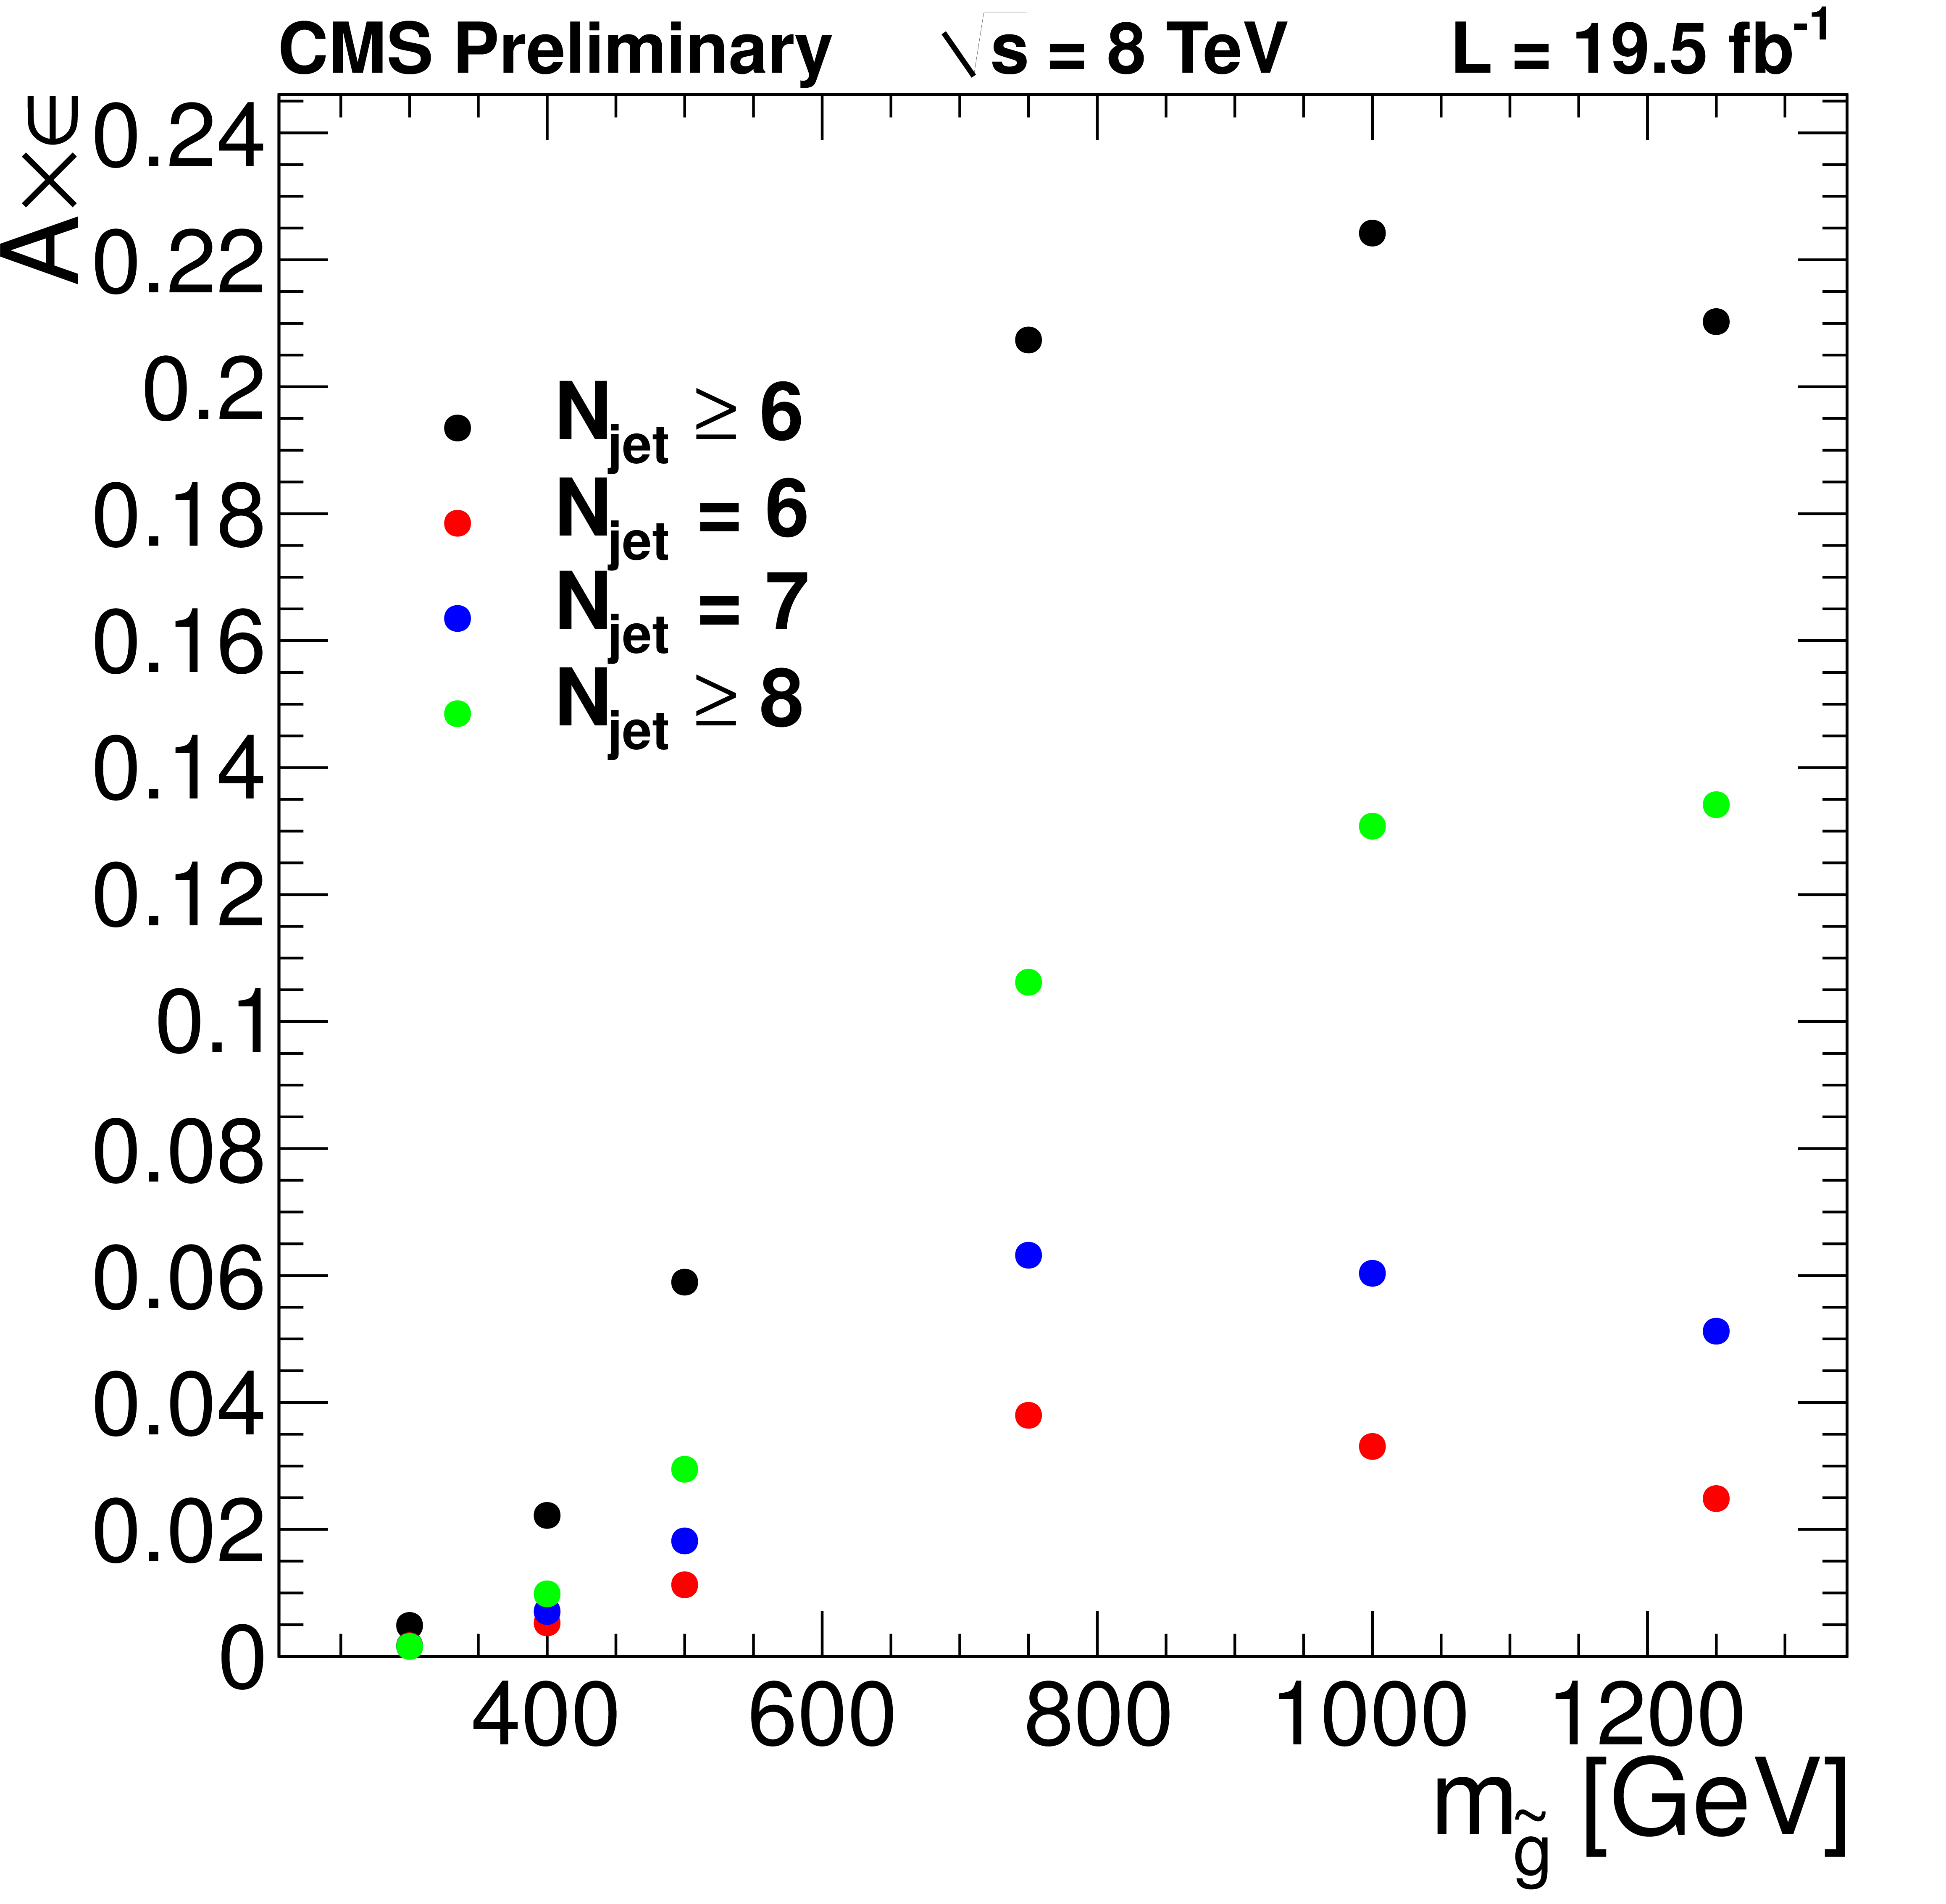
Figure 6-a:
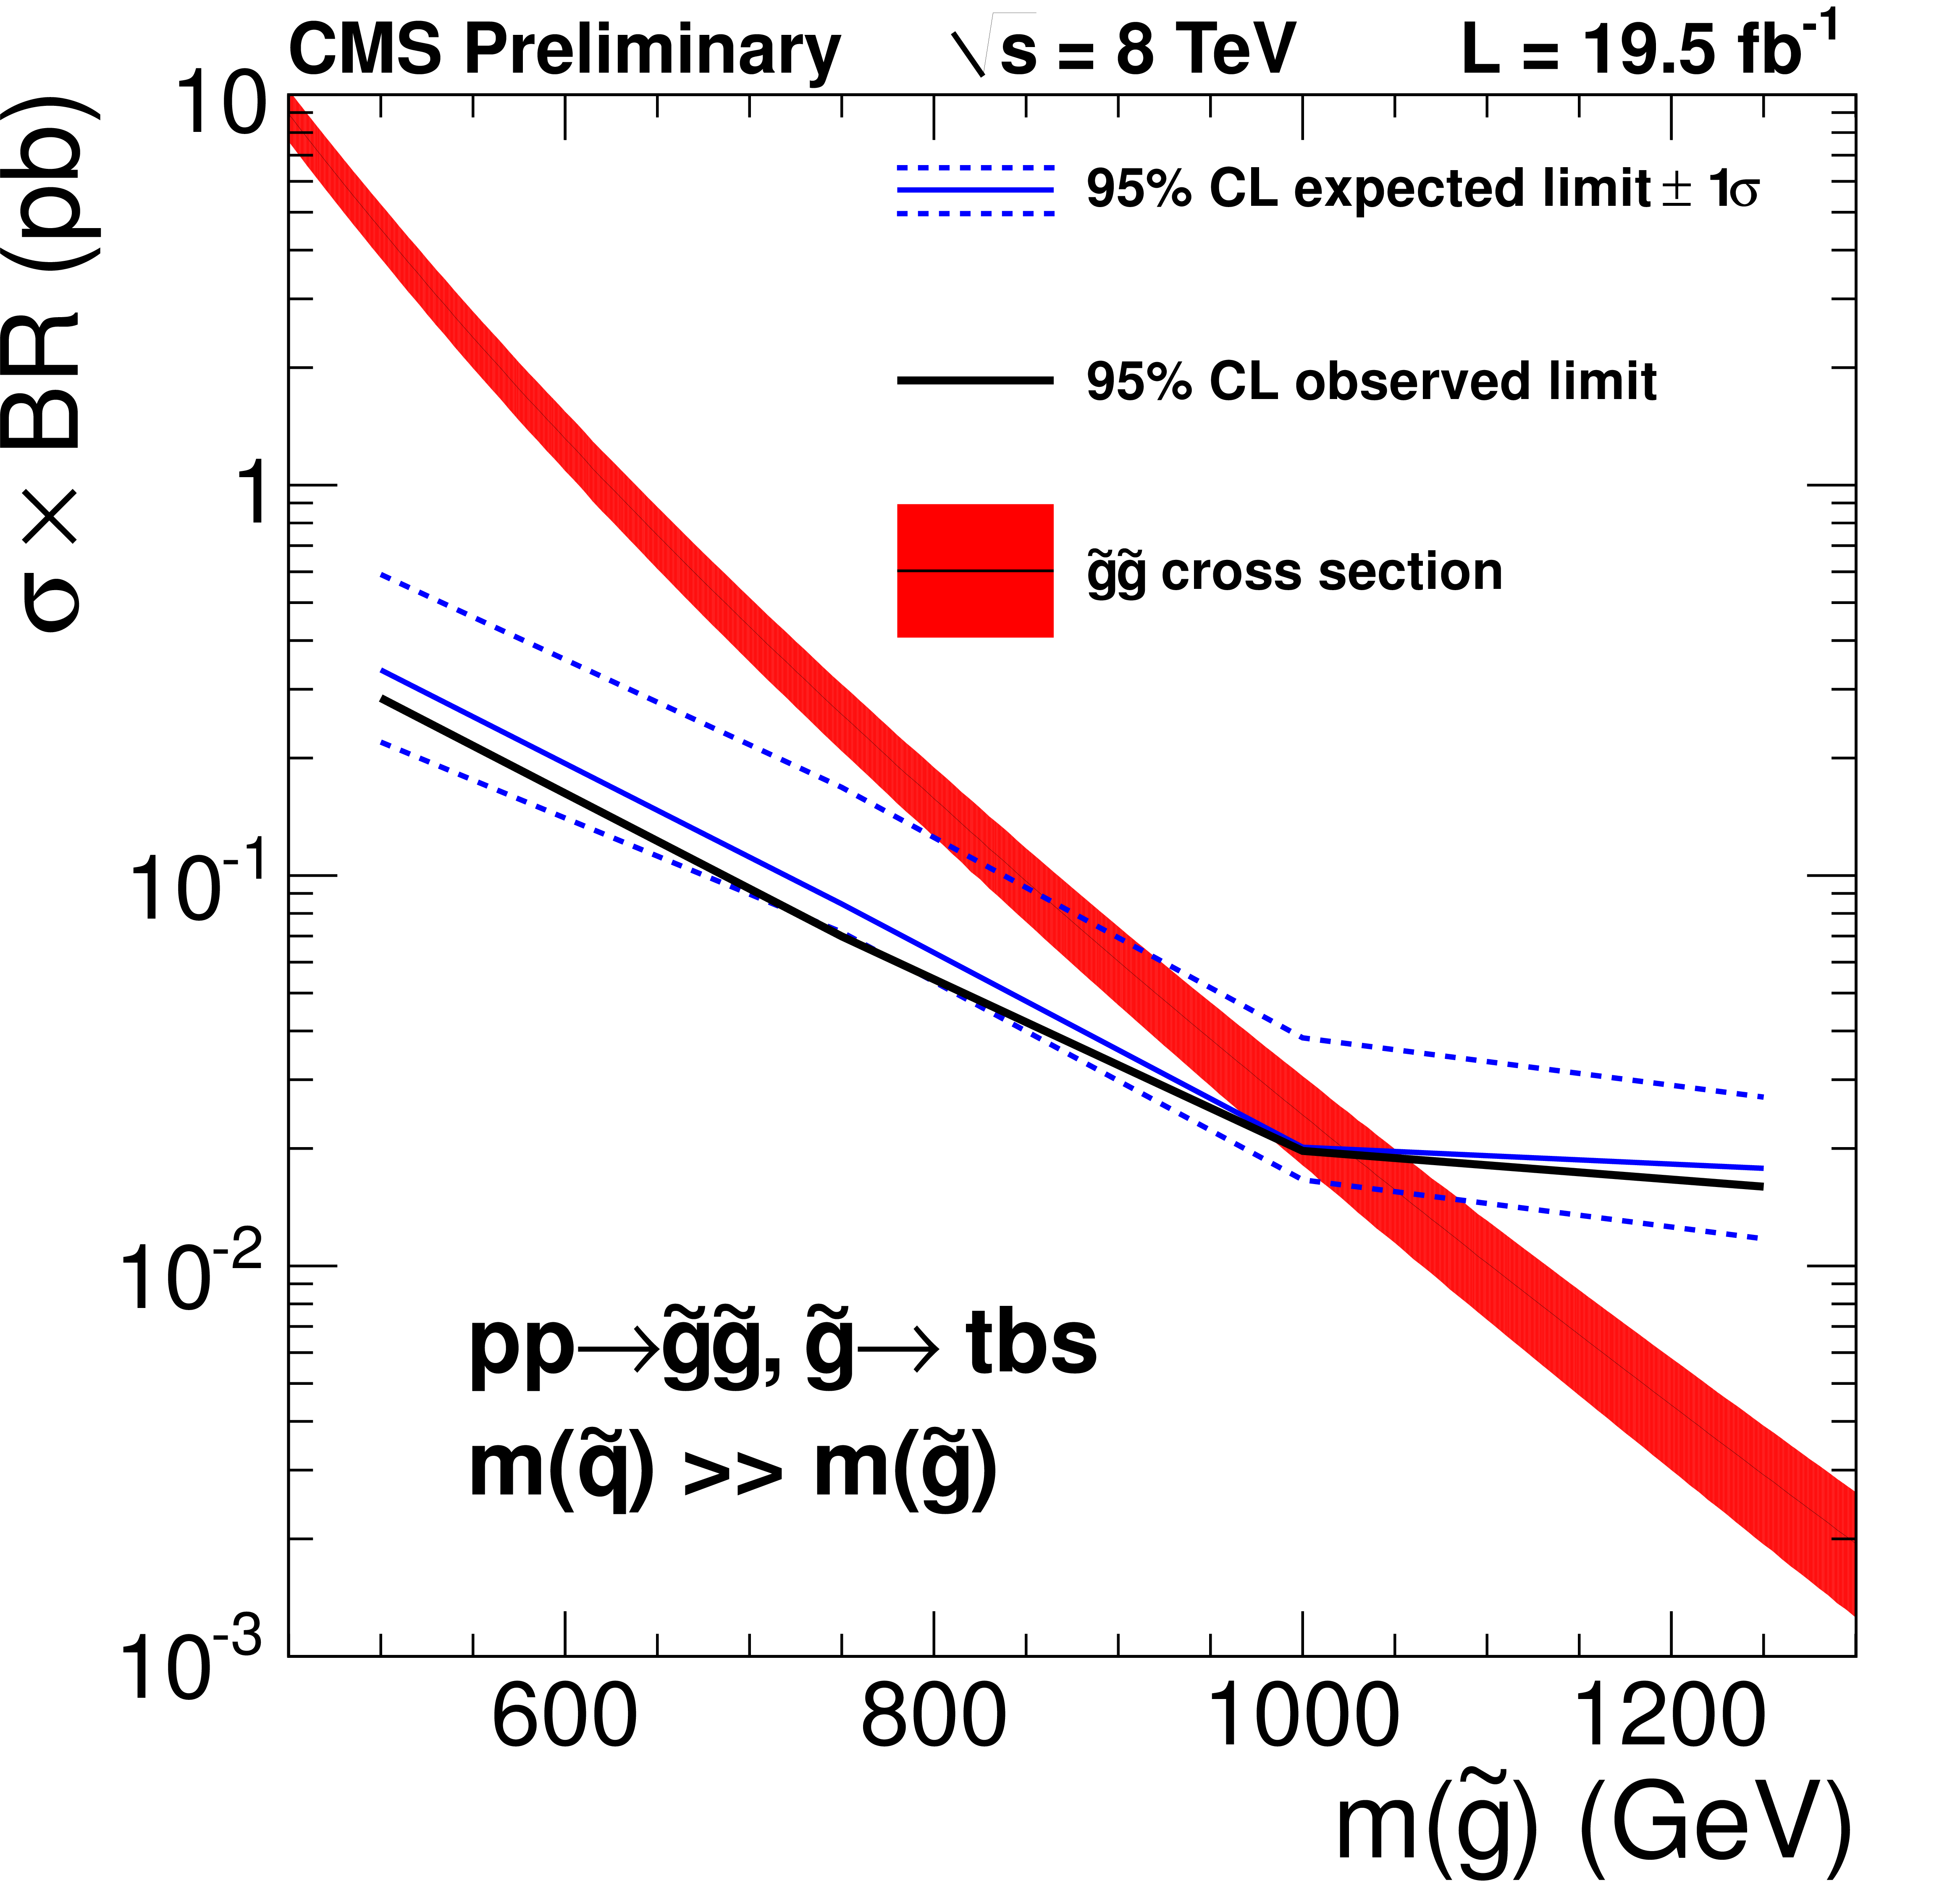
Signal efficiencies as a function of $m_{ \mathrm{ \tilde{g} } } $ for $N_b\geq $ 2, $H_{T}>$ 1.0 TeV, and $N_{\rm jet}\geq$ 6, together with the breakdown among $N_{\textrm {jet}}$ bins (a). Expected and observed limits in the all-hadronic $ \mathrm{ \tilde{g} \to t b s } $ analysis. The red band is the gluino pair production cross section (b). |
png ; pdf |
Figure 6-b:
Signal efficiencies as a function of $m_{ \mathrm{ \tilde{g} } } $ for $N_b\geq $ 2, $H_{T}>$ 1.0 TeV, and $N_{\rm jet}\geq$ 6, together with the breakdown among $N_{\textrm {jet}}$ bins (a). Expected and observed limits in the all-hadronic $ \mathrm{ \tilde{g} \to t b s } $ analysis. The red band is the gluino pair production cross section (b). |
|
|
Compact Muon Solenoid LHC, CERN |
|

|

|

|

|

|