

Compact Muon Solenoid
LHC, CERN
| CMS-PAS-SMP-15-008 | ||
| Measurements of the $\mathrm{ pp \to W^{\pm} \gamma \gamma }$ and $\mathrm{ pp \to Z \gamma \gamma } $ cross sections and limits on dimension-8 effective anomalous gauge couplings at $\sqrt{s} =$ 8 TeV | ||
| CMS Collaboration | ||
| February 2016 | ||
| Abstract: We present measurements of the cross sections of the $ \mathrm{ pp \to W ^{\pm} \gamma \gamma } $ and $ \mathrm{ pp \to Z \gamma\gamma } $ final states in the channels where the W boson decays to muons and Z boson decays to electrons or muons. The measurement uses 19.4 fb$^{-1}$ of 8 TeV data collected with the CMS experiment in 2012. We observe the signal for $\mathrm{ W^{\pm} \gamma \gamma } $ with a significance of 2.4$\sigma$ and we observe the $\mathrm{ Z \gamma \gamma }$ signal with a significance of 5.9$\sigma$. Upper limits are placed on anomalous quartic gauge couplings using the $\mathrm{ W^{\pm} \gamma \gamma } $ final state, with particular sensitivity to the $f_{\mathrm{T}, 0}$ coupling. The observed 95% confidence level limit on the $f_{\mathrm{T}, 0}$ coupling is $-37.5 < \frac{f_{\mathrm{T}, 0}}{\Lambda^4} < 38.1$. | ||
|
Links:
CDS record (PDF) ;
CADI line (restricted) ;
These preliminary results are superseded in this paper, JHEP 10 (2017) 072. The superseded preliminary plots can be found here. |
||
| Figures | |
png pdf |
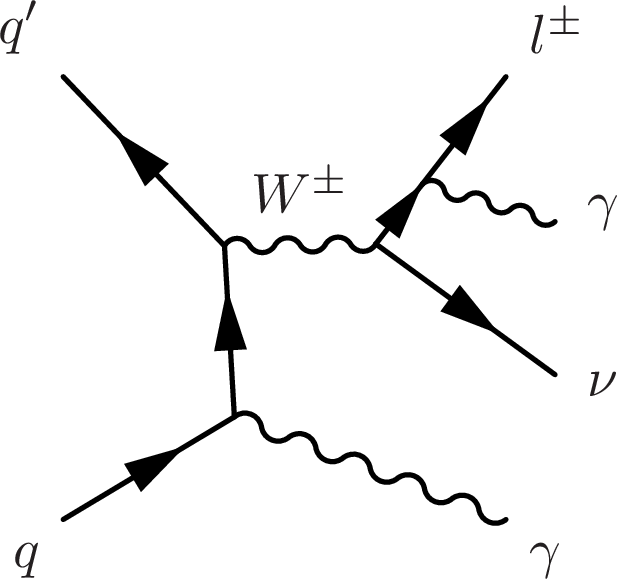
Figure 1-a:
Representative diagrams for $ \mathrm {W} ^{\pm }\gamma \gamma $ (a-c) and $ { \mathrm{ Z } \gamma \gamma } $ (d,e) production. In diagram (a) one photon originates as ISR and the other as FSR. In diagram (b) one photon results from ISR while the other participates in a TGC vertex. In diagram (c) both photons originate from a QGC vertex. The QGC vertex is of particular interest in this analysis because its strength can be enhanced by new physics. In diagram (d) $ {\mathrm{ Z } \gamma \gamma } $ production is shown with one ISR photon radiated from an incoming quark and one FSR photon from a Z decay lepton. In diagram (e) both photons are produced through ISR. The $ \mathrm{ Z Z } \gamma $, $ \mathrm{Z} \gamma \gamma $ and $ \mathrm{ Z Z } \gamma \gamma $ vertices are not allowed in the SM. |
png pdf |
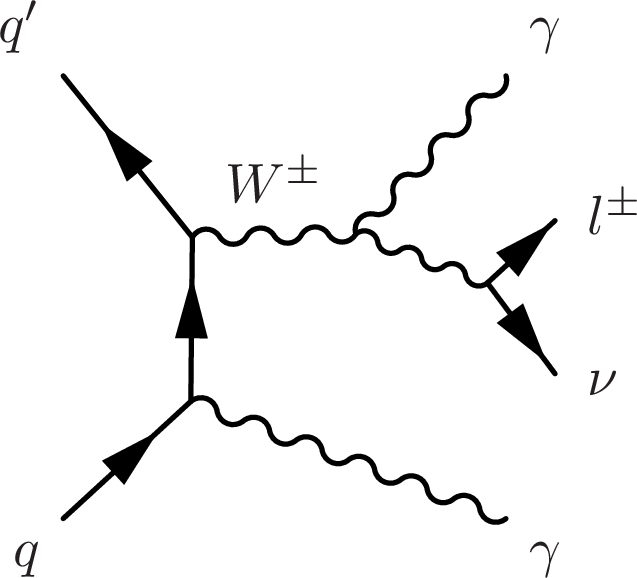
Figure 1-b:
Representative diagrams for $ \mathrm {W} ^{\pm }\gamma \gamma $ (a-c) and $ { \mathrm{ Z } \gamma \gamma } $ (d,e) production. In diagram (a) one photon originates as ISR and the other as FSR. In diagram (b) one photon results from ISR while the other participates in a TGC vertex. In diagram (c) both photons originate from a QGC vertex. The QGC vertex is of particular interest in this analysis because its strength can be enhanced by new physics. In diagram (d) $ {\mathrm{ Z } \gamma \gamma } $ production is shown with one ISR photon radiated from an incoming quark and one FSR photon from a Z decay lepton. In diagram (e) both photons are produced through ISR. The $ \mathrm{ Z Z } \gamma $, $ \mathrm{Z} \gamma \gamma $ and $ \mathrm{ Z Z } \gamma \gamma $ vertices are not allowed in the SM. |
png pdf |
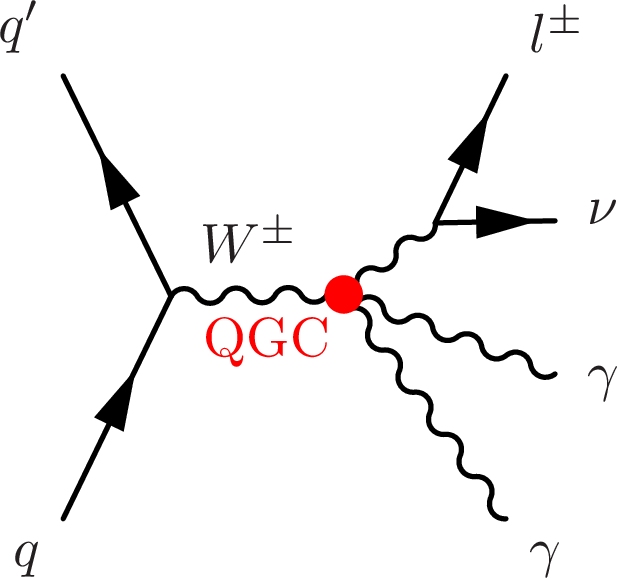
Figure 1-c:
Representative diagrams for $ \mathrm {W} ^{\pm }\gamma \gamma $ (a-c) and $ { \mathrm{ Z } \gamma \gamma } $ (d,e) production. In diagram (a) one photon originates as ISR and the other as FSR. In diagram (b) one photon results from ISR while the other participates in a TGC vertex. In diagram (c) both photons originate from a QGC vertex. The QGC vertex is of particular interest in this analysis because its strength can be enhanced by new physics. In diagram (d) $ {\mathrm{ Z } \gamma \gamma } $ production is shown with one ISR photon radiated from an incoming quark and one FSR photon from a Z decay lepton. In diagram (e) both photons are produced through ISR. The $ \mathrm{ Z Z } \gamma $, $ \mathrm{Z} \gamma \gamma $ and $ \mathrm{ Z Z } \gamma \gamma $ vertices are not allowed in the SM. |

png pdf |
Figure 1-d:
Representative diagrams for $ \mathrm {W} ^{\pm }\gamma \gamma $ (a-c) and $ { \mathrm{ Z } \gamma \gamma } $ (d,e) production. In diagram (a) one photon originates as ISR and the other as FSR. In diagram (b) one photon results from ISR while the other participates in a TGC vertex. In diagram (c) both photons originate from a QGC vertex. The QGC vertex is of particular interest in this analysis because its strength can be enhanced by new physics. In diagram (d) $ {\mathrm{ Z } \gamma \gamma } $ production is shown with one ISR photon radiated from an incoming quark and one FSR photon from a Z decay lepton. In diagram (e) both photons are produced through ISR. The $ \mathrm{ Z Z } \gamma $, $ \mathrm{Z} \gamma \gamma $ and $ \mathrm{ Z Z } \gamma \gamma $ vertices are not allowed in the SM. |

png pdf |
Figure 1-e:
Representative diagrams for $ \mathrm {W} ^{\pm }\gamma \gamma $ (a-c) and $ { \mathrm{ Z } \gamma \gamma } $ (d,e) production. In diagram (a) one photon originates as ISR and the other as FSR. In diagram (b) one photon results from ISR while the other participates in a TGC vertex. In diagram (c) both photons originate from a QGC vertex. The QGC vertex is of particular interest in this analysis because its strength can be enhanced by new physics. In diagram (d) $ {\mathrm{ Z } \gamma \gamma } $ production is shown with one ISR photon radiated from an incoming quark and one FSR photon from a Z decay lepton. In diagram (e) both photons are produced through ISR. The $ \mathrm{ Z Z } \gamma $, $ \mathrm{Z} \gamma \gamma $ and $ \mathrm{ Z Z } \gamma \gamma $ vertices are not allowed in the SM. |

png pdf |
Figure 2:
Validation of the data-driven estimates of misidentified jets signal-like events that have 15 GeV $ < p_{T}^{\text {sublead}} <$ 25 GeV. The misidentified jet contribution is estimated using data-driven techniques. The $ \mathrm {W} ^{\pm }\gamma \gamma $, $ { \mathrm{ Z } \gamma \gamma } $, and other multiboson contributions are given by simulation. The hatched area represents the combined uncertainty from all background sources. |

png pdf |
Figure 3:
The $ {p_{\mathrm {T}}} $ of the diphoton system for the $ \mathrm {W} ^{\pm }\gamma \gamma $ analysis. The jet misidentification background contribution is determined from data-driven methods. The $ { \mathrm{ Z } \gamma \gamma } $ and other multiboson contributions are estimated using simulation and are normalized to their production cross section. The hatched band represents the total uncertainty of all background sources, combined in quadrature. The last bin includes all events having $p_{T}^{\gamma \gamma } > $ 80 GeV, but the normalization is to the displayed bin width. |

png pdf |
Figure 4-a:
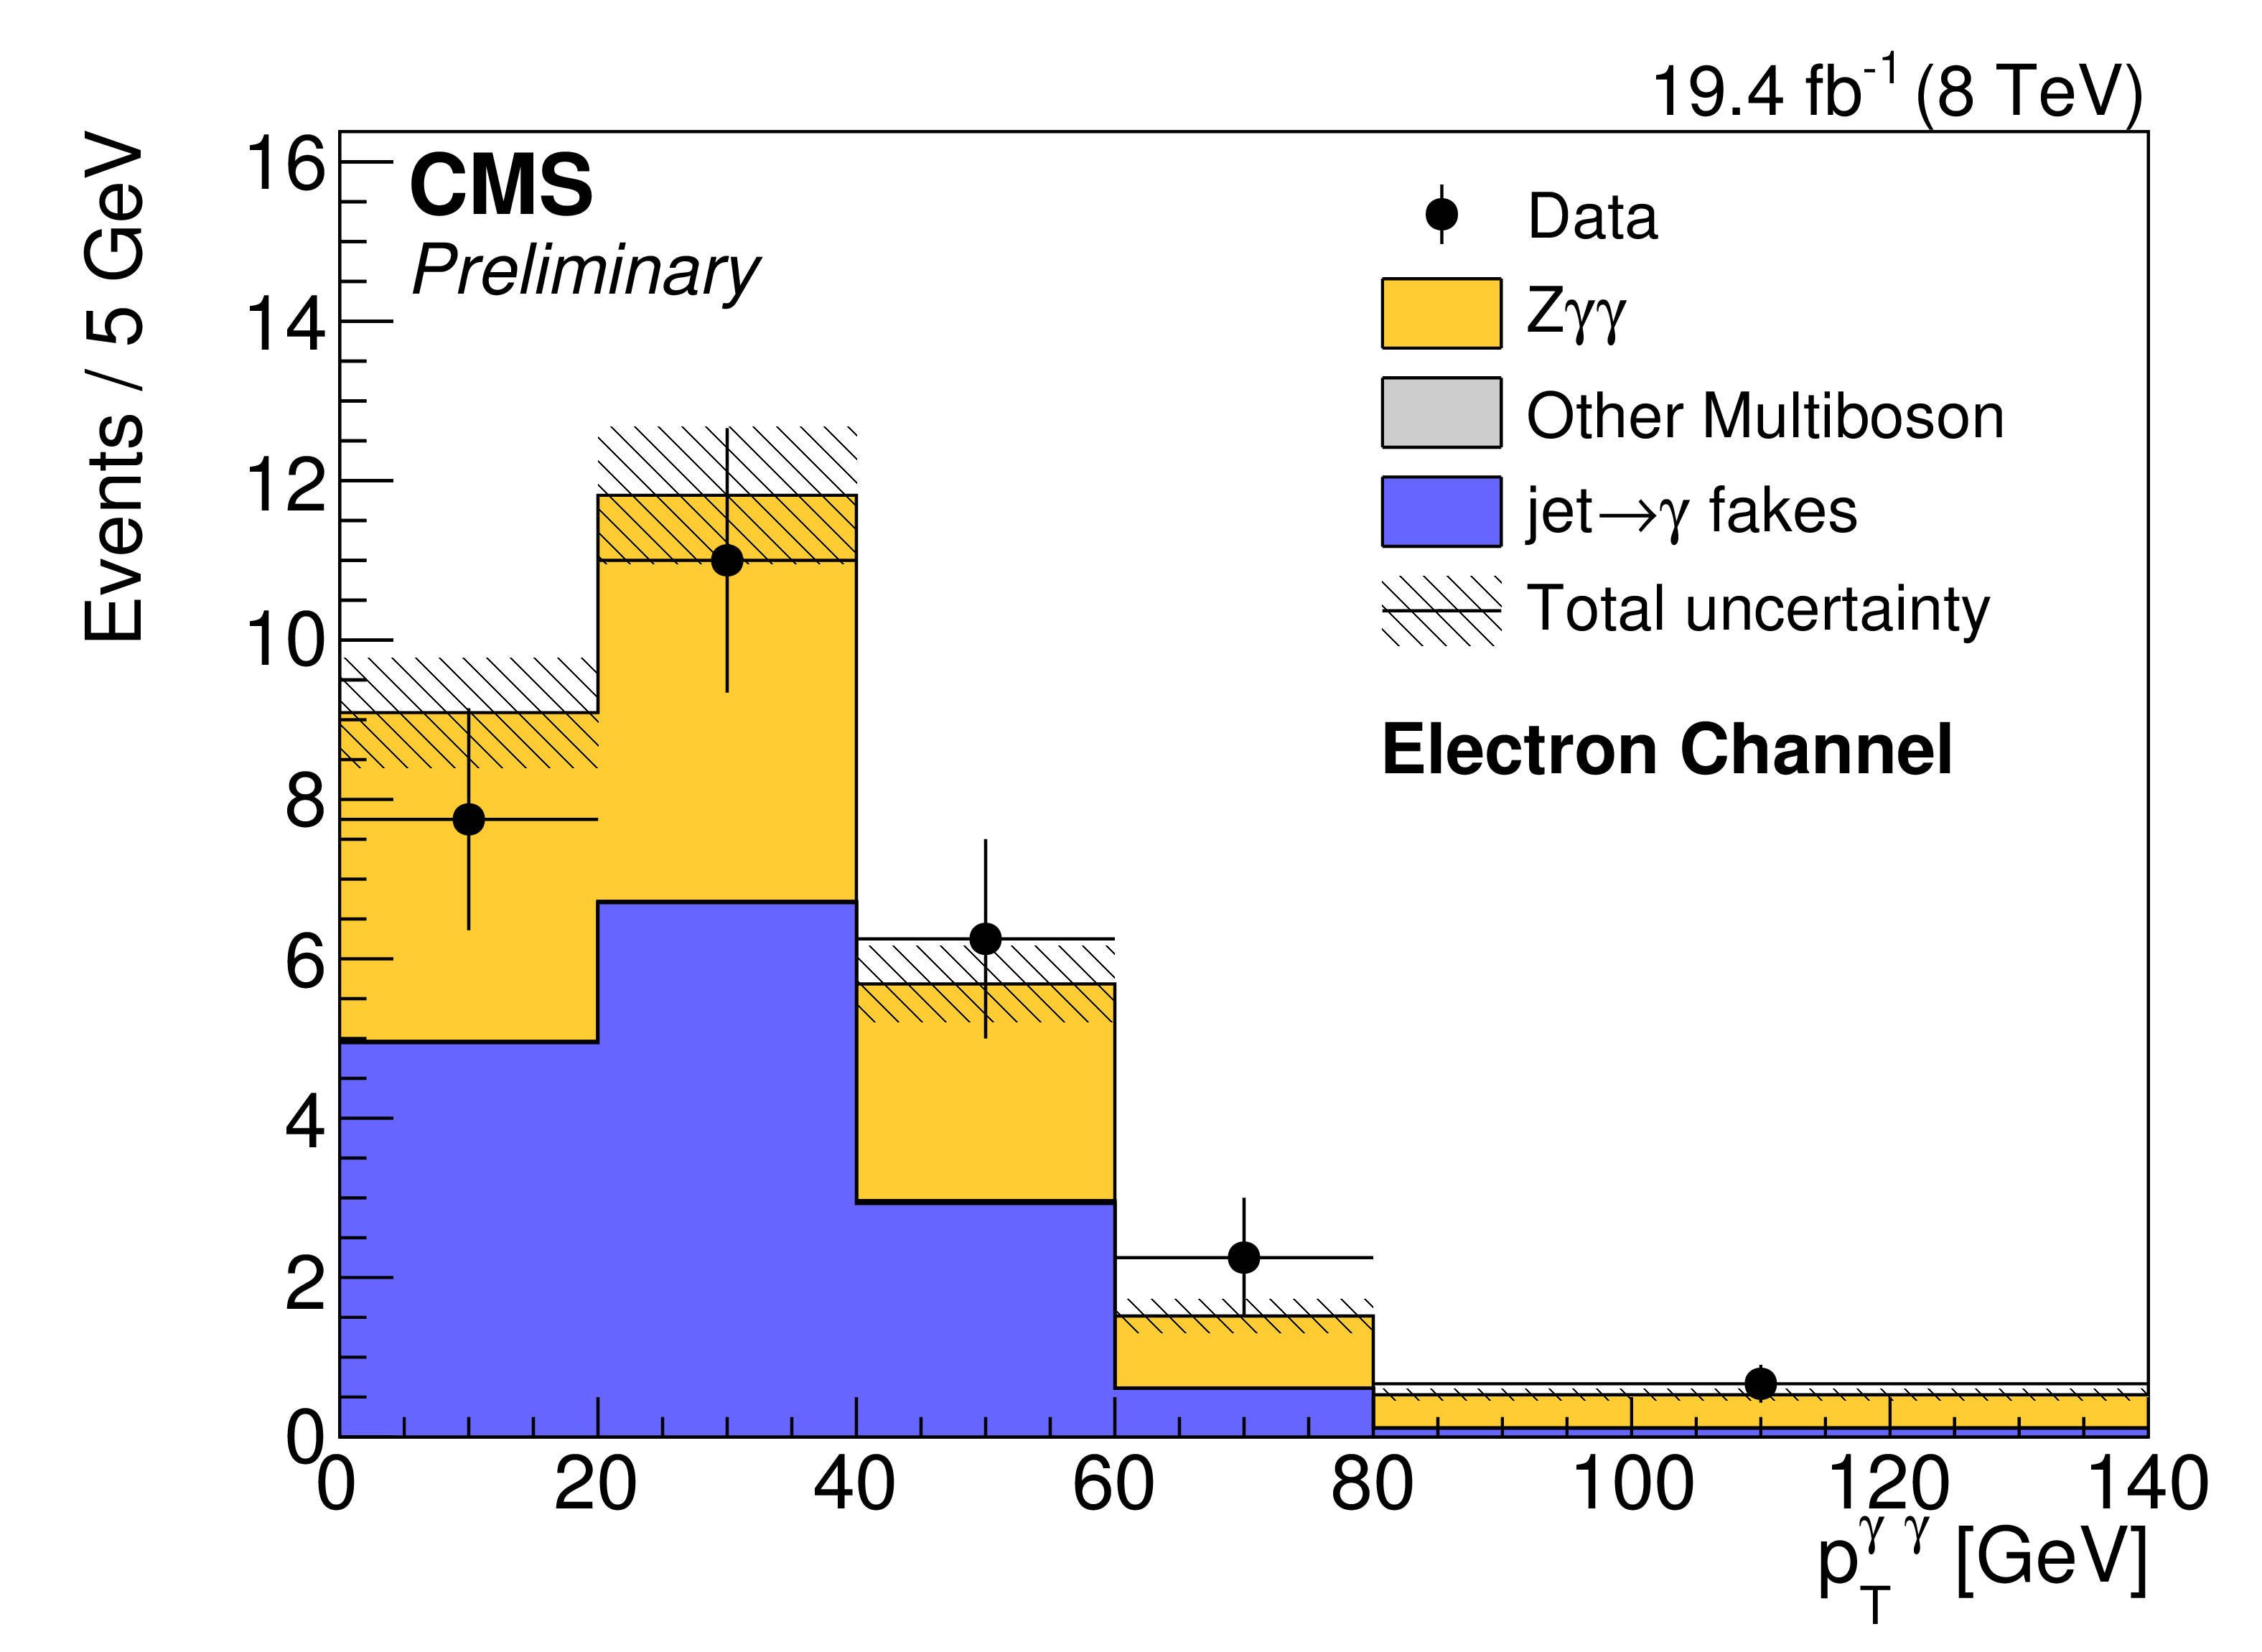
The $ {p_{\mathrm {T}}} $ of the diphoton system in the muon (left) and electron (right) channels for the $ { \mathrm{ Z } \gamma \gamma } $ analysis. The jet misidentification background contributions are determined from a data-driven estimate. The other multiboson background contributions are estimated using simulation and are normalized to their production cross section. The hatched band represents the total uncertainty of all background sources, combined in quadrature. The last bin includes all events having $p_{T}^{\gamma \gamma } >$ 80 GeV, but the normalization is to the displayed bin width. |
png pdf |
Figure 4-b:
The $ {p_{\mathrm {T}}} $ of the diphoton system in the muon (left) and electron (right) channels for the $ { \mathrm{ Z } \gamma \gamma } $ analysis. The jet misidentification background contributions are determined from a data-driven estimate. The other multiboson background contributions are estimated using simulation and are normalized to their production cross section. The hatched band represents the total uncertainty of all background sources, combined in quadrature. The last bin includes all events having $p_{T}^{\gamma \gamma } >$ 80 GeV, but the normalization is to the displayed bin width. |

png pdf |
Figure 5:
Observed data with predicted background contributions, expected SM $ \mathrm {W} ^{\pm }\gamma \gamma $ signal and the contribution from an aQGC where the $ {f_{\mathrm {T},0}} $ parameter is 50 TeV$^{-4}$ (dashed line). |

png pdf |
Figure 6:
Scan of the negative log likelihood ratio as a function of the $f_{T0}$ parameter. The expected distribution is shown in black and the observed in red. The 1$\sigma $ and 2$\sigma $ exclusion levels are shown in green and yellow. The shape of the likelihood ratio for the observed data is a result of a small excess of observed data over the SM prediction. The excess does not exclude the SM at the 68% confidence level, but the observed limits become somewhat weaker than the expected limits. |
| Tables | |
png pdf |
Table 1:
Number of predicted background events compared to the observed data and expected signal for the $ \mathrm{W} \gamma \gamma $ analysis, having photons with $ {p_{\mathrm {T}}} >$ 25 GeV. The results are presented separately in each region and also as the sum over the regions. The background contributions are summed in the 'Total Background' column with the correlations between various components of the uncertainties combined appropriately. The signal prediction is given by the nominal signal simulation sample normalized to the recorded luminosity. |

png pdf |
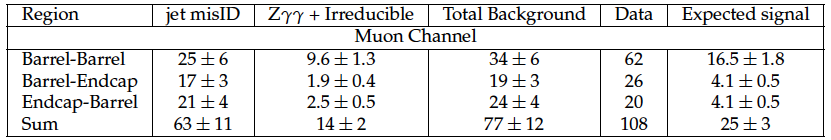
Table 2:
Number of predicted background events compared to the observed data and expected signal for the $ \mathrm{Z} \gamma \gamma $ analysis, having photons with $ {p_{\mathrm {T}}} >$ 15 GeV. The results are presented separately in each region and also as the sum over the regions. The background contributions are summed in the 'Total Background' column with the correlations between various components of the uncertainties combined appropriately. The signal prediction is given by the nominal signal simulation sample normalized to the recorded luminosity. |
png pdf |
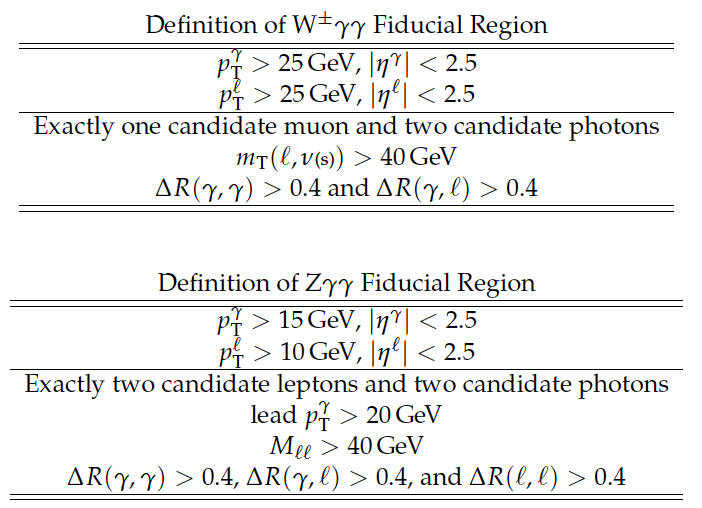
Table 3:
Fiducial definitions for the $ \mathrm{W} \gamma \gamma $ analysis (top) and $ \mathrm{Z} \gamma \gamma $ analysis (bottom). Leptons are dressed such that the four-momenta of photons within a cone of $\Delta R <$ 0.1 are added to the four-momentum of the lepton. |

png pdf |
Table 4:
Fiducial acceptance for the $ \mathrm{W} \gamma \gamma $ and $ \mathrm{Z} \gamma \gamma $ analyses. The acceptances are the ratios of reconstructed events passing the analysis selection criteria to Monte Carlo ``Truth'' events passing each analysis's fiducial definition. The removal of $\tau $ decays is accomplished by dividing by the fraction of events that do not contain a $\tau $ decay, $(1- {f_{\tau }})$. |
png pdf |
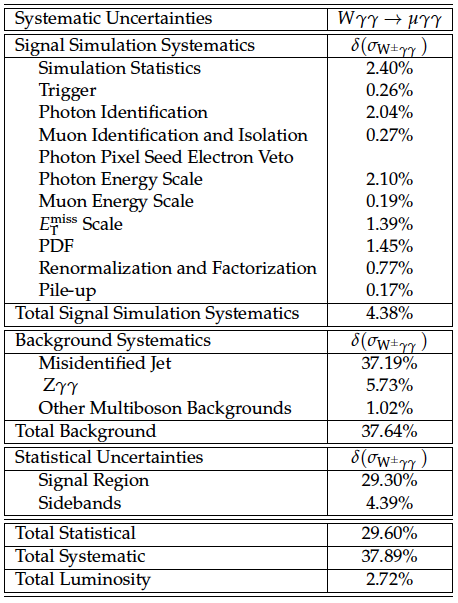
Table 5:
Systematic and statistical uncertainties affecting the $ \mathrm{W} \gamma \gamma $ fiducial cross section for events with a leading photon having $ {p_{\mathrm {T}}} >$ 25 GeV. |
png pdf |
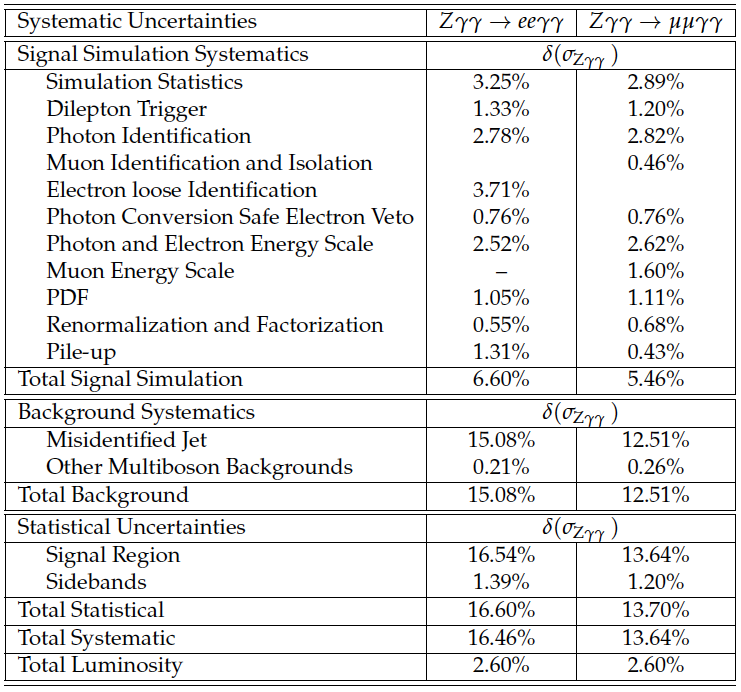
Table 6:
Systematic and statistical uncertainties affecting the $ \mathrm{Z} \gamma \gamma $ fiducial cross section for events with a leading photon having $ {p_{\mathrm {T}}} > $ 15 GeV. |
png pdf |
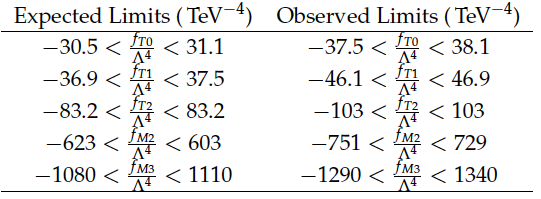
Table 7:
95% exclusion limits on the anomalous couplings. |
|
|
Compact Muon Solenoid LHC, CERN |
|

|

|

|

|

|