

Compact Muon Solenoid
LHC, CERN
| CMS-PAS-SMP-15-007 | ||
| Measurement of the double-differential inclusive jet cross section at $\sqrt{s} =$ 13 TeV | ||
| CMS Collaboration | ||
| December 2015 | ||
| Abstract: A measurement of the double-differential inclusive jet cross section, as a function of jet transverse momentum $p_\mathrm{T}$ and absolute jet rapidity $|y|$, is presented. The analysis is based on a data set of proton-proton collisions acquired by the CMS experiment at the LHC during 2015 at a center-of-mass energy of 13 TeV. The collected data correspond to an integrated luminosity of 72 pb$^{-1}$ for rapidities up to $|y|=$ 3 and 45 pb$^{-1}$ for the forward rapidity region 3.2 $<|y|<$ 4.7. Jets are reconstructed with the anti-$k_{\mathrm{T}}$ clustering algorithm for two jet size parameters $R=$ 0.7 and $R=$ 0.4 in a phase space region covering jet $p_\mathrm{T}$ up to 2 TeV and jet rapidity up to $|y| =$ 4.7. The results are compared to fixed-order predictions of perturbative QCD and to simulations using various Monte Carlo event generators including parton showers, hadronisation, and multiparton interactions. | ||
|
Links:
CDS record (PDF) ;
CADI line (restricted) ;
These preliminary results are superseded in this paper, EPJC 76 (2016) 451. The superseded preliminary plots can be found here. |
||
| Figures | |
png ; pdf ; |
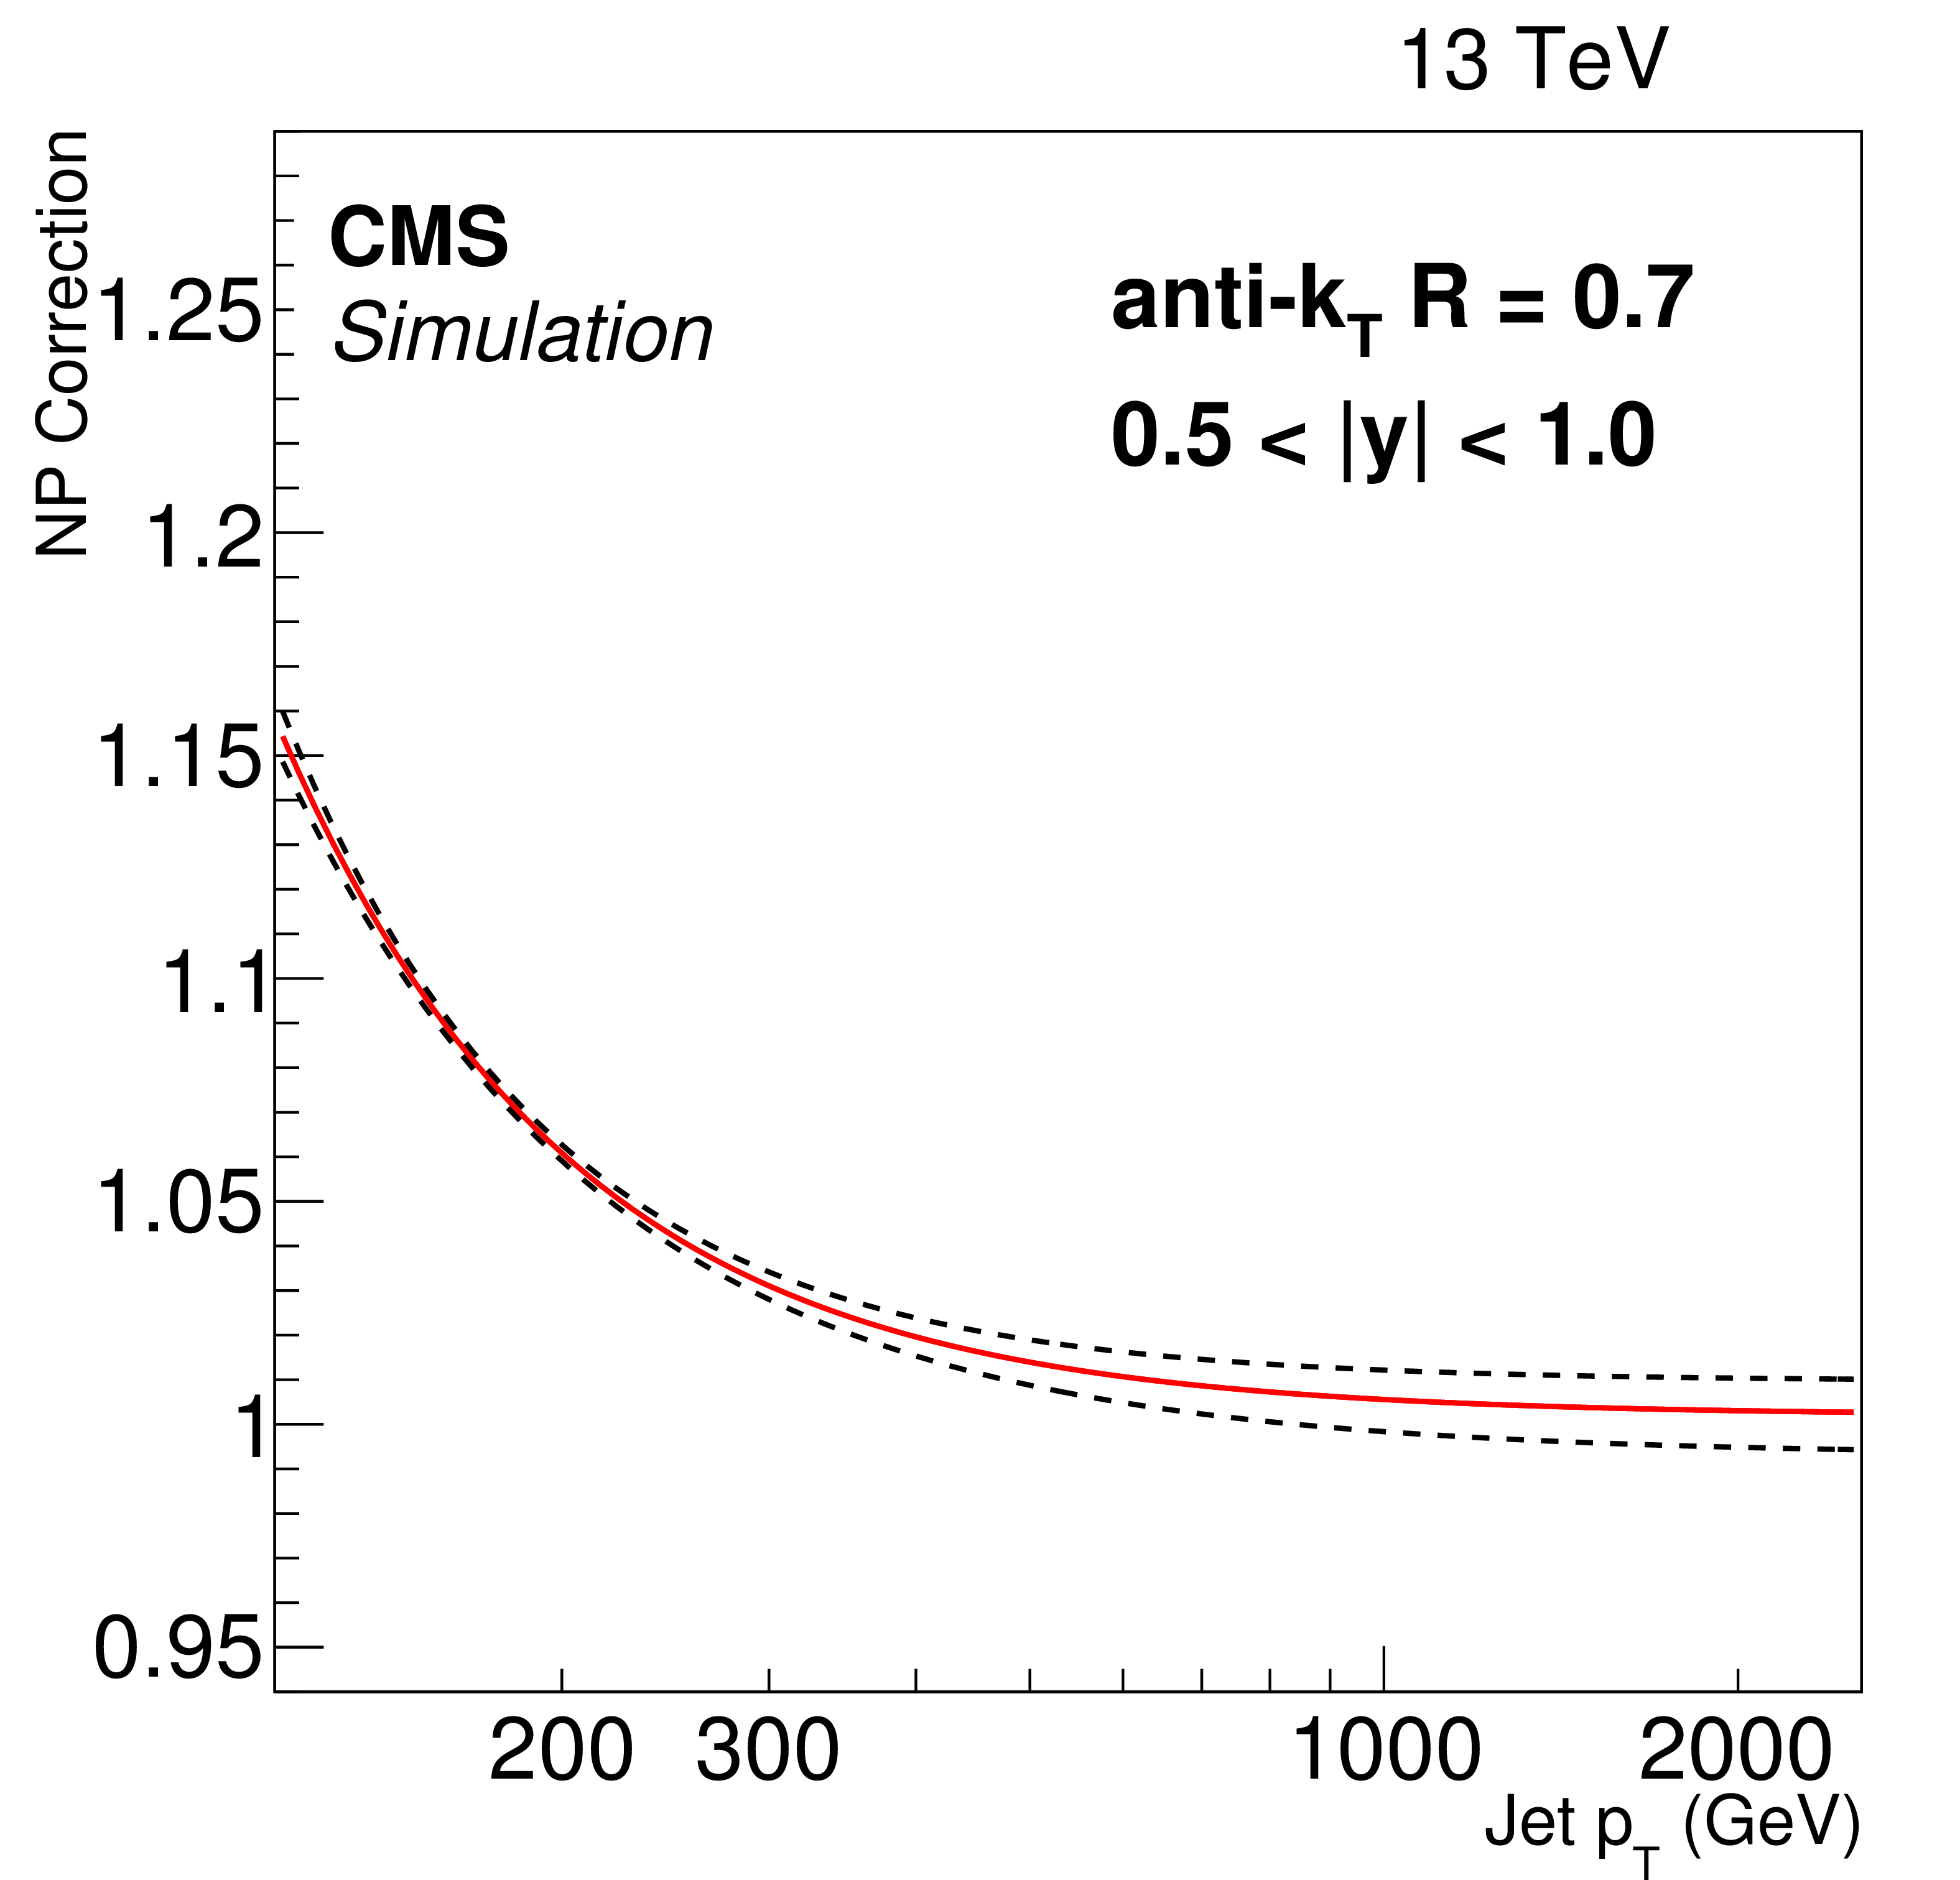
Figure 1-a:
Fits to the nonperturbative corrections obtained for inclusive AK7 jet cross sections as a function of jet $p_{\textrm {T}}$ for two rapidity bins: 0.5 $< |y| <$ 1.0 (left) and 2.5 $< |y| <$ 3.0 (right). |
png ; pdf ; |
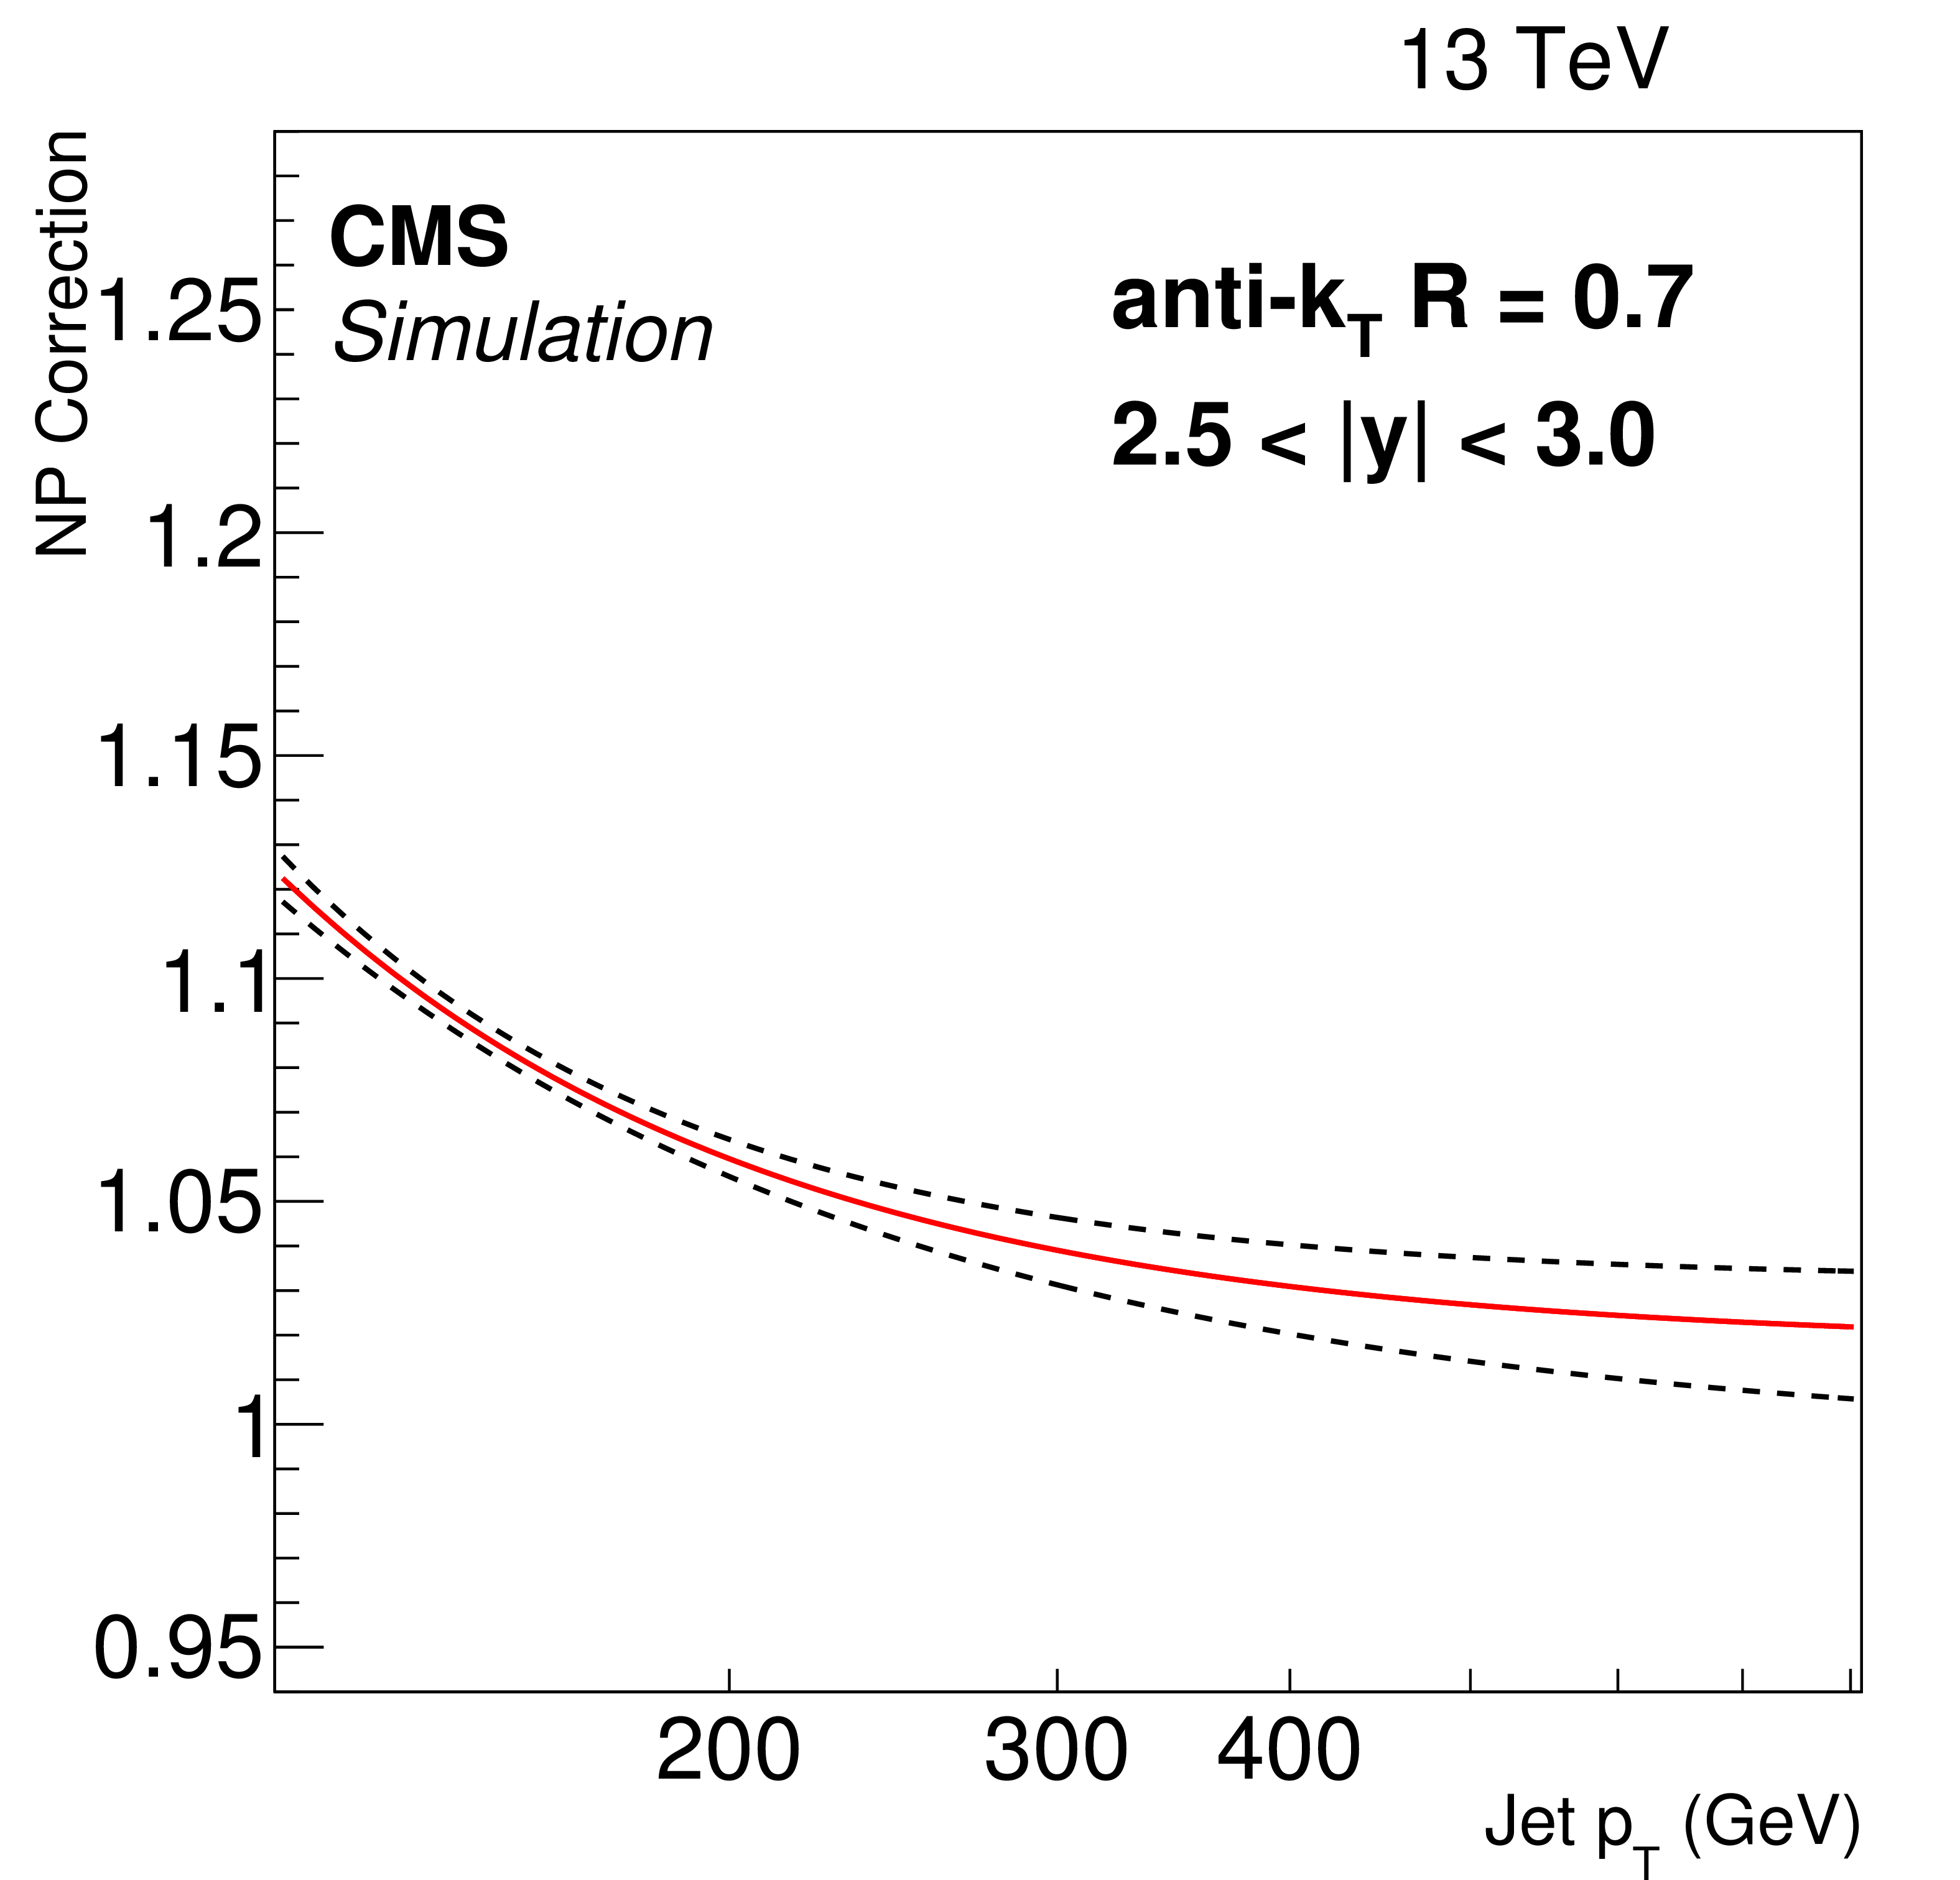
Figure 1-b:
Fits to the nonperturbative corrections obtained for inclusive AK7 jet cross sections as a function of jet $p_{\textrm {T}}$ for two rapidity bins: 0.5 $< |y| <$ 1.0 (left) and 2.5 $< |y| <$ 3.0 (right). |
png ; pdf ; |
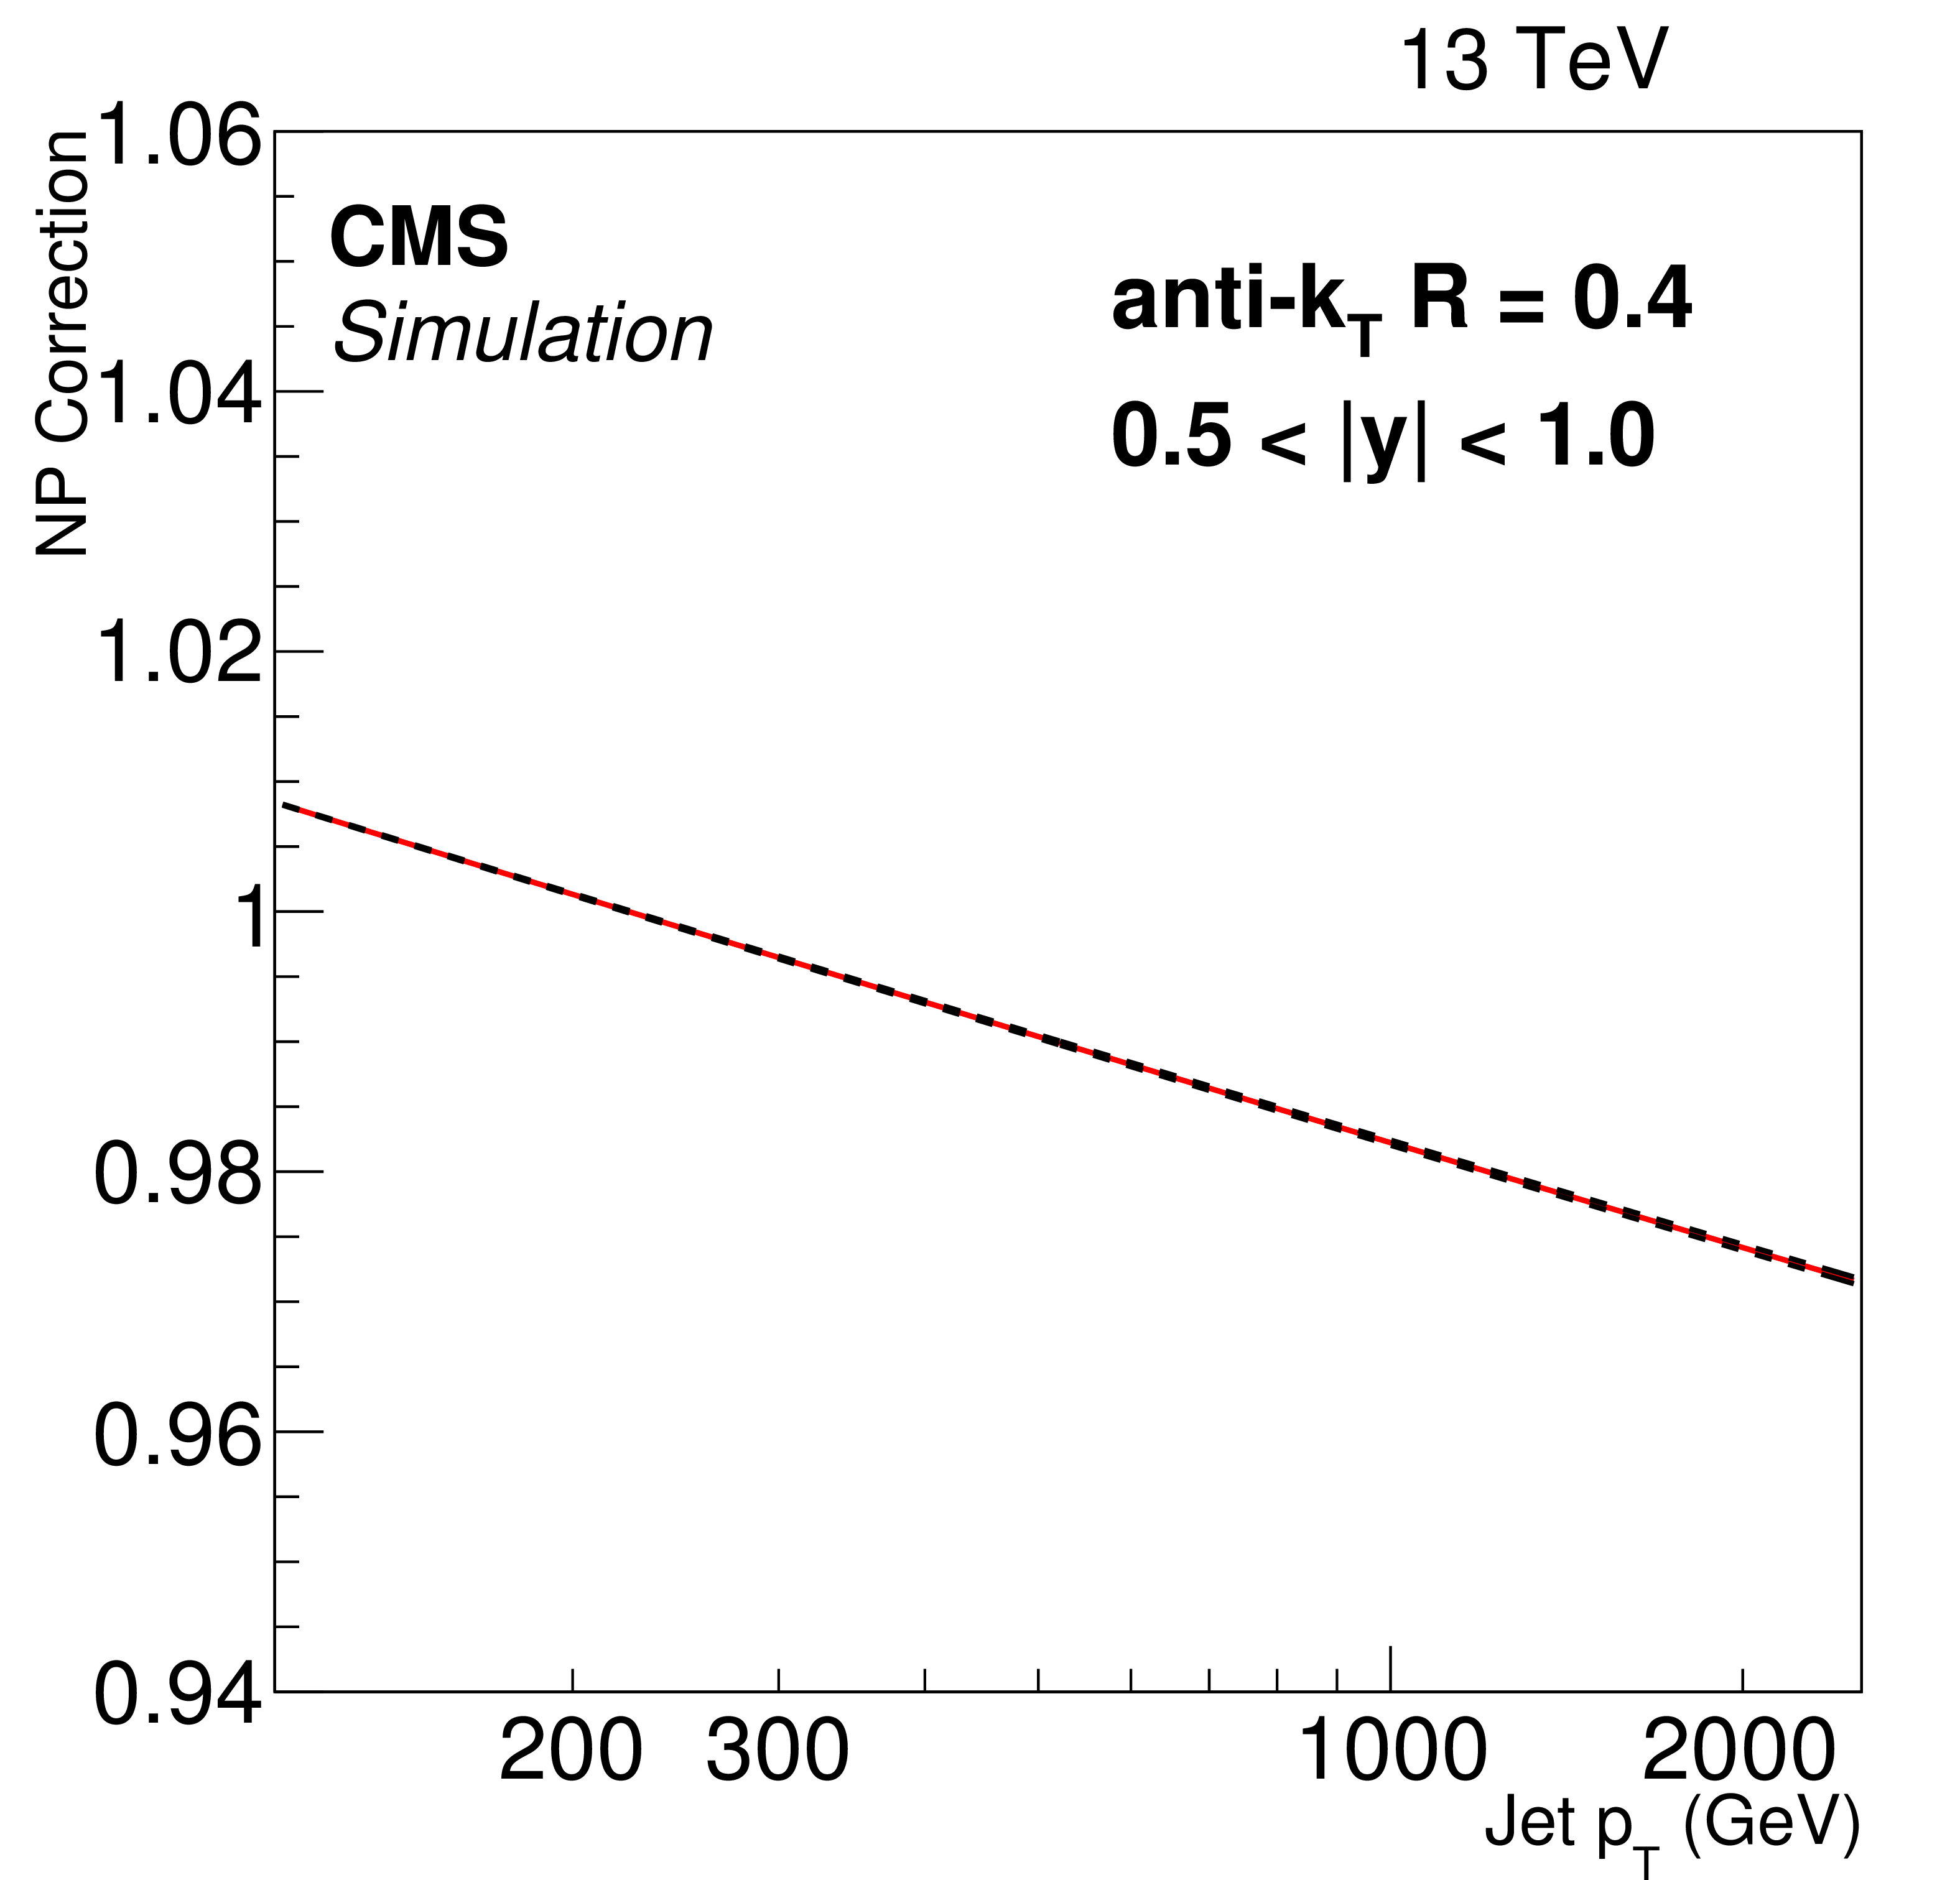
Figure 2-a:
Fits to the nonperturbative corrections obtained for inclusive AK4 jet cross sections as a function of jet $p_{\textrm {T}}$ for two rapidity bins: 0.5 $< |y| <$ 1.0 (left) and 2.5 $< |y| <$ 3.0 (right). |
png ; pdf ; |
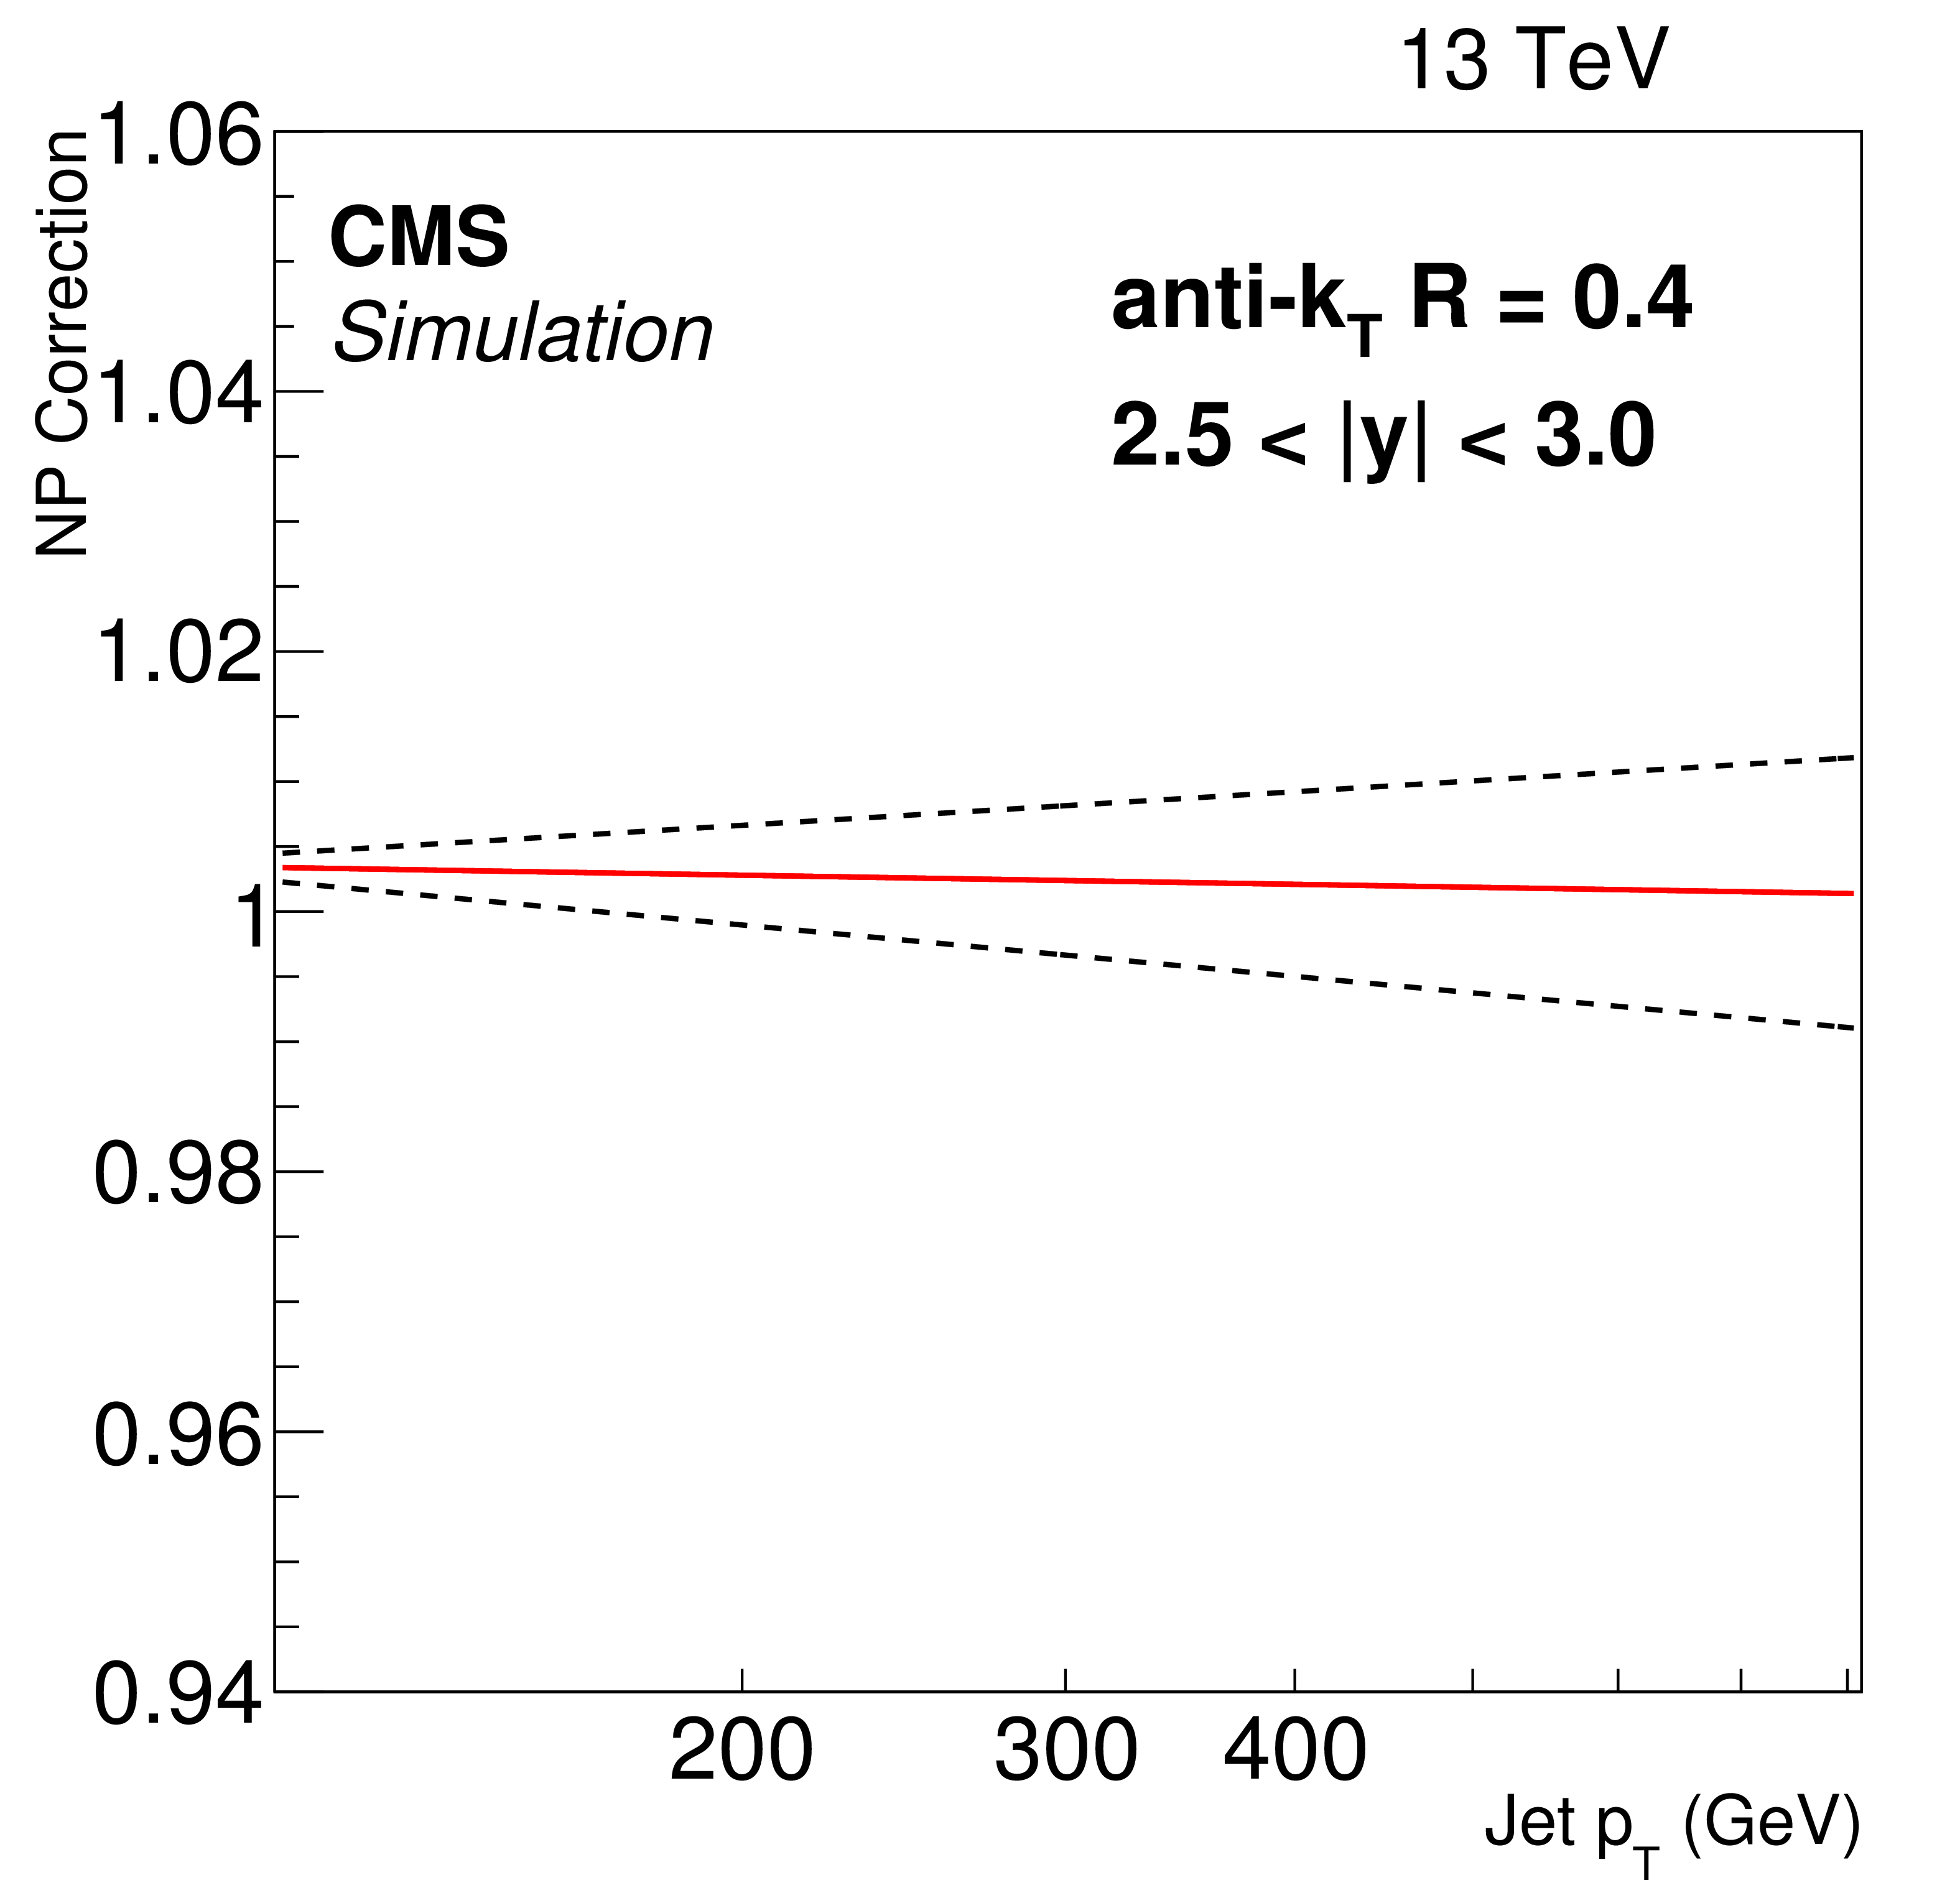
Figure 2-b:
Fits to the nonperturbative corrections obtained for inclusive AK4 jet cross sections as a function of jet $p_{\textrm {T}}$ for two rapidity bins: 0.5 $< |y| <$ 1.0 (left) and 2.5 $< |y| <$ 3.0 (right). |
png ; pdf ; |
Figure 3-a:
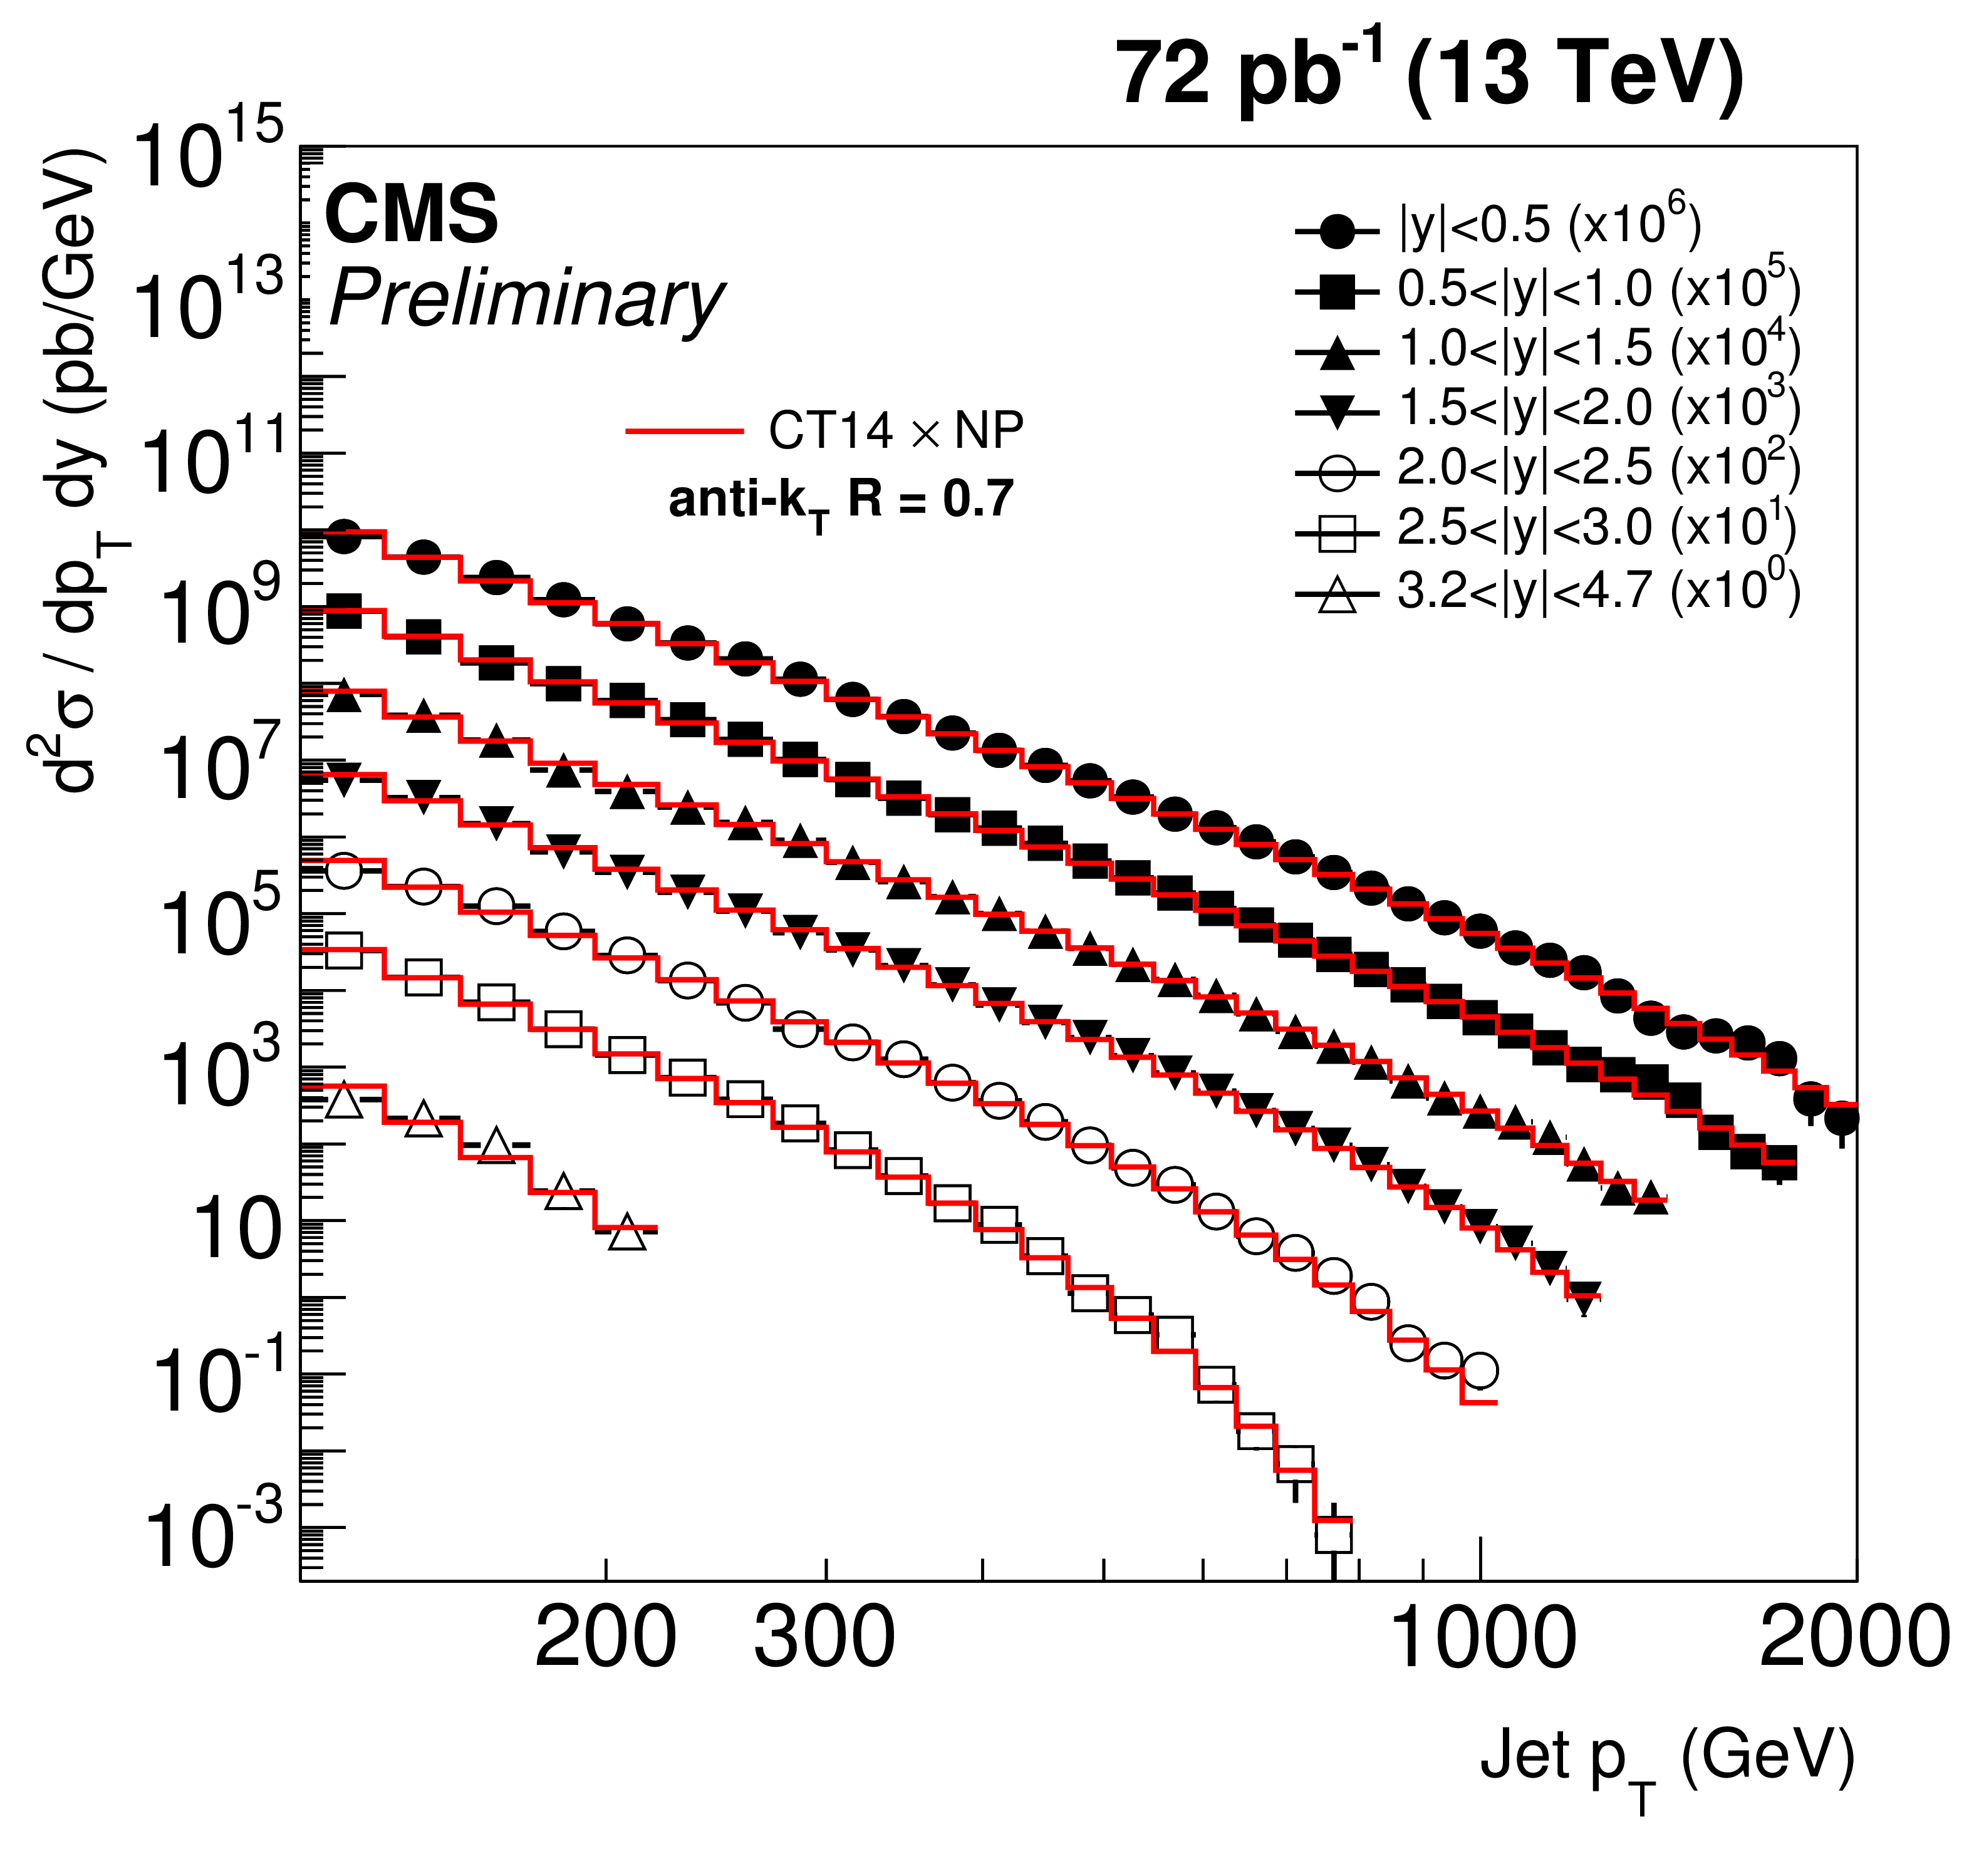
Double-differential inclusive jet cross section as function of jet $ {p_{\mathrm {T}}} $. On the (a) plot, data (points) and NLOJet++ predictions based on CT14 PDF set corrected for the NP factor (line). On the (b) plot, data (points) and predictions from POWHEG + PYTHIA8 with tune CUETM1 (line). Jets are clustered with the anti-$ {k_{\mathrm {T}}} $ algorithm ($R =$ 0.7). |
png ; pdf ; |
Figure 3-b:
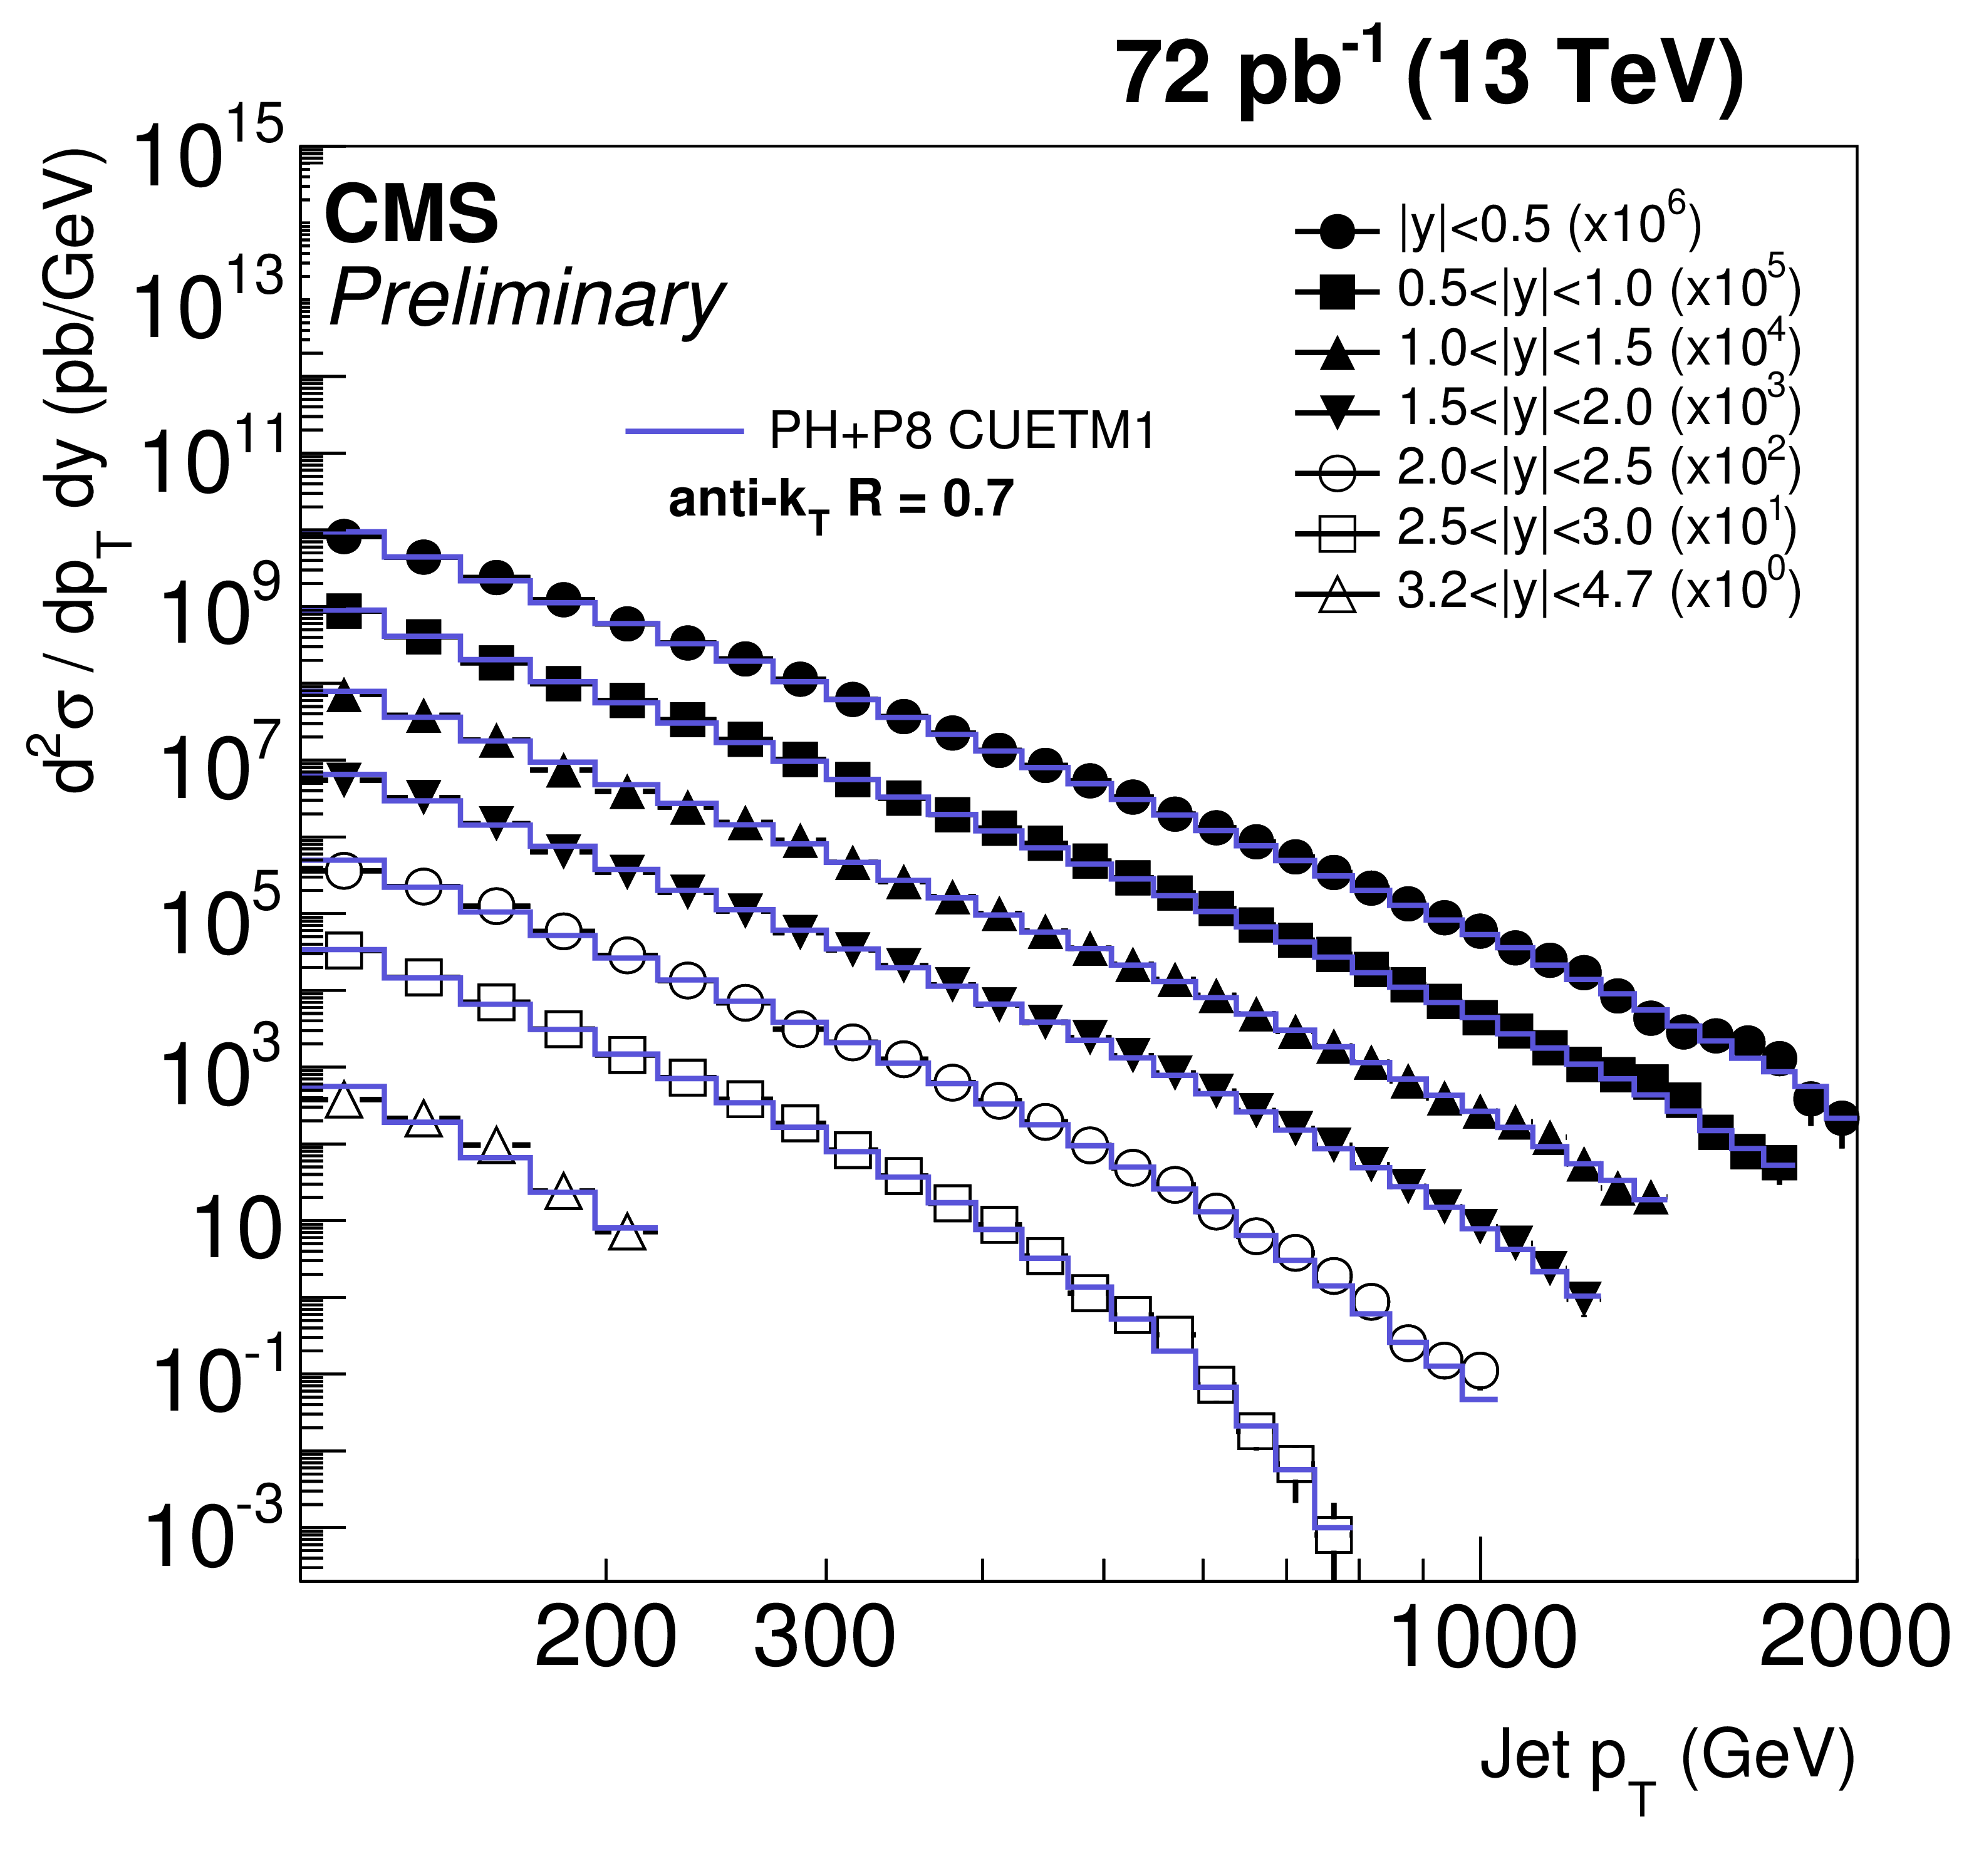
Double-differential inclusive jet cross section as function of jet $ {p_{\mathrm {T}}} $. On the (a) plot, data (points) and NLOJet++ predictions based on CT14 PDF set corrected for the NP factor (line). On the (b) plot, data (points) and predictions from POWHEG + PYTHIA8 with tune CUETM1 (line). Jets are clustered with the anti-$ {k_{\mathrm {T}}} $ algorithm ($R =$ 0.7). |
png ; pdf ; |
Figure 4-a:
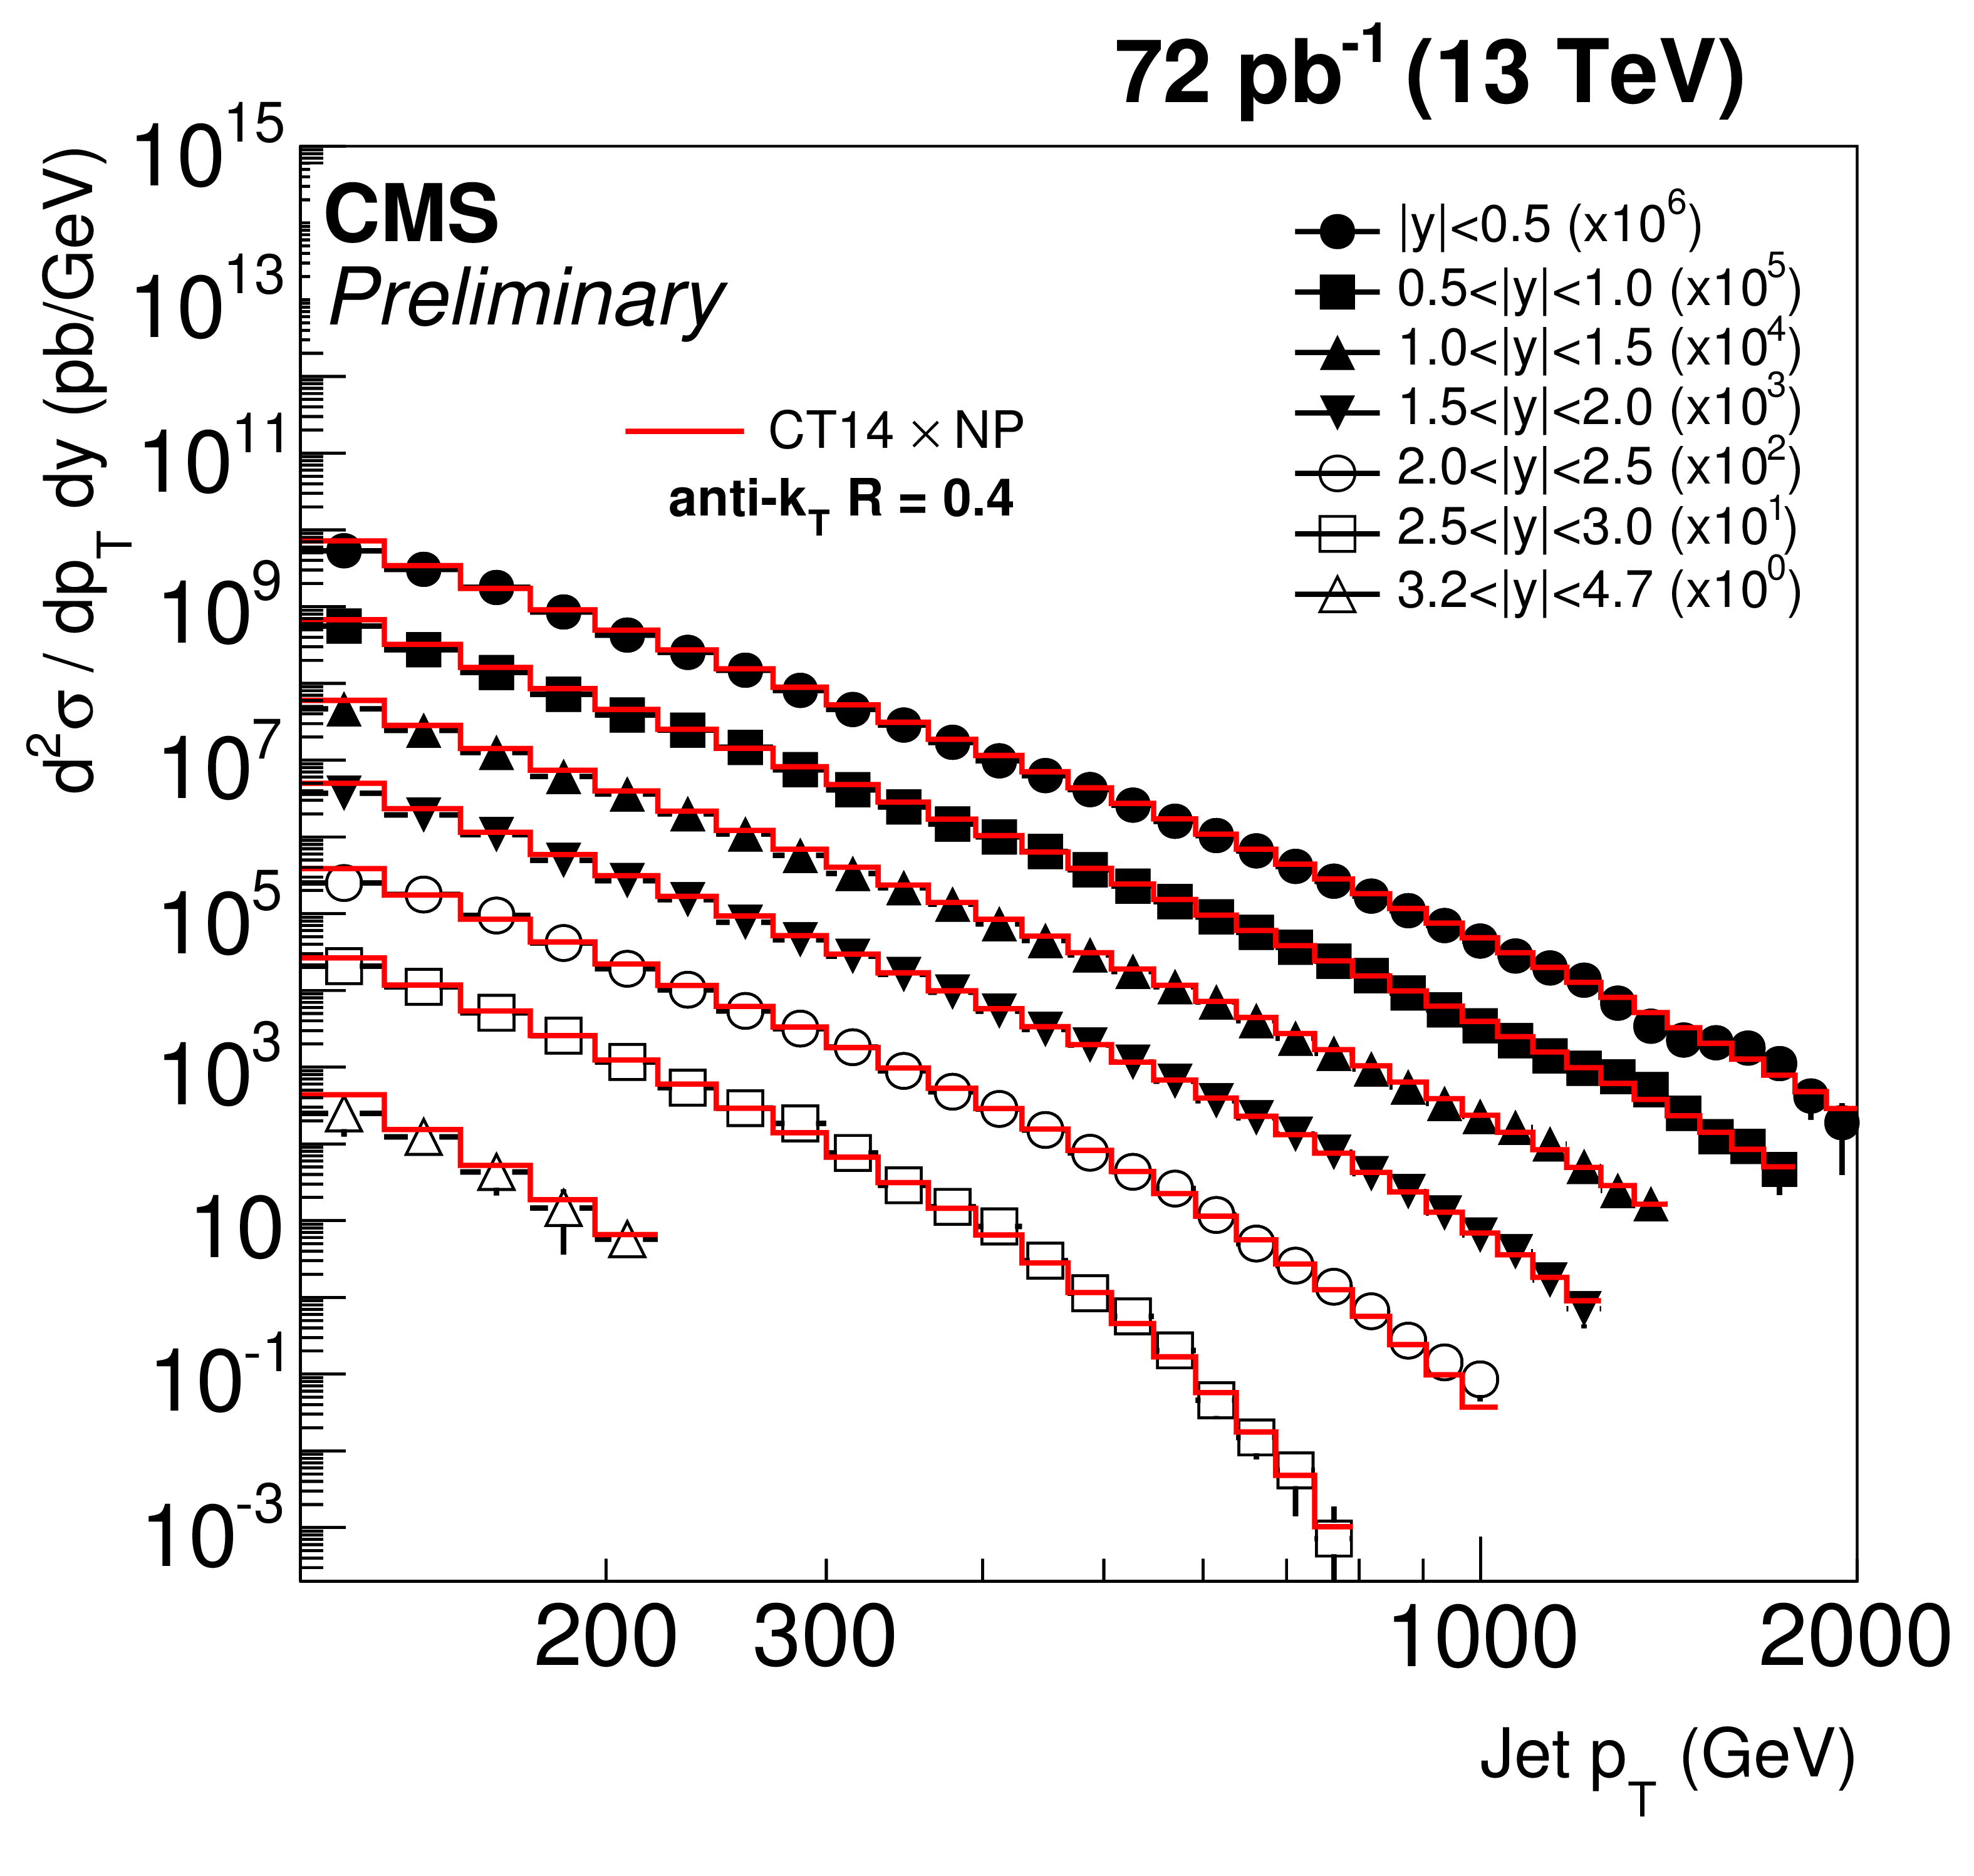
Double-differential inclusive jet cross section as function of jet $ {p_{\mathrm {T}}} $. On the (a) plot, data (points) and NLOJet++ predictions based on CT14 PDF set corrected for the NP factor (line). On the (b) plot, data (points) and predictions from POWHEG + PYTHIA8 with tune CUETM1 (line). Jets are clustered with the anti-$ {k_{\mathrm {T}}} $ algorithm ($R =$ 0.4). |
png ; pdf ; |
Figure 4-b:
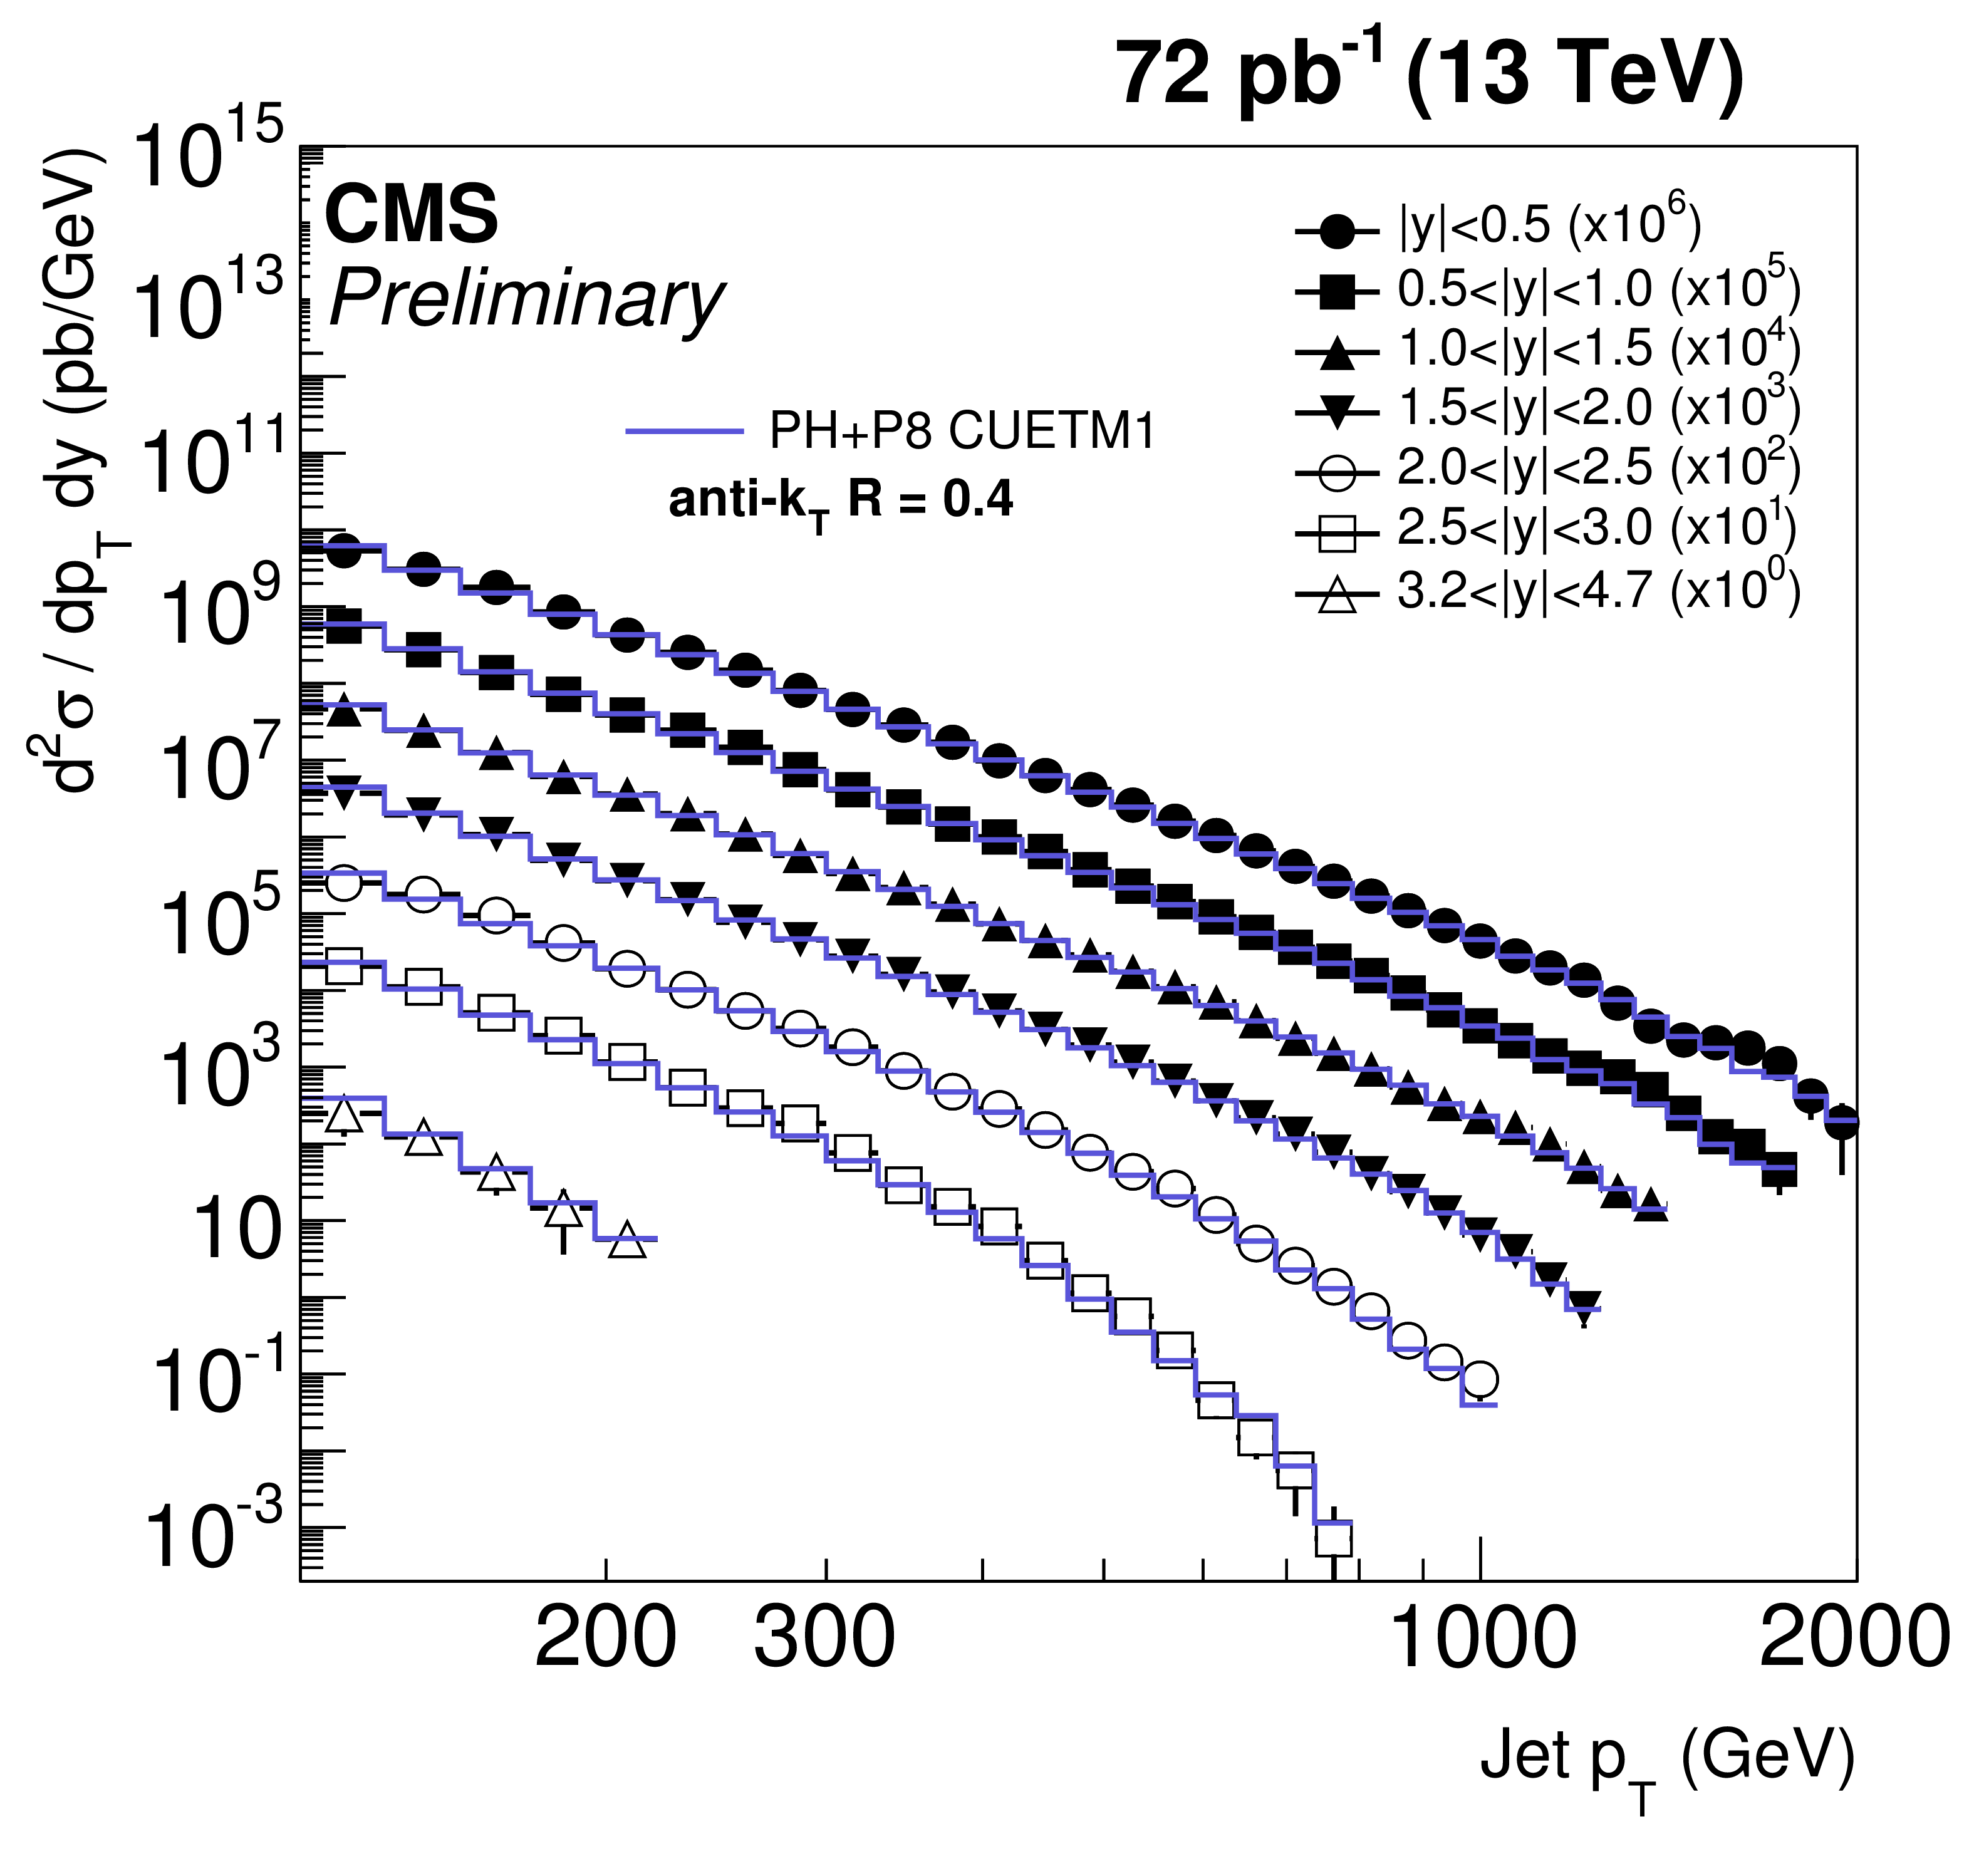
Double-differential inclusive jet cross section as function of jet $ {p_{\mathrm {T}}} $. On the (a) plot, data (points) and NLOJet++ predictions based on CT14 PDF set corrected for the NP factor (line). On the (b) plot, data (points) and predictions from POWHEG + PYTHIA8 with tune CUETM1 (line). Jets are clustered with the anti-$ {k_{\mathrm {T}}} $ algorithm ($R =$ 0.4). |
png ; pdf ; |
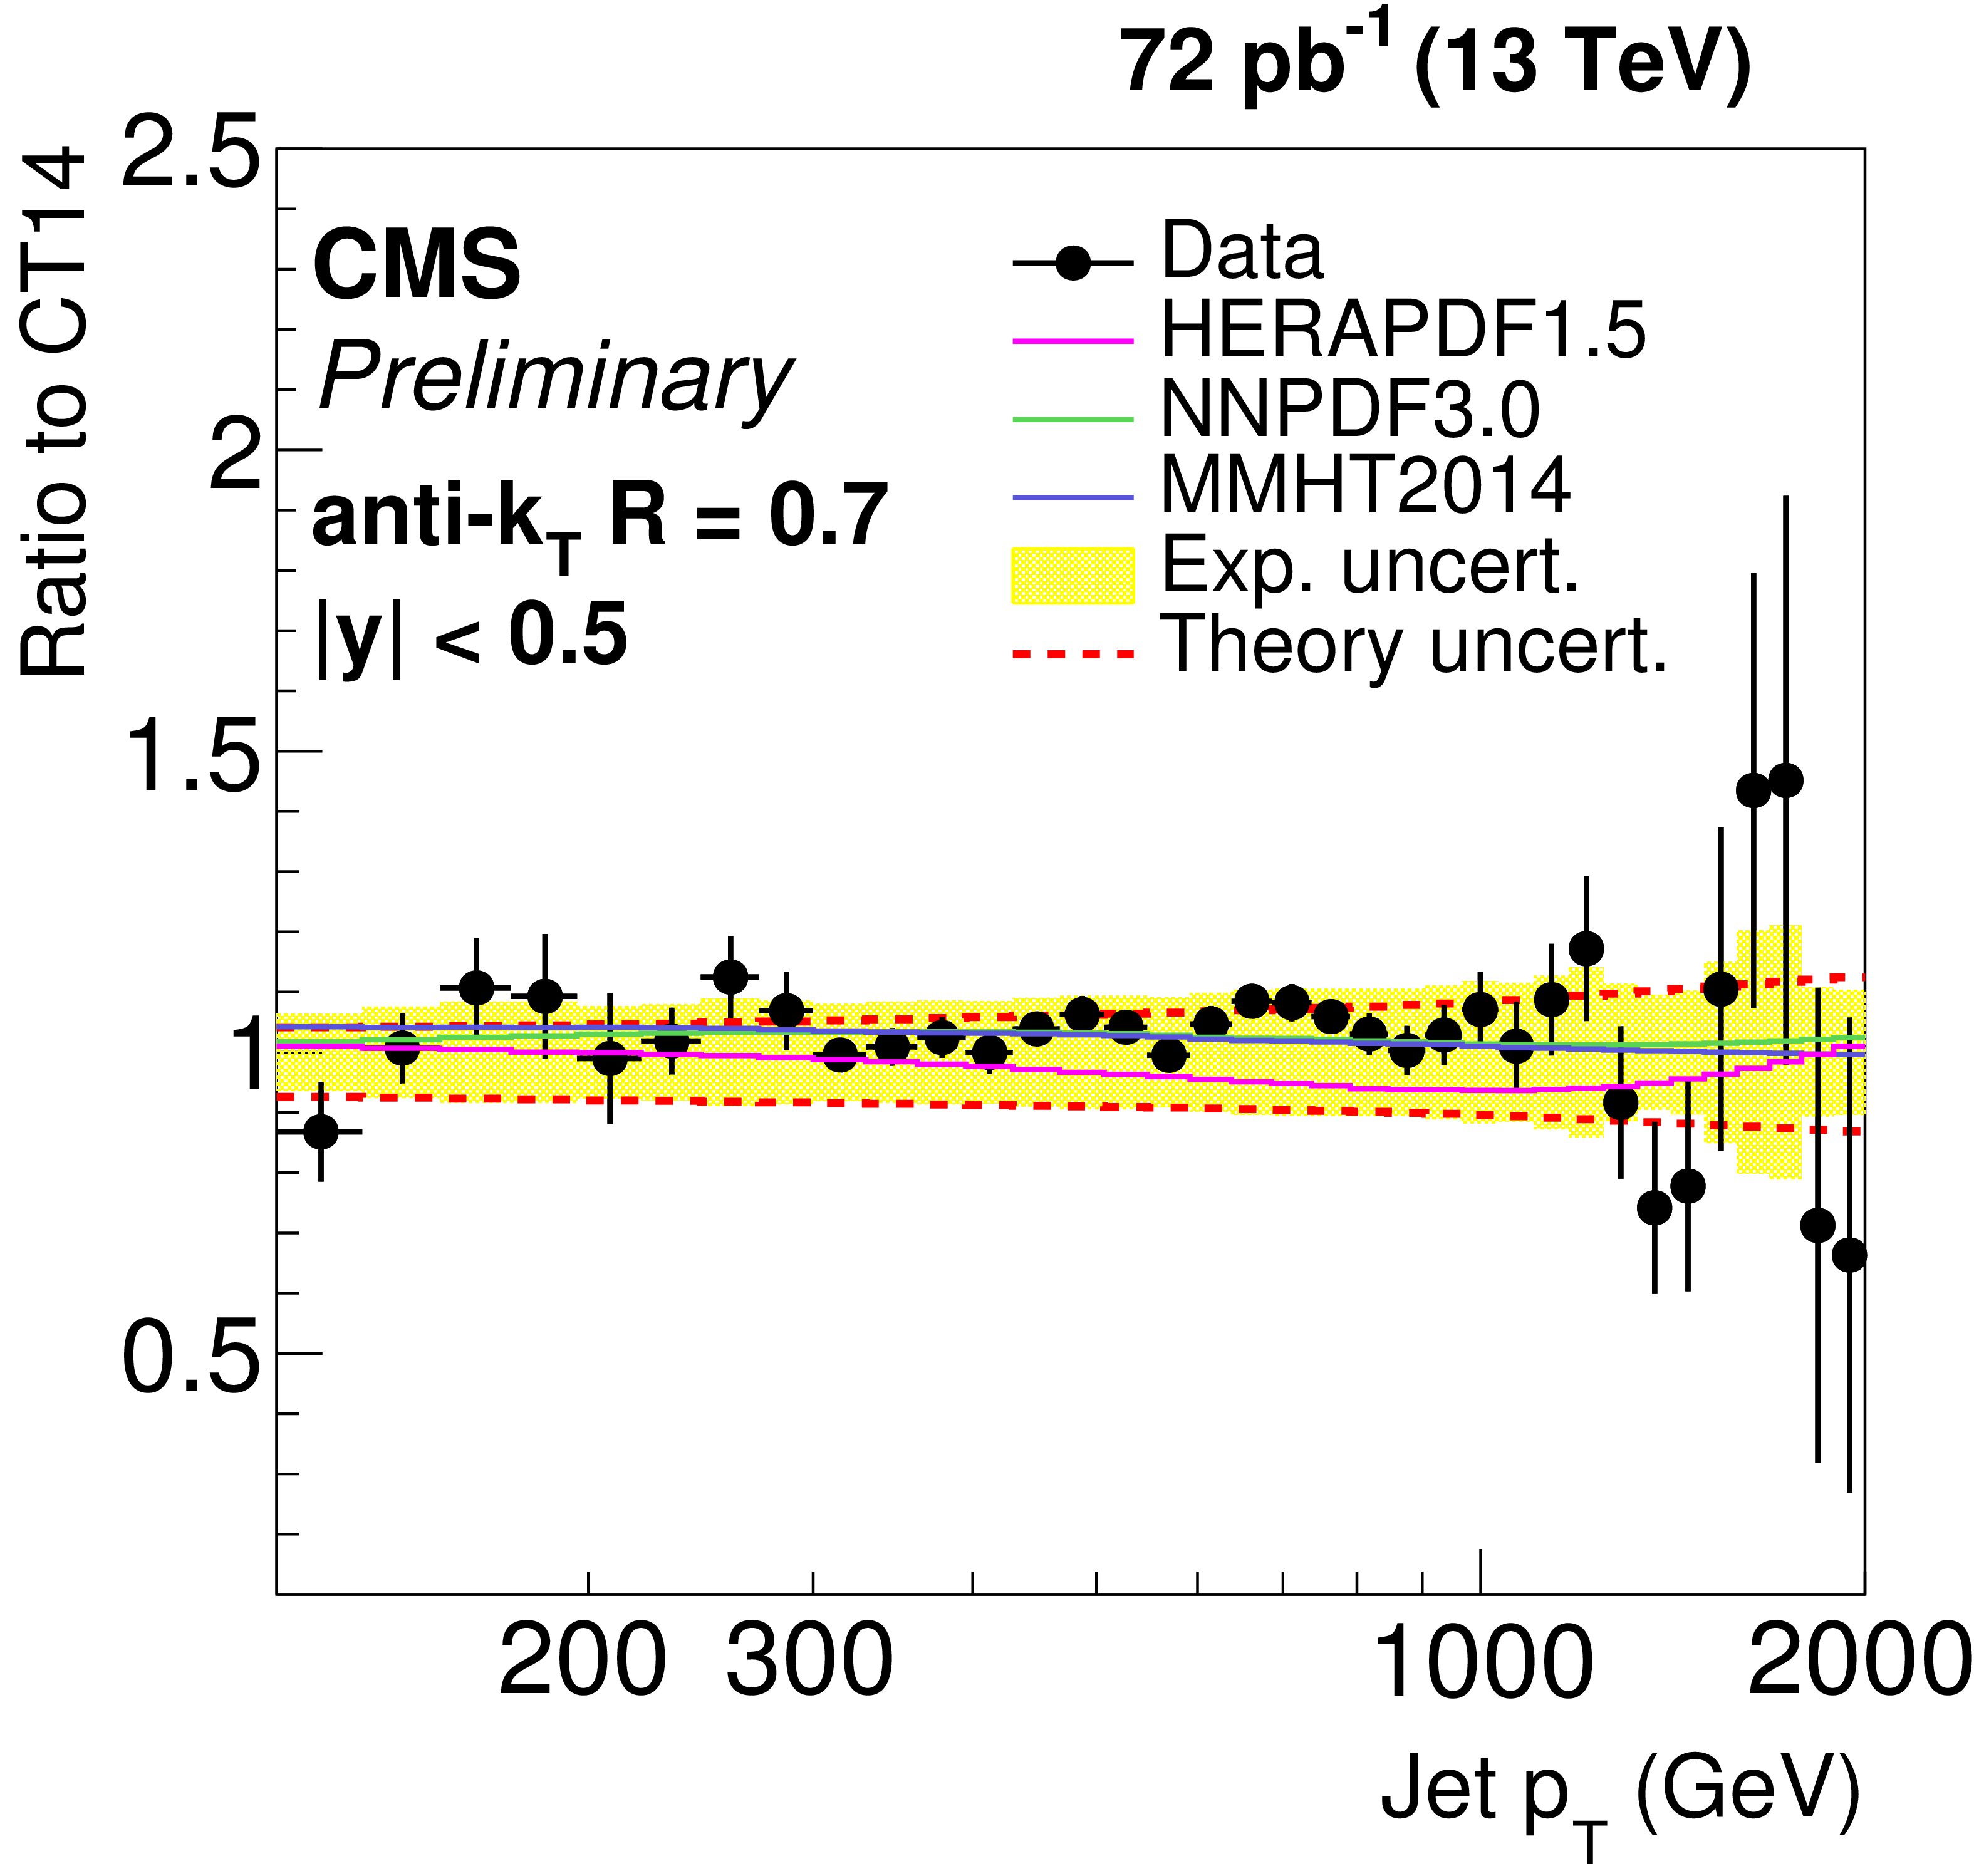
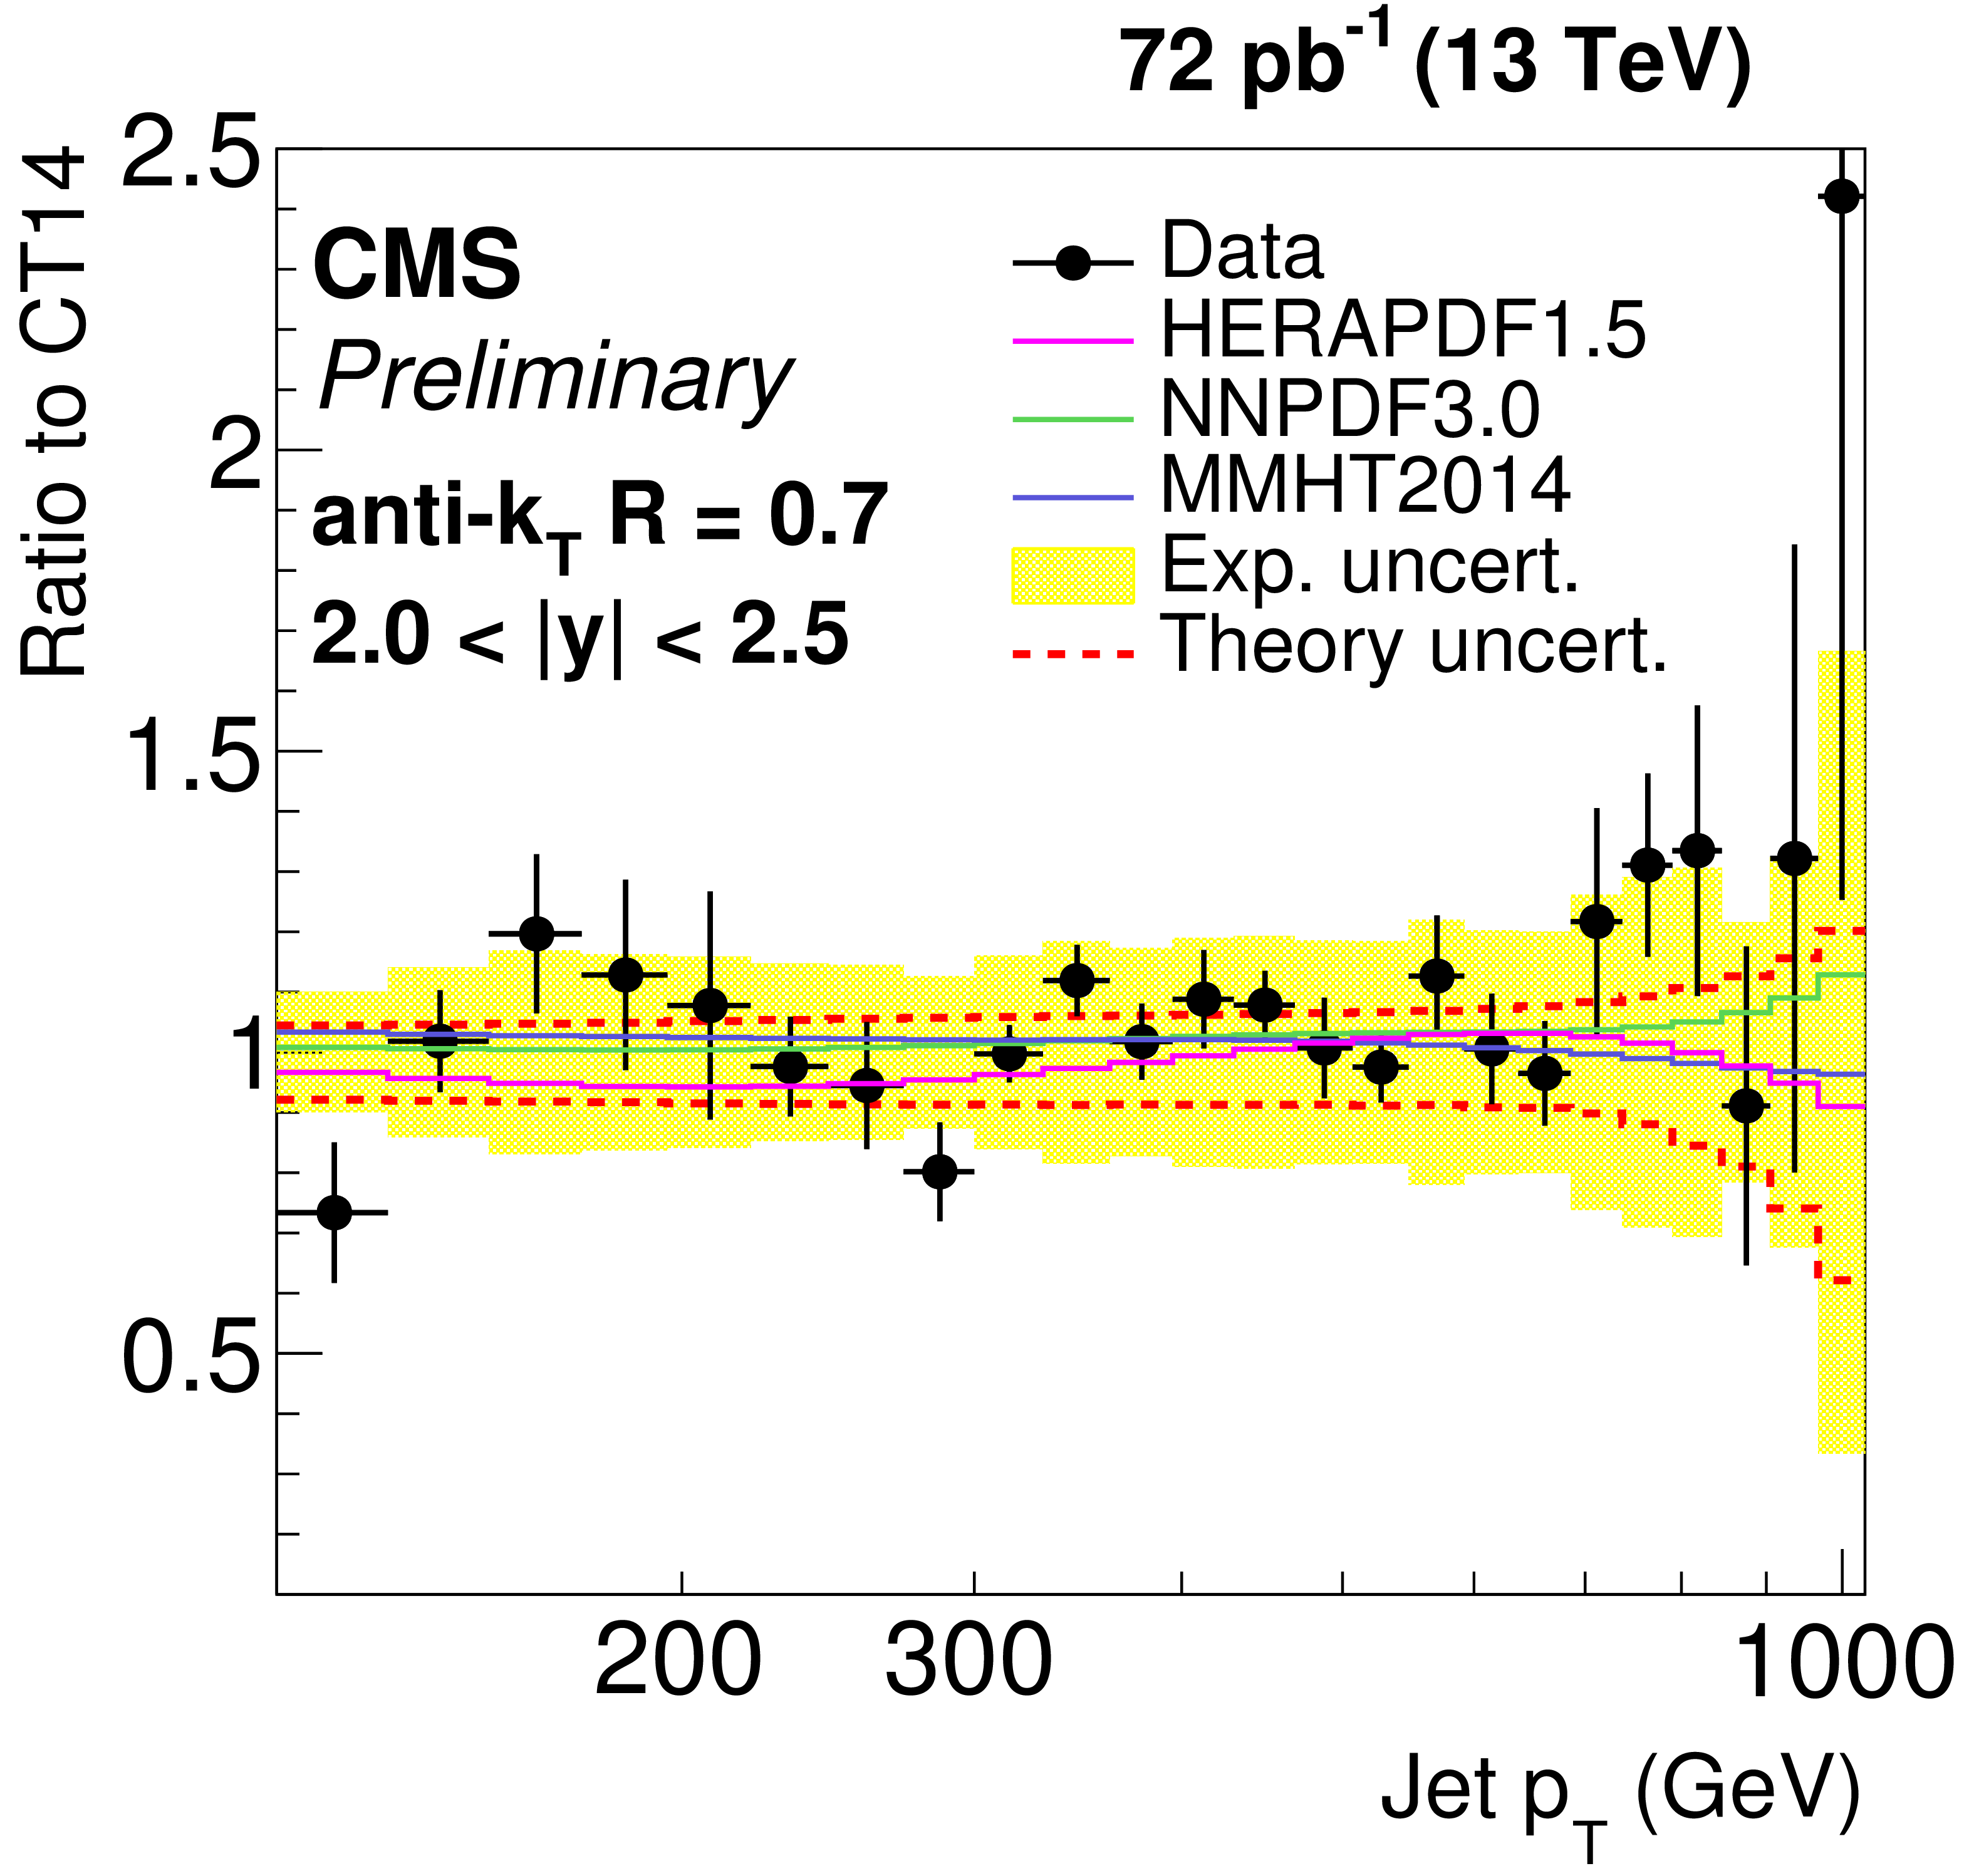
Figure 5-a:
Ratio of data over theory prediction using the CT14 PDF set. For comparison predictions employing three other PDF sets are also shown. Jets are clustered with the anti-$ {k_{\mathrm {T}}} $ algorithm ($R =$ 0.7). The error bars correspond to the statistical uncertainty of the data and the shaded band to the total systematical uncertainty. |
png ; pdf ; |
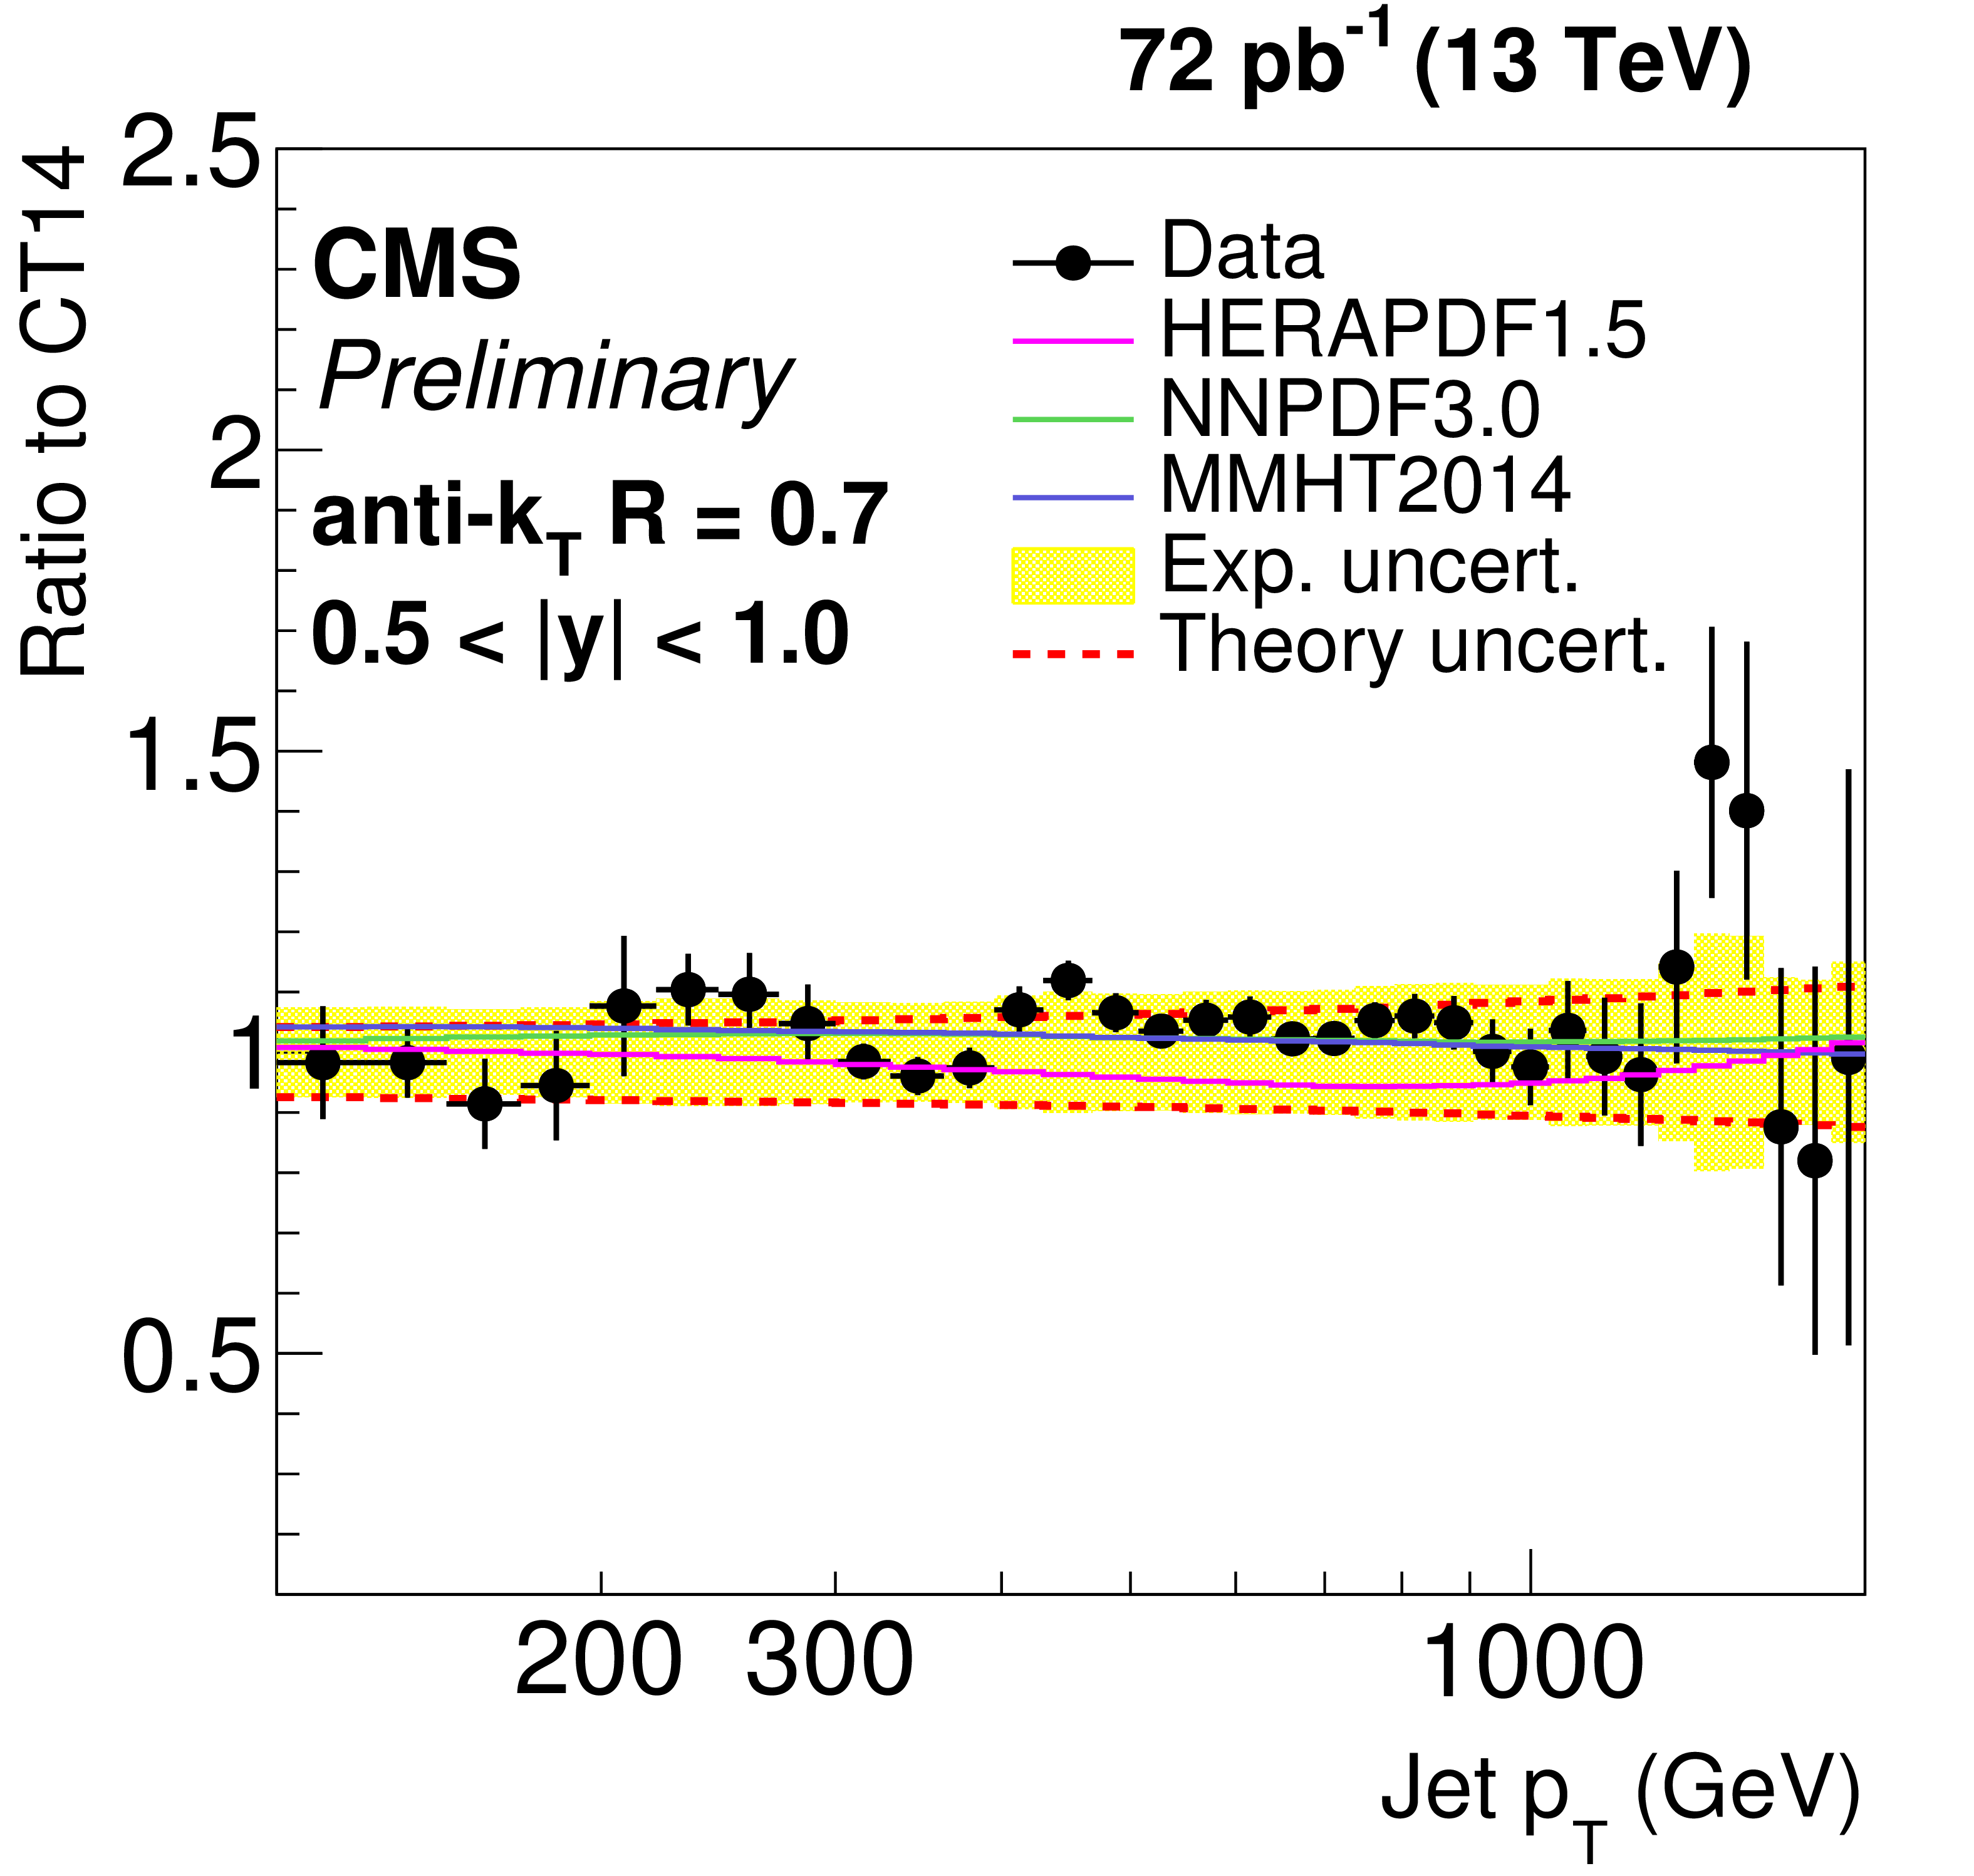
Figure 5-b:
Ratio of data over theory prediction using the CT14 PDF set. For comparison predictions employing three other PDF sets are also shown. Jets are clustered with the anti-$ {k_{\mathrm {T}}} $ algorithm ($R =$ 0.7). The error bars correspond to the statistical uncertainty of the data and the shaded band to the total systematical uncertainty. |
png ; pdf ; |
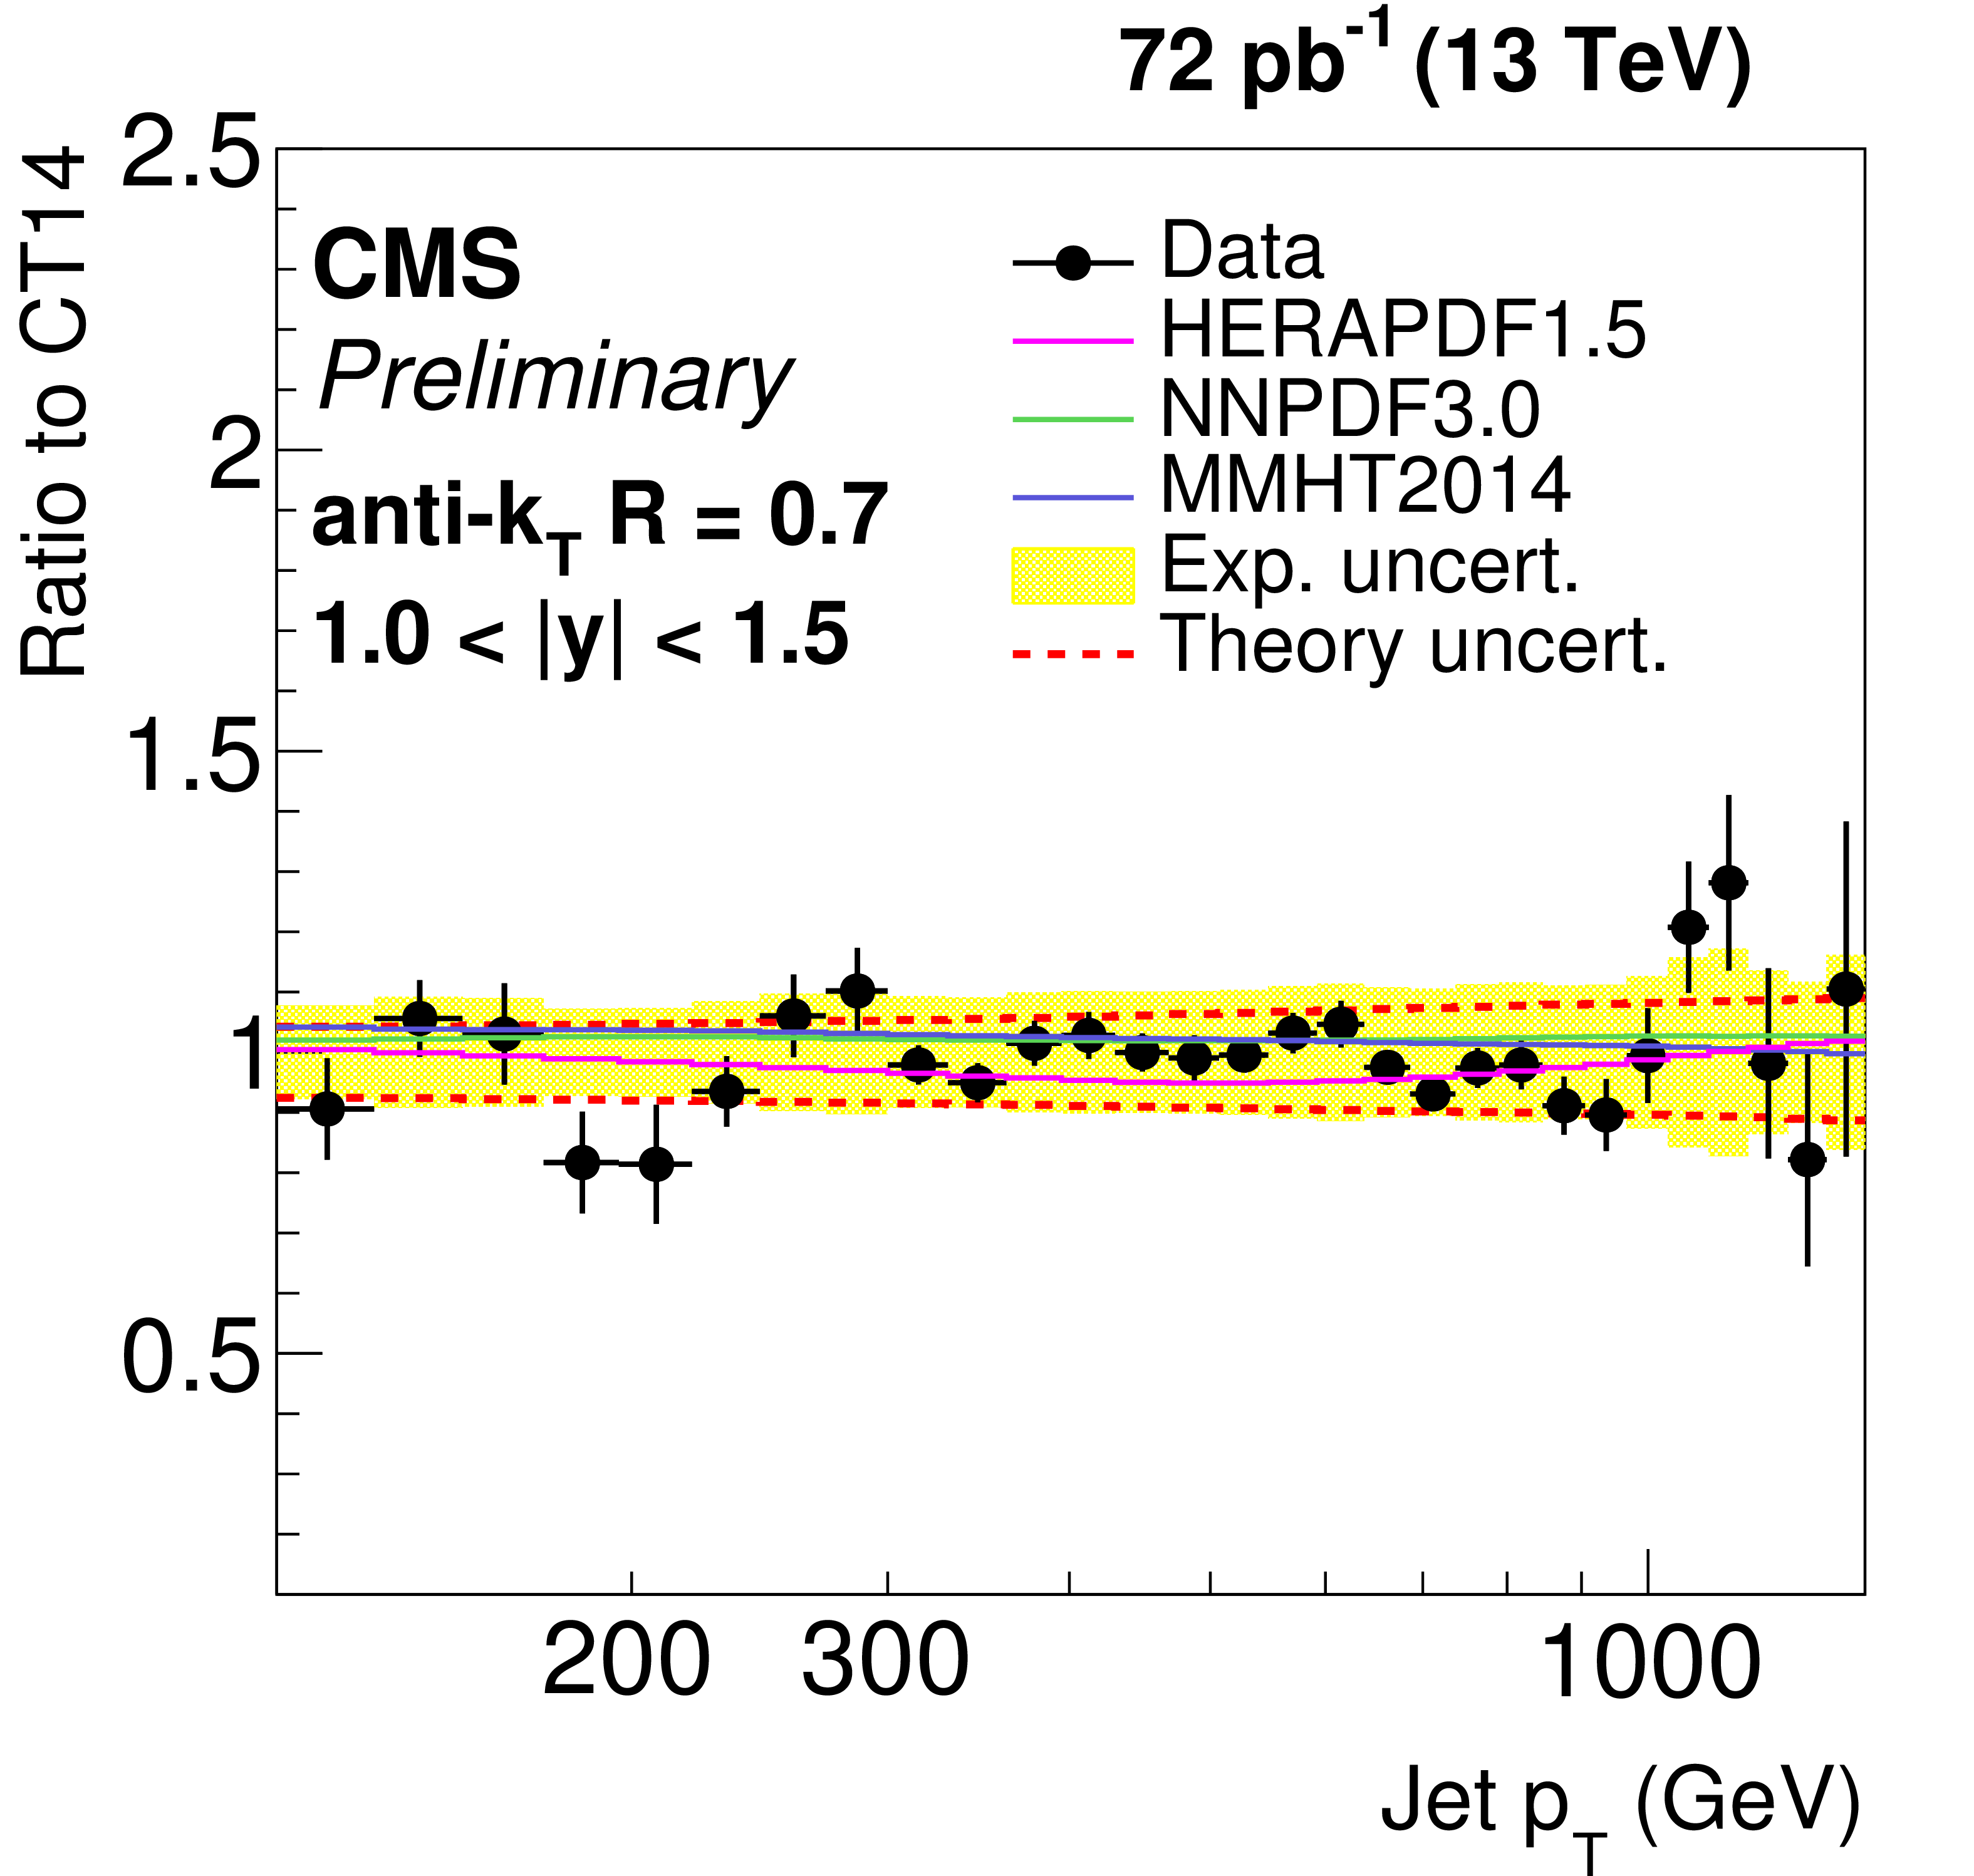
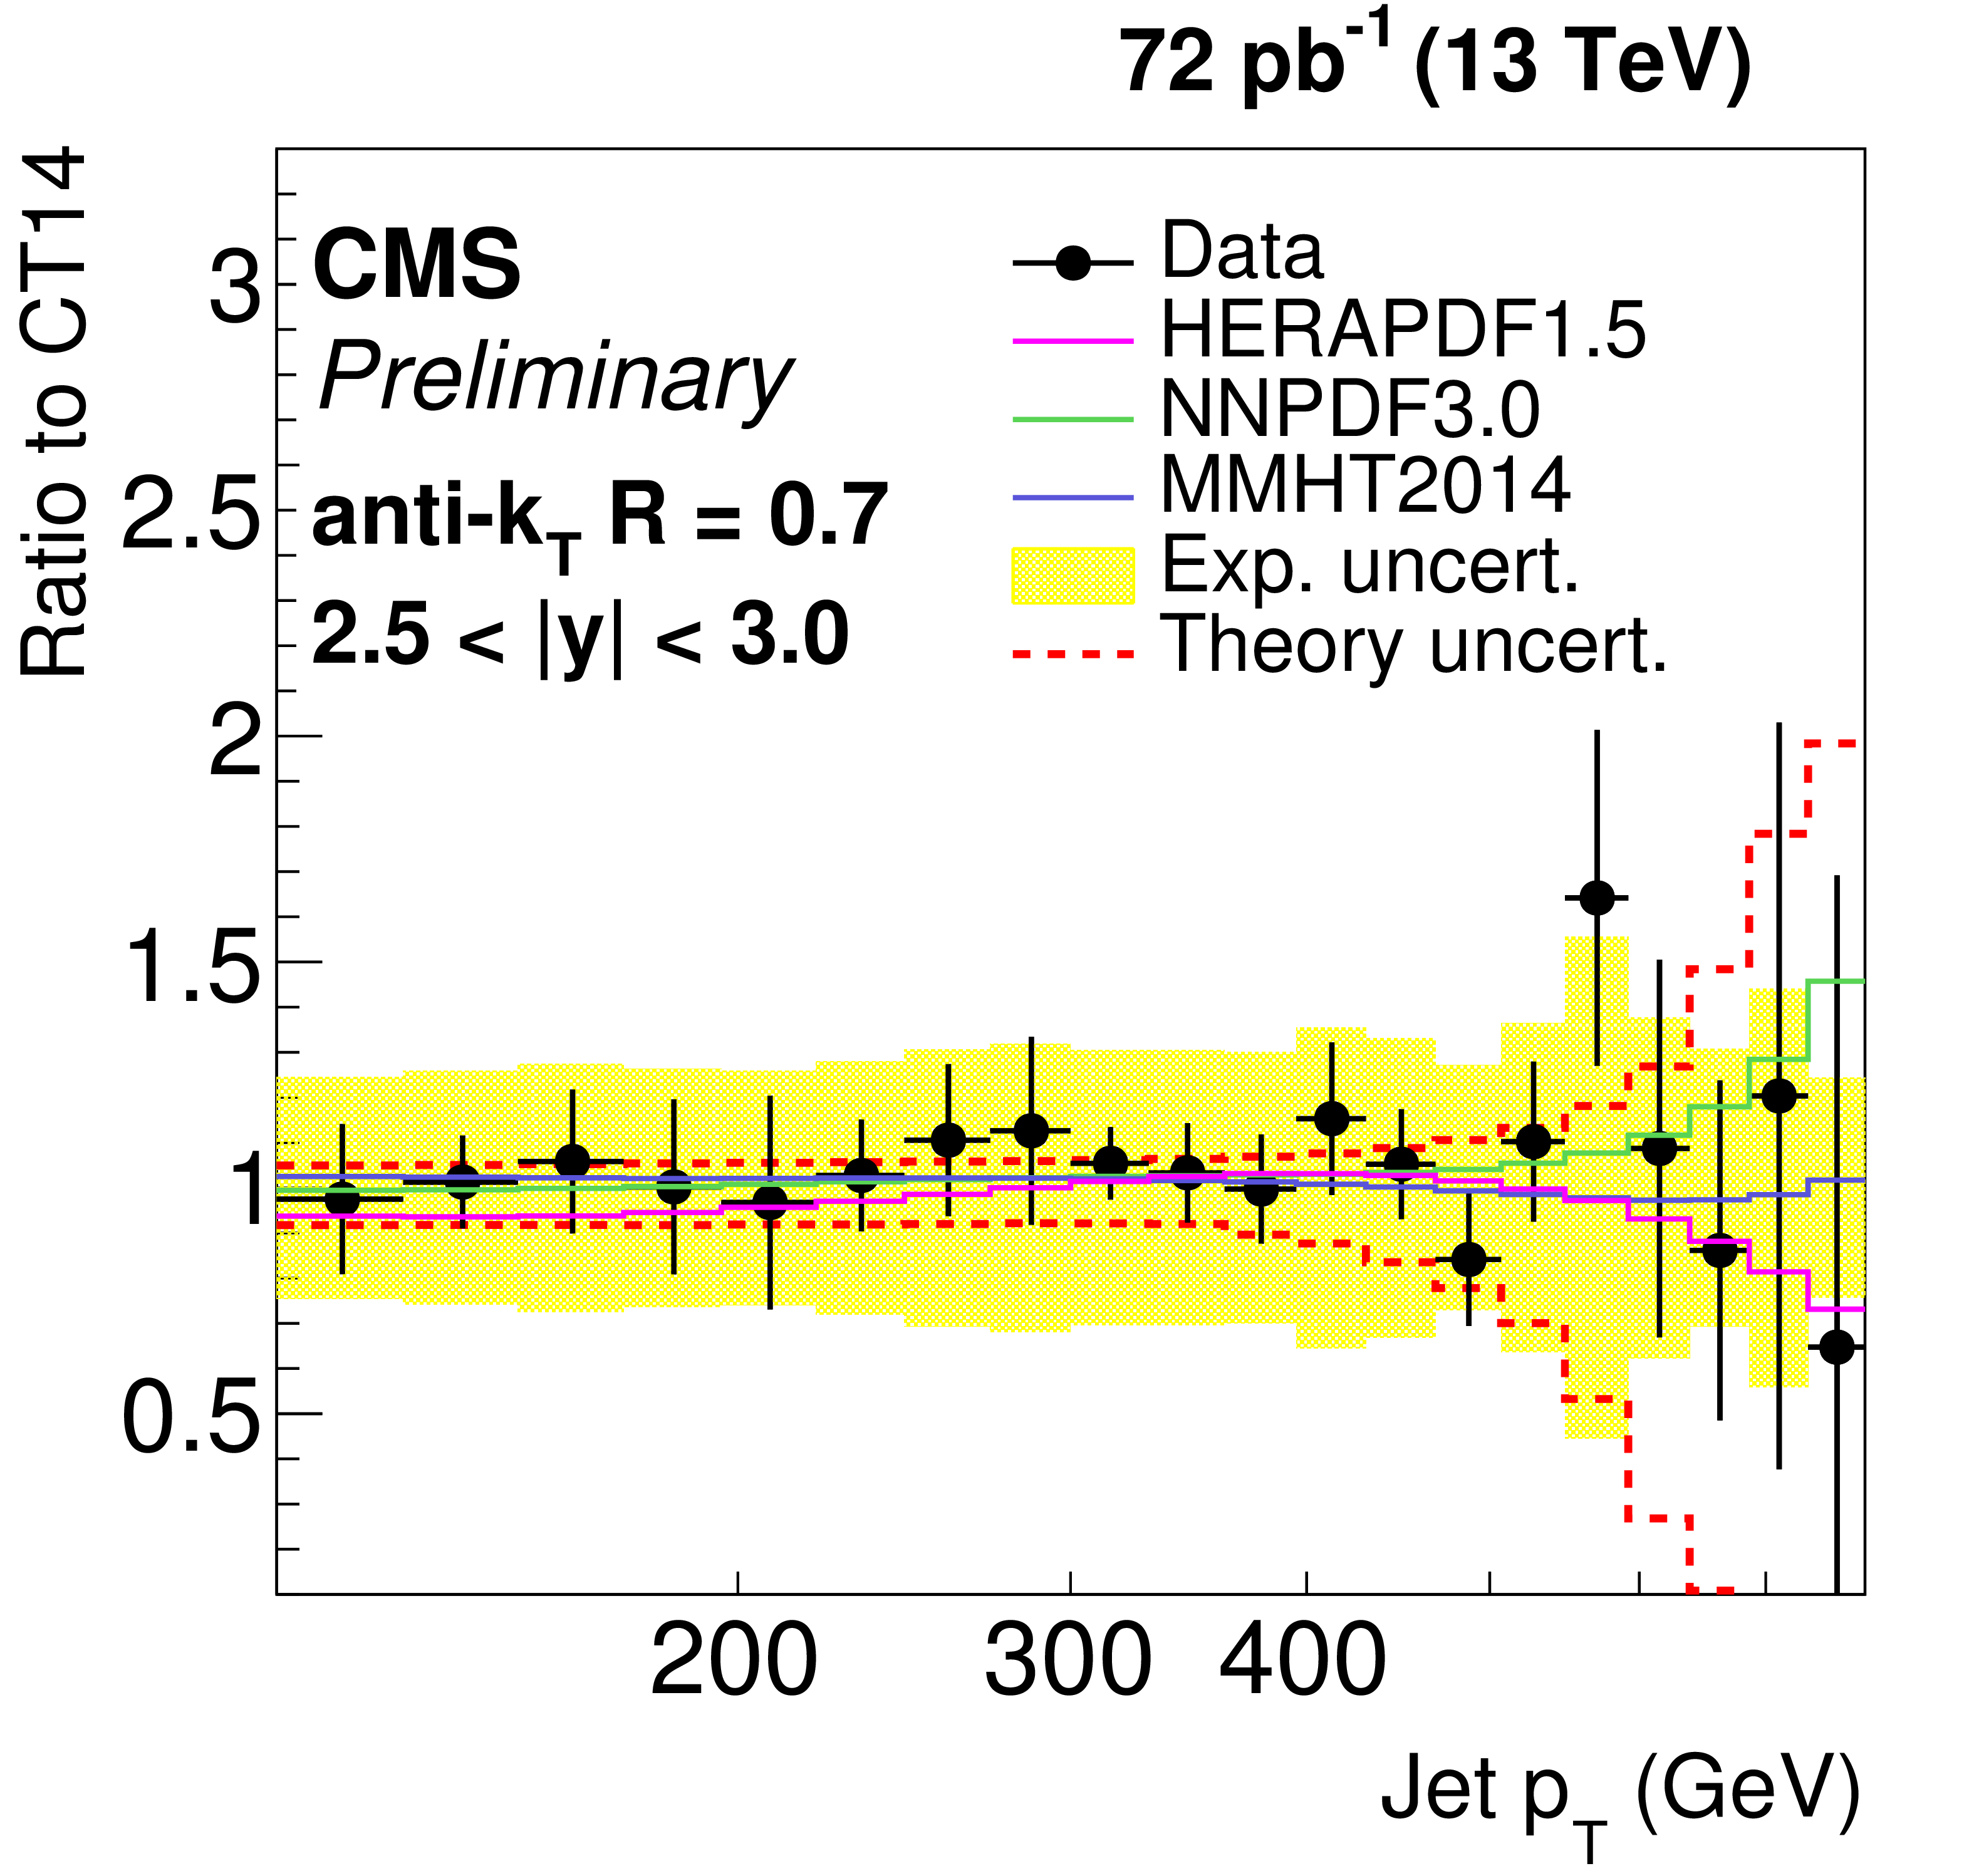
Figure 5-c:
Ratio of data over theory prediction using the CT14 PDF set. For comparison predictions employing three other PDF sets are also shown. Jets are clustered with the anti-$ {k_{\mathrm {T}}} $ algorithm ($R =$ 0.7). The error bars correspond to the statistical uncertainty of the data and the shaded band to the total systematical uncertainty. |
png ; pdf ; |
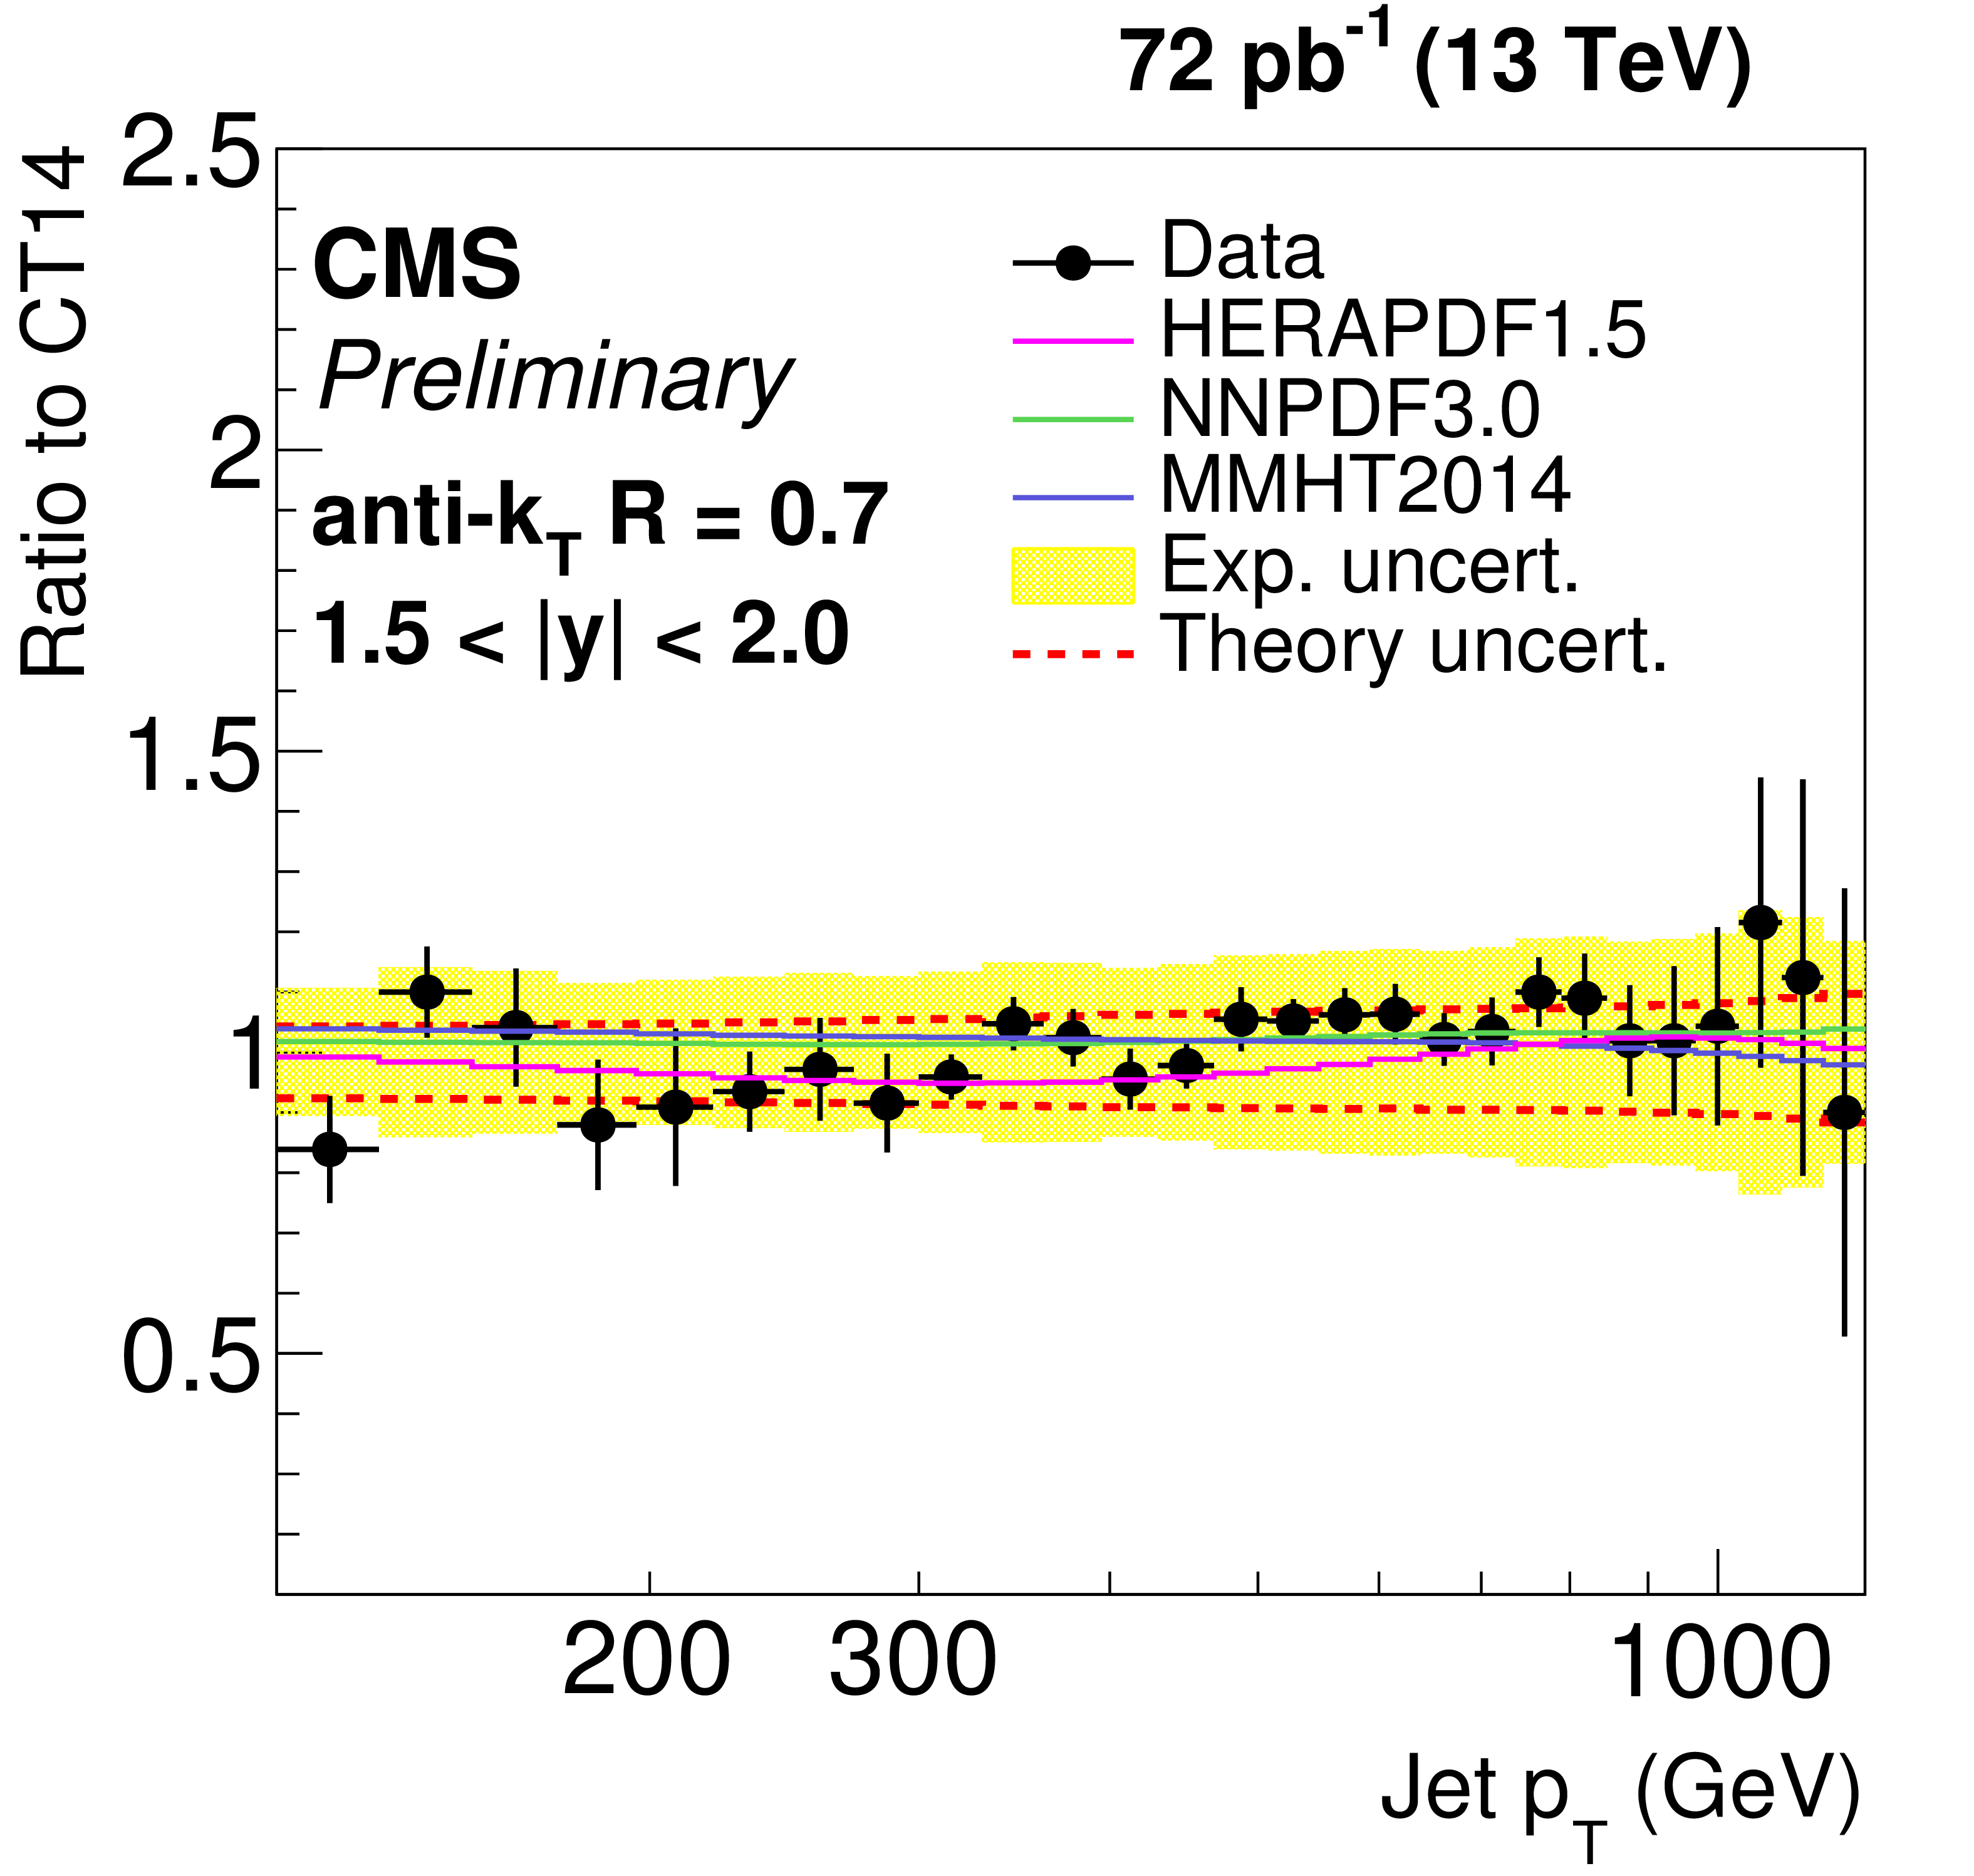
Figure 5-d:
Ratio of data over theory prediction using the CT14 PDF set. For comparison predictions employing three other PDF sets are also shown. Jets are clustered with the anti-$ {k_{\mathrm {T}}} $ algorithm ($R =$ 0.7). The error bars correspond to the statistical uncertainty of the data and the shaded band to the total systematical uncertainty. |
png ; pdf ; |
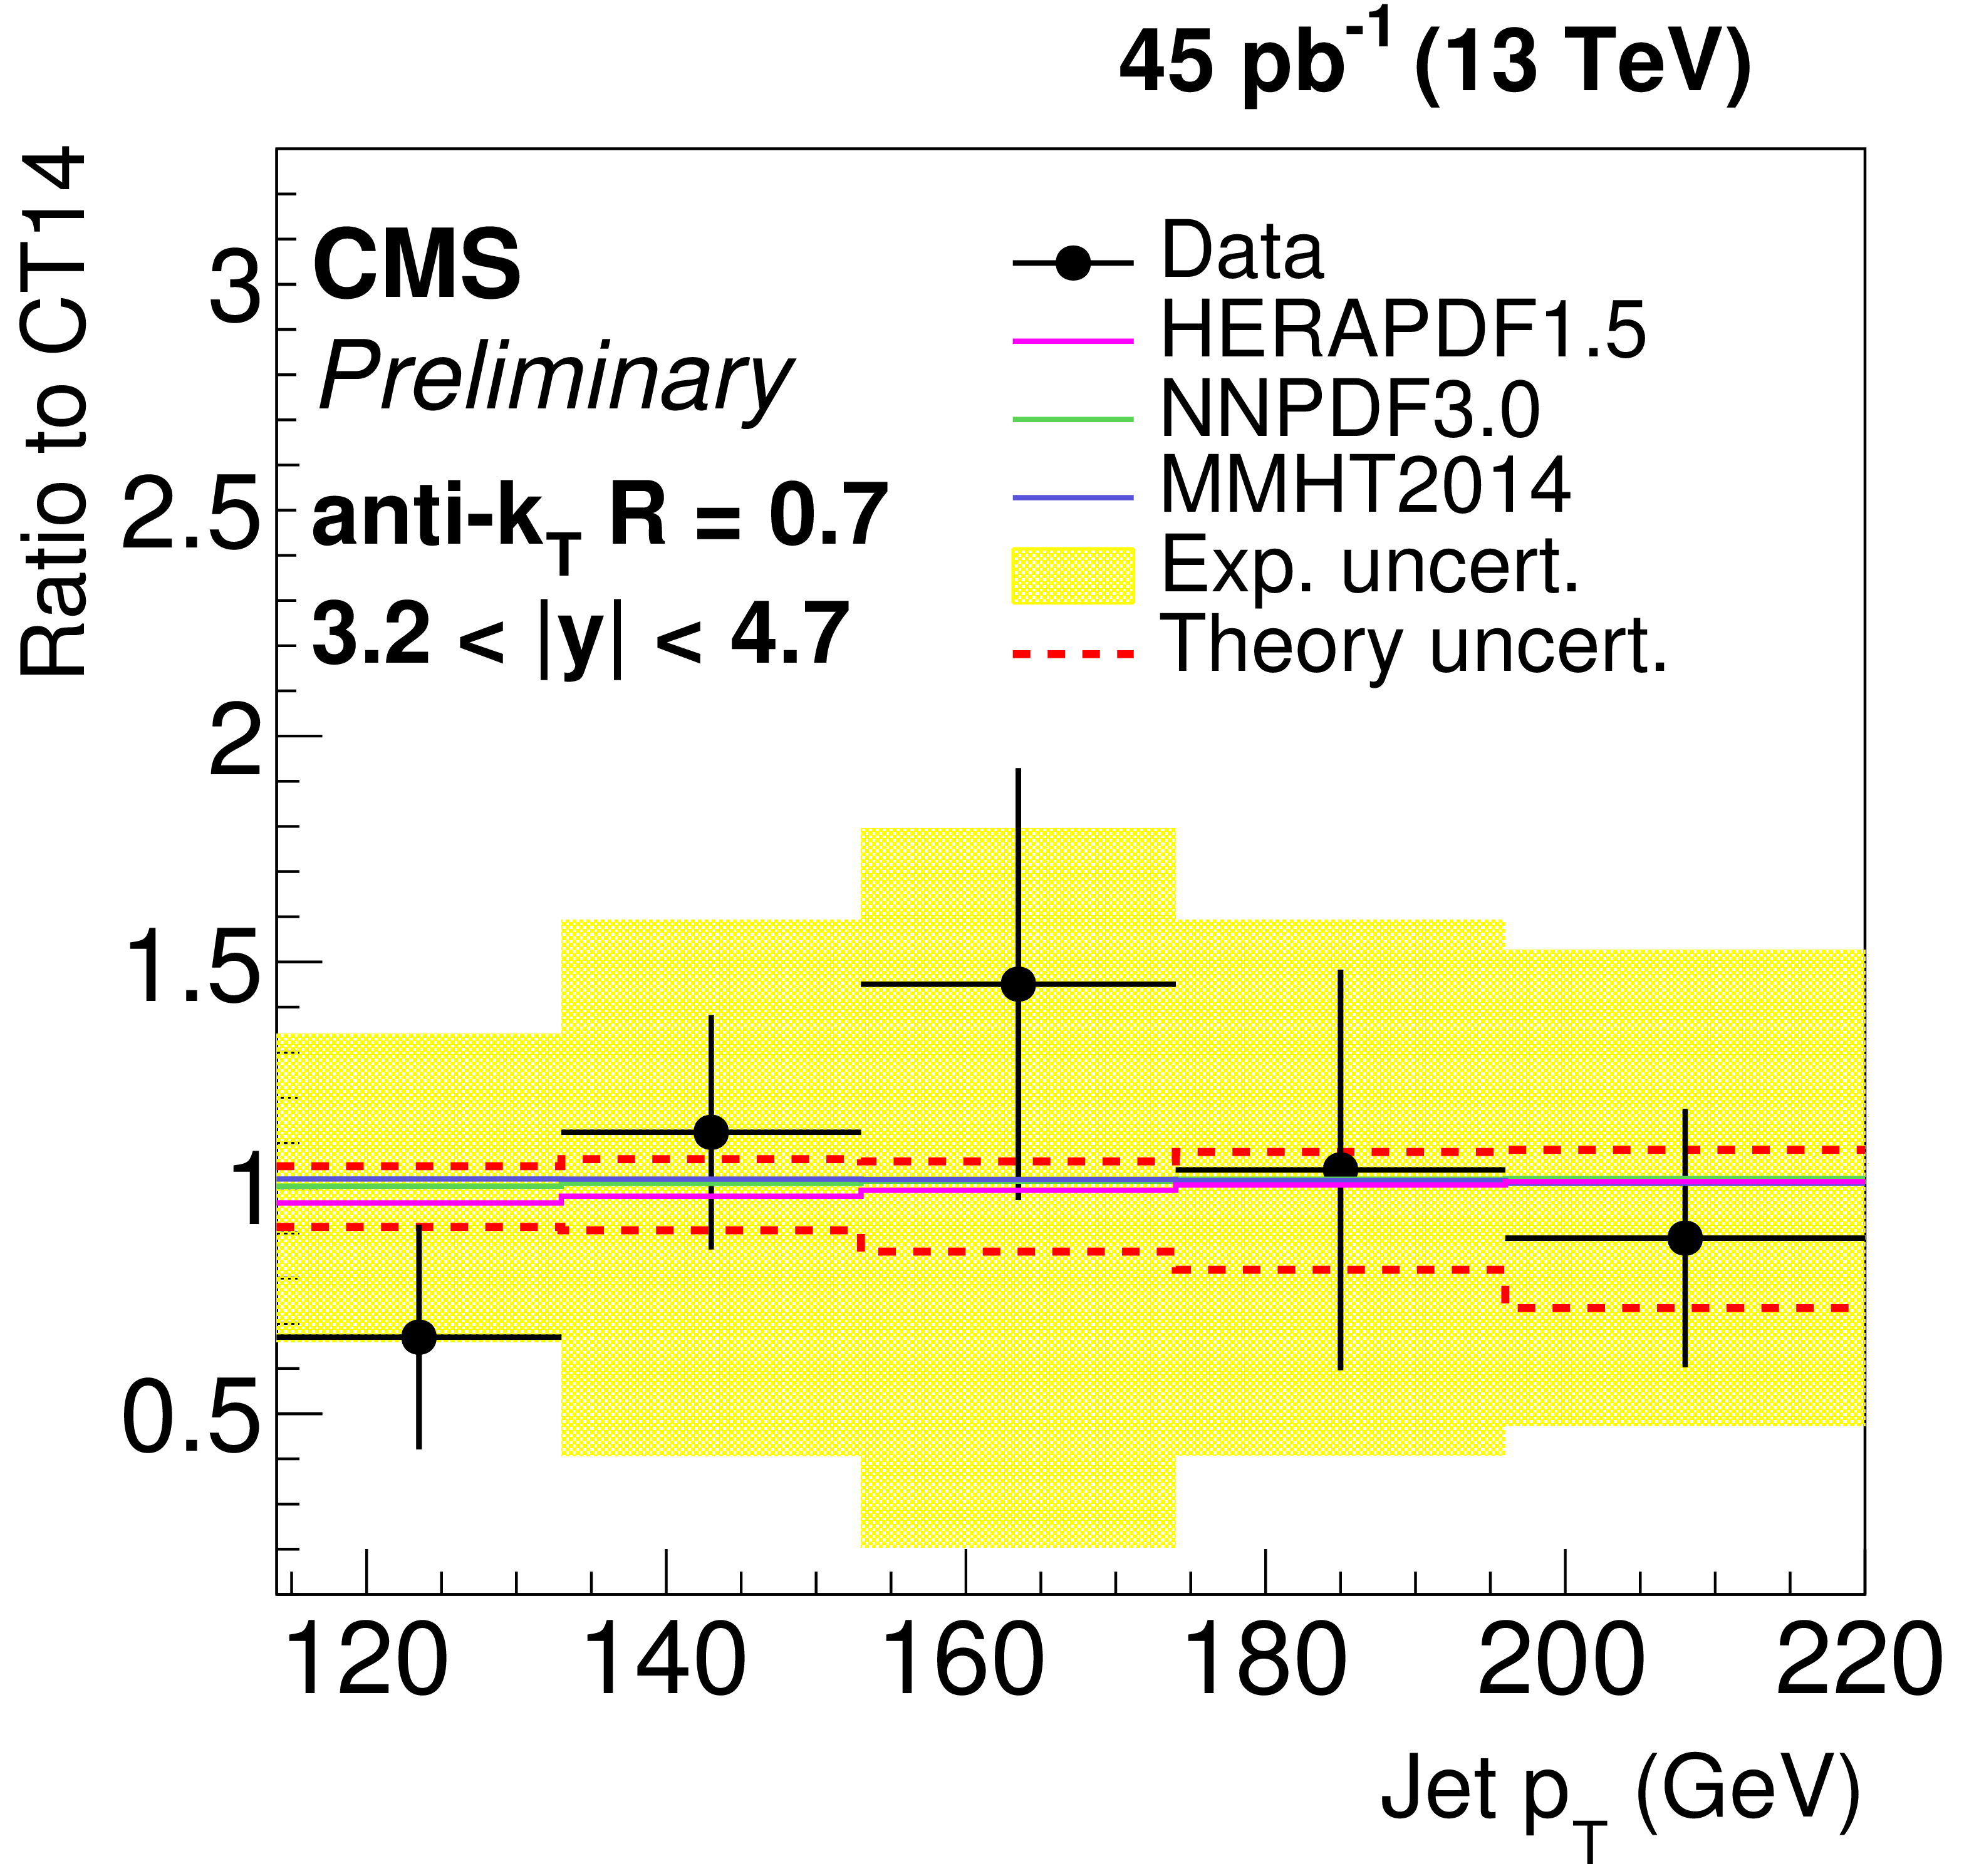
Figure 5-e:
Ratio of data over theory prediction using the CT14 PDF set. For comparison predictions employing three other PDF sets are also shown. Jets are clustered with the anti-$ {k_{\mathrm {T}}} $ algorithm ($R =$ 0.7). The error bars correspond to the statistical uncertainty of the data and the shaded band to the total systematical uncertainty. |
png ; pdf ; |
Figure 5-f:
Ratio of data over theory prediction using the CT14 PDF set. For comparison predictions employing three other PDF sets are also shown. Jets are clustered with the anti-$ {k_{\mathrm {T}}} $ algorithm ($R =$ 0.7). The error bars correspond to the statistical uncertainty of the data and the shaded band to the total systematical uncertainty. |
png ; pdf ; |
Figure 5-g:
Ratio of data over theory prediction using the CT14 PDF set. For comparison predictions employing three other PDF sets are also shown. Jets are clustered with the anti-$ {k_{\mathrm {T}}} $ algorithm ($R =$ 0.7). The error bars correspond to the statistical uncertainty of the data and the shaded band to the total systematical uncertainty. |
png ; pdf ; |
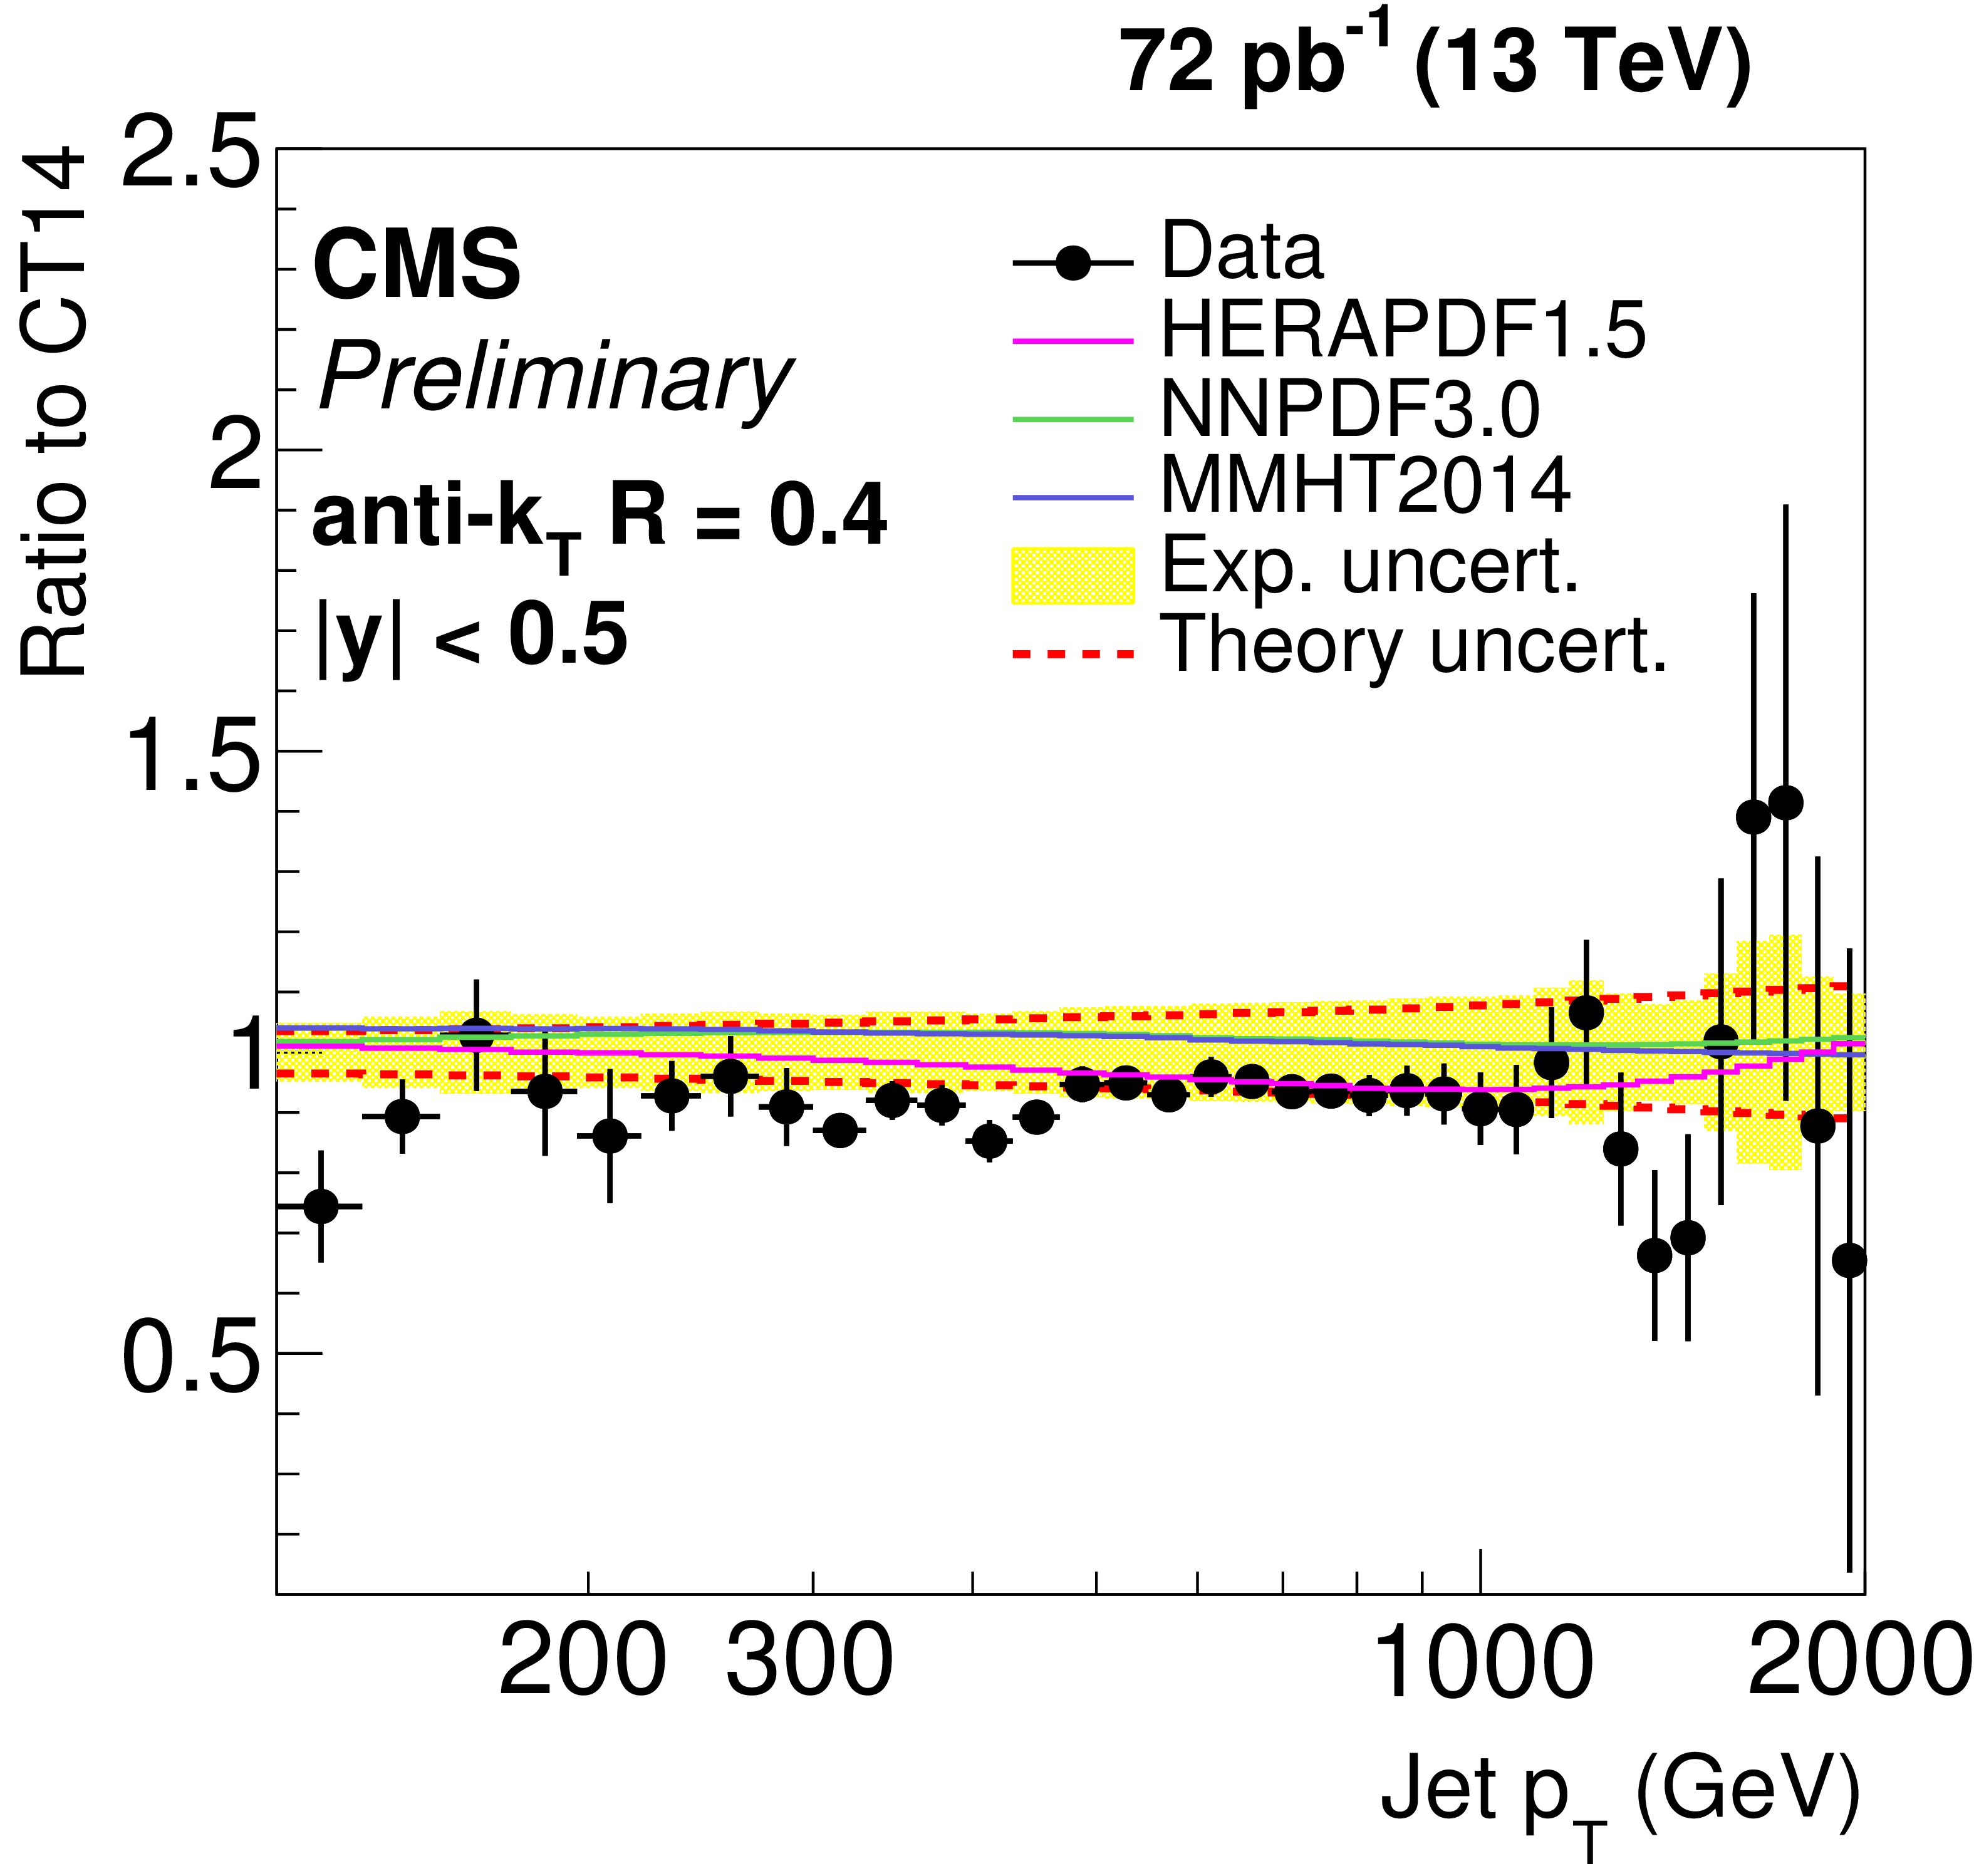
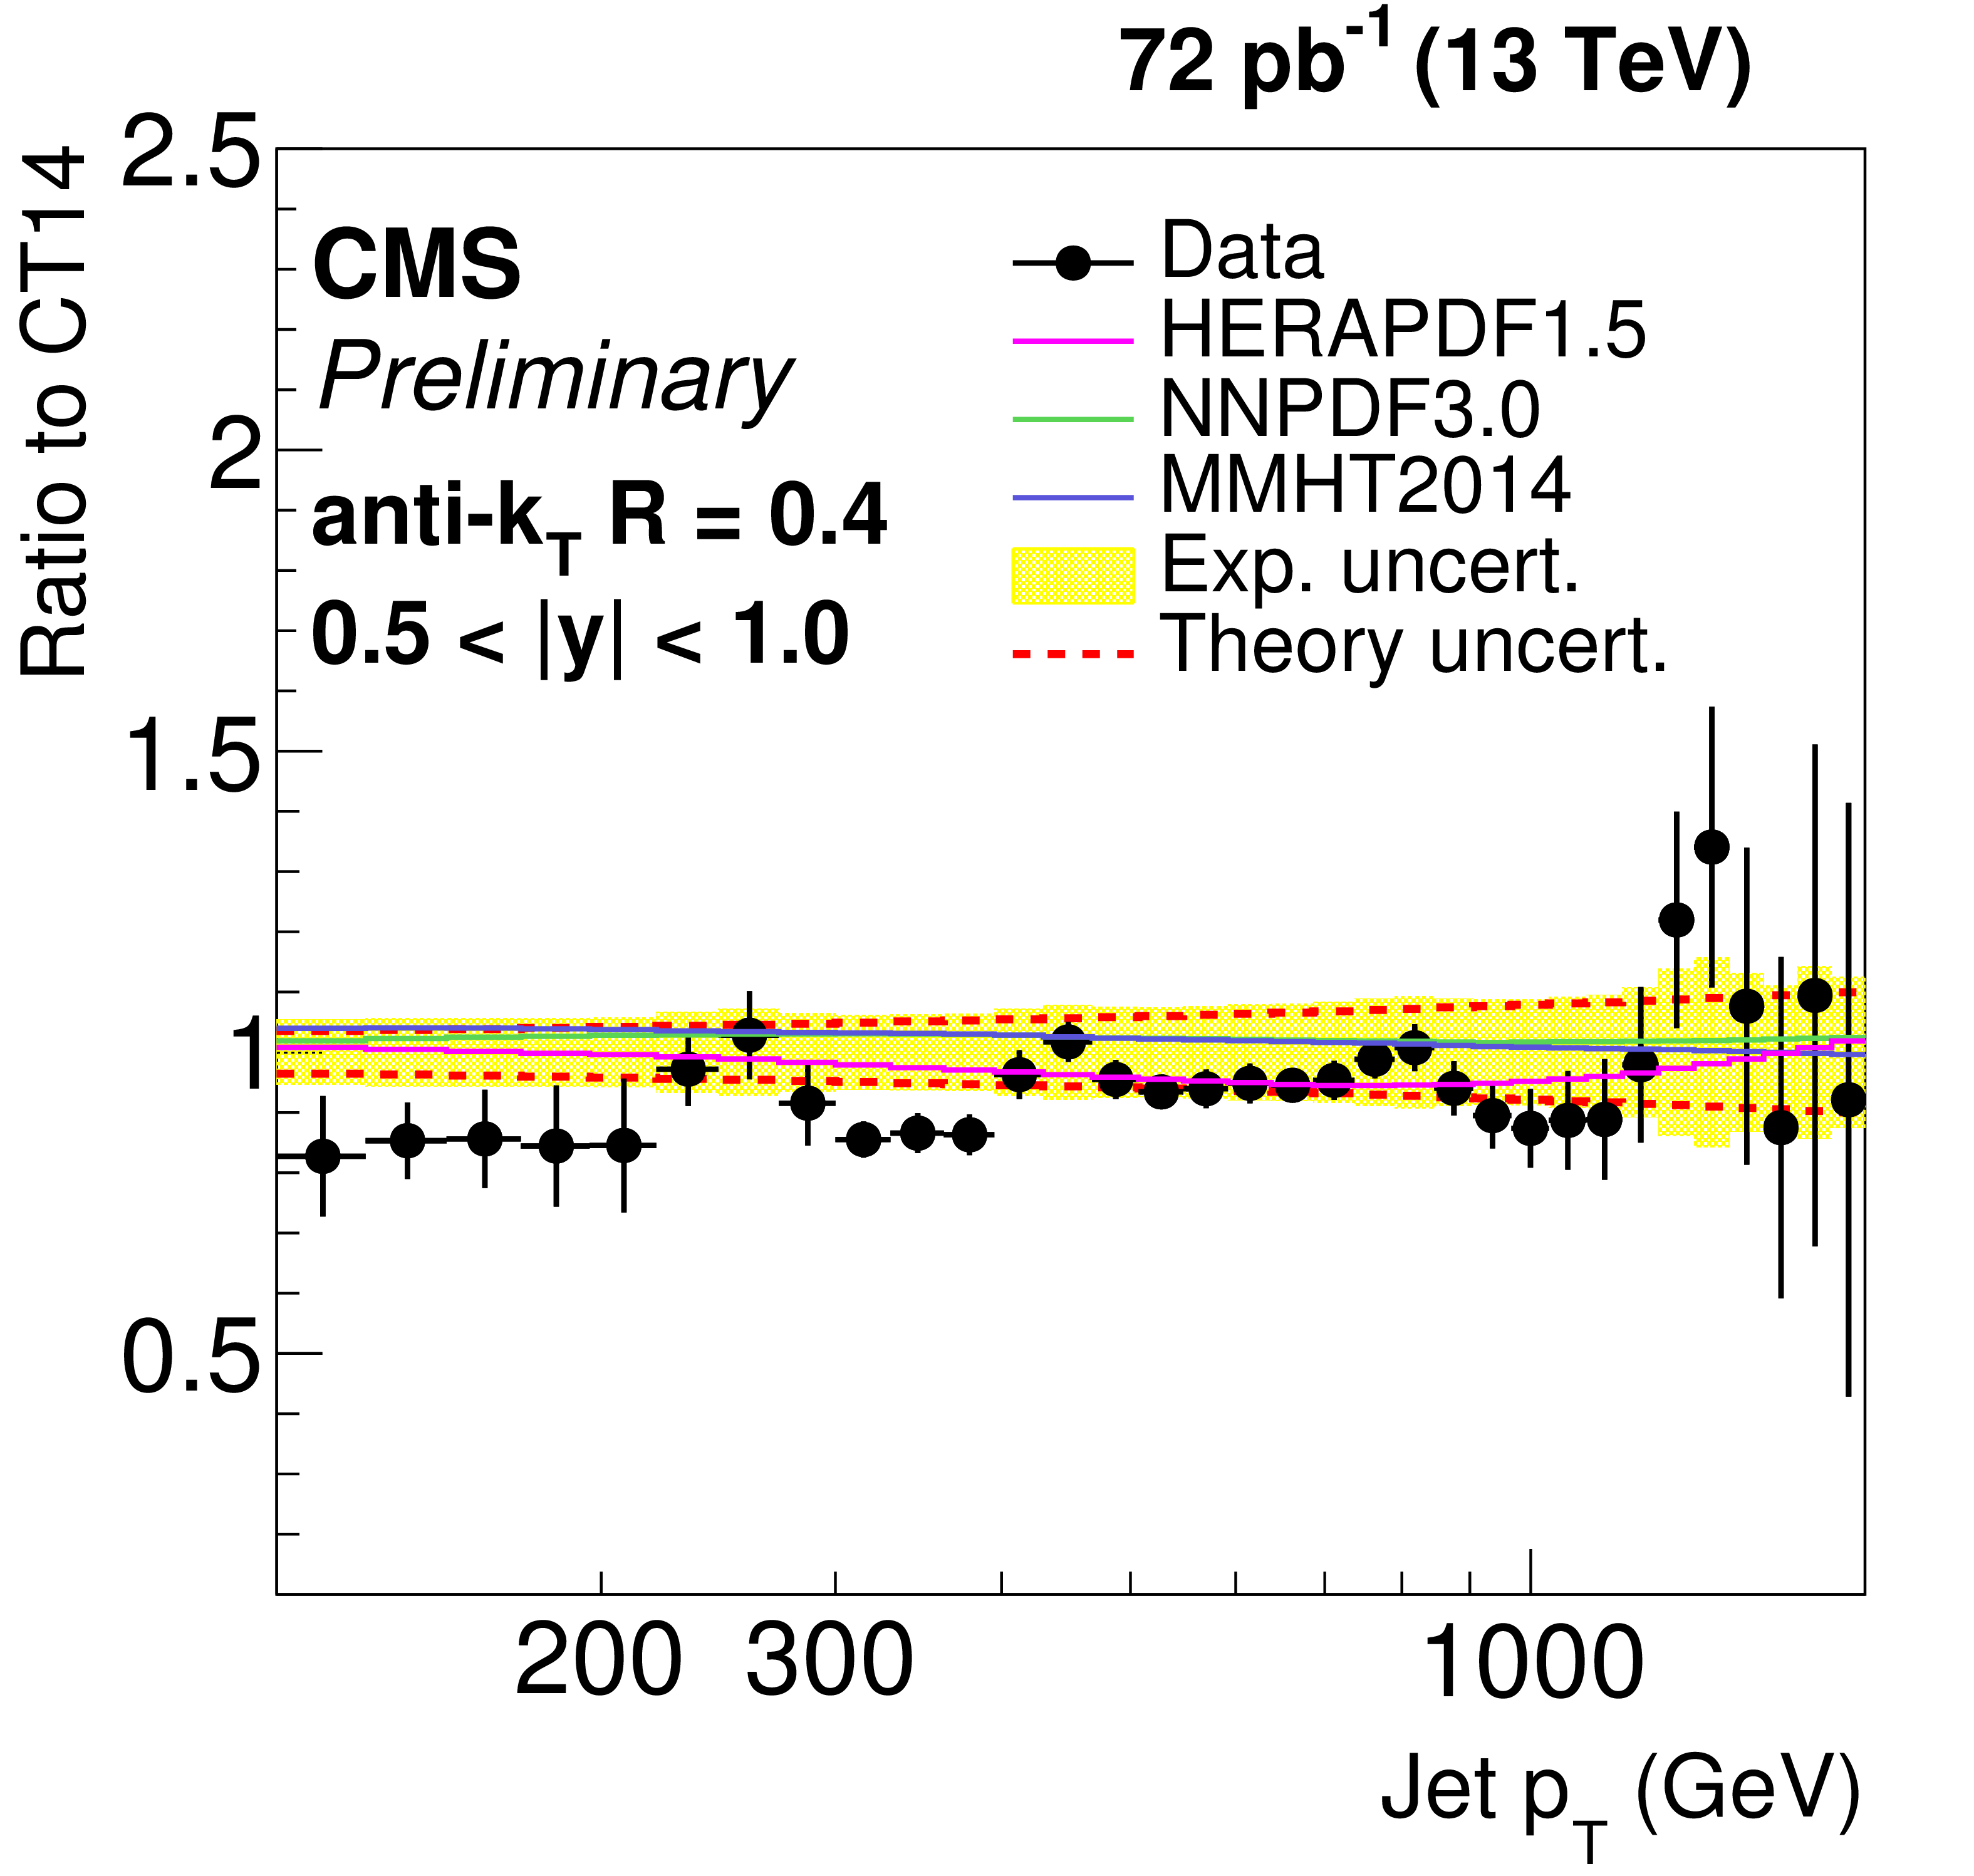
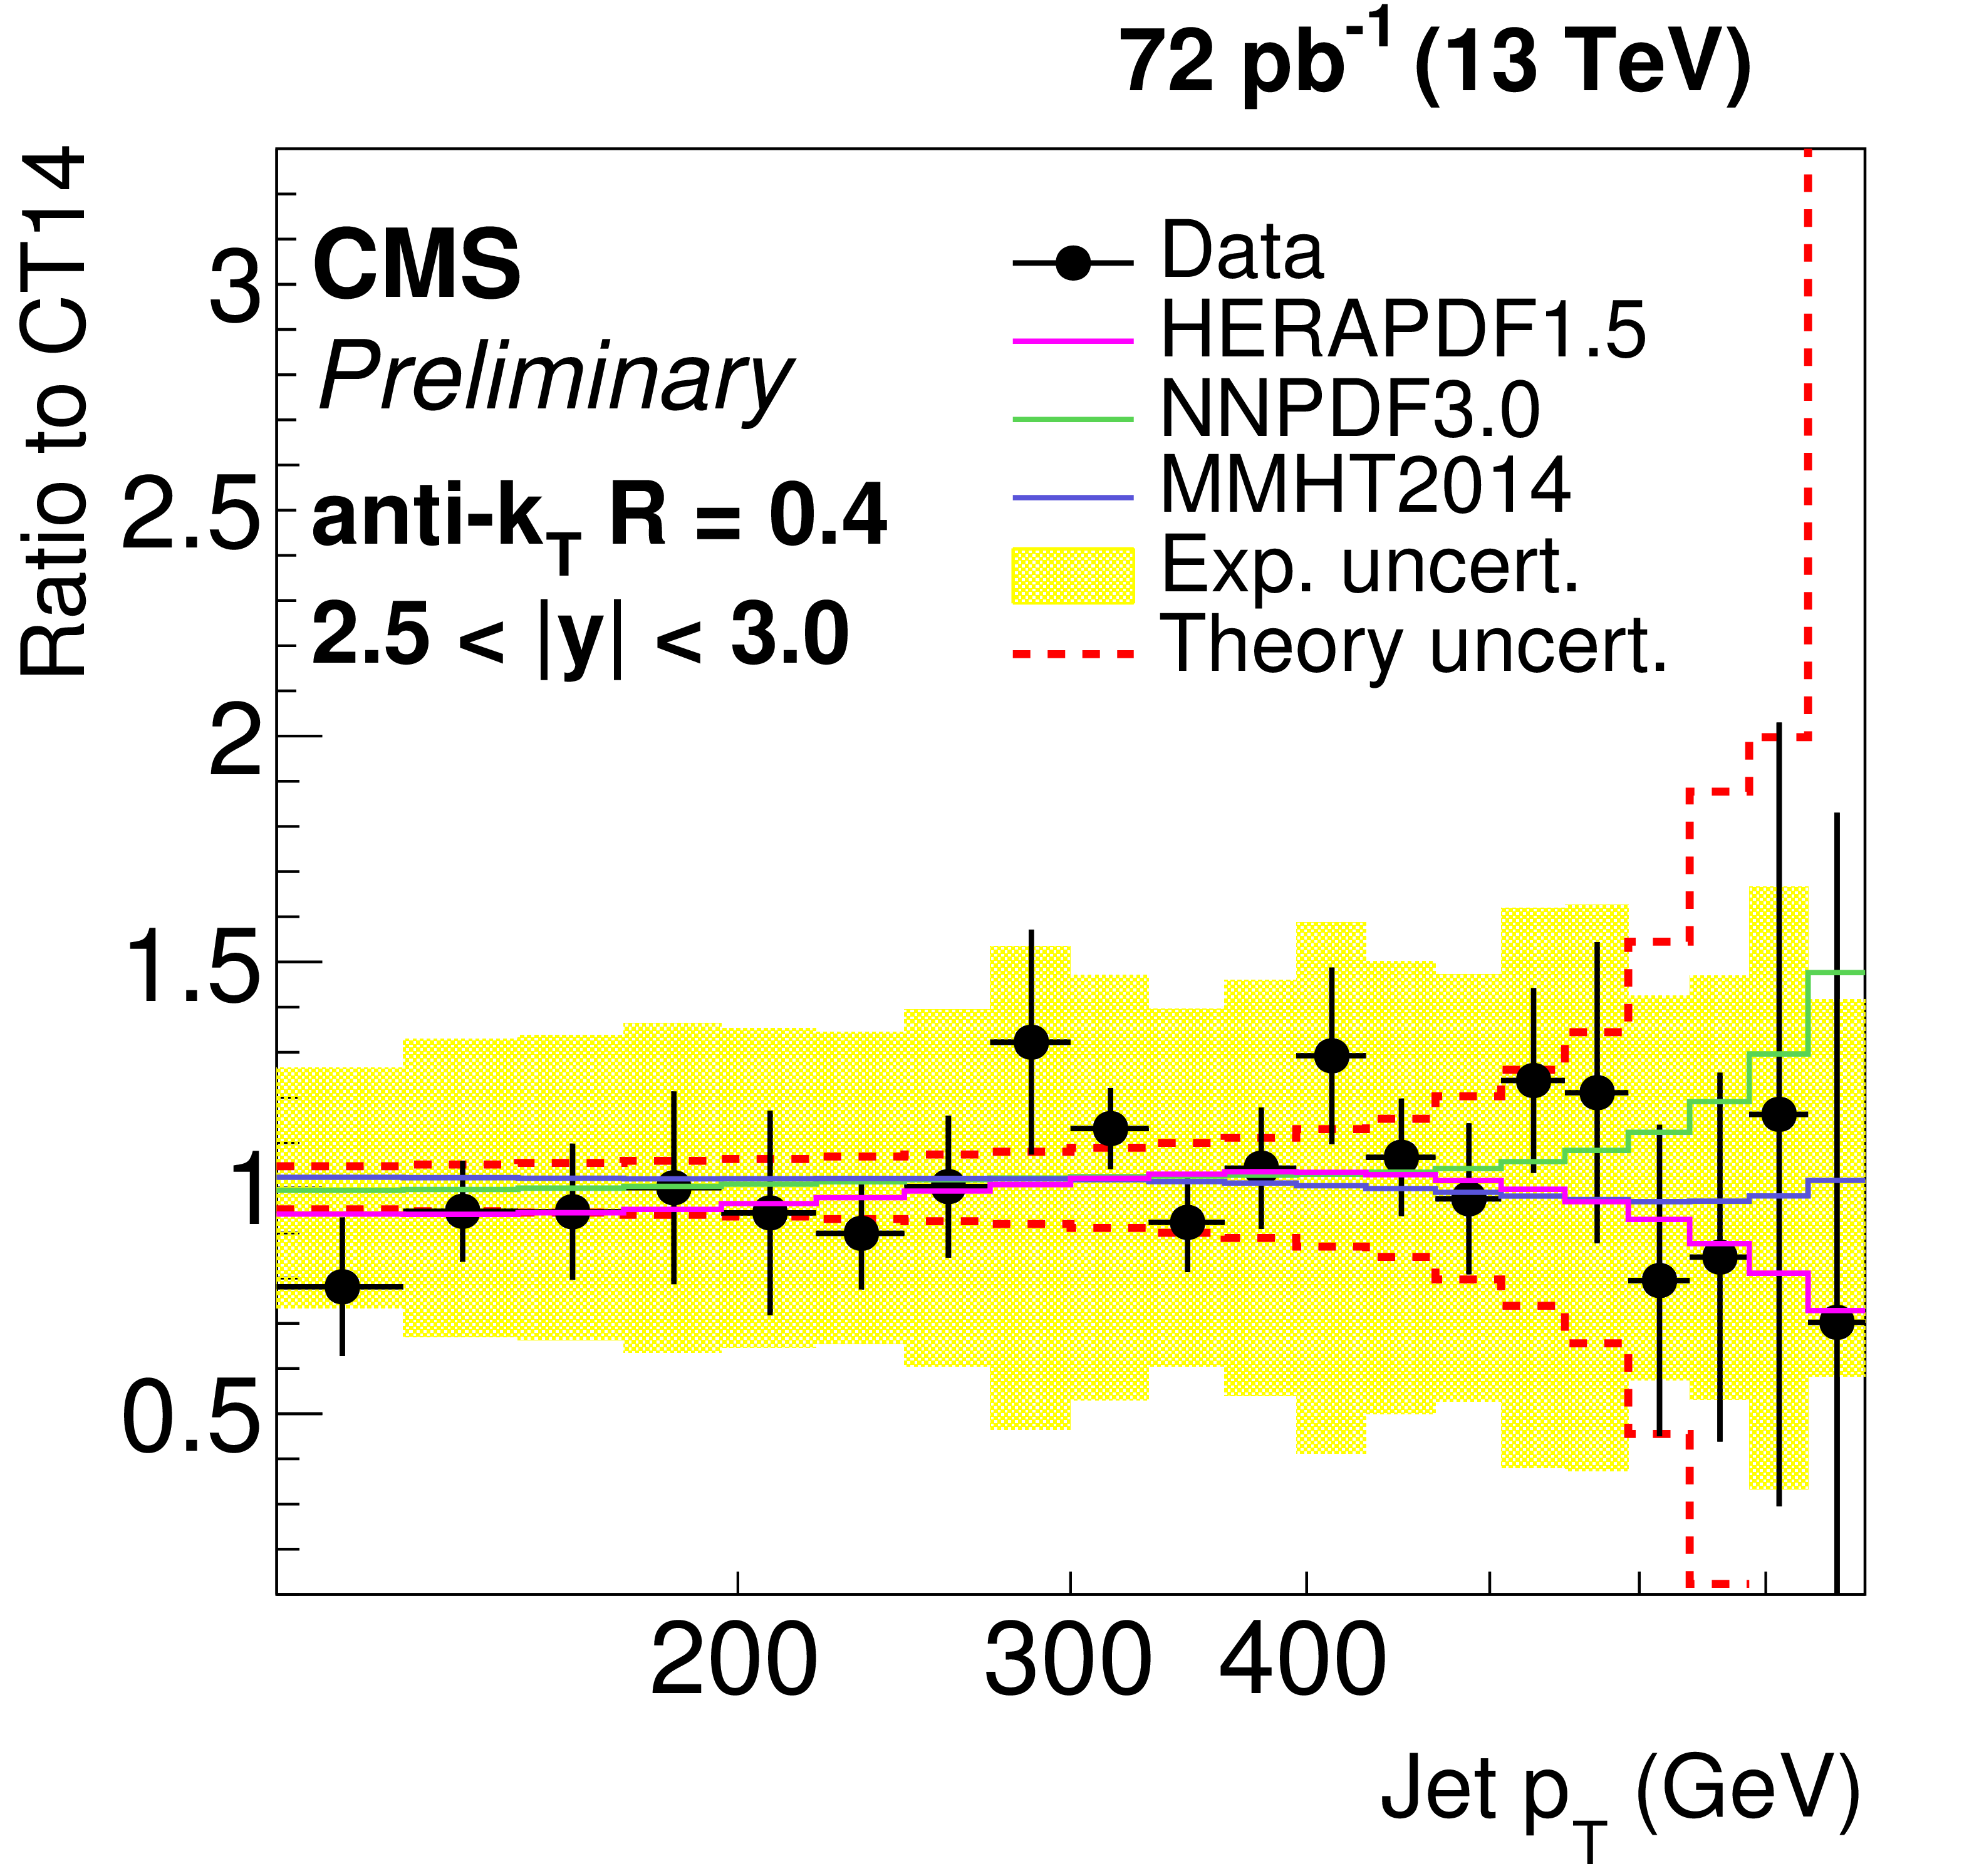
Figure 6-a:
Ratio of data over theory prediction using the CT14 PDF set. For comparison predictions employing three other PDF sets are also shown. Jets are clustered with the anti-$ {k_{\mathrm {T}}} $ algorithm ($R =$ 0.4). The error bars correspond to the statistical uncertainty of the data and the shaded band to the total systematical uncertainty. |
png ; pdf ; |
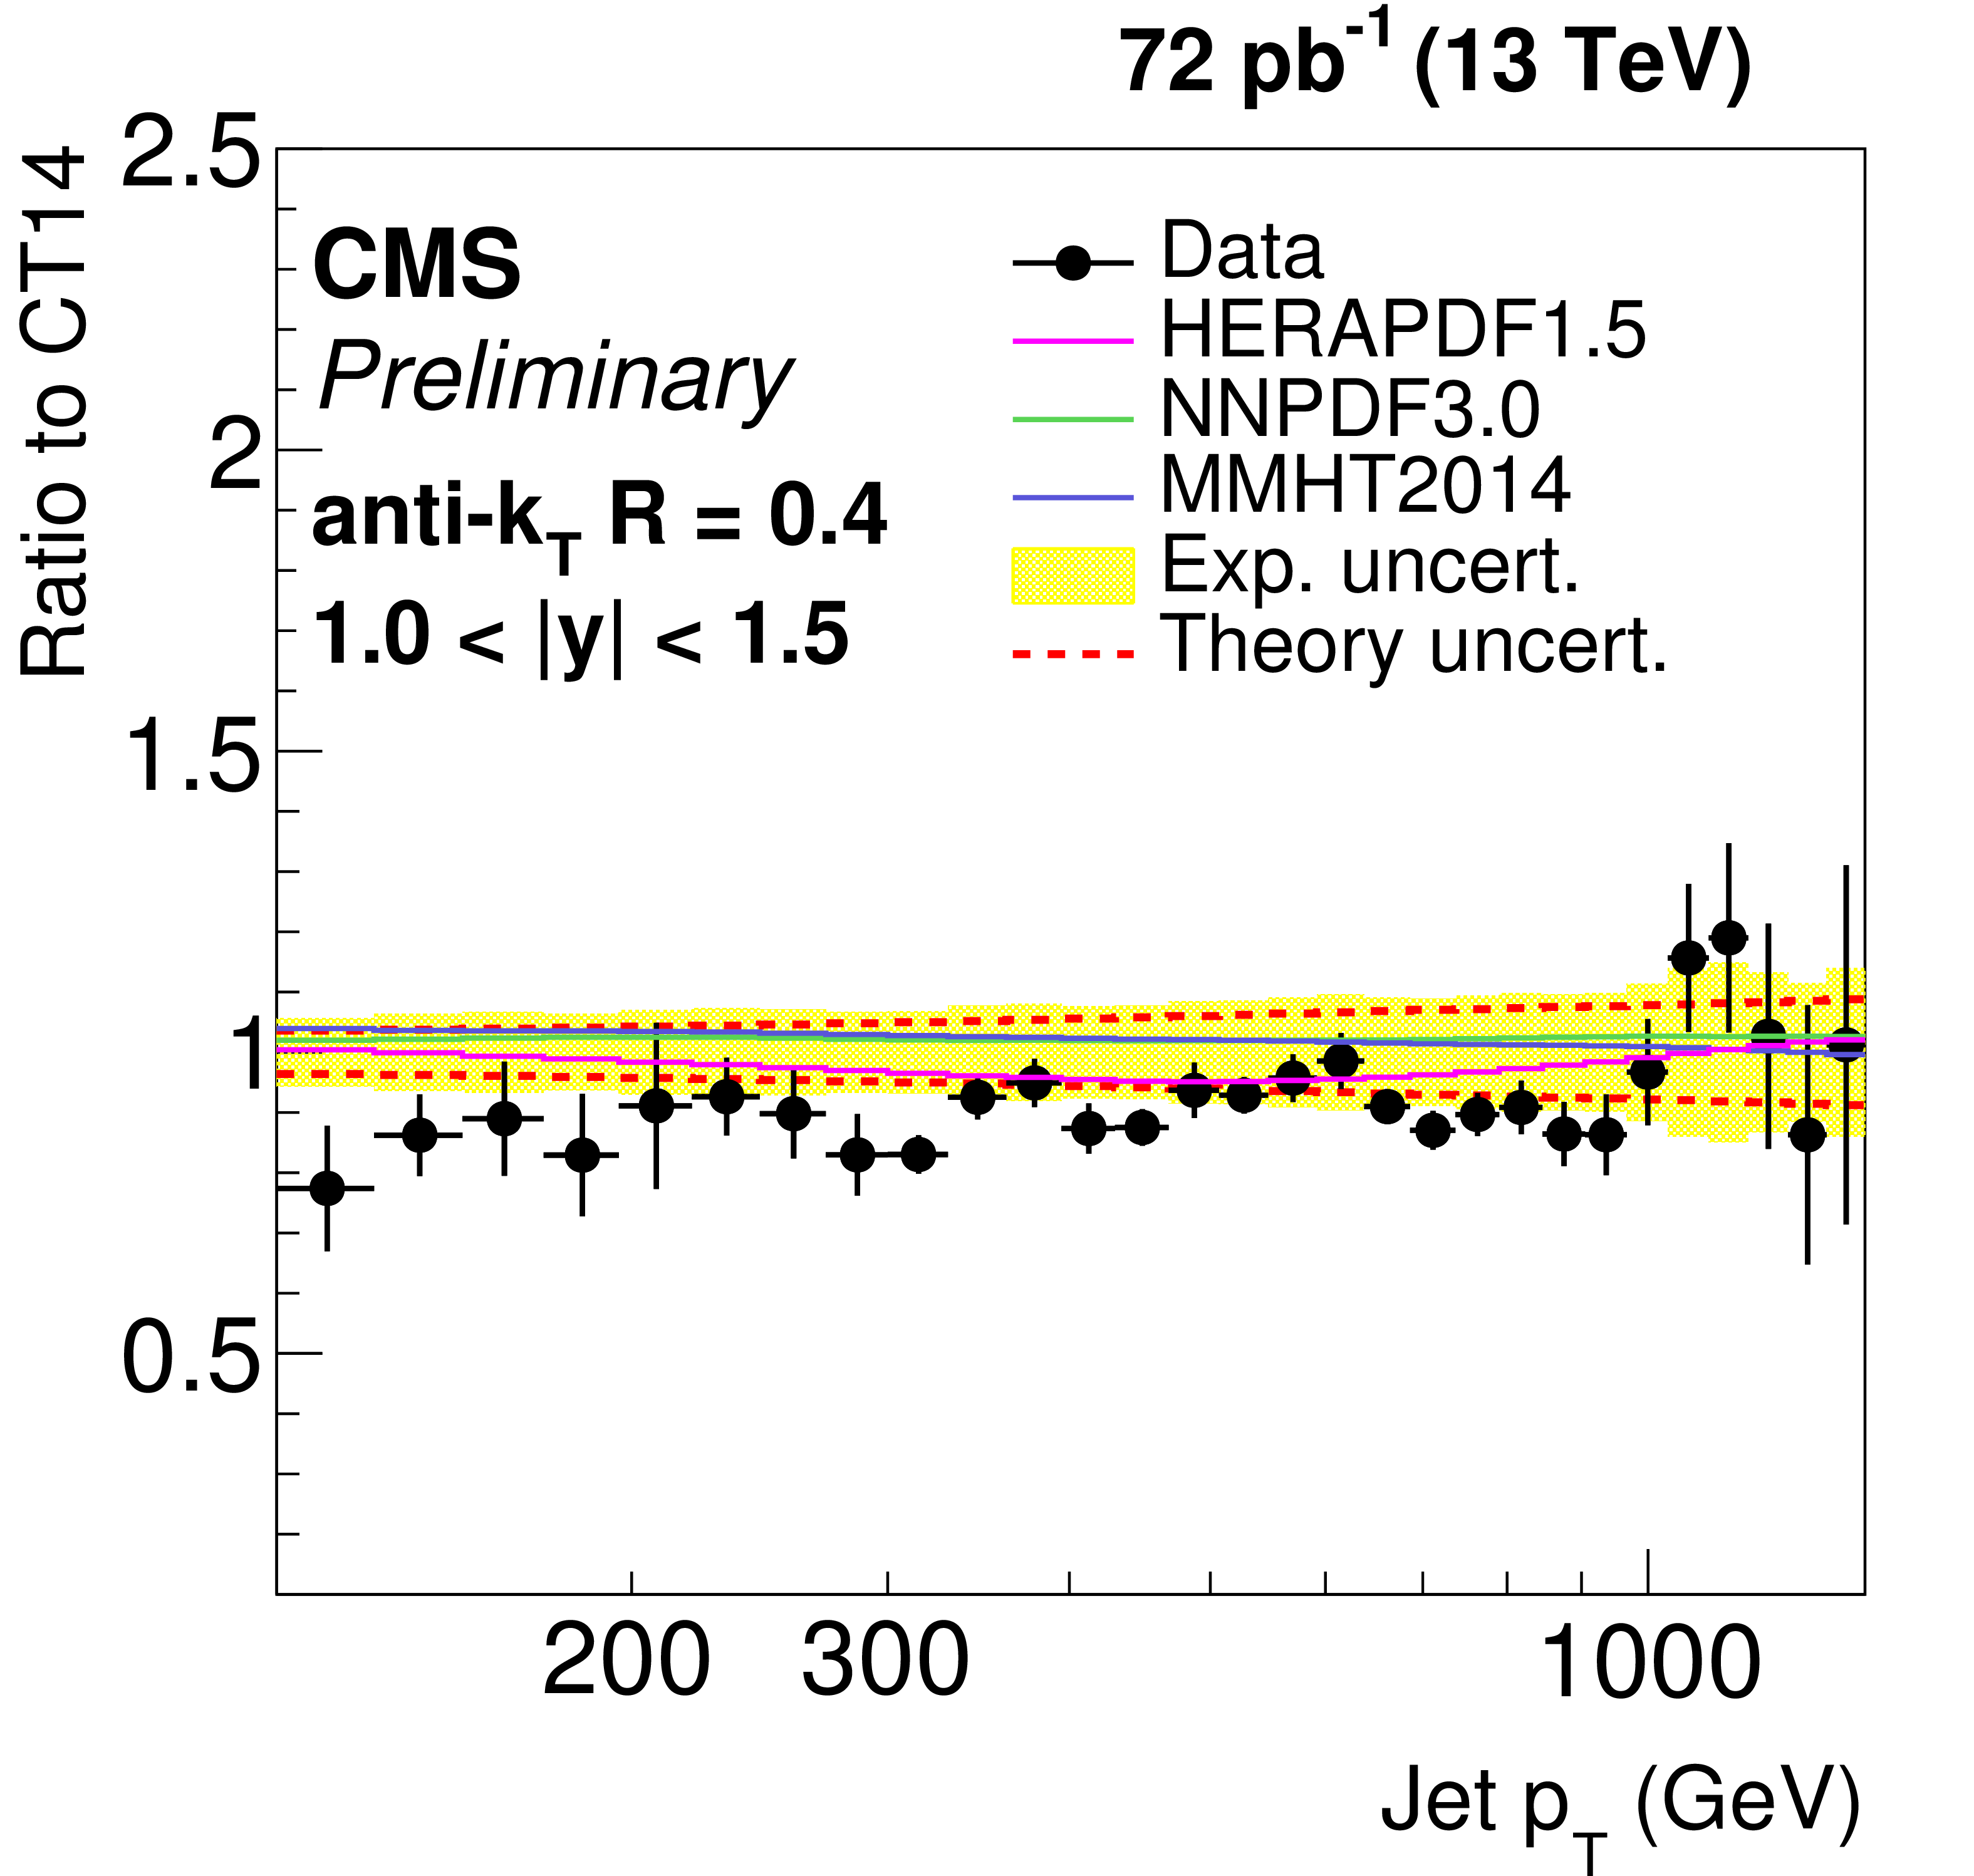
Figure 6-b:
Ratio of data over theory prediction using the CT14 PDF set. For comparison predictions employing three other PDF sets are also shown. Jets are clustered with the anti-$ {k_{\mathrm {T}}} $ algorithm ($R =$ 0.4). The error bars correspond to the statistical uncertainty of the data and the shaded band to the total systematical uncertainty. |
png ; pdf ; |
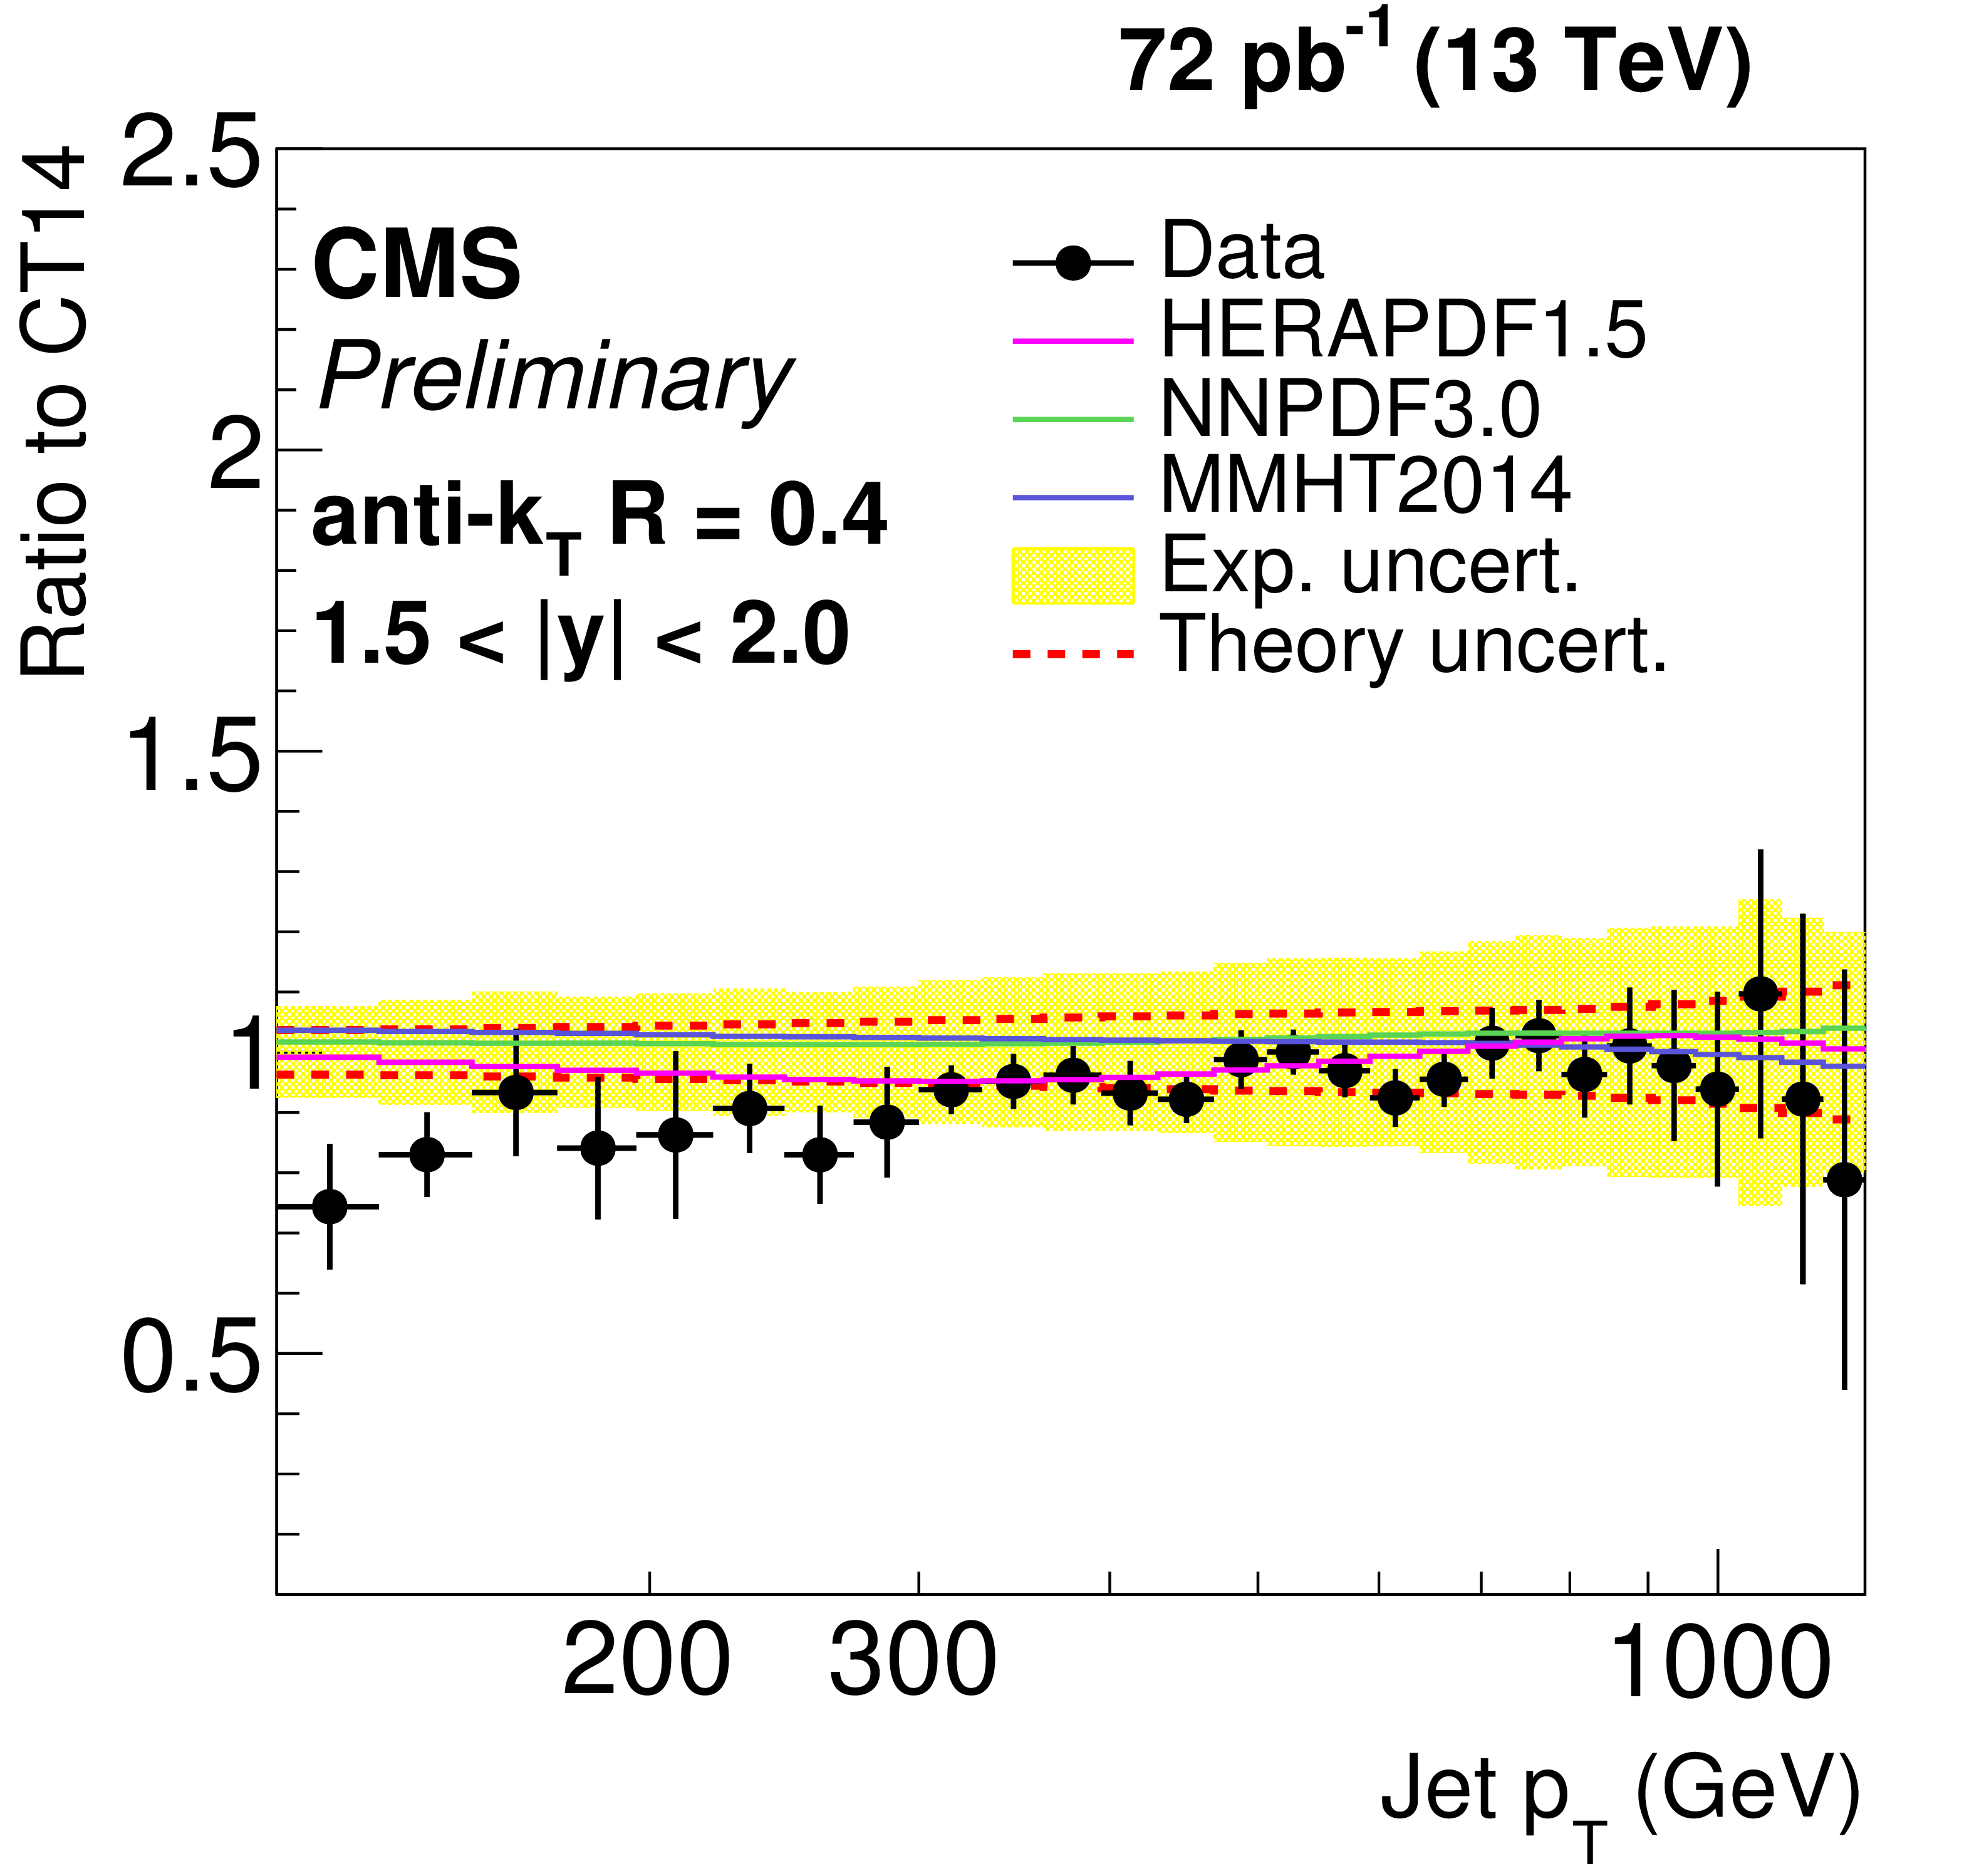
Figure 6-c:
Ratio of data over theory prediction using the CT14 PDF set. For comparison predictions employing three other PDF sets are also shown. Jets are clustered with the anti-$ {k_{\mathrm {T}}} $ algorithm ($R =$ 0.4). The error bars correspond to the statistical uncertainty of the data and the shaded band to the total systematical uncertainty. |
png ; pdf ; |
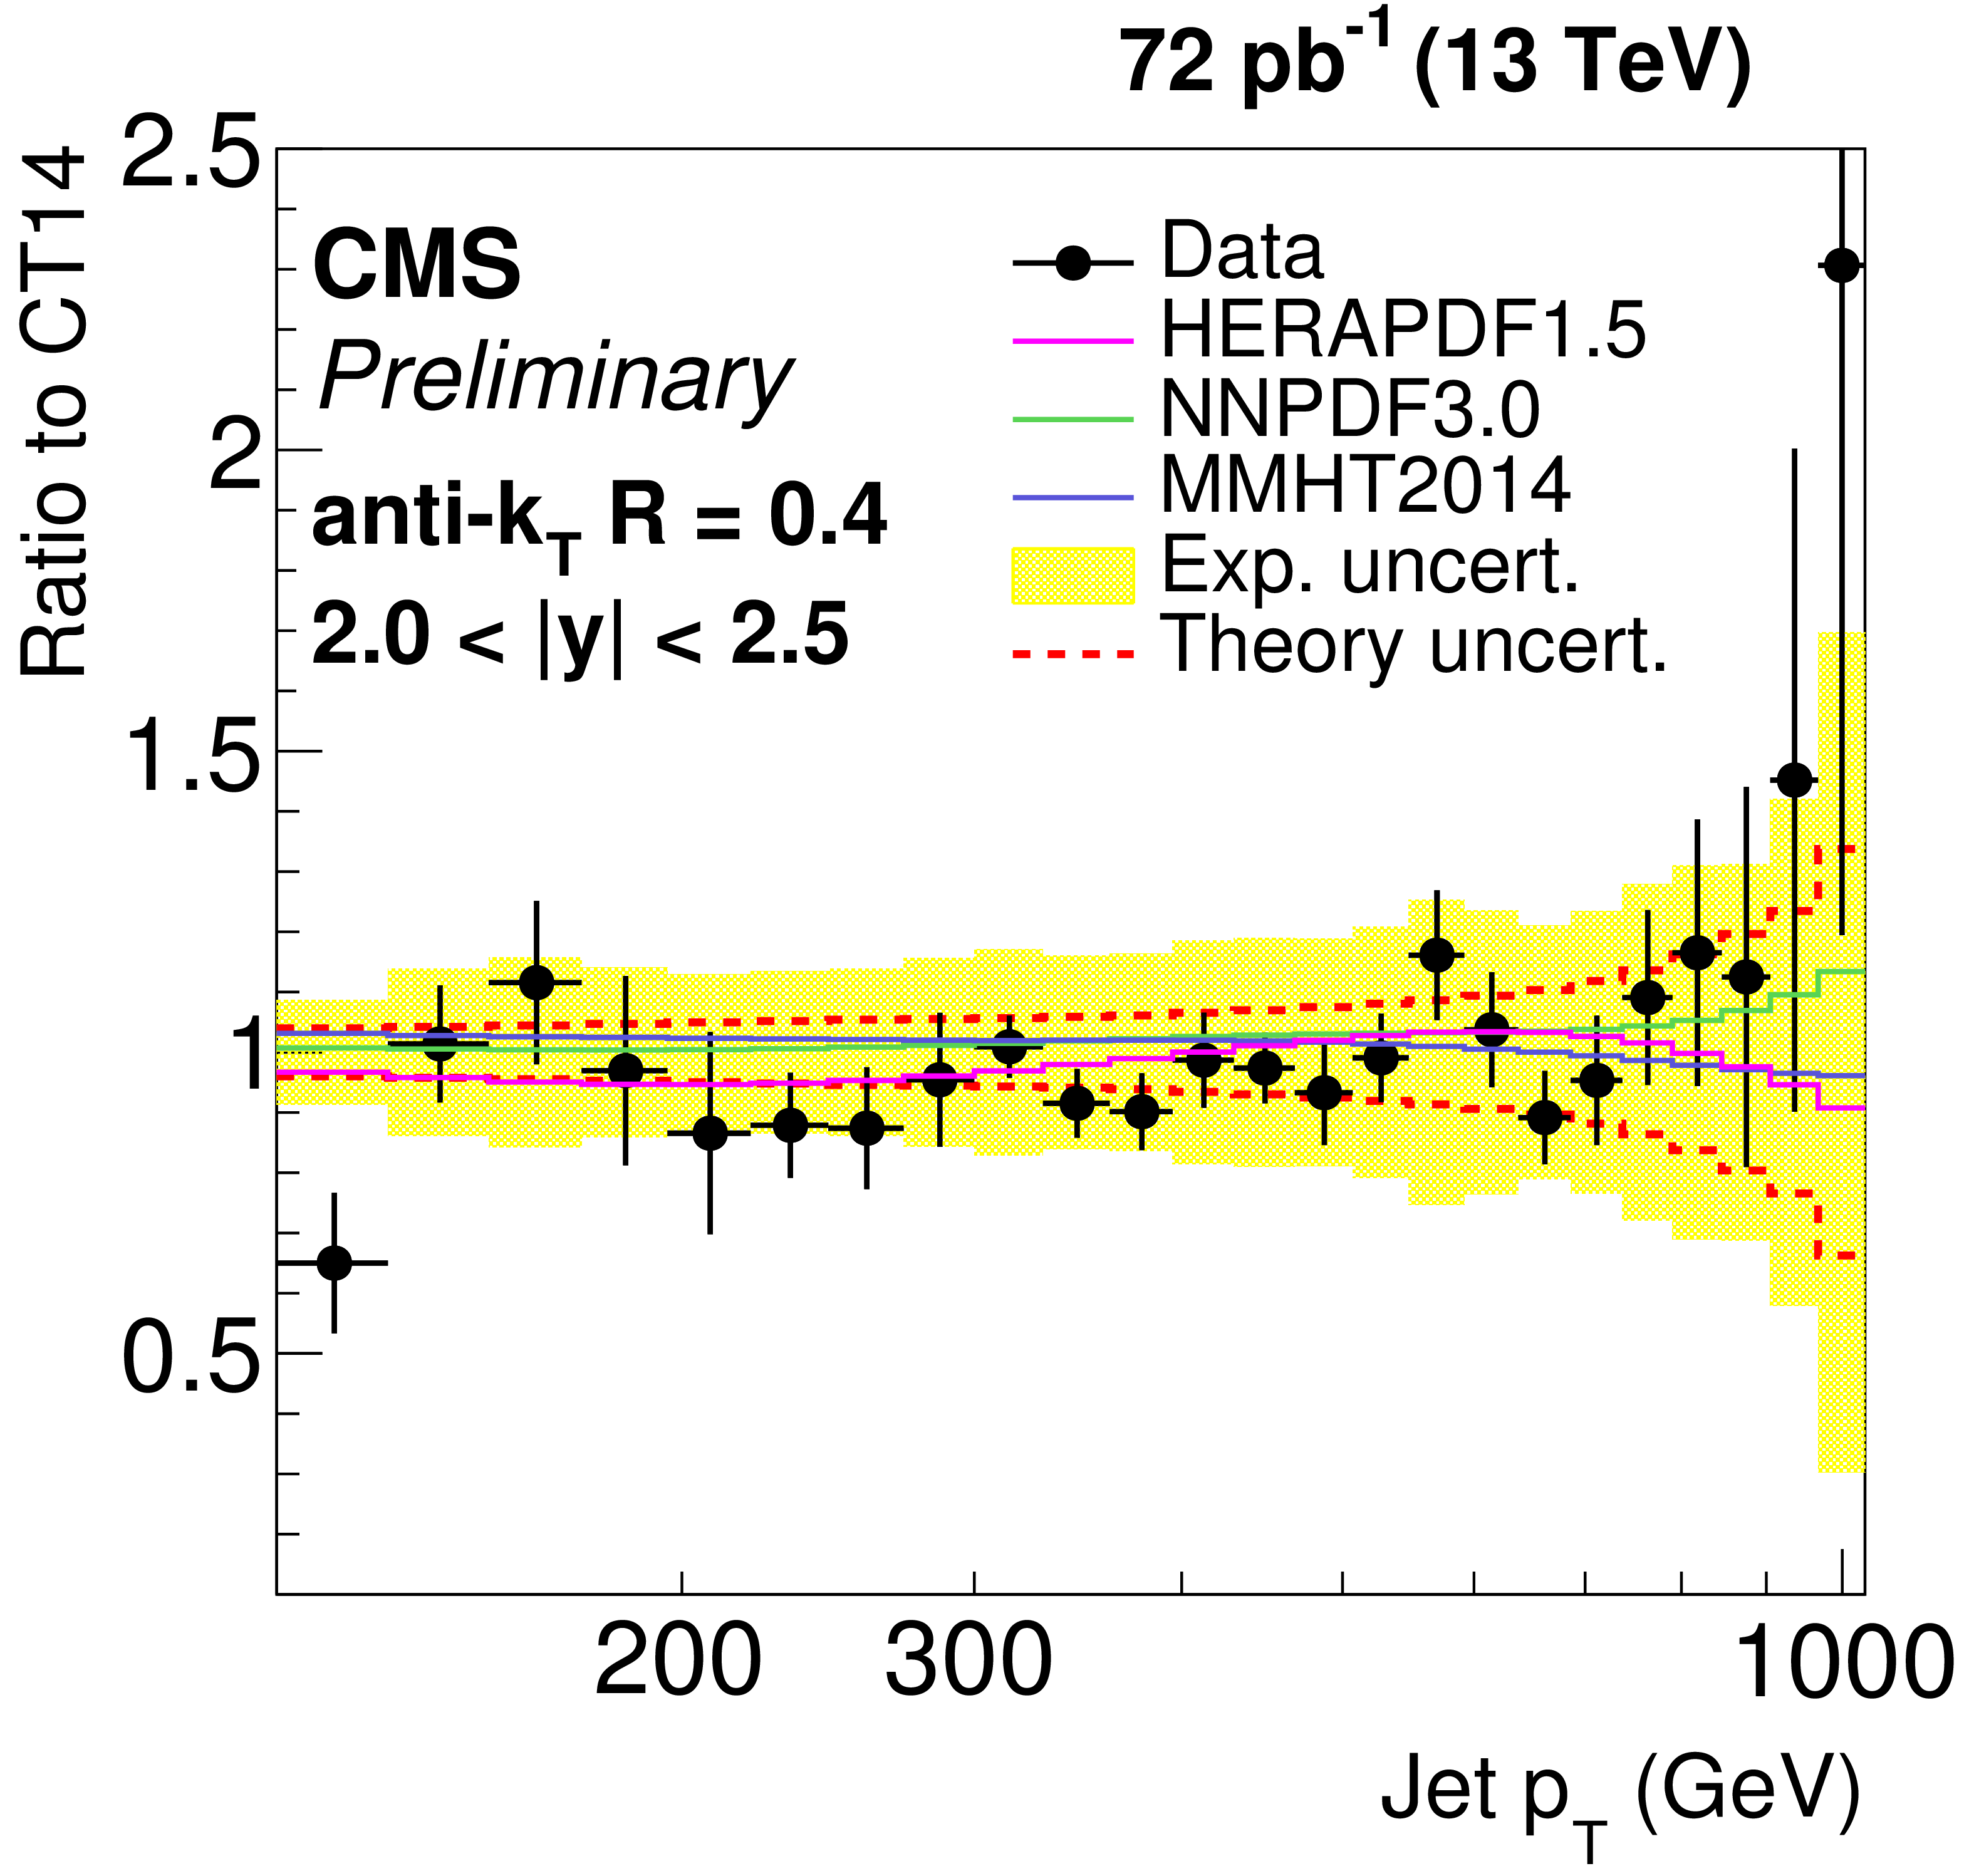
Figure 6-d:
Ratio of data over theory prediction using the CT14 PDF set. For comparison predictions employing three other PDF sets are also shown. Jets are clustered with the anti-$ {k_{\mathrm {T}}} $ algorithm ($R =$ 0.4). The error bars correspond to the statistical uncertainty of the data and the shaded band to the total systematical uncertainty. |
png ; pdf ; |
Figure 6-e:
Ratio of data over theory prediction using the CT14 PDF set. For comparison predictions employing three other PDF sets are also shown. Jets are clustered with the anti-$ {k_{\mathrm {T}}} $ algorithm ($R =$ 0.4). The error bars correspond to the statistical uncertainty of the data and the shaded band to the total systematical uncertainty. |
png ; pdf ; |
Figure 6-f:
Ratio of data over theory prediction using the CT14 PDF set. For comparison predictions employing three other PDF sets are also shown. Jets are clustered with the anti-$ {k_{\mathrm {T}}} $ algorithm ($R =$ 0.4). The error bars correspond to the statistical uncertainty of the data and the shaded band to the total systematical uncertainty. |
png ; pdf ; |
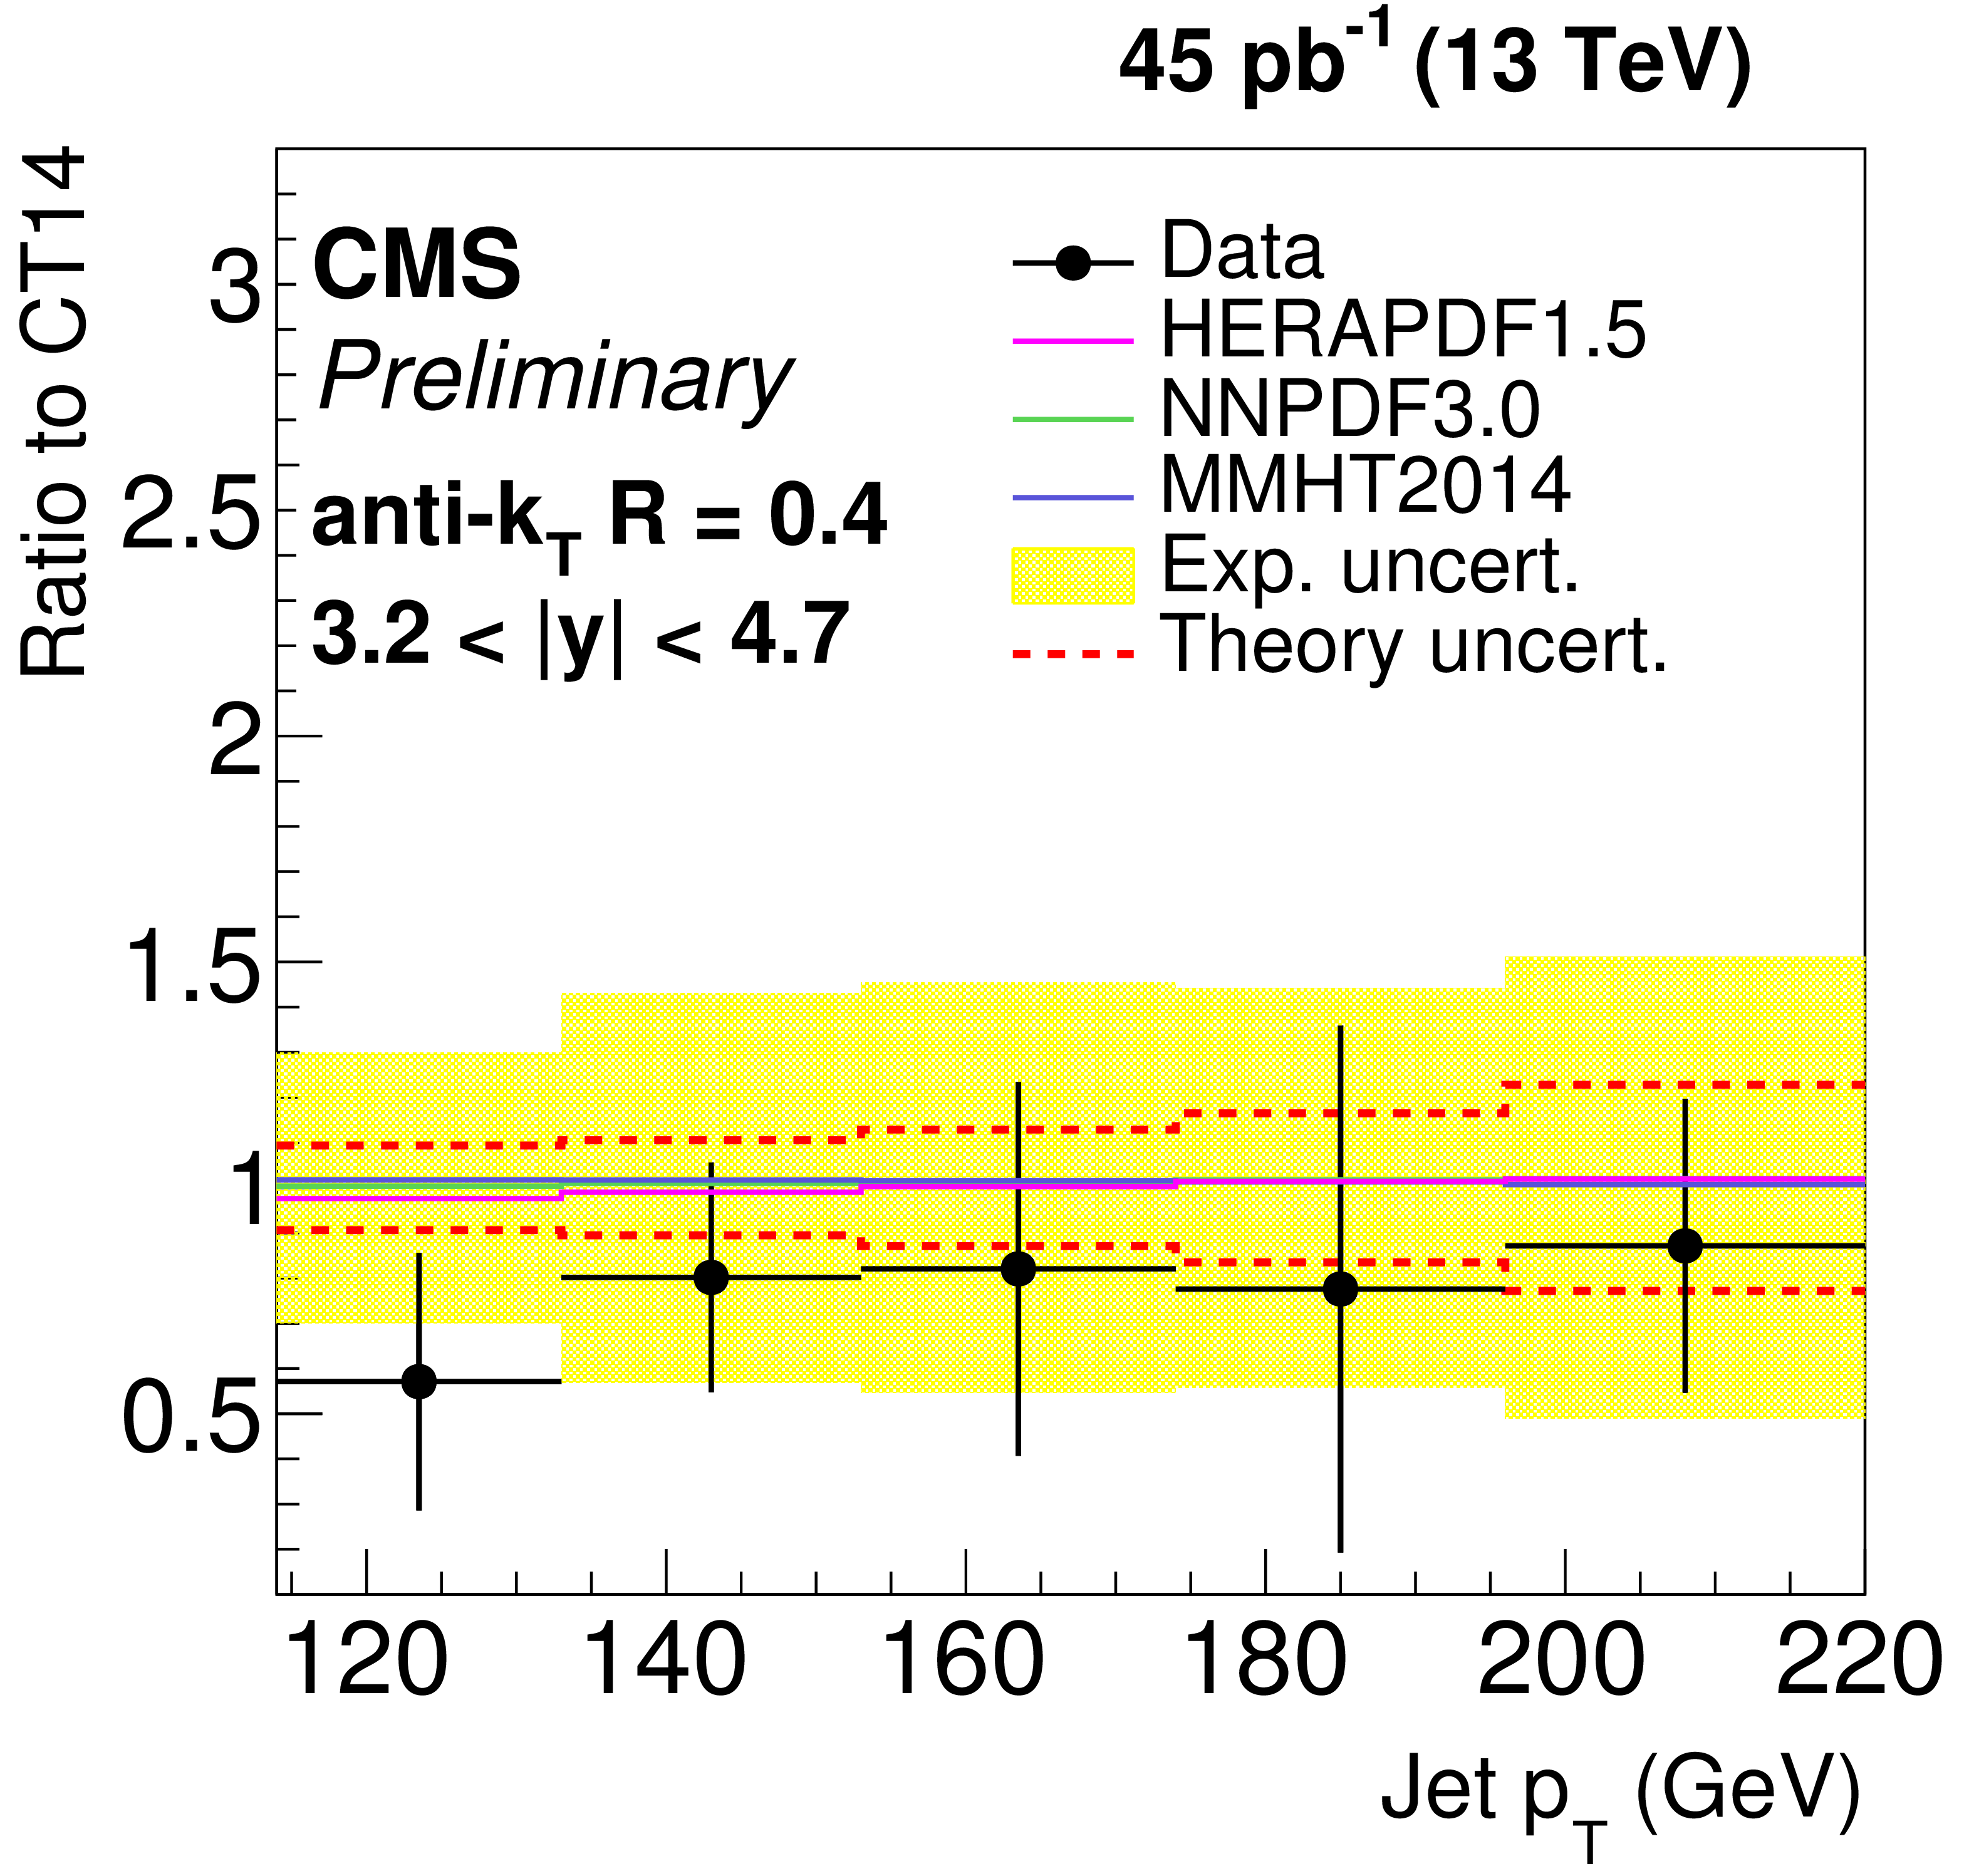
Figure 6-g:
Ratio of data over theory prediction using the CT14 PDF set. For comparison predictions employing three other PDF sets are also shown. Jets are clustered with the anti-$ {k_{\mathrm {T}}} $ algorithm ($R =$ 0.4). The error bars correspond to the statistical uncertainty of the data and the shaded band to the total systematical uncertainty. |
png ; pdf ; |
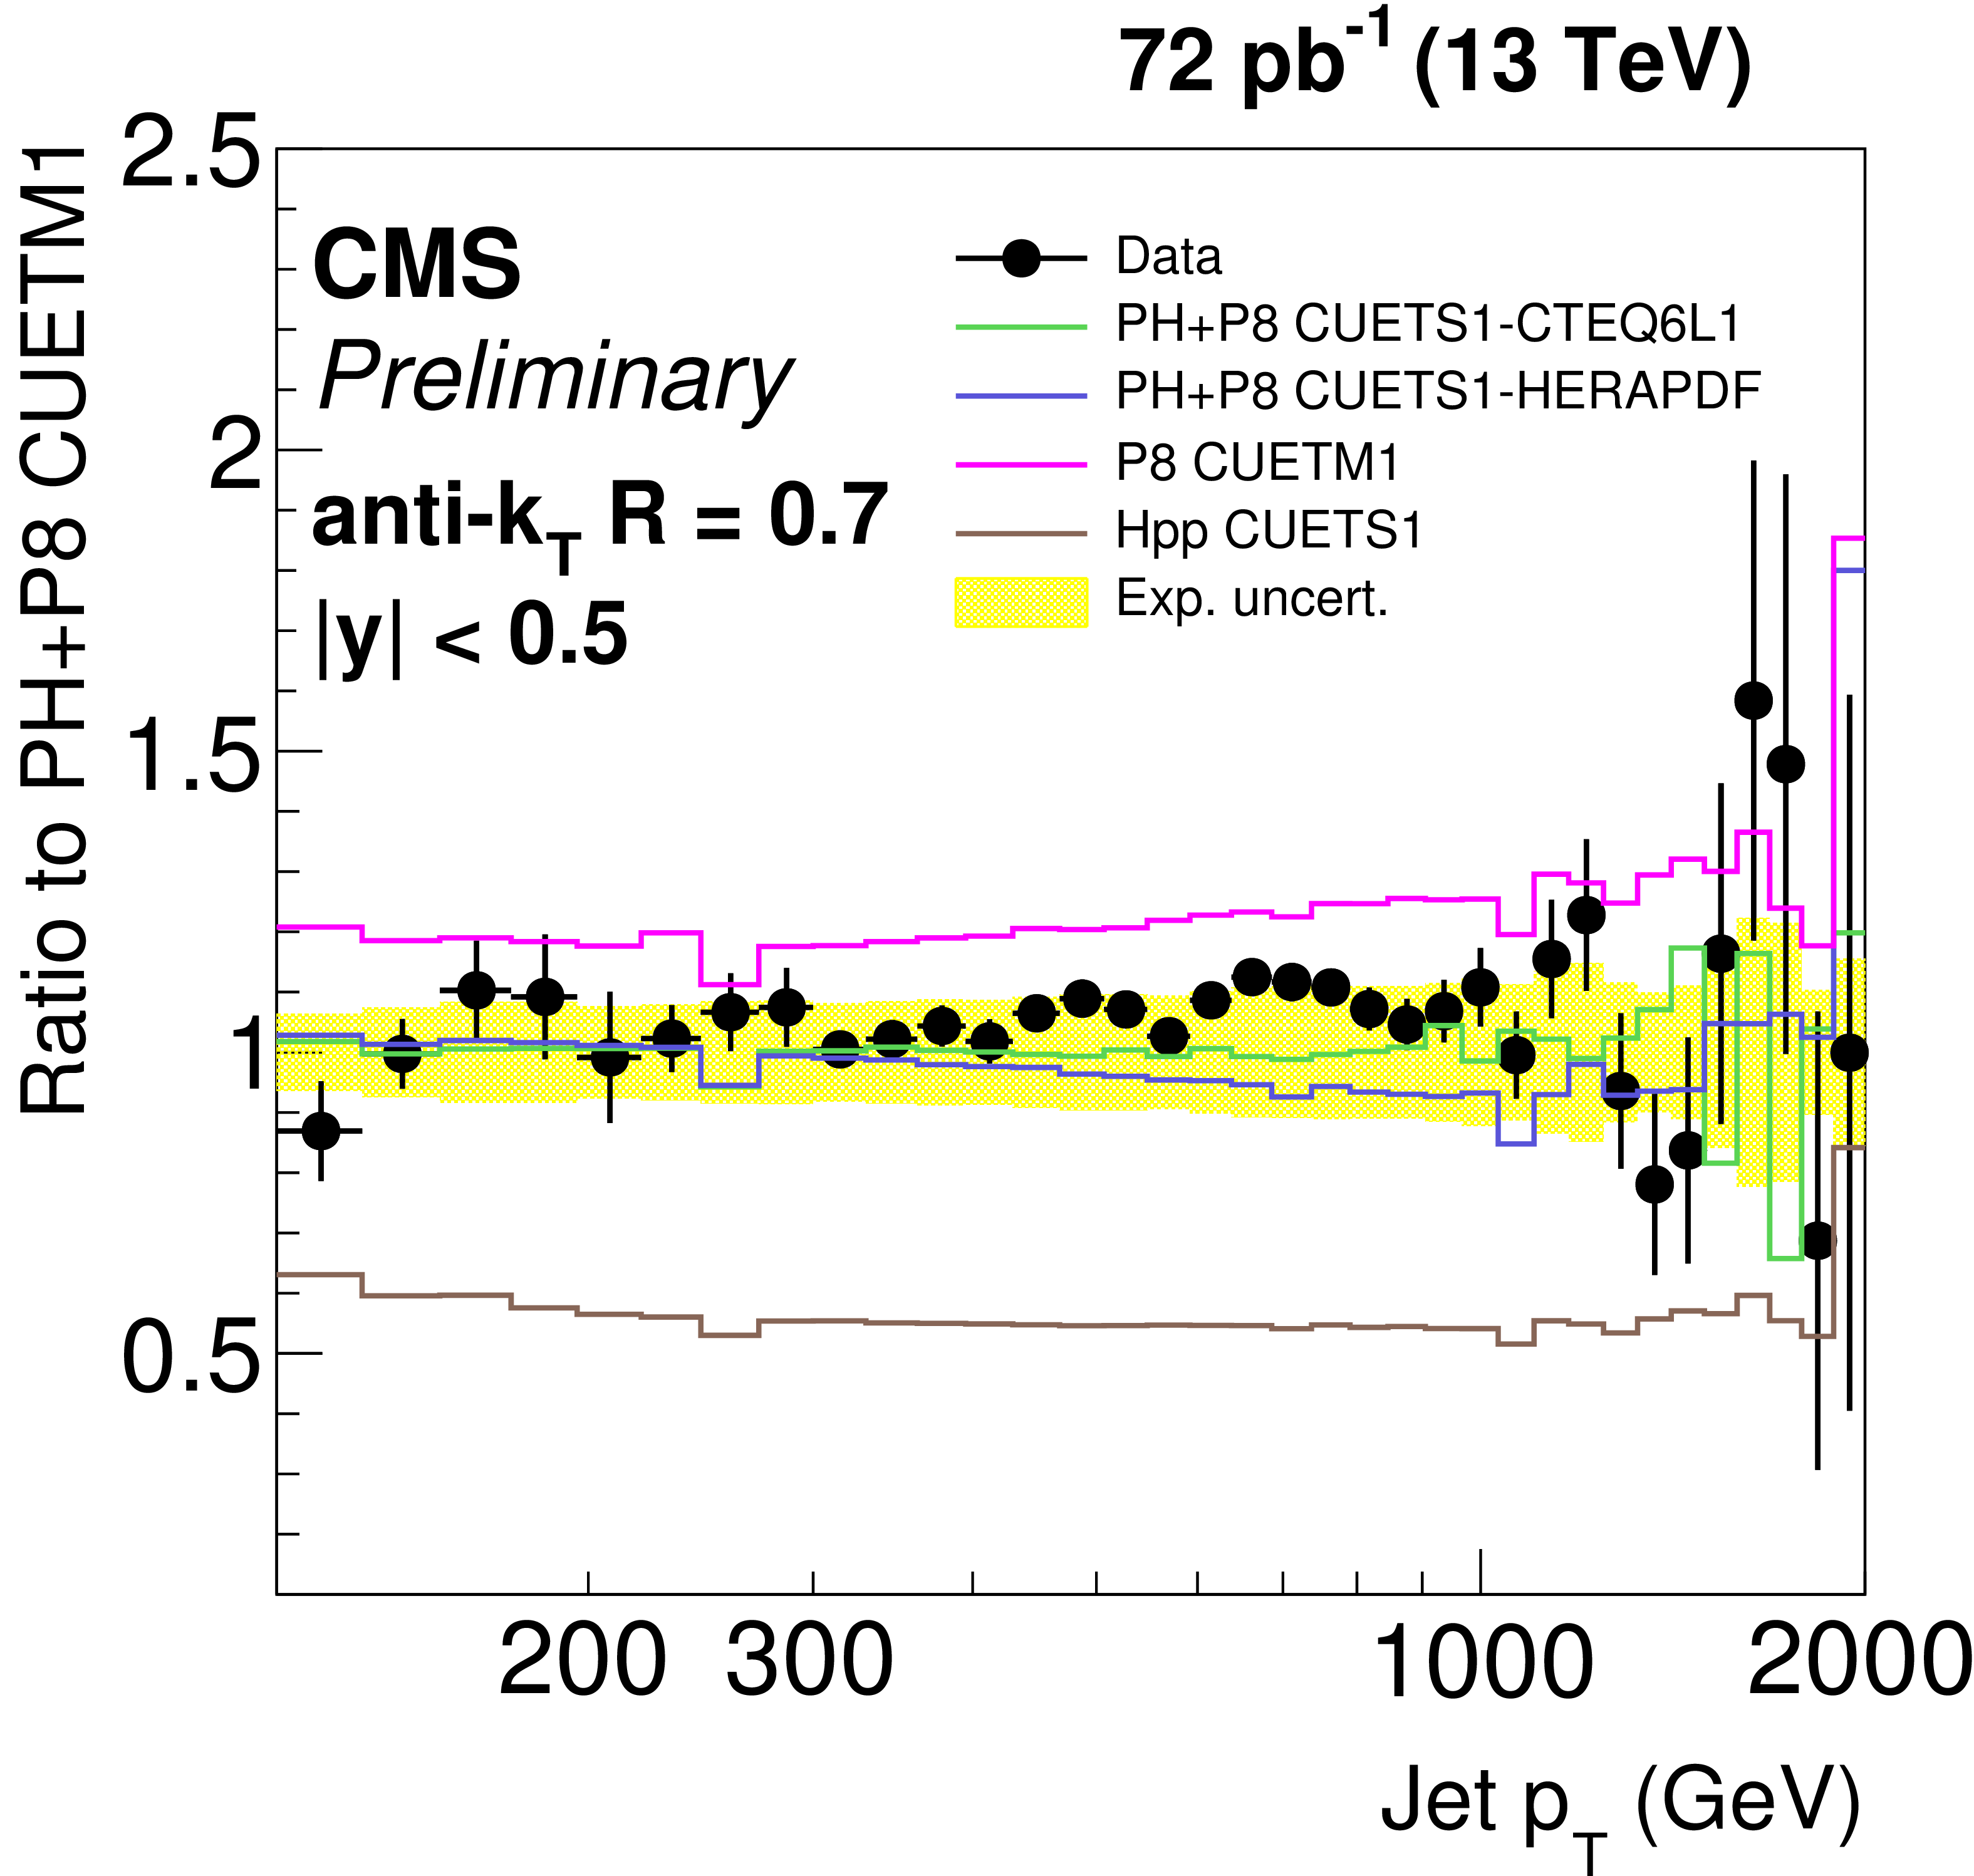
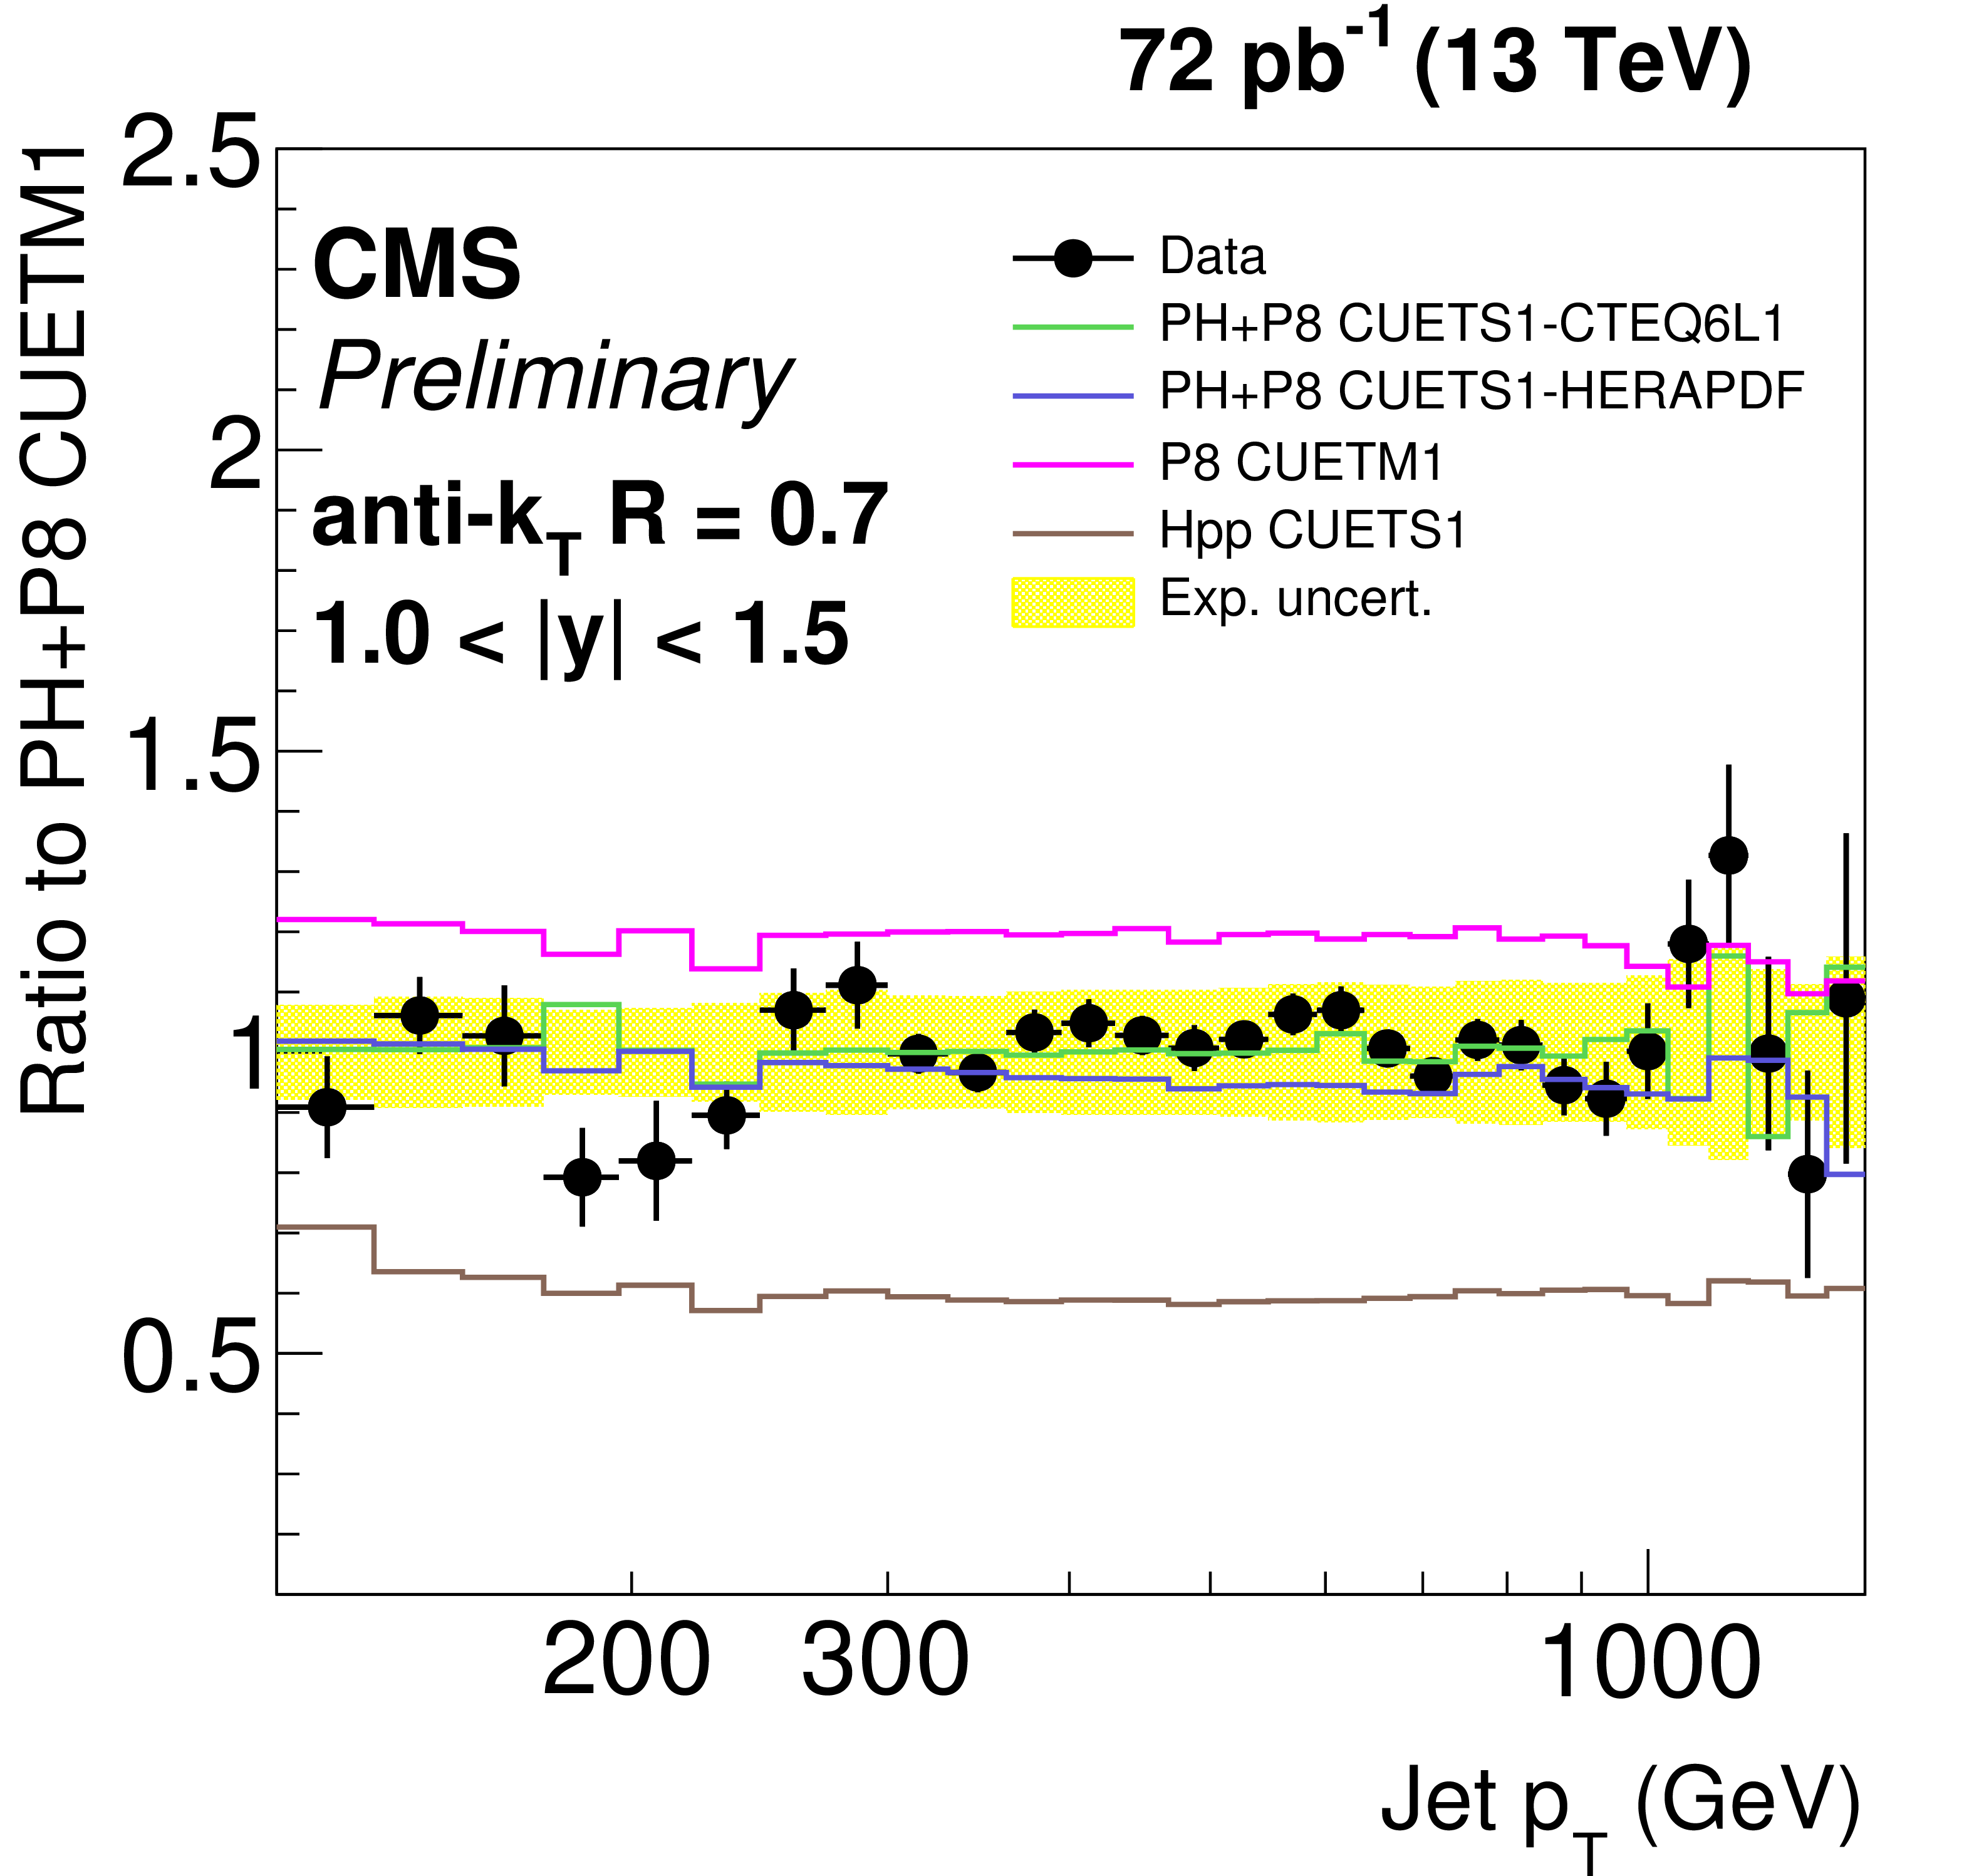
Figure 7-a:
Ratio of data over predictions from POWHEG + PYTHIA8 with tune CUETM1. For comparison predictions employing four other MC generators are also shown, where PH, P8 and Hpp stands for POWHEG , PYTHIA8 and HERWIG++ respectively. Jets are clustered with the anti-$ {k_{\mathrm {T}}} $ algorithm ($R =$ 0.7). The error bars correspond to the statistical uncertainty of the data and the shaded band to the total systematical uncertainty. |
png ; pdf ; |
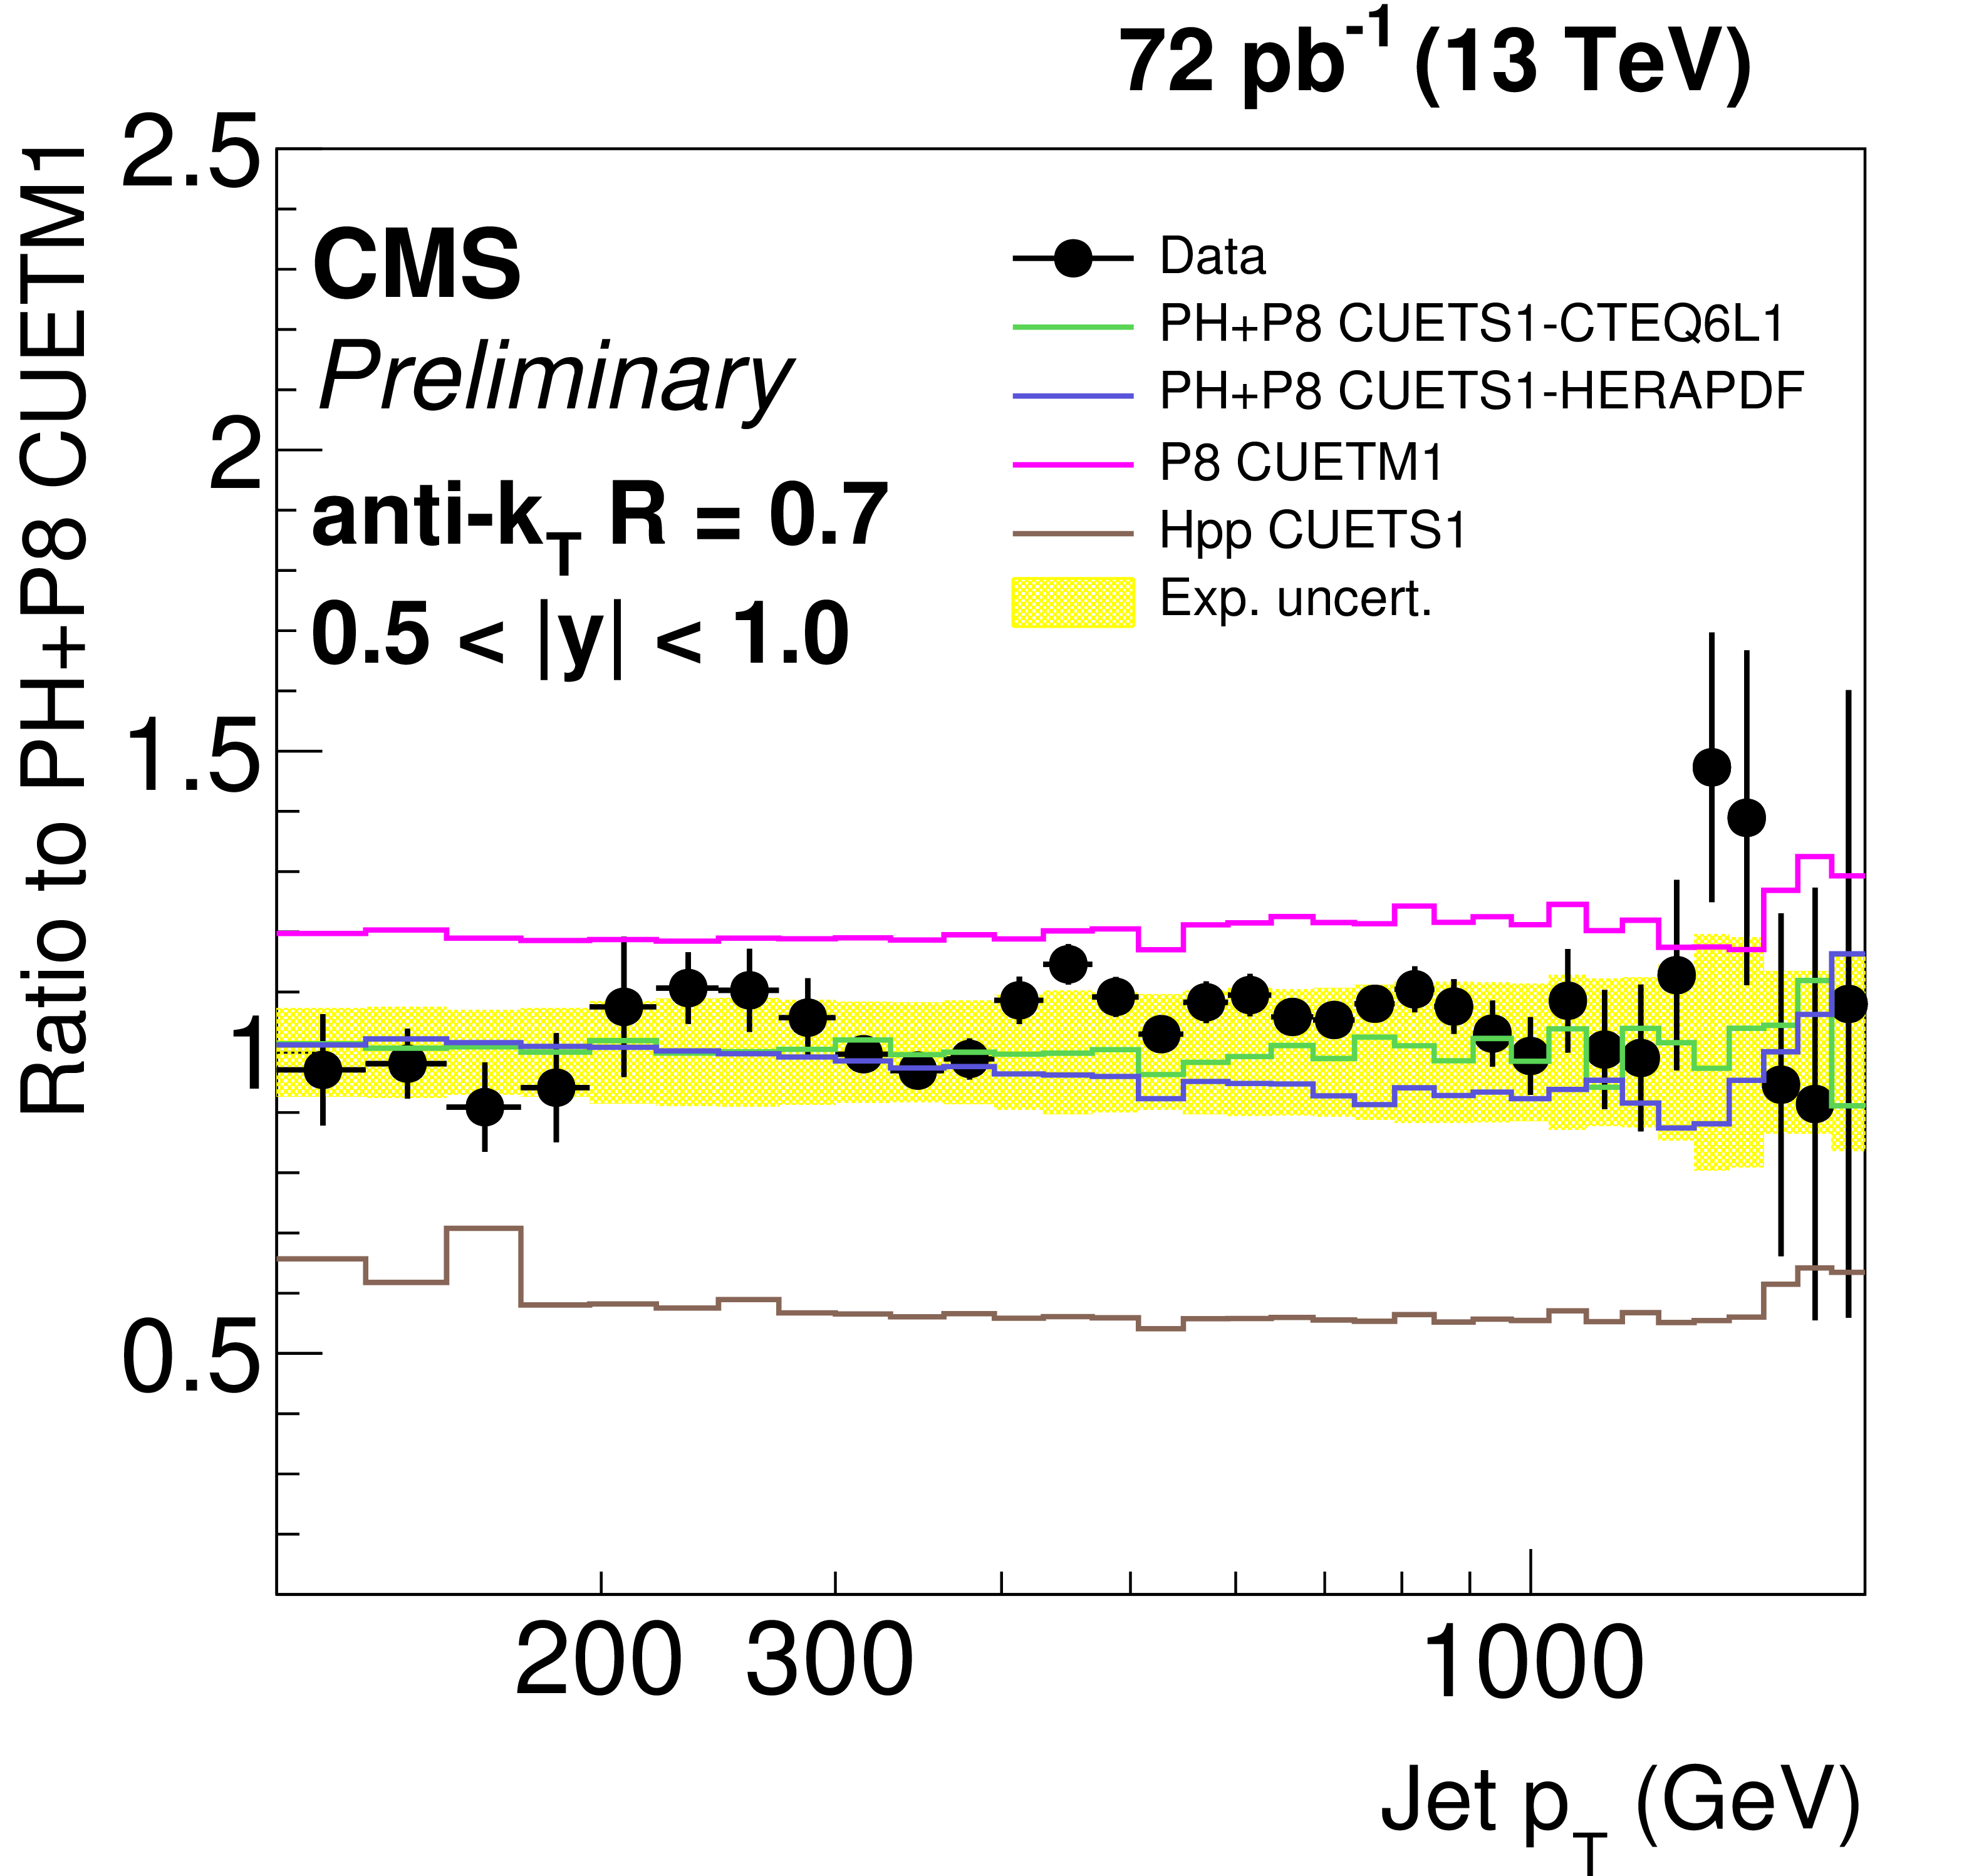
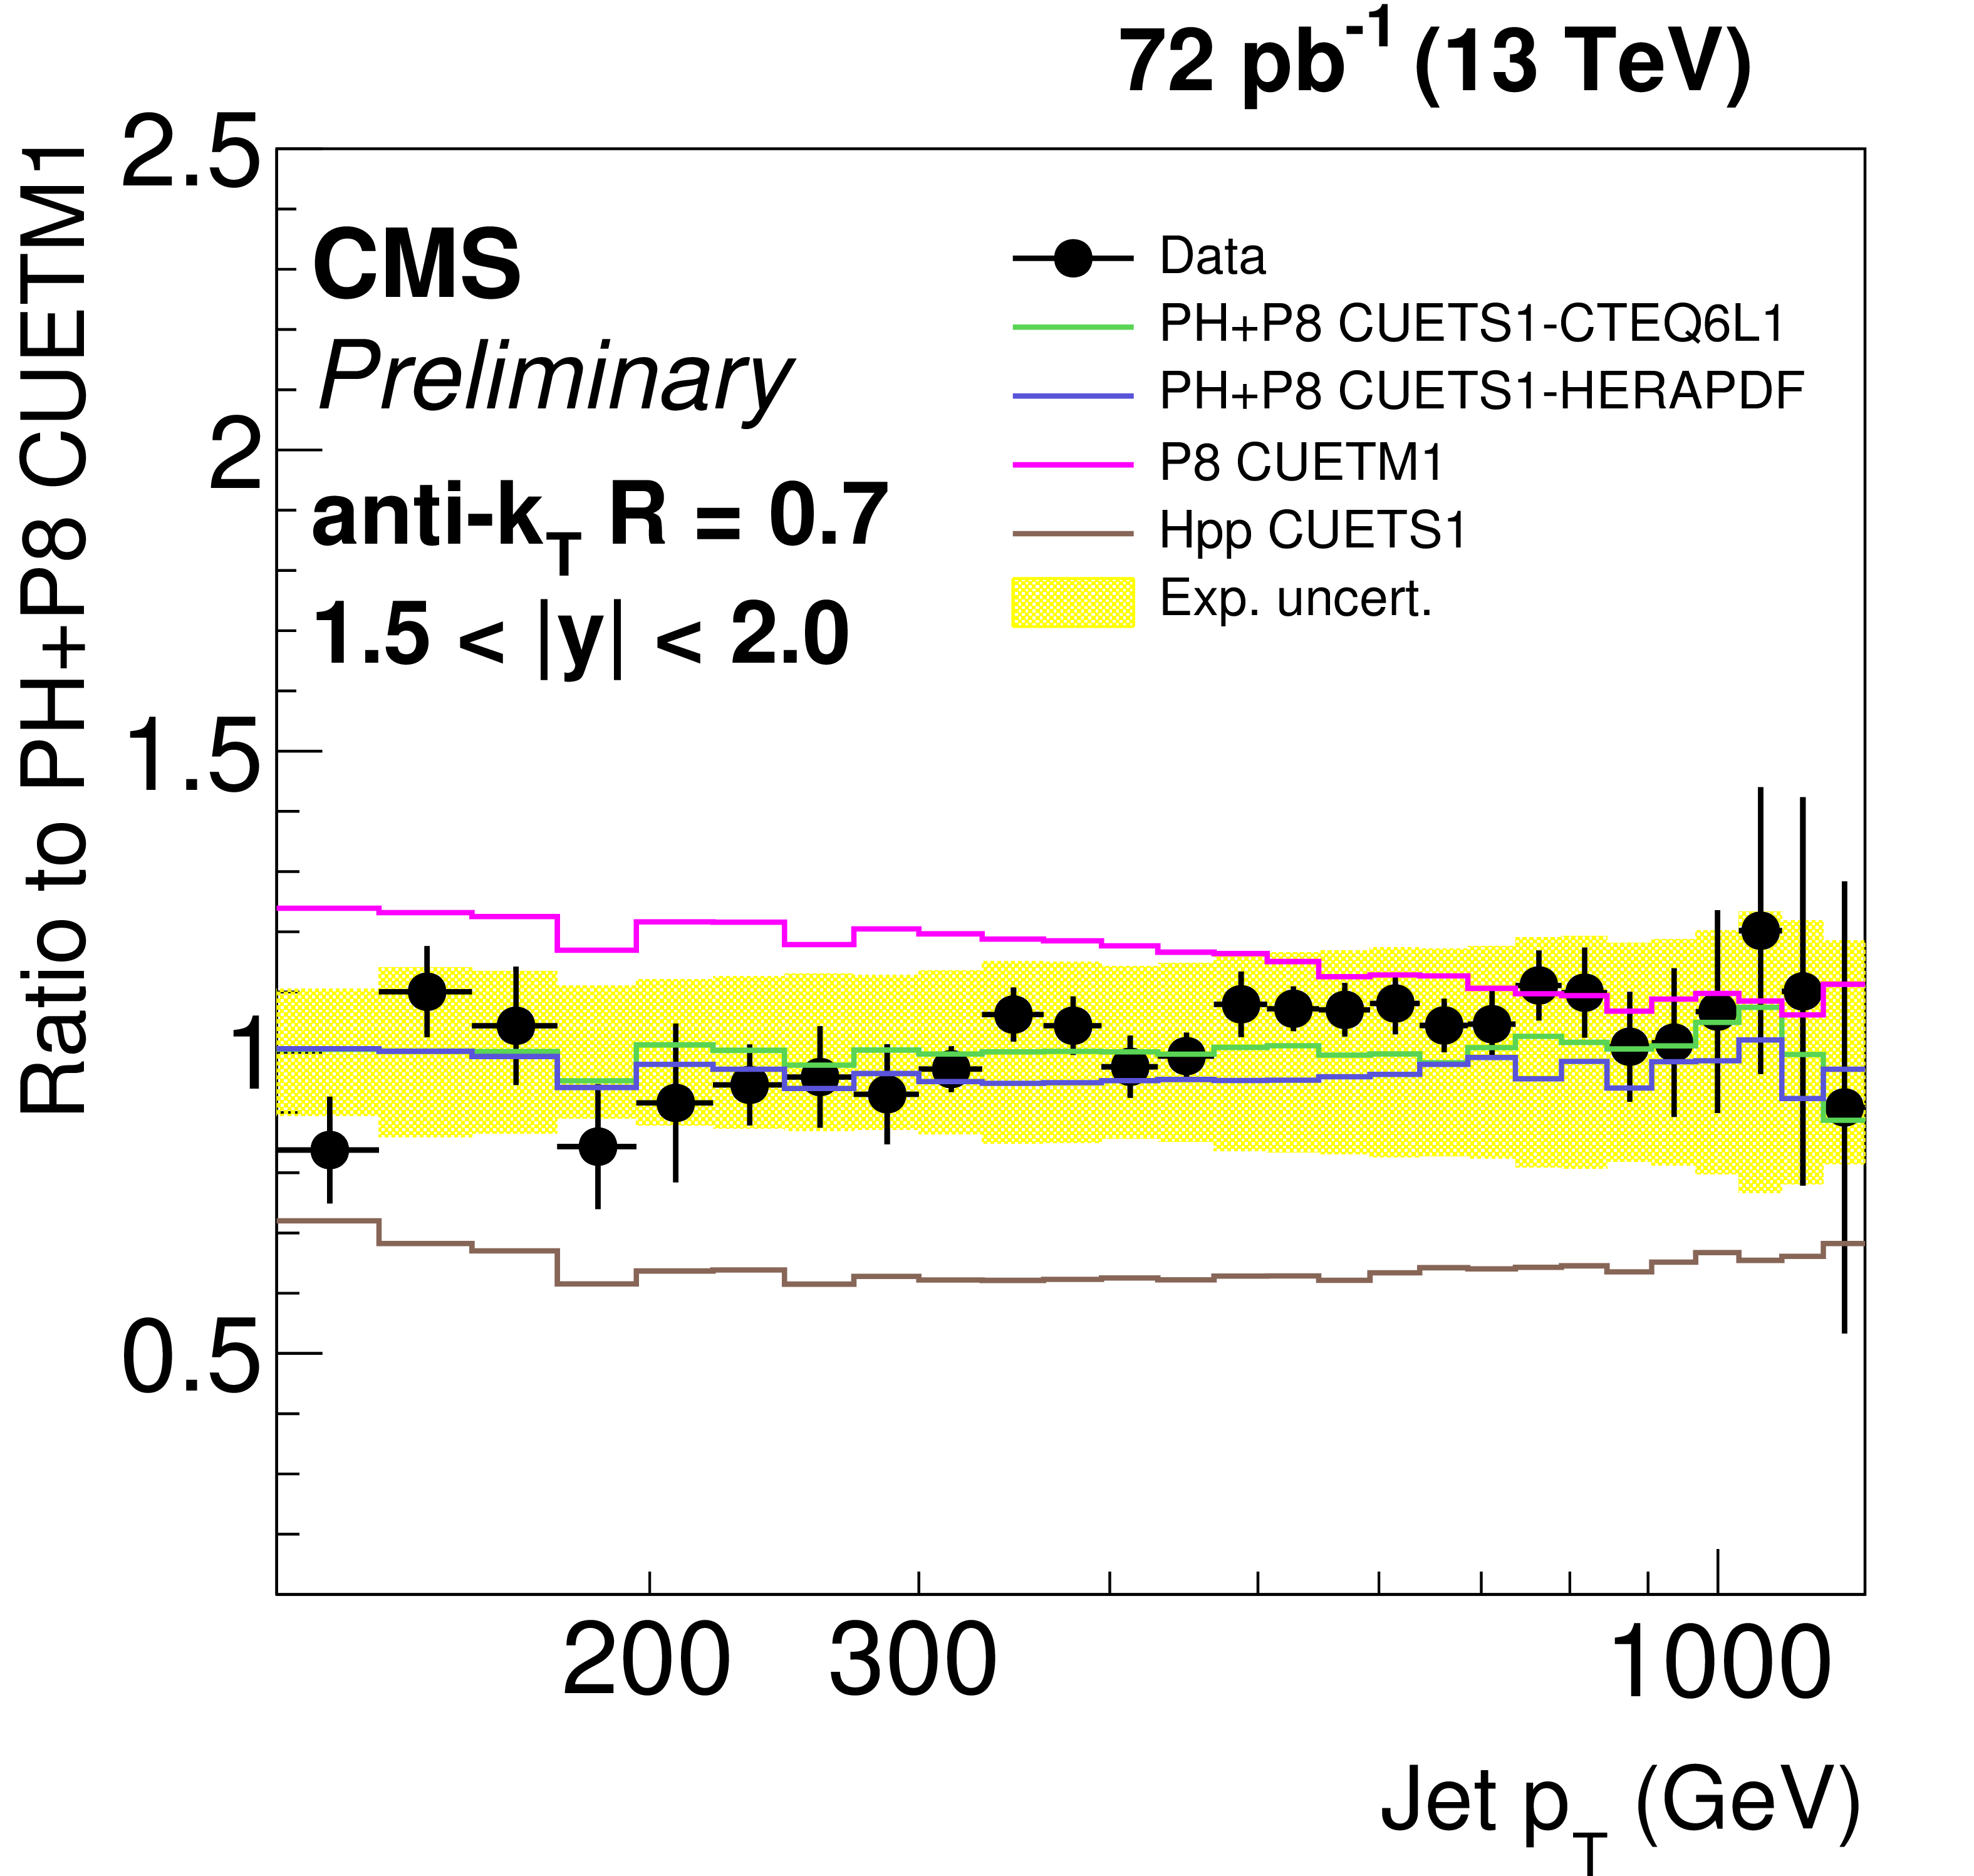
Figure 7-b:
Ratio of data over predictions from POWHEG + PYTHIA8 with tune CUETM1. For comparison predictions employing four other MC generators are also shown, where PH, P8 and Hpp stands for POWHEG , PYTHIA8 and HERWIG++ respectively. Jets are clustered with the anti-$ {k_{\mathrm {T}}} $ algorithm ($R =$ 0.7). The error bars correspond to the statistical uncertainty of the data and the shaded band to the total systematical uncertainty. |
png ; pdf ; |
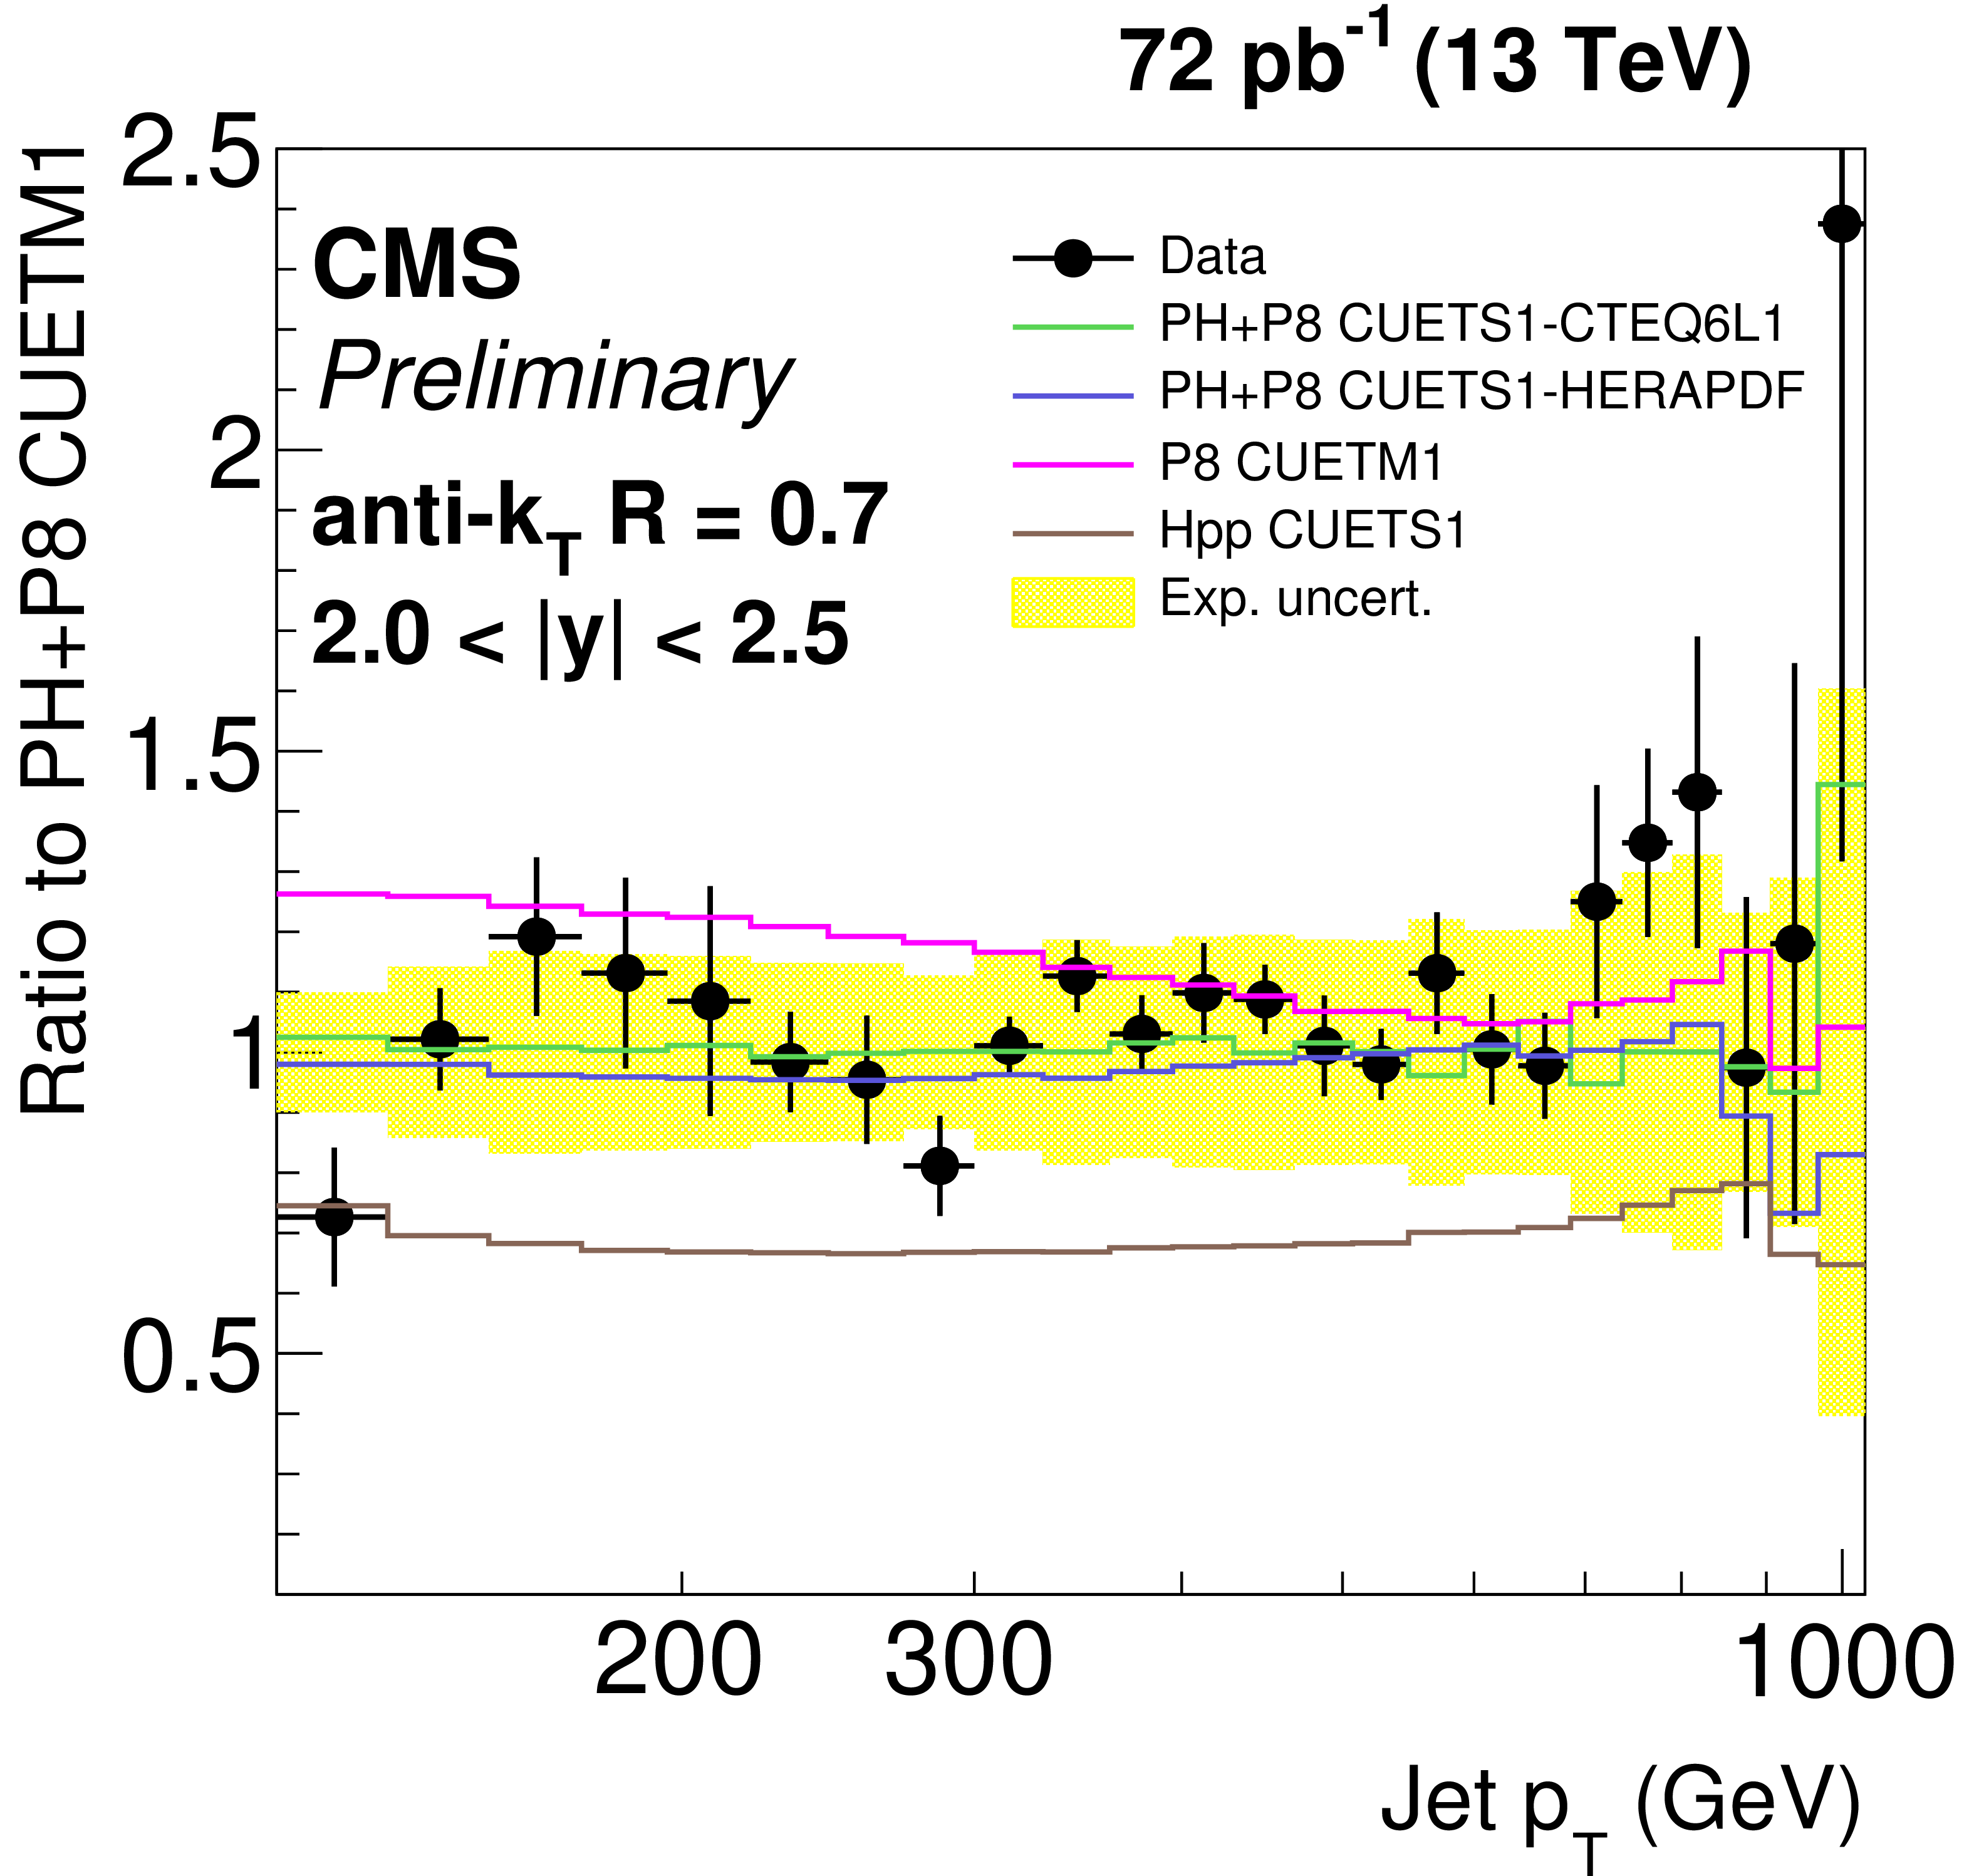
Figure 7-c:
Ratio of data over predictions from POWHEG + PYTHIA8 with tune CUETM1. For comparison predictions employing four other MC generators are also shown, where PH, P8 and Hpp stands for POWHEG , PYTHIA8 and HERWIG++ respectively. Jets are clustered with the anti-$ {k_{\mathrm {T}}} $ algorithm ($R =$ 0.7). The error bars correspond to the statistical uncertainty of the data and the shaded band to the total systematical uncertainty. |
png ; pdf ; |
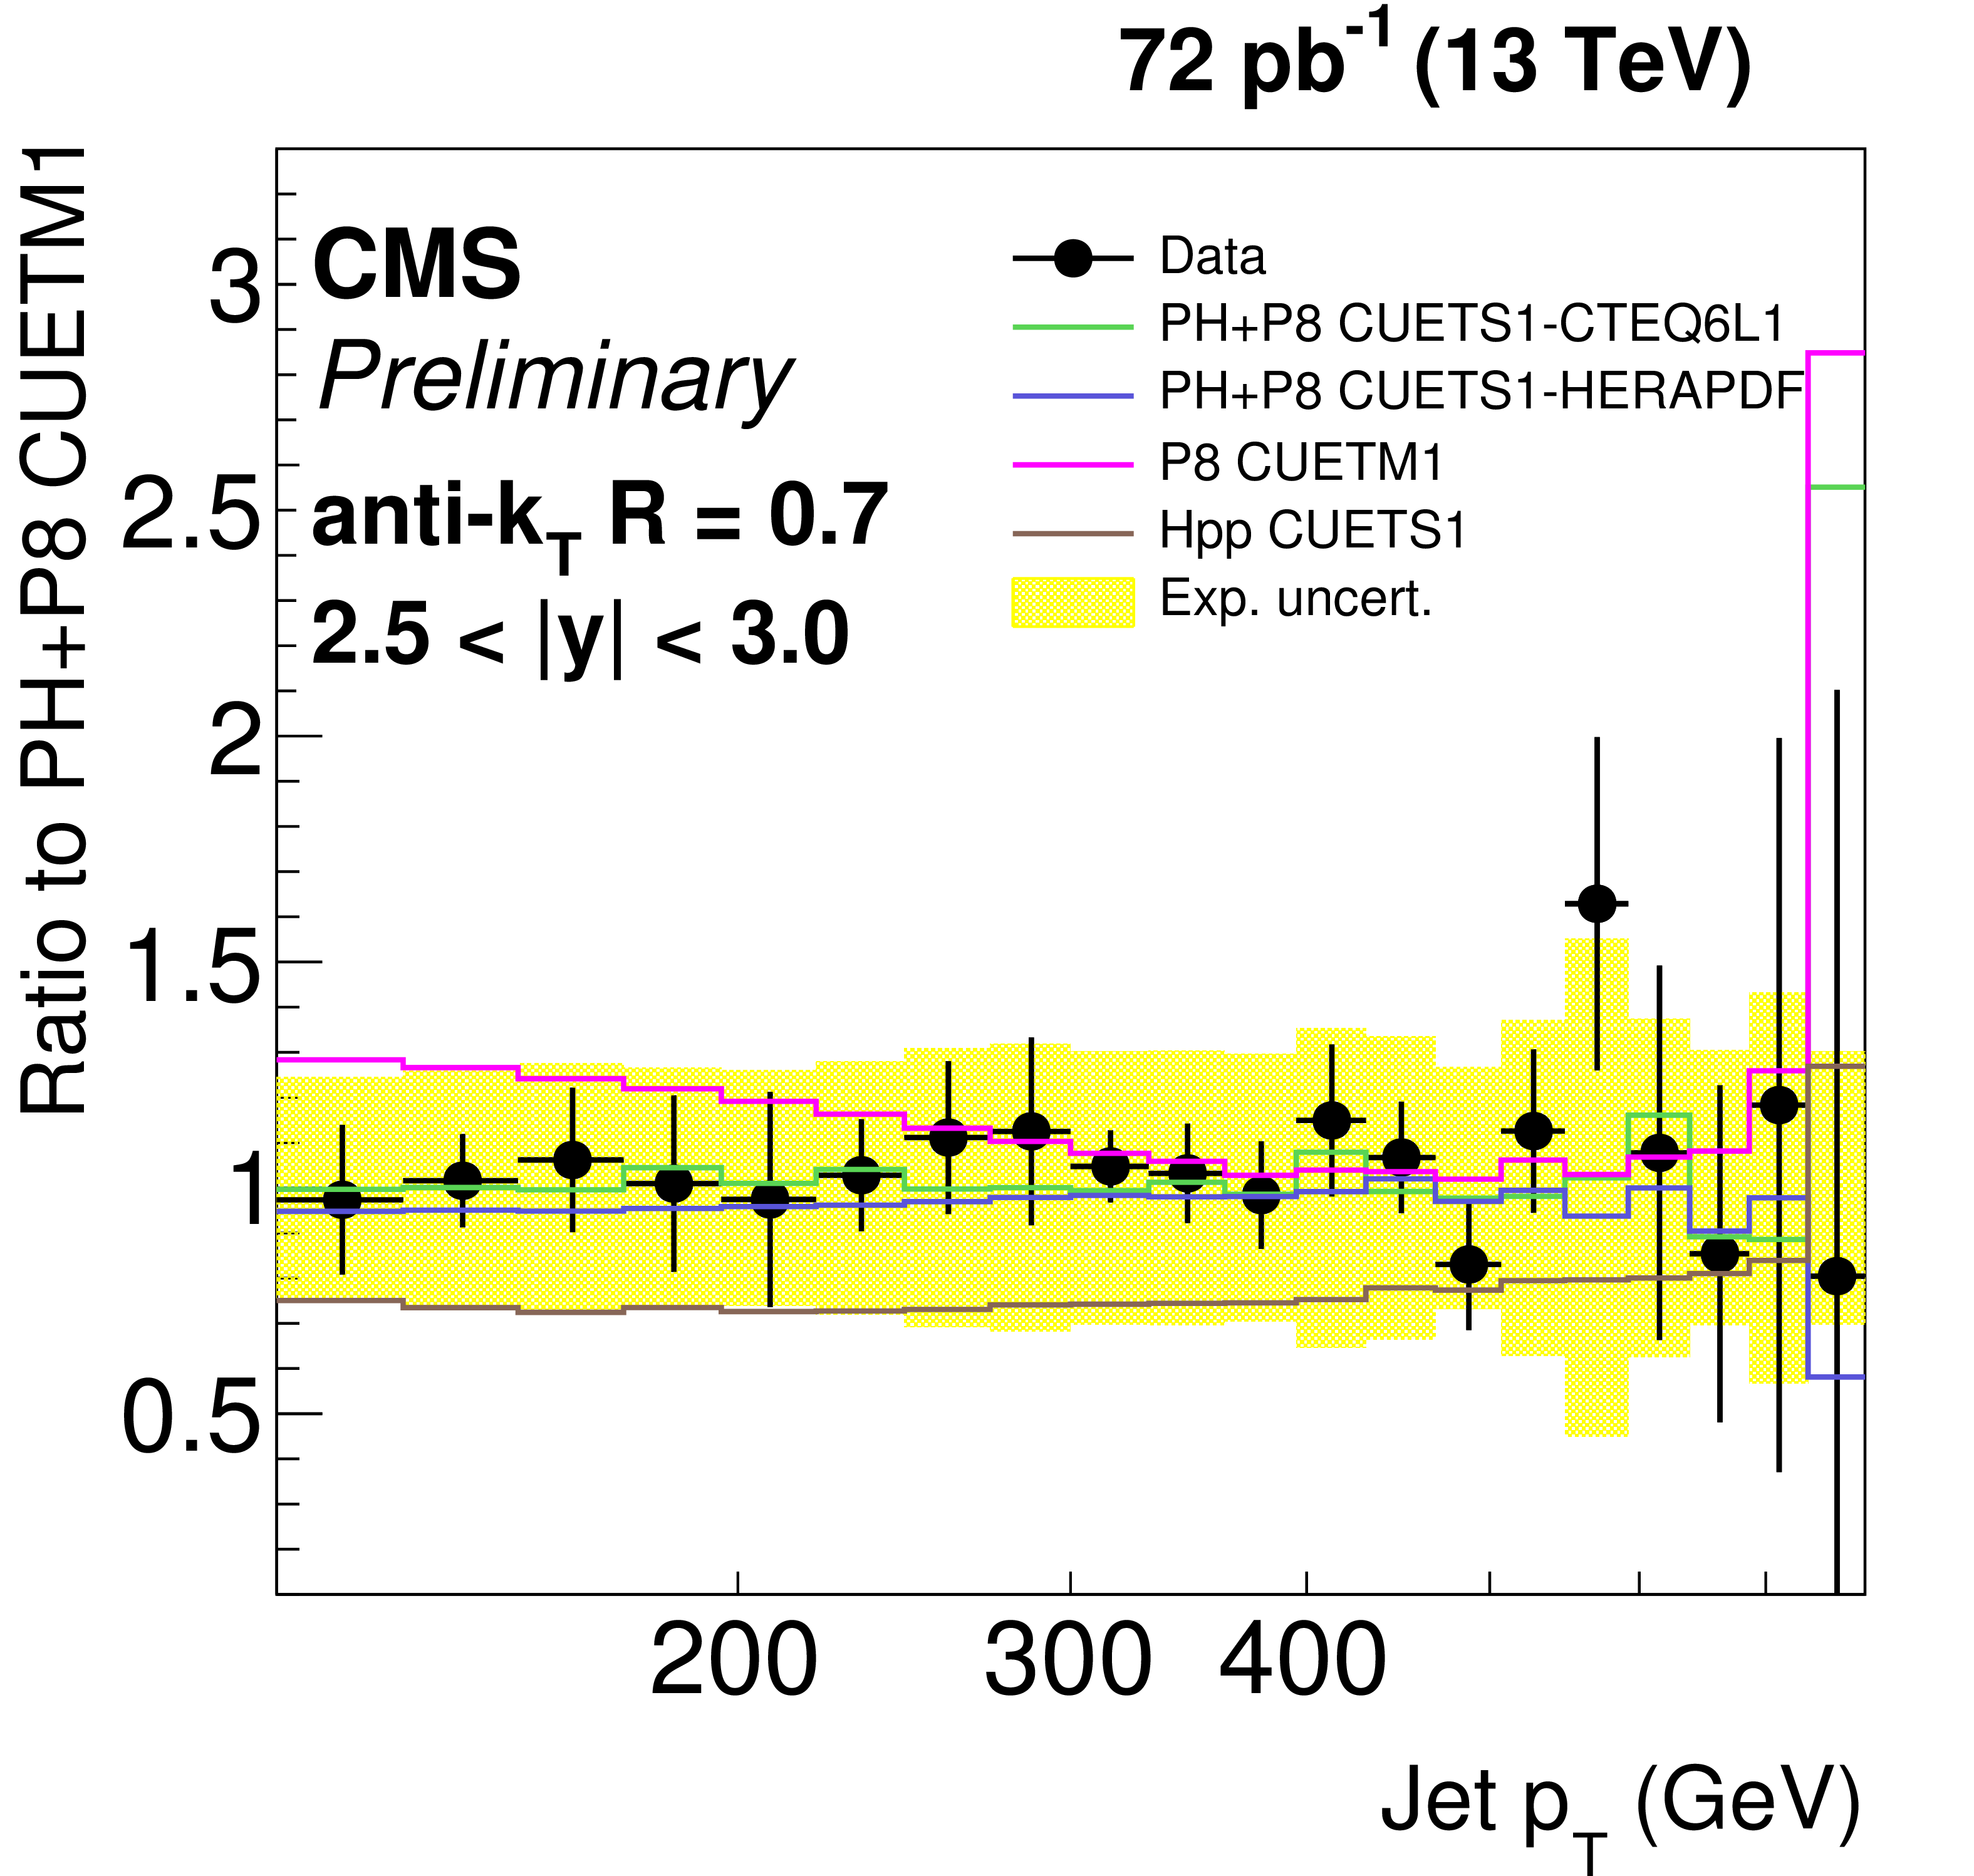
Figure 7-d:
Ratio of data over predictions from POWHEG + PYTHIA8 with tune CUETM1. For comparison predictions employing four other MC generators are also shown, where PH, P8 and Hpp stands for POWHEG , PYTHIA8 and HERWIG++ respectively. Jets are clustered with the anti-$ {k_{\mathrm {T}}} $ algorithm ($R =$ 0.7). The error bars correspond to the statistical uncertainty of the data and the shaded band to the total systematical uncertainty. |
png ; pdf ; |
Figure 7-e:
Ratio of data over predictions from POWHEG + PYTHIA8 with tune CUETM1. For comparison predictions employing four other MC generators are also shown, where PH, P8 and Hpp stands for POWHEG , PYTHIA8 and HERWIG++ respectively. Jets are clustered with the anti-$ {k_{\mathrm {T}}} $ algorithm ($R =$ 0.7). The error bars correspond to the statistical uncertainty of the data and the shaded band to the total systematical uncertainty. |
png ; pdf ; |
Figure 7-f:
Ratio of data over predictions from POWHEG + PYTHIA8 with tune CUETM1. For comparison predictions employing four other MC generators are also shown, where PH, P8 and Hpp stands for POWHEG , PYTHIA8 and HERWIG++ respectively. Jets are clustered with the anti-$ {k_{\mathrm {T}}} $ algorithm ($R =$ 0.7). The error bars correspond to the statistical uncertainty of the data and the shaded band to the total systematical uncertainty. |
png ; pdf ; |
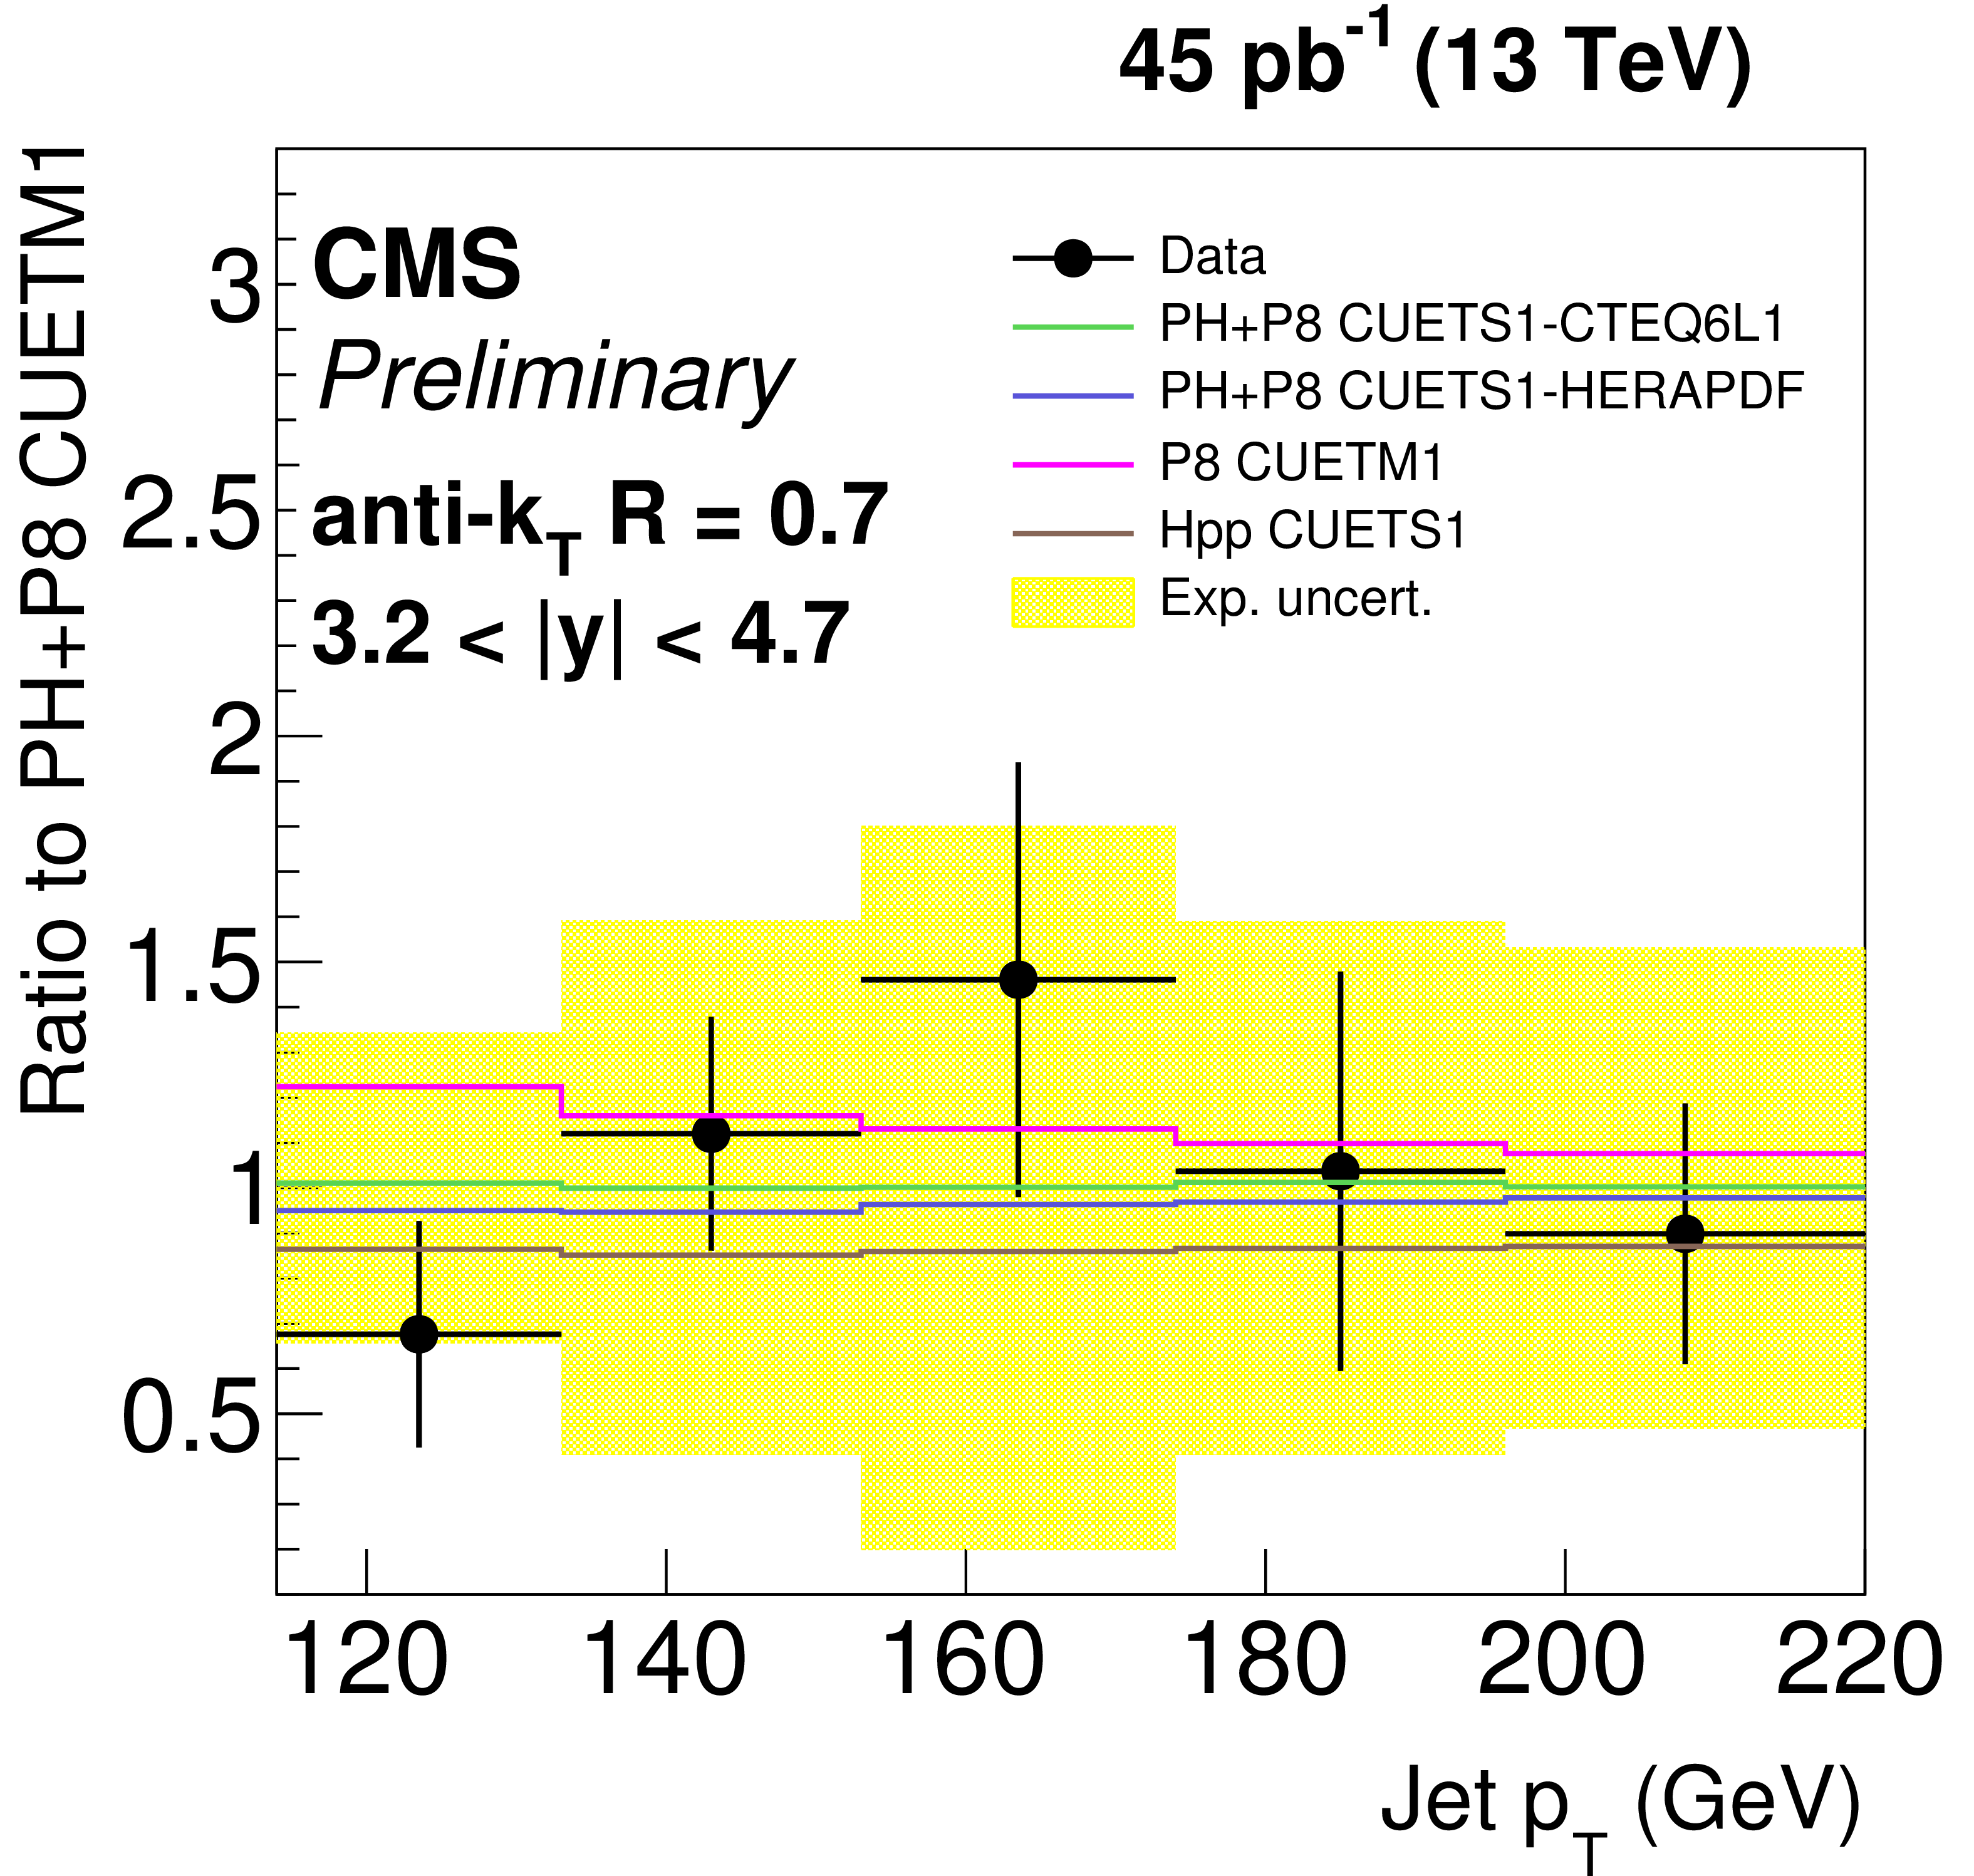
Figure 7-g:
Ratio of data over predictions from POWHEG + PYTHIA8 with tune CUETM1. For comparison predictions employing four other MC generators are also shown, where PH, P8 and Hpp stands for POWHEG , PYTHIA8 and HERWIG++ respectively. Jets are clustered with the anti-$ {k_{\mathrm {T}}} $ algorithm ($R =$ 0.7). The error bars correspond to the statistical uncertainty of the data and the shaded band to the total systematical uncertainty. |
png ; pdf ; |
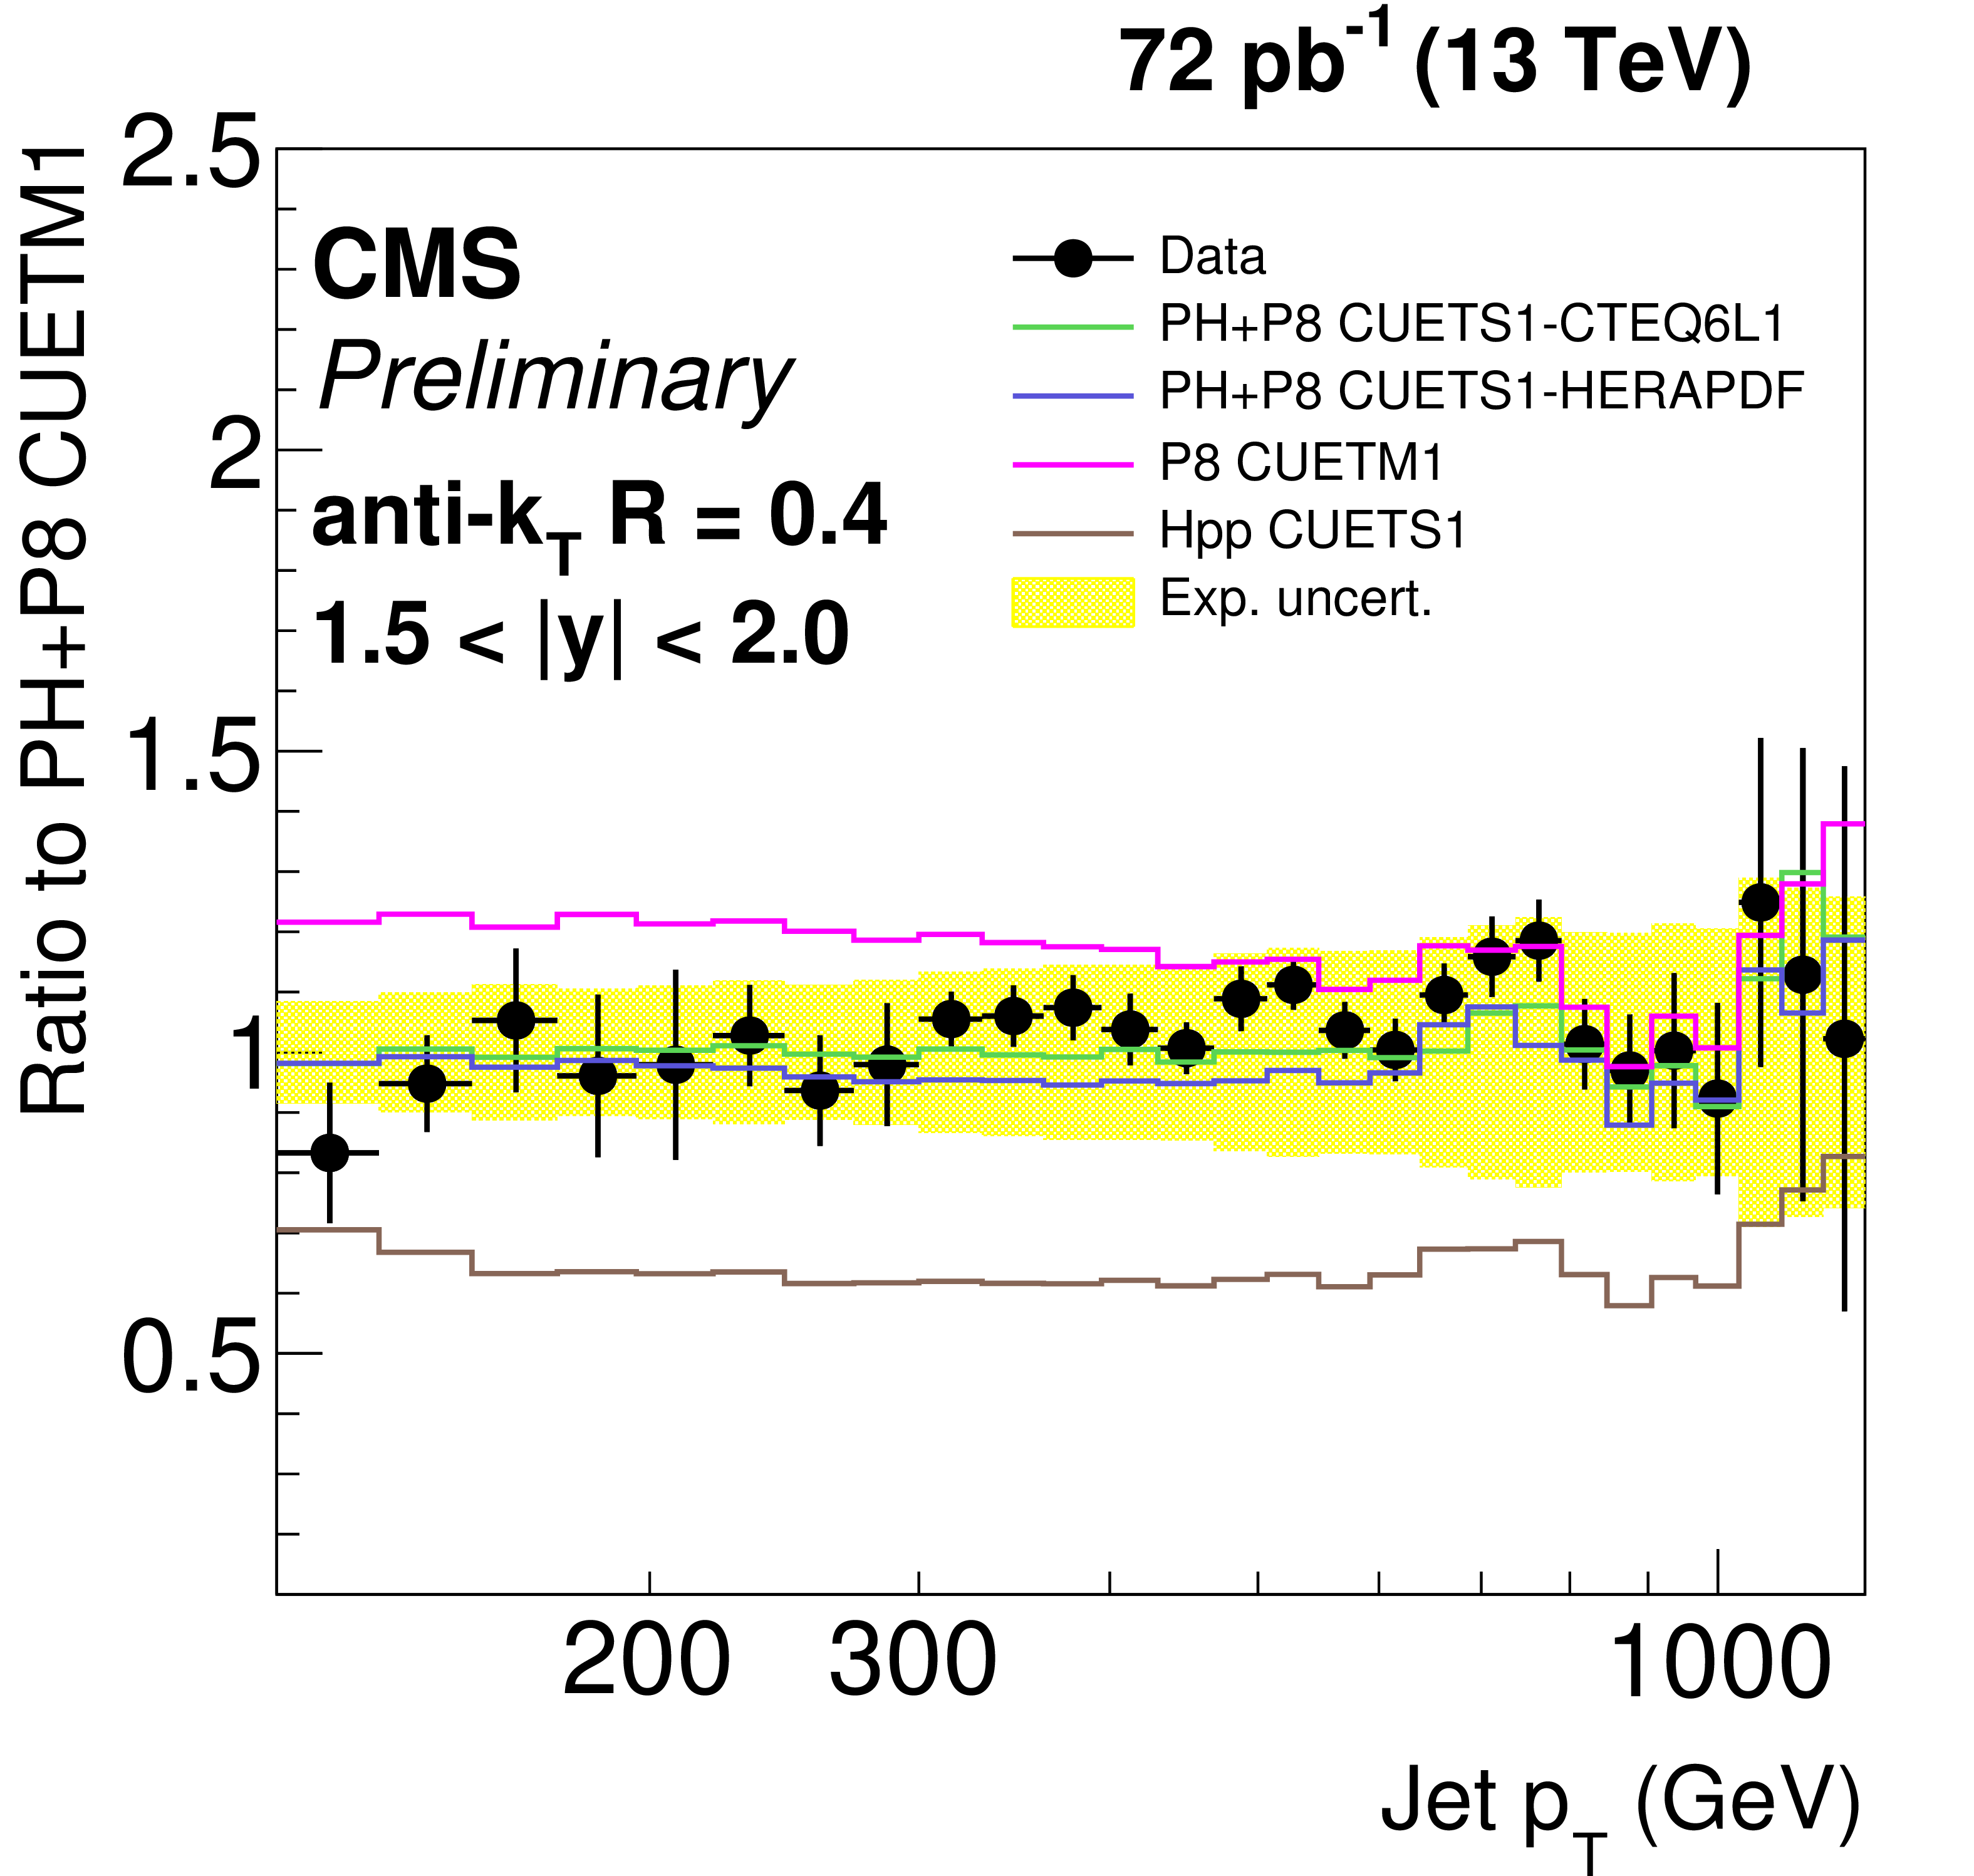
Figure 8-a:
Ratio of data over predictions from POWHEG + PYTHIA8 with tune CUETM1. For comparison predictions employing four other MC generators are also shown, where PH, P8 and Hpp stands for POWHEG , PYTHIA8 and HERWIG++ respectively. Jets are clustered with the anti-$ {k_{\mathrm {T}}} $ algorithm ($R =$ 0.4). The error bars correspond to the statistical uncertainty of the data and the shaded band to the total systematical uncertainty. |
png ; pdf ; |
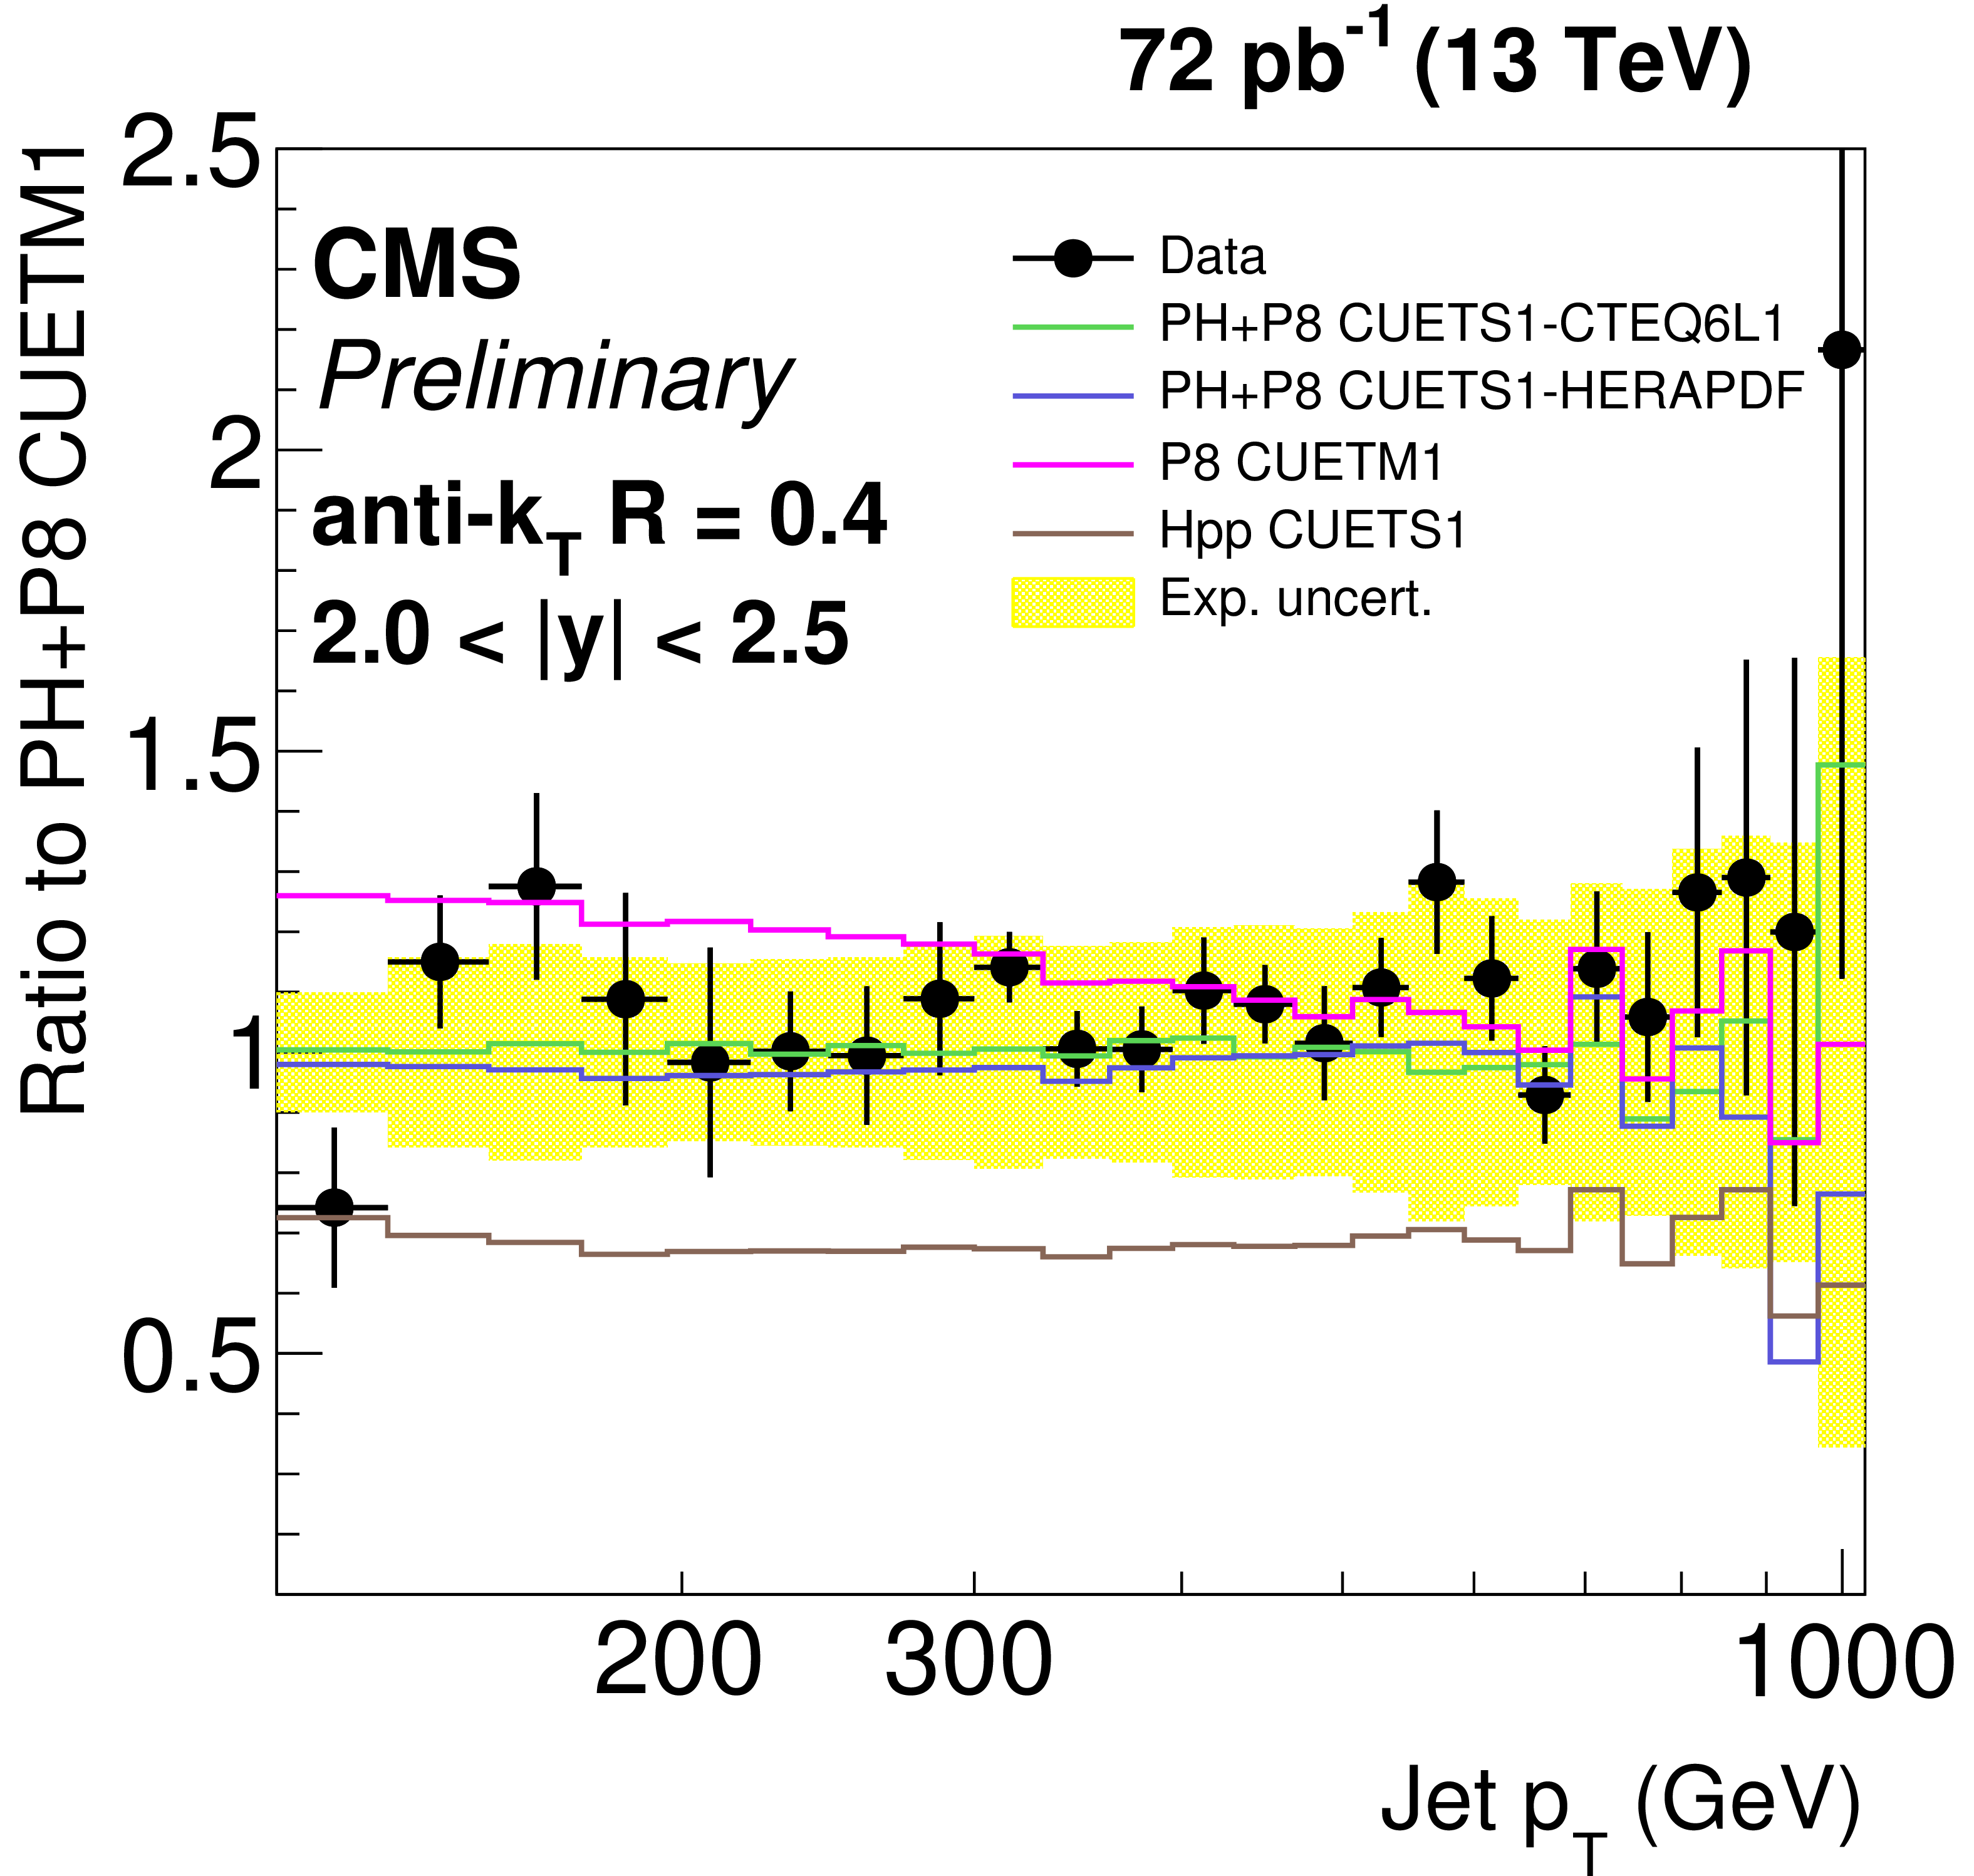
Figure 8-b:
Ratio of data over predictions from POWHEG + PYTHIA8 with tune CUETM1. For comparison predictions employing four other MC generators are also shown, where PH, P8 and Hpp stands for POWHEG , PYTHIA8 and HERWIG++ respectively. Jets are clustered with the anti-$ {k_{\mathrm {T}}} $ algorithm ($R =$ 0.4). The error bars correspond to the statistical uncertainty of the data and the shaded band to the total systematical uncertainty. |
png ; pdf ; |
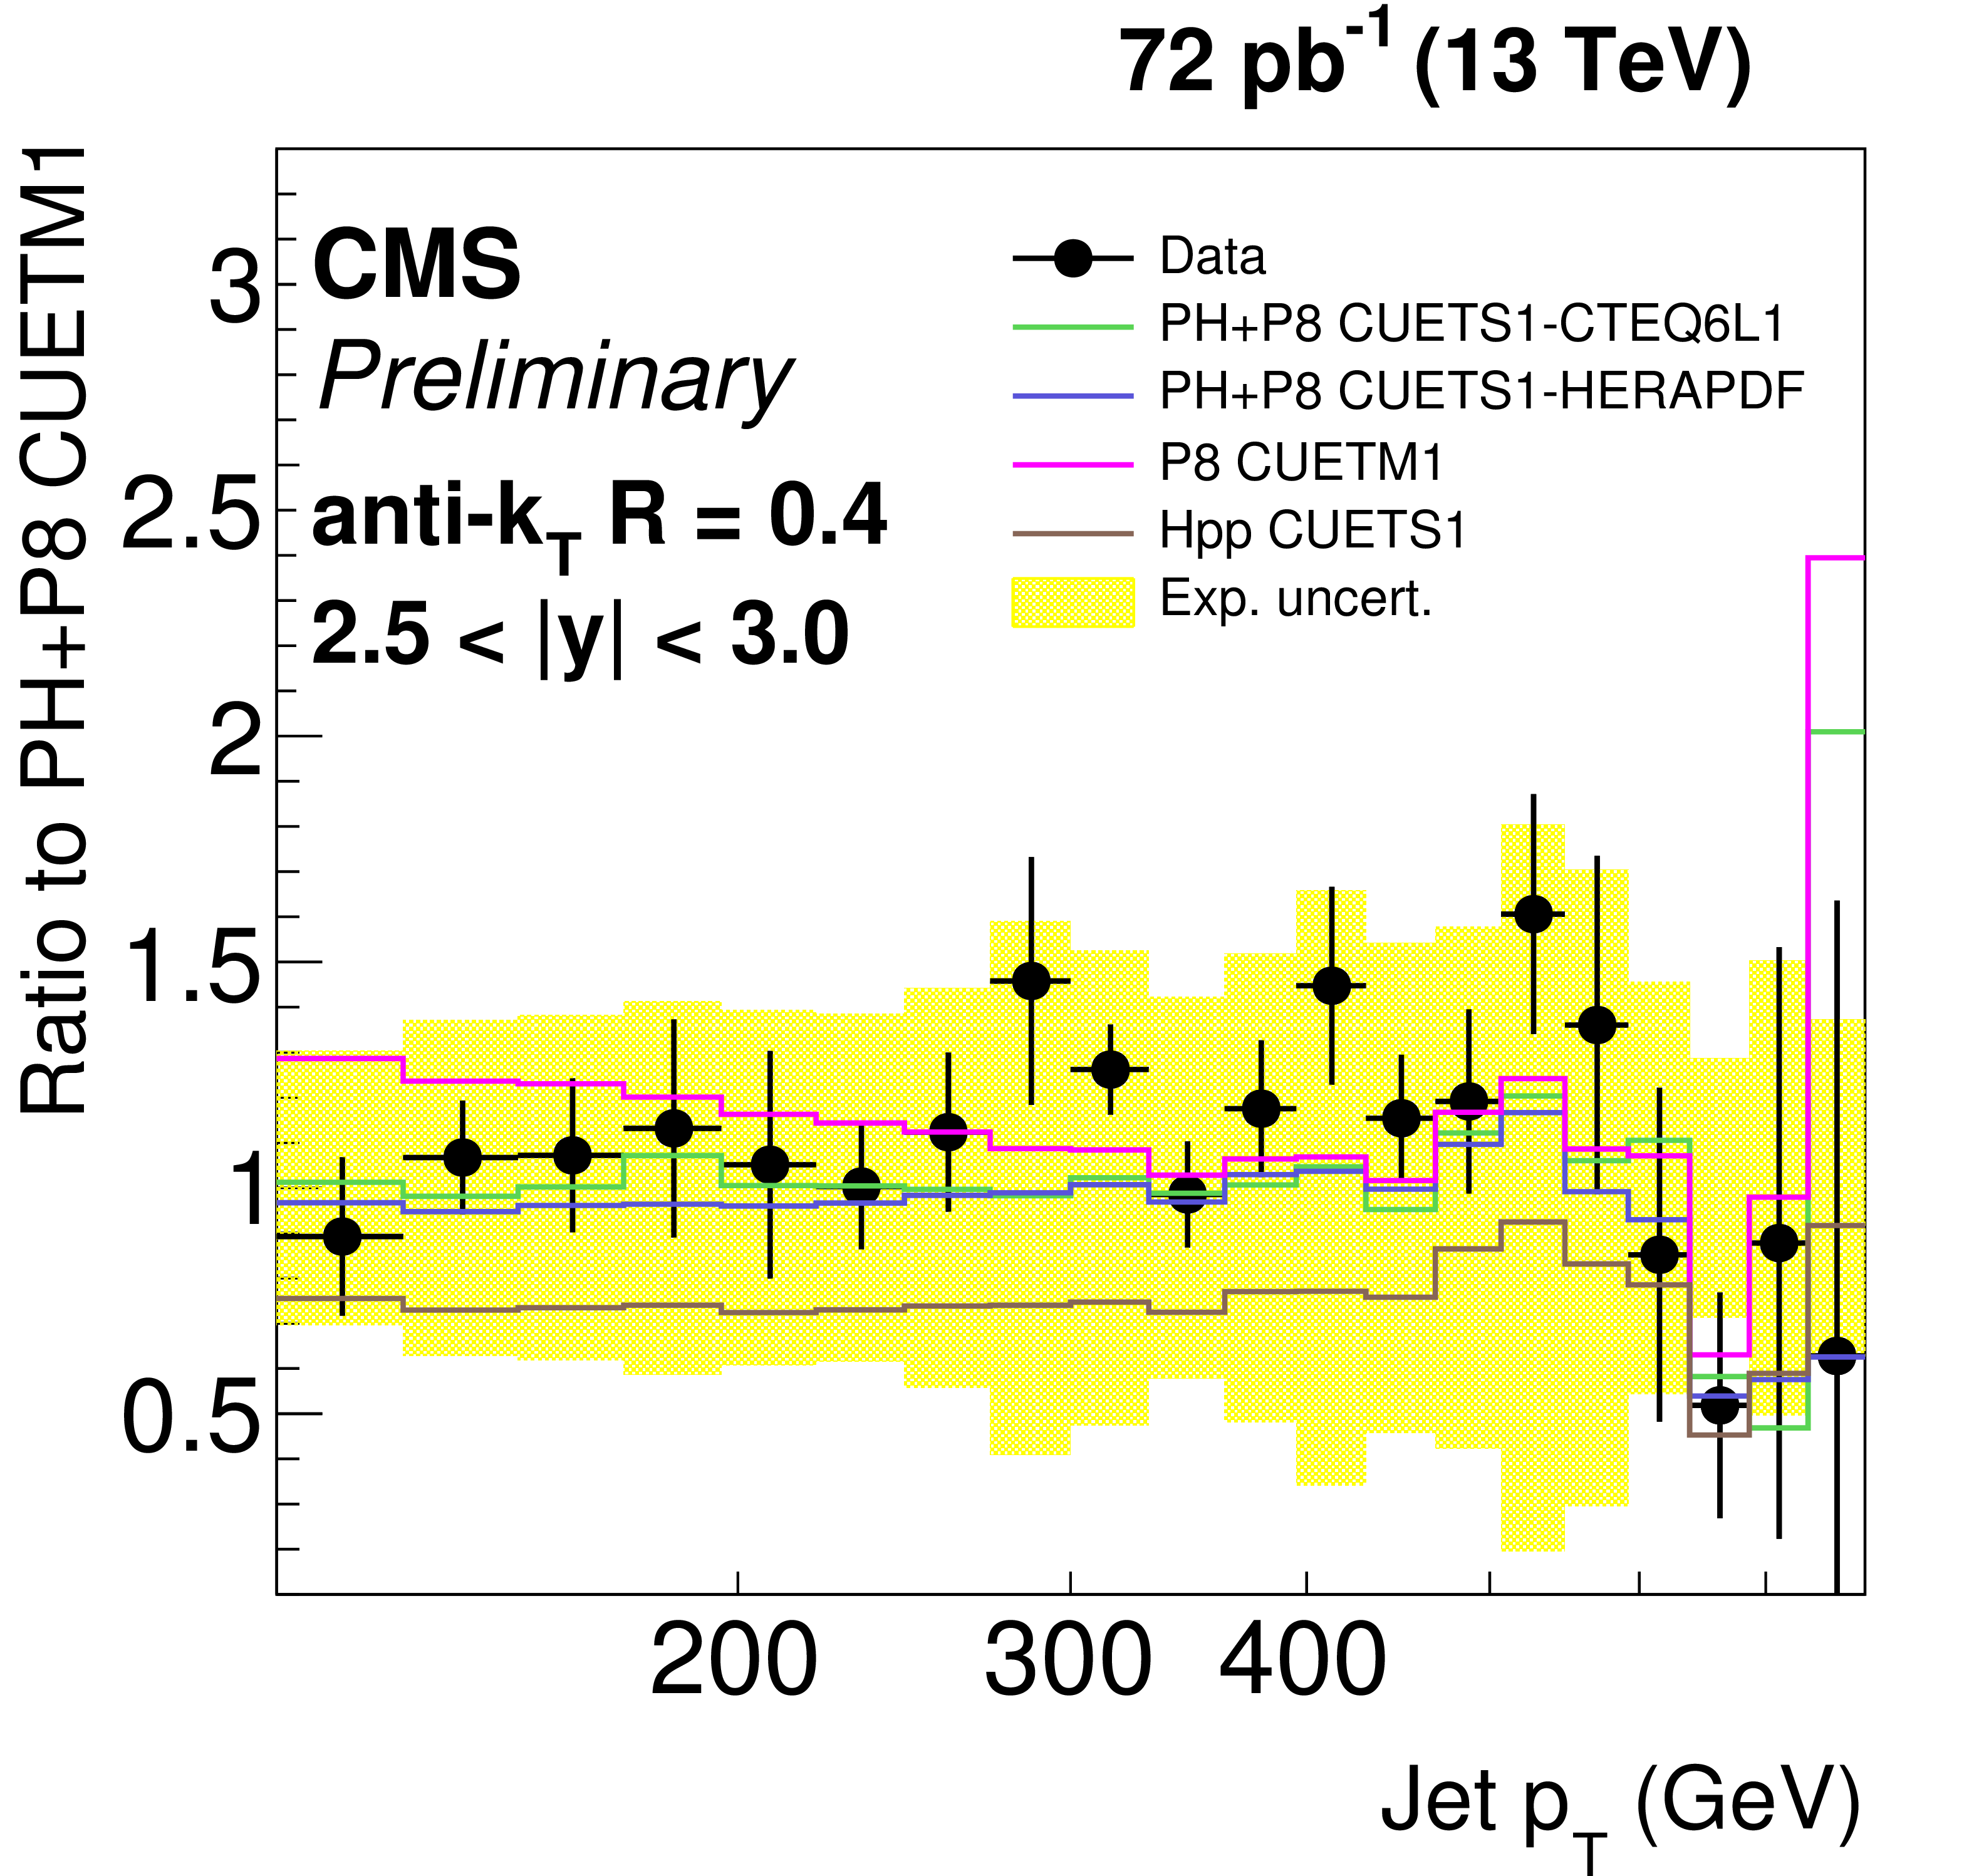
Figure 8-c:
Ratio of data over predictions from POWHEG + PYTHIA8 with tune CUETM1. For comparison predictions employing four other MC generators are also shown, where PH, P8 and Hpp stands for POWHEG , PYTHIA8 and HERWIG++ respectively. Jets are clustered with the anti-$ {k_{\mathrm {T}}} $ algorithm ($R =$ 0.4). The error bars correspond to the statistical uncertainty of the data and the shaded band to the total systematical uncertainty. |
png ; pdf ; |
Figure 8-d:
Ratio of data over predictions from POWHEG + PYTHIA8 with tune CUETM1. For comparison predictions employing four other MC generators are also shown, where PH, P8 and Hpp stands for POWHEG , PYTHIA8 and HERWIG++ respectively. Jets are clustered with the anti-$ {k_{\mathrm {T}}} $ algorithm ($R =$ 0.4). The error bars correspond to the statistical uncertainty of the data and the shaded band to the total systematical uncertainty. |
png ; pdf ; |
Figure 8-e:
Ratio of data over predictions from POWHEG + PYTHIA8 with tune CUETM1. For comparison predictions employing four other MC generators are also shown, where PH, P8 and Hpp stands for POWHEG , PYTHIA8 and HERWIG++ respectively. Jets are clustered with the anti-$ {k_{\mathrm {T}}} $ algorithm ($R =$ 0.4). The error bars correspond to the statistical uncertainty of the data and the shaded band to the total systematical uncertainty. |
png ; pdf ; |
Figure 8-f:
Ratio of data over predictions from POWHEG + PYTHIA8 with tune CUETM1. For comparison predictions employing four other MC generators are also shown, where PH, P8 and Hpp stands for POWHEG , PYTHIA8 and HERWIG++ respectively. Jets are clustered with the anti-$ {k_{\mathrm {T}}} $ algorithm ($R =$ 0.4). The error bars correspond to the statistical uncertainty of the data and the shaded band to the total systematical uncertainty. |
png ; pdf ; |
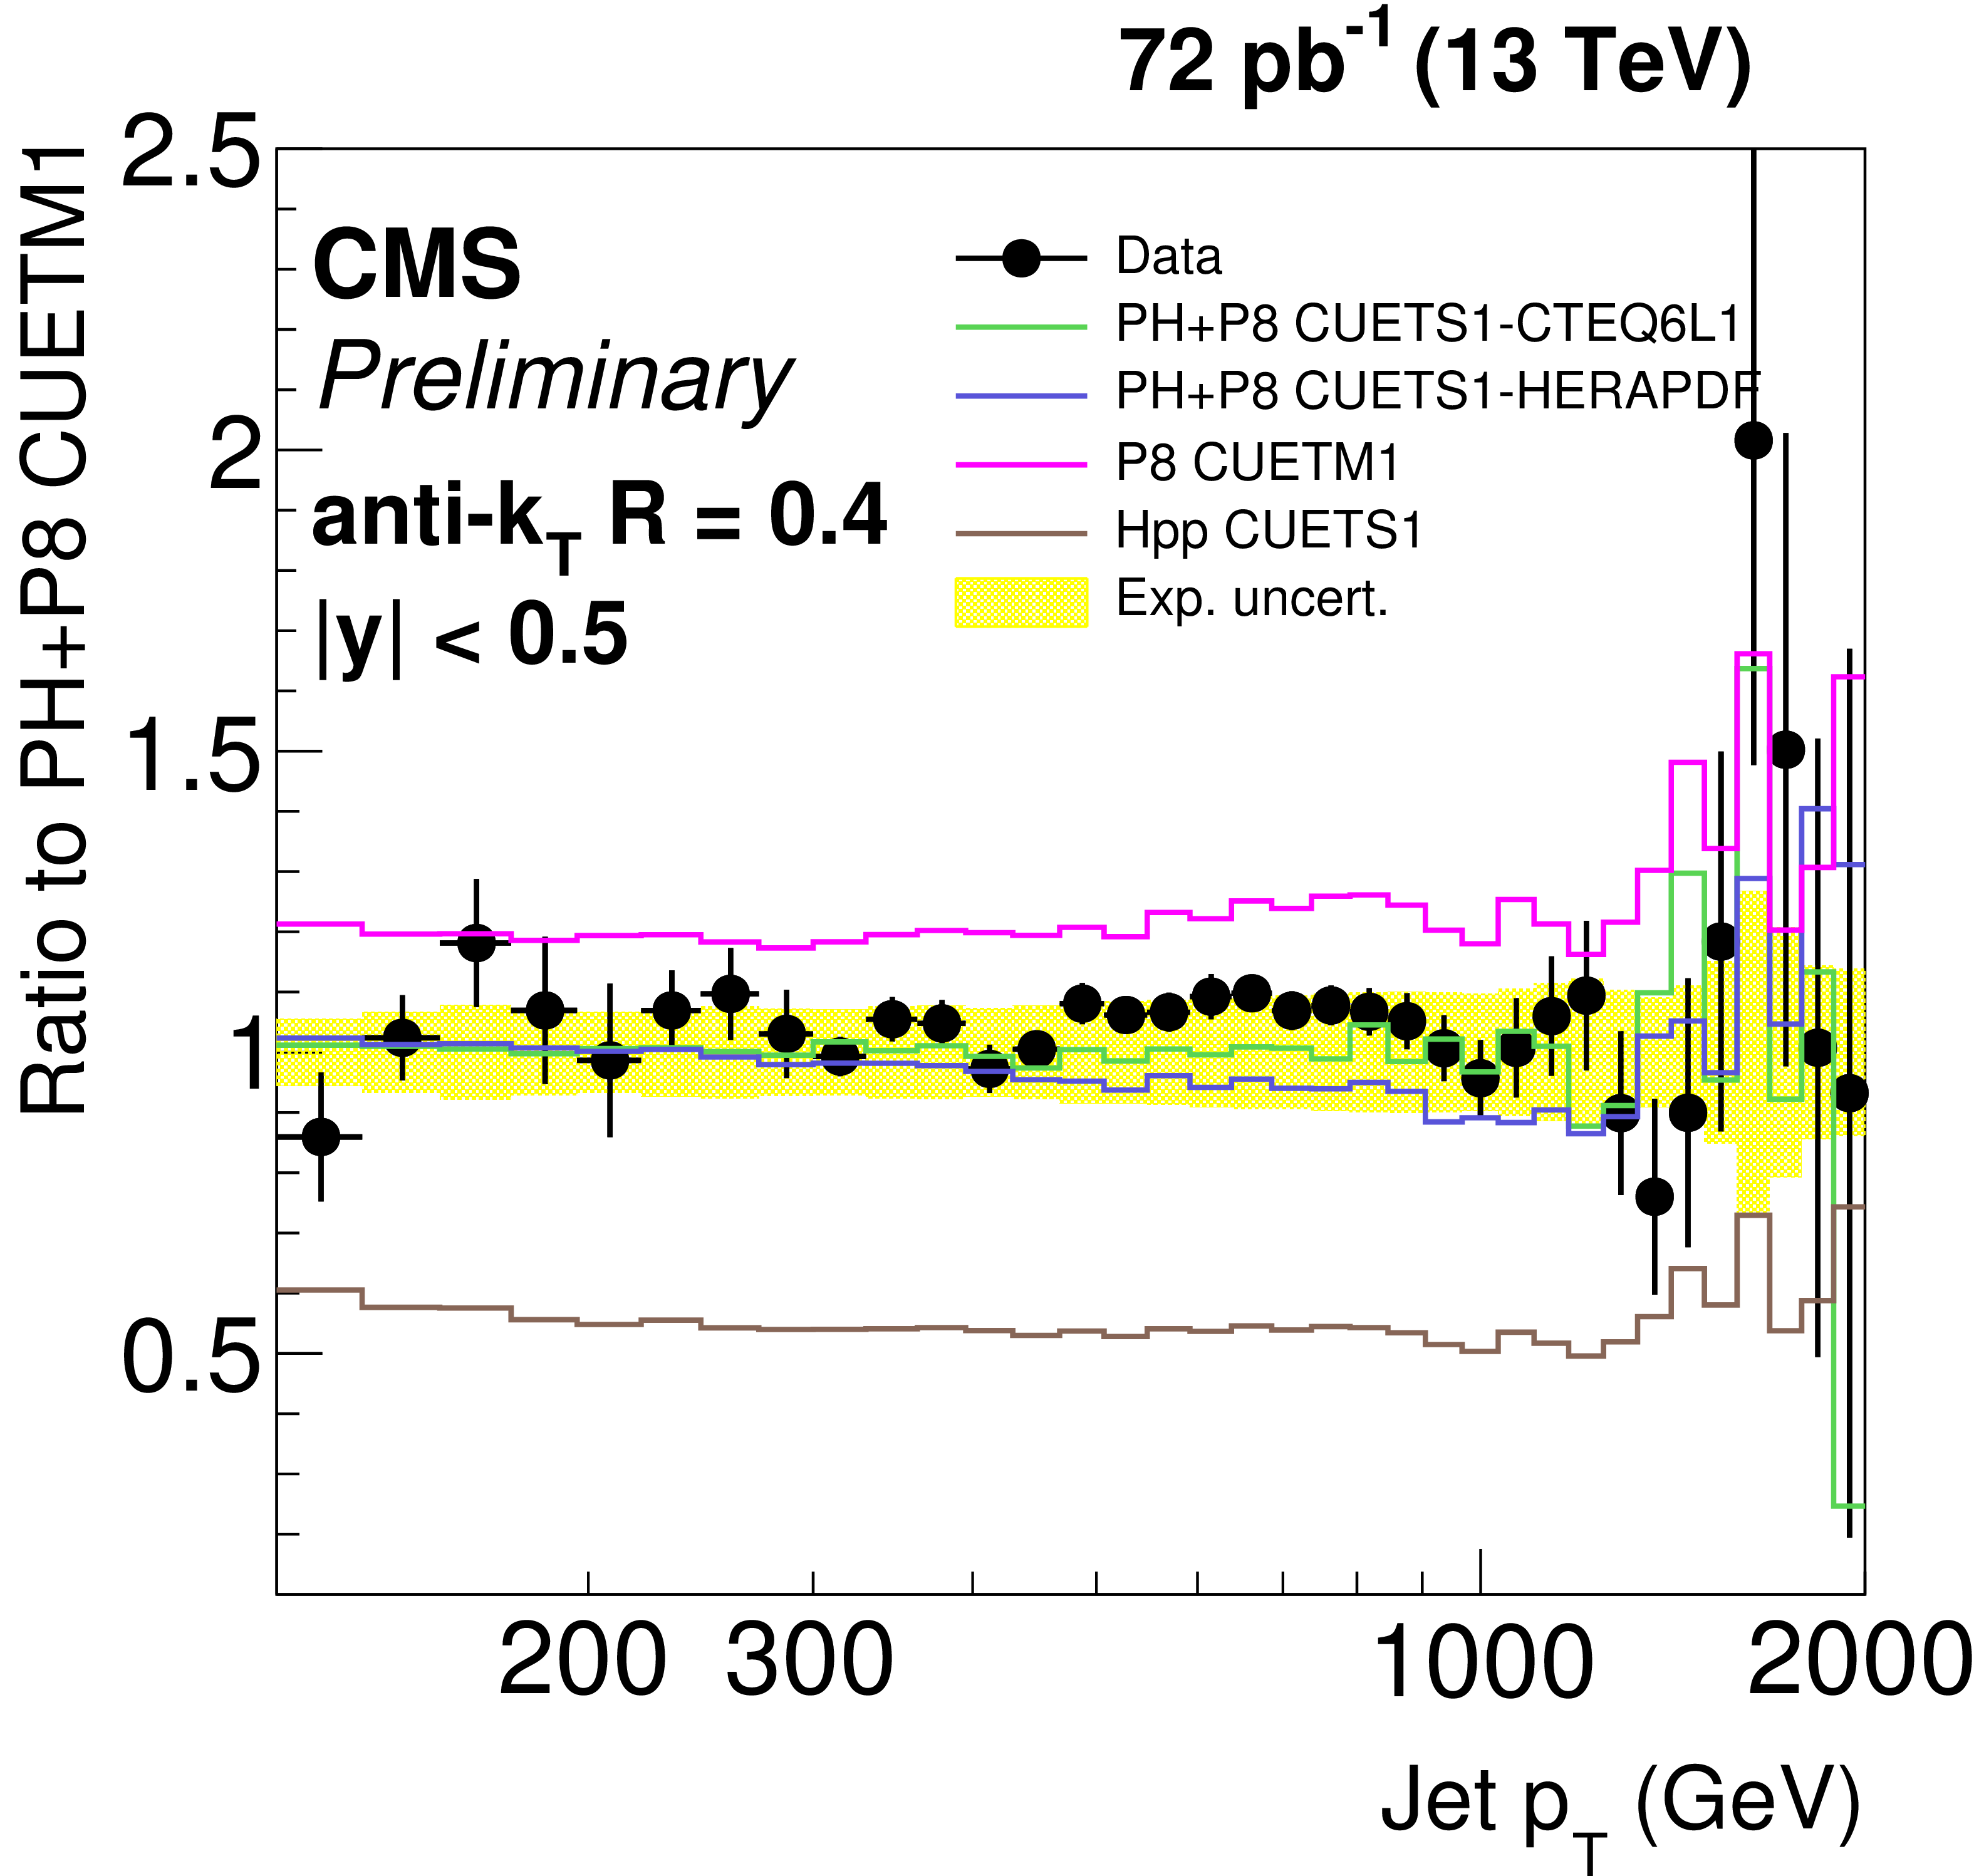
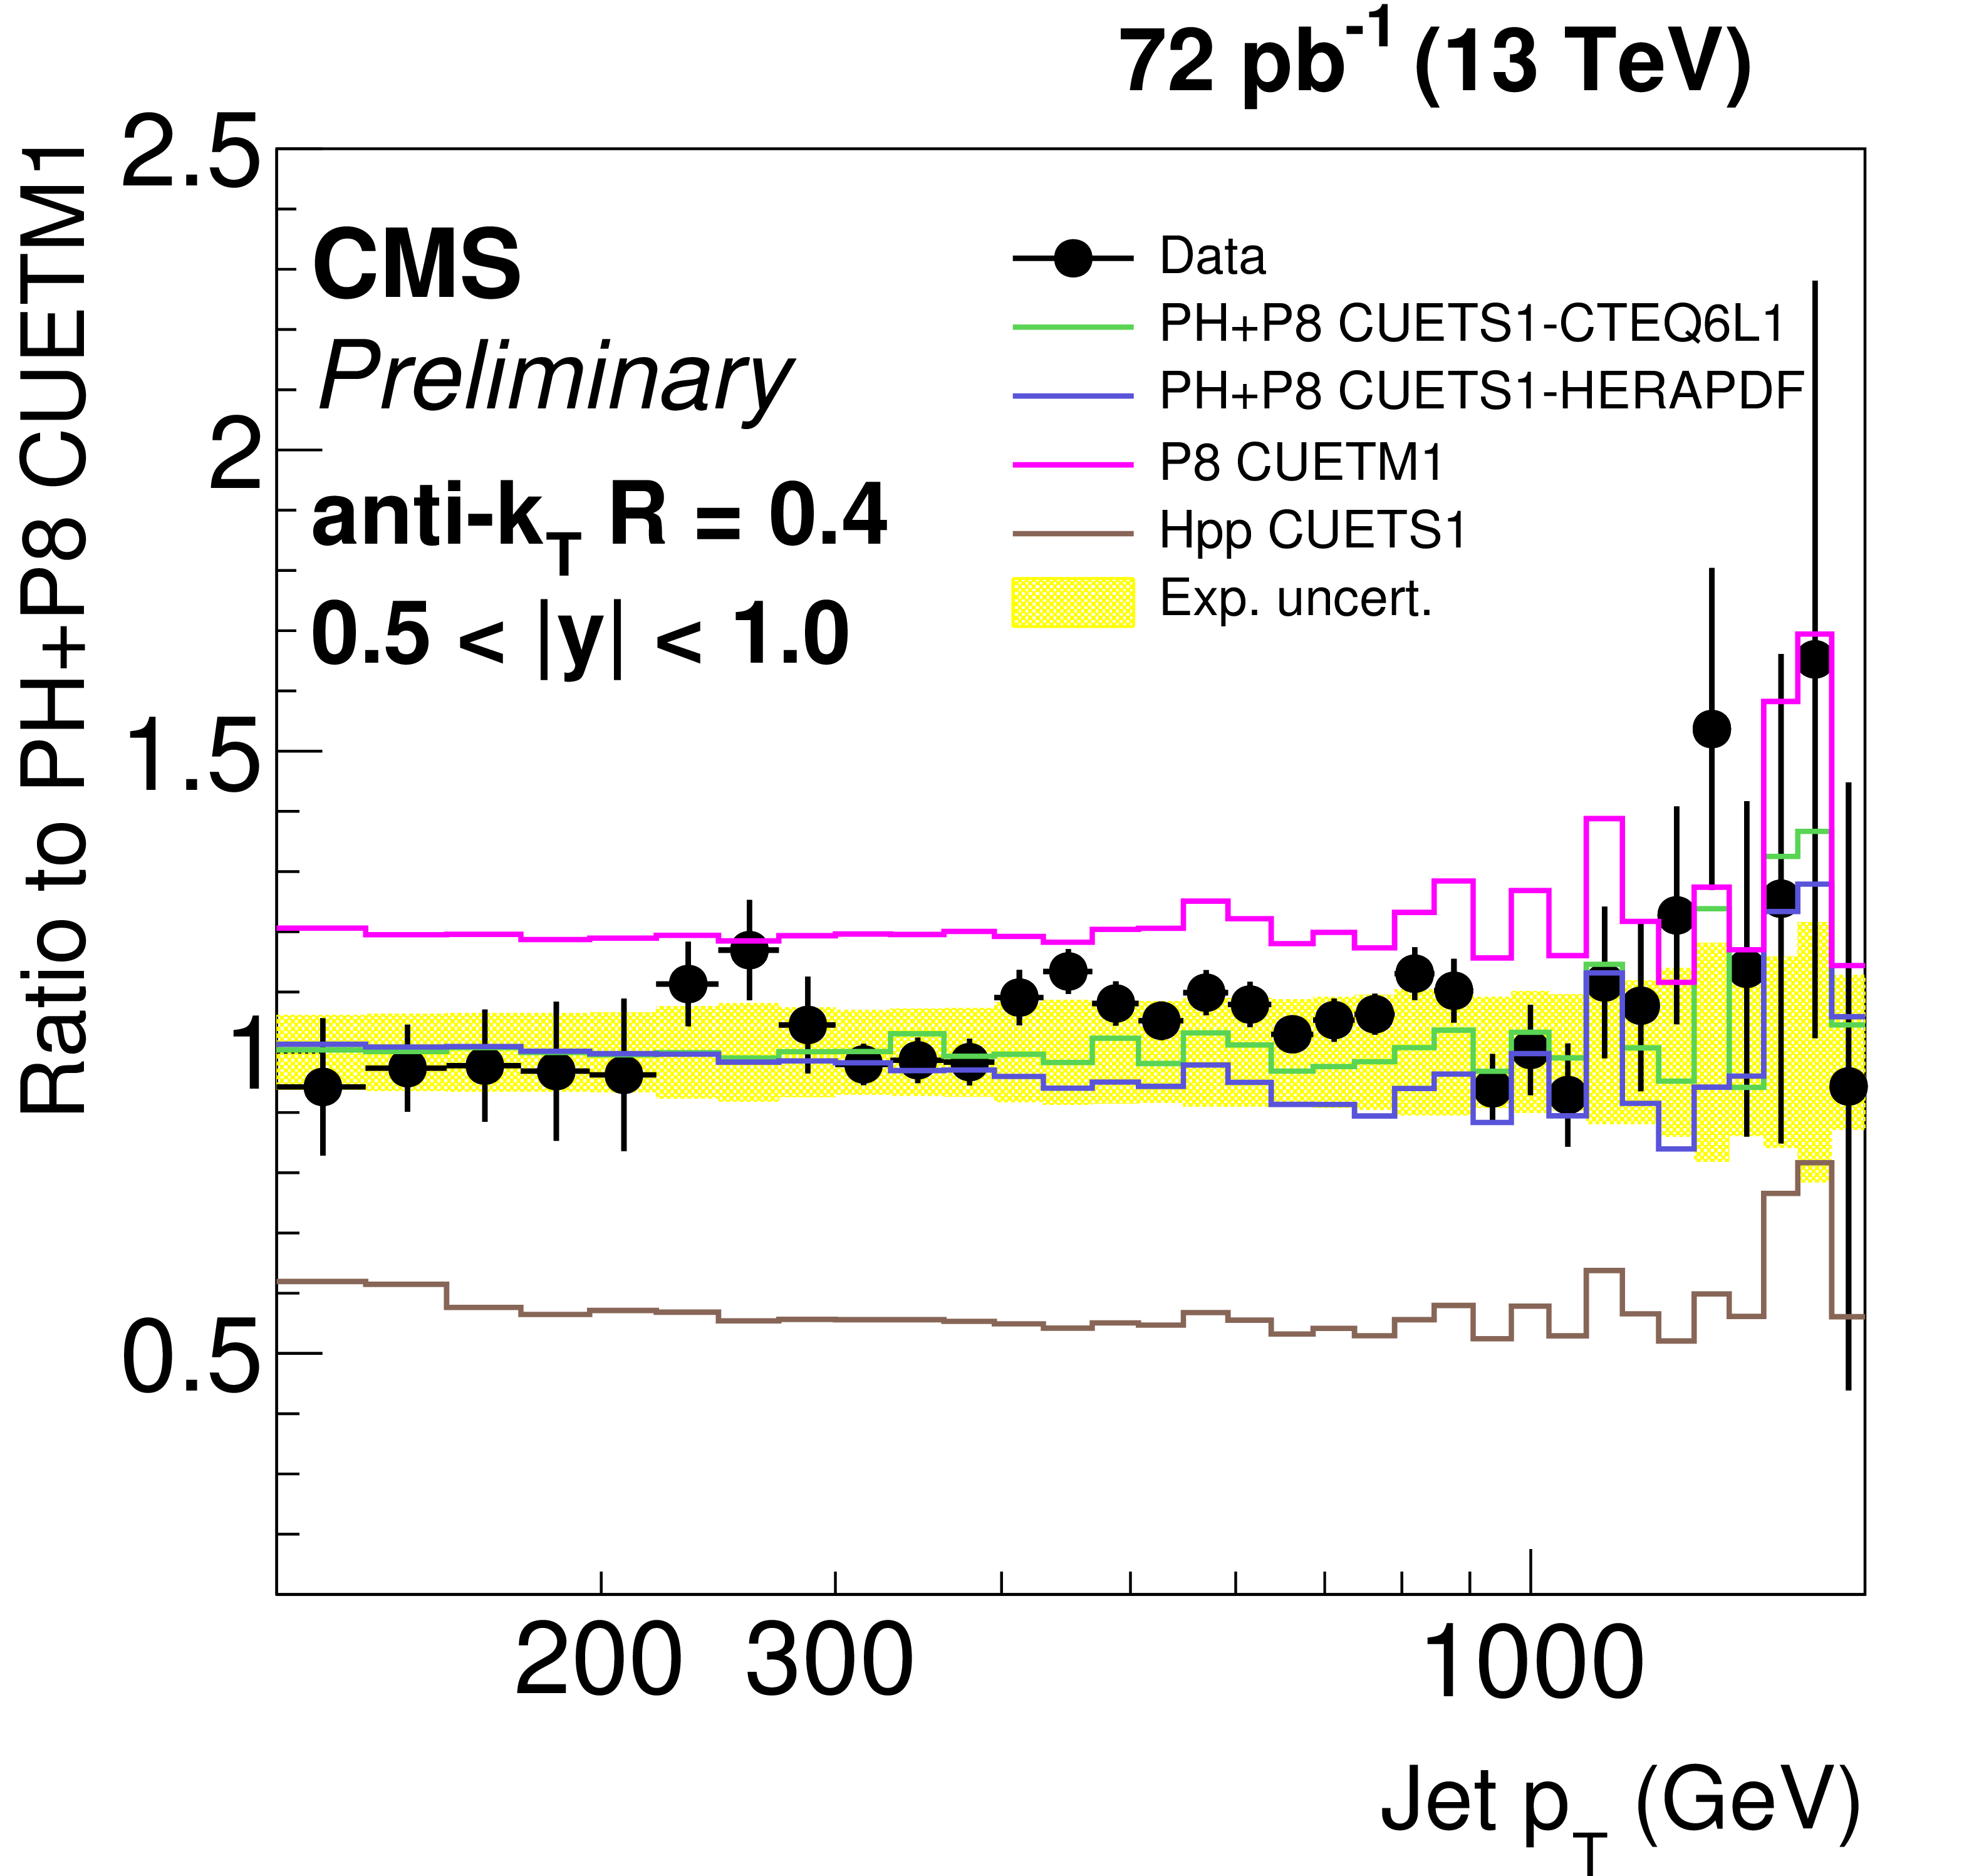
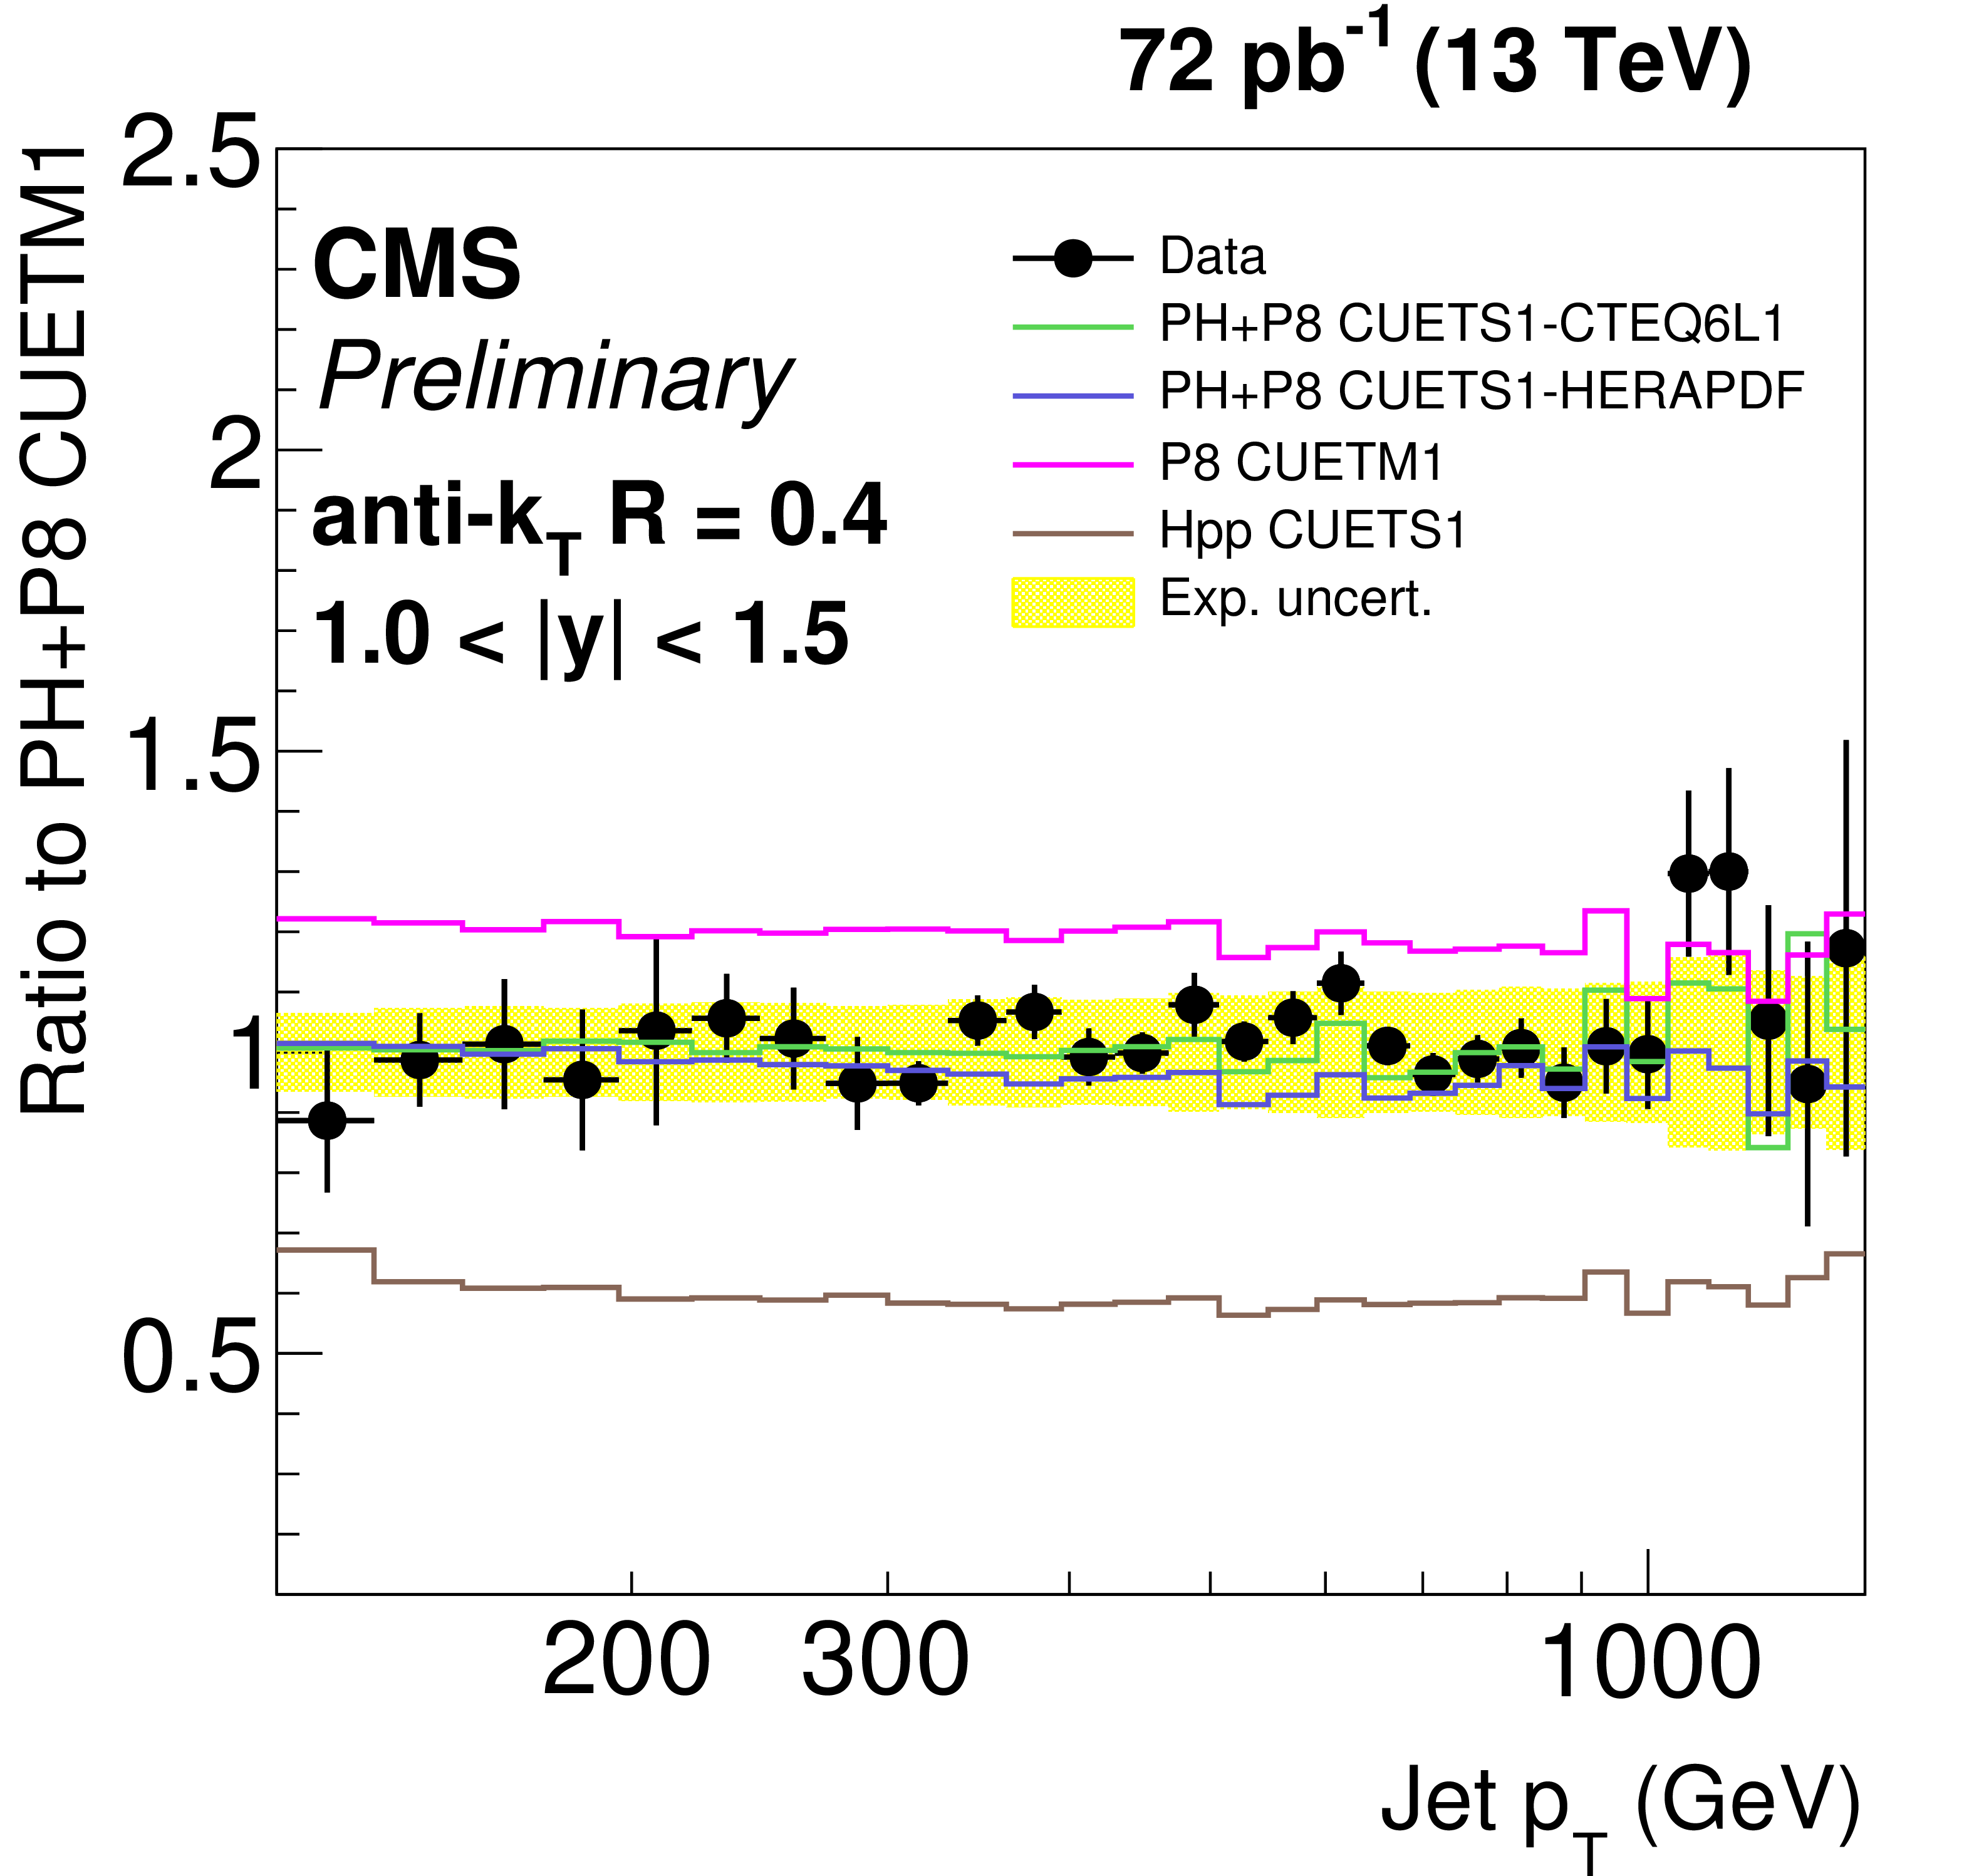
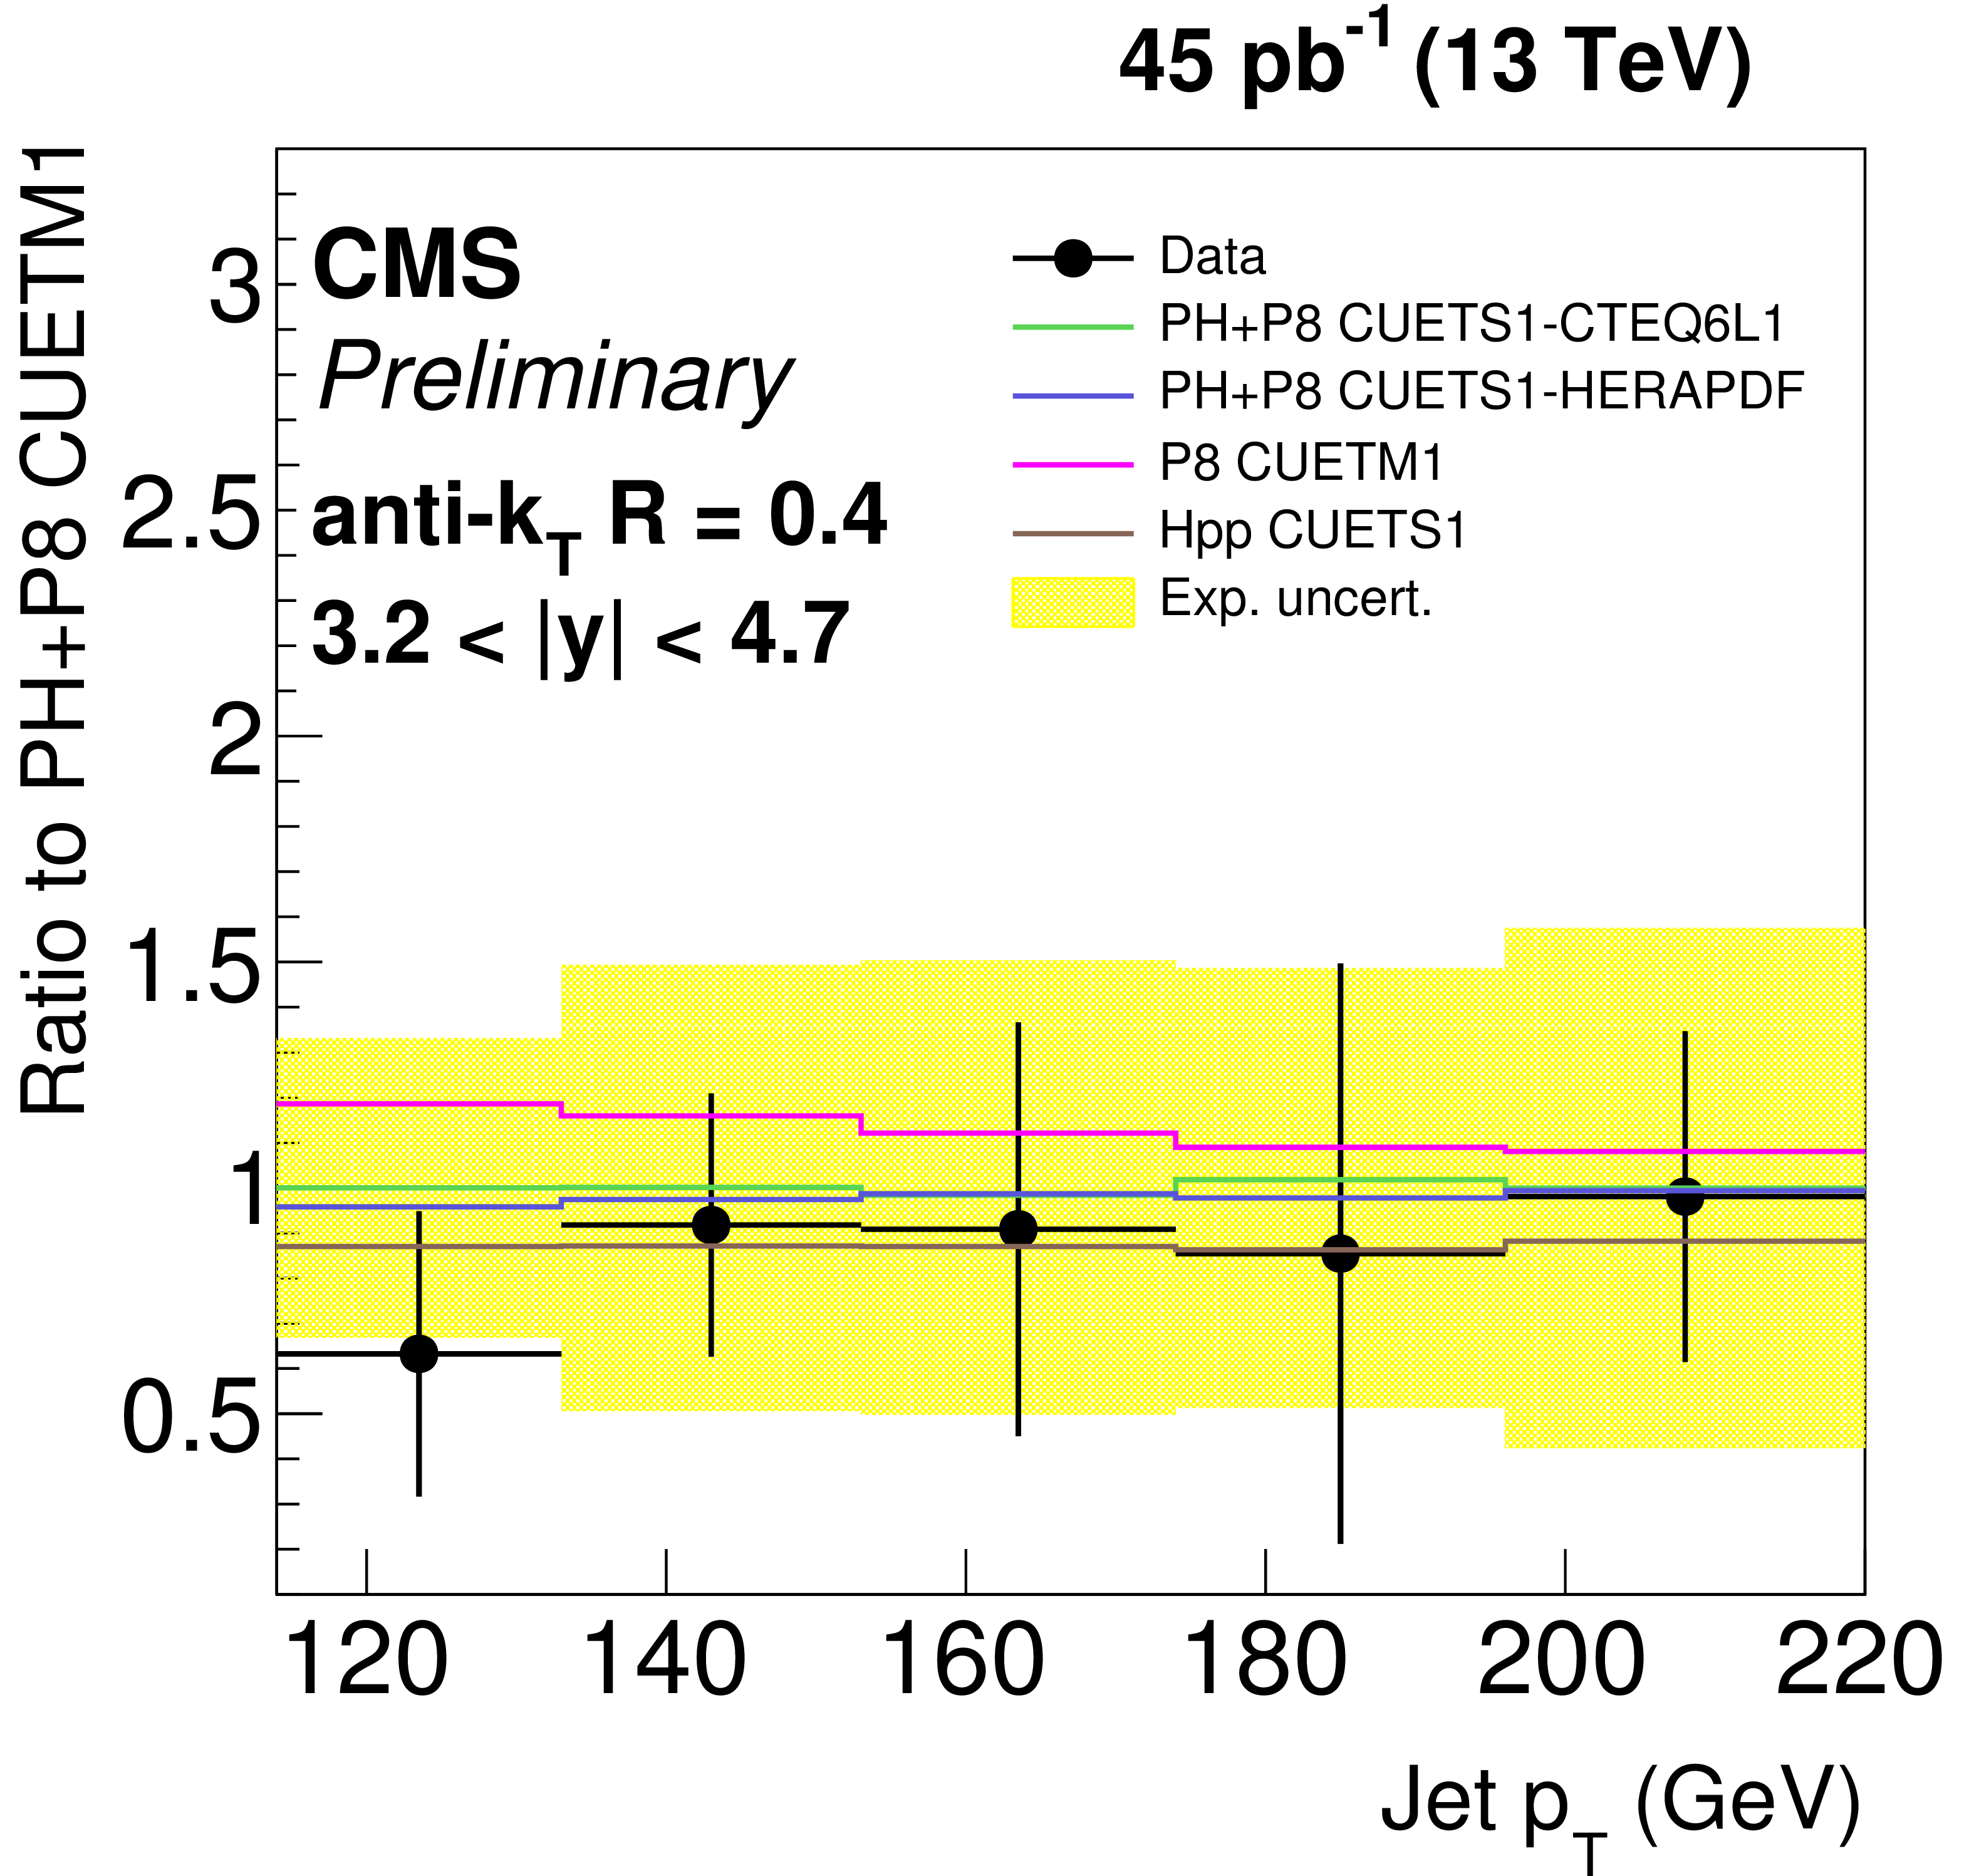
Figure 8-g:
Ratio of data over predictions from POWHEG + PYTHIA8 with tune CUETM1. For comparison predictions employing four other MC generators are also shown, where PH, P8 and Hpp stands for POWHEG , PYTHIA8 and HERWIG++ respectively. Jets are clustered with the anti-$ {k_{\mathrm {T}}} $ algorithm ($R =$ 0.4). The error bars correspond to the statistical uncertainty of the data and the shaded band to the total systematical uncertainty. |
| Tables | |
png ; pdf |
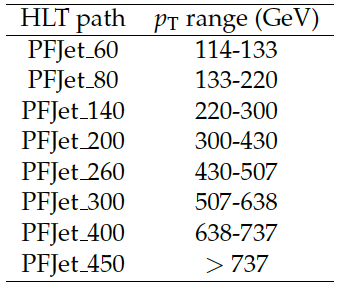
Table 1:
Trigger regions defined as ranges of the leading jet $ {p_{\mathrm {T}}} $ in each event for every single jet trigger used in the inclusive jet cross section measurement. |
|
|
Compact Muon Solenoid LHC, CERN |
|

|

|

|

|

|