

Compact Muon Solenoid
LHC, CERN
| CMS-PAS-SMP-14-010 | ||
| Measurement of the associated production of a Z boson and b jets in pp collisions at 8 TeV | ||
| CMS Collaboration | ||
| August 2015 | ||
| Abstract: The study of the production of a Z boson in association with at least one jet originating from a b quark in proton-proton collisions at $\sqrt{s} =$ 8 TeV is presented. Differential cross sections are measured on data collected by CMS in 2012, for a total integrated luminosity of 19.8 fb$^{-1}$, using Z boson decays into electrons or muons, and identified b quark jets. Cross sections are measured as a function of observables characterizing the b jet and Z boson kinematics, and ratios of differential cross sections for the associated production with at least a b jet and with any jet are presented. In the case where two b quark jets are reconstructed, differential cross sections are also measured for observables describing the kinematics of the dijet system. Results are compared to theoretical predictions, testing two different flavour schemes for the choice of initial state partons. | ||
|
Links:
CDS record (PDF) ;
CADI line (restricted) ; Figures are also available from the CDS record. These preliminary results are superseded in this paper, EPJC 77 (2017) 751. The superseded preliminary plots can be found here. |
||
| Figures | |
png ; pdf |
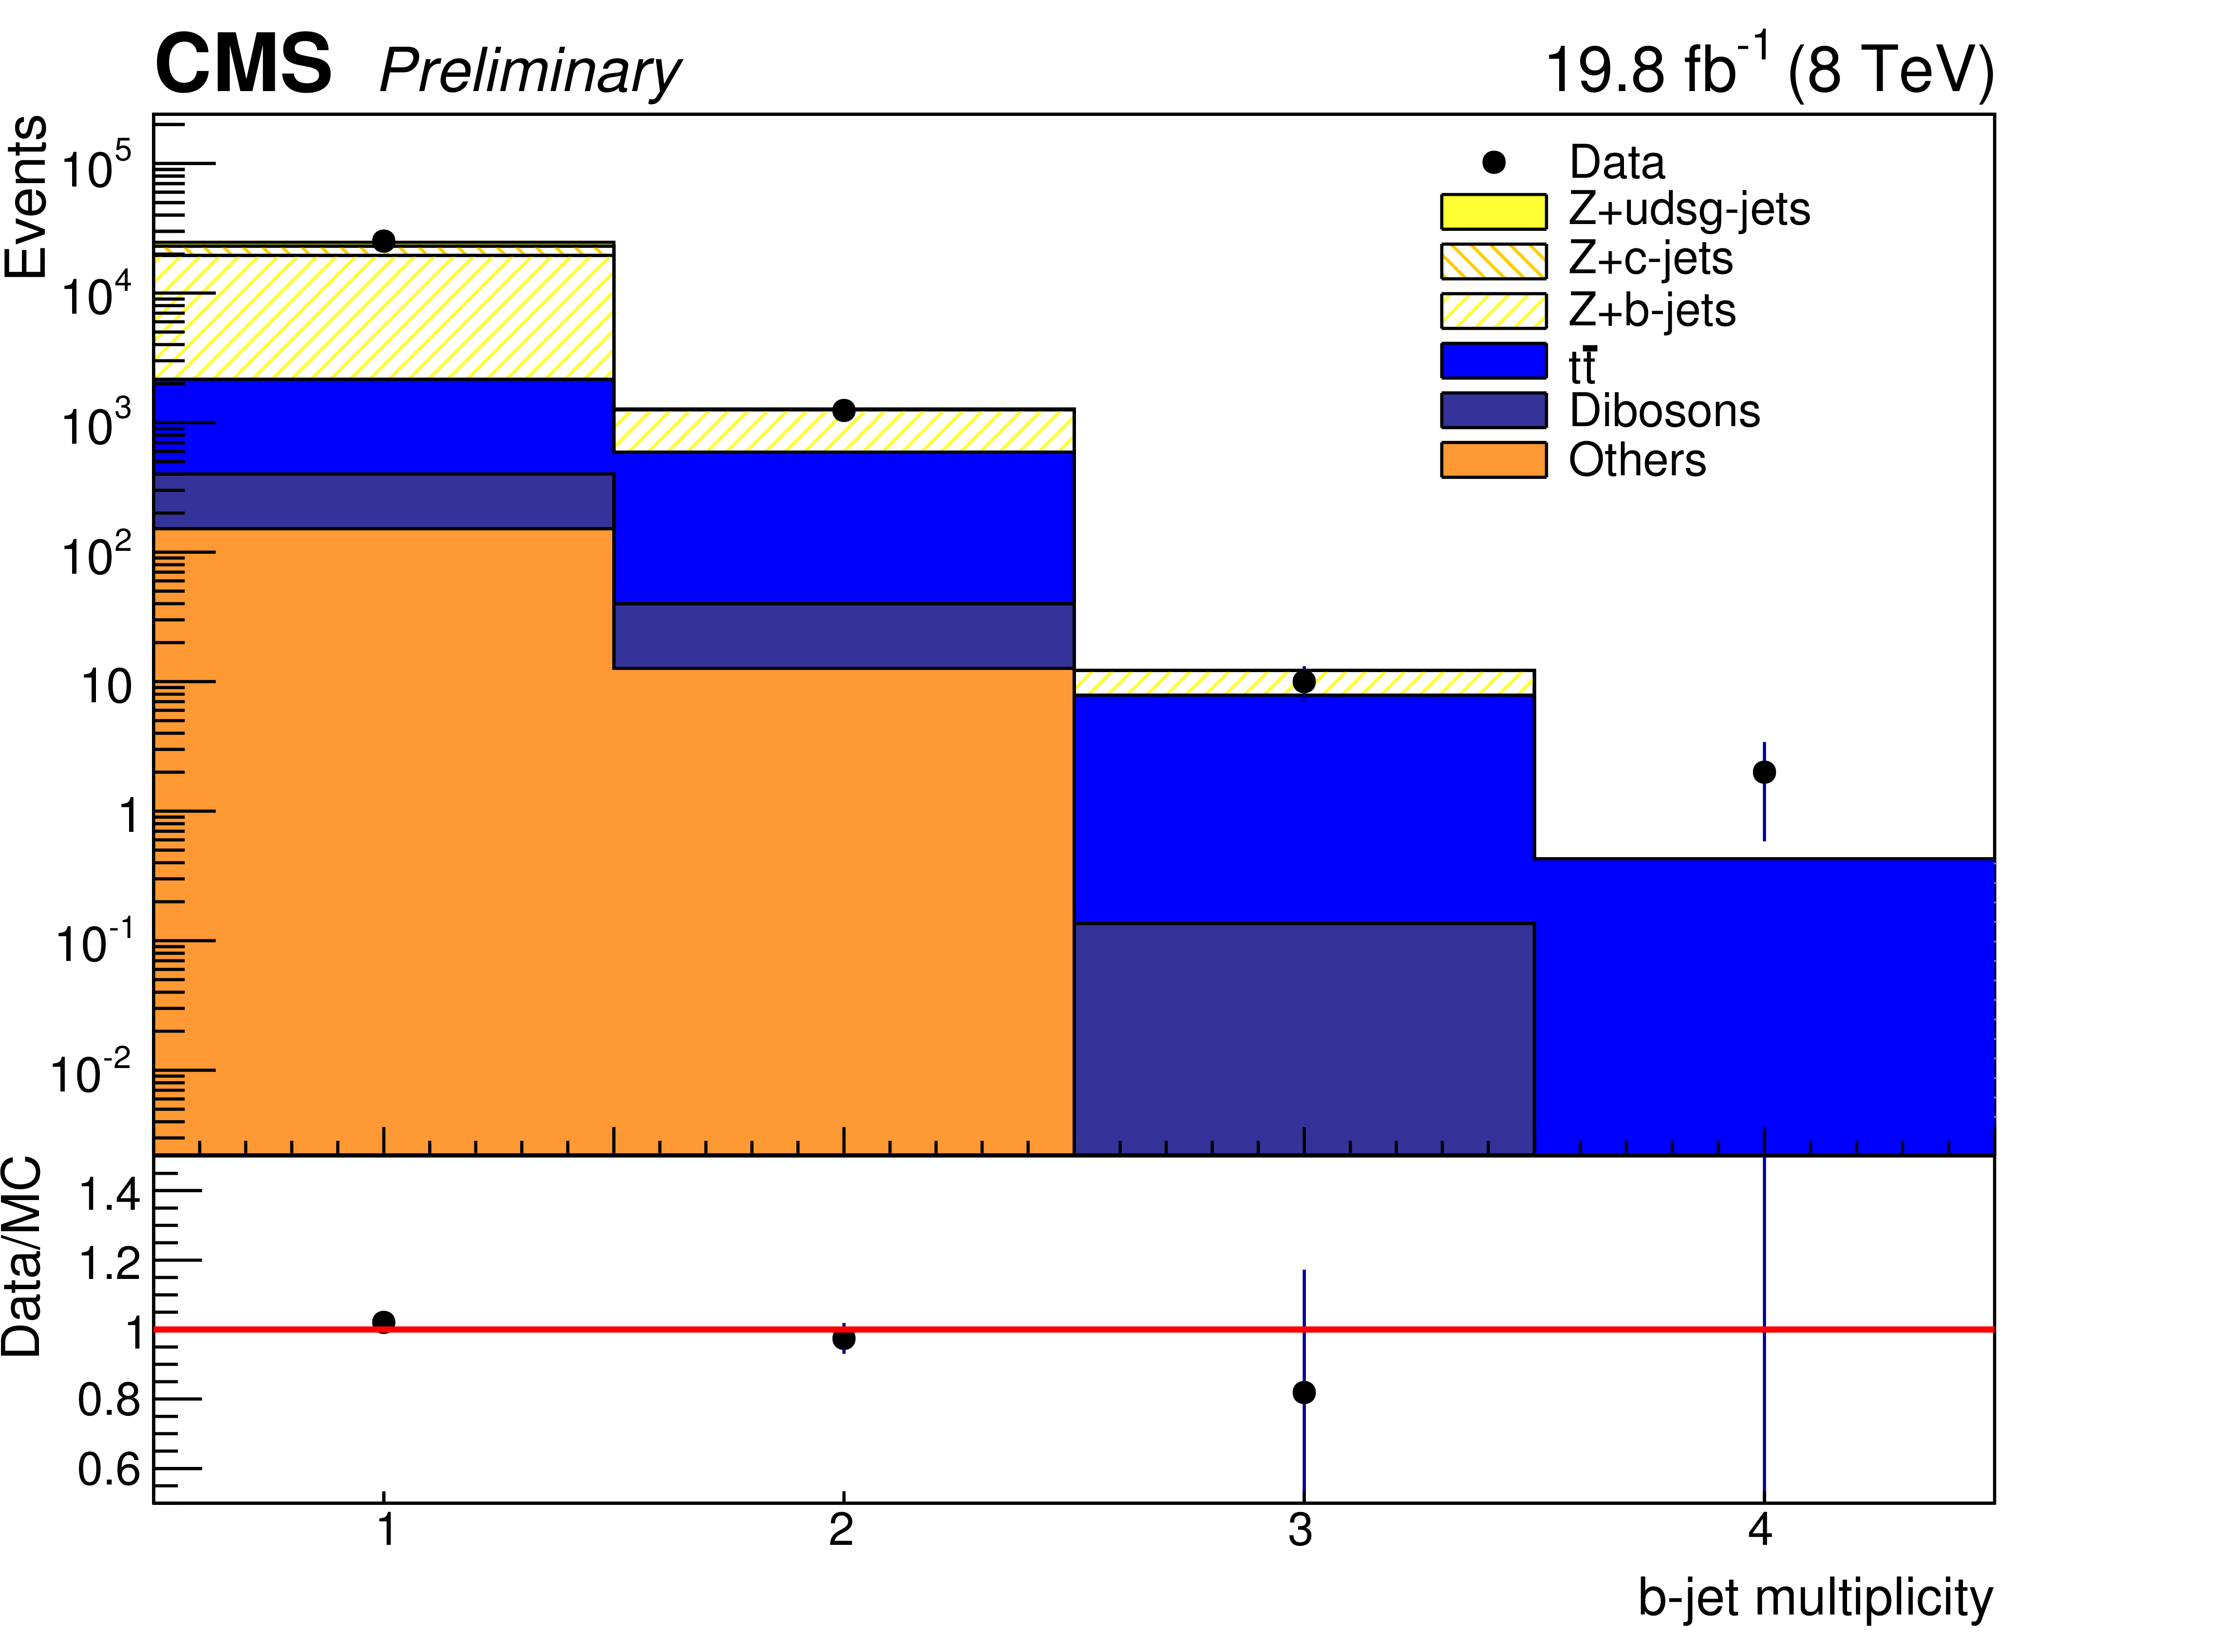
Figure 1-a:
Exclusive $ {\mathrm {b}}$-jet multiplicity distributions for $ { {\mathrm {Z}}(1 {\mathrm {b}})} $ events, for the electron (a) and muon (b) $ {\mathrm {Z}} $ decay channels. |

png ; pdf |
Figure 1-b:
Exclusive $ {\mathrm {b}}$-jet multiplicity distributions for $ { {\mathrm {Z}}(1 {\mathrm {b}})} $ events, for the electron (a) and muon (b) $ {\mathrm {Z}} $ decay channels. |
png ; pdf |
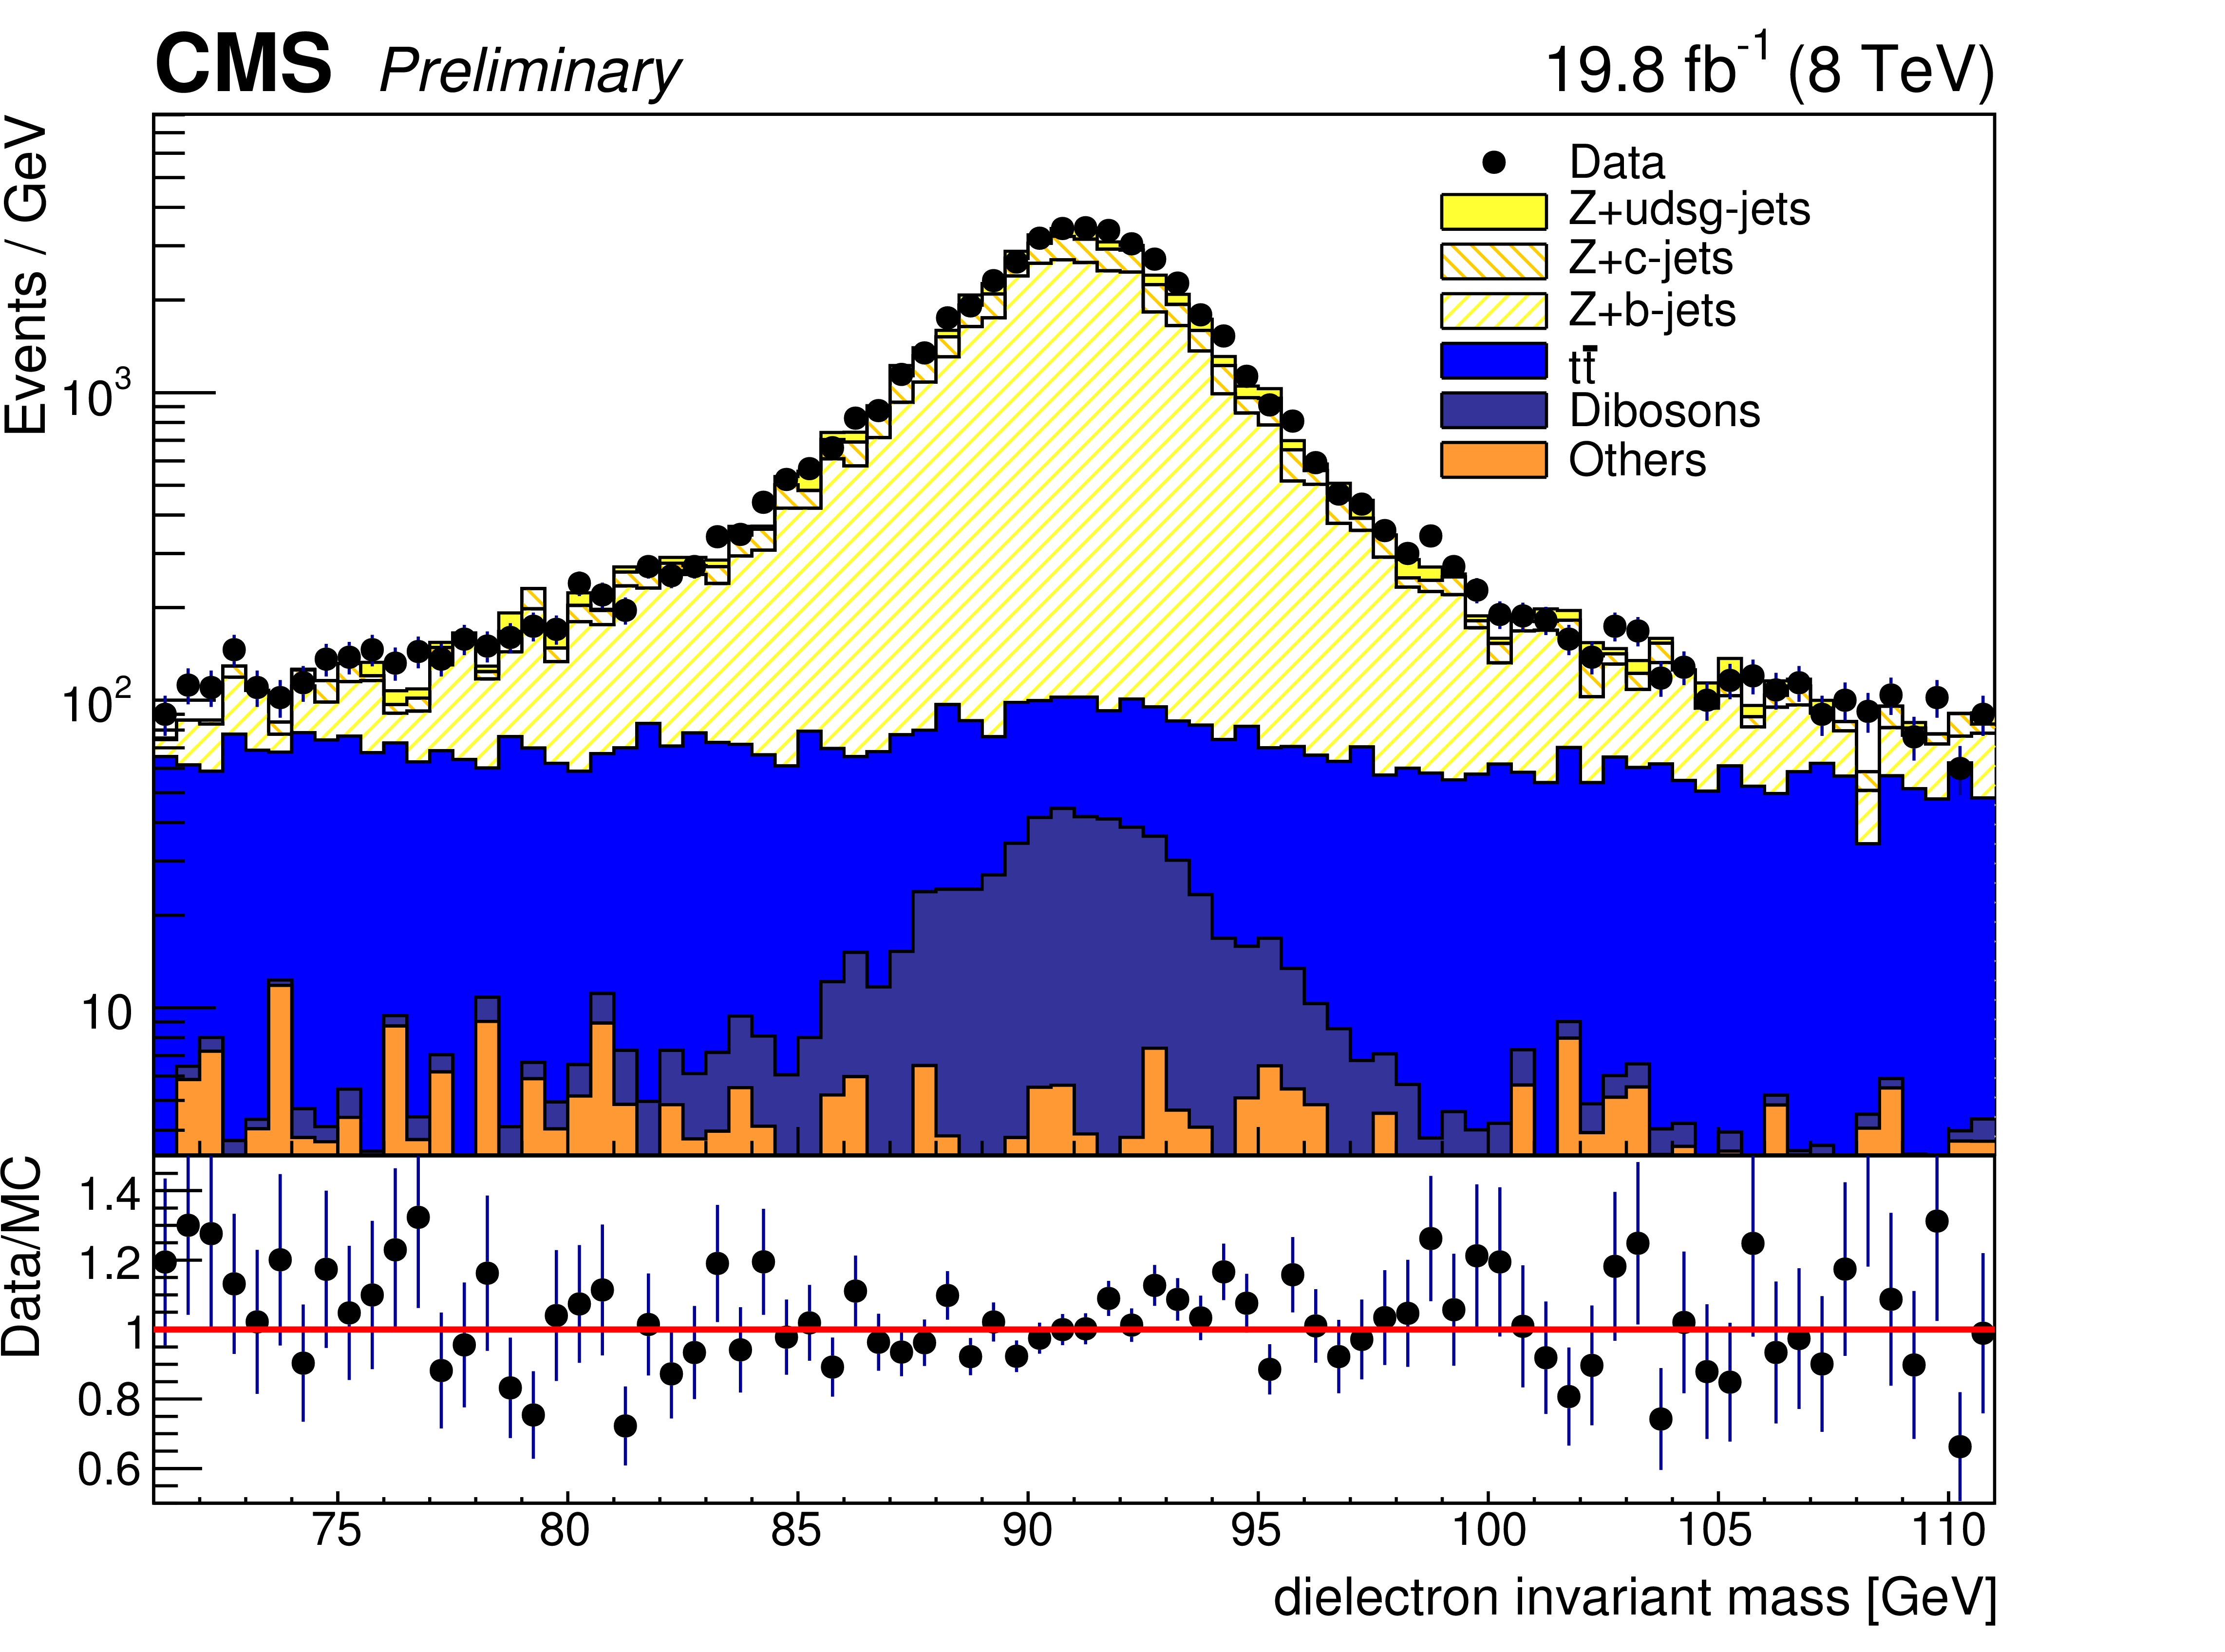
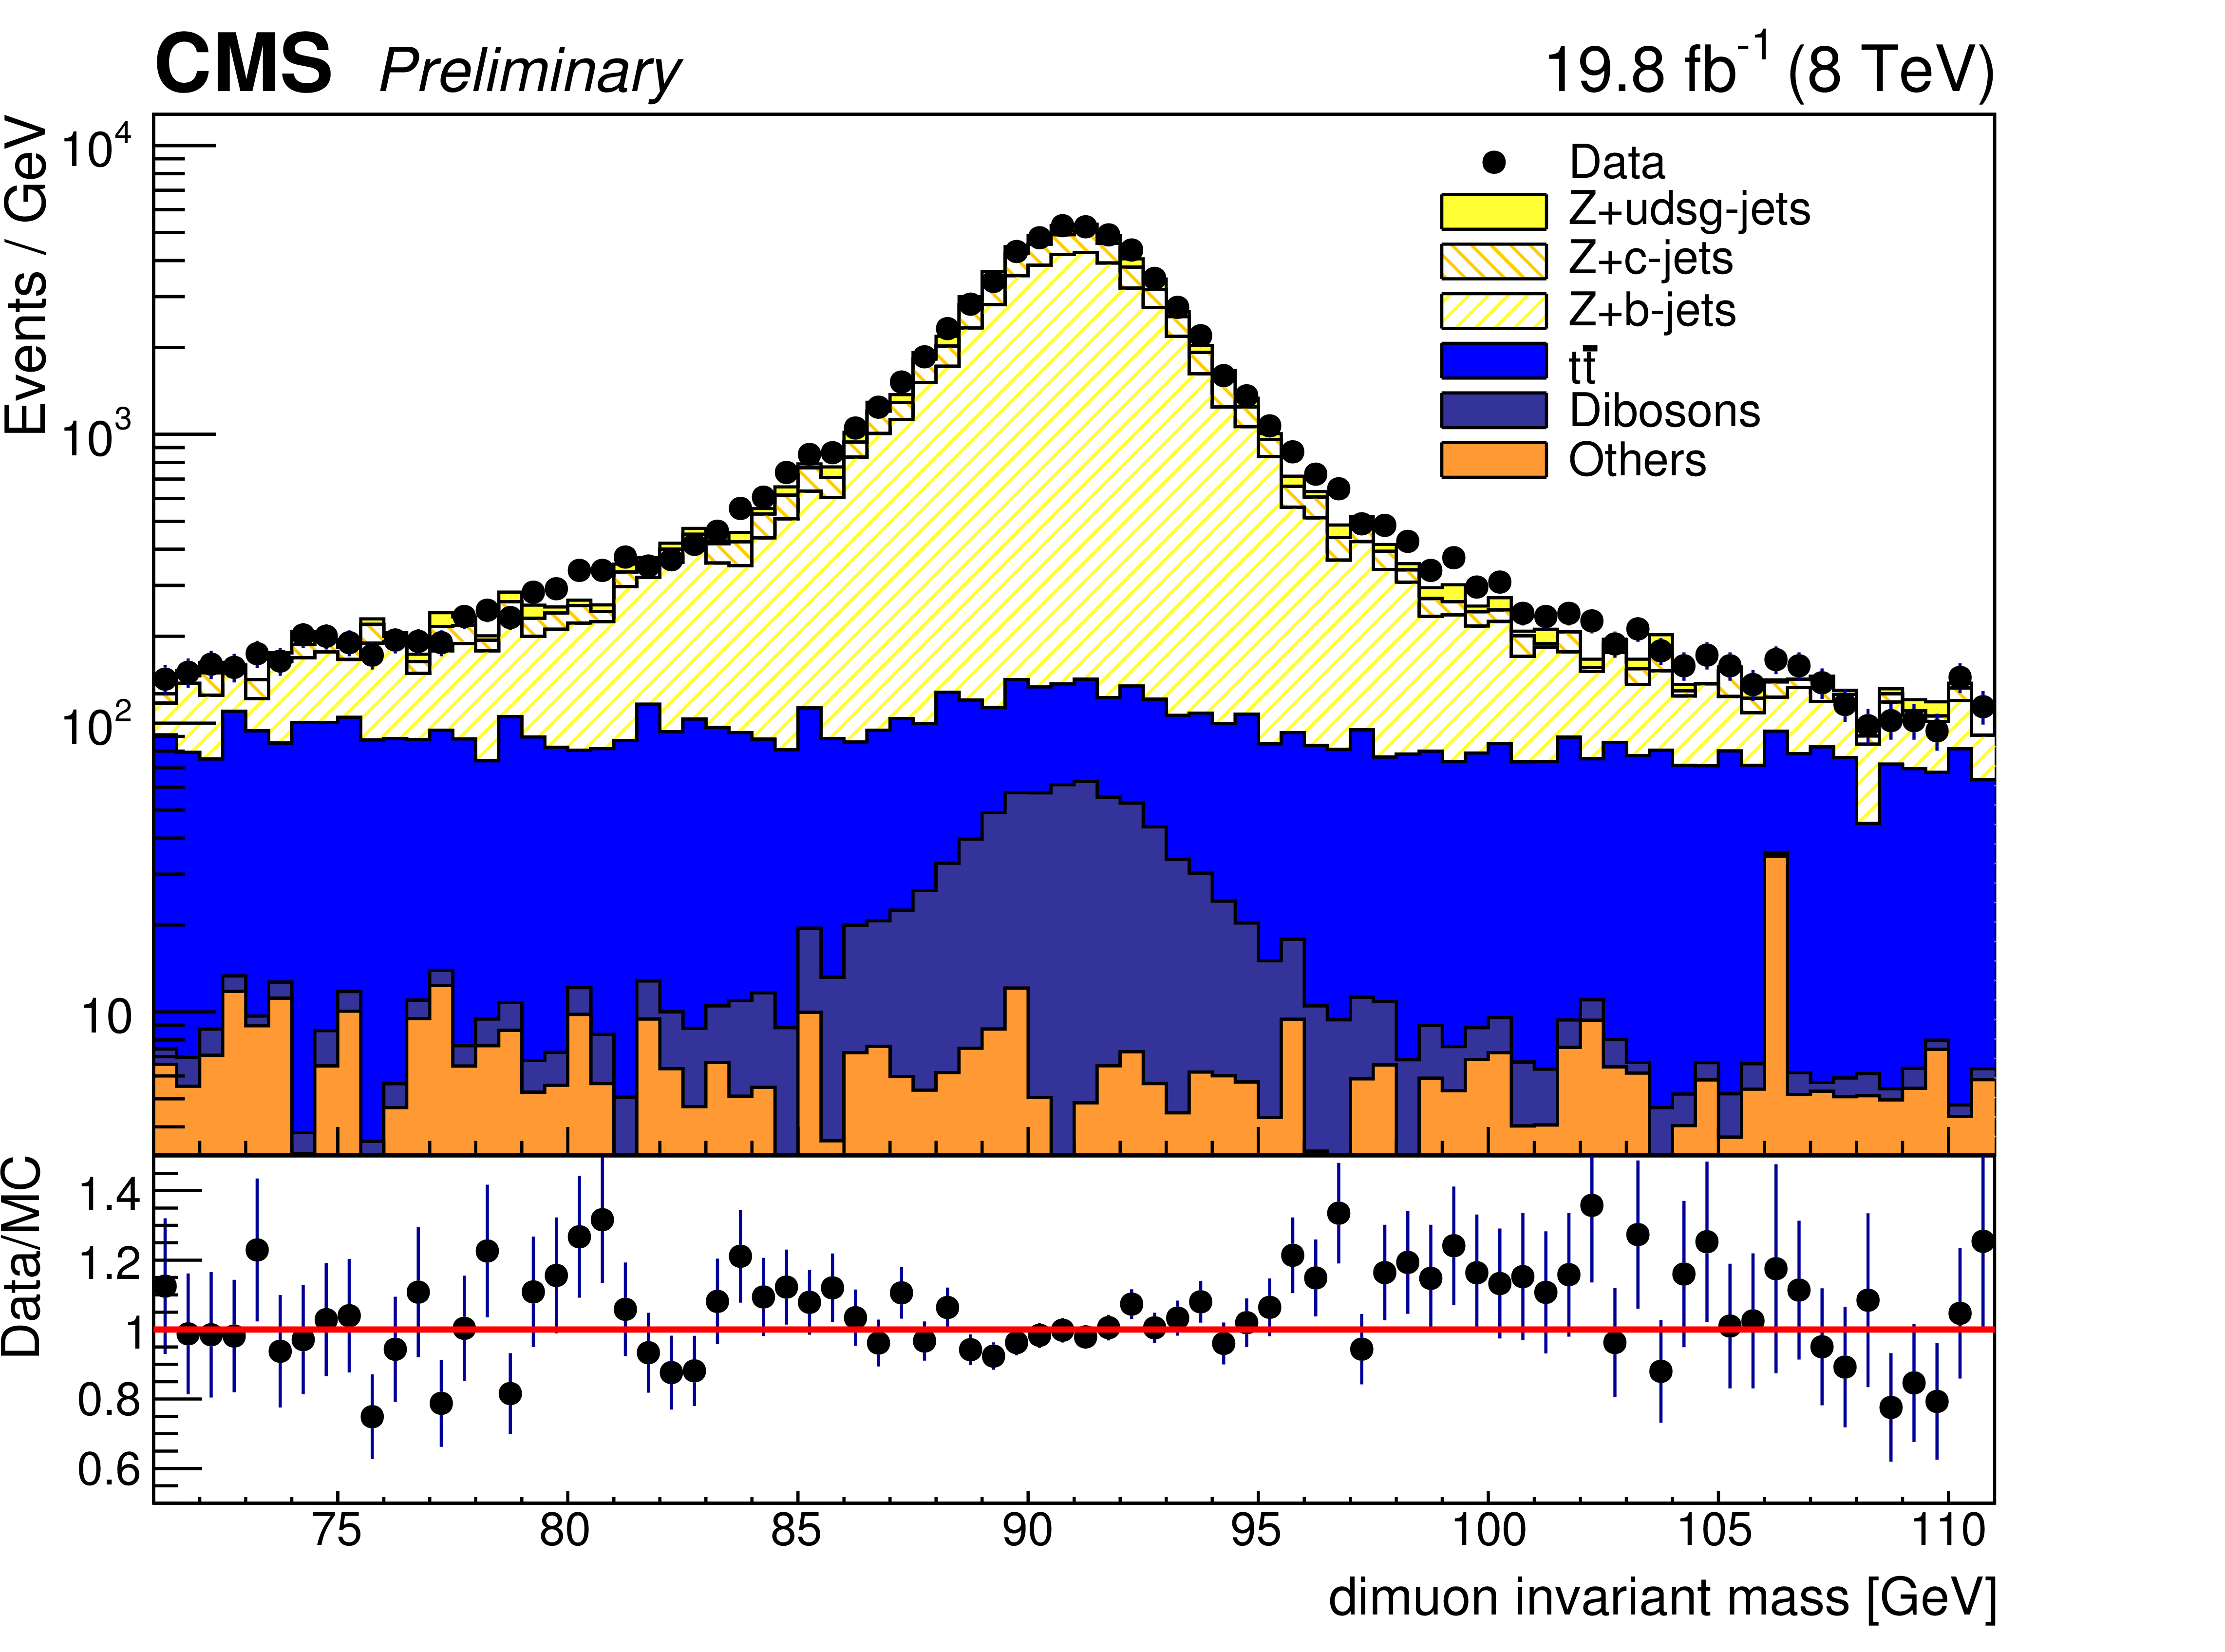
Figure 2-a:
Dilepton invariant mass distributions for $ { {\mathrm {Z}}(1 {\mathrm {b}})} $ events, for the electron (a) and muon (b) $ {\mathrm {Z}} $ decay channels. |
png ; pdf |
Figure 2-b:
Dilepton invariant mass distributions for $ { {\mathrm {Z}}(1 {\mathrm {b}})} $ events, for the electron (a) and muon (b) $ {\mathrm {Z}} $ decay channels. |

png ; pdf |
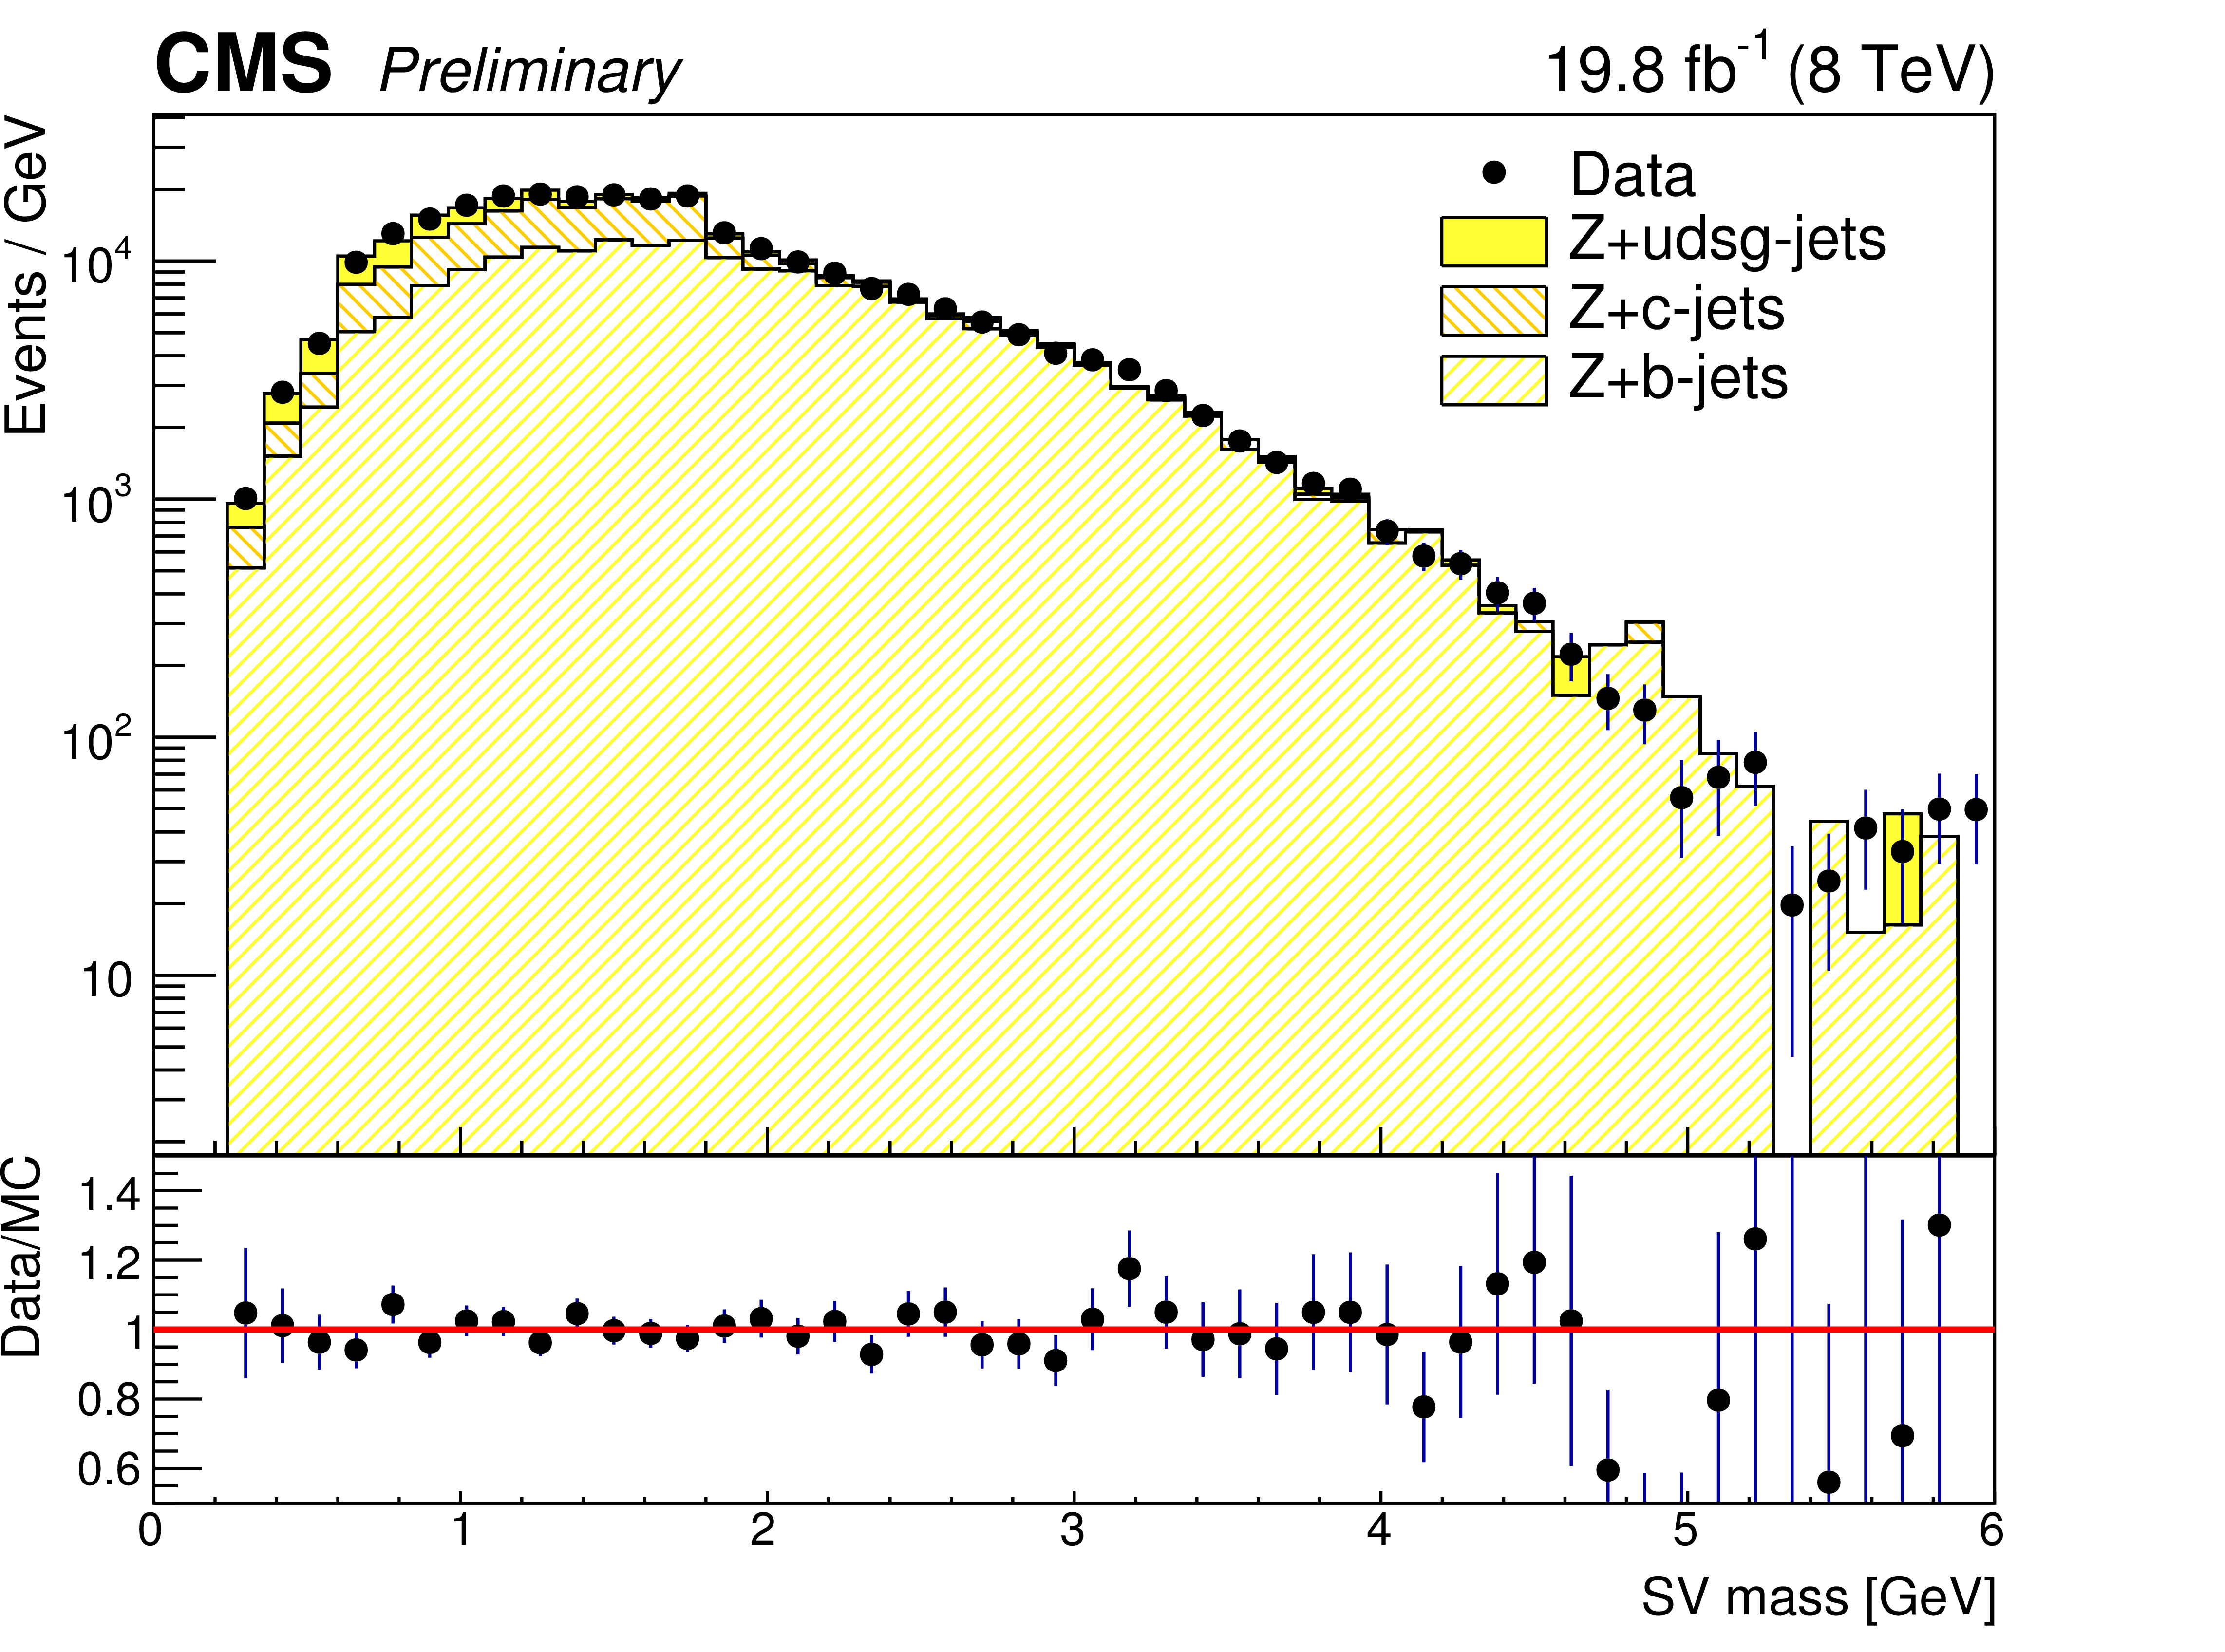
Figure 3-a:
Distributions of the secondary vertex mass of the leading-$ {p_{\mathrm {T}}} $ jet after the $ { {\mathrm {Z}}(1 {\mathrm {b}})} $ selection with the $ {\mathrm {Z}} $ boson decaying into electrons (a) and muons (b). The subsamples corresponding to $ {\mathrm {b}}$-tagged jets originating from b, c and light quarks/gluons are shown. |
png ; pdf |
Figure 3-b:
Distributions of the secondary vertex mass of the leading-$ {p_{\mathrm {T}}} $ jet after the $ { {\mathrm {Z}}(1 {\mathrm {b}})} $ selection with the $ {\mathrm {Z}} $ boson decaying into electrons (a) and muons (b). The subsamples corresponding to $ {\mathrm {b}}$-tagged jets originating from b, c and light quarks/gluons are shown. |

png ; pdf |
Figure 4-a:
Differential $ { {\mathrm {Z}}(1 {\mathrm {b}})} $ cross section as a function of the leading-$ {p_{\mathrm {T}}}$ $ {\mathrm {b}}$ jet $ {p_{\mathrm {T}}} $ (a), and the cross section ratio R for the leading ${p_{\mathrm {T}}} $ jets between $ { {\mathrm {Z}}(1 {\mathrm {b}})} $ and Z+jets (b), compared with the MadGraph 5FS, MadGraph 4FS and POWHEG theoretical predictions (shaded bands), normalized to the theoretical cross sections described in the text. For each data point the statistical and the total (statistical plus systematic) uncertainty are represented by the double error bar. The width of shaded bands represents the statistical error on the theoretical predictions. |
png ; pdf |
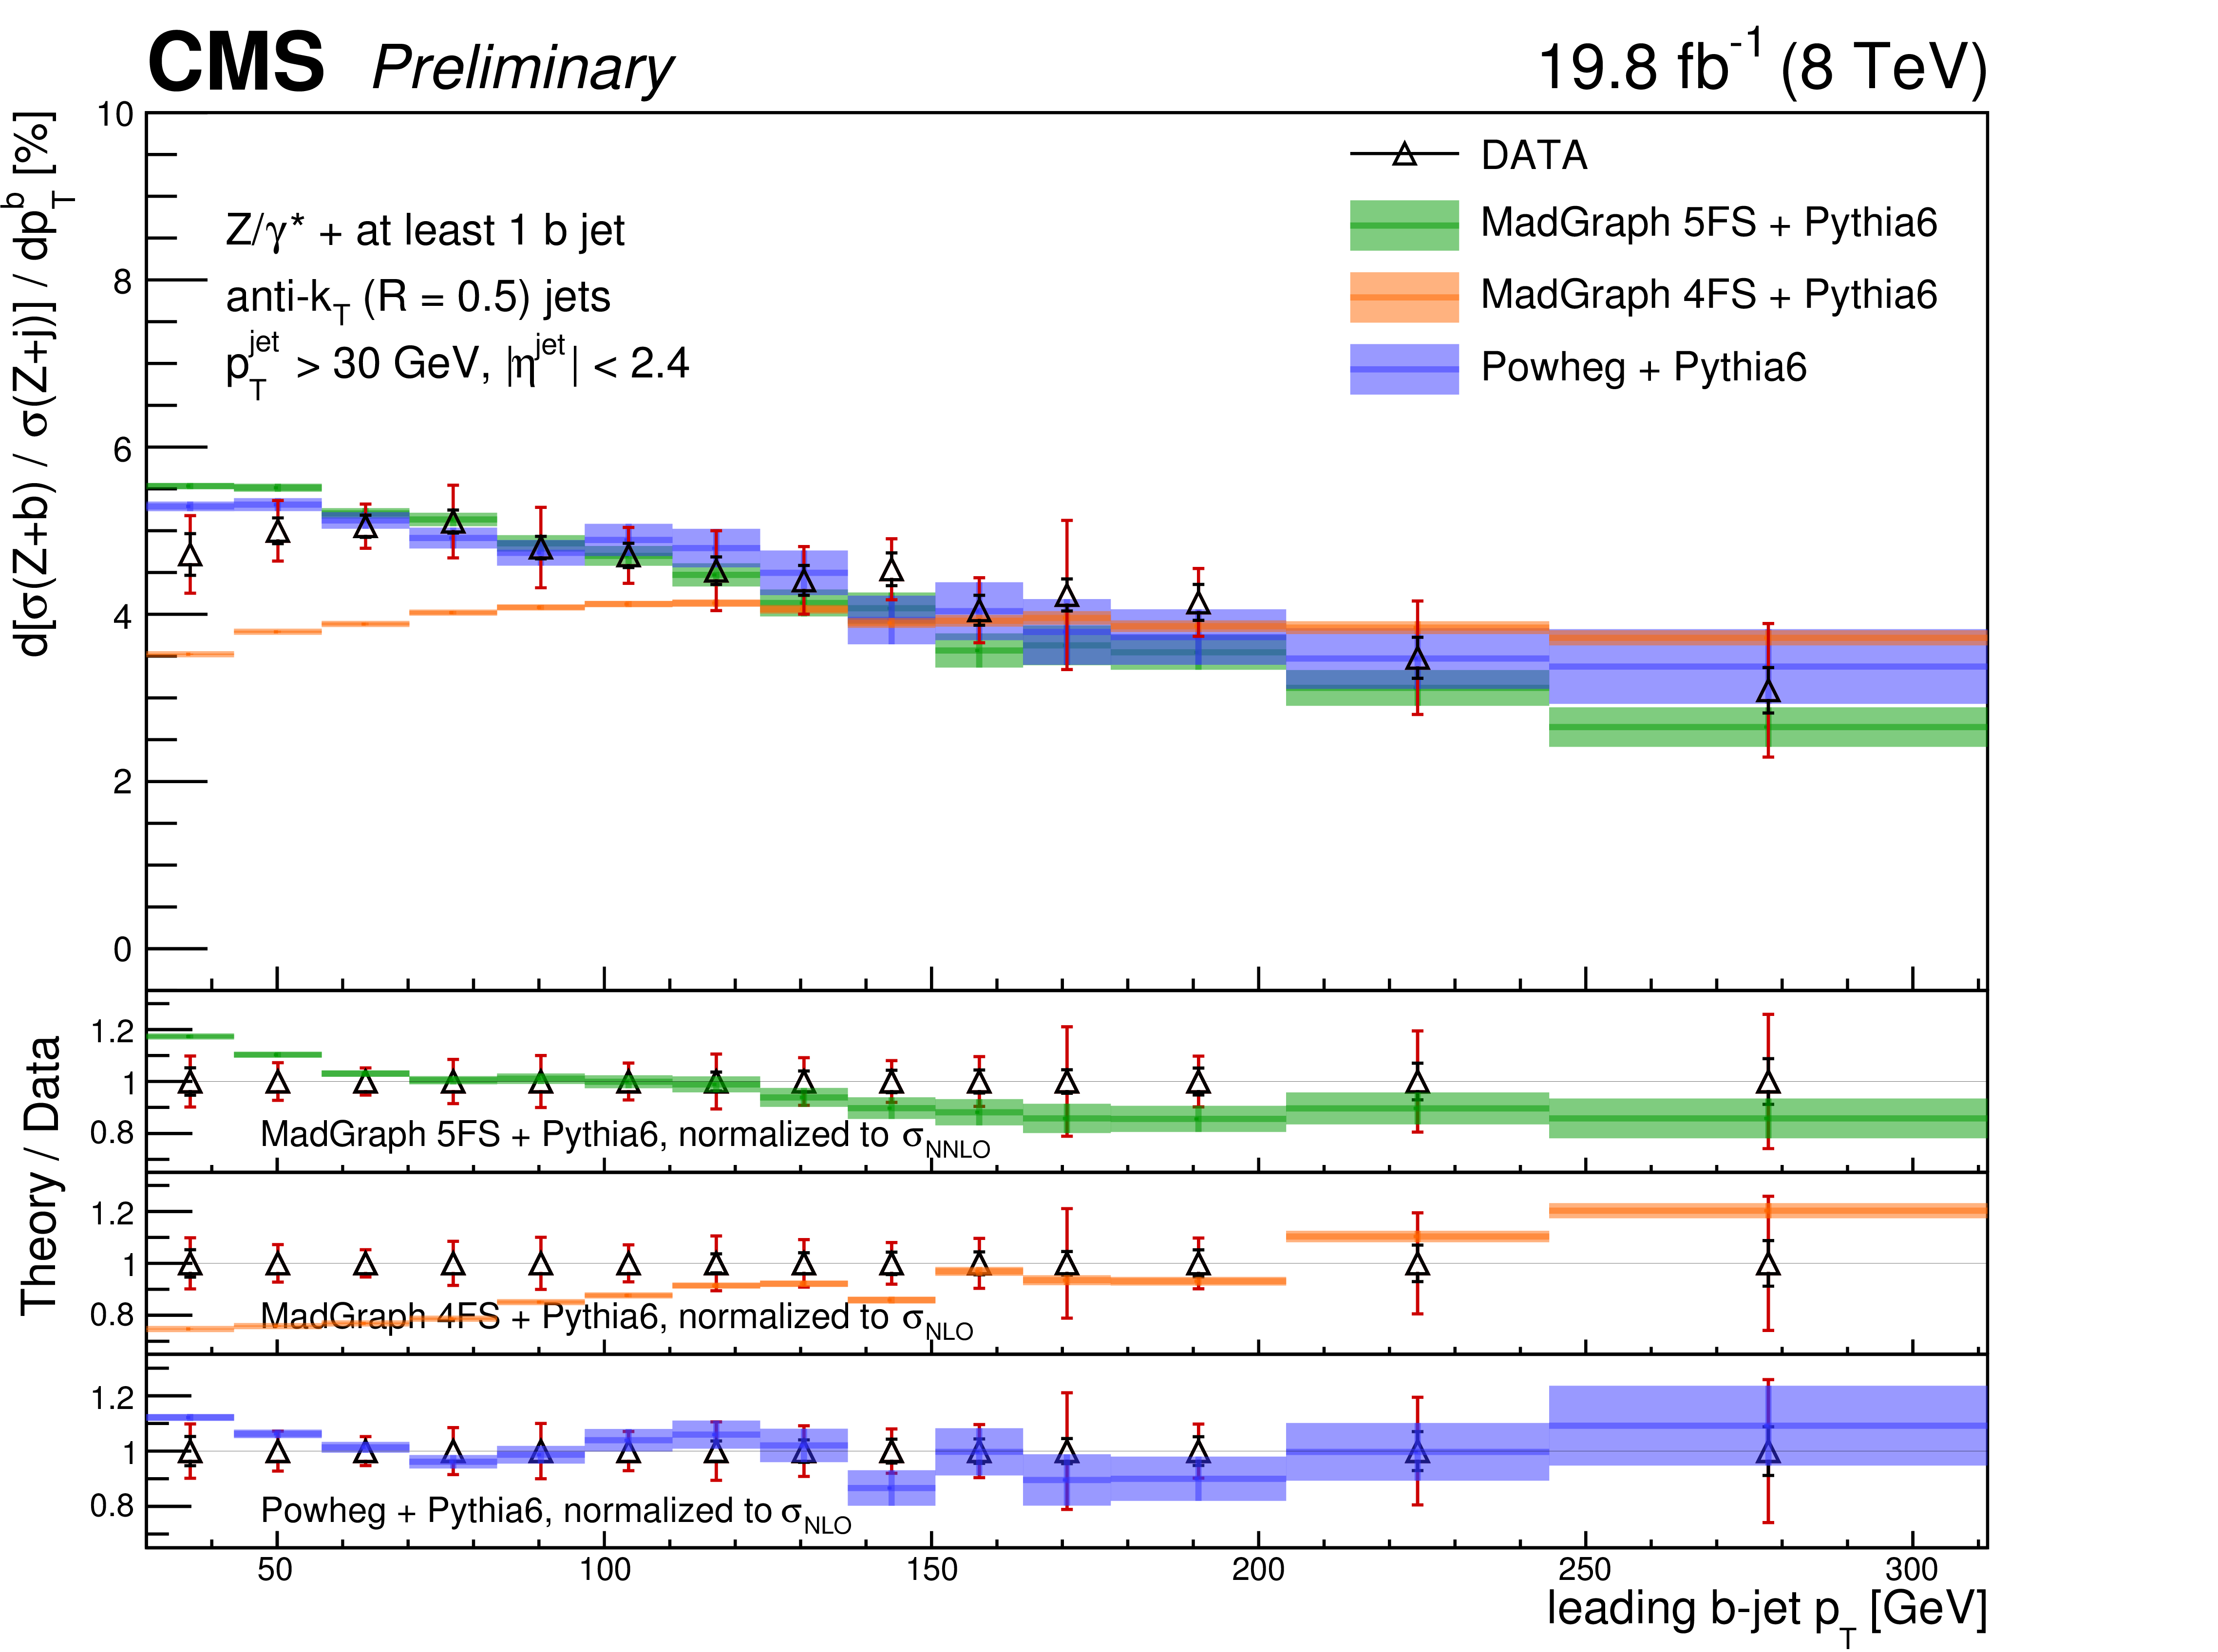
Figure 4-b:
Differential $ { {\mathrm {Z}}(1 {\mathrm {b}})} $ cross section as a function of the leading-$ {p_{\mathrm {T}}}$ $ {\mathrm {b}}$ jet $ {p_{\mathrm {T}}} $ (a), and the cross section ratio R for the leading ${p_{\mathrm {T}}} $ jets between $ { {\mathrm {Z}}(1 {\mathrm {b}})} $ and Z+jets (b), compared with the MadGraph 5FS, MadGraph 4FS and POWHEG theoretical predictions (shaded bands), normalized to the theoretical cross sections described in the text. For each data point the statistical and the total (statistical plus systematic) uncertainty are represented by the double error bar. The width of shaded bands represents the statistical error on the theoretical predictions. |
png ; pdf |
Figure 5-a:
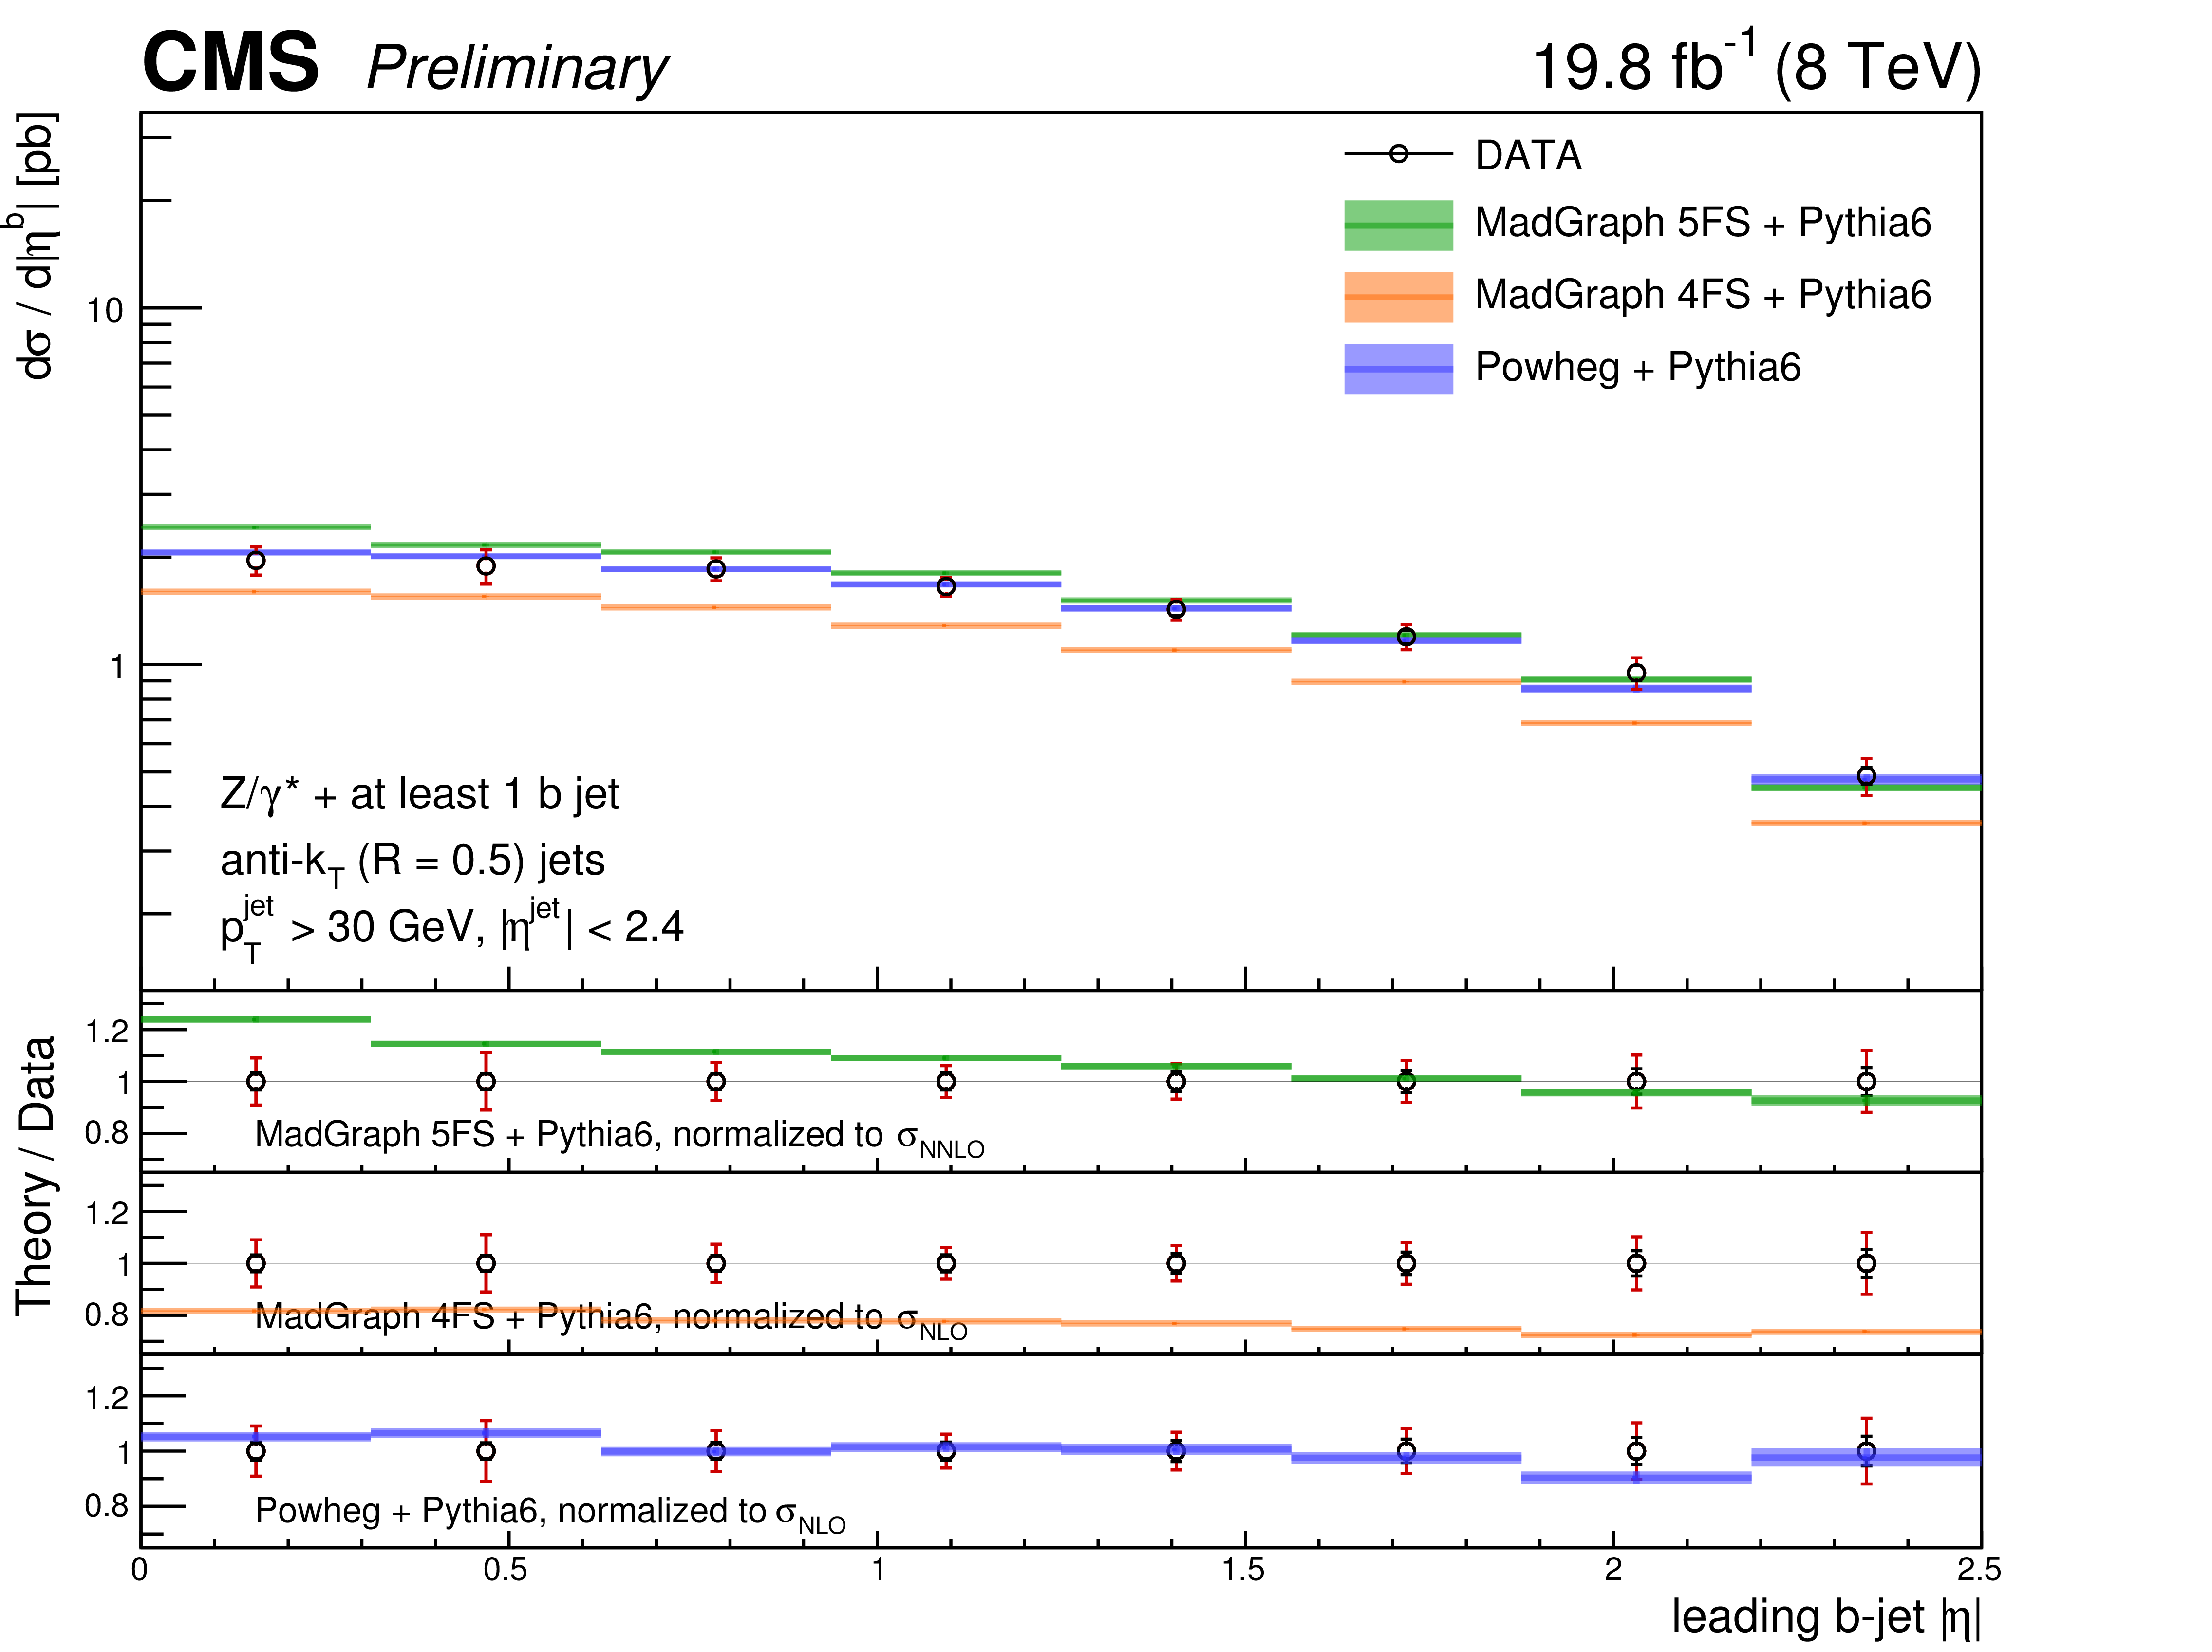
Differential $ { {\mathrm {Z}}(1 {\mathrm {b}})} $ cross section (a) as a function of the leading-$ {p_{\mathrm {T}}} $ $ {\mathrm {b}}$ jet $|\eta |$, and the cross section ratio R for the leading $ {p_{\mathrm {T}}} $ jet $|\eta |$ between $ { {\mathrm {Z}}(1 {\mathrm {b}})} $ and Z+jets (b), compared with the MadGraph 5FS, MadGraph 4FS and POWHEG theoretical predictions (shaded bands), normalized to the theoretical cross sections described in the text. For each data point the statistical and the total (statistical plus systematic) uncertainty are represented by the double error bar. The width of shaded bands represents the statistical error on the theoretical predictions. |
png ; pdf |
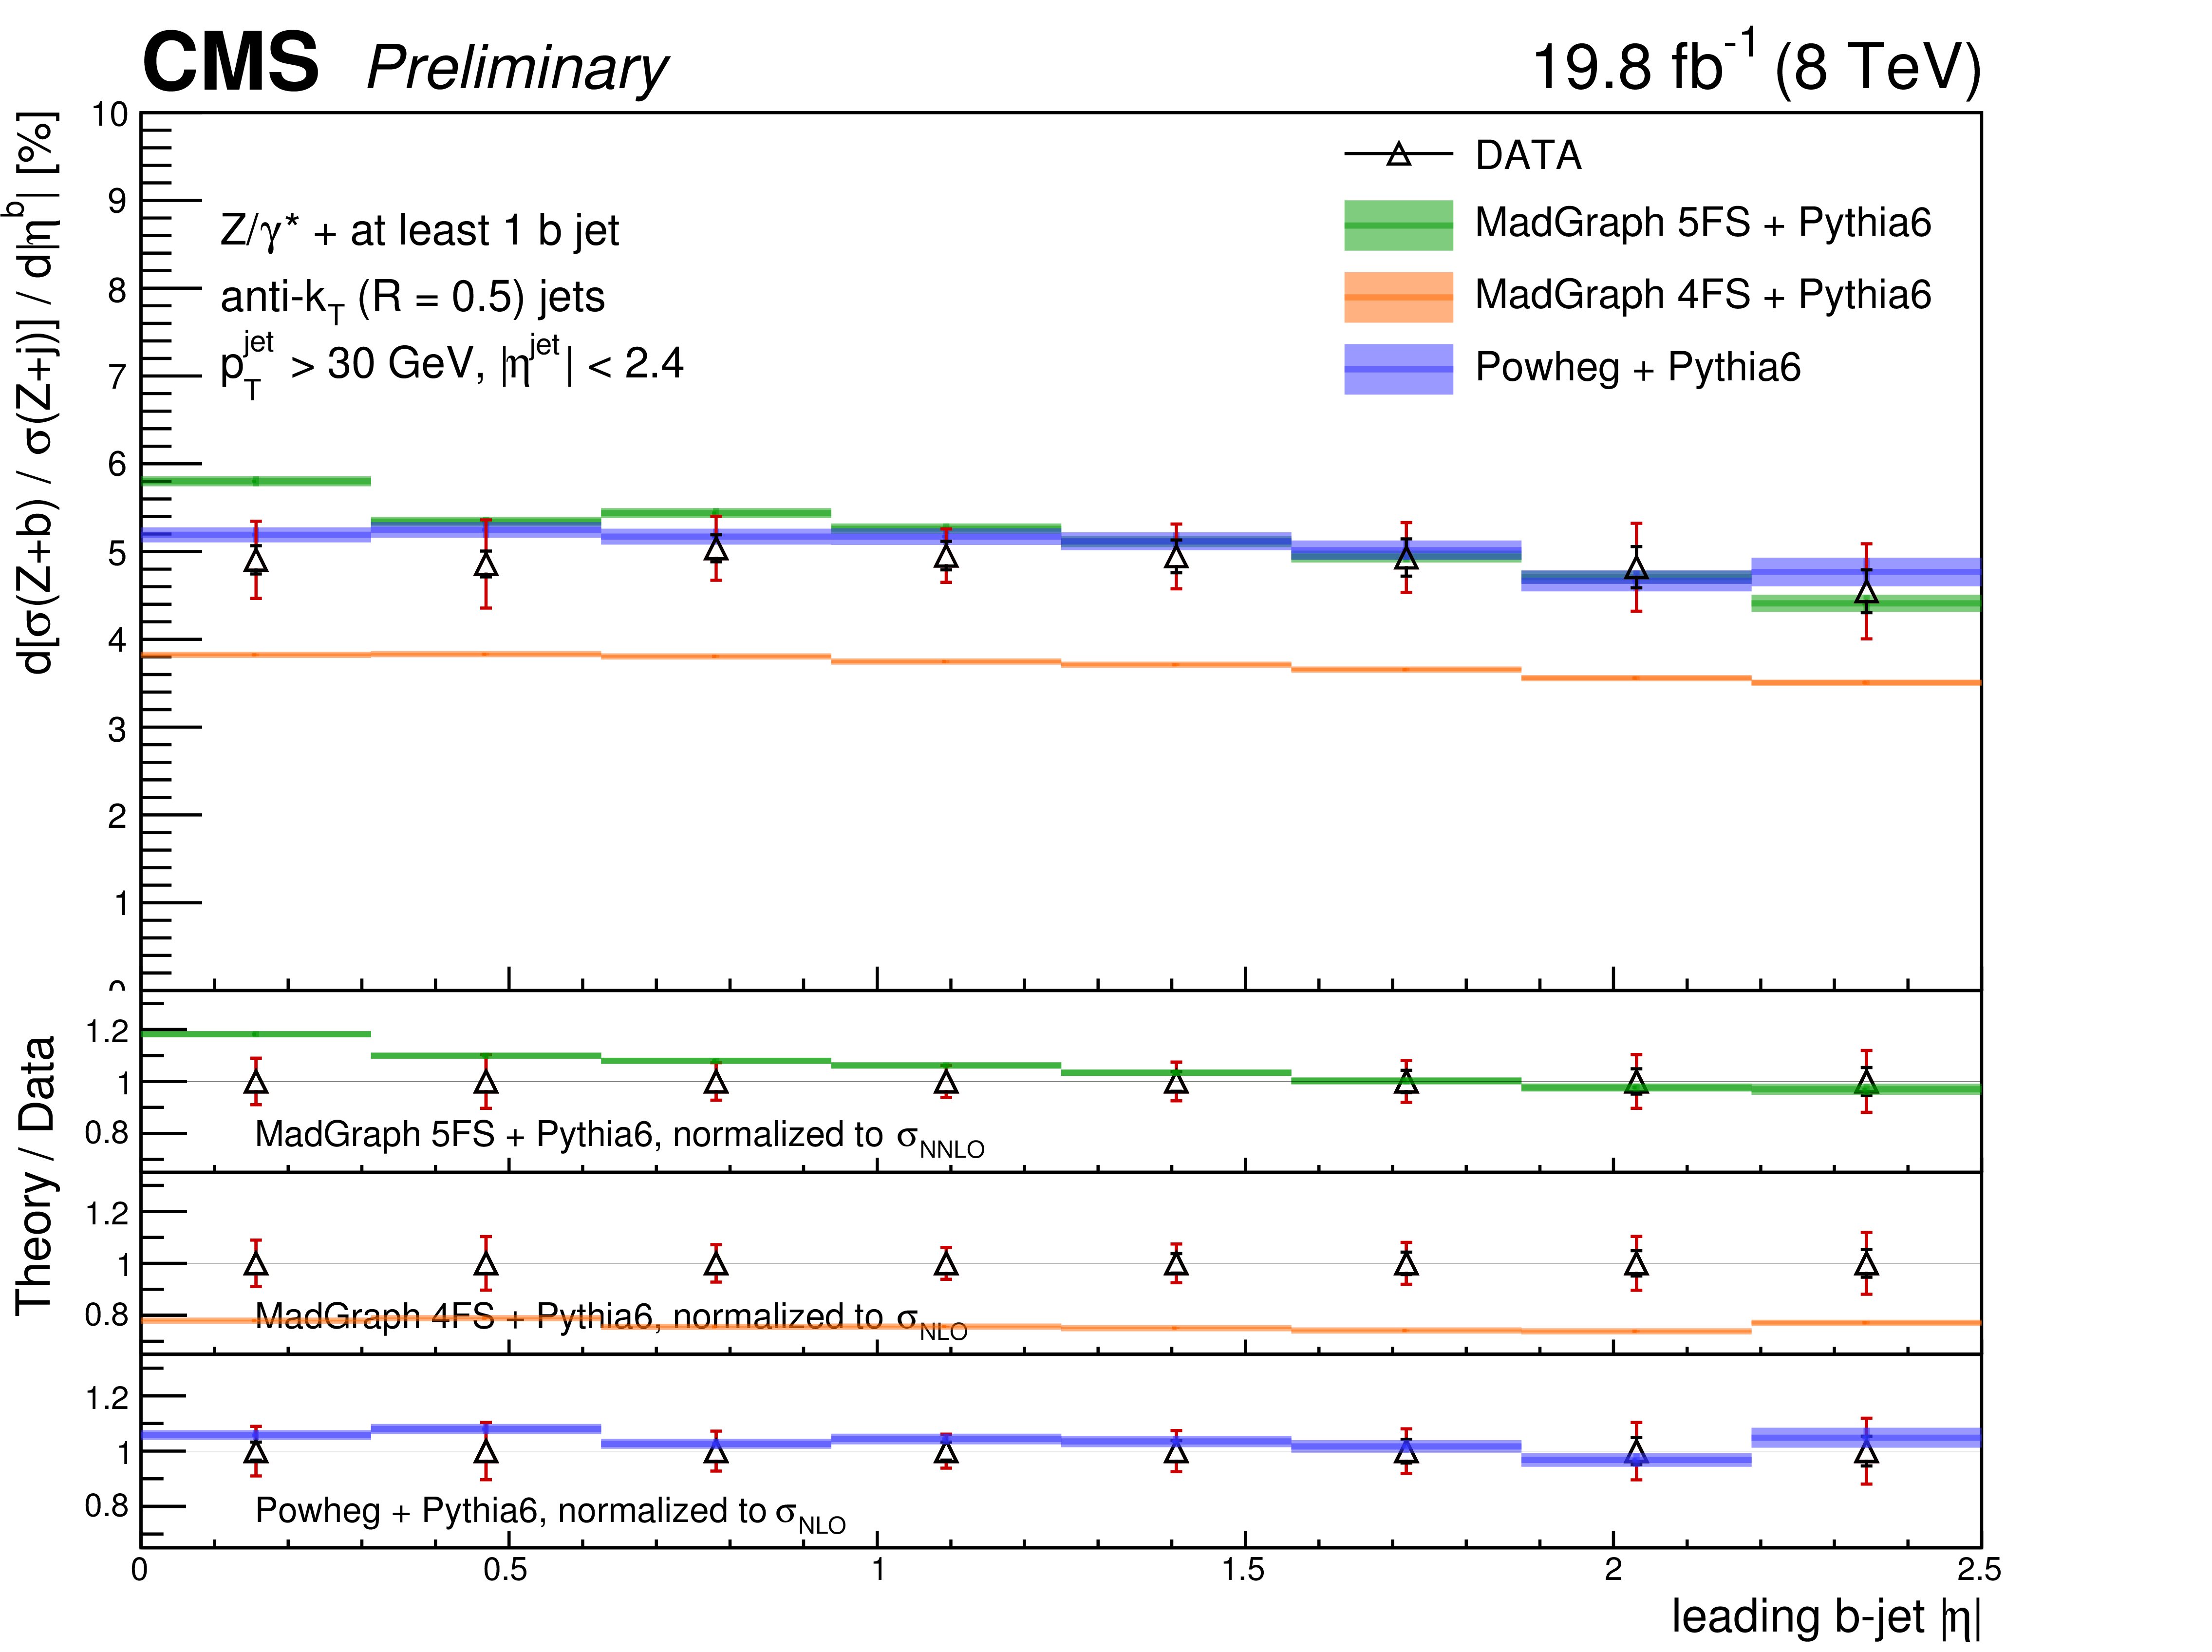
Figure 5-b:
Differential $ { {\mathrm {Z}}(1 {\mathrm {b}})} $ cross section (a) as a function of the leading-$ {p_{\mathrm {T}}} $ $ {\mathrm {b}}$ jet $|\eta |$, and the cross section ratio R for the leading $ {p_{\mathrm {T}}} $ jet $|\eta |$ between $ { {\mathrm {Z}}(1 {\mathrm {b}})} $ and Z+jets (b), compared with the MadGraph 5FS, MadGraph 4FS and POWHEG theoretical predictions (shaded bands), normalized to the theoretical cross sections described in the text. For each data point the statistical and the total (statistical plus systematic) uncertainty are represented by the double error bar. The width of shaded bands represents the statistical error on the theoretical predictions. |

png ; pdf |
Figure 6-a:
Differential $ { {\mathrm {Z}}(1 {\mathrm {b}})} $ cross section as a function of the Z boson $ {p_{\mathrm {T}}} $ (a), and the cross section ratio R between $ { {\mathrm {Z}}(1 {\mathrm {b}})} $ and Z+jets (b), compared with the MadGraph 5FS, MadGraph 4FS and POWHEG theoretical predictions (shaded bands), normalized to the theoretical cross sections described in the text. For each data point the statistical and the total (statistical plus systematic) uncertainty are represented by the double error bar. The width of shaded bands represents the statistical error on the theoretical predictions. |
png ; pdf |
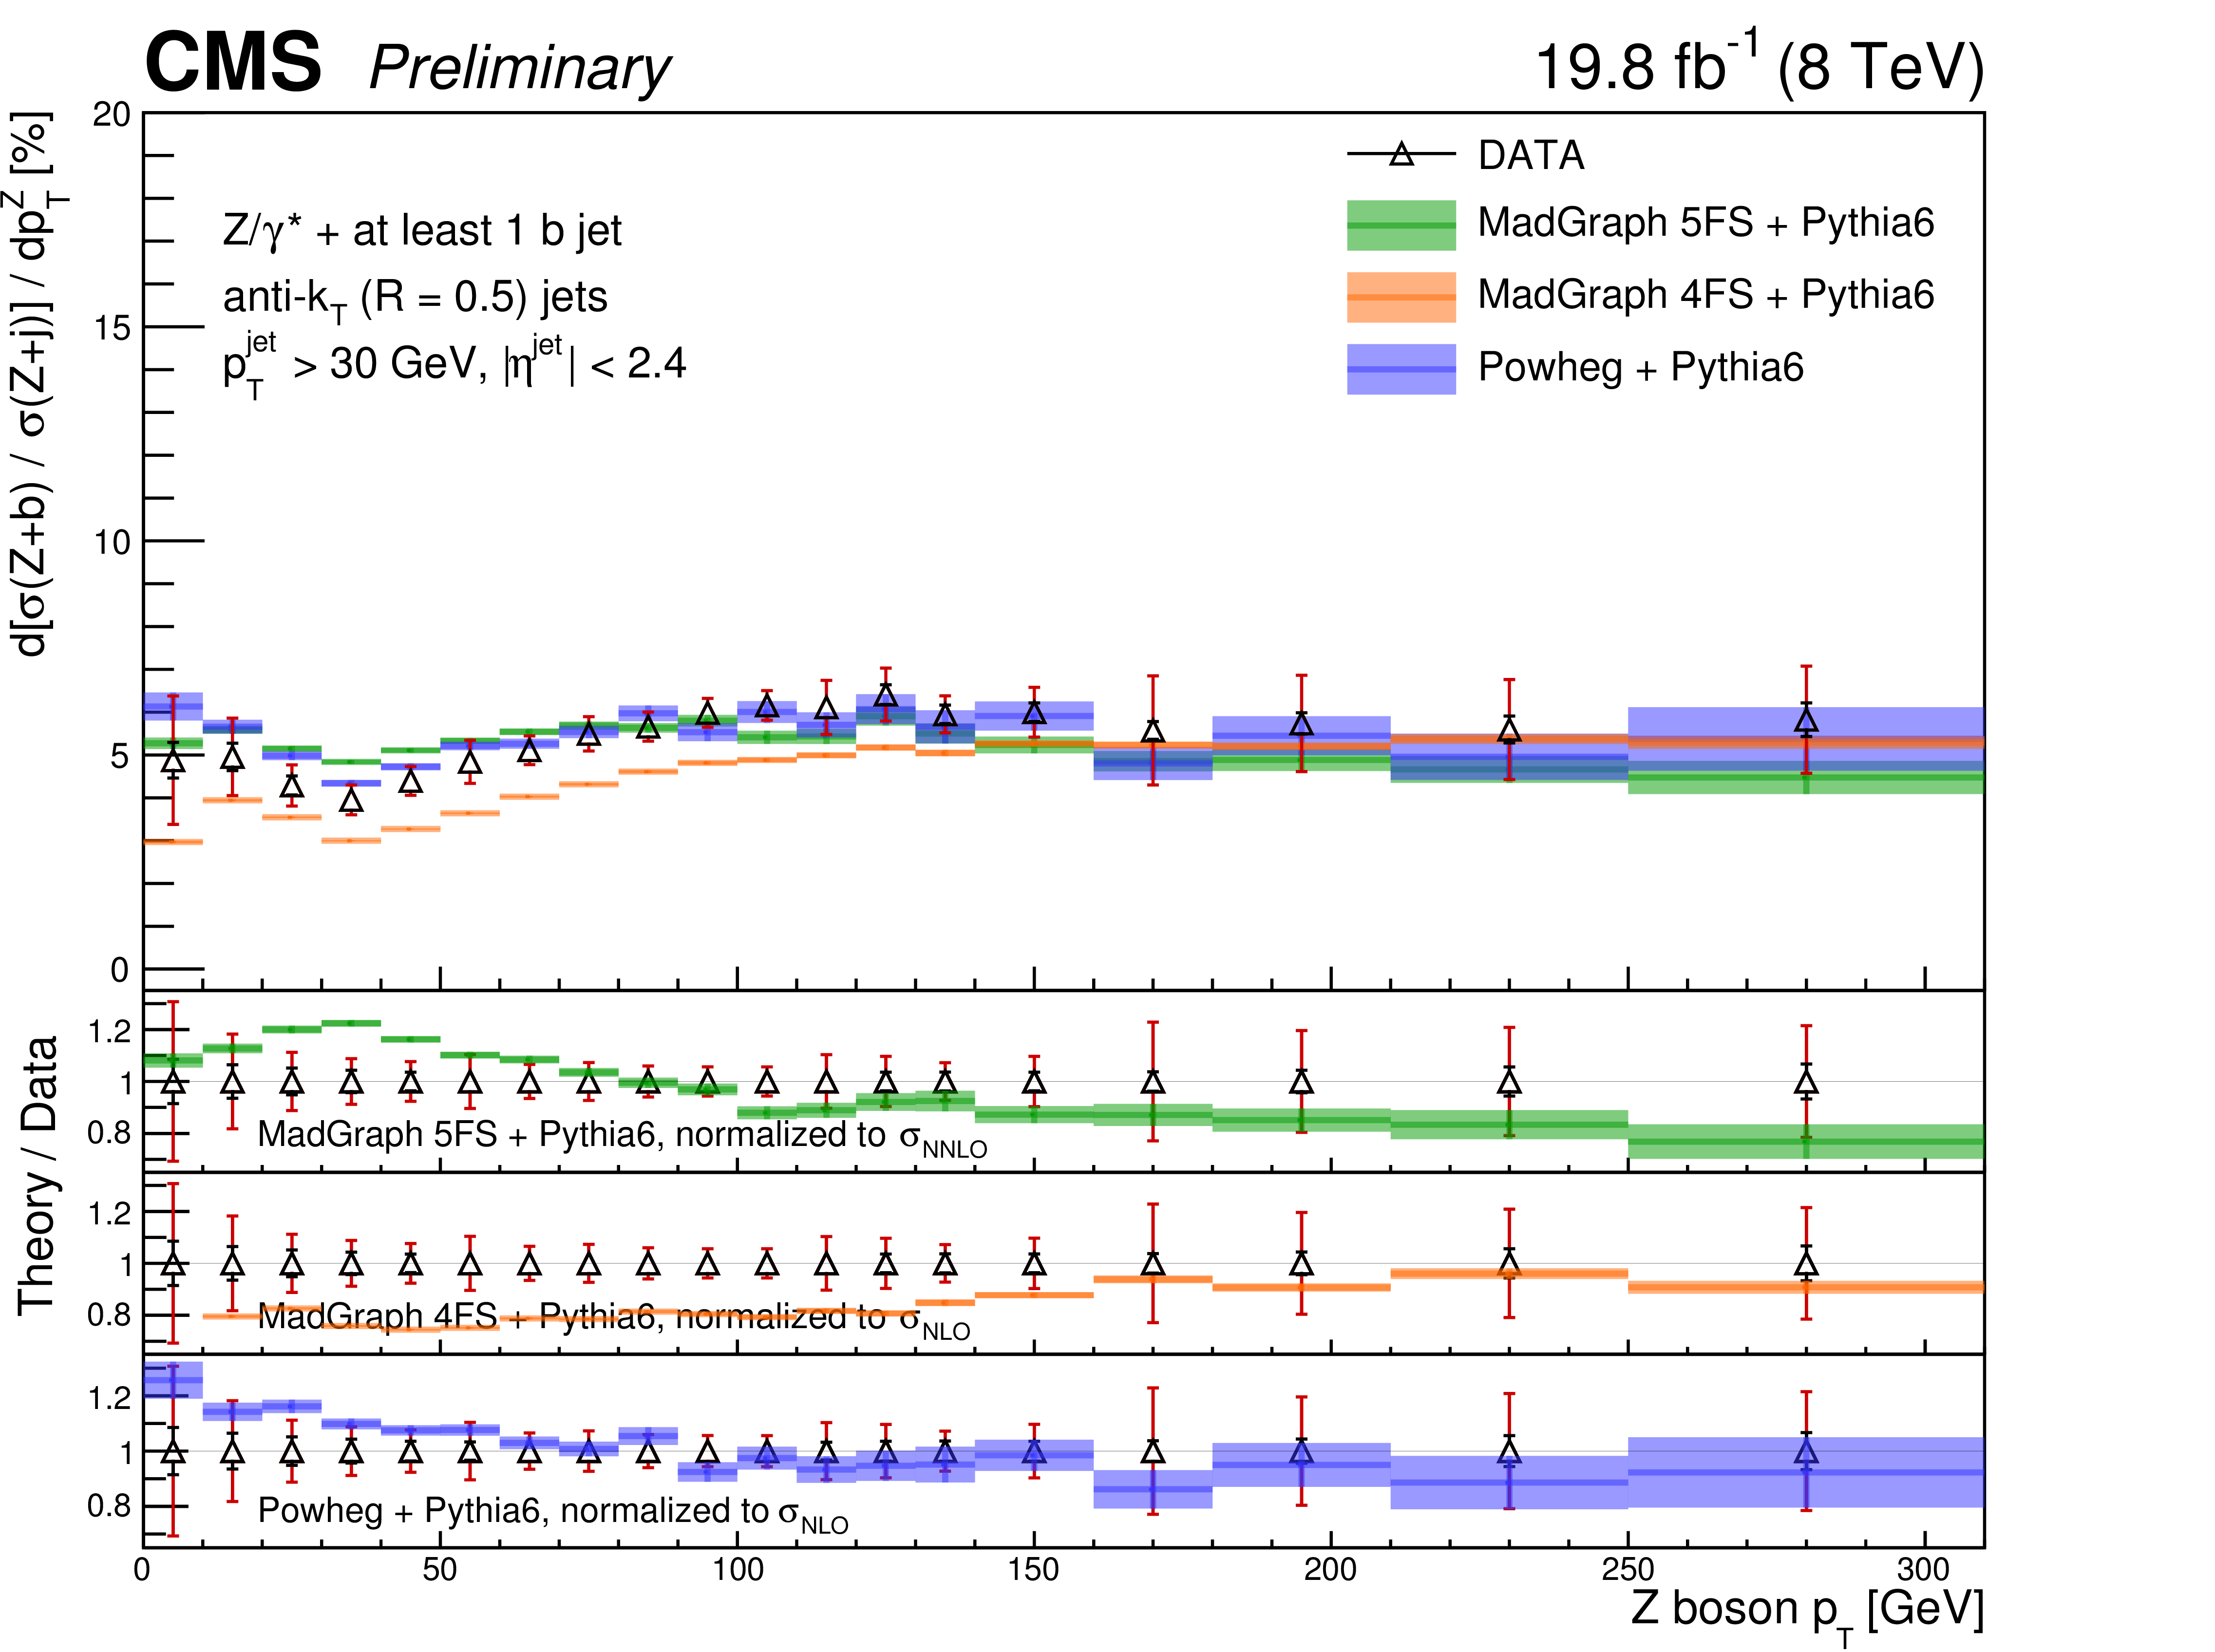
Figure 6-b:
Differential $ { {\mathrm {Z}}(1 {\mathrm {b}})} $ cross section as a function of the Z boson $ {p_{\mathrm {T}}} $ (a), and the cross section ratio R between $ { {\mathrm {Z}}(1 {\mathrm {b}})} $ and Z+jets (b), compared with the MadGraph 5FS, MadGraph 4FS and POWHEG theoretical predictions (shaded bands), normalized to the theoretical cross sections described in the text. For each data point the statistical and the total (statistical plus systematic) uncertainty are represented by the double error bar. The width of shaded bands represents the statistical error on the theoretical predictions. |
png ; pdf |
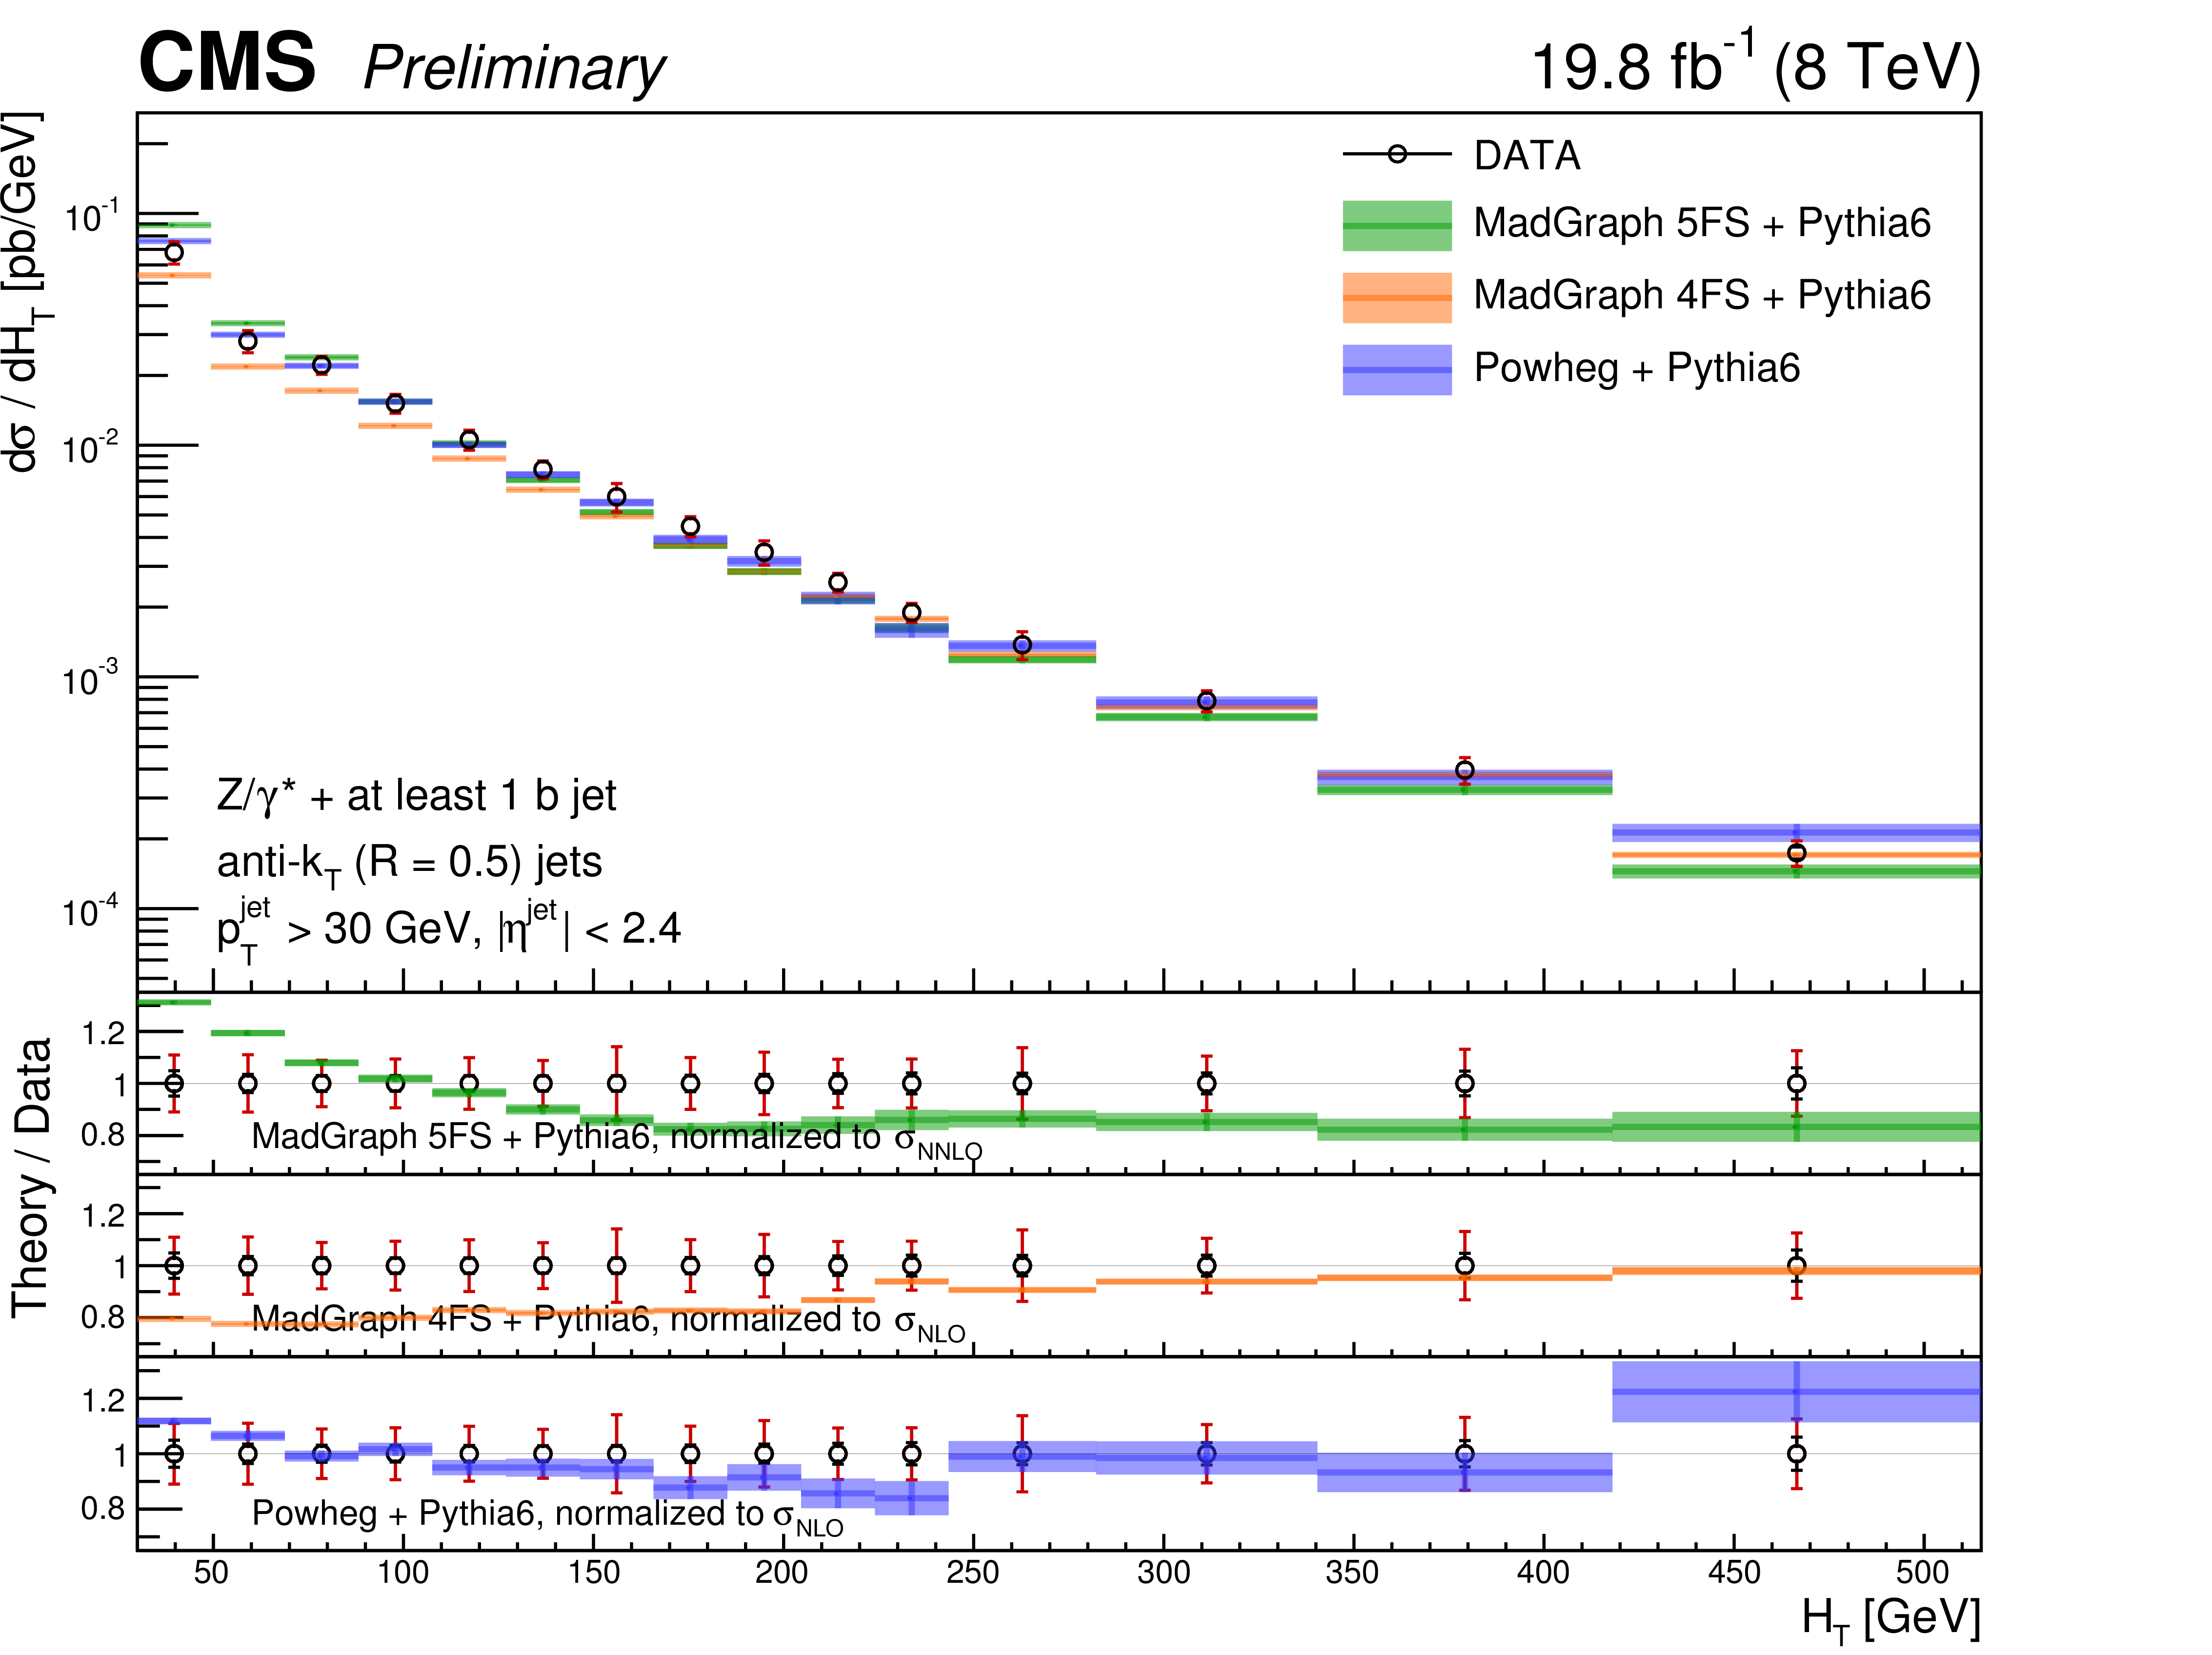
Figure 7-a:
Differential $ { {\mathrm {Z}}(1 {\mathrm {b}})} $ cross section as a function of $ {H_{\mathrm {T}}} $ (a), and the cross section ratio R between $ { {\mathrm {Z}}(1 {\mathrm {b}})} $ and Z+jets (b), compared with the MadGraph 5FS, MadGraph 4FS and POWHEG theoretical predictions (shaded bands), normalized to the theoretical cross sections described in the text. For each data point the statistical and the total (statistical plus systematic) uncertainty are represented by the double error bar. The width of shaded bands represents the statistical error on the theoretical predictions. |
png ; pdf |
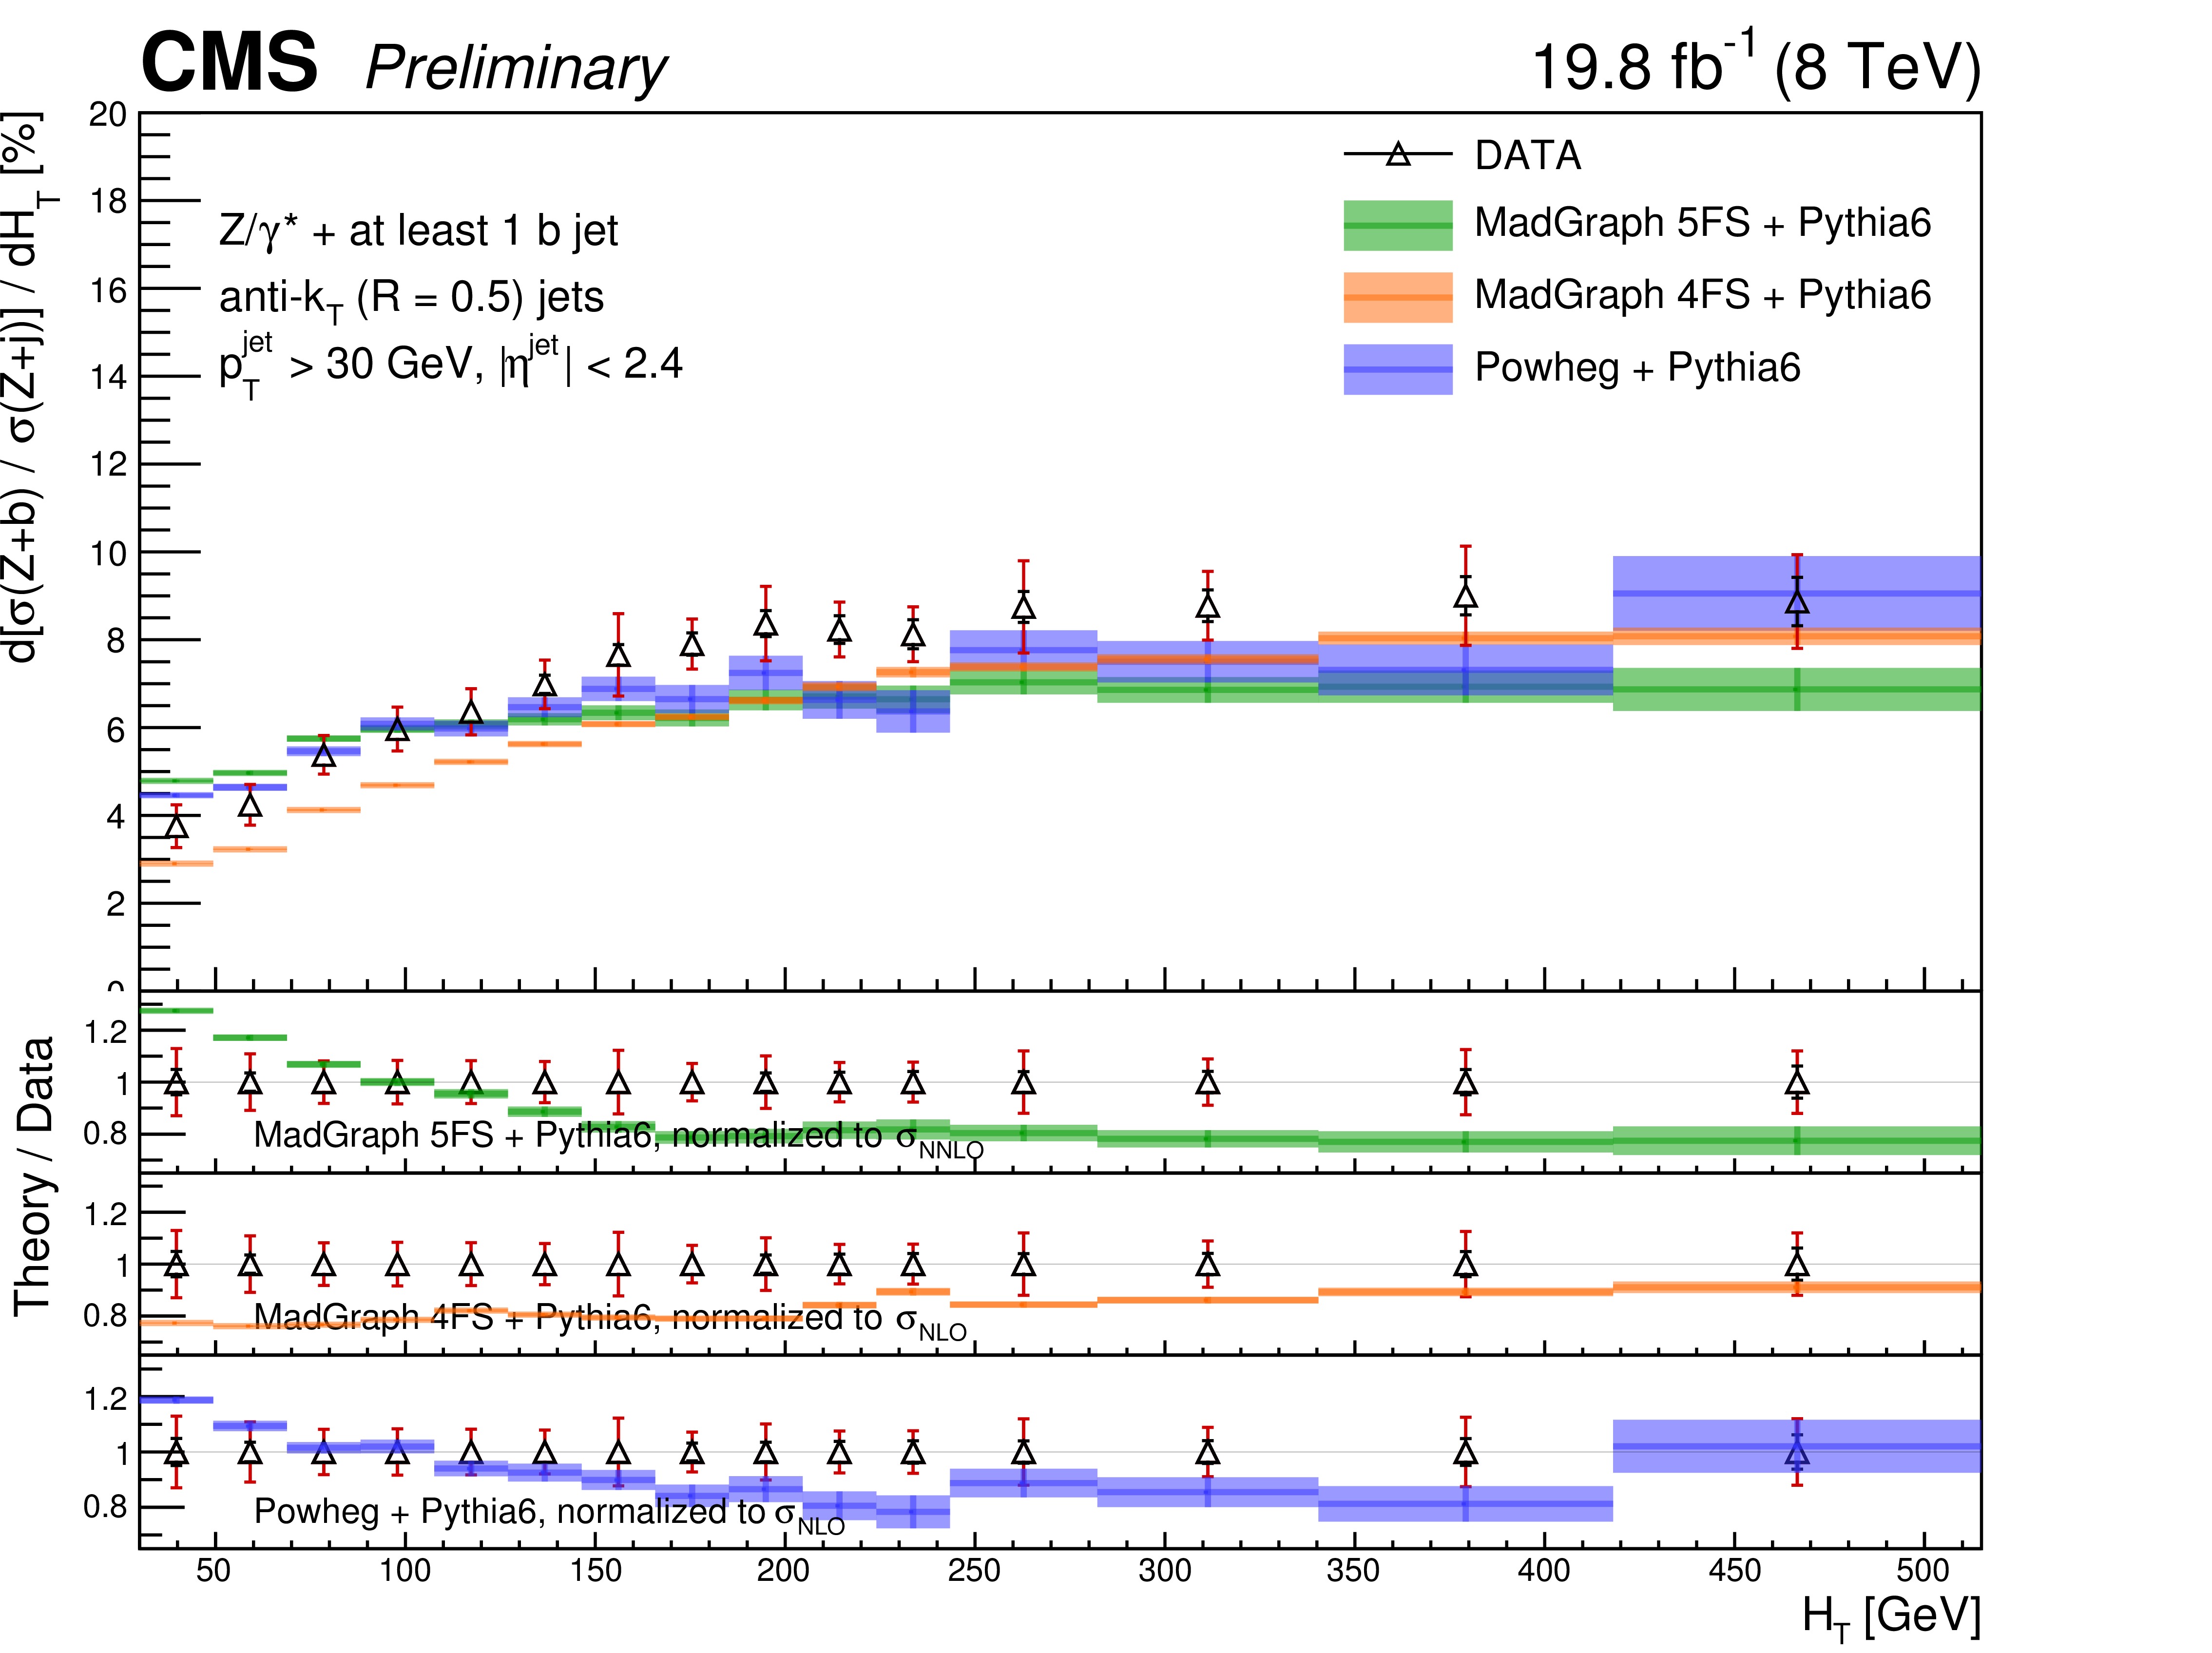
Figure 7-b:
Differential $ { {\mathrm {Z}}(1 {\mathrm {b}})} $ cross section as a function of $ {H_{\mathrm {T}}} $ (a), and the cross section ratio R between $ { {\mathrm {Z}}(1 {\mathrm {b}})} $ and Z+jets (b), compared with the MadGraph 5FS, MadGraph 4FS and POWHEG theoretical predictions (shaded bands), normalized to the theoretical cross sections described in the text. For each data point the statistical and the total (statistical plus systematic) uncertainty are represented by the double error bar. The width of shaded bands represents the statistical error on the theoretical predictions. |
png ; pdf |
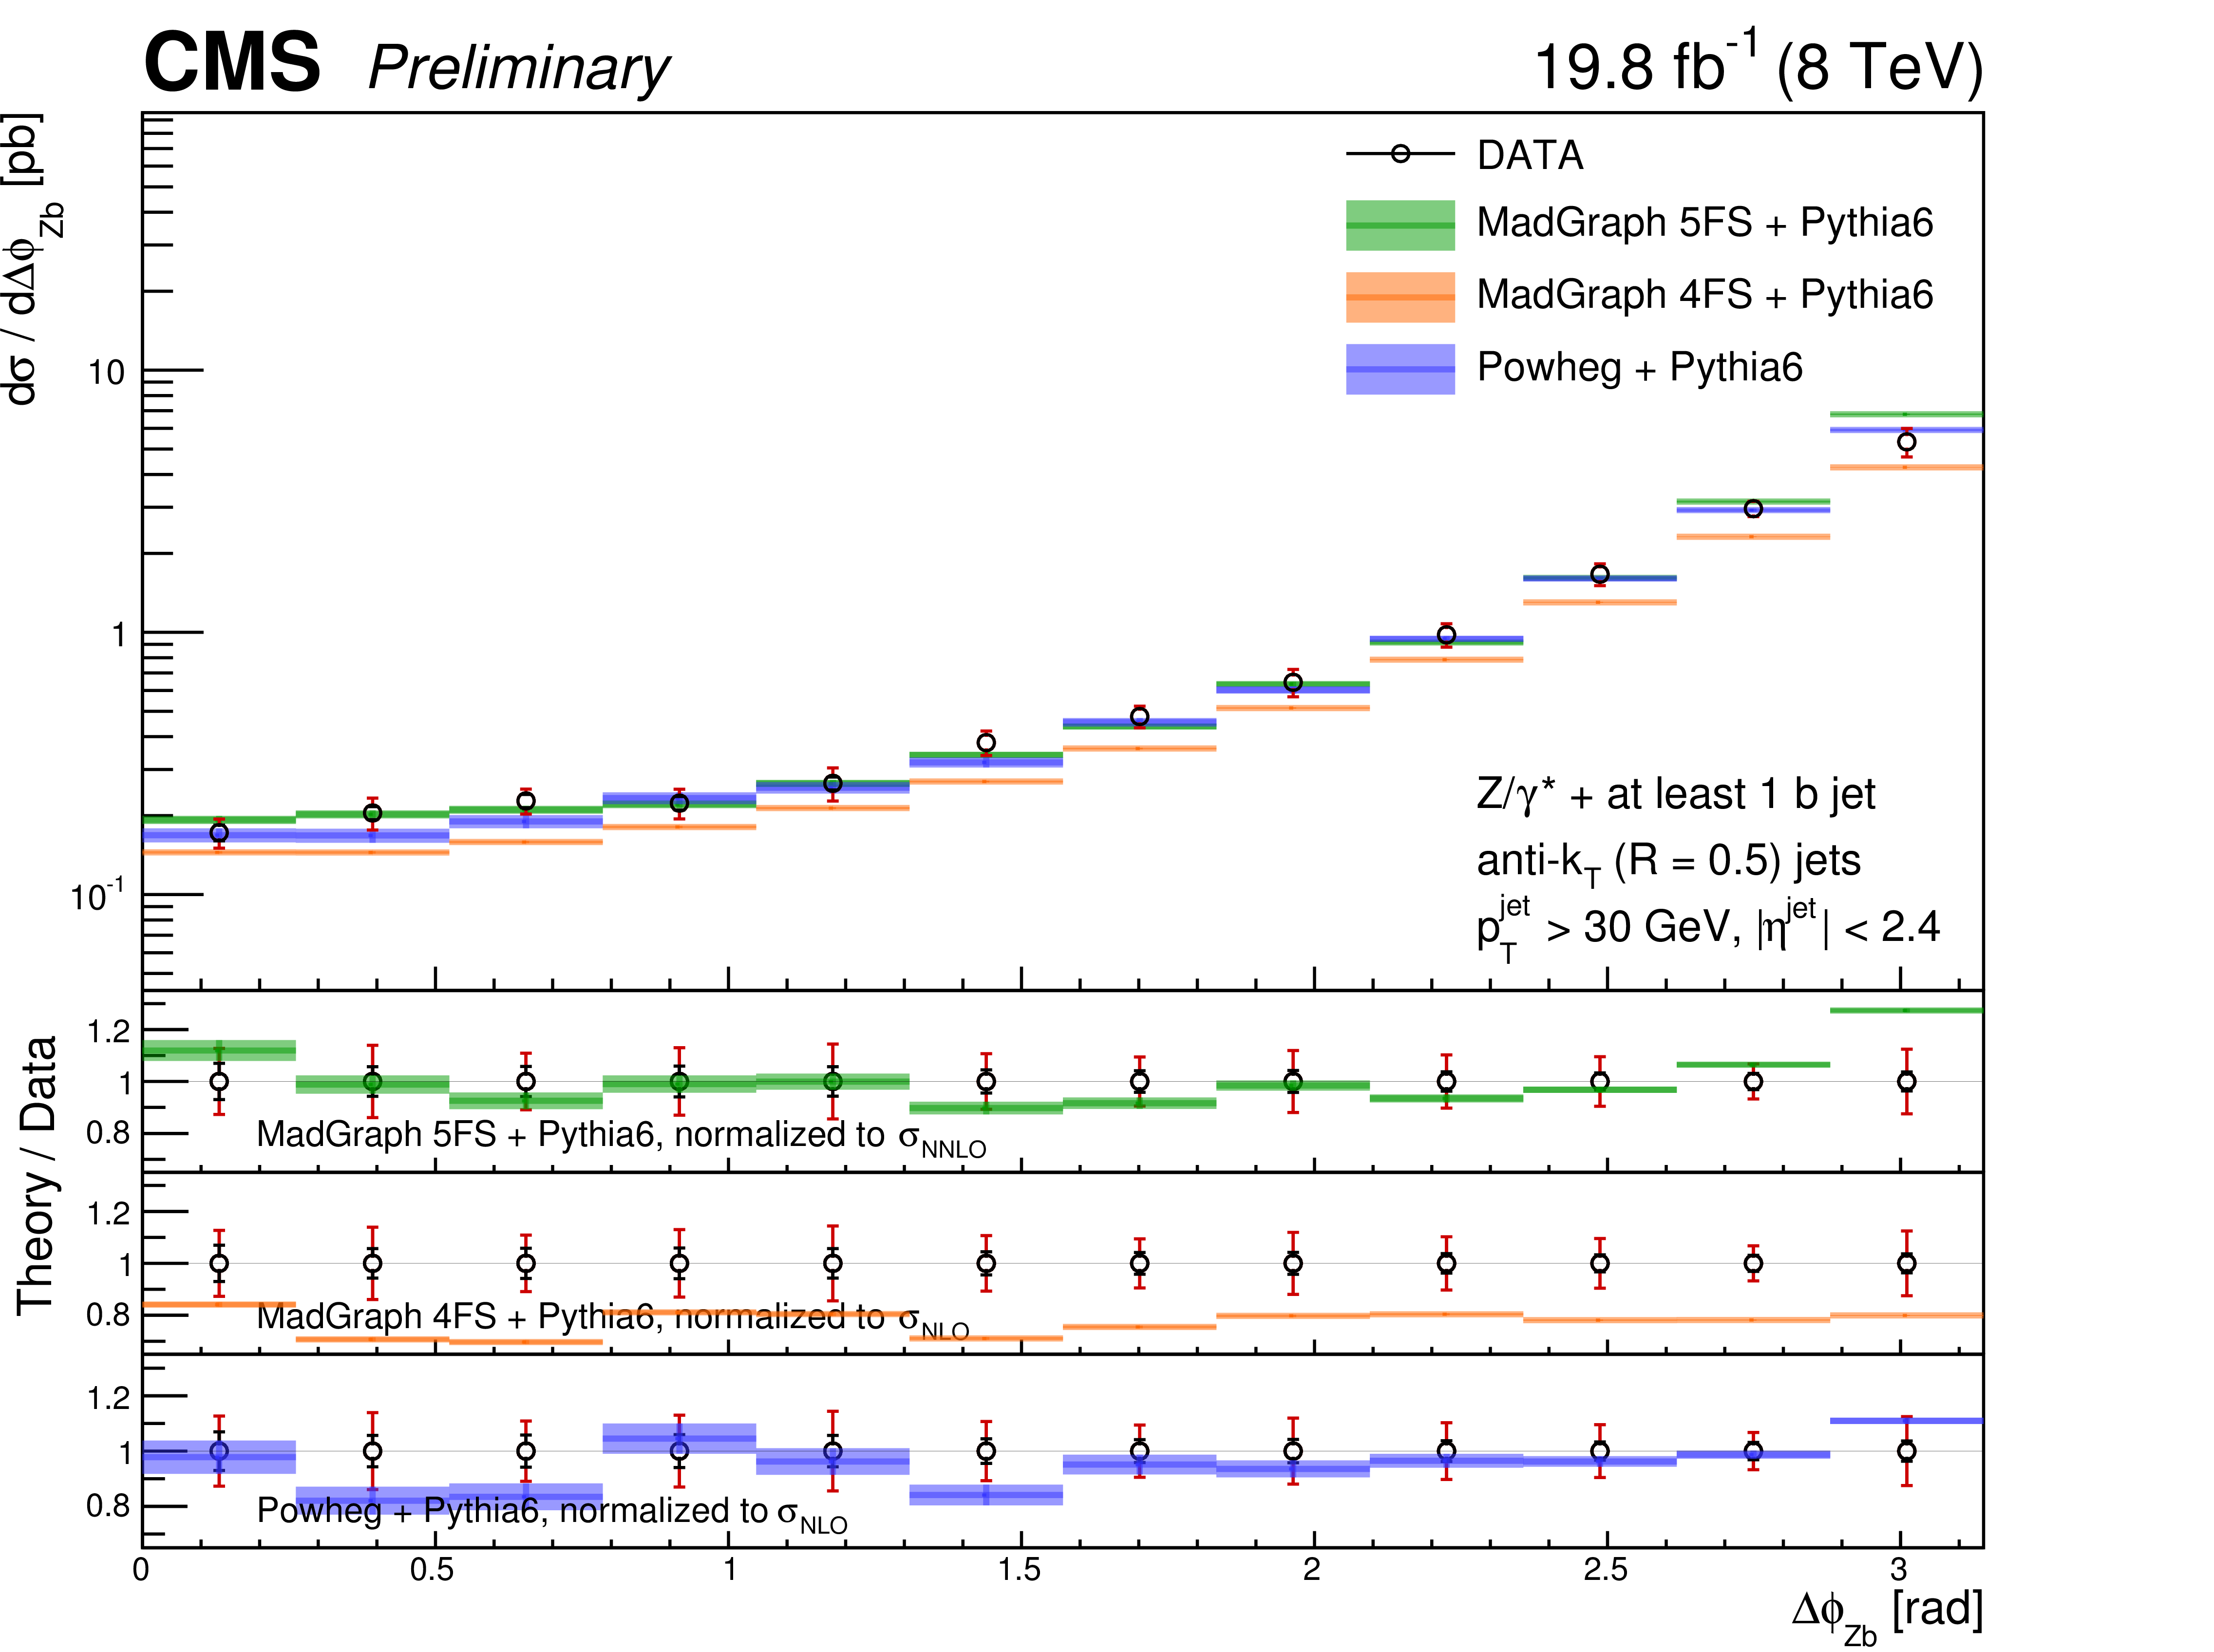
Figure 8-a:
Differential $ { {\mathrm {Z}}(1 {\mathrm {b}})} $ cross section as a function of $\Delta \phi _{\mathrm {Zj}})$ (a), and the cross section ratio R between $ { {\mathrm {Z}}(1 {\mathrm {b}})} $ and Z+jets (b), compared with the MadGraph 5FS, MadGraph 4FS and POWHEG theoretical predictions (shaded bands), normalized to the theoretical cross sections described in the text. For each data point the statistical and the total (statistical plus systematic) uncertainty are represented by the double error bar. The width of shaded bands represents the statistical error on the theoretical predictions. |
png ; pdf |
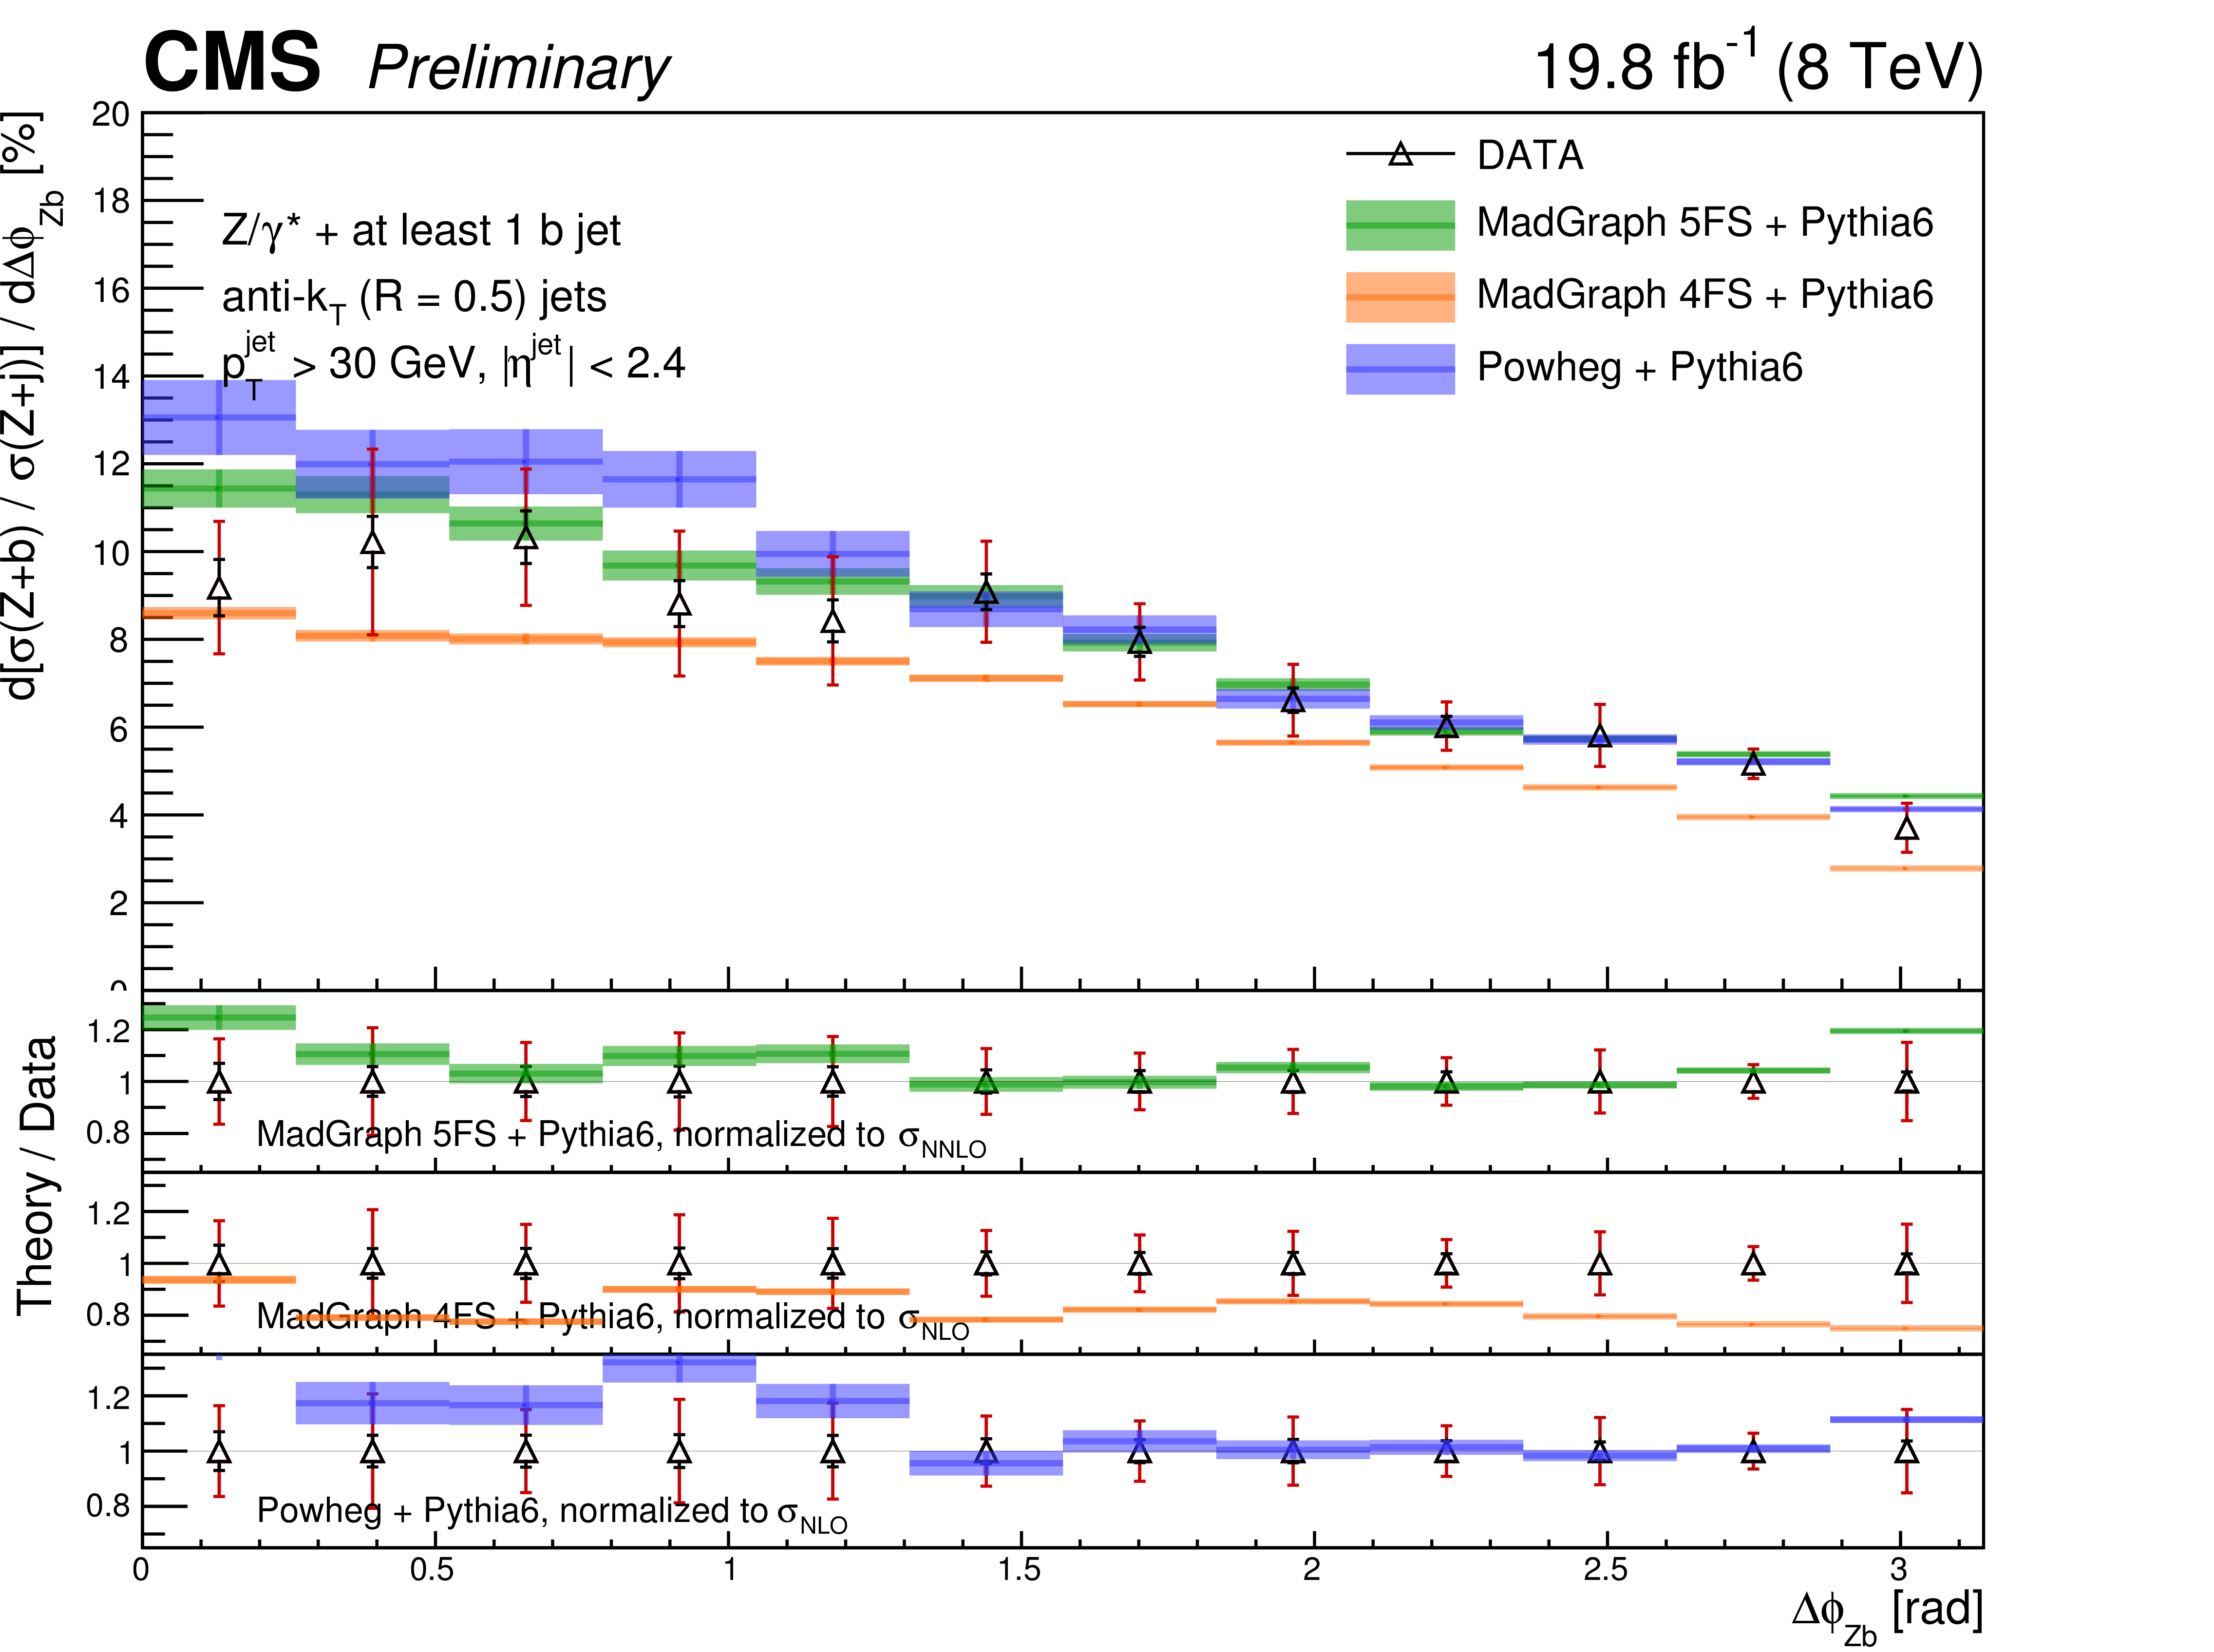
Figure 8-b:
Differential $ { {\mathrm {Z}}(1 {\mathrm {b}})} $ cross section as a function of $\Delta \phi _{\mathrm {Zj}})$ (a), and the cross section ratio R between $ { {\mathrm {Z}}(1 {\mathrm {b}})} $ and Z+jets (b), compared with the MadGraph 5FS, MadGraph 4FS and POWHEG theoretical predictions (shaded bands), normalized to the theoretical cross sections described in the text. For each data point the statistical and the total (statistical plus systematic) uncertainty are represented by the double error bar. The width of shaded bands represents the statistical error on the theoretical predictions. |
png ; pdf |
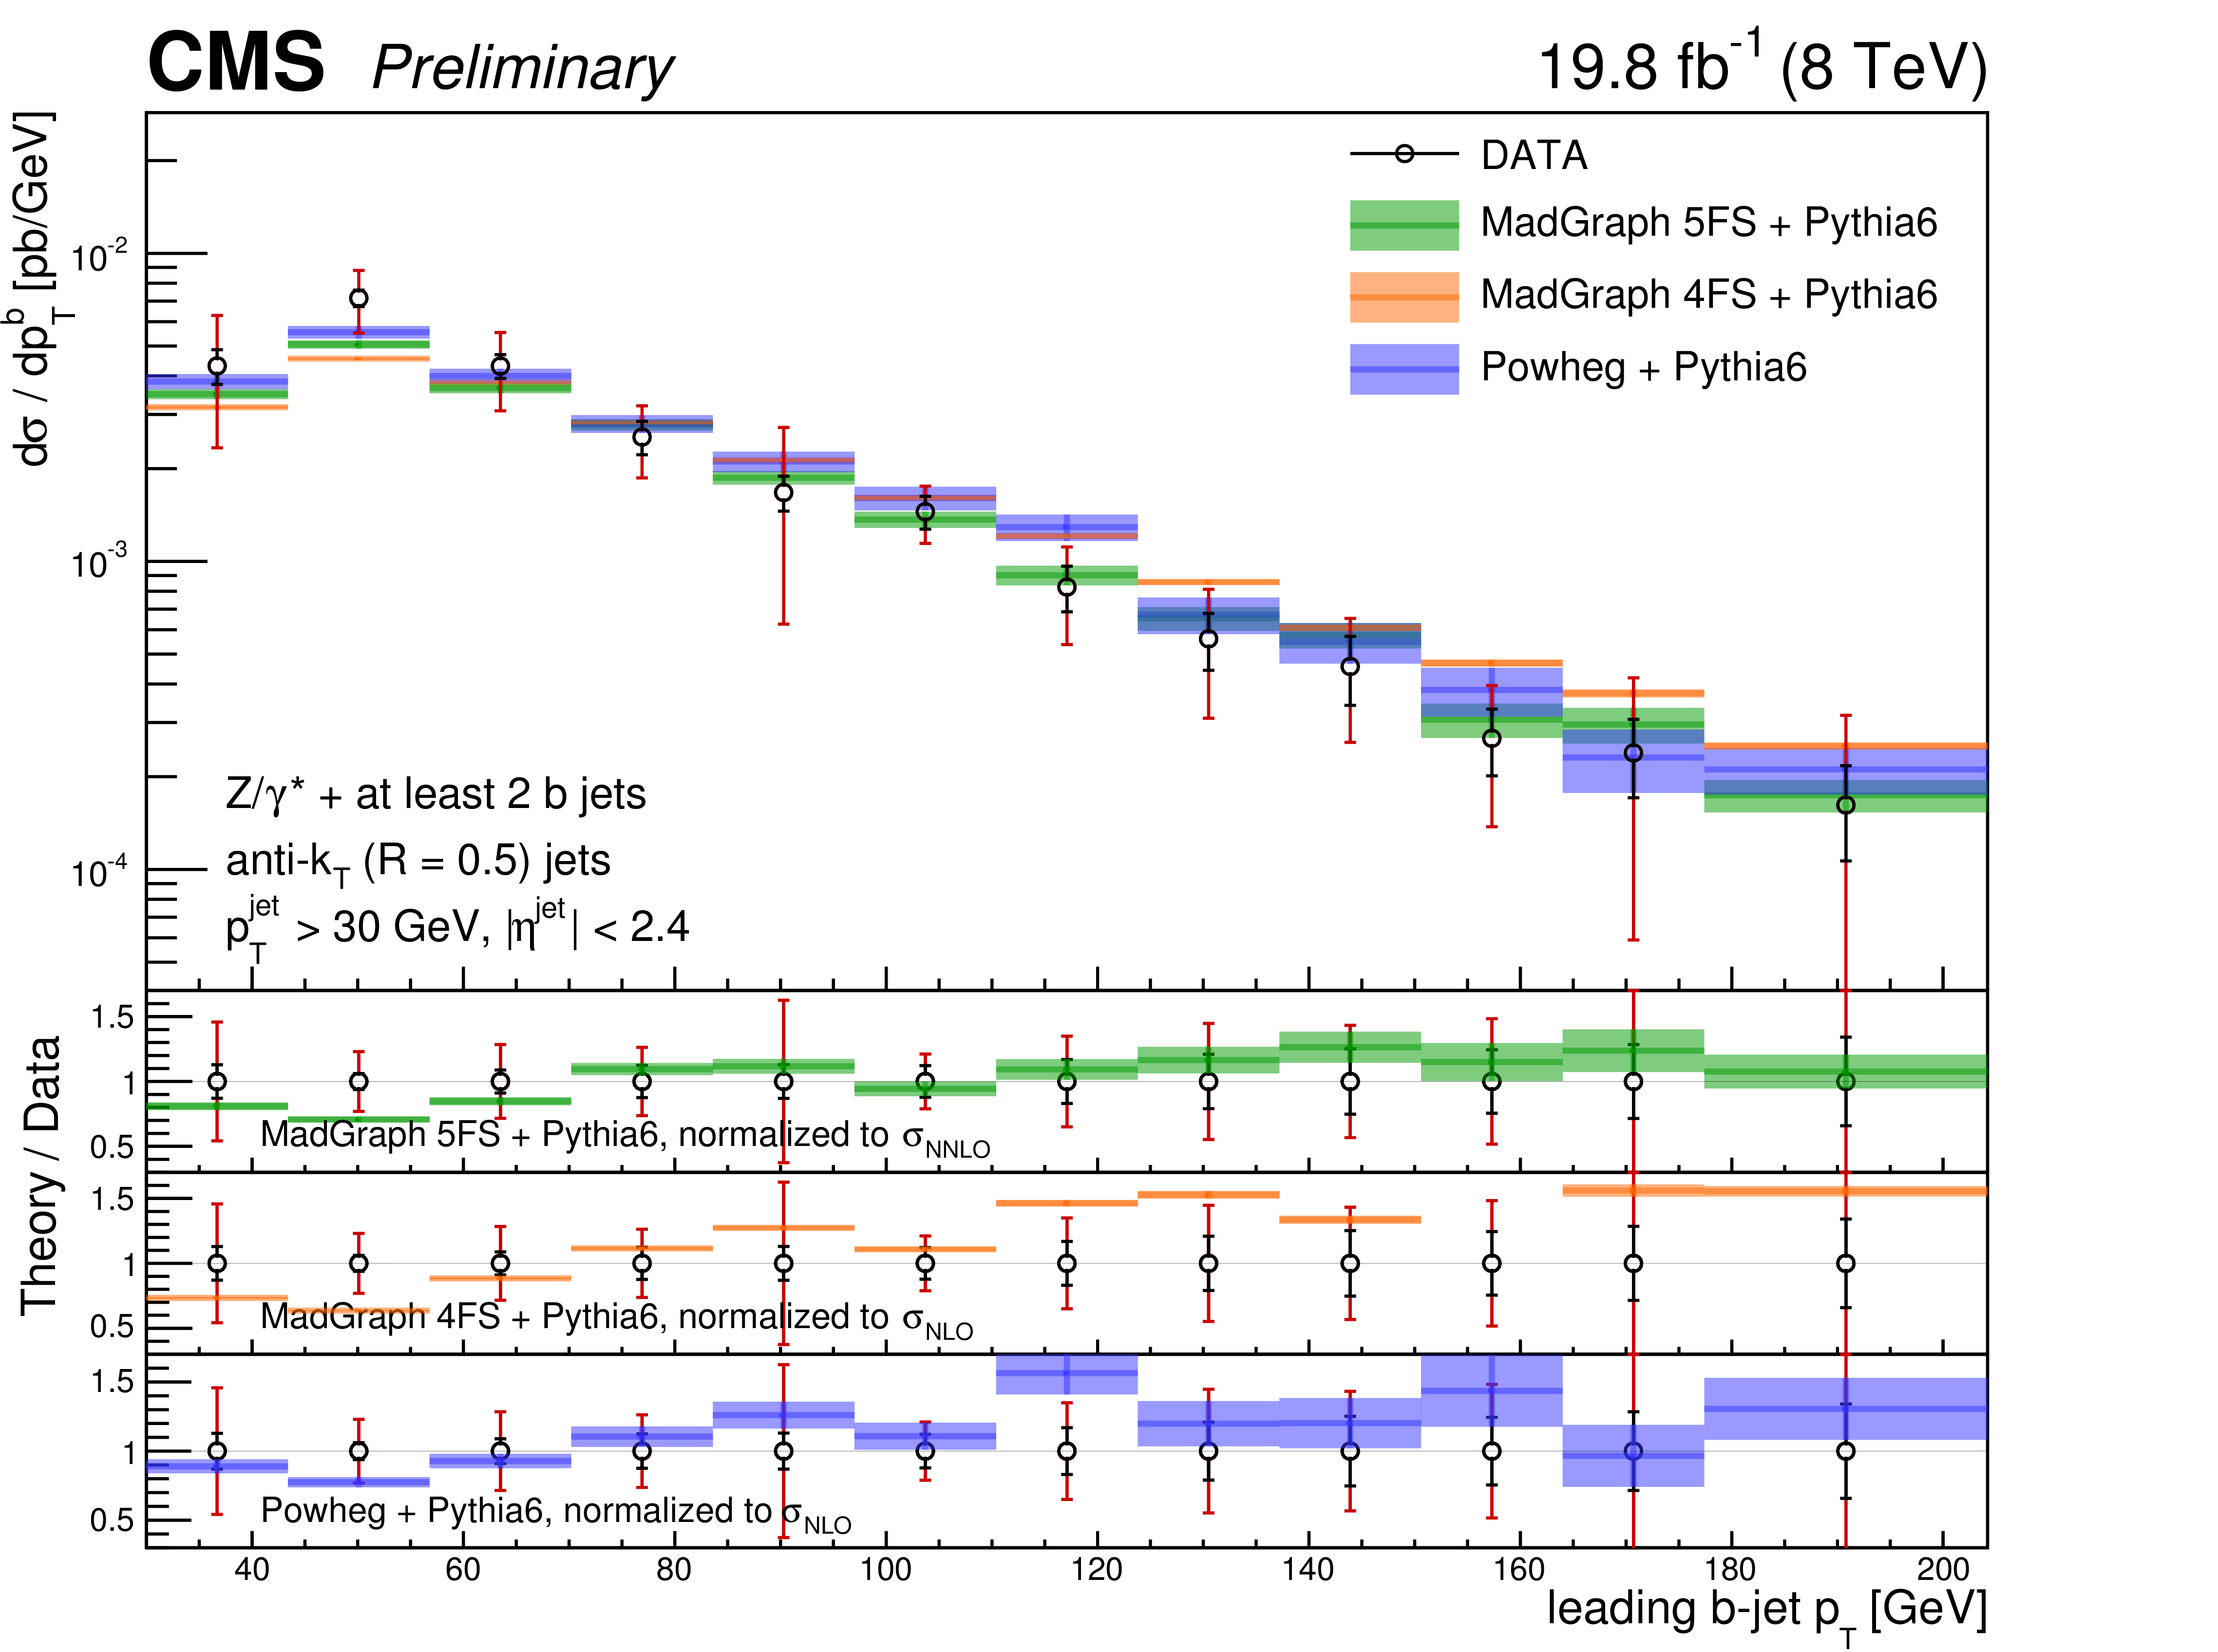
Figure 9:
Differential $ { {\mathrm {Z}}(2 {\mathrm {b}})} $ cross section as a function of the leading-$ {p_{\mathrm {T}}} $ $ {\mathrm {b}}$ jet $ {p_{\mathrm {T}}} $, compared with the MadGraph 5FS, MadGraph 4FS and POWHEG theoretical predictions (shaded bands), normalized to the theoretical cross sections described in the text. For each data point the statistical and the total (statistical plus systematic) uncertainty are represented by the double error bar. The width of shaded bands represents the statistical error on the theoretical predictions. |

png ; pdf |
Figure 10:
Differential $ { {\mathrm {Z}}(2 {\mathrm {b}})} $ cross section as a function of the subleading-$ {p_{\mathrm {T}}} $ $ {\mathrm {b}}$ jet $ {p_{\mathrm {T}}} $, compared with the MadGraph 5FS, MadGraph 4FS and POWHEG theoretical predictions (shaded bands), normalized to the theoretical cross sections described in the text. For each data point the statistical and the total (statistical plus systematic) uncertainty are represented by the double error bar. The width of shaded bands represents the statistical error on the theoretical predictions. |
png ; pdf |
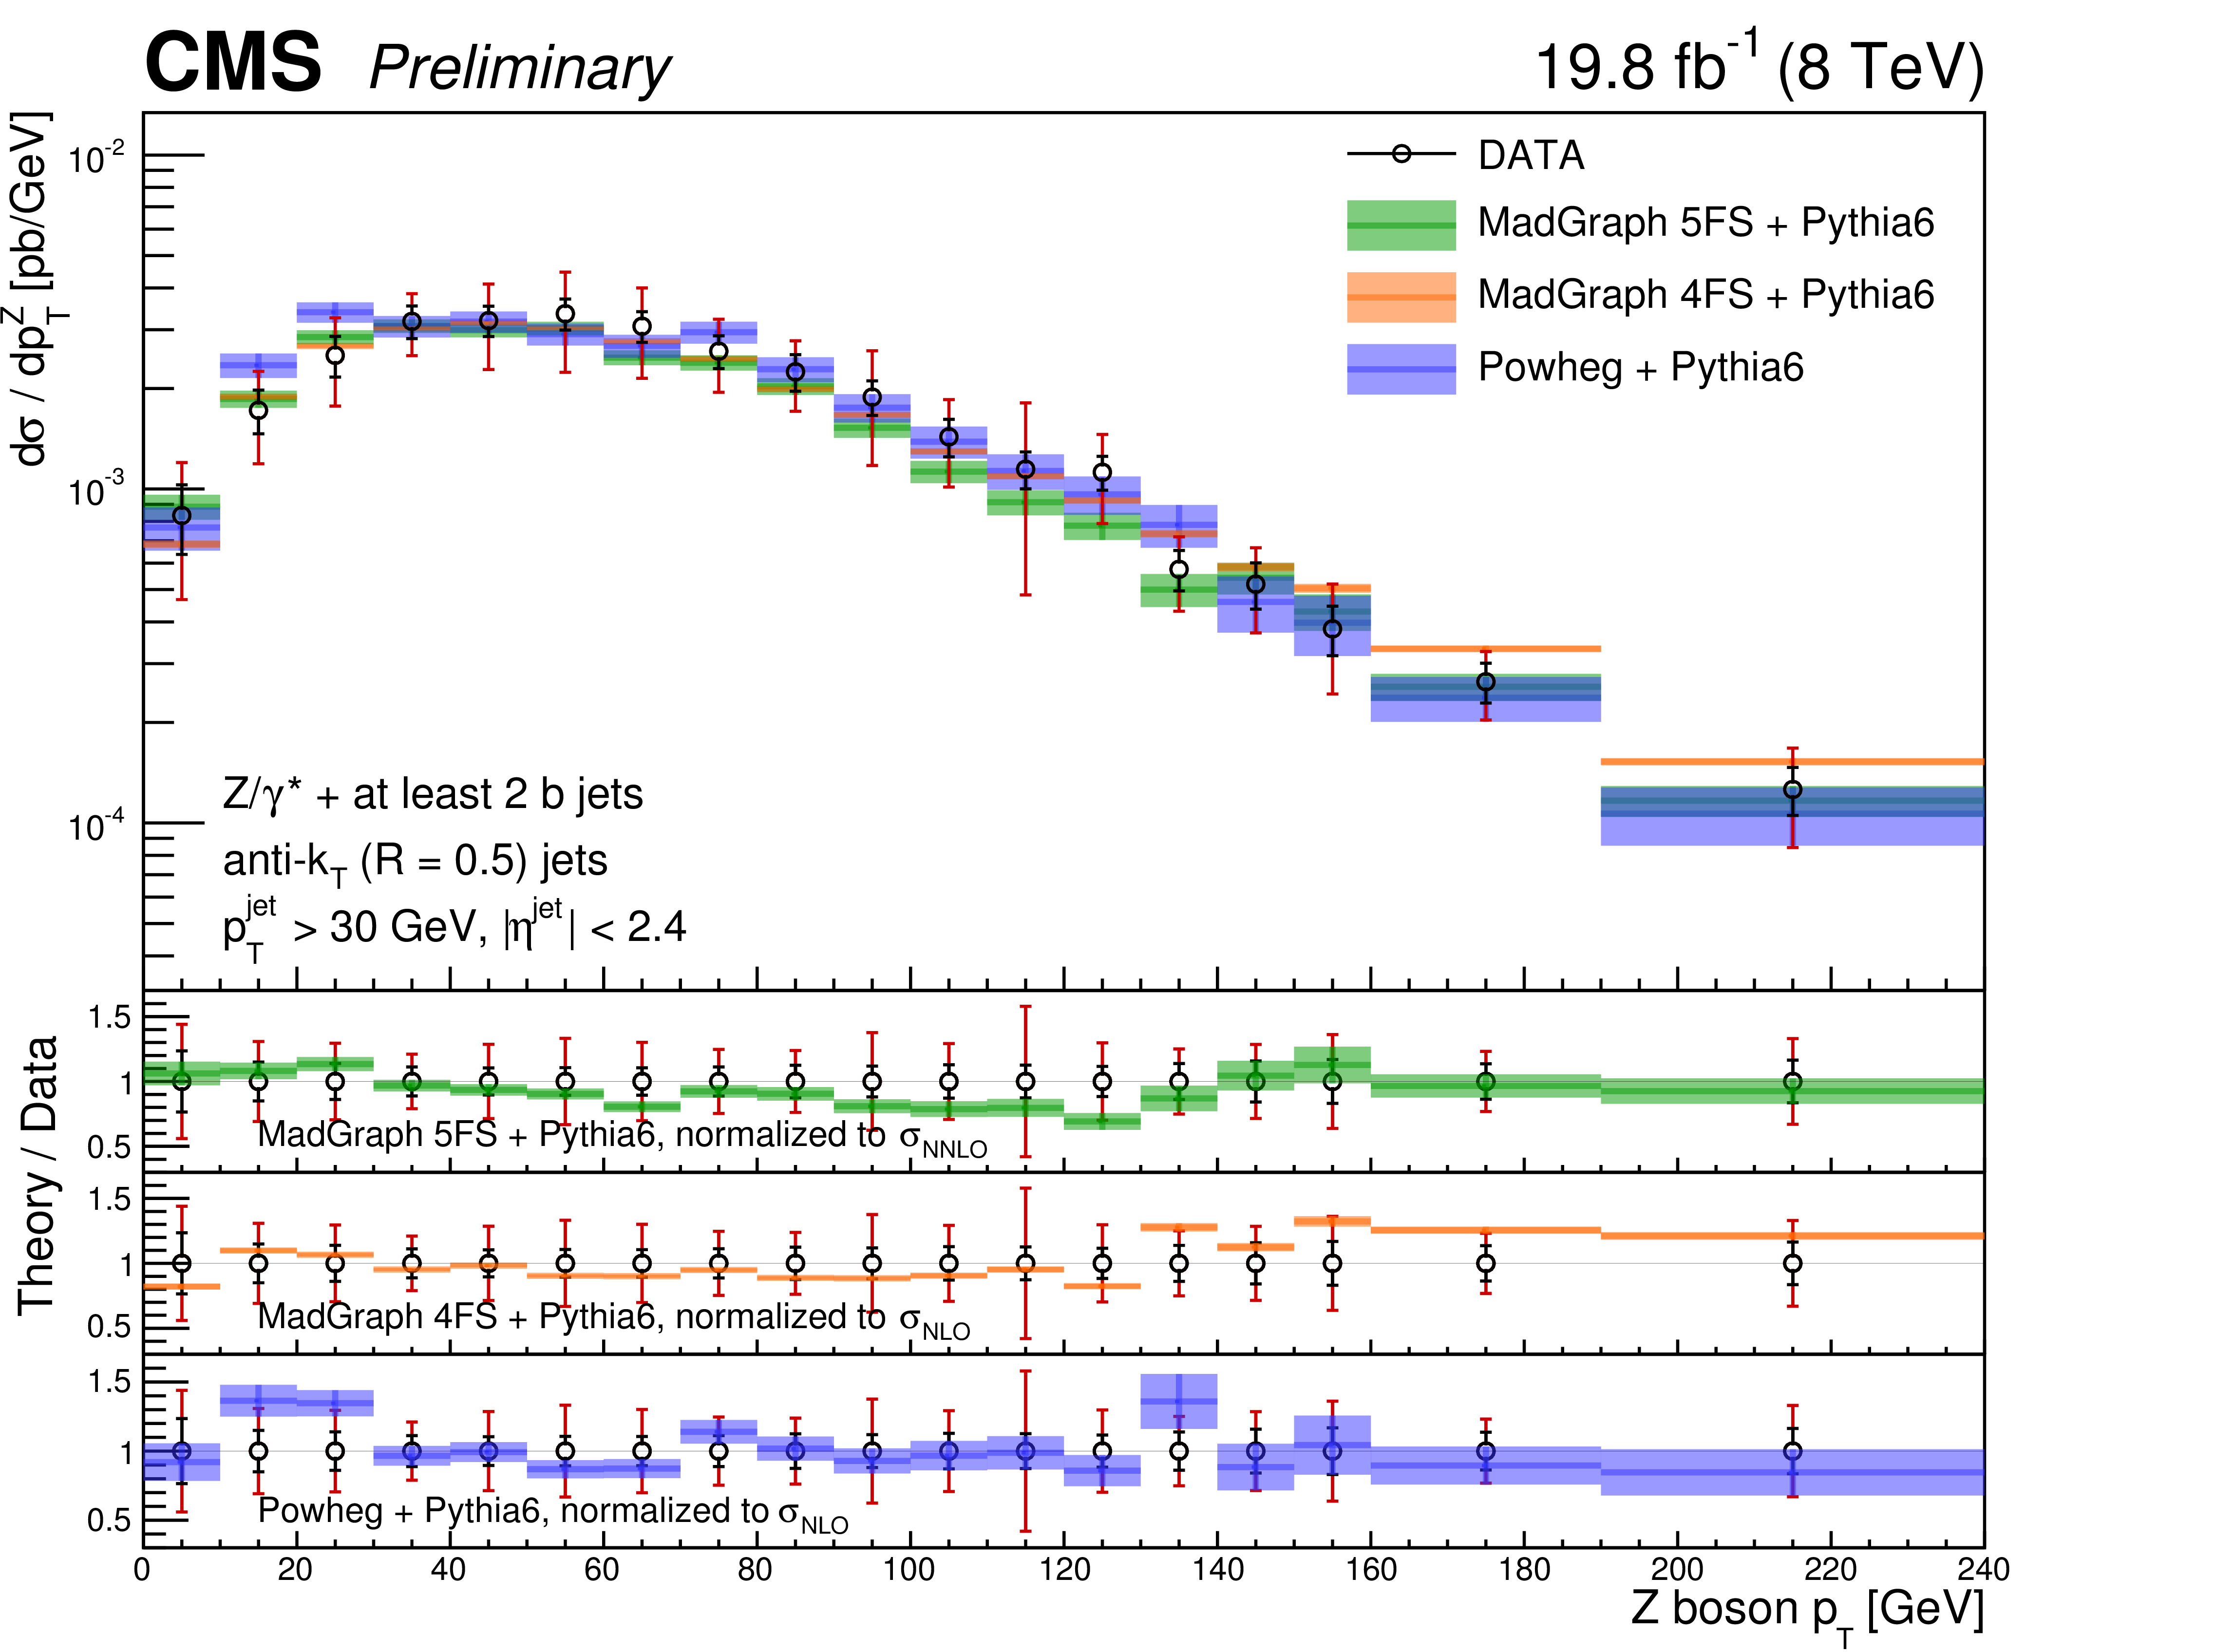
Figure 11:
Differential $ { {\mathrm {Z}}(2 {\mathrm {b}})} $ cross section as a function of the Z boson $ {p_{\mathrm {T}}} $, compared with the MadGraph 5FS, MadGraph 4FS and POWHEG theoretical predictions (shaded bands), normalized to the theoretical cross sections described in the text. For each data point the statistical and the total (statistical plus systematic) uncertainty are represented by the double error bar. The width of shaded bands represents the statistical error on the theoretical predictions. |
png ; pdf |
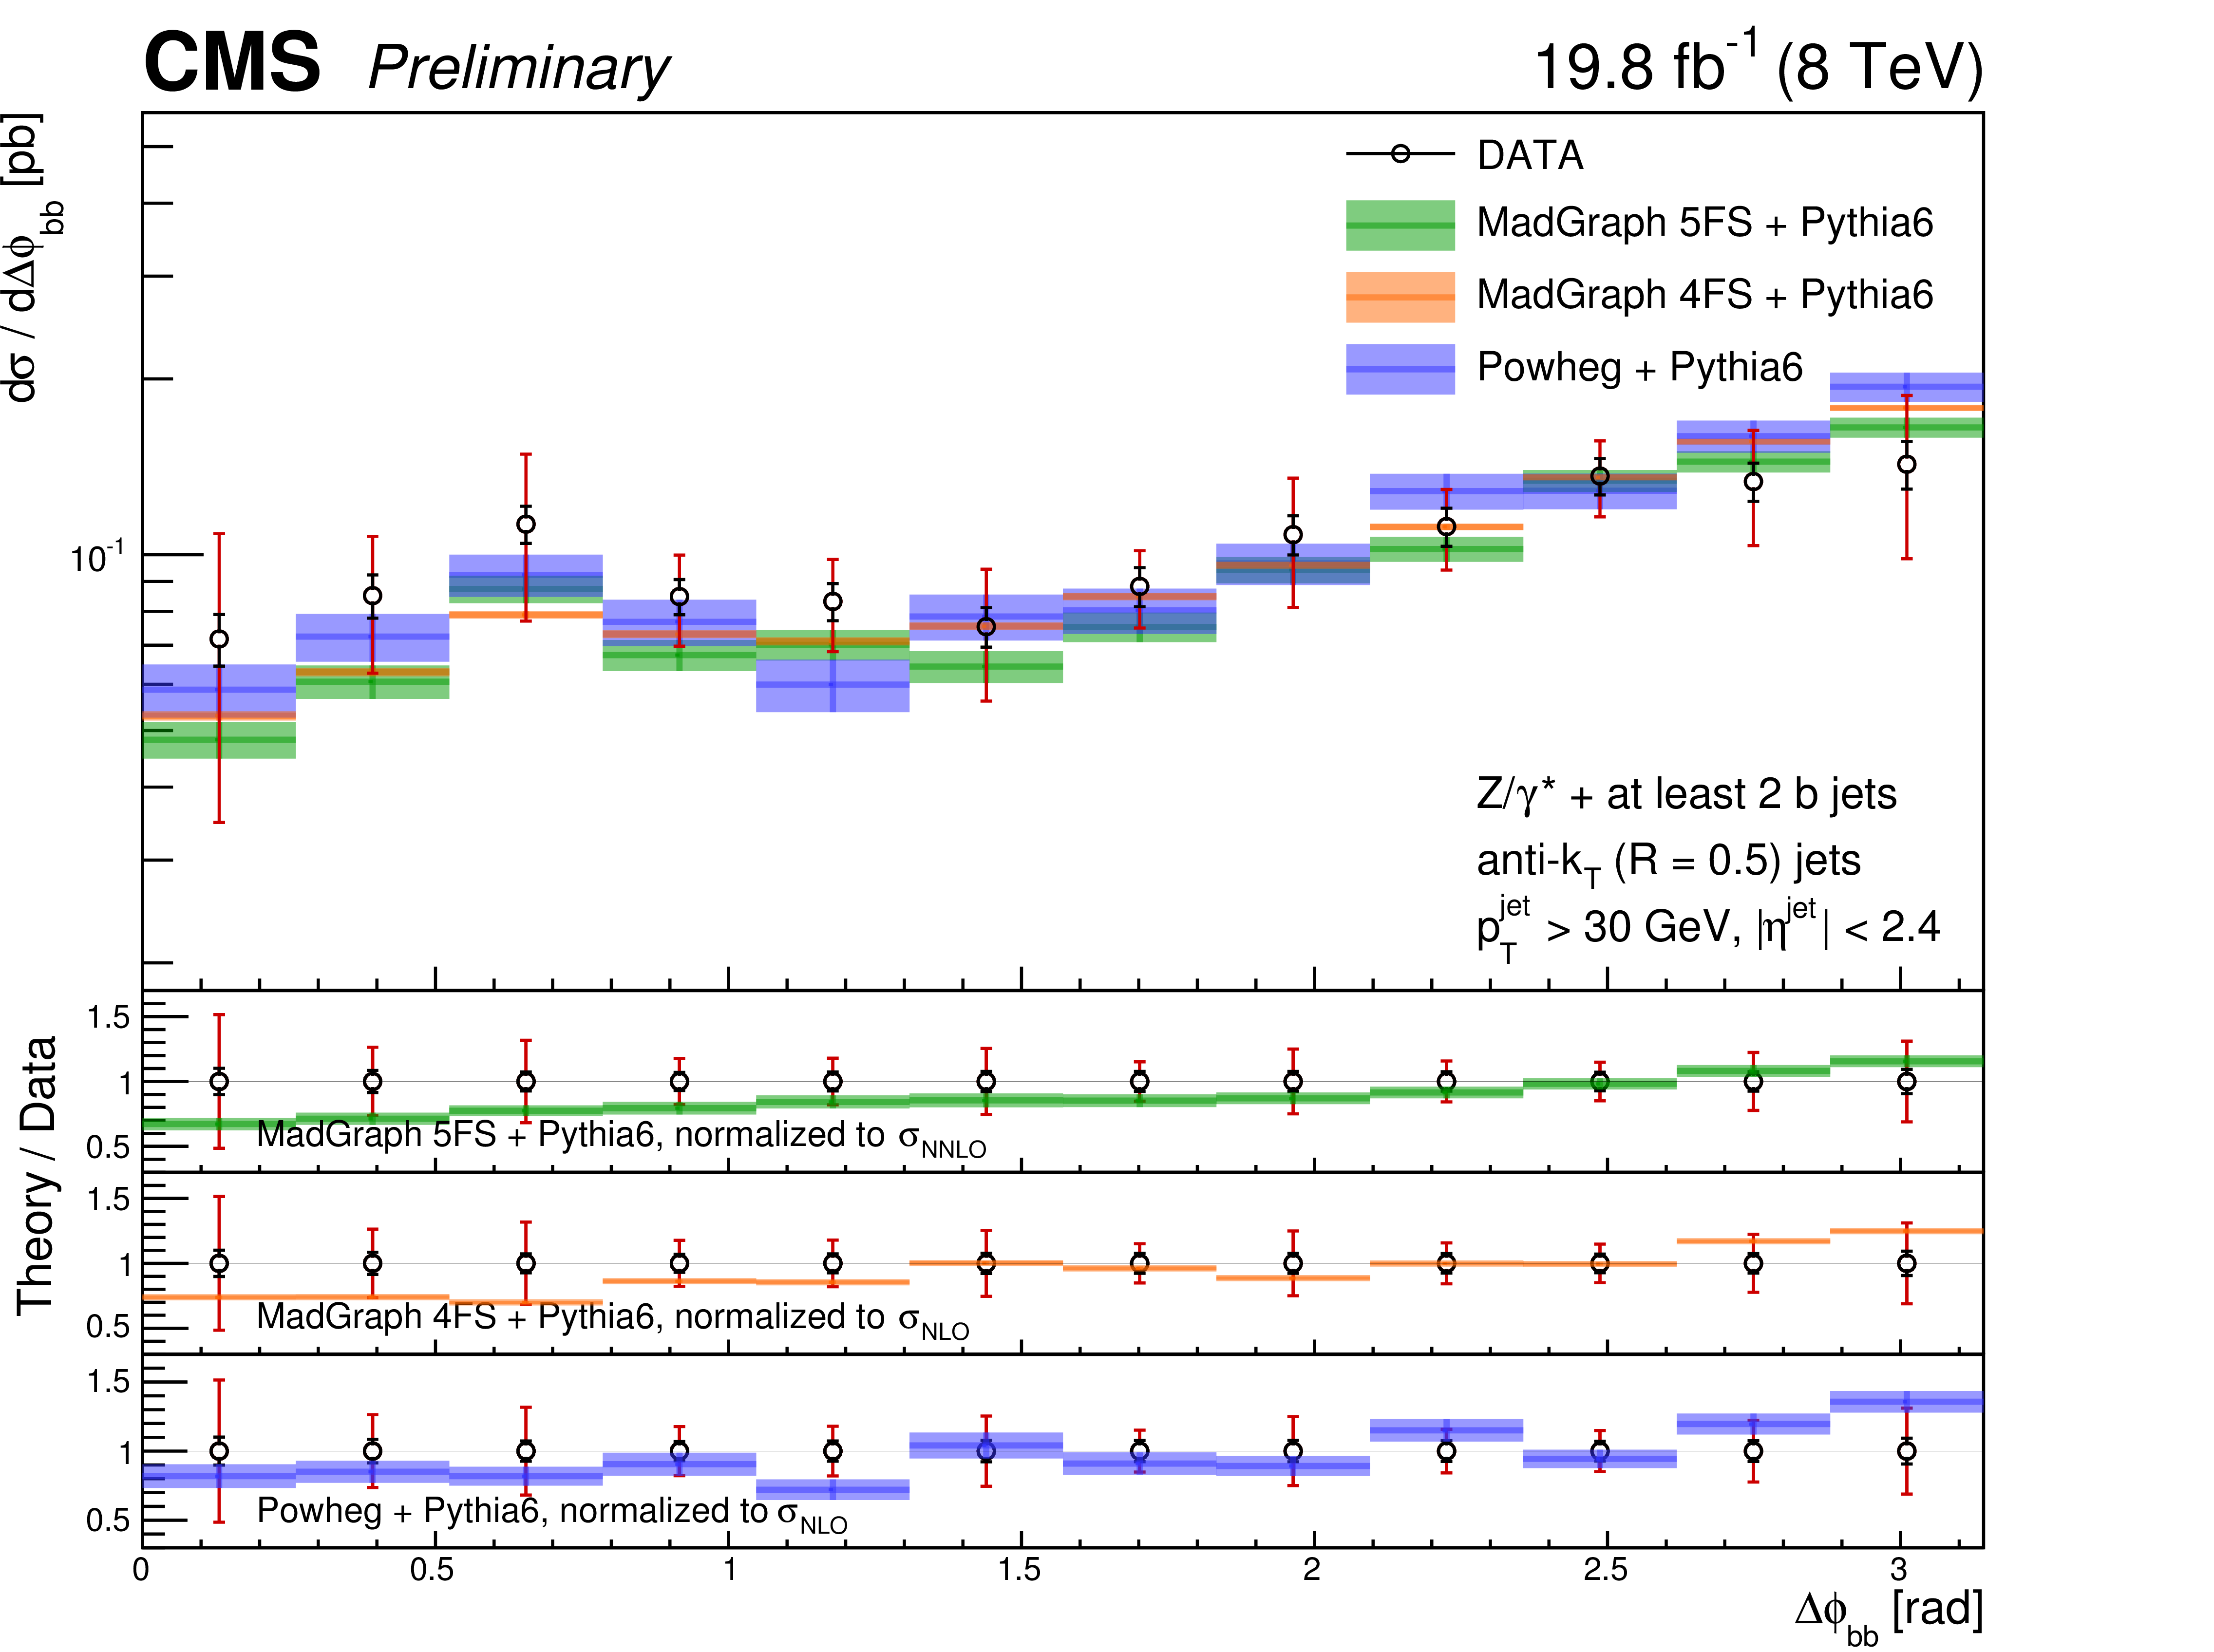
Figure 12:
Differential $ { {\mathrm {Z}}(2 {\mathrm {b}})} $ cross section as a function of the $\Delta \phi _\mathrm {bb}$, compared with the MadGraph 5FS, MadGraph 4FS and POWHEG theoretical predictions (shaded bands), normalized to the theoretical cross sections described in the text. For each data point the statistical and the total (statistical plus systematic) uncertainty are represented by the double error bar. The width of shaded bands represents the statistical error on the theoretical predictions. |
png ; pdf |
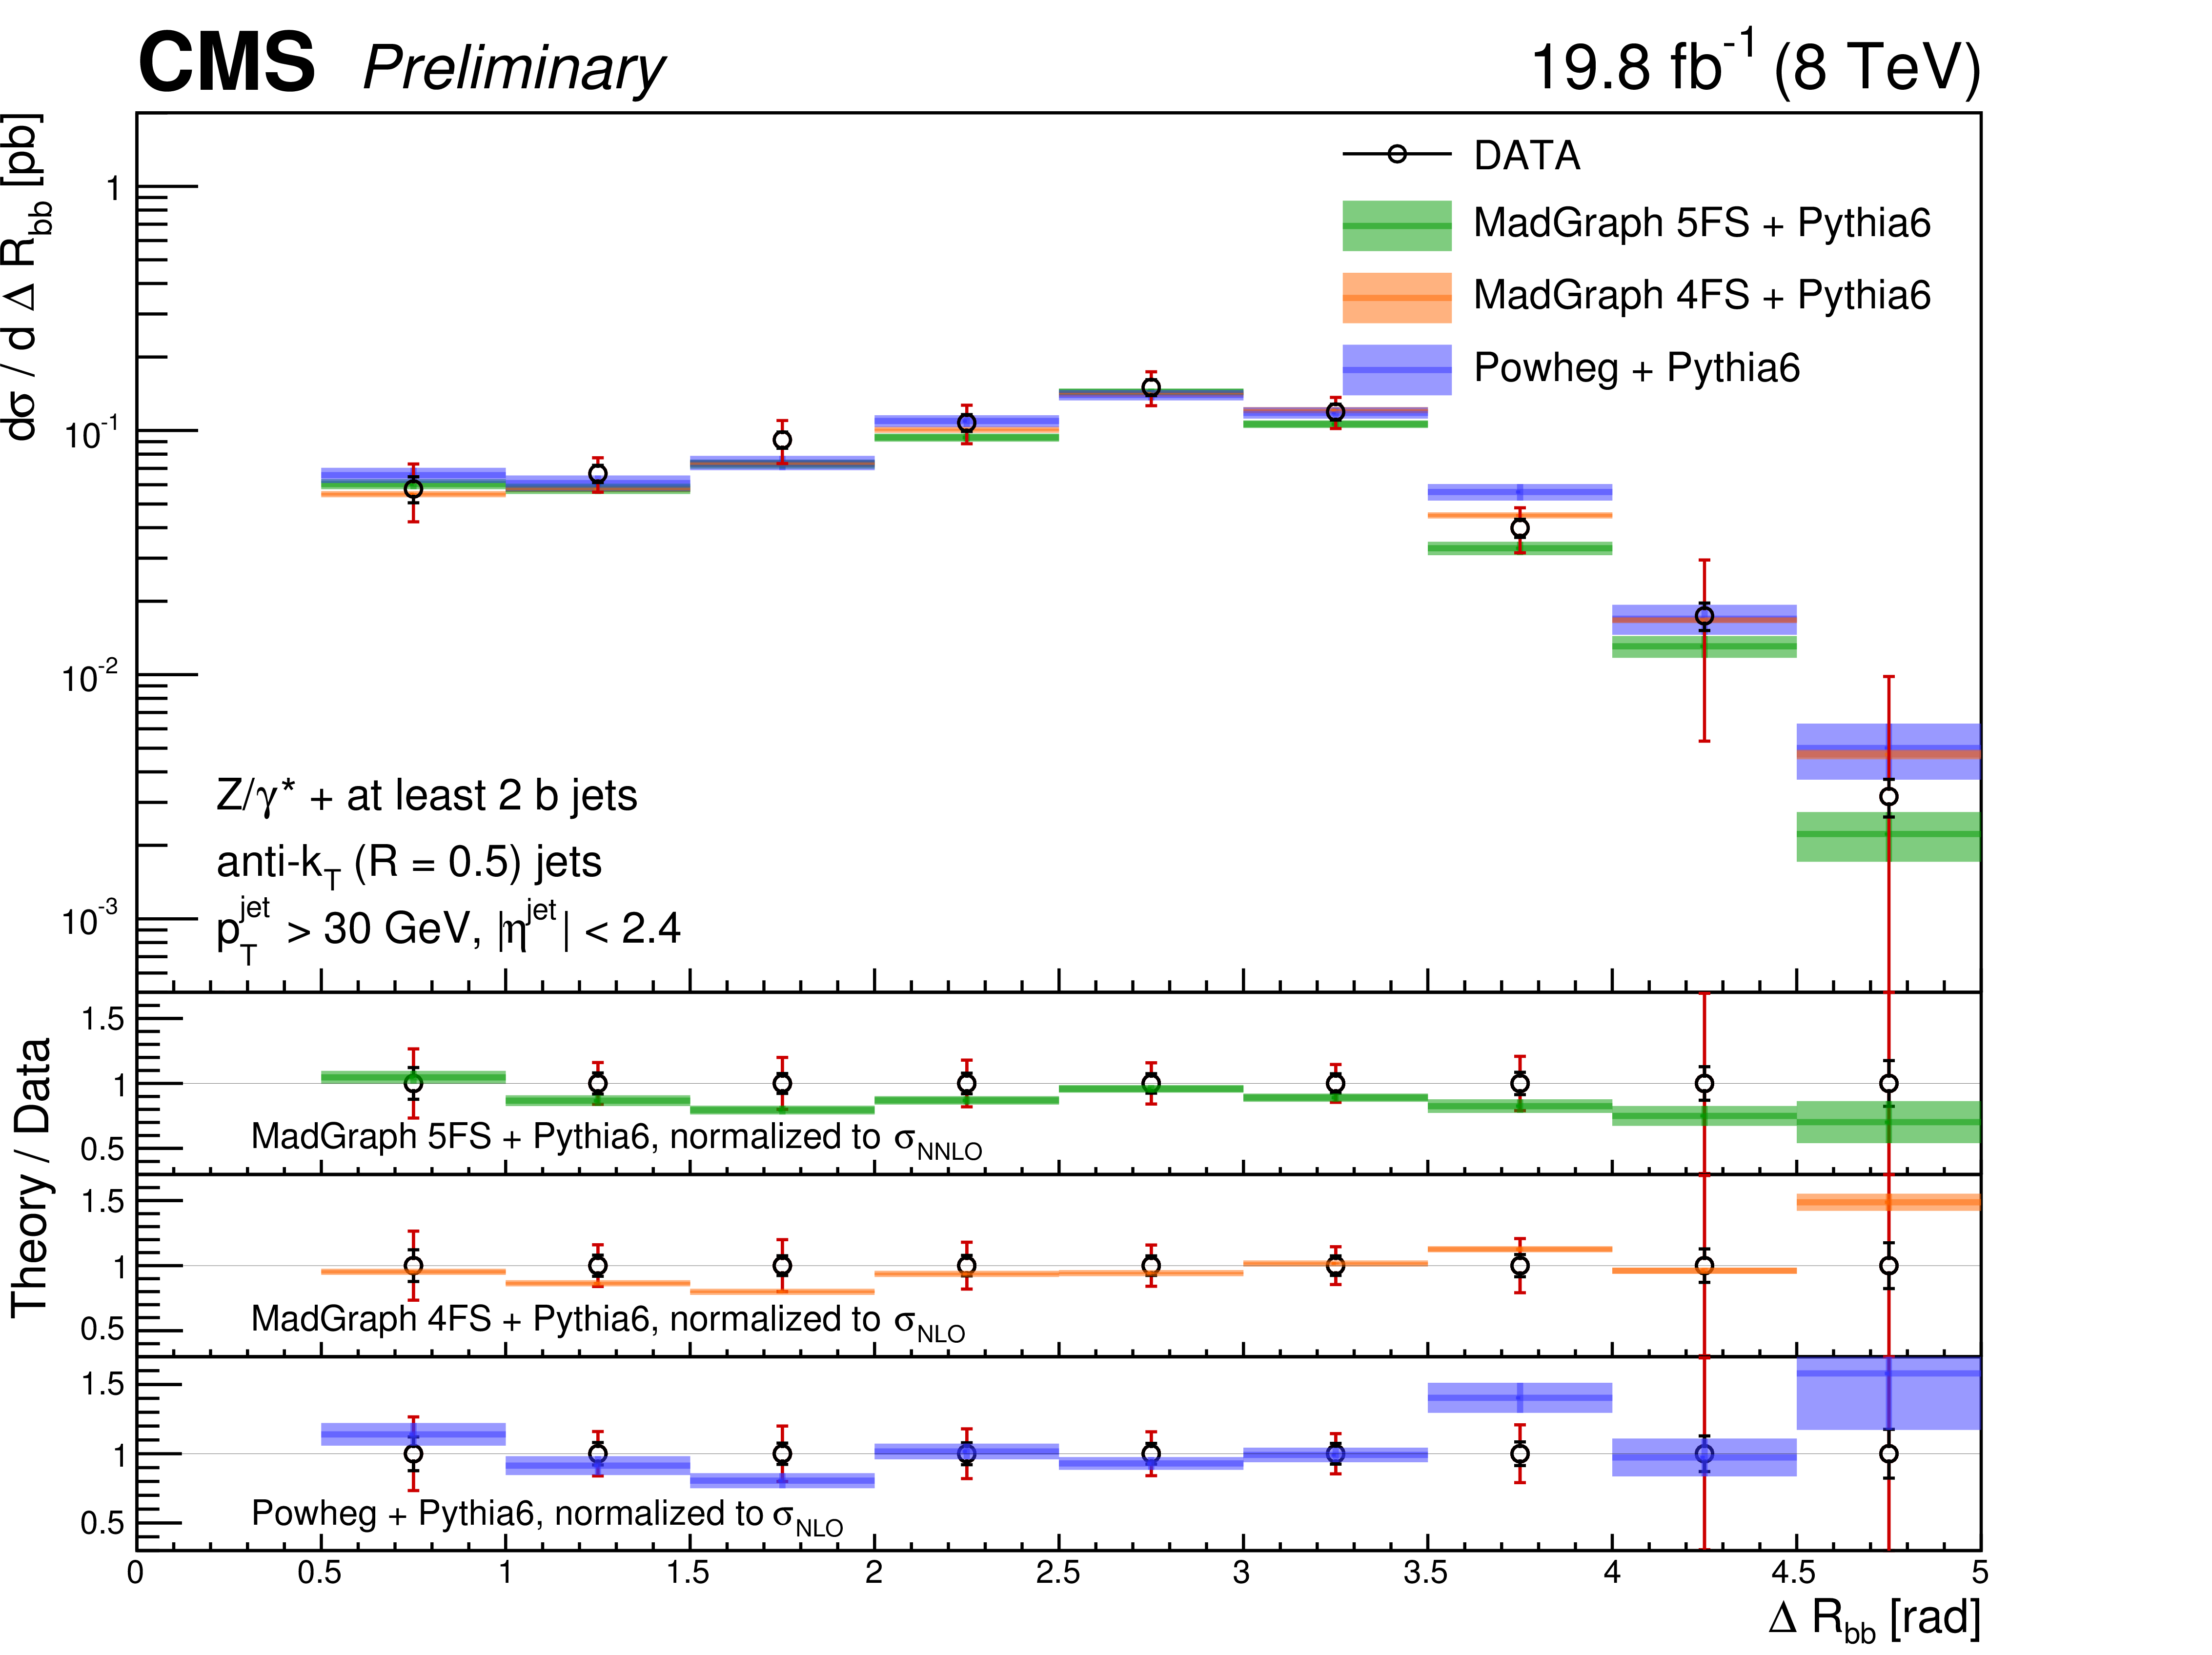
Figure 13:
Differential $ { {\mathrm {Z}}(2 {\mathrm {b}})} $ cross section as a function of the $\Delta \mathrm {R_{bb}}$, compared with the MadGraph 5FS, MadGraph 4FS and POWHEG theoretical predictions (shaded bands), normalized to the theoretical cross sections described in the text. For each data point the statistical and the total (statistical plus systematic) uncertainty are represented by the double error bar. The width of shaded bands represents the statistical error on the theoretical predictions. |
png ; pdf |
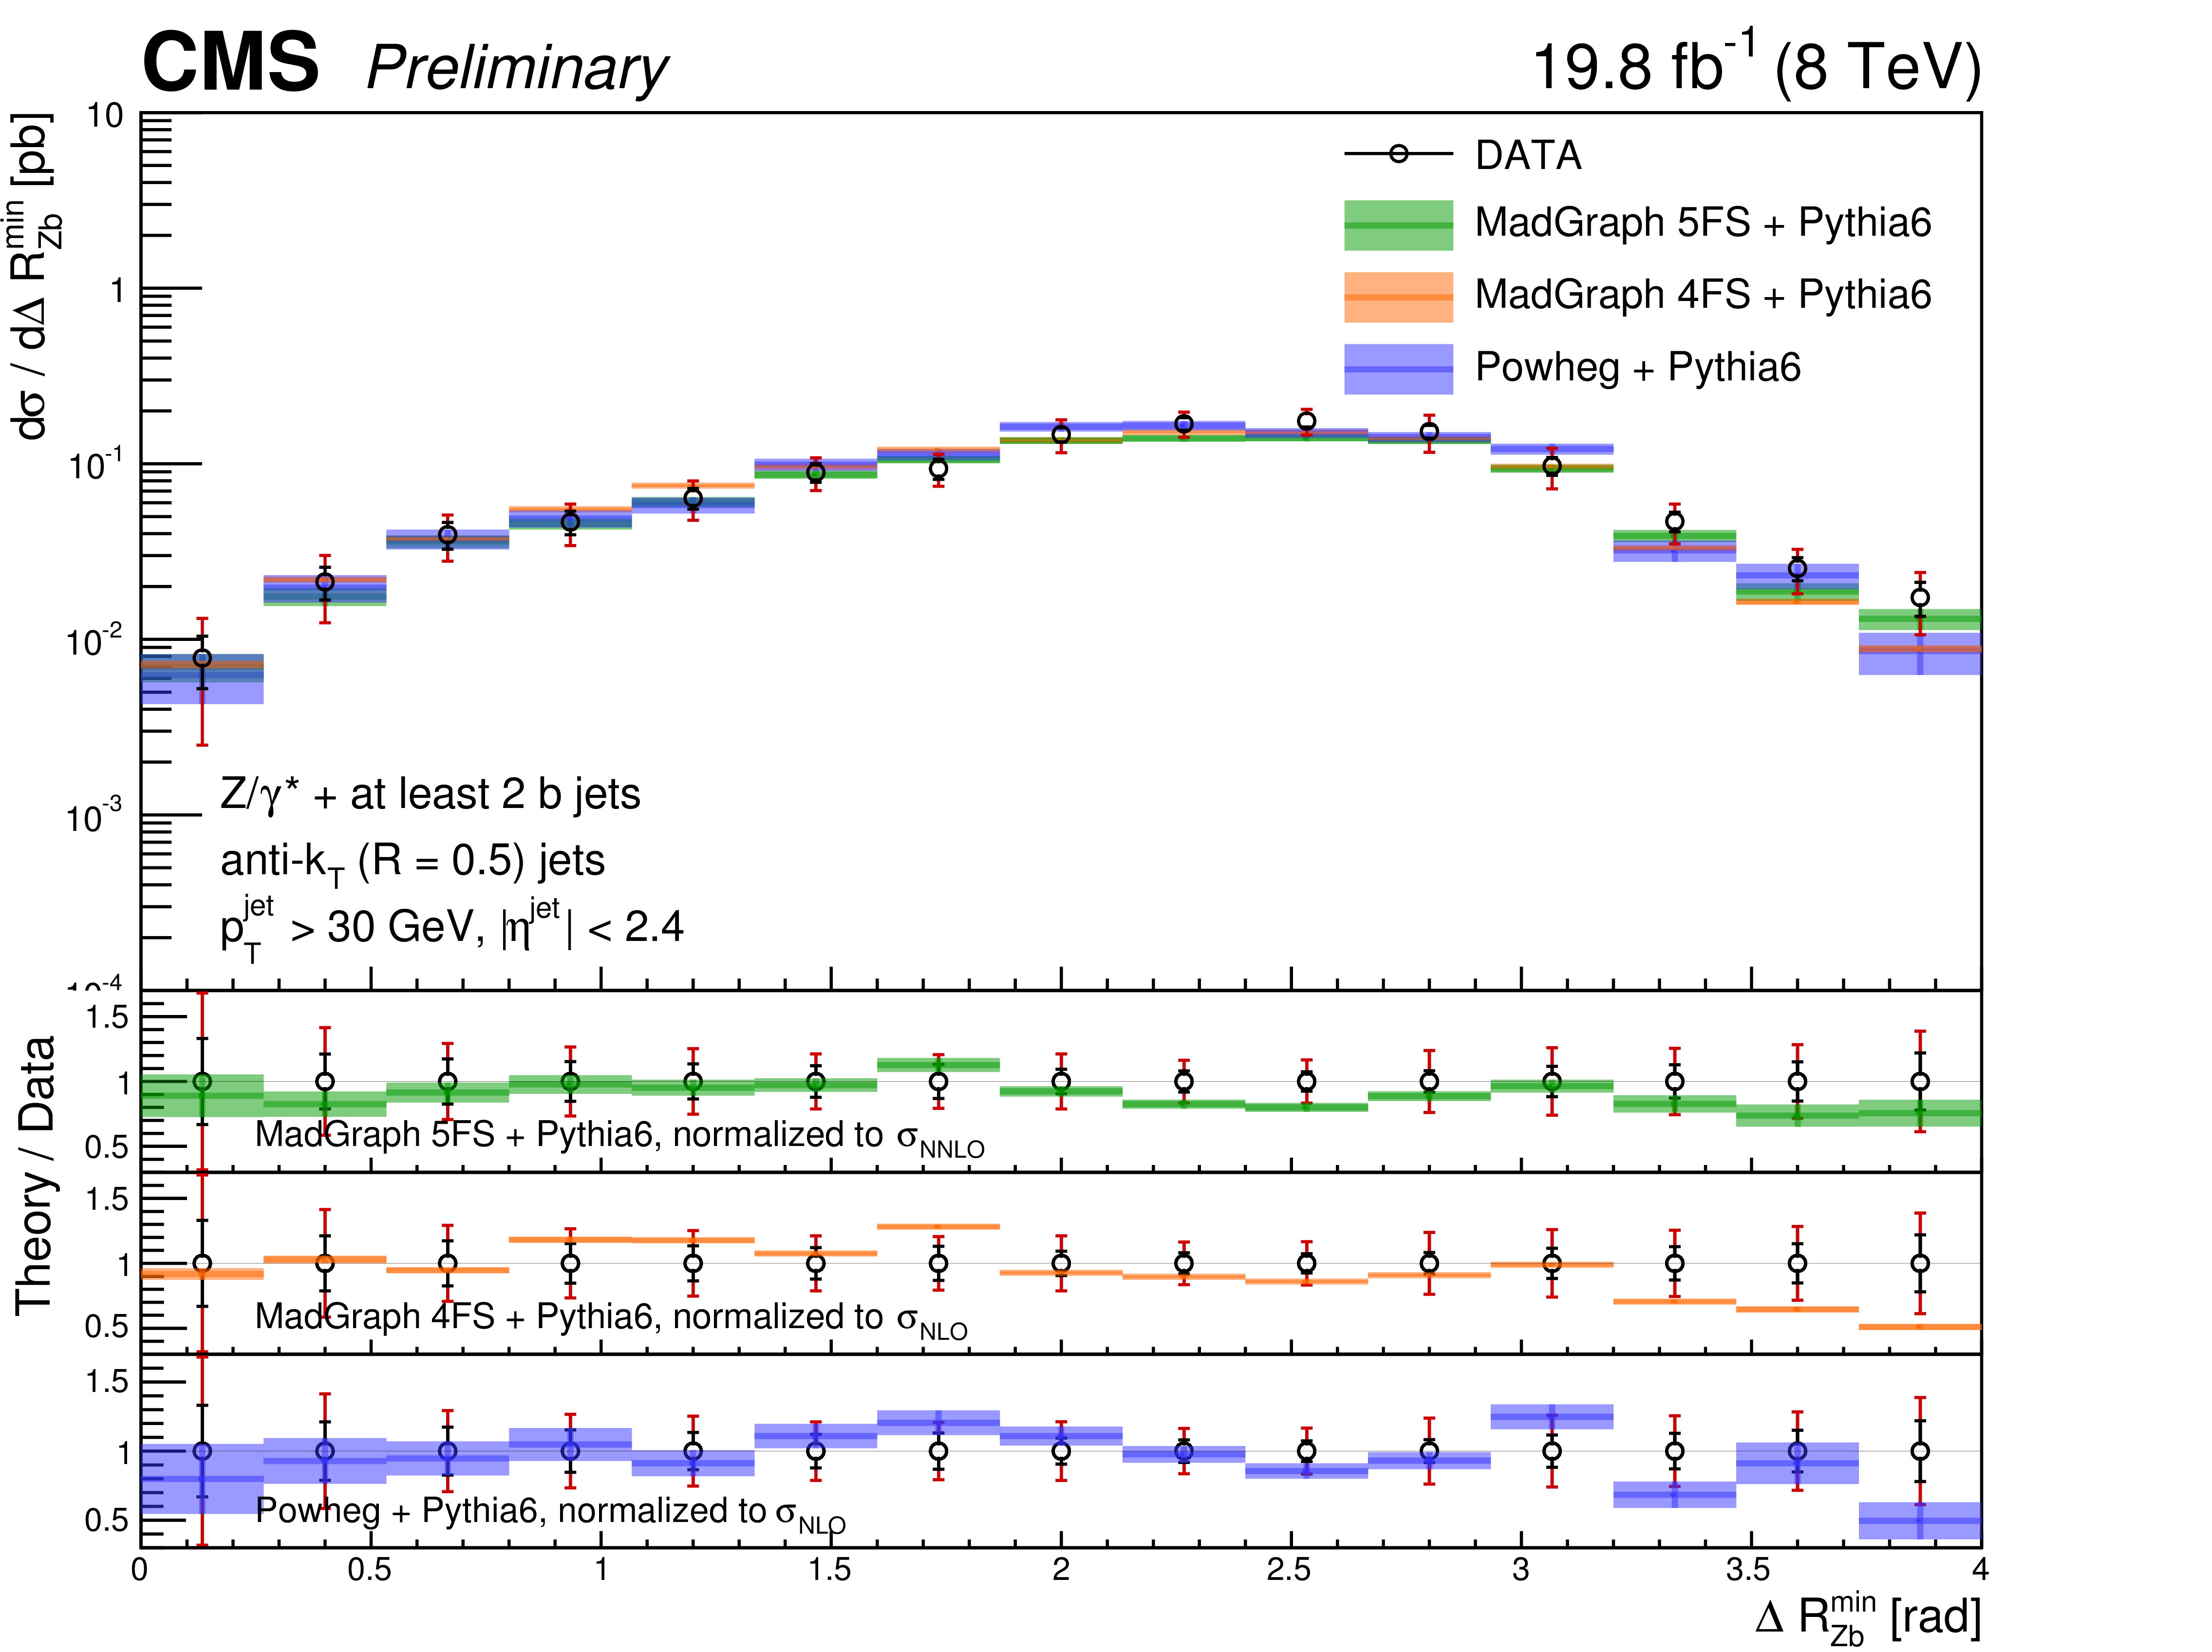
Figure 14:
Differential $ { {\mathrm {Z}}(2 {\mathrm {b}})} $ cross section as a function of the $\Delta \mathrm {R_{Zb}^{min}}$, compared with the MadGraph 5FS, MadGraph 4FS and POWHEG theoretical predictions (shaded bands), normalized to the theoretical cross sections described in the text. For each data point the statistical and the total (statistical plus systematic) uncertainty are represented by the double error bar. The width of shaded bands represents the statistical error on the theoretical predictions. |

png ; pdf |
Figure 15:
Differential $ { {\mathrm {Z}}(2 {\mathrm {b}})} $ cross section as a function of the $\mathrm {A_{Zbb}}$, compared with the MadGraph 5FS, MadGraph 4FS and POWHEG theoretical predictions (shaded bands), normalized to the theoretical cross sections described in the text. For each data point the statistical and the total (statistical plus systematic) uncertainty are represented by the double error bar. The width of shaded bands represents the statistical error on the theoretical predictions. |
png ; pdf |
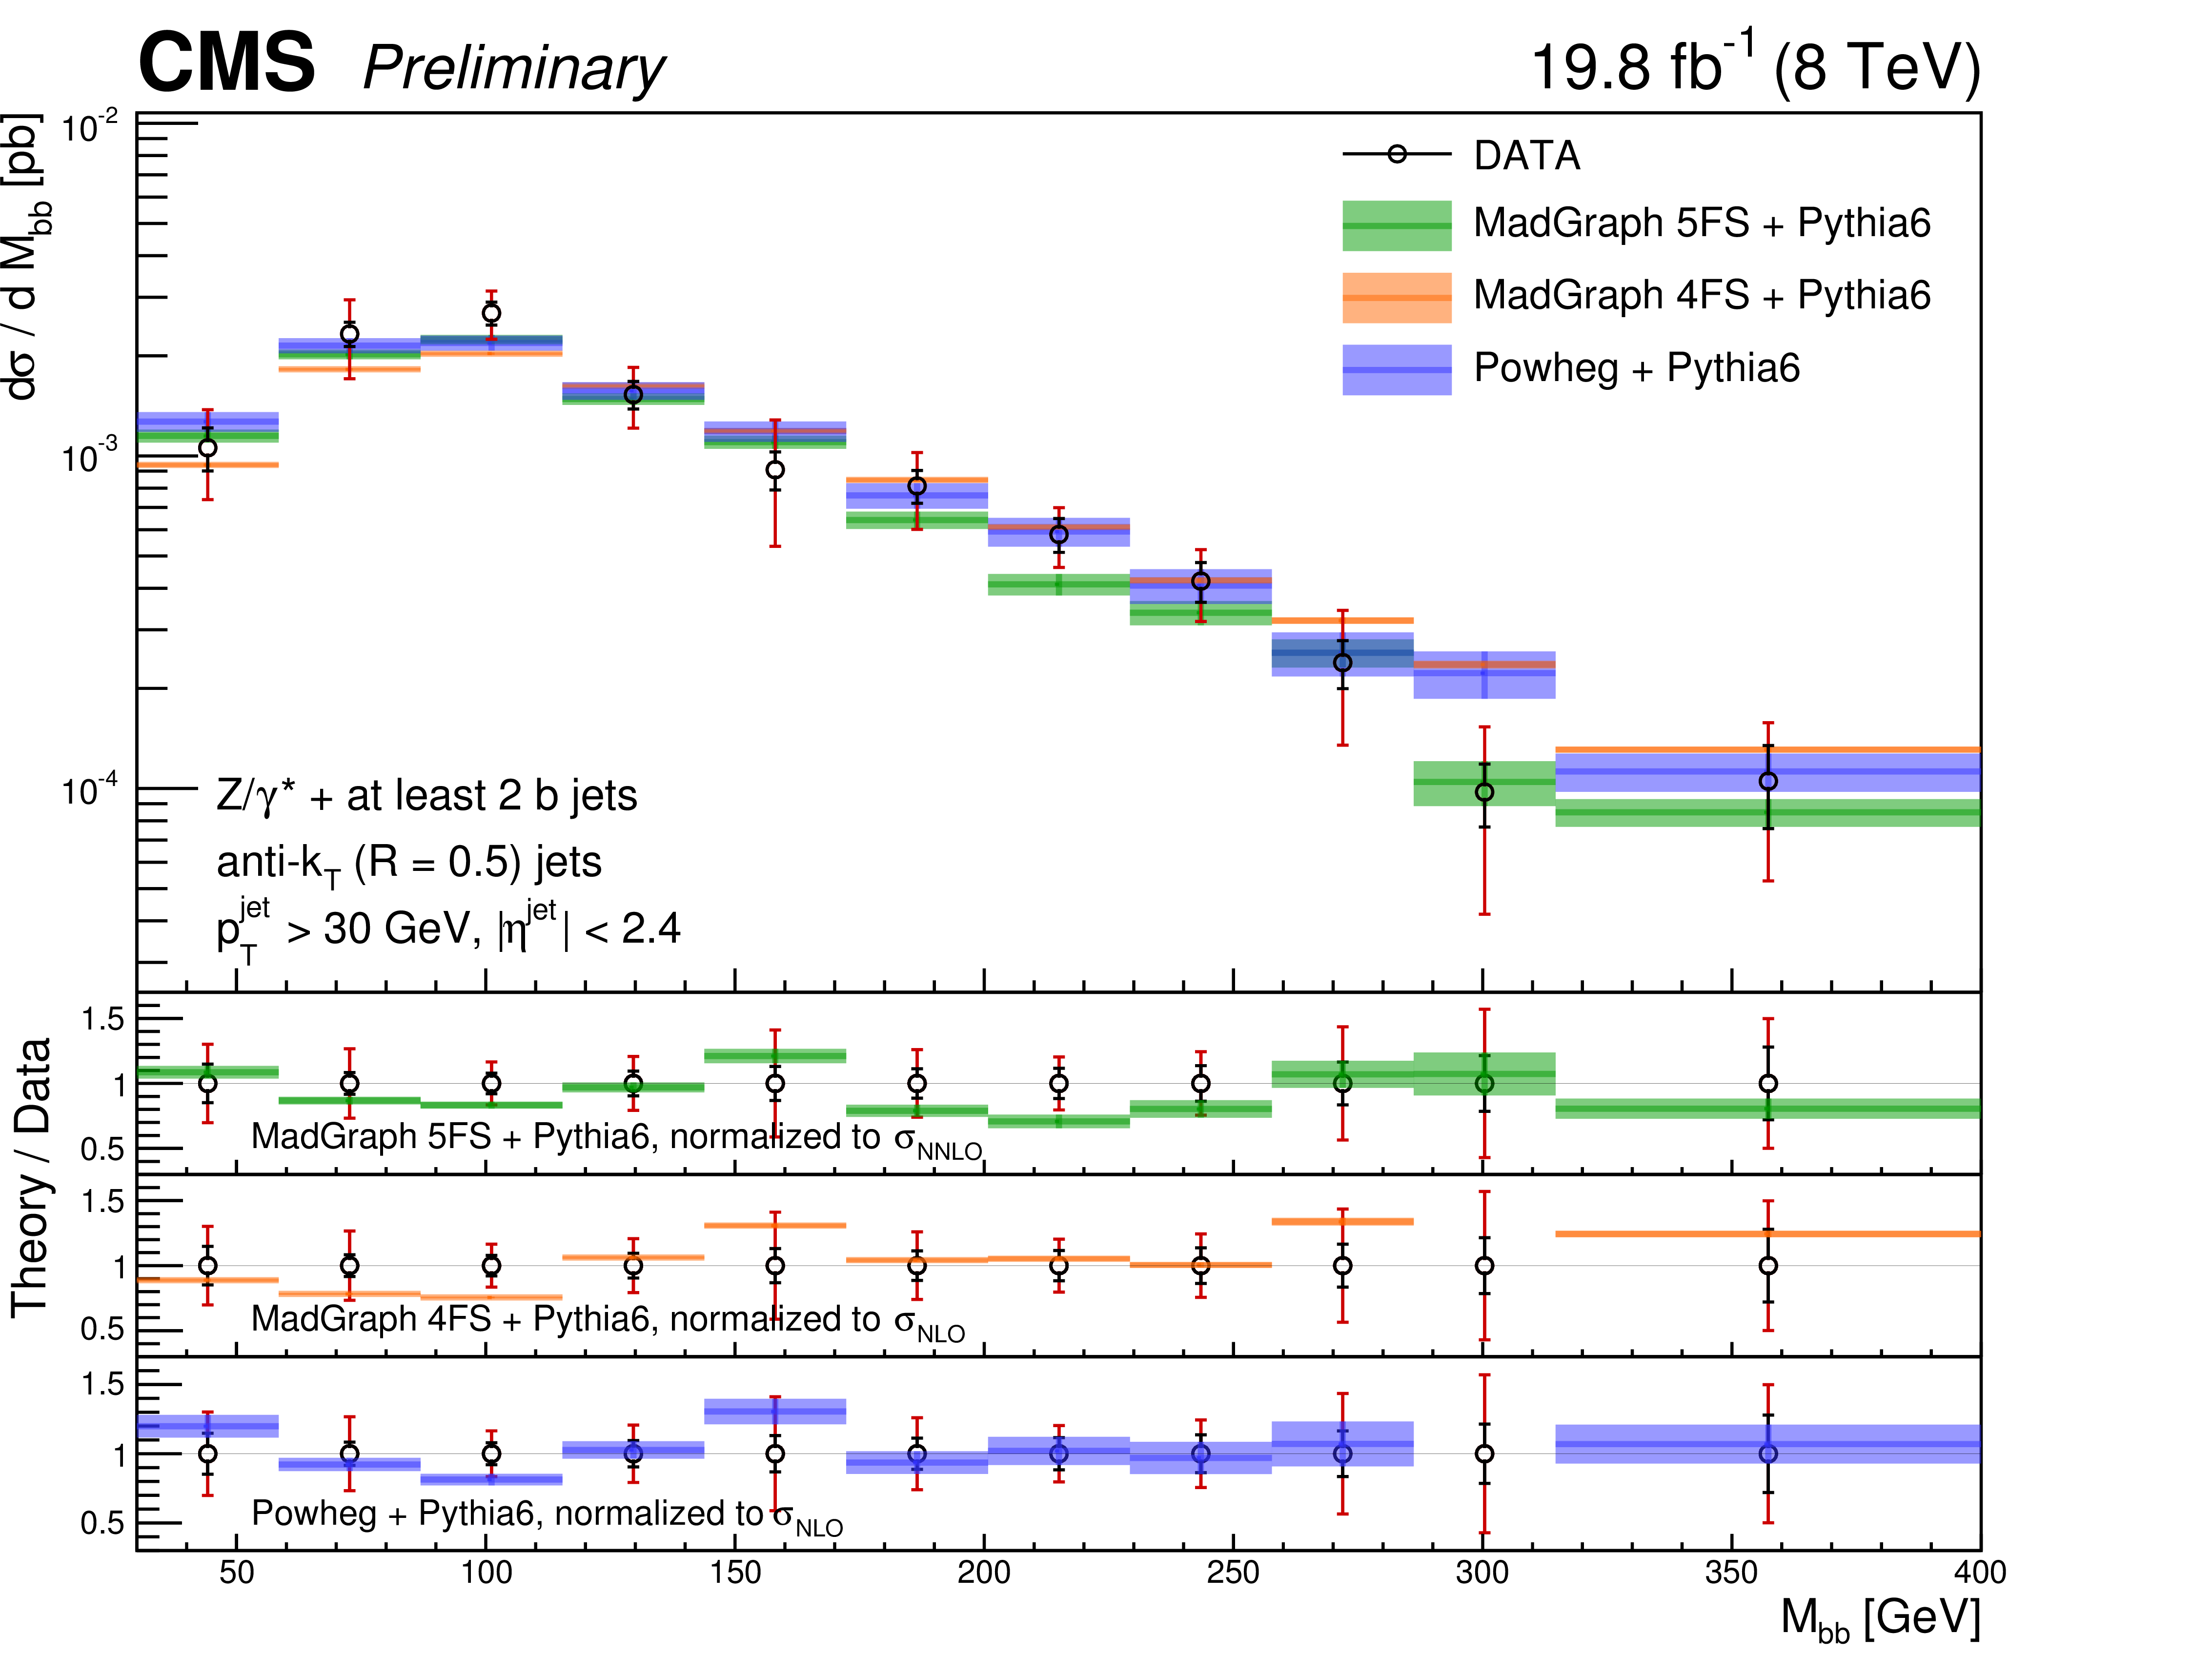
Figure 16:
Differential $ { {\mathrm {Z}}(2 {\mathrm {b}})} $ cross section as a function of the invariant mass of the $ {\mathrm {b}}$ jet pair $\mathrm {M_{bb}}$, compared with the MadGraph 5FS, MadGraph 4FS and POWHEG theoretical predictions (shaded bands), normalized to the theoretical cross sections described in the text. For each data point the statistical and the total (statistical plus systematic) uncertainty are represented by the double error bar. The width of shaded bands represents the statistical error on the theoretical predictions. |
png ; pdf |
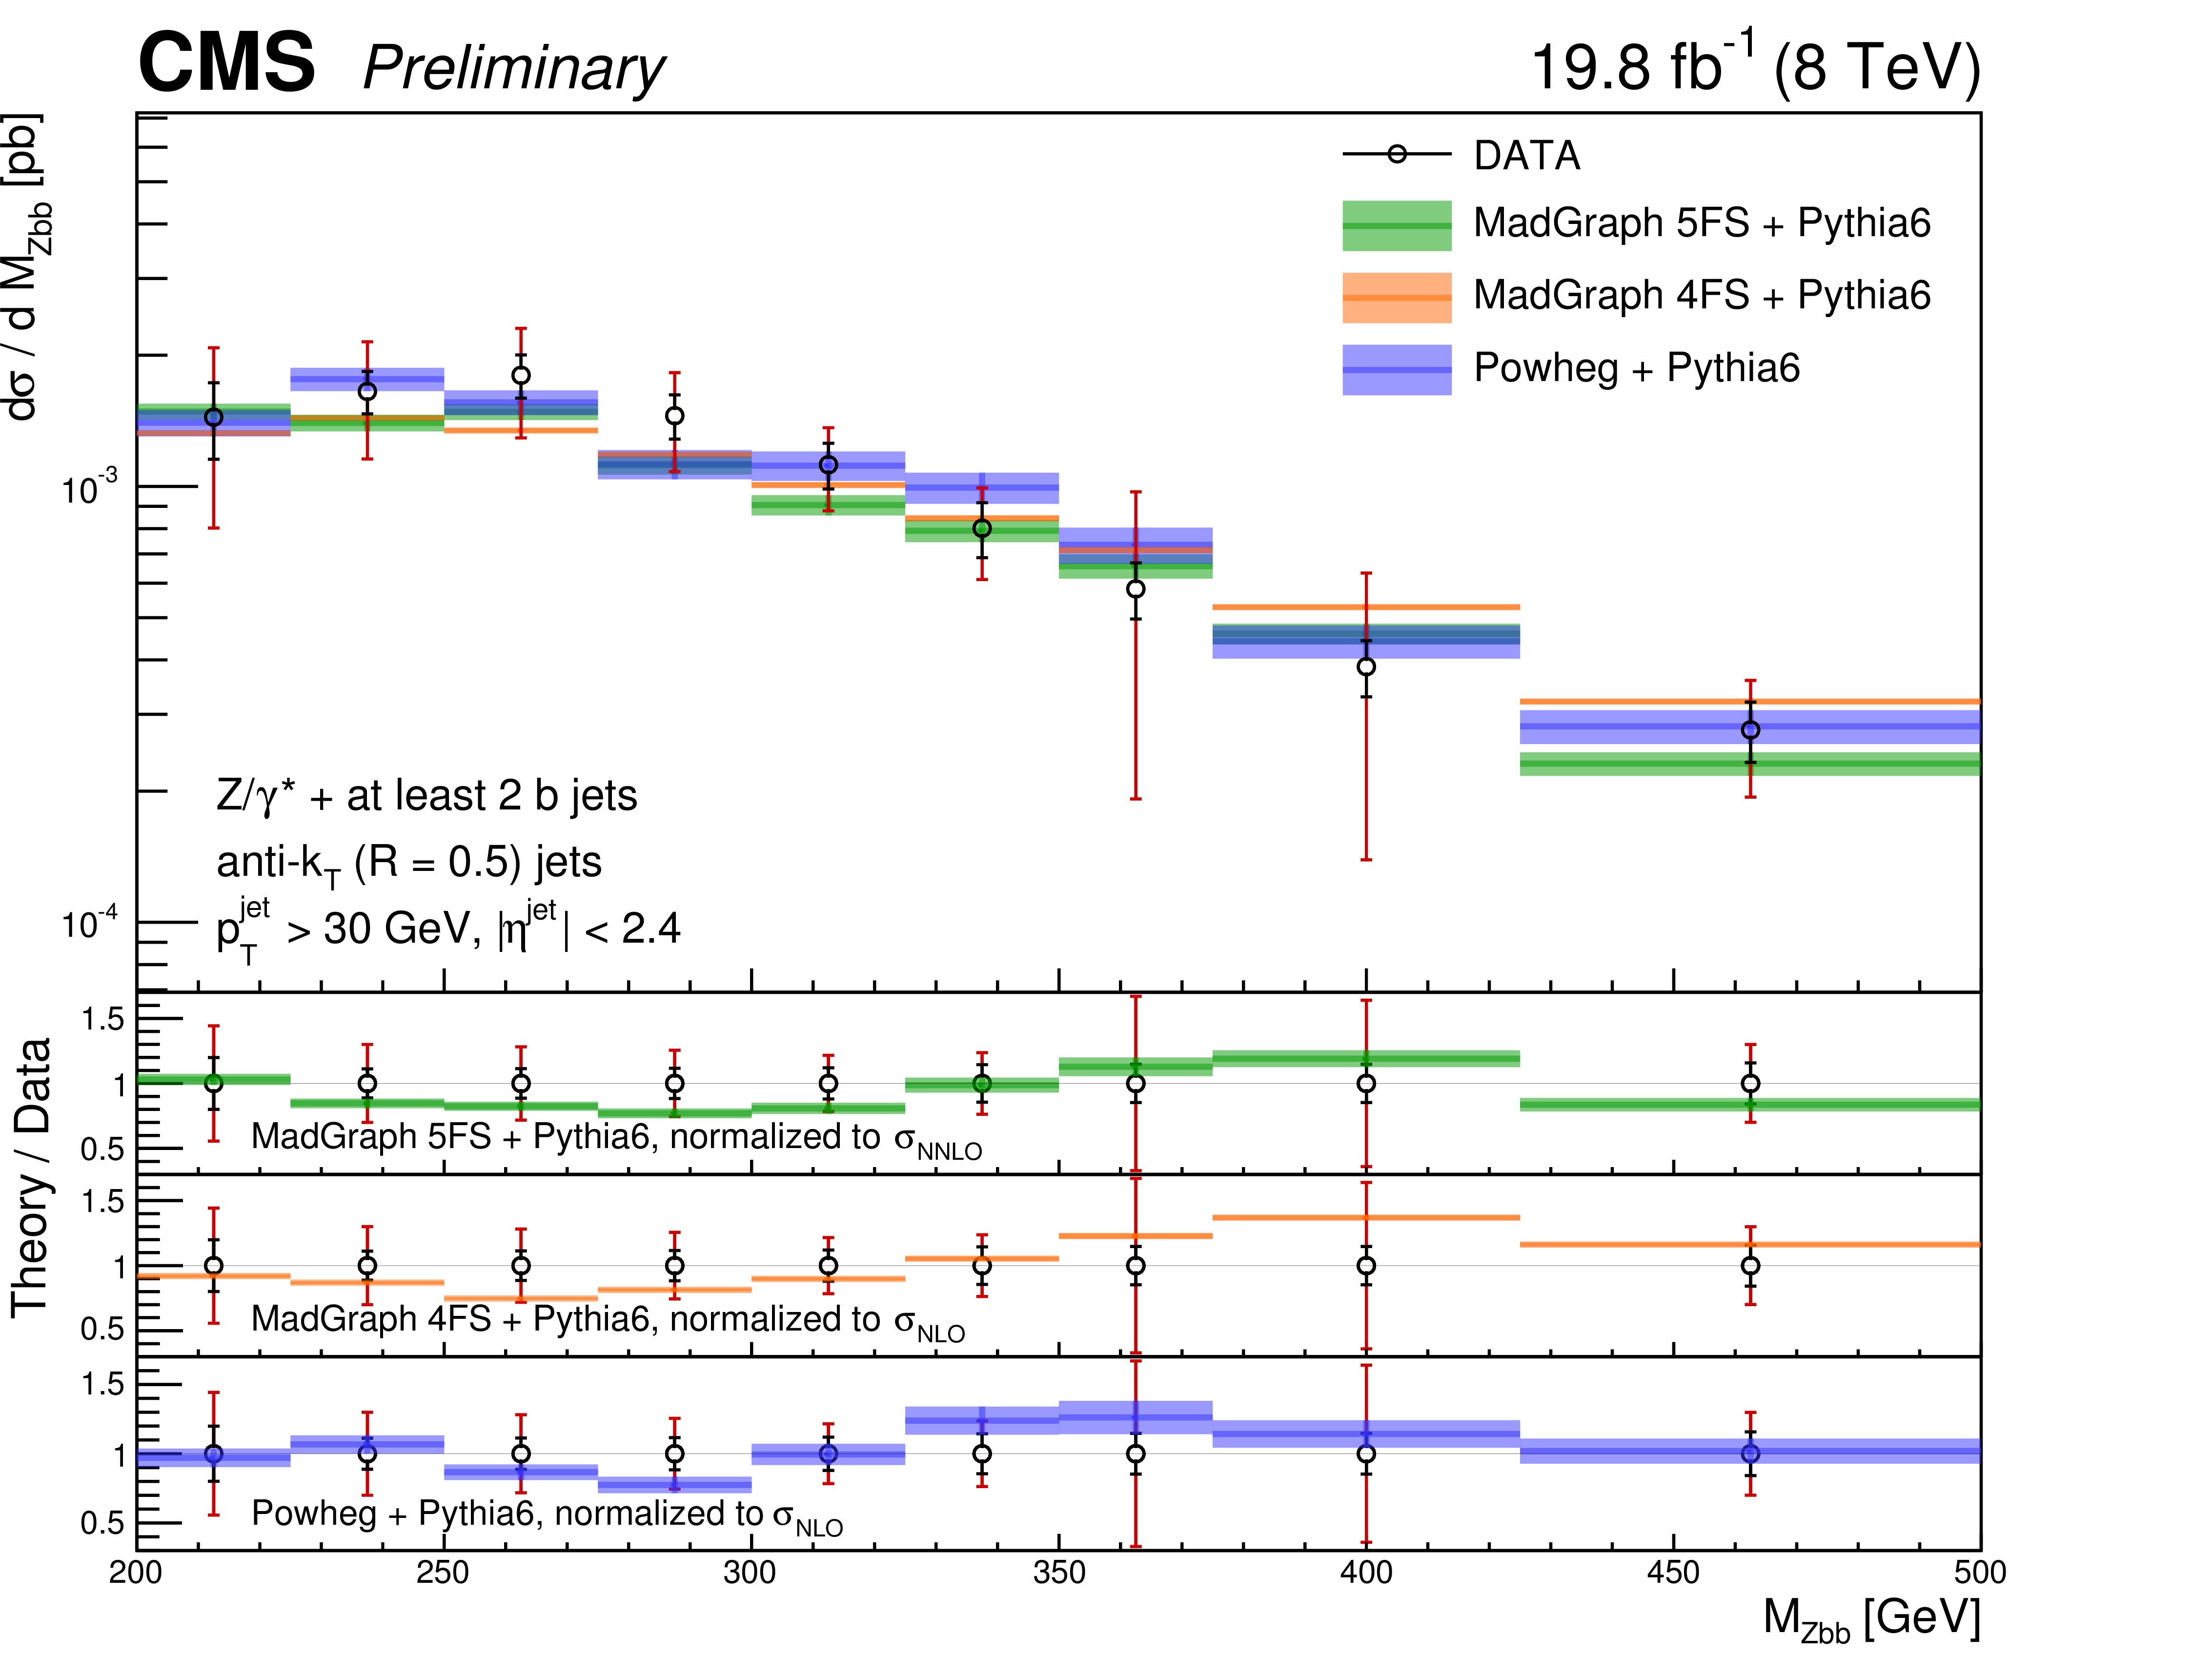
Figure 17:
Differential $ { {\mathrm {Z}}(2 {\mathrm {b}})} $ cross section as a function of the invariant mass of the $\mathrm {Zbb}$ system $\mathrm {M_{Zbb}}$, compared with the MadGraph 5FS, MadGraph 4FS and POWHEG theoretical predictions (shaded bands), normalized to the theoretical cross sections described in the text. For each data point the statistical and the total (statistical plus systematic) uncertainty are represented by the double error bar. The width of shaded bands represents the statistical error on the theoretical predictions. |
| Tables | |
png ; pdf |
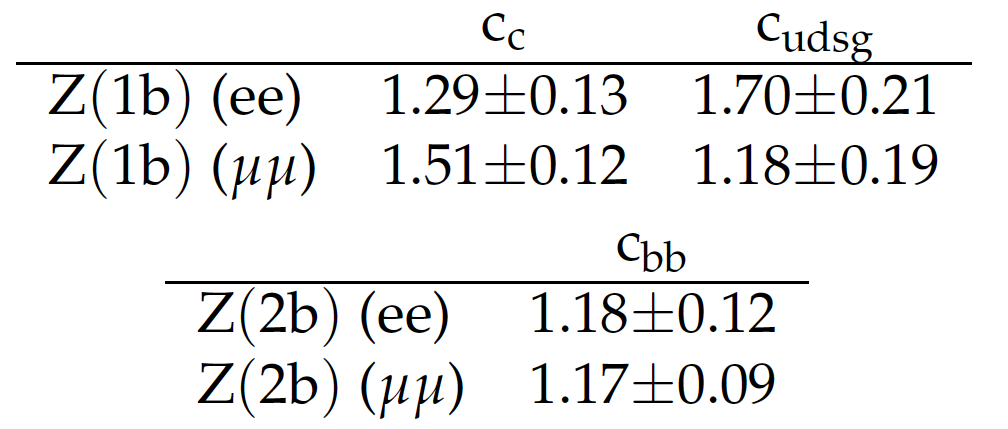
Table 1:
Scale factors for charm and light (up, down, strange and gluons) components in the selected $ { {\mathrm {Z}}(1 {\mathrm {b}})} $ events, and for beauty in the selected $ { {\mathrm {Z}}(2 {\mathrm {b}})}$ events, extracted by fitting to data the secondary vertex mass template distribution for dielectron and dimuon final states. |
png ; pdf |
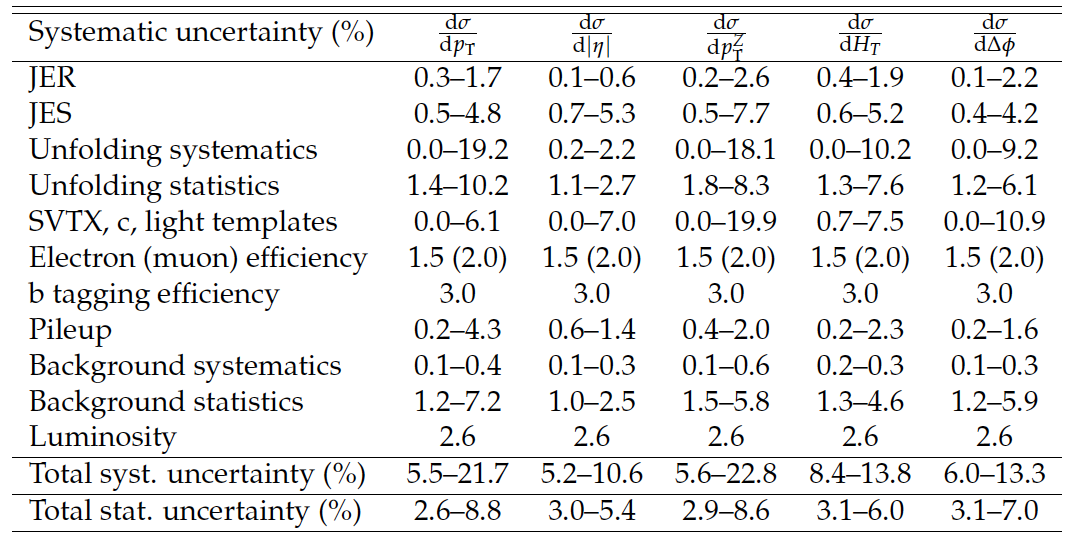
Table 2:
Systematic uncertainties (in percent) on the differential cross sections as a function of the leading b-jet $ {p_{\mathrm {T}}} $ and $|\eta |$, of the Z boson $ {p_{\mathrm {T}}} $, of $ {H_{\mathrm {T}}} $ and $\Delta \phi $ between the Z boson and the leading b jet for the $ \mathrm{ Z(1b) } $ sample. |
png ; pdf |
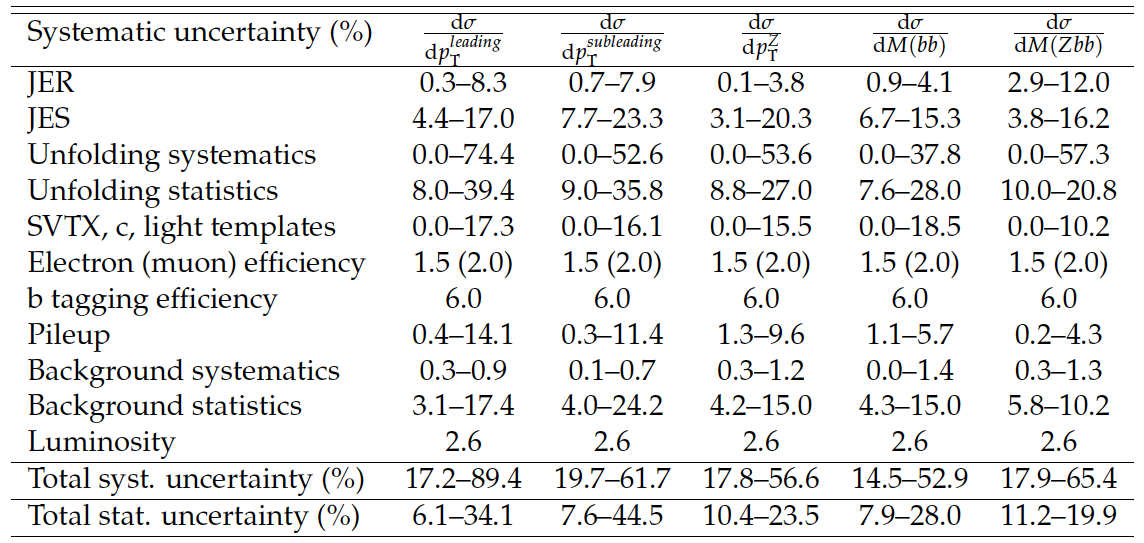
Table 3:
Sources of systematic uncertainty (in percent) on the differential cross sections as a function of the leading and subleading b jet $ {p_{\mathrm {T}}} $, the Z boson $ {p_{\mathrm {T}}} $, the invariant mass of the two b-tagged jets, and the invariant mass of the Z boson and the two b-tagged jets for the $ { {\mathrm {Z}}(2 {\mathrm {b}})} $ sample. |

png ; pdf |
Table 4:
Sources of systematic uncertainty (in percent) on the differential cross sections as a function of the $ {\Delta R}$ and $\Delta \phi $ between the two b-tagged jets, the $ {\Delta R}$ between the Z boson and the closest b-tagged jet, and the asymmetry $\mathrm {A_{Zbb}}$ for the $ { {\mathrm {Z}}(2 {\mathrm {b}})} $ sample. |
| Summary |
|
The process of the associated production of jets, including b jets, and a Z boson decaying into lepton pairs ($\ell =$ e, $\mu$) has been measured in LHC pp collisions at $\sqrt{s} =$ 8 TeV with the CMS experiment, using a total integrated luminosity of 19.8 fb$^{-1}$. The measured fiducial cross sections in data are compared to several theoretical predictions after the unfolding procedure. The cross sections have been measured as a function of various kinematic observables describing the topology where a Z boson and at least one b jet are present: the $p_{ \mathrm{T} }$ and $\eta$ of the leading b jet, the Z boson $p_{ \mathrm{T} }$, the scalar sum of the jet energies $H_{\mathrm{T}}$, and the azimuthal angular difference between the direction of the leading b jet and the Z boson. The comparison between unfolded data and the matrix element plus parton shower leading order prediction in perturbative QCD is made testing two different models using the MadGraph event generator and using the NLO calculation for the first jet with POWHEG. Most of the distributions show a good agreement between data and theoretical prediction, with the shape of the soft b-jet region slightly better reproduced by MadGraph 4FS, while its normalization is underestimated by about 20%. The differential cross section ratios between the inclusive Z+jets and Z+b jets final state has been measured and compared with the theoretical expectations. The 4FS-based prediction fails to describe the shape of the ratio as a function of the leading b-jet $p_{ \mathrm{T} }$, and discrepancies in the shape are observed also for high values of the Z boson $p_{ \mathrm{T} }$. The case where at least two b jets are detected in the fiducial phase space has also been studied. The kinematic observables studied are: the $p_{ \mathrm{T} }$ of the leading and of the subleading b jets, the $p_{ \mathrm{T} }$ of the Z boson, the distances between the b jets both in the azimuthal angle and in the $\eta$-$\phi$ plane, the minimal distance in the $\eta$-$\phi$ plane between the Z boson and a b jet and the asymmetry between the minimal and the maximal distances between the Z boson and a b jet, the invariant masses of the bb and of the Zbb systems. The distributions are generally well reproduced within uncertainties. |
| Auxiliary Figures | |

png ; pdf |
Auxiliary Figure 1:
Distribution of the secondary vertex mass of the leading-$p_{\mathrm{T}}$ jet after the $ { {\mathrm {Z}}(1 {\mathrm {b}})} $ selection with the Z boson decaying into electrons. The subsamples corresponding to b-tagged jets originating from b, c and light quarks/gluons are shown, with the scale factors for each component fitted on data and the corresponding fractions. |

png ; pdf |
Auxiliary Figure 2:
Distribution of the secondary vertex mass of the leading-$p_{\mathrm{T}}$ jet after the $ { {\mathrm {Z}}(1 {\mathrm {b}})} $ selection with the Z boson decaying into muons. The subsamples corresponding to b-tagged jets originating from b, c and light quarks/gluons are shown, with the scale factors for each component fitted on data and the corresponding fractions. |
|
|
Compact Muon Solenoid LHC, CERN |
|

|

|

|

|

|