

Compact Muon Solenoid
LHC, CERN
| CMS-PAS-SMP-14-001 | ||
| Measurement of the double-differential inclusive jet cross section at $\sqrt{s} =$ 8 TeV | ||
| CMS Collaboration | ||
| October 2015 | ||
| Abstract: A measurement of the double-differential inclusive jet cross section, as a function of jet transverse momentum $p_{\mathrm{T}}$ and absolute jet rapidity $|y|$, is presented. Data from LHC proton-proton collisions at $\sqrt{s}=$ 8 TeV, corresponding to an integrated luminosity of 19.71 fb$^{-1}$, have been collected with the CMS detector. Jets are reconstructed with the anti-$k_{\mathrm{T}}$ clustering algorithm for a jet size parameter R=0.7 in a phase space region covering jet $p_{\mathrm{T}}$ up to 2.5 TeV and jet rapidity up to $|y|=$ 3.0. The measured jet cross section is corrected for detector effects and compared to predictions of perturbative QCD at next-to-leading order using various sets of parton distribution functions. From the measured double-differential jet cross section the strong coupling constant value is found to be $\alpha_{\mathrm{S}}(\mathrm{M_Z}) =$ 0.1164$^{+0.0060}_{-0.0043}$, using the CT10 NLO parton distribution function set. Constraints on parton distribution functions based on the inclusive cross section measurement are presented. | ||
|
Links:
CDS record (PDF) ;
CADI line (restricted) ; Figures are also available from the CDS record. These preliminary results are superseded in this paper, JHEP 03 (2017) 156. The superseded preliminary plots can be found here. |
||
| Figures | |

png ; pdf |
Figure 1-a:
NP correction factor shown for the central (a) and outermost (b) rapidity bins as a function of jet {p_{\mathrm {T}}} . The correction is obtained by averaging LO- and NLO-based predictions, and the envelope of these predictions is used for the uncertainty band. The average of these two NP predictions is used for all data-theory comparisons as well as $ {\alpha _\mathrm {S}(\mathrm {M_Z})} $ fitting. |

png ; pdf |
Figure 1-b:
NP correction factor shown for the central (a) and outermost (b) rapidity bins as a function of jet {p_{\mathrm {T}}} . The correction is obtained by averaging LO- and NLO-based predictions, and the envelope of these predictions is used for the uncertainty band. The average of these two NP predictions is used for all data-theory comparisons as well as $ {\alpha _\mathrm {S}(\mathrm {M_Z})} $ fitting. |

png ; pdf |
Figure 2-a:
Electroweak correction factor for the central (a) and outer most (b) rapidity bins as a function of jet $ {p_{\mathrm {T}}} $. |
png ; pdf |
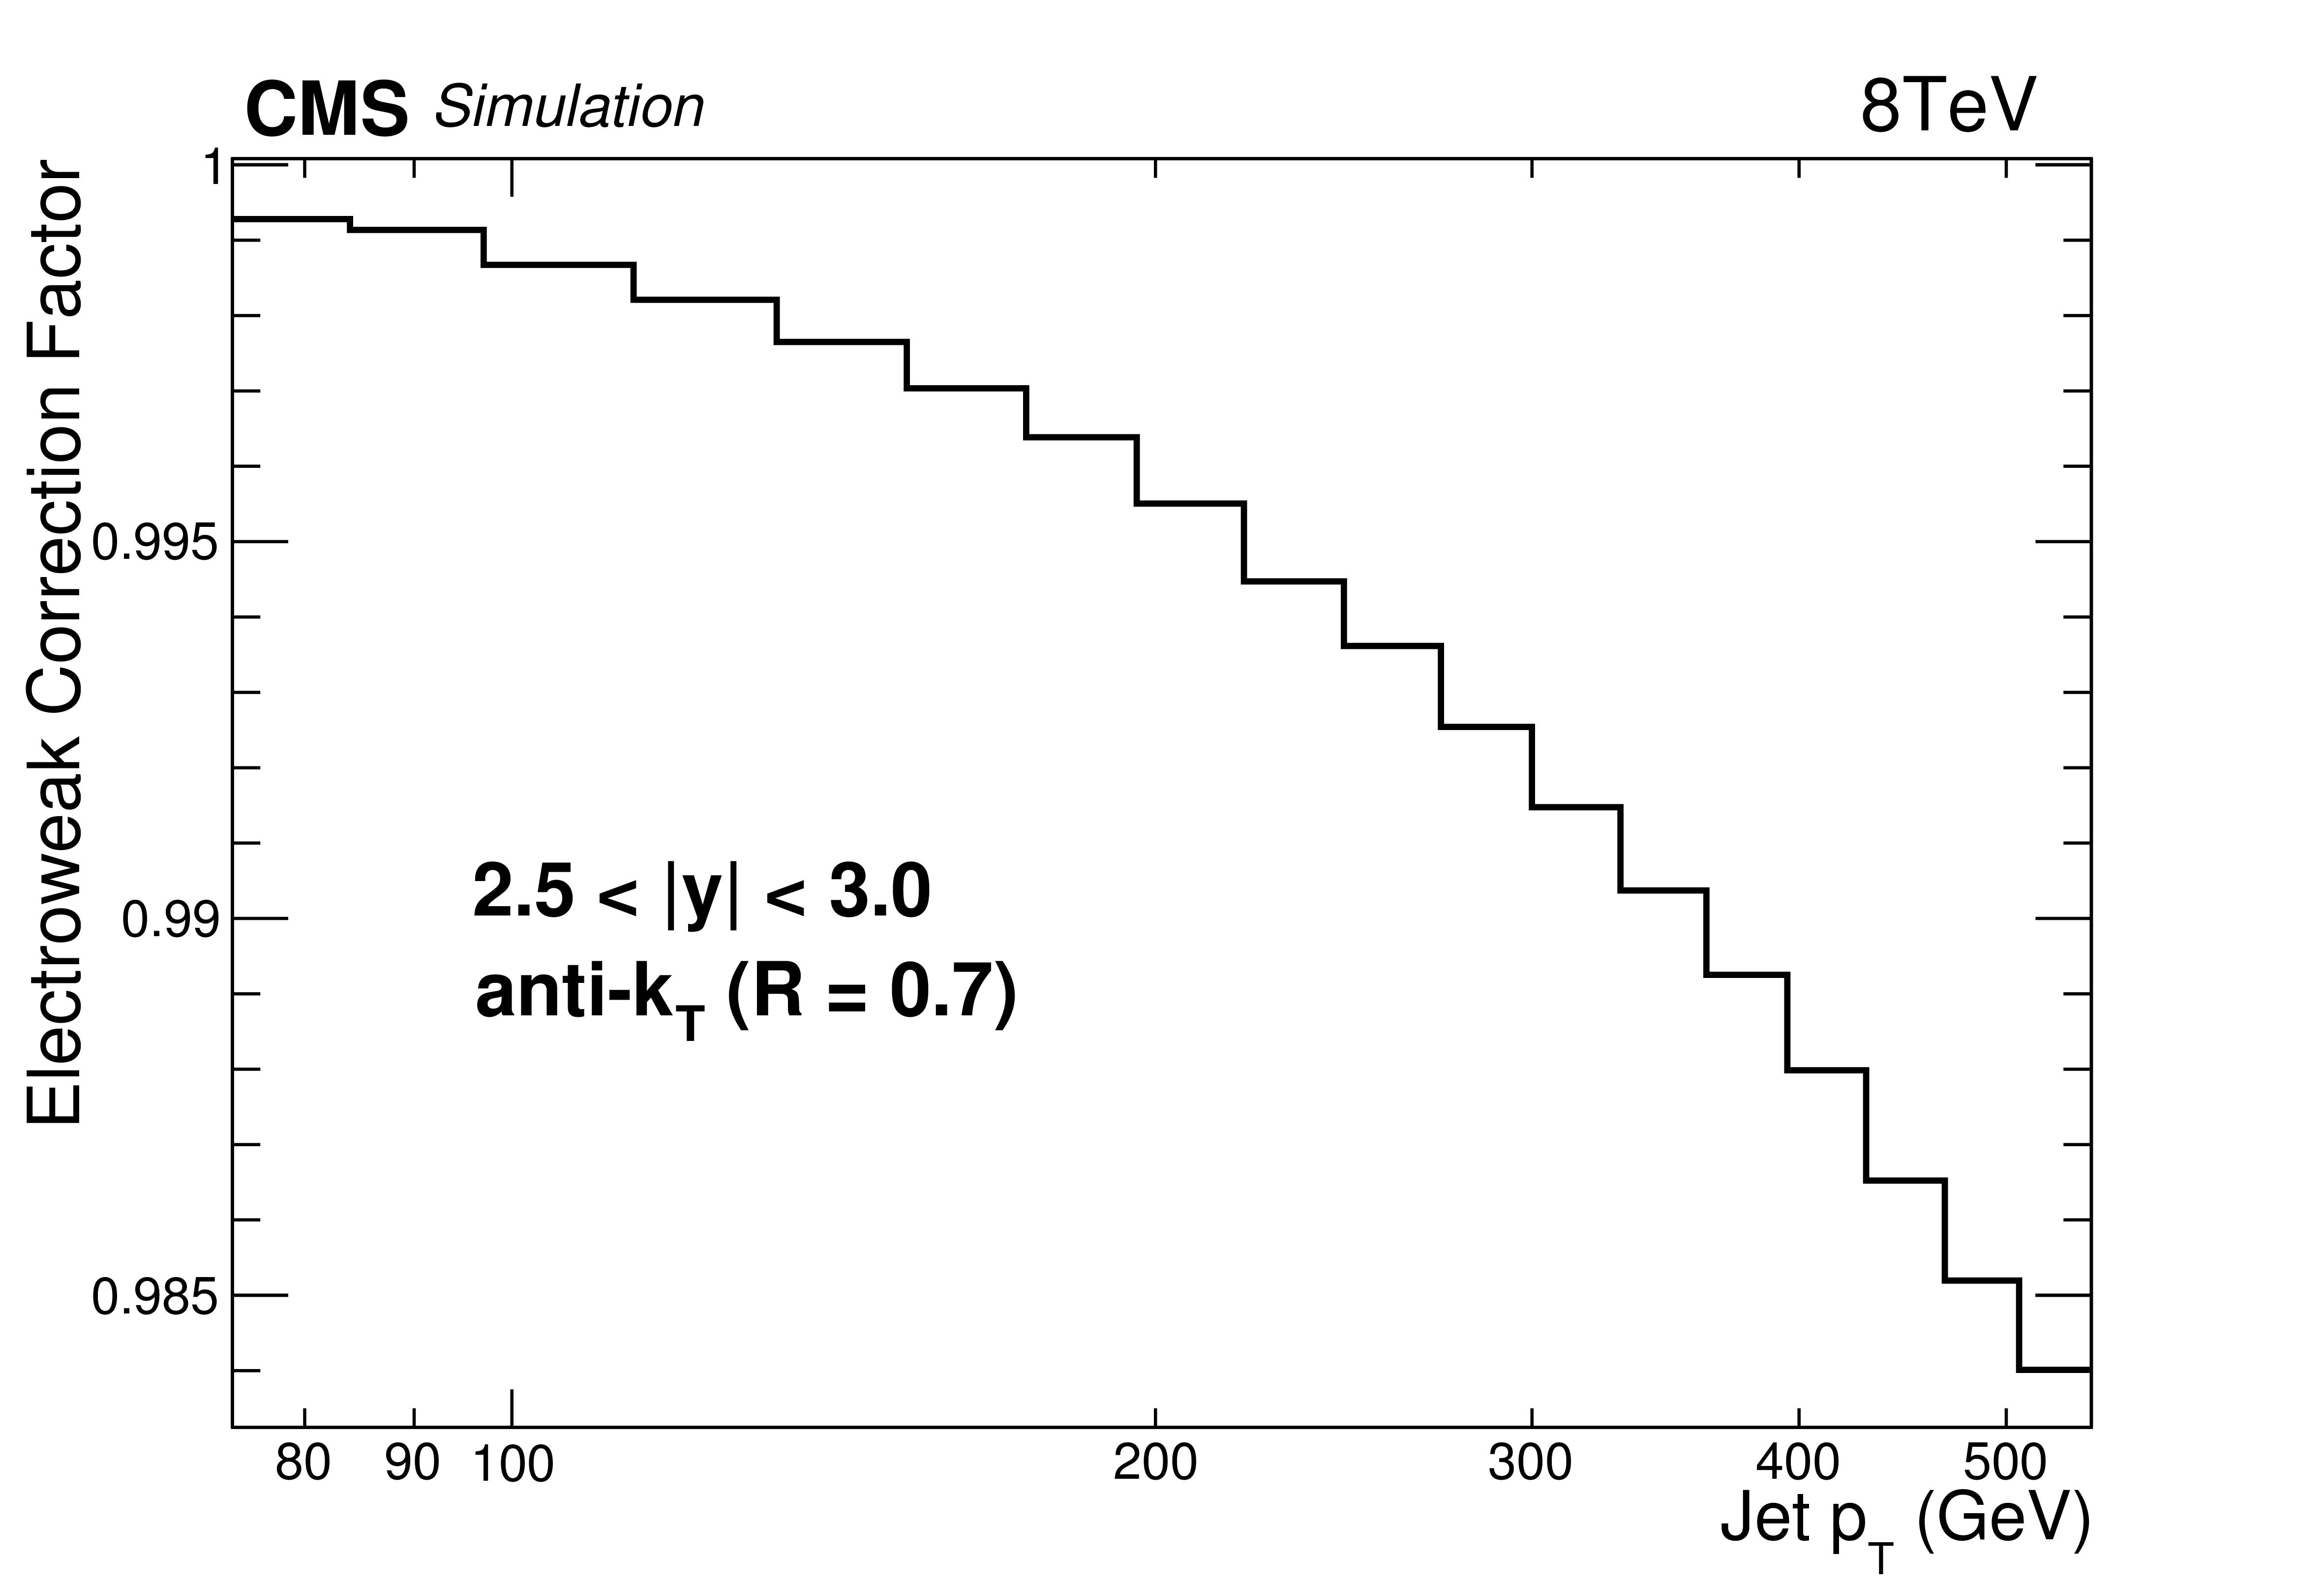
Figure 2-b:
Electroweak correction factor for the central (a) and outer most (b) rapidity bins as a function of jet $ {p_{\mathrm {T}}} $. |

png ; pdf |
Figure 3:
Double-differential inclusive jet cross section as function of jet $ {p_{\mathrm {T}}} $. Data (points) and NLO predictions based on CT10 PDF set corrected for the NP factor and electroweak correction factor (line). The comparison is carried out for six different $|y|$ bins at an interval of $\Delta |y| = $ 0.5. |

png ; pdf |
Figure 4-a:
Ratio of data over theory prediction using the CT10 PDF set. For comparison the total theoretical (band enclosed by dashed lines) and the total experimental systematic uncertainty (shaded band) are shown as well. The error bars correspond to the statistical uncertainty of the data. |

png ; pdf |
Figure 4-b:
Ratio of data over theory prediction using the CT10 PDF set. For comparison the total theoretical (band enclosed by dashed lines) and the total experimental systematic uncertainty (shaded band) are shown as well. The error bars correspond to the statistical uncertainty of the data. |

png ; pdf |
Figure 4-c:
Ratio of data over theory prediction using the CT10 PDF set. For comparison the total theoretical (band enclosed by dashed lines) and the total experimental systematic uncertainty (shaded band) are shown as well. The error bars correspond to the statistical uncertainty of the data. |

png ; pdf |
Figure 4-d:
Ratio of data over theory prediction using the CT10 PDF set. For comparison the total theoretical (band enclosed by dashed lines) and the total experimental systematic uncertainty (shaded band) are shown as well. The error bars correspond to the statistical uncertainty of the data. |

png ; pdf |
Figure 4-e:
Ratio of data over theory prediction using the CT10 PDF set. For comparison the total theoretical (band enclosed by dashed lines) and the total experimental systematic uncertainty (shaded band) are shown as well. The error bars correspond to the statistical uncertainty of the data. |

png ; pdf |
Figure 4-f:
Ratio of data over theory prediction using the CT10 PDF set. For comparison the total theoretical (band enclosed by dashed lines) and the total experimental systematic uncertainty (shaded band) are shown as well. The error bars correspond to the statistical uncertainty of the data. |

png ; pdf |
Figure 5-a:
Ratio of data over theory prediction using the the CT10 PDF set. For comparison predictions employing five other PDF sets are shown in addition to the total theoretical (band enclosed by dashed black lines) and total experimental systematic uncertainty (shaded band). The error bars correspond to the statistical uncertainty of the data. |

png ; pdf |
Figure 5-b:
Ratio of data over theory prediction using the the CT10 PDF set. For comparison predictions employing five other PDF sets are shown in addition to the total theoretical (band enclosed by dashed black lines) and total experimental systematic uncertainty (shaded band). The error bars correspond to the statistical uncertainty of the data. |

png ; pdf |
Figure 5-c:
Ratio of data over theory prediction using the the CT10 PDF set. For comparison predictions employing five other PDF sets are shown in addition to the total theoretical (band enclosed by dashed black lines) and total experimental systematic uncertainty (shaded band). The error bars correspond to the statistical uncertainty of the data. |
png ; pdf |
Figure 5-d:
Ratio of data over theory prediction using the the CT10 PDF set. For comparison predictions employing five other PDF sets are shown in addition to the total theoretical (band enclosed by dashed black lines) and total experimental systematic uncertainty (shaded band). The error bars correspond to the statistical uncertainty of the data. |
png ; pdf |
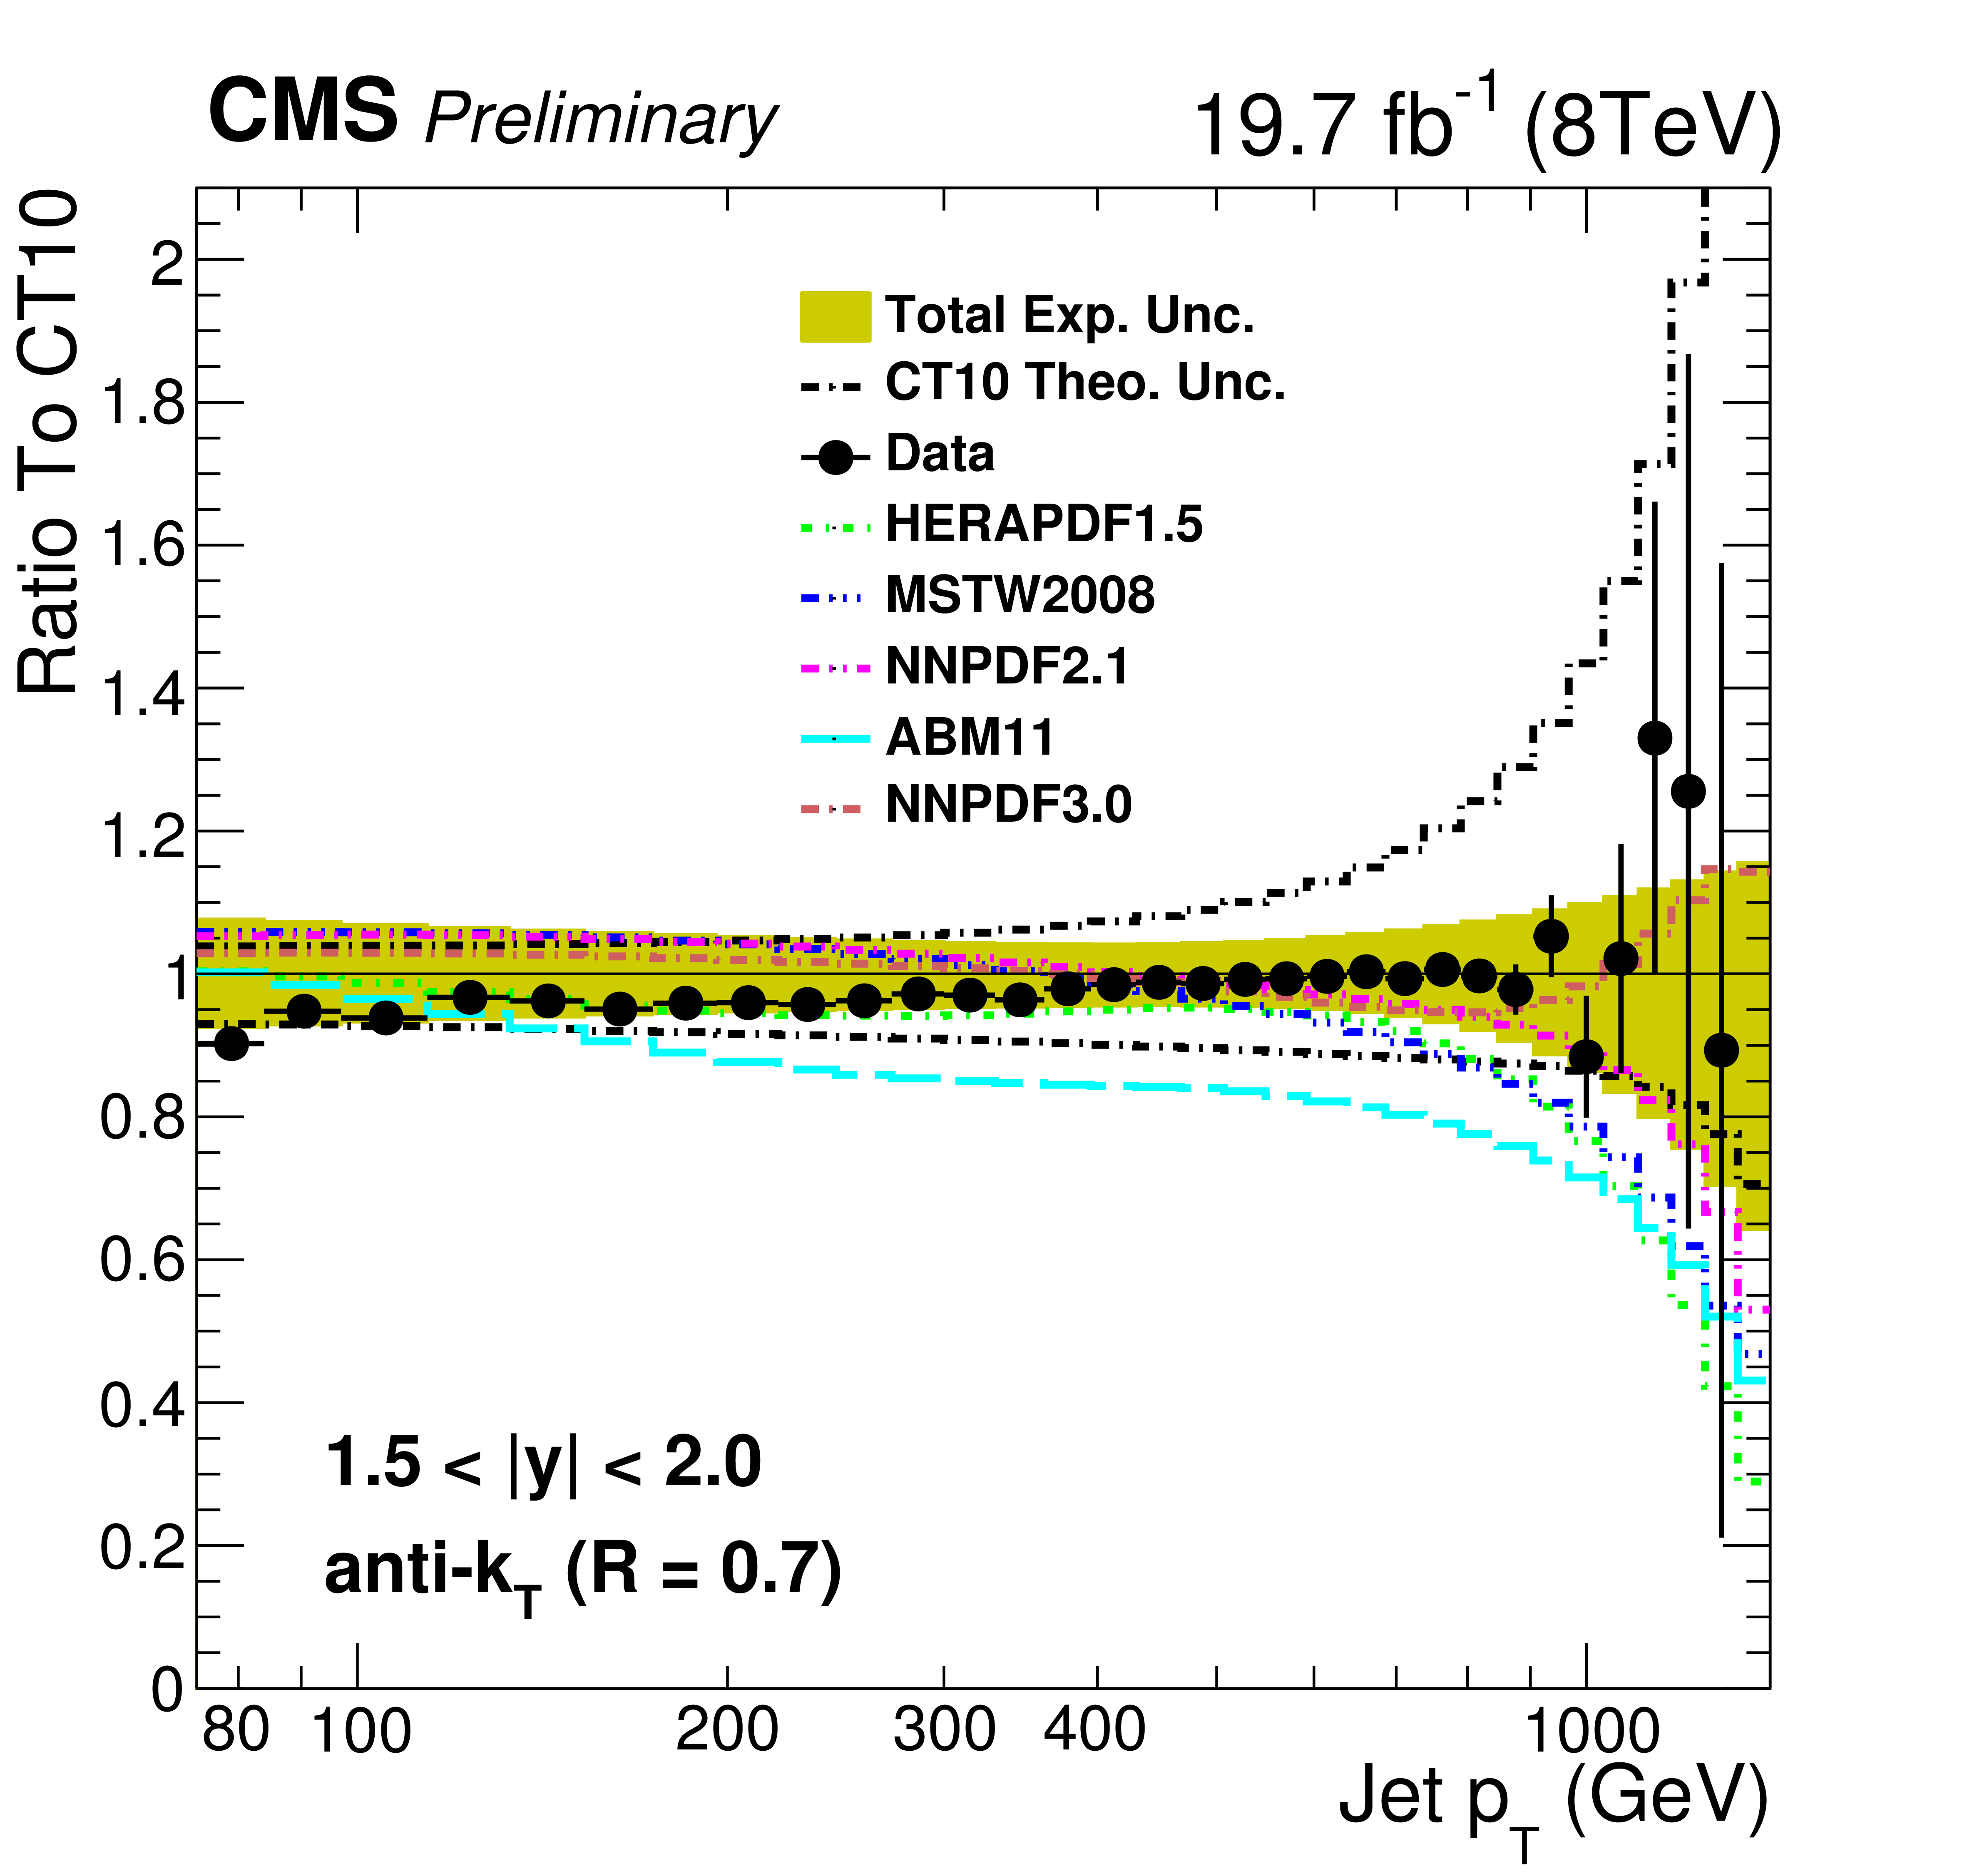
Figure 5-e:
Ratio of data over theory prediction using the the CT10 PDF set. For comparison predictions employing five other PDF sets are shown in addition to the total theoretical (band enclosed by dashed black lines) and total experimental systematic uncertainty (shaded band). The error bars correspond to the statistical uncertainty of the data. |

png ; pdf |
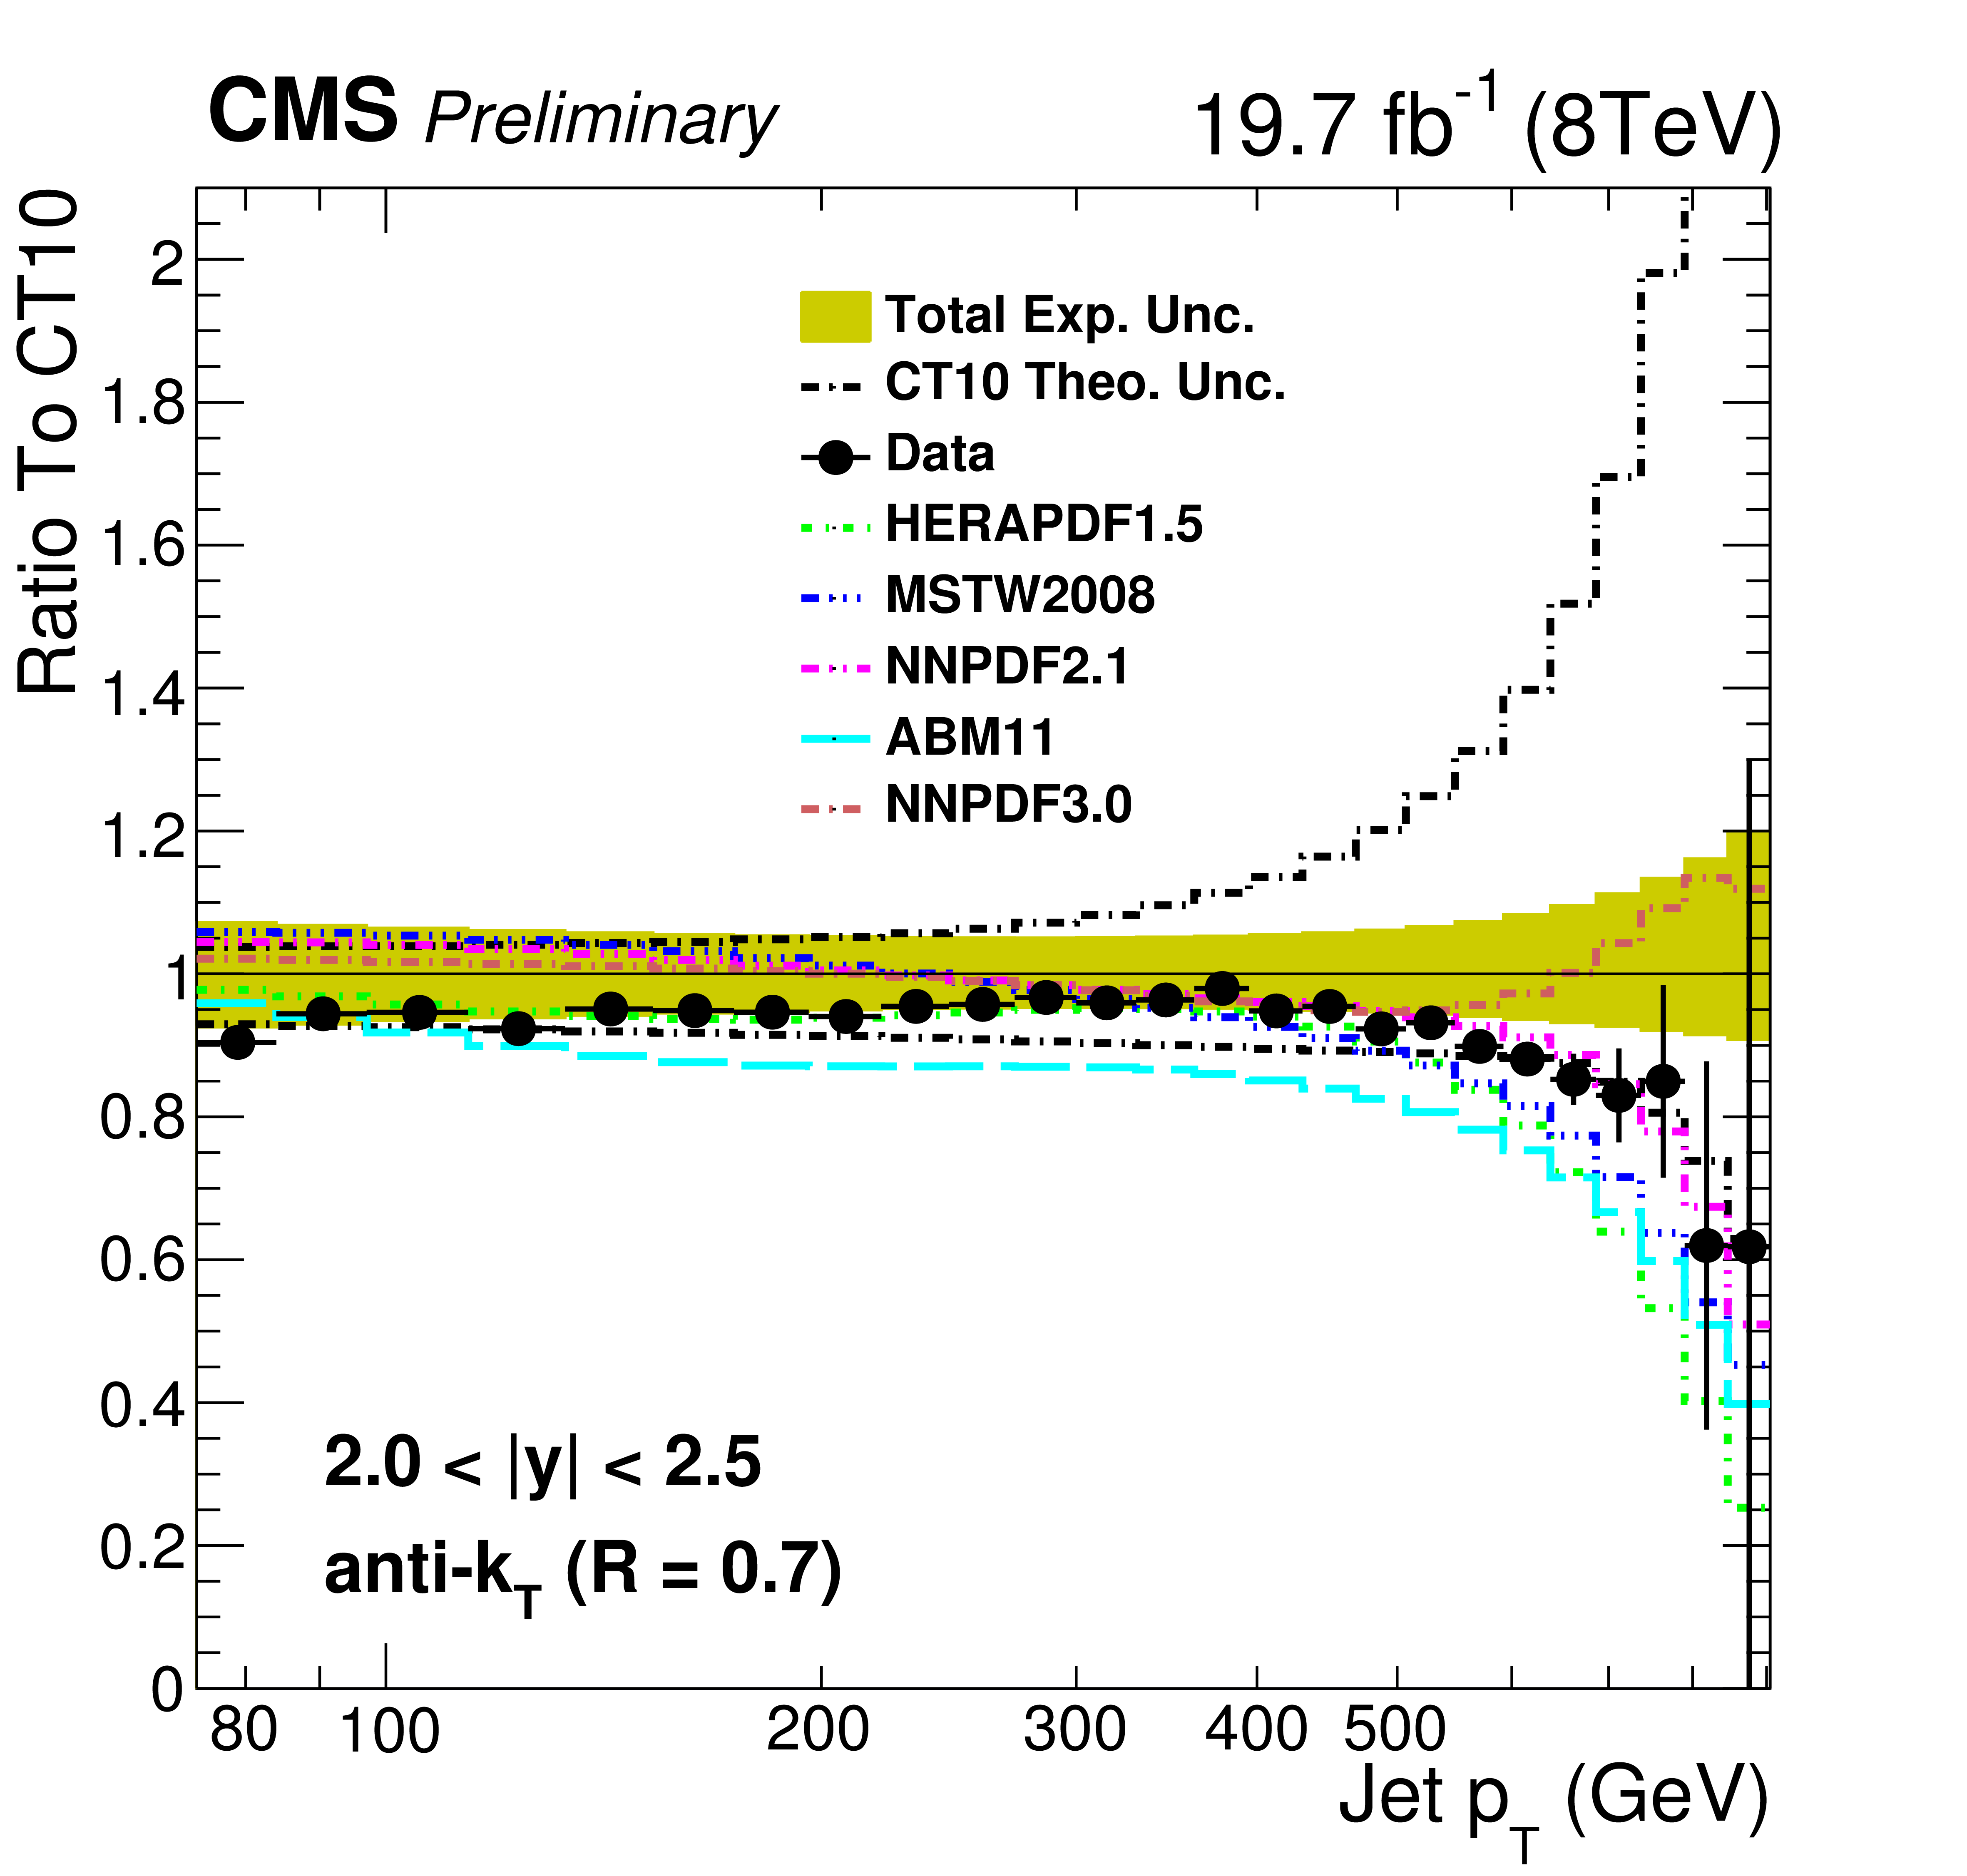
Figure 5-f:
Ratio of data over theory prediction using the the CT10 PDF set. For comparison predictions employing five other PDF sets are shown in addition to the total theoretical (band enclosed by dashed black lines) and total experimental systematic uncertainty (shaded band). The error bars correspond to the statistical uncertainty of the data. |

png ; pdf |
Figure 6-a:
Ratio of double-differential inclusive jet cross sections between $ \sqrt {s}=$ 8 TeV and $\sqrt {s}=$ 7 TeV for rapidity bins 0.0 $< |y| <$ 0.5 (a) and 0.5 $< |y| <$ 1.0 (b). In the top plots the yellow band shows the total experimental uncertainty, accounting for the correlation between different energies, and the theoretical prediction for the CT10 PDF set is overlaid. Bottom plots show the ratio of the measured cross section ratio to its theoretical prediction, with the experimental uncertainty shown as a full line band, and theoretical uncertainties as a shaded band. |

png ; pdf |
Figure 6-b:
Ratio of double-differential inclusive jet cross sections between $ \sqrt {s}=$ 8 TeV and $\sqrt {s}=$ 7 TeV for rapidity bins 0.0 $< |y| <$ 0.5 (a) and 0.5 $< |y| <$ 1.0 (b). In the top plots the yellow band shows the total experimental uncertainty, accounting for the correlation between different energies, and the theoretical prediction for the CT10 PDF set is overlaid. Bottom plots show the ratio of the measured cross section ratio to its theoretical prediction, with the experimental uncertainty shown as a full line band, and theoretical uncertainties as a shaded band. |
png ; pdf |
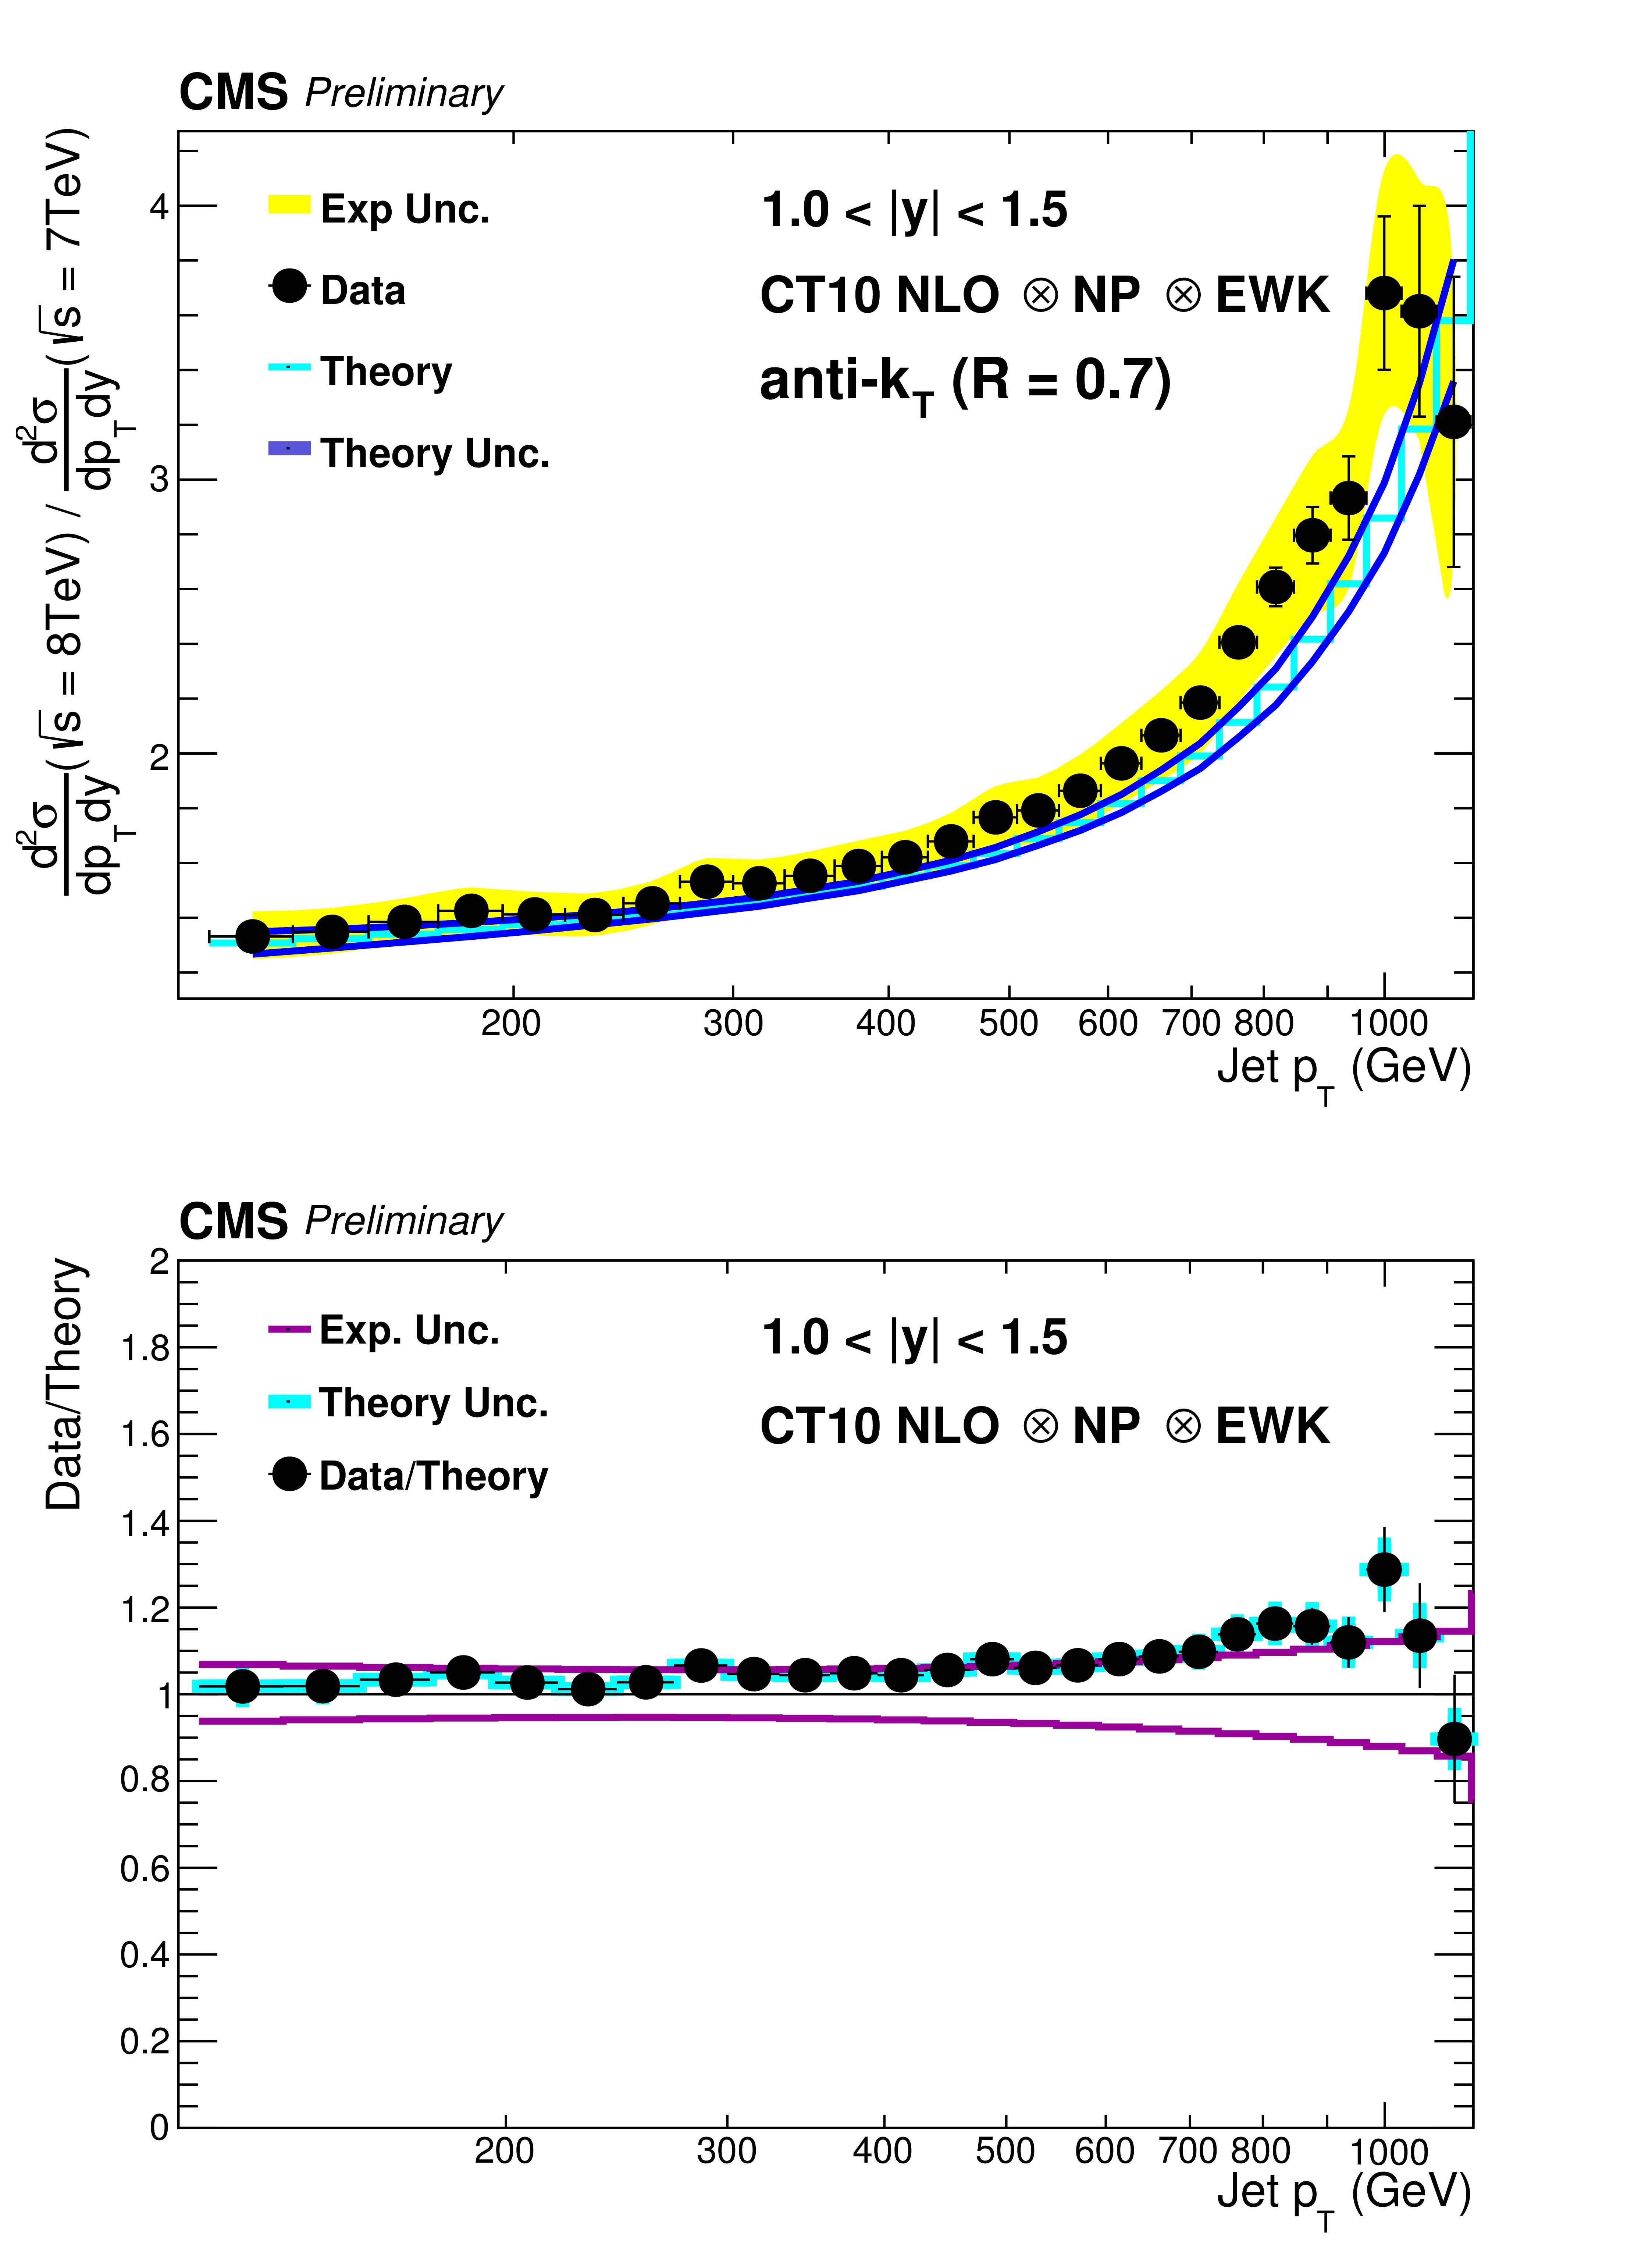
Figure 7-a:
Ratio of double-differential inclusive jet cross sections between $ \sqrt {s}= $ 8 TeV and $ \sqrt {s}=$ 7 TeV for rapidity bins 1.0 $< |y| <$ 1.5 (a) and 1.5 $< |y| <$ 2.0 (b). In the top plots the yellow band shows the total experimental uncertainty, accounting for the correlation between different energies, and the theoretical prediction for the CT10 PDF set is overlaid. The bottom plot shows the ratio of the measured cross section ratio to its theoretical prediction, with the experimental uncertainty shown as a full line band, and theoretical uncertainties as a shaded band. |

png ; pdf |
Figure 7-b:
Ratio of double-differential inclusive jet cross sections between $ \sqrt {s}= $ 8 TeV and $ \sqrt {s}=$ 7 TeV for rapidity bins 1.0 $< |y| <$ 1.5 (a) and 1.5 $< |y| <$ 2.0 (b). In the top plots the yellow band shows the total experimental uncertainty, accounting for the correlation between different energies, and the theoretical prediction for the CT10 PDF set is overlaid. The bottom plot shows the ratio of the measured cross section ratio to its theoretical prediction, with the experimental uncertainty shown as a full line band, and theoretical uncertainties as a shaded band. |

png ; pdf |
Figure 8:
Ratio of double-differential inclusive jet cross sections between $\sqrt {s}=$ 8 TeV and $\sqrt {s}=$ 7 TeV for the rapidity bin 2.0 $< |y| <$ 2.5. In the top plot the yellow band shows the total experimental uncertainty, accounting for the correlation between different energies, and the theoretical prediction for the CT10 PDF set is overlaid. Bottom plots show the ratio of the measured cross section ratio to its theoretical prediction, with the experimental uncertainty shown as a full line band, and theoretical uncertainties as a shaded band. |

png ; pdf |
Figure 9-a:
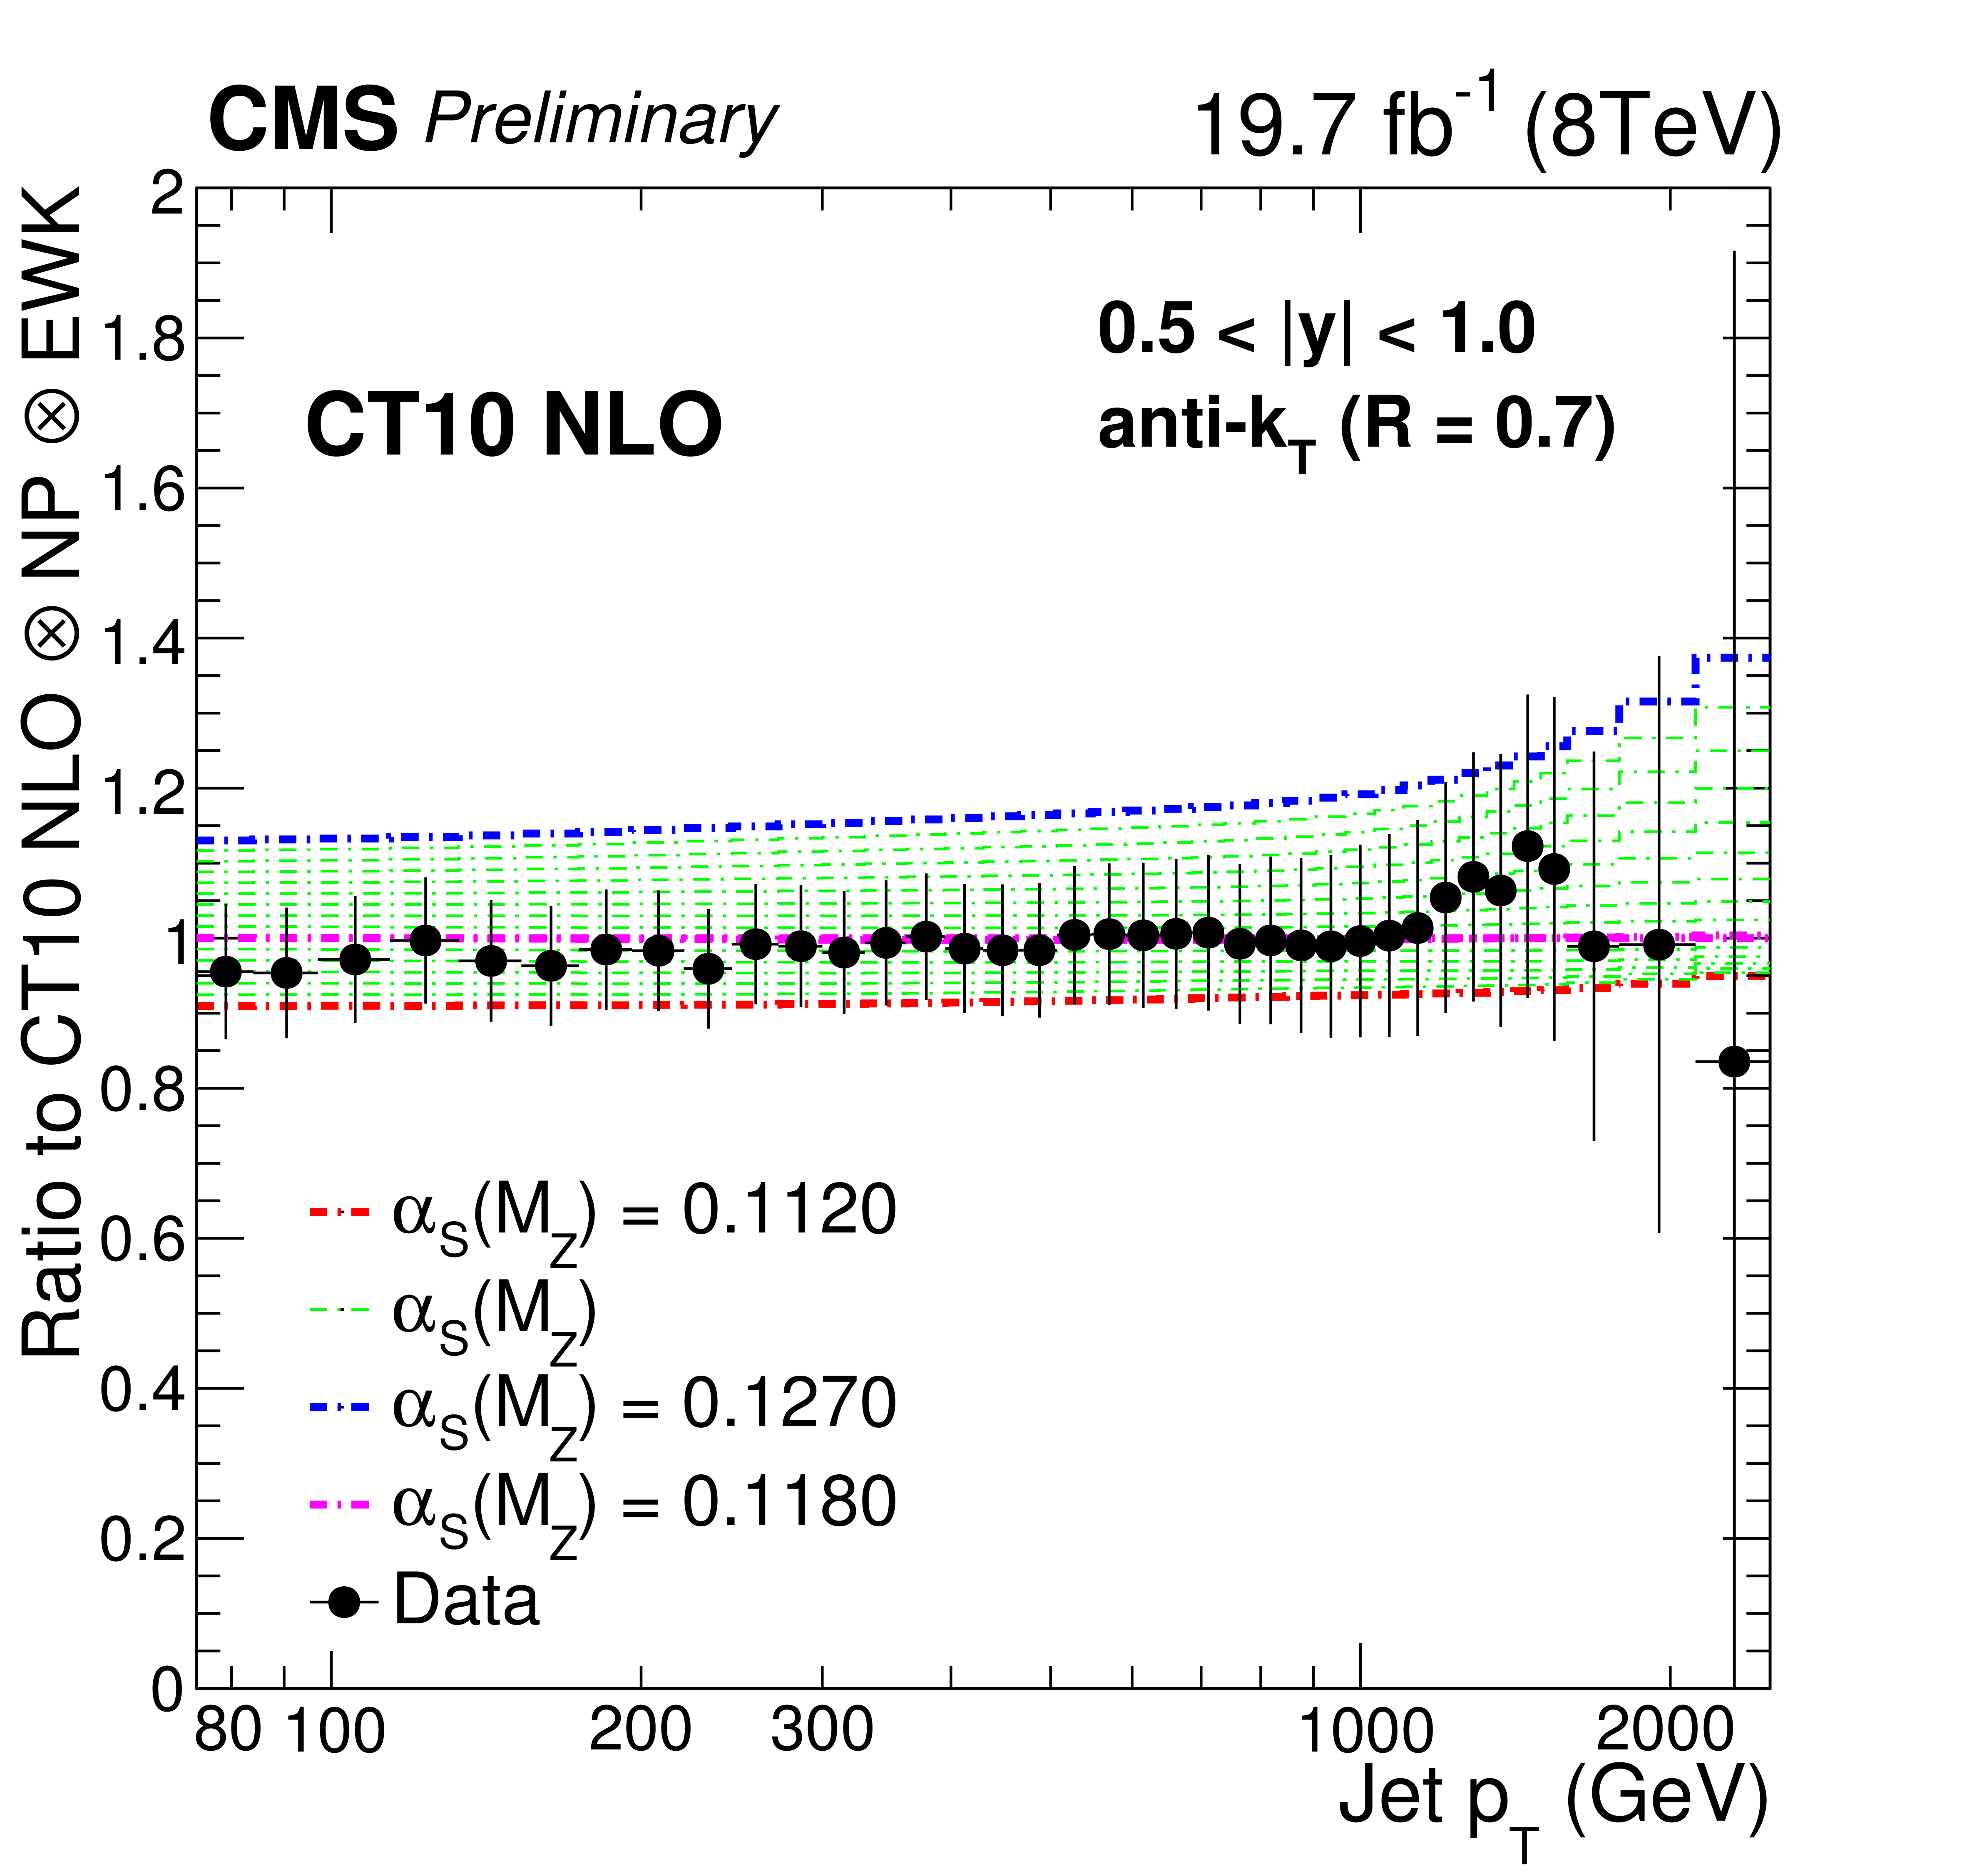
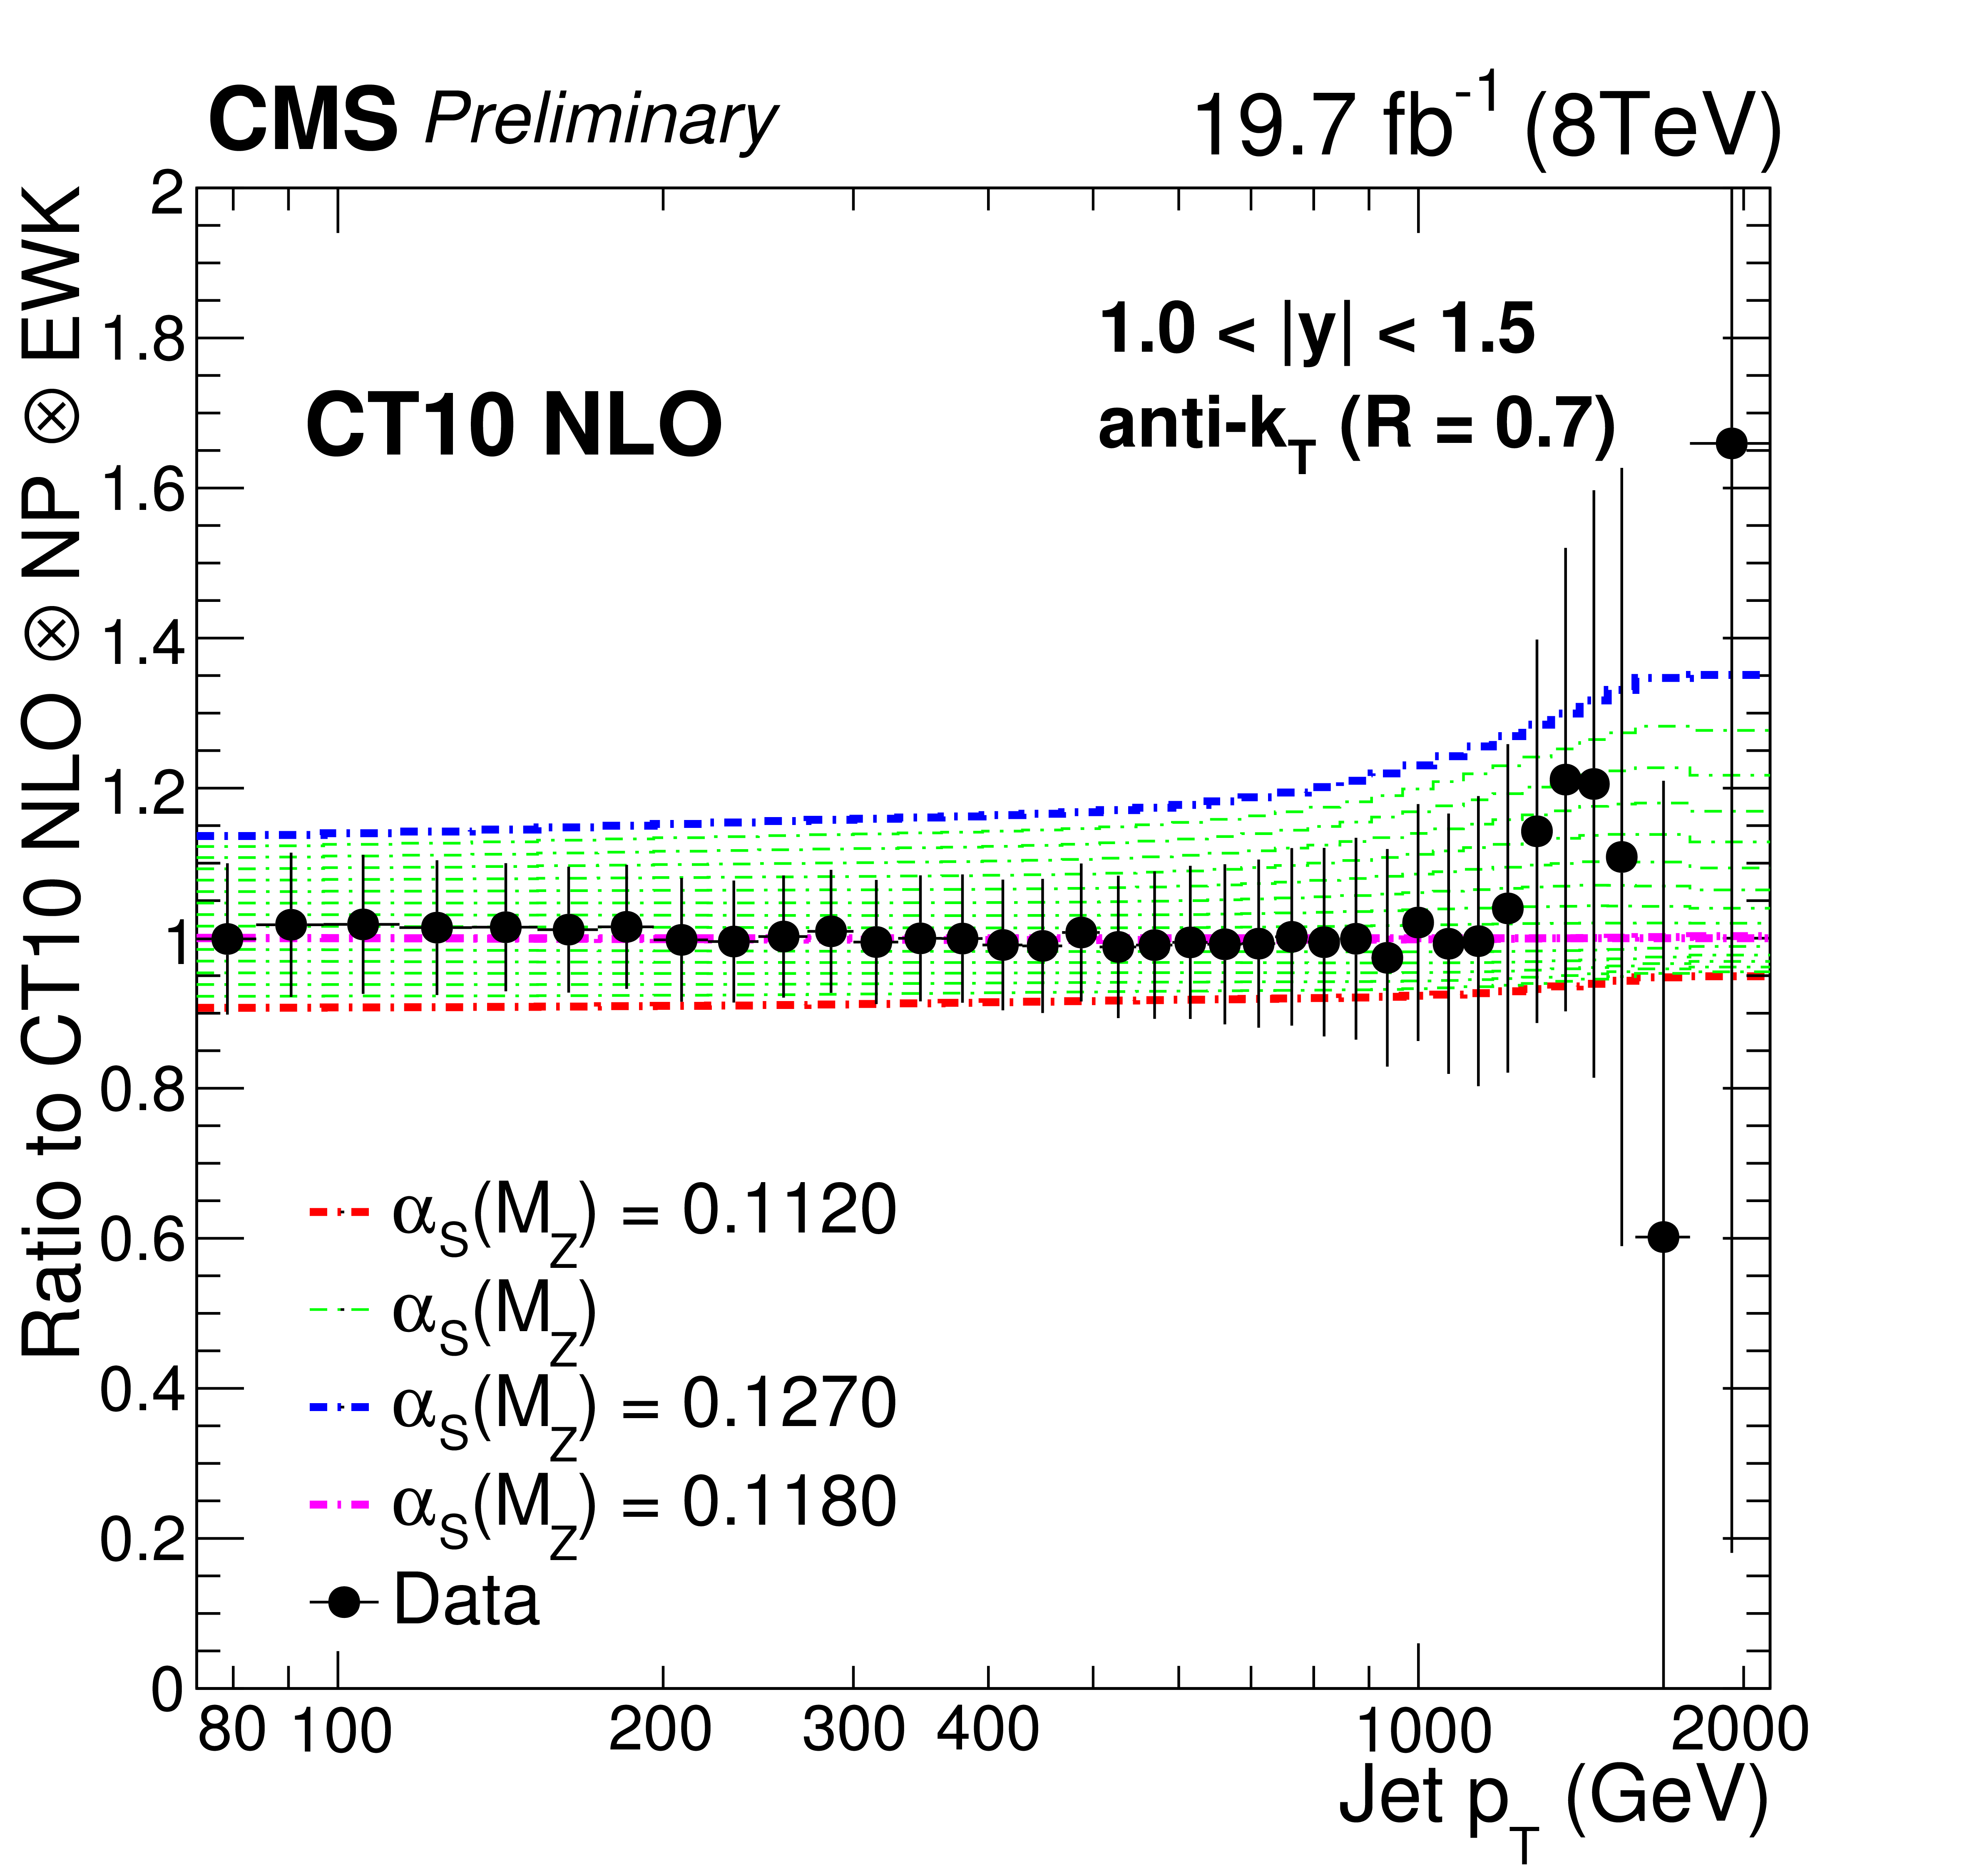
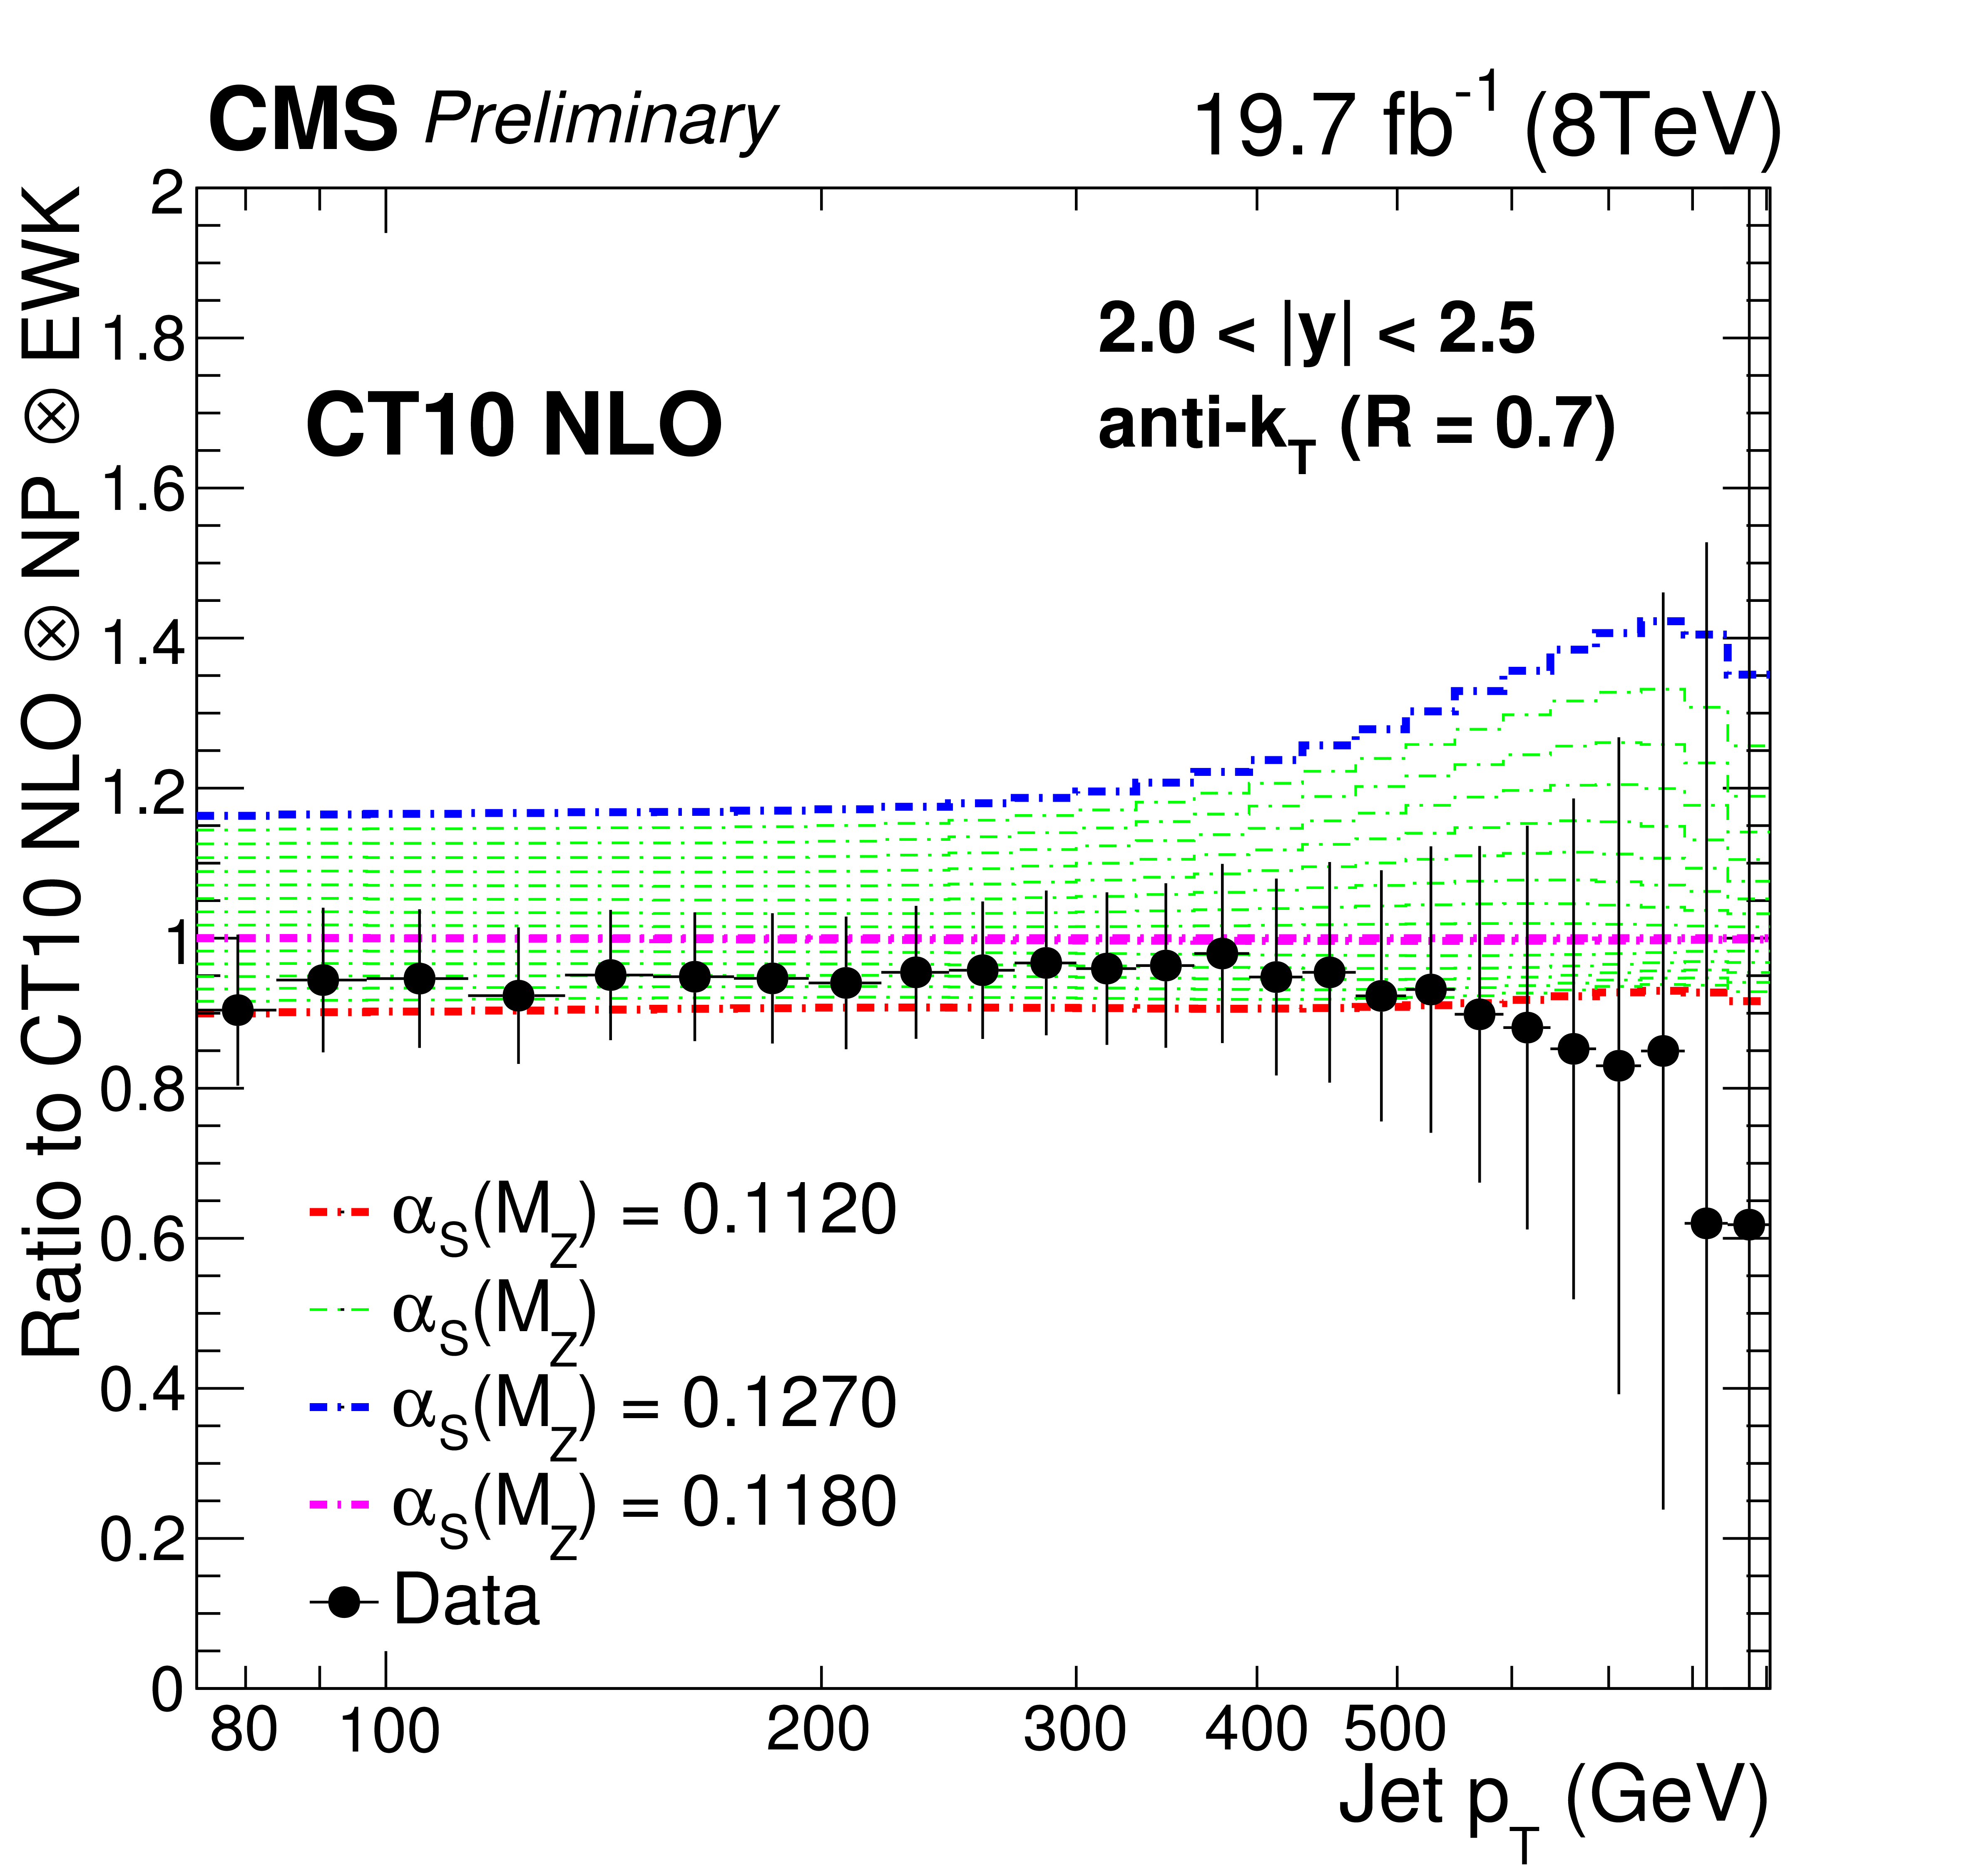
Ratio of data over theory prediction using the the CT10 NLO PDF set, where the $ {\alpha _\mathrm {S}(\mathrm {M_Z})} $ value is varied in the range 0.112-0.127 in steps of 0.001. The error bars correspond to the total uncertainty of the data. |
png ; pdf |
Figure 9-b:
Ratio of data over theory prediction using the the CT10 NLO PDF set, where the $ {\alpha _\mathrm {S}(\mathrm {M_Z})} $ value is varied in the range 0.112-0.127 in steps of 0.001. The error bars correspond to the total uncertainty of the data. |
png ; pdf |
Figure 9-c:
Ratio of data over theory prediction using the the CT10 NLO PDF set, where the $ {\alpha _\mathrm {S}(\mathrm {M_Z})} $ value is varied in the range 0.112-0.127 in steps of 0.001. The error bars correspond to the total uncertainty of the data. |

png ; pdf |
Figure 9-d:
Ratio of data over theory prediction using the the CT10 NLO PDF set, where the $ {\alpha _\mathrm {S}(\mathrm {M_Z})} $ value is varied in the range 0.112-0.127 in steps of 0.001. The error bars correspond to the total uncertainty of the data. |
png ; pdf |
Figure 9-e:
Ratio of data over theory prediction using the the CT10 NLO PDF set, where the $ {\alpha _\mathrm {S}(\mathrm {M_Z})} $ value is varied in the range 0.112-0.127 in steps of 0.001. The error bars correspond to the total uncertainty of the data. |

png ; pdf |
Figure 9-f:
Ratio of data over theory prediction using the the CT10 NLO PDF set, where the $ {\alpha _\mathrm {S}(\mathrm {M_Z})} $ value is varied in the range 0.112-0.127 in steps of 0.001. The error bars correspond to the total uncertainty of the data. |

png ; pdf |
Figure 10:
The $\chi ^2$ minimization with respect to $ {\alpha _\mathrm {S}(\mathrm {M_Z})} $ using the CT10 NLO PDF set and data from all rapidity bins. The uncertainty is obtained from the $ {\alpha _\mathrm {S}(\mathrm {M_Z})} $ values for which $\chi ^2$ is increased by one with respect to the minimum value, indicated by the horizontal line. The curve corresponds to a fourth-degree polynomial fit through the available $\chi ^2$ points. |
png ; pdf |
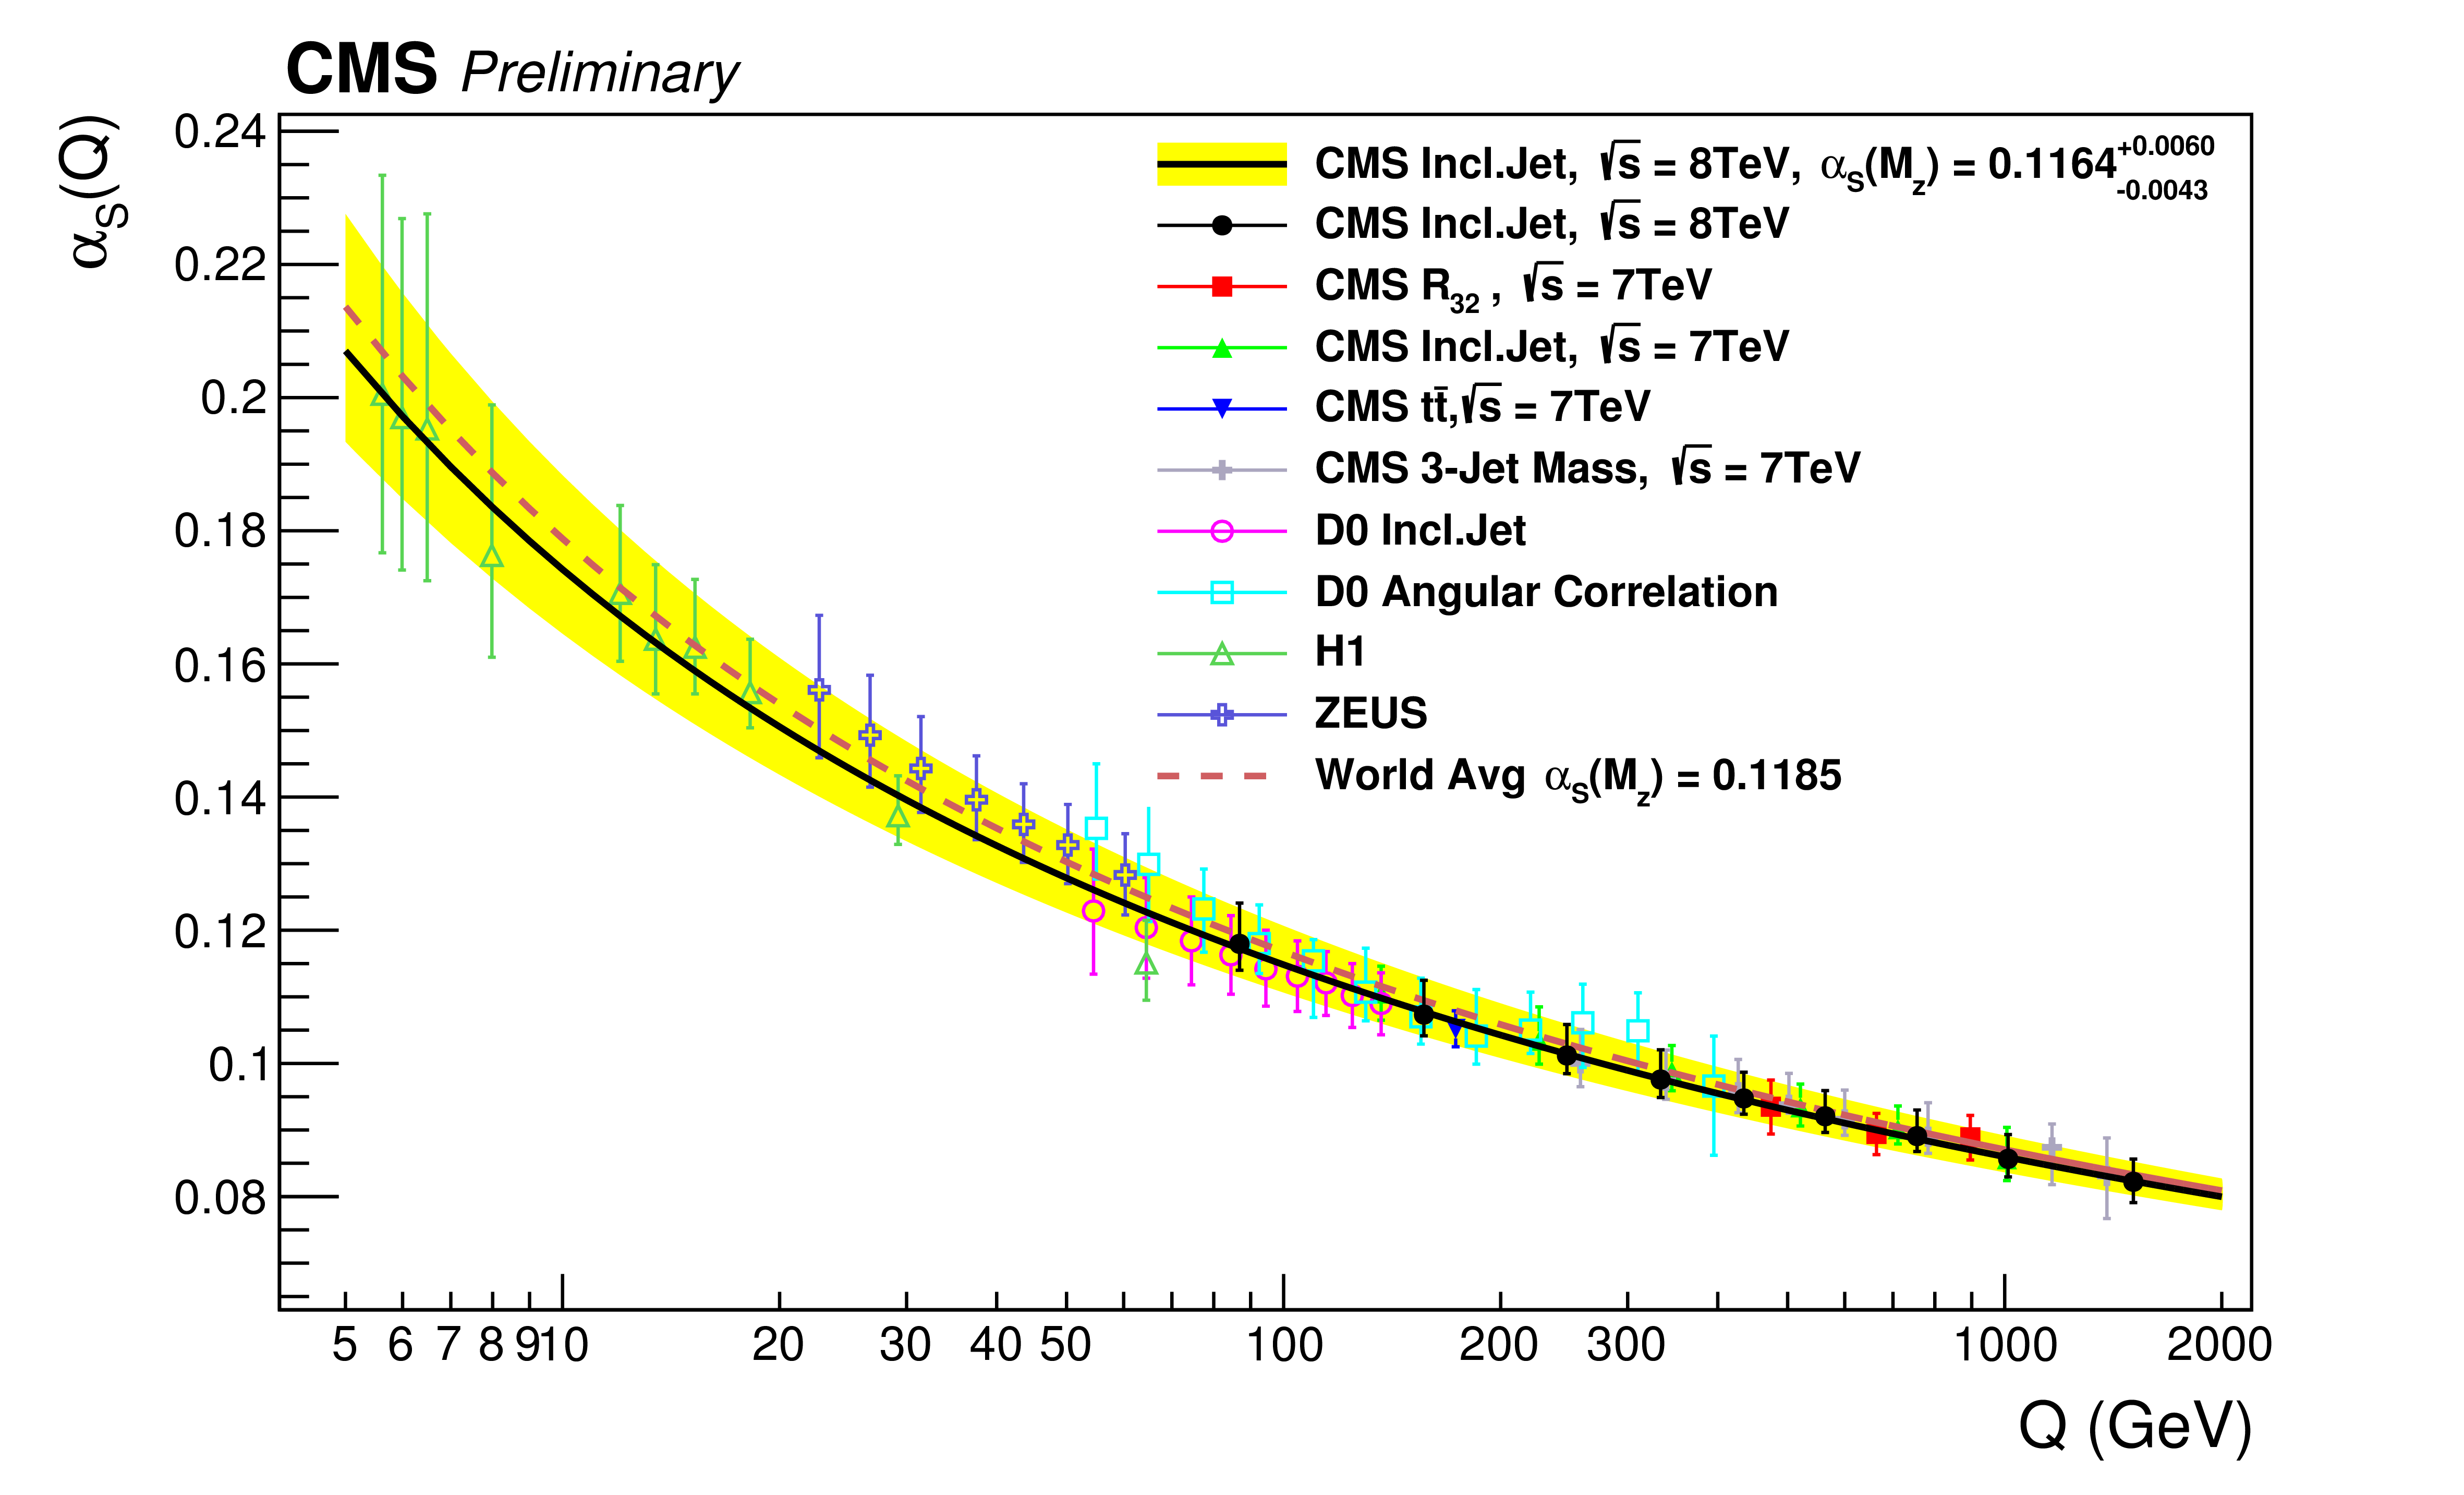
Figure 11:
The running $ {\alpha _\mathrm {S}(\mathrm {Q})} $ as a function of the scale $Q$ is shown, as obtained using CT10 NLO PDF set. The solid line and the uncertainty band are obtained evolving the extracted $ {\alpha _\mathrm {S}(\mathrm {M_Z})} $ values with the 2-loop 5-flavour RG evolution. The dashed line represents the evolution of the world average value. The black dots in the figure show the numbers obtained from $\sqrt {s}=$ 8 TeV inclusive jet measurement. Results from other CMS, D0, H1 and ZEUS measurements are superimposed. |

png ; pdf |
Figure 12-a:
Distributions of gluon (a), $ {\mathrm {u}}$-valence quark (b) $ {\mathrm {d}}$-valence quark as functions of $x$ at the starting scale $Q^2=$ 1.9 GeV$^2$. The results of the fit to the HERA data and inclusive jet measurements at 8 TeV (shaded band), and to HERA only (hatched band) are compared with their total uncertainties, as determined by using the HERAPDF method. In the bottom panels the fractional uncertainties are shown. |
png ; pdf |
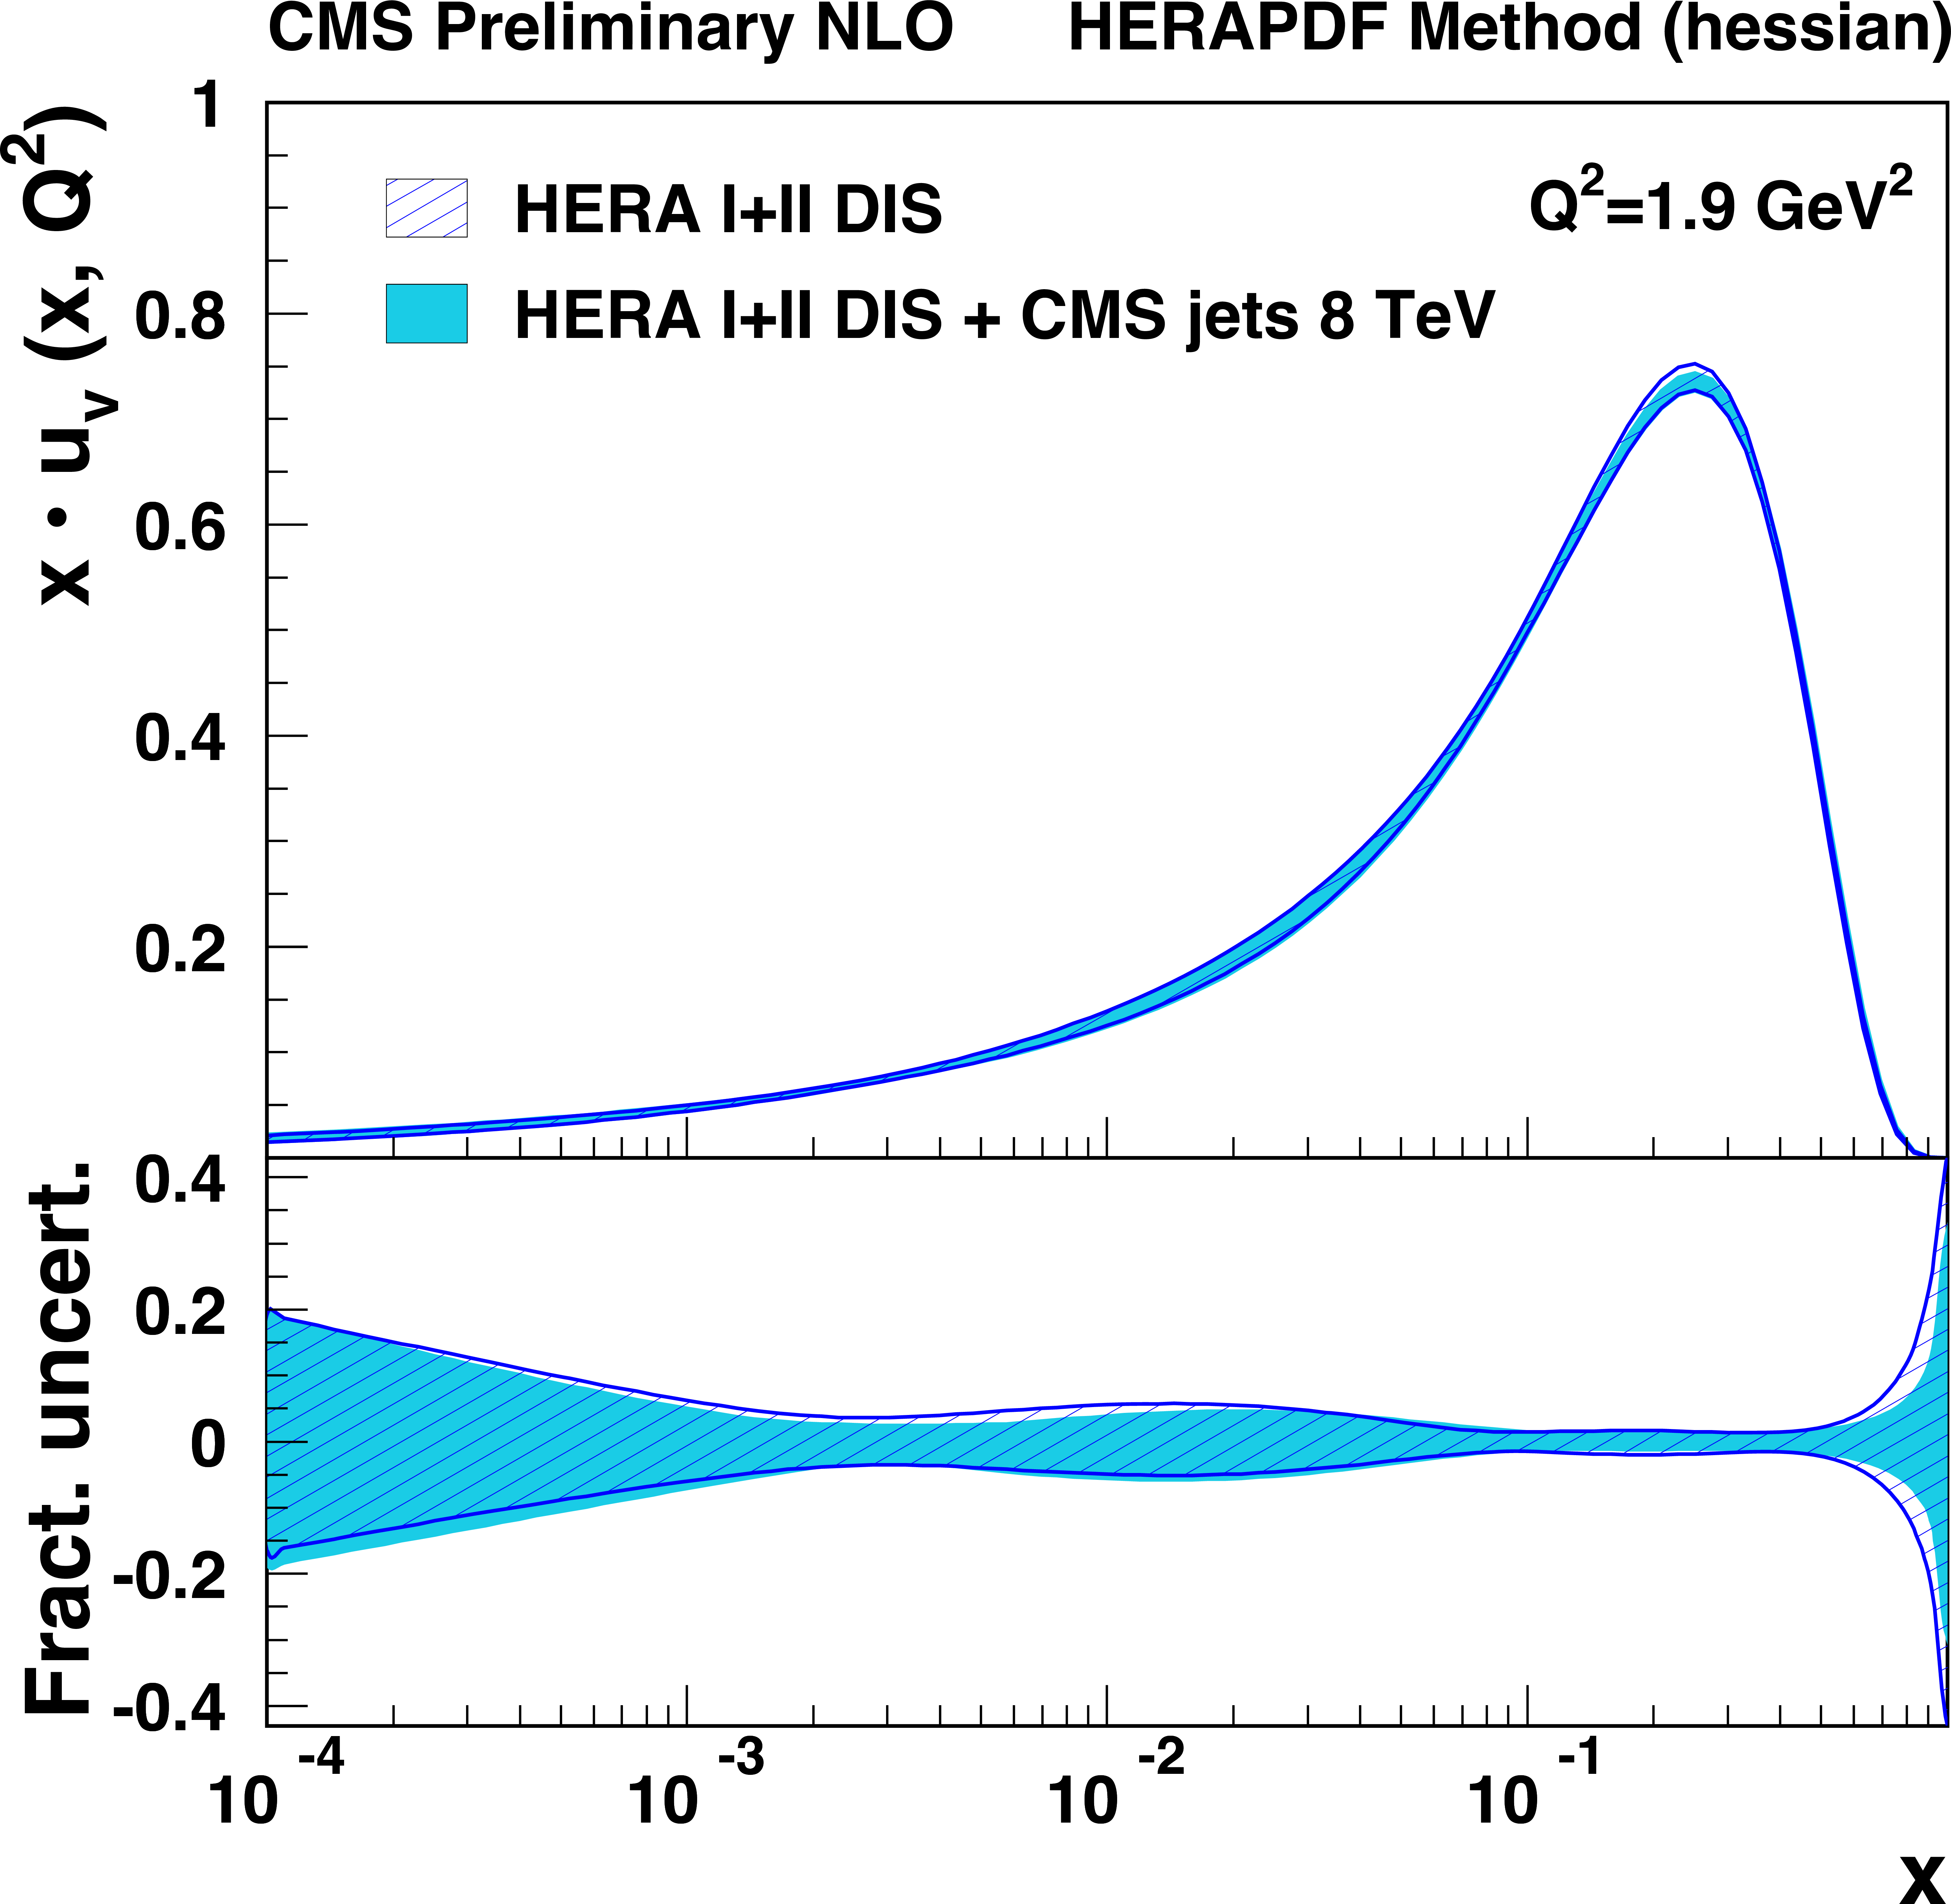
Figure 12-b:
Distributions of gluon (a), $ {\mathrm {u}}$-valence quark (b) $ {\mathrm {d}}$-valence quark as functions of $x$ at the starting scale $Q^2=$ 1.9 GeV$^2$. The results of the fit to the HERA data and inclusive jet measurements at 8 TeV (shaded band), and to HERA only (hatched band) are compared with their total uncertainties, as determined by using the HERAPDF method. In the bottom panels the fractional uncertainties are shown. |

png ; pdf |
Figure 12-c:
Distributions of gluon (a), $ {\mathrm {u}}$-valence quark (b) $ {\mathrm {d}}$-valence quark as functions of $x$ at the starting scale $Q^2=$ 1.9 GeV$^2$. The results of the fit to the HERA data and inclusive jet measurements at 8 TeV (shaded band), and to HERA only (hatched band) are compared with their total uncertainties, as determined by using the HERAPDF method. In the bottom panels the fractional uncertainties are shown. |

png ; pdf |
Figure 13-a:
Distributions of gluon (a), $ {\mathrm {u}}$-valence quark (b) $ {\mathrm {d}}$-valence quark as functions of $x$ at the starting scale $Q^2 =10^5$ GeV$^2$. The results of the fit to the HERA data and inclusive jet measurements at 8 TeV (shaded band), and to HERA only (hatched band) are compared with their total uncertainties, as determined by using the HERAPDF method. In the bottom panels the fractional uncertainties are shown. |

png ; pdf |
Figure 13-b:
Distributions of gluon (a), $ {\mathrm {u}}$-valence quark (b) $ {\mathrm {d}}$-valence quark as functions of $x$ at the starting scale $Q^2 =10^5$ GeV$^2$. The results of the fit to the HERA data and inclusive jet measurements at 8 TeV (shaded band), and to HERA only (hatched band) are compared with their total uncertainties, as determined by using the HERAPDF method. In the bottom panels the fractional uncertainties are shown. |

png ; pdf |
Figure 13-c:
Distributions of gluon (a), $ {\mathrm {u}}$-valence quark (b) $ {\mathrm {d}}$-valence quark as functions of $x$ at the starting scale $Q^2 =10^5$ GeV$^2$. The results of the fit to the HERA data and inclusive jet measurements at 8 TeV (shaded band), and to HERA only (hatched band) are compared with their total uncertainties, as determined by using the HERAPDF method. In the bottom panels the fractional uncertainties are shown. |
png ; pdf |
Figure 14-a:
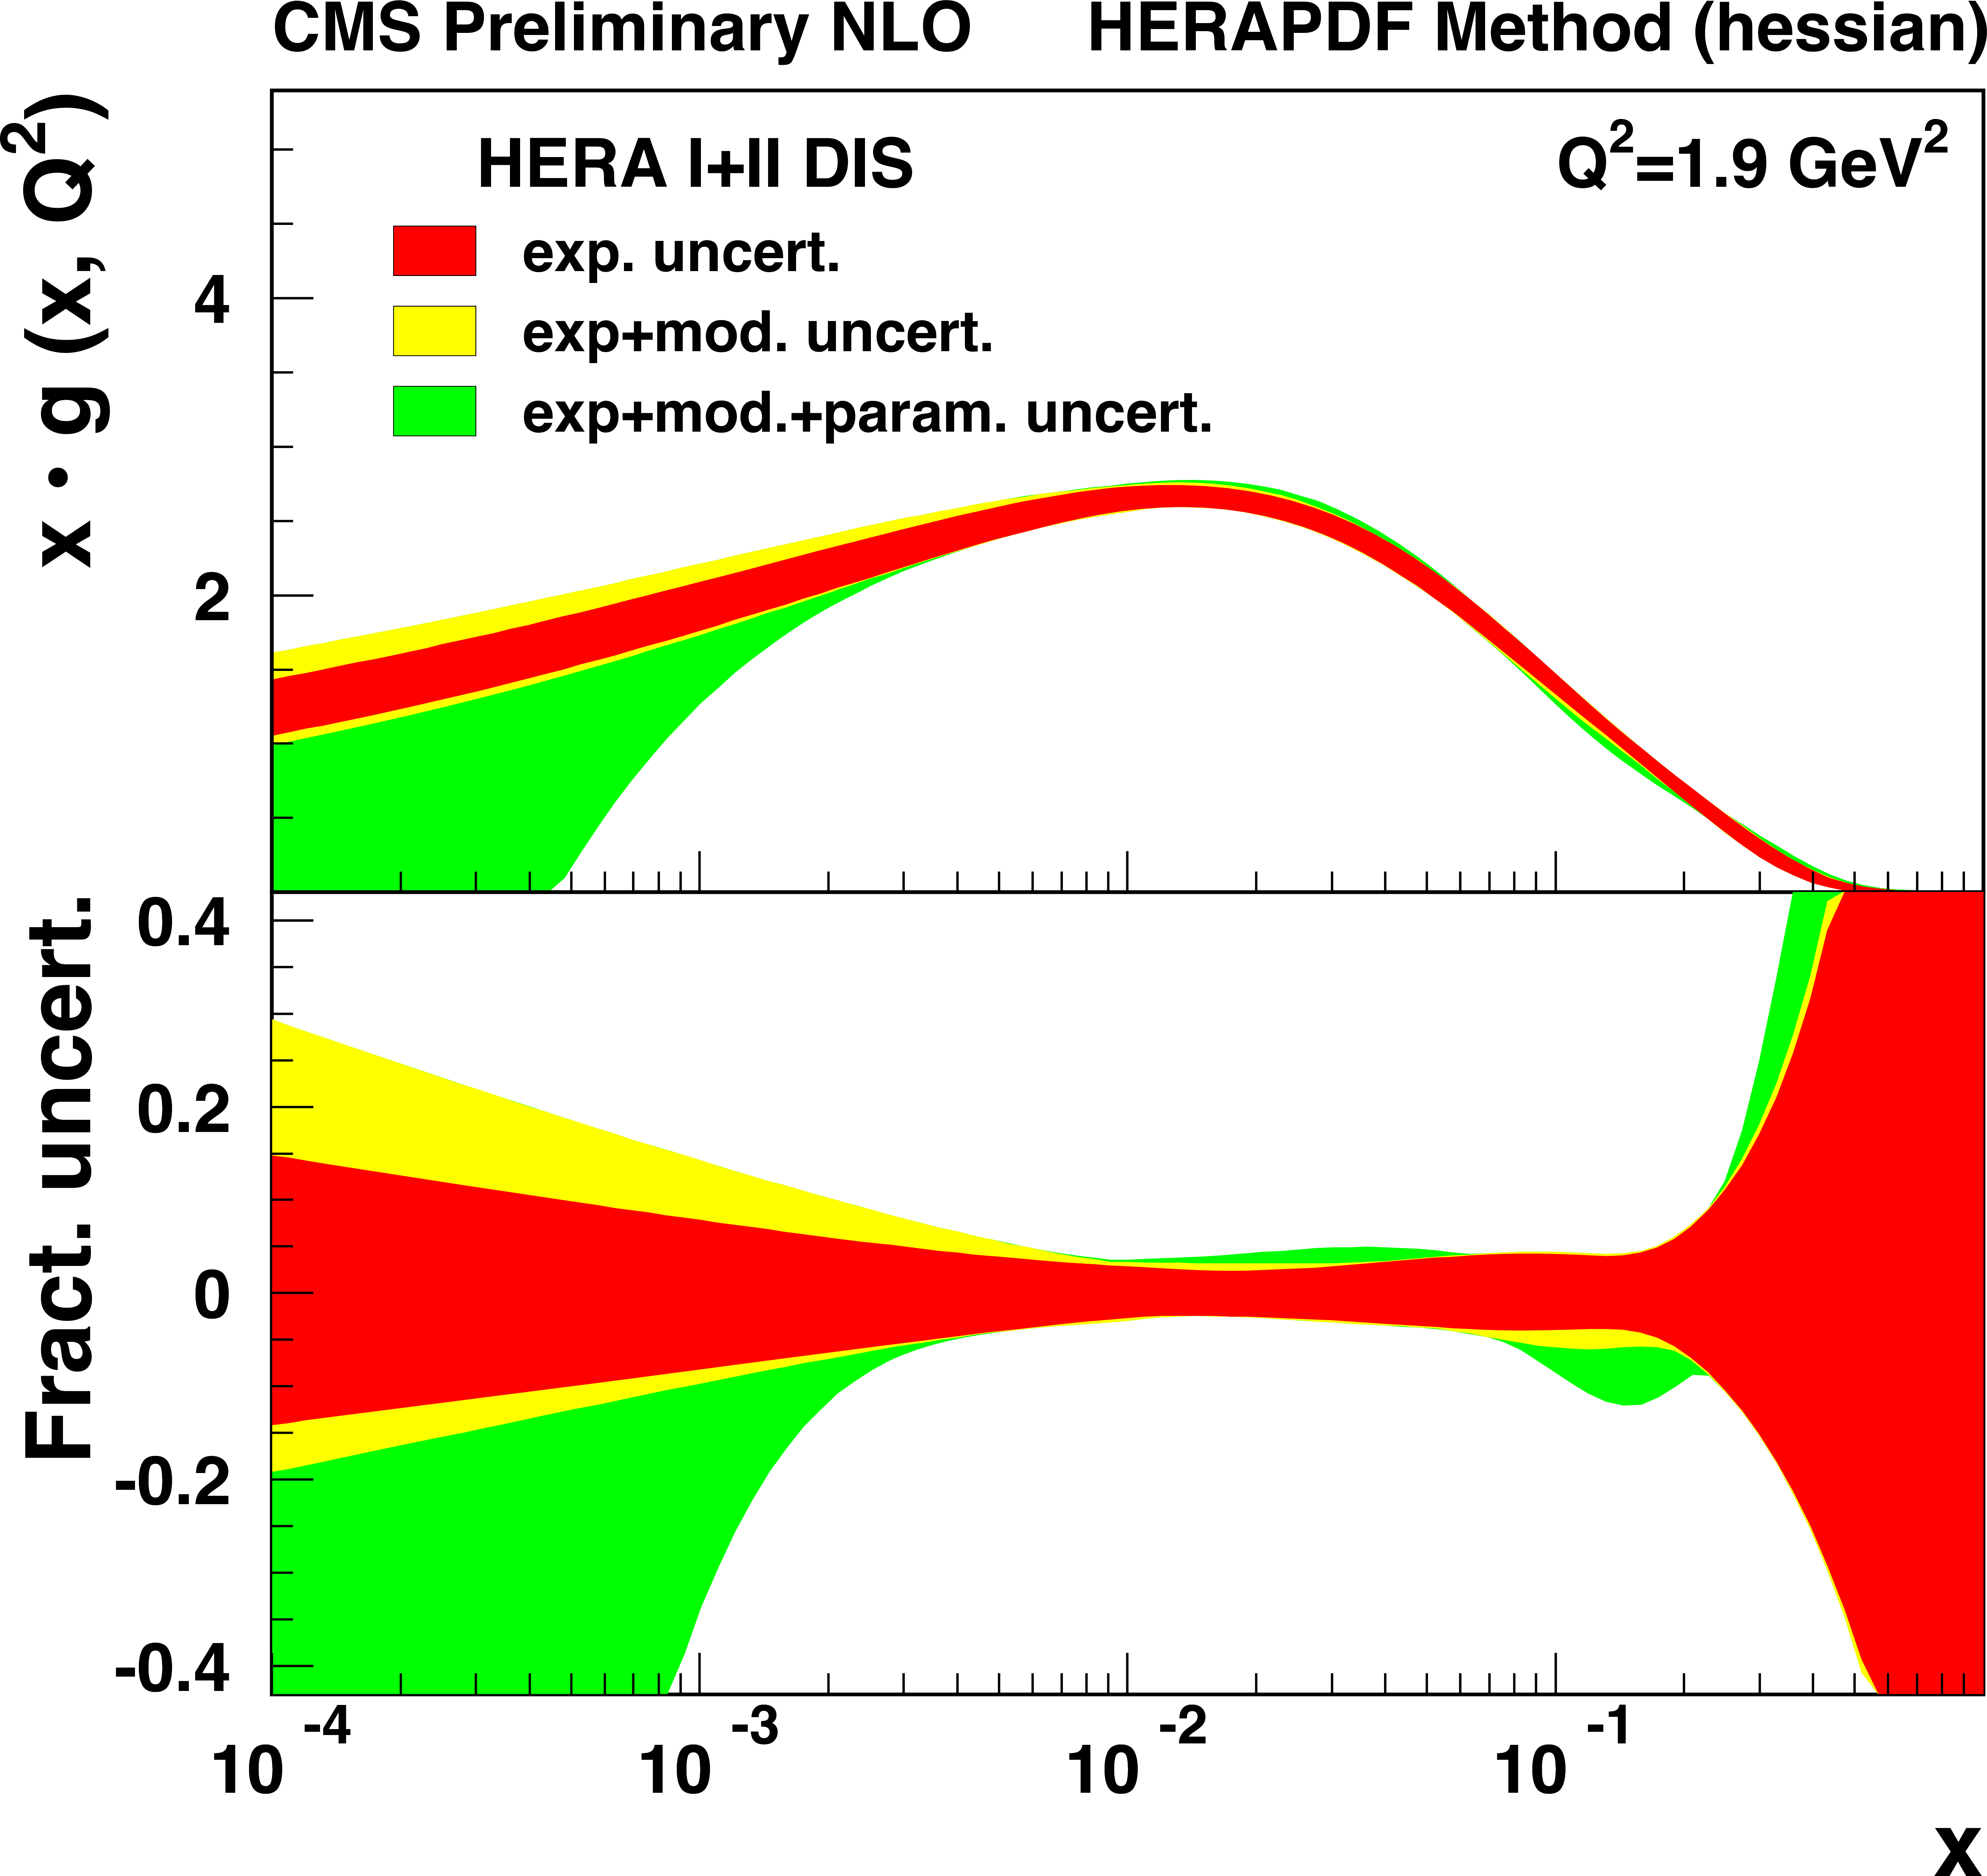
Gluon PDF distribution as functions of $x$ at the starting scale $Q^2=$ 1.9 GeV$^2$ as derived from HERA inclusive DIS (a) and in combination with CMS inclusive jet data (b). Different contributions to the PDF uncertainty are represented by bands of different shades. In the bottom panels the fractional uncertainties are shown. |

png ; pdf |
Figure 14-b:
Gluon PDF distribution as functions of $x$ at the starting scale $Q^2=$ 1.9 GeV$^2$ as derived from HERA inclusive DIS (a) and in combination with CMS inclusive jet data (b). Different contributions to the PDF uncertainty are represented by bands of different shades. In the bottom panels the fractional uncertainties are shown. |
png ; pdf |
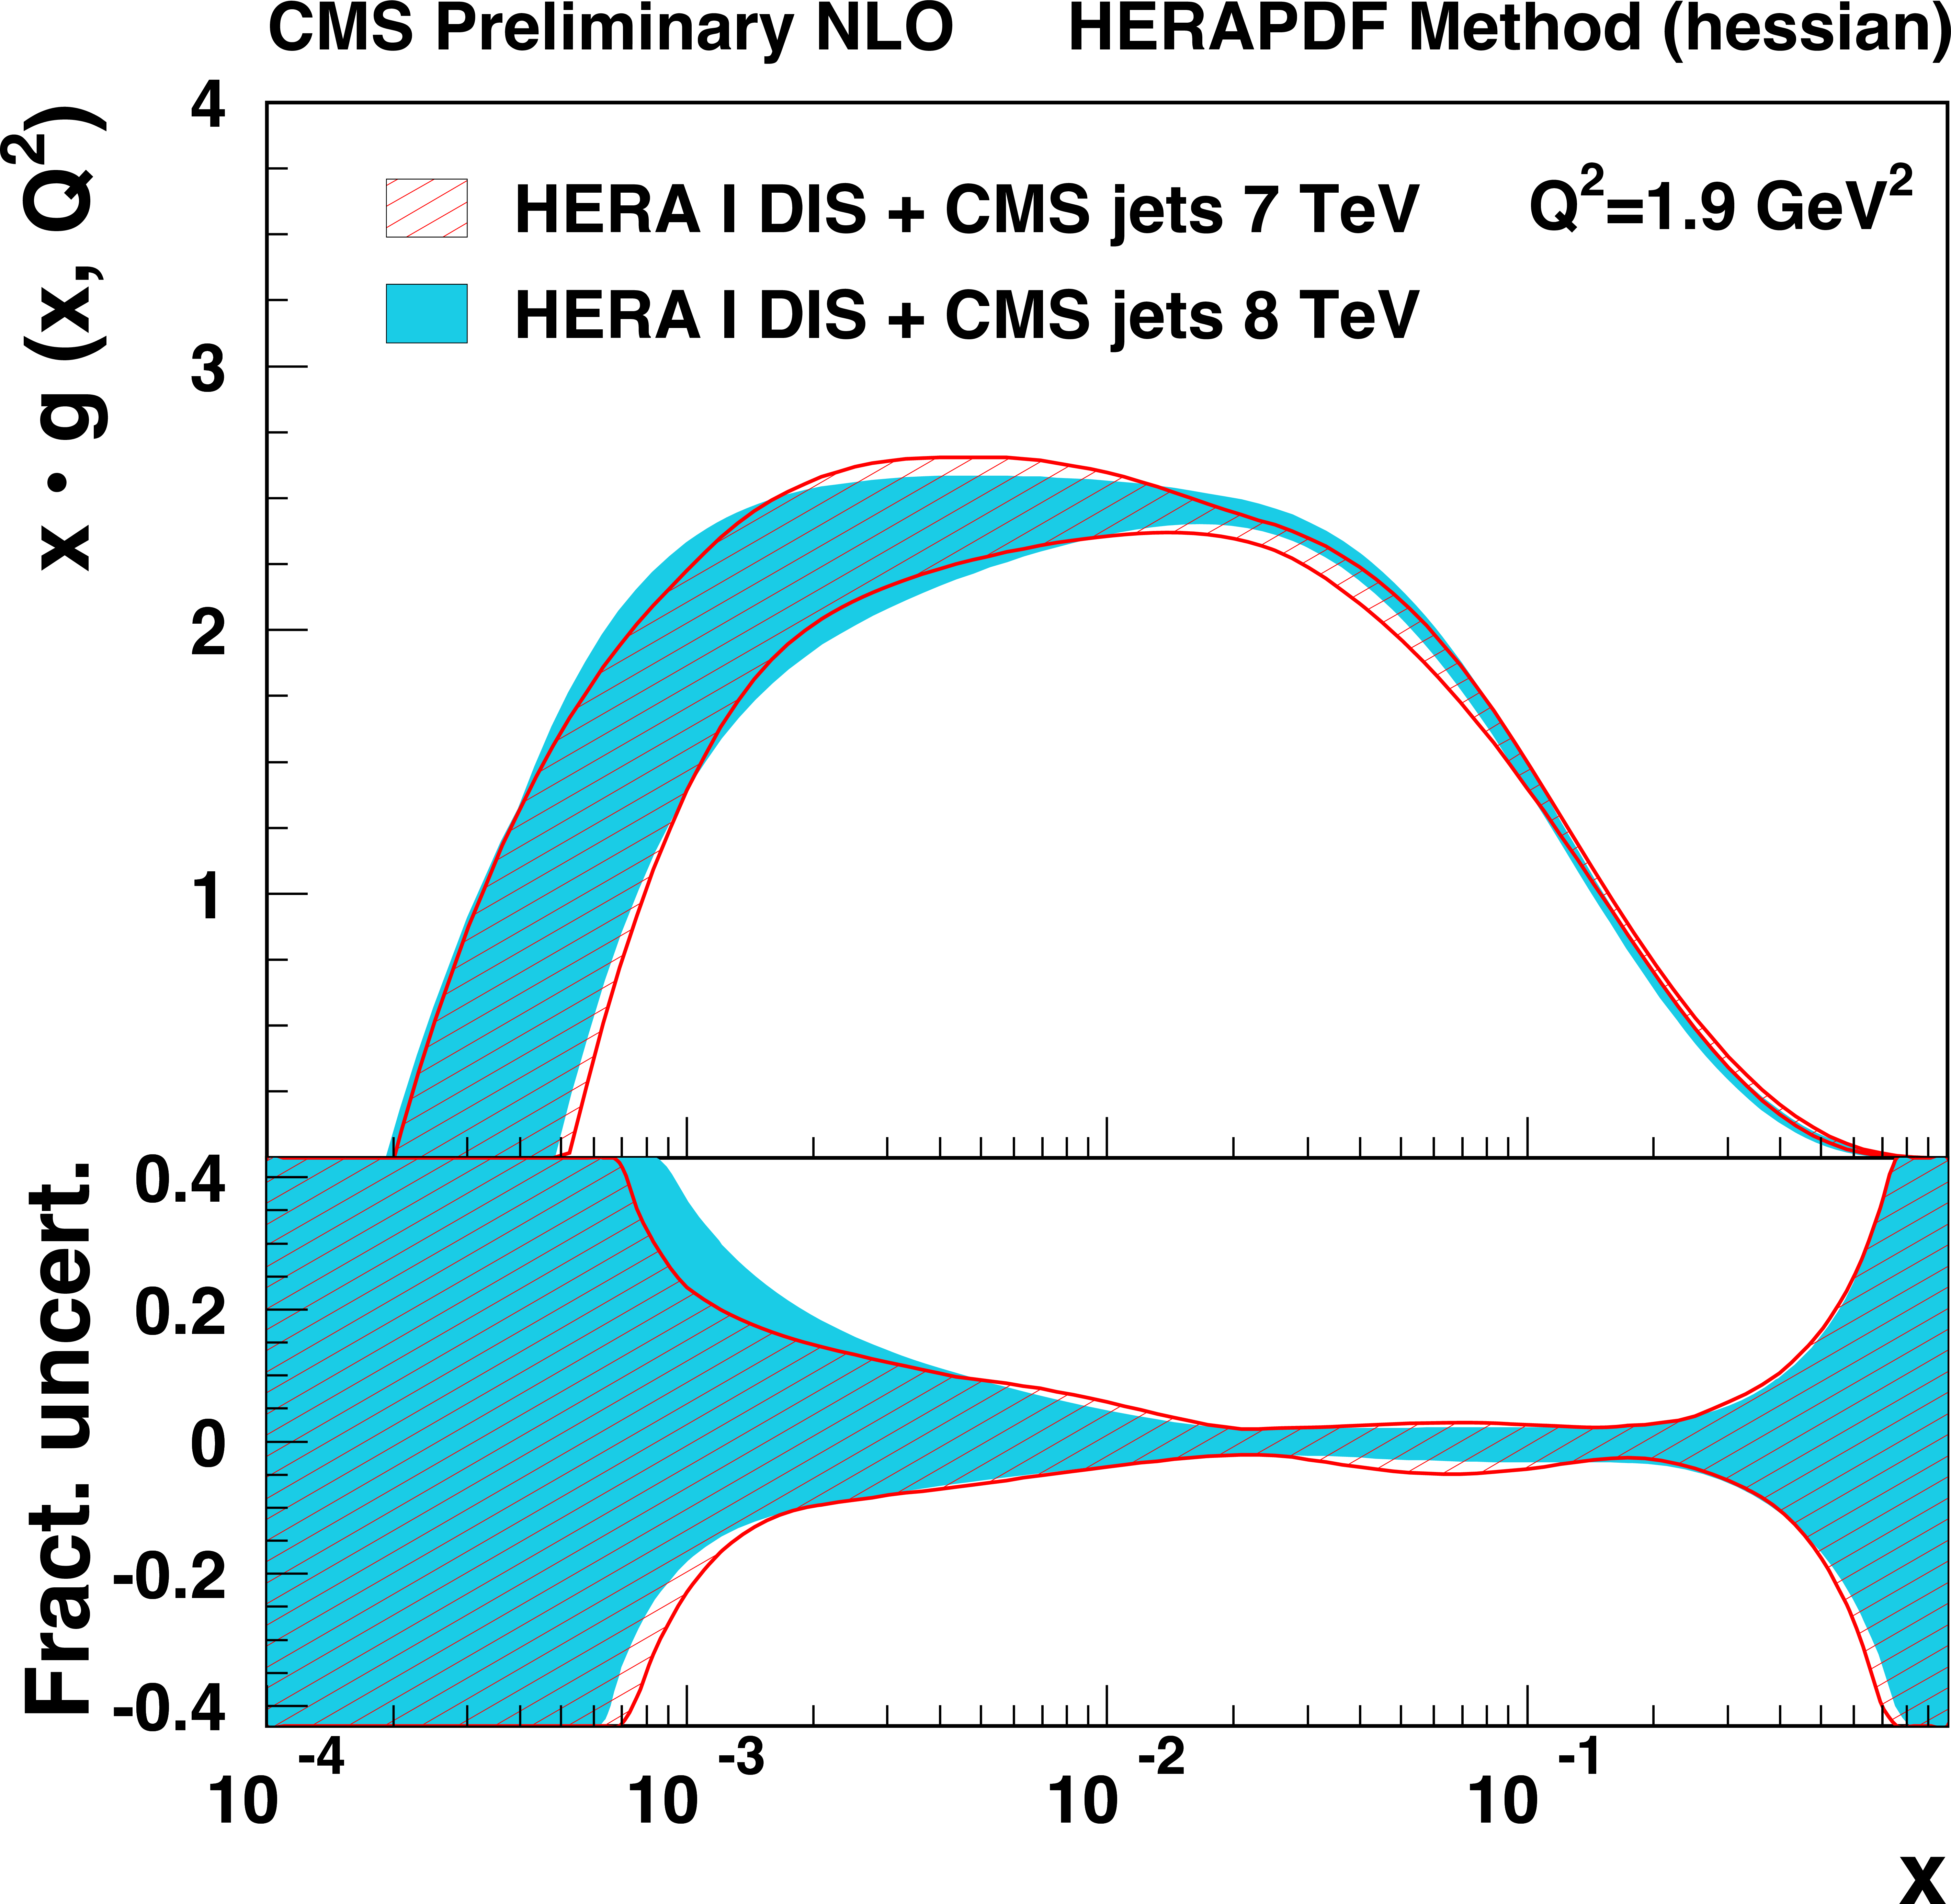
Figure 15-a:
Distributions of gluon (a) and $ {\mathrm {d}}$-valence quark (b) as functions of $x$ at the starting scale $Q^2=$ 1.9 GeV$^2$. The results of the 13-parameter fit to the subset of the combined HERA data and inclusive jet measurements at 7 TeV (hatched band), and, alternatively, 8 TeV (shaded band) are compared with their total uncertainties, as determined by using the HERAPDF method. In the bottom panels the fractional uncertainties are shown. |

png ; pdf |
Figure 15-b:
Distributions of gluon (a) and $ {\mathrm {d}}$-valence quark (b) as functions of $x$ at the starting scale $Q^2=$ 1.9 GeV$^2$. The results of the 13-parameter fit to the subset of the combined HERA data and inclusive jet measurements at 7 TeV (hatched band), and, alternatively, 8 TeV (shaded band) are compared with their total uncertainties, as determined by using the HERAPDF method. In the bottom panels the fractional uncertainties are shown. |
| Tables | |

png ; pdf |
Table 1:
HLT trigger thresholds and effective integrated luminosities used in the jet cross section measurement. |

png ; pdf |
Table 2:
PDF sets used in comparisons to the data together with the corresponding number of active flavours $\mathrm {N_f}$, the assumed masses $\mathrm {M_t}$ and $\mathrm {M_Z}$ of the top quark and of the Z boson, the default values of the strong coupling constant $ {\alpha _\mathrm {S}(\mathrm {M_Z})} $ and the ranges in $ {\alpha _\mathrm {S}(\mathrm {M_Z})} $ available for fits. For CT10 the updated versions of 2012 are taken. |

png ; pdf |
Table 3:
Summary of the values $\chi ^2/\mathrm {N_{bins}}$ for the comparison in each $|y|$ range of data and theoretical predictions based on different PDF sets. |
png ; pdf |
Table 4:
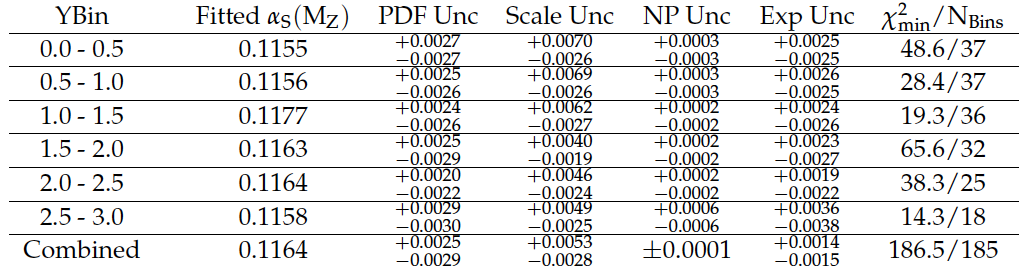
$ {\alpha _\mathrm {S}(\mathrm {M_Z})} $ results extracted using CT10 NLO PDF set. The fitted values for each $|y|$ bins, the corresponding uncertainty components due to PDF, scale and NP and total experimental uncertainty are shown. The last row of the table shows the results of combined fitting of all the $|y|$ bins simultaneously. |

png ; pdf |
Table 5:
The $ {\alpha _\mathrm {S}(\mathrm {M_Z})} $ extracted values, the corresponding $ {\alpha _\mathrm {S}(\mathrm {Q})} $ values at the Q scale for each $ {p_{\mathrm {T}}} $ range, and $\chi ^{2}_{\mathrm {min}}/\mathrm {N_{Bins}}$ are shown. Uncertainties are given for both $ {\alpha _\mathrm {S}} $ values. |

png ; pdf |
Table 6:
Composition of the uncertainty on $ {\alpha _\mathrm {S}(\mathrm {M_Z})} $ fit results in ranges of $ {p_{\mathrm {T}}} $. For each range, the corresponding statistical, and experimental systematic uncertainty, and the components of the theoretical uncertainty are shown. The numbers are obtained using CT10 NLO PDF set. |

png ; pdf |
Table 7:
Partial $\chi ^2/n_{\text {dp}}$ per number of data points $n_{\textrm {dp}}$ for the data sets used in the QCD analysis. The global $\chi ^2/n_{\text {dof}}$ per degrees of freedom of 1471/1216 is obtained, with correlated $\chi ^2$ of 94. |
| Auxiliary Figures | |

png ; pdf |
Auxiliary Figure 1:
Distribution of gluon as a function of $x$ at the starting scale $Q^2=$ 1.9 GeV$^2$. The results of the fit to the HERA data and inclusive jet measurements at 8 TeV (shaded band), and to HERA only (hatched band) are compared with their total uncertainties, as determined by using the Monte-Carlo method. In the bottom panels the fractional uncertainties are shown. |
|
|
Compact Muon Solenoid LHC, CERN |
|

|

|

|

|

|