

Compact Muon Solenoid
LHC, CERN
| CMS-PAS-HIN-15-011 | ||
| Decomposing energy balance contributions for quenched jets in PbPb versus pp collisions at $\sqrt{s_{\rm NN}} =$ 2.76 TeV | ||
| CMS Collaboration | ||
| September 2015 | ||
| Abstract: The angular distribution of charged particle momenta in relative pseudorapidity ($\Delta \eta$) and relative azimuth ($\Delta \phi$) with respect to a sample of high transverse momentum dijets is utilized to study the momentum balance of jet fragments in heavy-ion collisions, which is potentially modified due to jet quenching in the Quark Gluon Plasma. This analysis compares the contributions of charged particles of different transverse momenta to study the overall event energy balance in PbPb versus pp collisions using data collected in 2011 and 2013, respectively, at collision energies $\sqrt{s_{\rm NN}} =$ 2.76 TeV with integrated luminosities of 166 $\mu \rm{b}^{-1}$ and 5.3 pb$^{-1}$. Distributions of momentum with respect to leading and subleading transverse momentum jets are studied individually, and are decomposed into contributions from jet cones and a long range event-wise azimuthal asymmetry in particle momenta. Results are presented as a function of PbPb collision centrality, track transverse momentum, $\Delta\phi$, and radius parameter $\Delta r = \sqrt{\Delta\eta^{2}+\Delta\phi^{2}}$ for balanced and unbalanced dijets, and are compared to pp reference. | ||
|
Links:
CDS record (PDF) ;
Public twiki page ;
CADI line (restricted) ; Figures are also available from the CDS record. These preliminary results are superseded in this paper, JHEP 11 (2016) 055. The superseded preliminary plots can be found here. |
||
| Figures | |

png ; pdf |
Figure 1:
Jet-track correlation distributions for unbalanced dijets ($A_{\rm J}>0.22$), projected over $|\Delta \eta |<$1.0 and overlaid with long range distribution projected over 1.5 $<|\Delta \eta |<$ 2.5. The ''near-side'' region $- \pi /2<\Delta \phi <\pi /2$ is taken from the leading jet correlation, while the ''away-side'' $\pi /2<\Delta \phi <3\pi /2$ is taken from the subleading jet correlation. The top row shows low track transverse momentum bin $1 |

png ; pdf |
Figure 2:
Top row: total hemisphere distribution in $\Delta \phi $ of excess transverse momentum about the subleading relative to the leading jet for balanced dijets with $A_{\rm J} <$ 0.22 shown differentially by track transverse momentum for pp reference, peripheral PbPb, and central PbPb data. Bottom row: PbPb - pp difference in these $\Delta \phi $ momentum distributions. Statistical uncertainties are shown with vertical bars, and systematic uncertainties are shown with shaded boxes. |

png ; pdf |
Figure 3:
Top row: total hemisphere distribution in $\Delta \phi $ of excess transverse momentum about the subleading relative to the leading jet for unbalanced dijets with $A_{\rm J} >$ 0.22, shown differentially by track transverse momentum for pp reference, peripheral PbPb, and central PbPb data. Bottom row: PbPb - pp difference in these $\Delta \phi $ momentum distributions. Statistical uncertainties are shown with vertical bars, and systematic uncertainties are shown with shaded boxes. |

png ; pdf |
Figure 4:
Top row: jet-peak (long-range subtracted) distribution in $\Delta \phi $ of transverse momentum about the subleading (plotted positive) and leading (plotted negative) jets for balanced dijets with $A_{\rm J} < $ 0.22. Middle rows: PbPb - pp momentum distribution differences for subleading and leading jets. Bottom row: PbPb - pp, subleading - leading double difference in these $\Delta \phi $ momentum distributions. Statistical uncertainties are shown with vertical bars, and systematic uncertainties are shown with shaded boxes. |
png ; pdf |
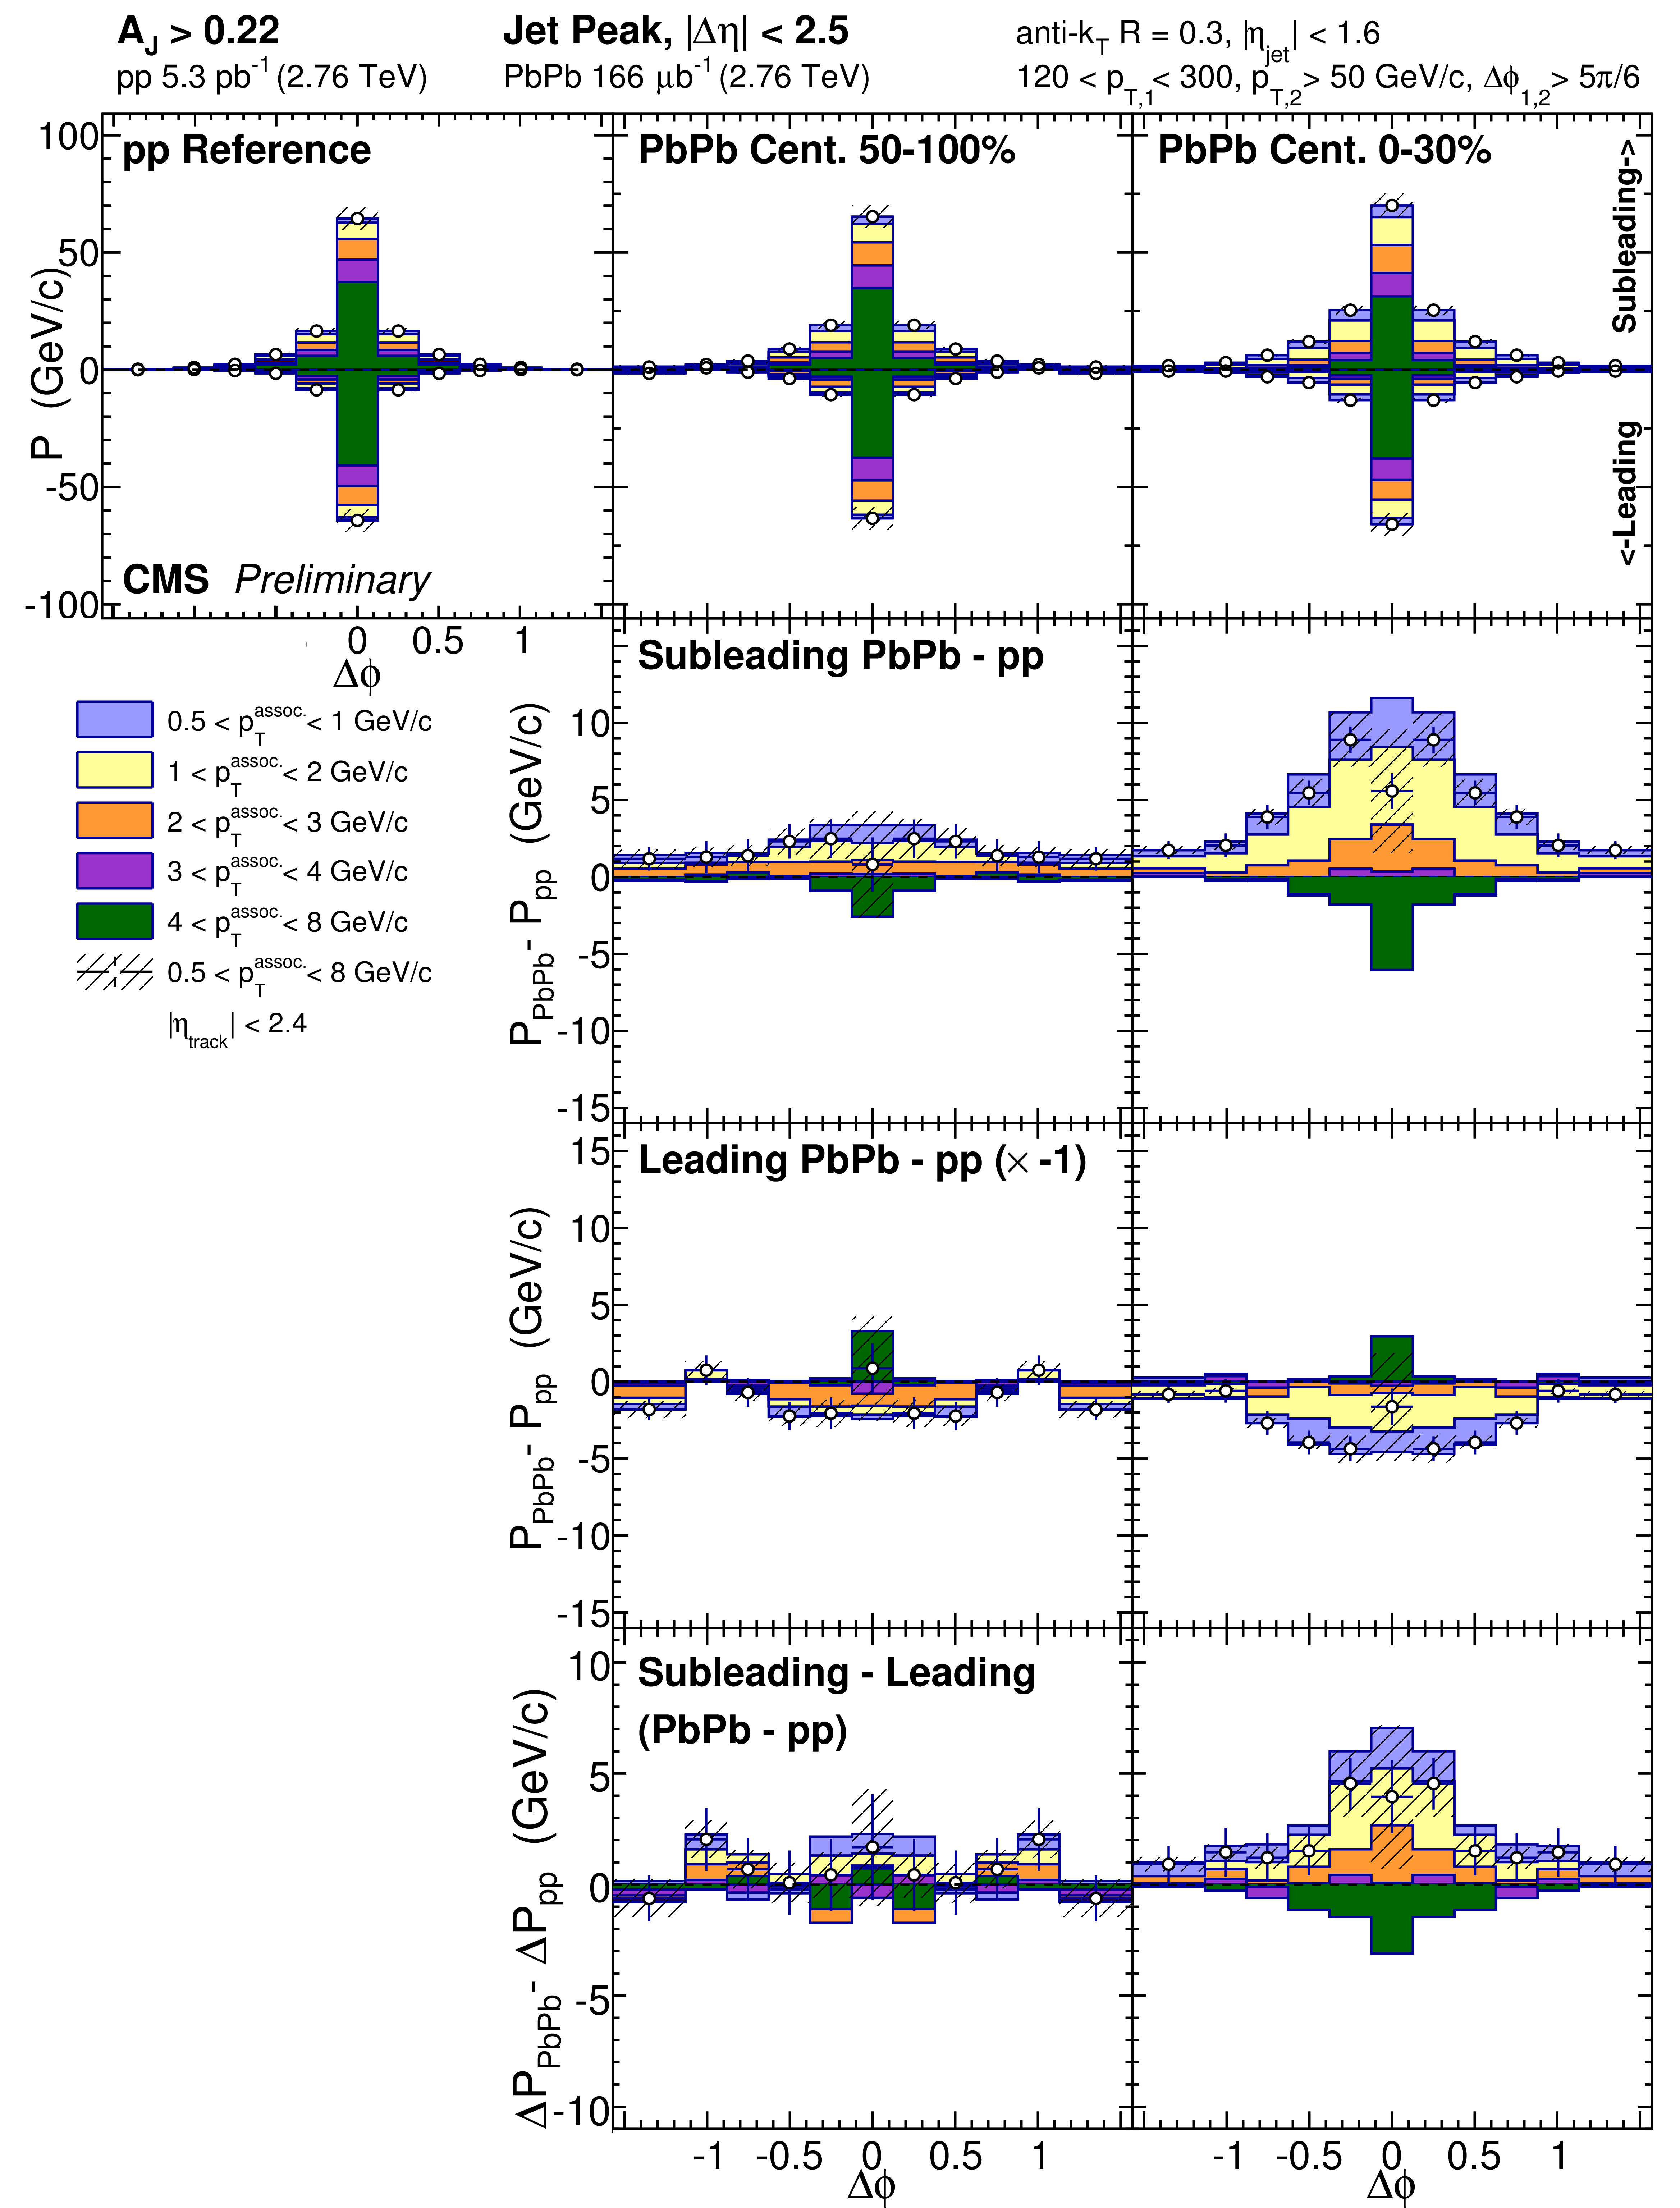
Figure 5:
Top row: jet-peak (long-range subtracted) distribution in $\Delta \phi $ of transverse momentum about the subleading (plotted positive) and leading (plotted negative) jets for unbalanced dijets with $A_{\rm J} > $ 0.22. Middle rows: PbPb - pp momentum distribution differences for subleading and leading jets. Bottom row: PbPb - pp, subleading - leading double difference in these $\Delta \phi $ momentum distributions. Statistical uncertainties are shown with vertical bars, and systematic uncertainties are shown with shaded boxes. |
png ; pdf |
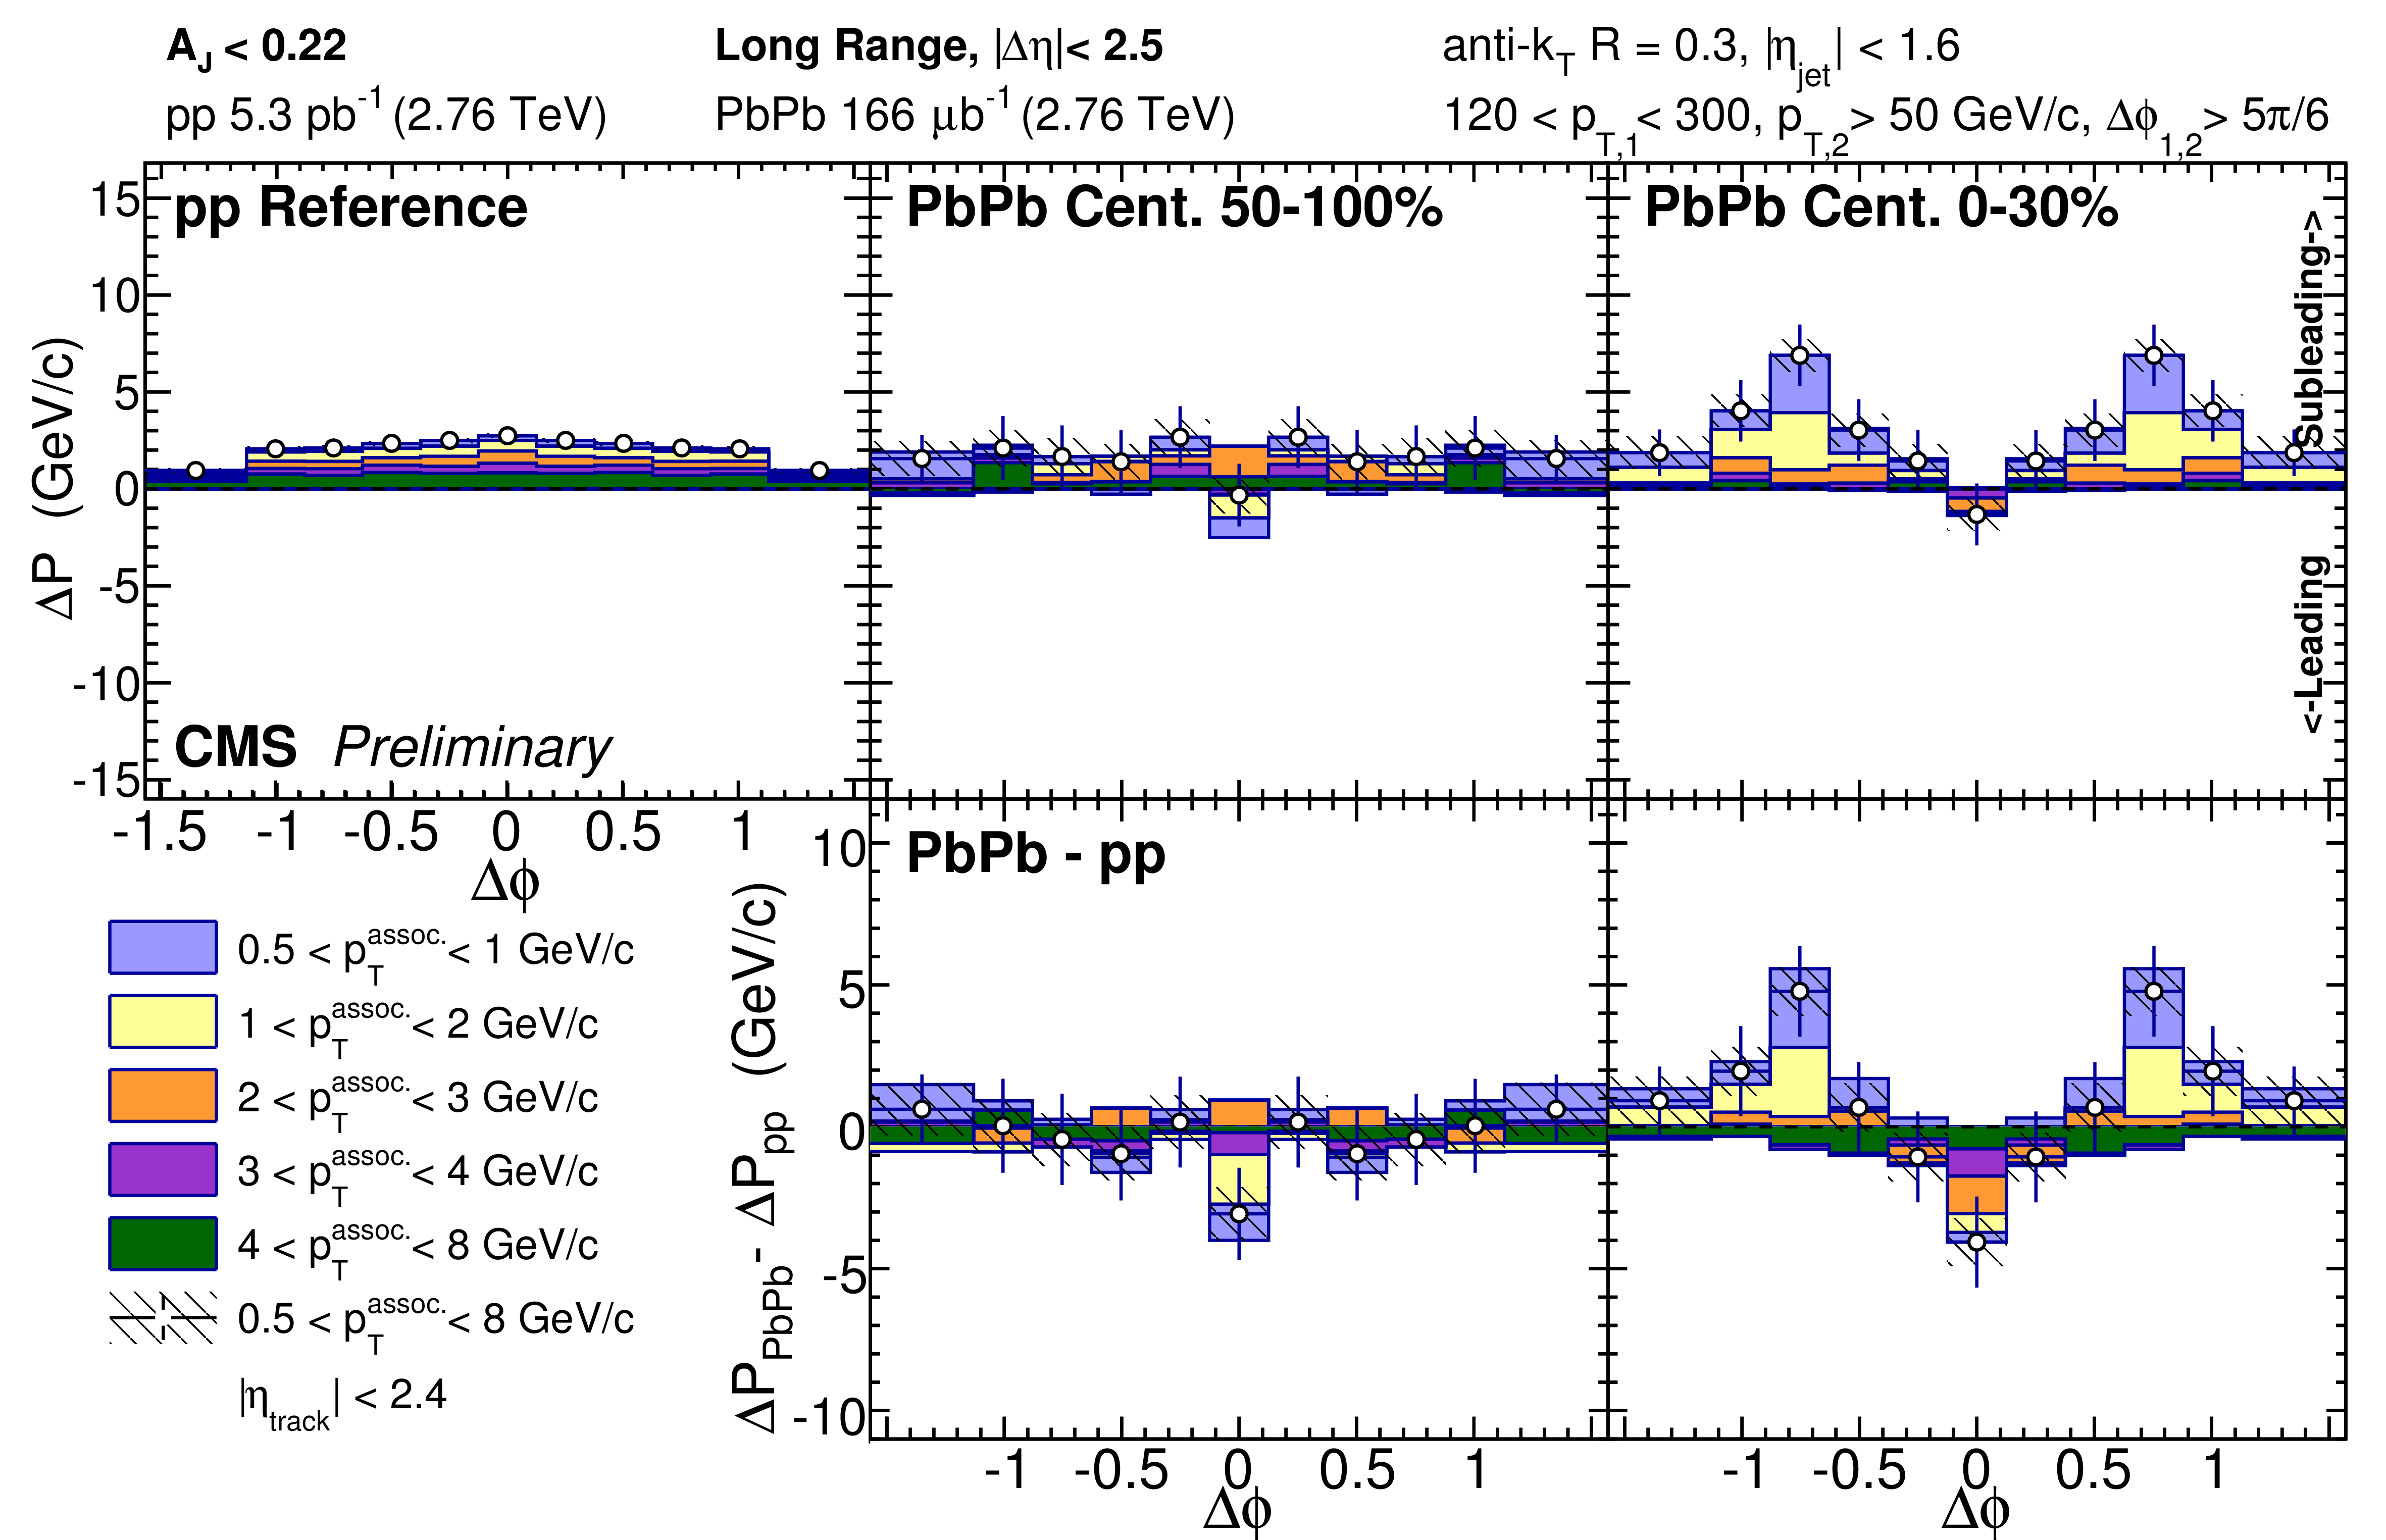
Figure 6:
Top row: long range distribution in $\Delta \phi $ of excess transverse momentum in the subleading relative to leading sides for balanced dijets with $A_{\rm J} < $ 0.22. Bottom row: PbPb - pp difference in these $\Delta \phi $ long range momentum distributions. Statistical uncertainties are shown with vertical bars, and systematic uncertainties are shown with shaded boxes. |

png ; pdf |
Figure 7:
Top row: long range distribution in $\Delta \phi $ of excess transverse momentum in the subleading relative to leading sides for unbalanced dijets with $A_{\rm J} >$ 0.22. Bottom row: PbPb - pp difference in these $\Delta \phi $ long range momentum distributions. Statistical uncertainties are shown with vertical bars, and systematic uncertainties are shown with shaded boxes. |

png ; pdf |
Figure 8:
Integrated transverse momentum in the long range $\Delta \phi $-correlated distribution as a function of track-$p_{\rm T}$ integrated over $|\Delta \phi | < \pi /2$ and $|\Delta \eta | < 2.5$ and for pp reference, peripheral PbPb and central PbPb data for balanced compared to unbalanced dijets. Statistical uncertainties are shown with vertical bars, and systematic uncertainties are shown with shaded boxes. |

png ; pdf |
Figure 9:
Modifications of jet-hadron correlated transverse momentum in central PbPb collisions with respect to pp reference, integrated $|\Delta \phi | < \pi /2$ and $|\Delta \eta | <$ 2.5. Top row: subleading and leading jet peak PbPb - pp. Bottom row: relative contributions from jet peaks and long range asymmetry to the double difference PbPb - pp, subleading - leading in total hemisphere transverse momentum. Statistical uncertainties are shown with vertical bars, and systematic uncertainties are shown with shaded boxes. |
png ; pdf |
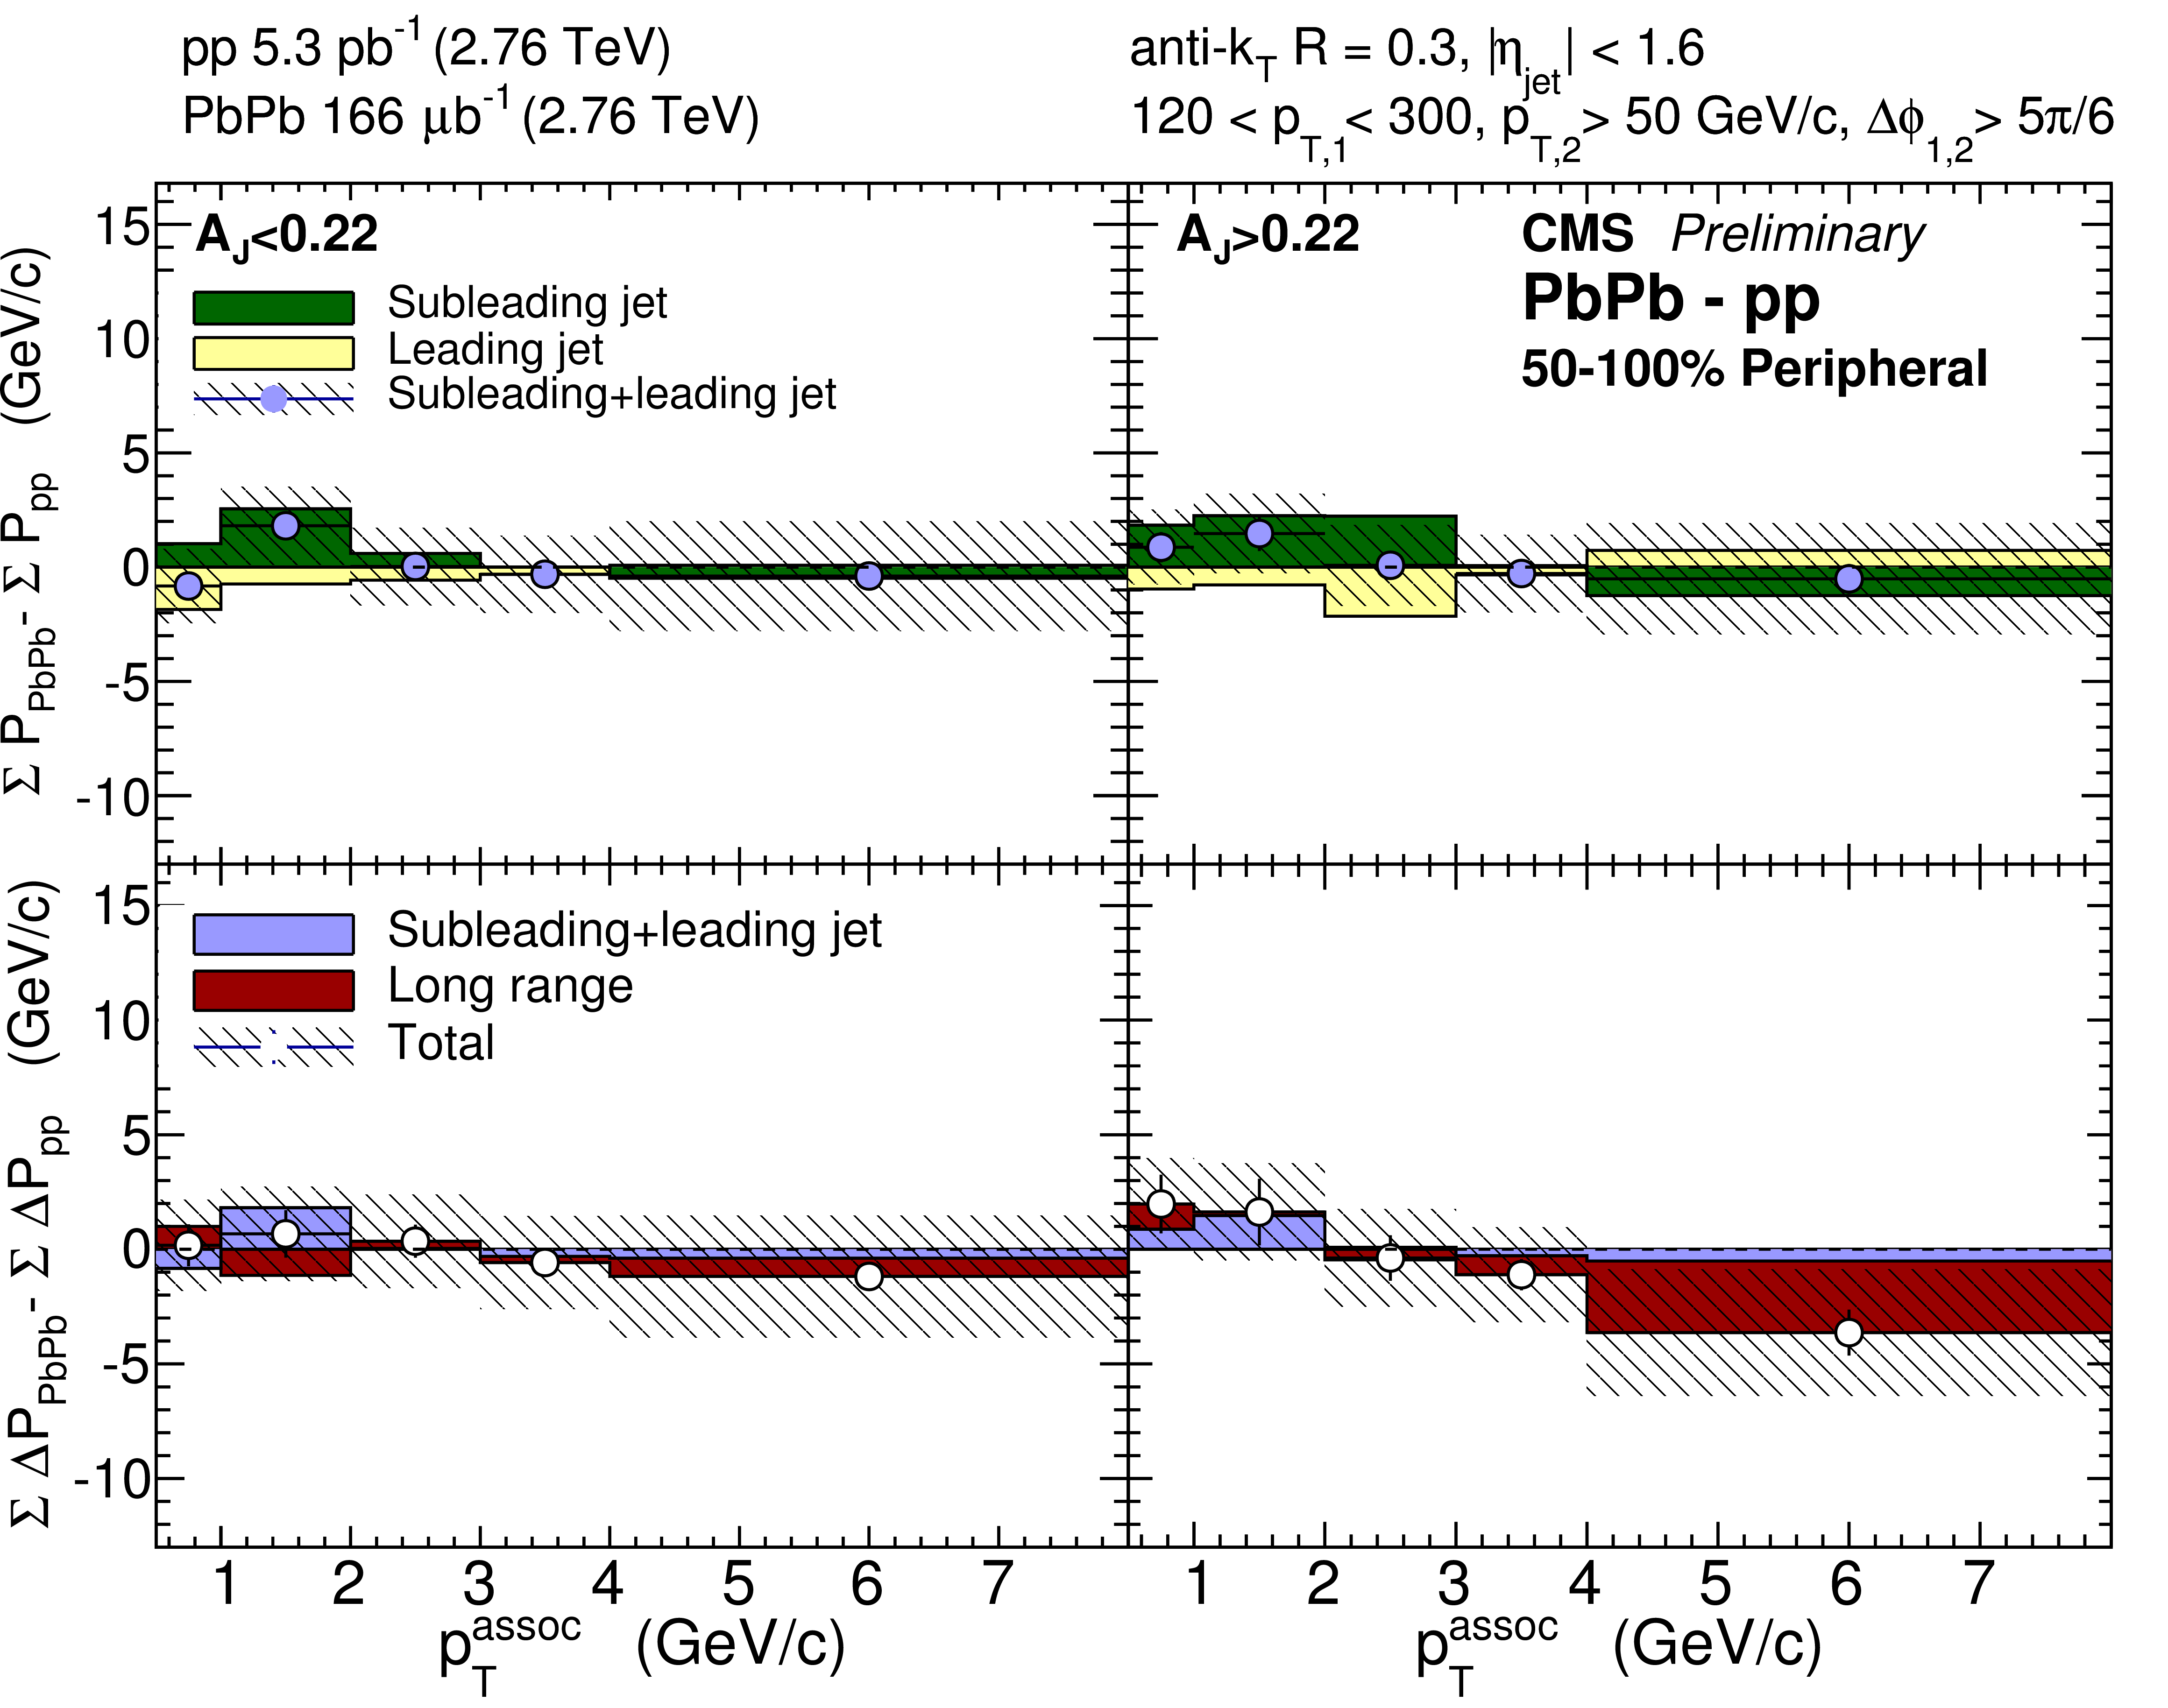
Figure 10:
Modifications of jet-hadron correlated transverse momentum in peripheral PbPb collisions with respect to pp reference, integrated $|\Delta \phi | < \pi /2$ and $|\Delta \eta | <$ 2.5. Top row: subleading and leading jet peak PbPb - pp. Bottom row: relative contributions from jet peaks and long range asymmetry to the double difference PbPb - pp, subleading - leading in total hemisphere transverse momentum. Statistical uncertainties are shown with vertical bars, and systematic uncertainties are shown with shaded boxes. |
png ; pdf |
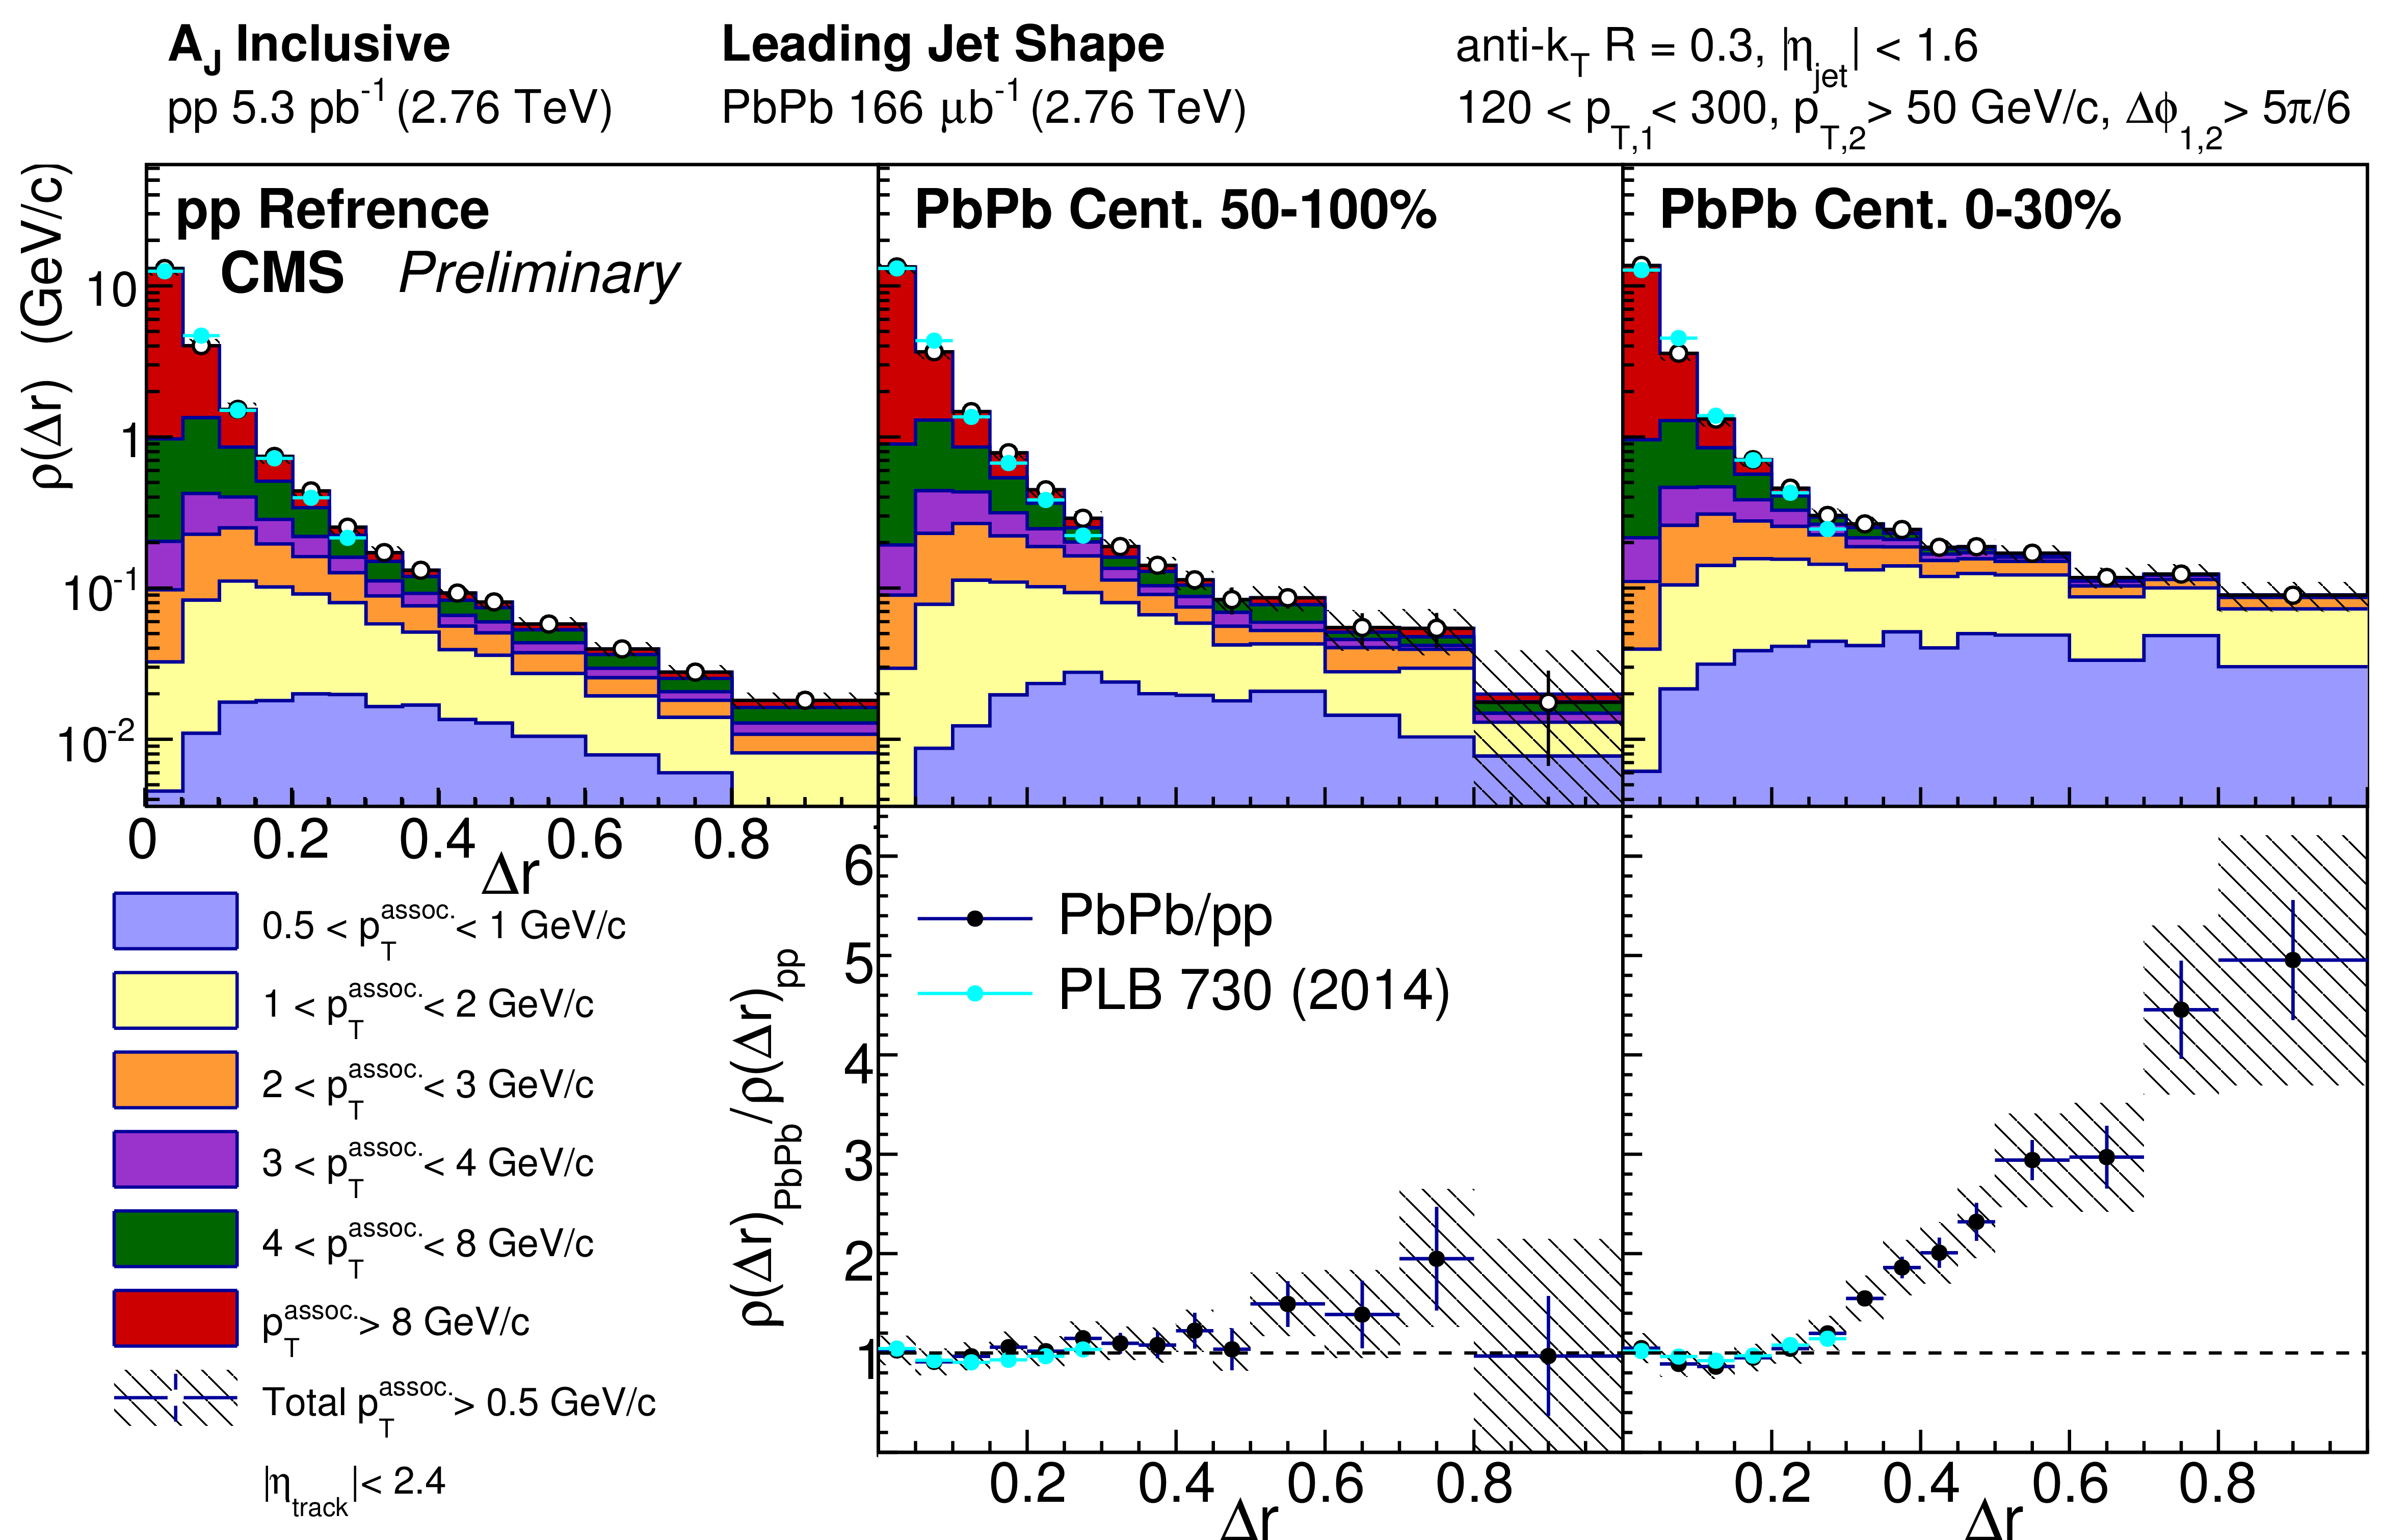
Figure 11:
Top row: leading jet shape $\rho (r)$ for pp reference and central and peripheral PbPb data, shown for all tracks with $p_{\rm T} >$ 0.5 GeV/$c$ and decomposed by track transverse momentum. Shapes are normalized to unity over the region $r<0.3$ for consistency with the published reference shown. Bottom row: leading jet shape ratio $\rho (r)_{\rm PbPb}/\rho (r)_{\rm pp}$, again with published reference. Statistical uncertainties are shown with vertical bars, and systematic uncertainties are shown with shaded boxes. |
png ; pdf |
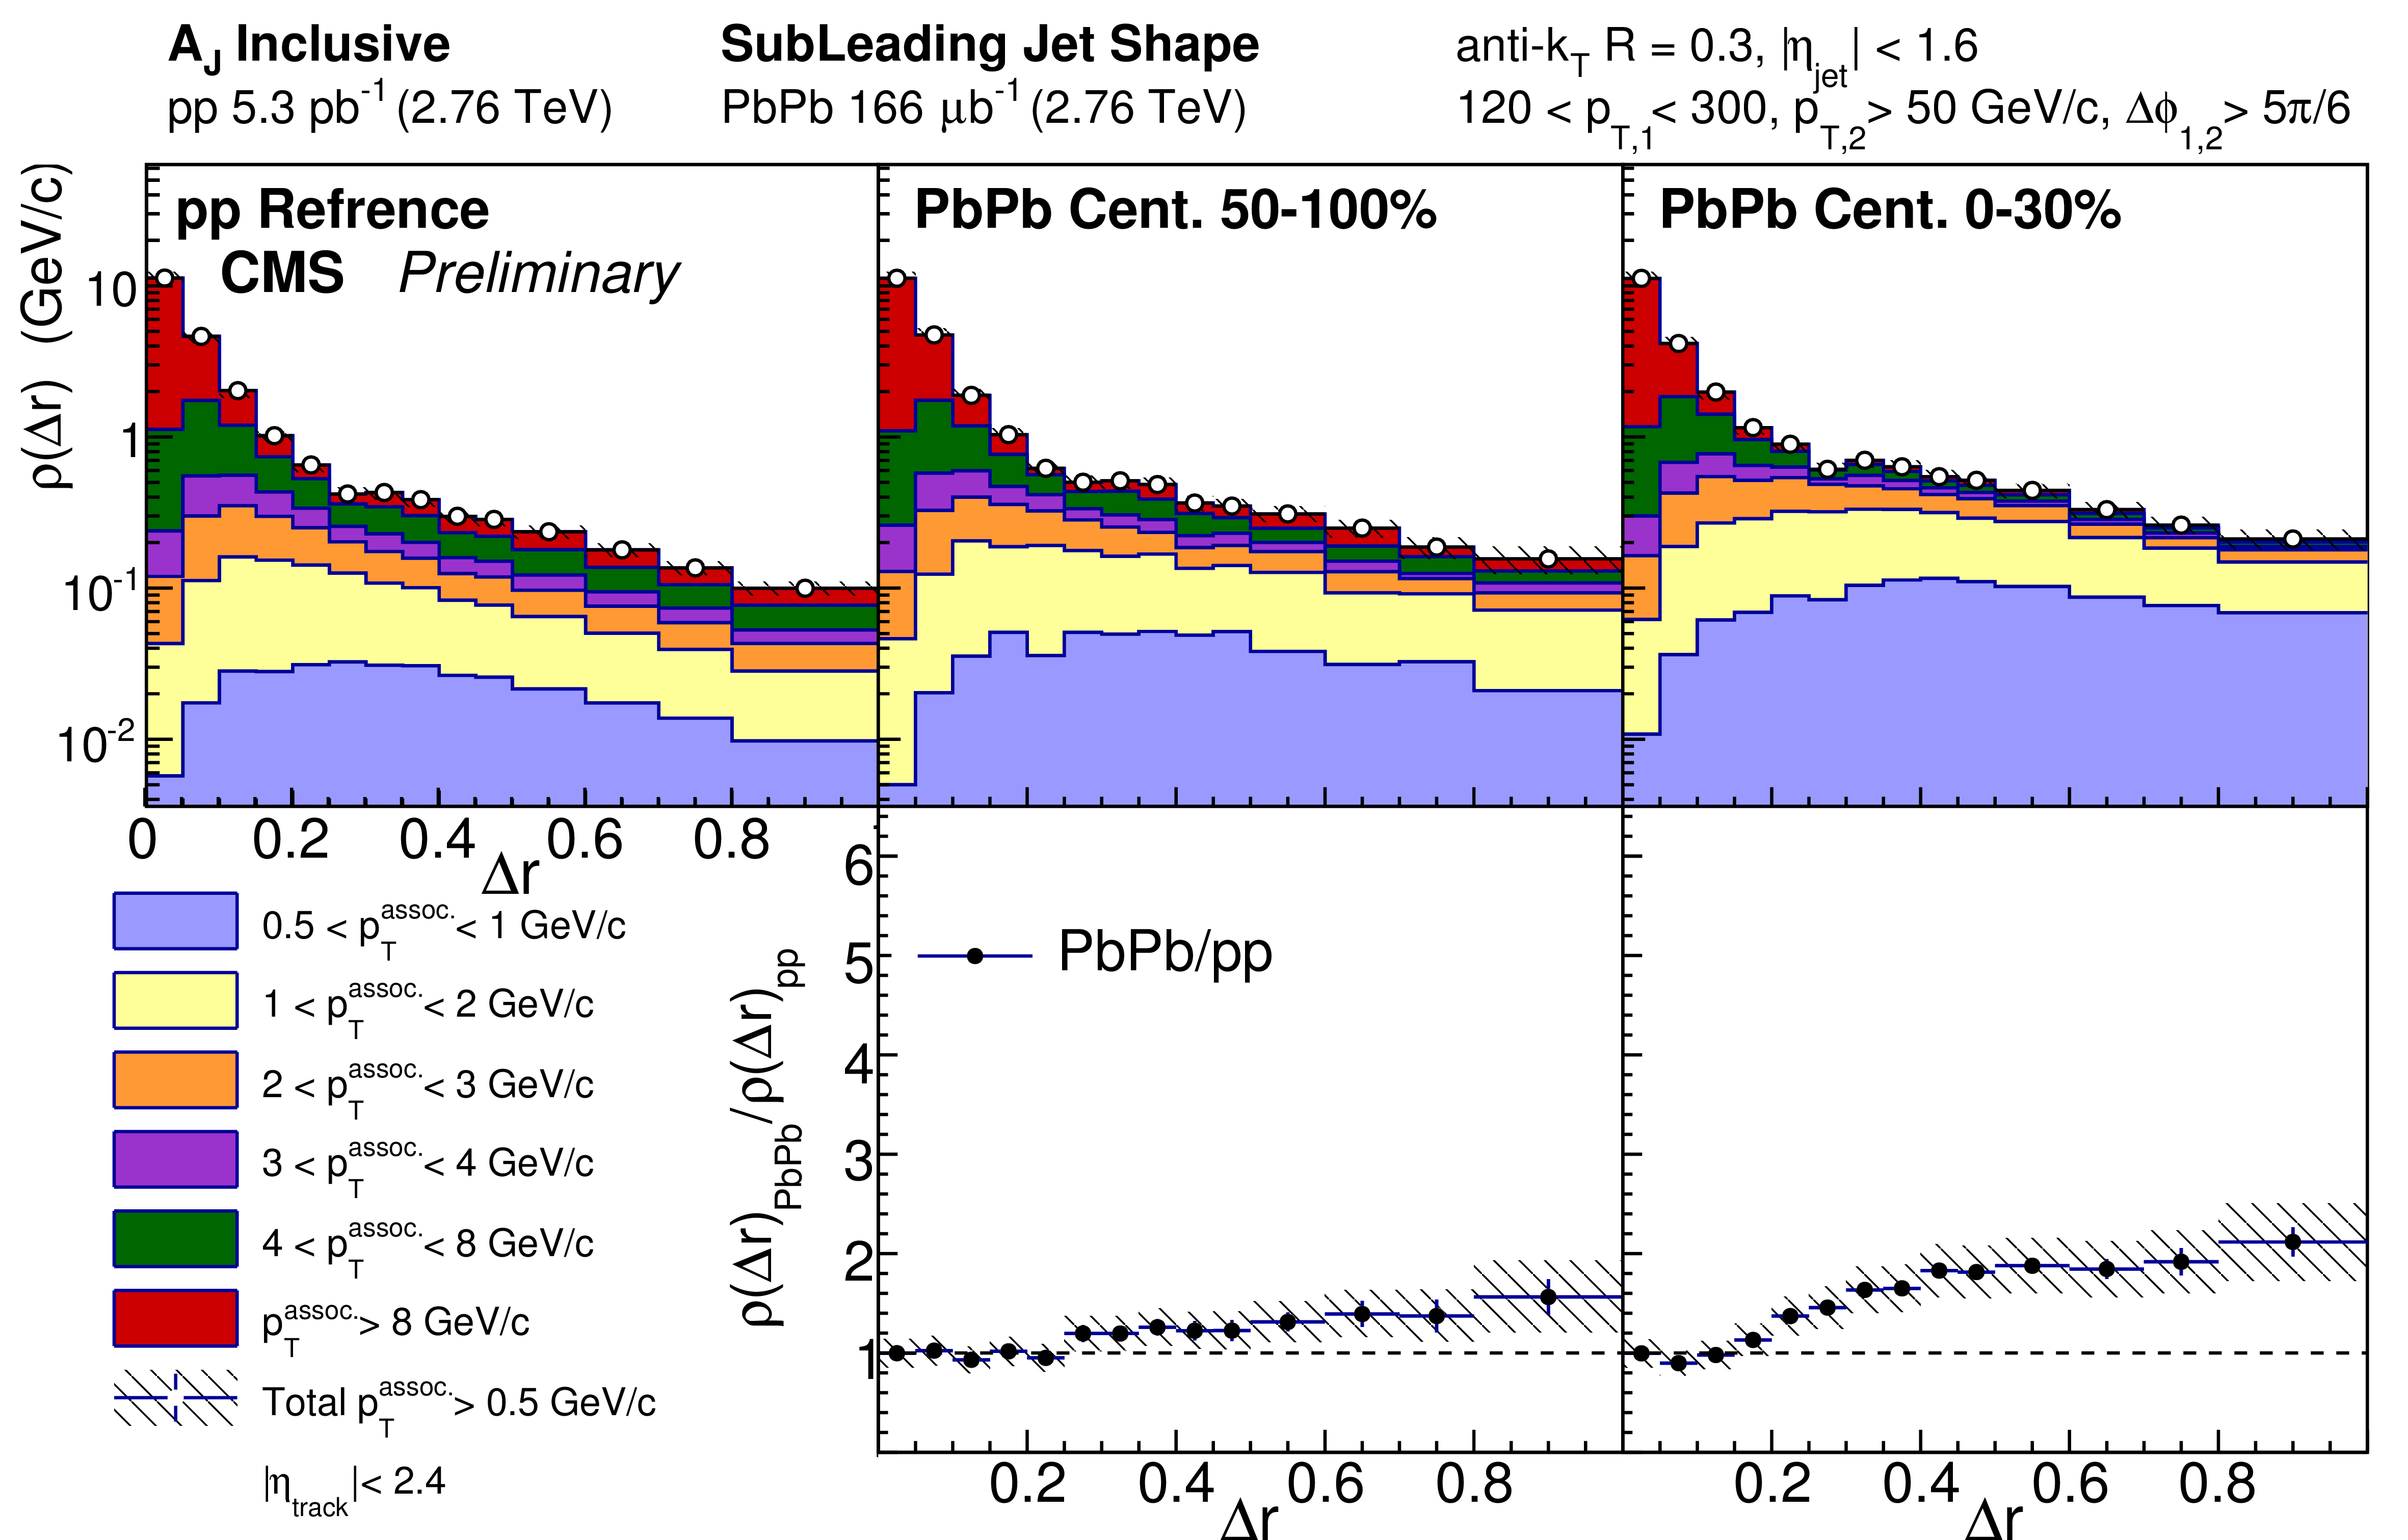
Figure 12:
Top row: subleading jet shape $\rho (r)$ for pp reference and central and peripheral PbPb data, shown for all tracks with $p_{\rm T}>$ 0.5 GeV/$c$ and decomposed by track transverse momentum, normalized to unity over the region $r<0.3$ Bottom row: subleading jet shape ratio $\rho (r)_{\rm PbPb}/\rho (r)_{\rm pp}$. Statistical uncertainties are shown with vertical bars, and systematic uncertainties are shown with shaded boxes. |
| Tables | |

png ; pdf |
Table 1:
Systematic uncertainties in the measurement of the jet track correlations in PbPb collisions. The numbers presented in this table summarize typical lowest and highest values of systematic uncertainty as a function of collision centrality. |
|
|
Compact Muon Solenoid LHC, CERN |
|

|

|

|

|

|