

Compact Muon Solenoid
LHC, CERN
| CMS-PAS-HIN-14-014 | ||
| Centrality and pseudorapidity dependence of transverse energy flow in pPb collisions at $\sqrt{s_{\rm NN}} = $ 5.02 TeV | ||
| CMS Collaboration | ||
| September 2015 | ||
| Abstract: The almost hermetic coverage of CMS is used to measure the distribution of transverse energy as a function of pseudo-rapidity for pPb collisions at $\sqrt{s_{NN}} =$ 5.02 TeV. For minimum bias collisions $(1/N) \mathrm{d}E_T/\mathrm{d}\eta$ reaches 23 GeV which implies an $E_{\mathrm{T}}$ per participant pair comparable to that of peripheral PbPb collisions at $\sqrt{s_{NN}} =$ 2.76 TeV. The centrality dependence of transverse energy dependence has been studied using centrality measures defined in three different angular regions. There is a strong auto-correlation between $(1/N)~\mathrm{d}E_T/\mathrm{d}\eta$ and the $\eta$ range used to define centrality both for data and the EPOS-LHC and HIJING event generators. The centrality dependence of the data is much stronger for $\eta$ values on the lead side than the proton side and shows significant differences from that predicted by either of the event generators. | ||
|
Links:
CDS record (PDF) ;
CADI line (restricted) ; Figures are also available from the CDS record. These preliminary results are superseded in this paper, PRC 100 (2019) 024902. The superseded preliminary plots can be found here. |
||
| Figures | |

png ; pdf |
Figure 1:
$(1/N)\mathrm{d}E_{\mathrm{T}}/\mathrm{d}\eta $ versus $\eta $ from minimum bias $\sqrt {s_{\rm NN}} =$ 5.02 TeV pPb collisions. The statistical errors are smaller than the size of the points. The systematic errors are shown by gray bands and are largely correlated point to point. Predictions from EPOS-LHC (red) and HIJING (blue) are also shown. |
png ; pdf |
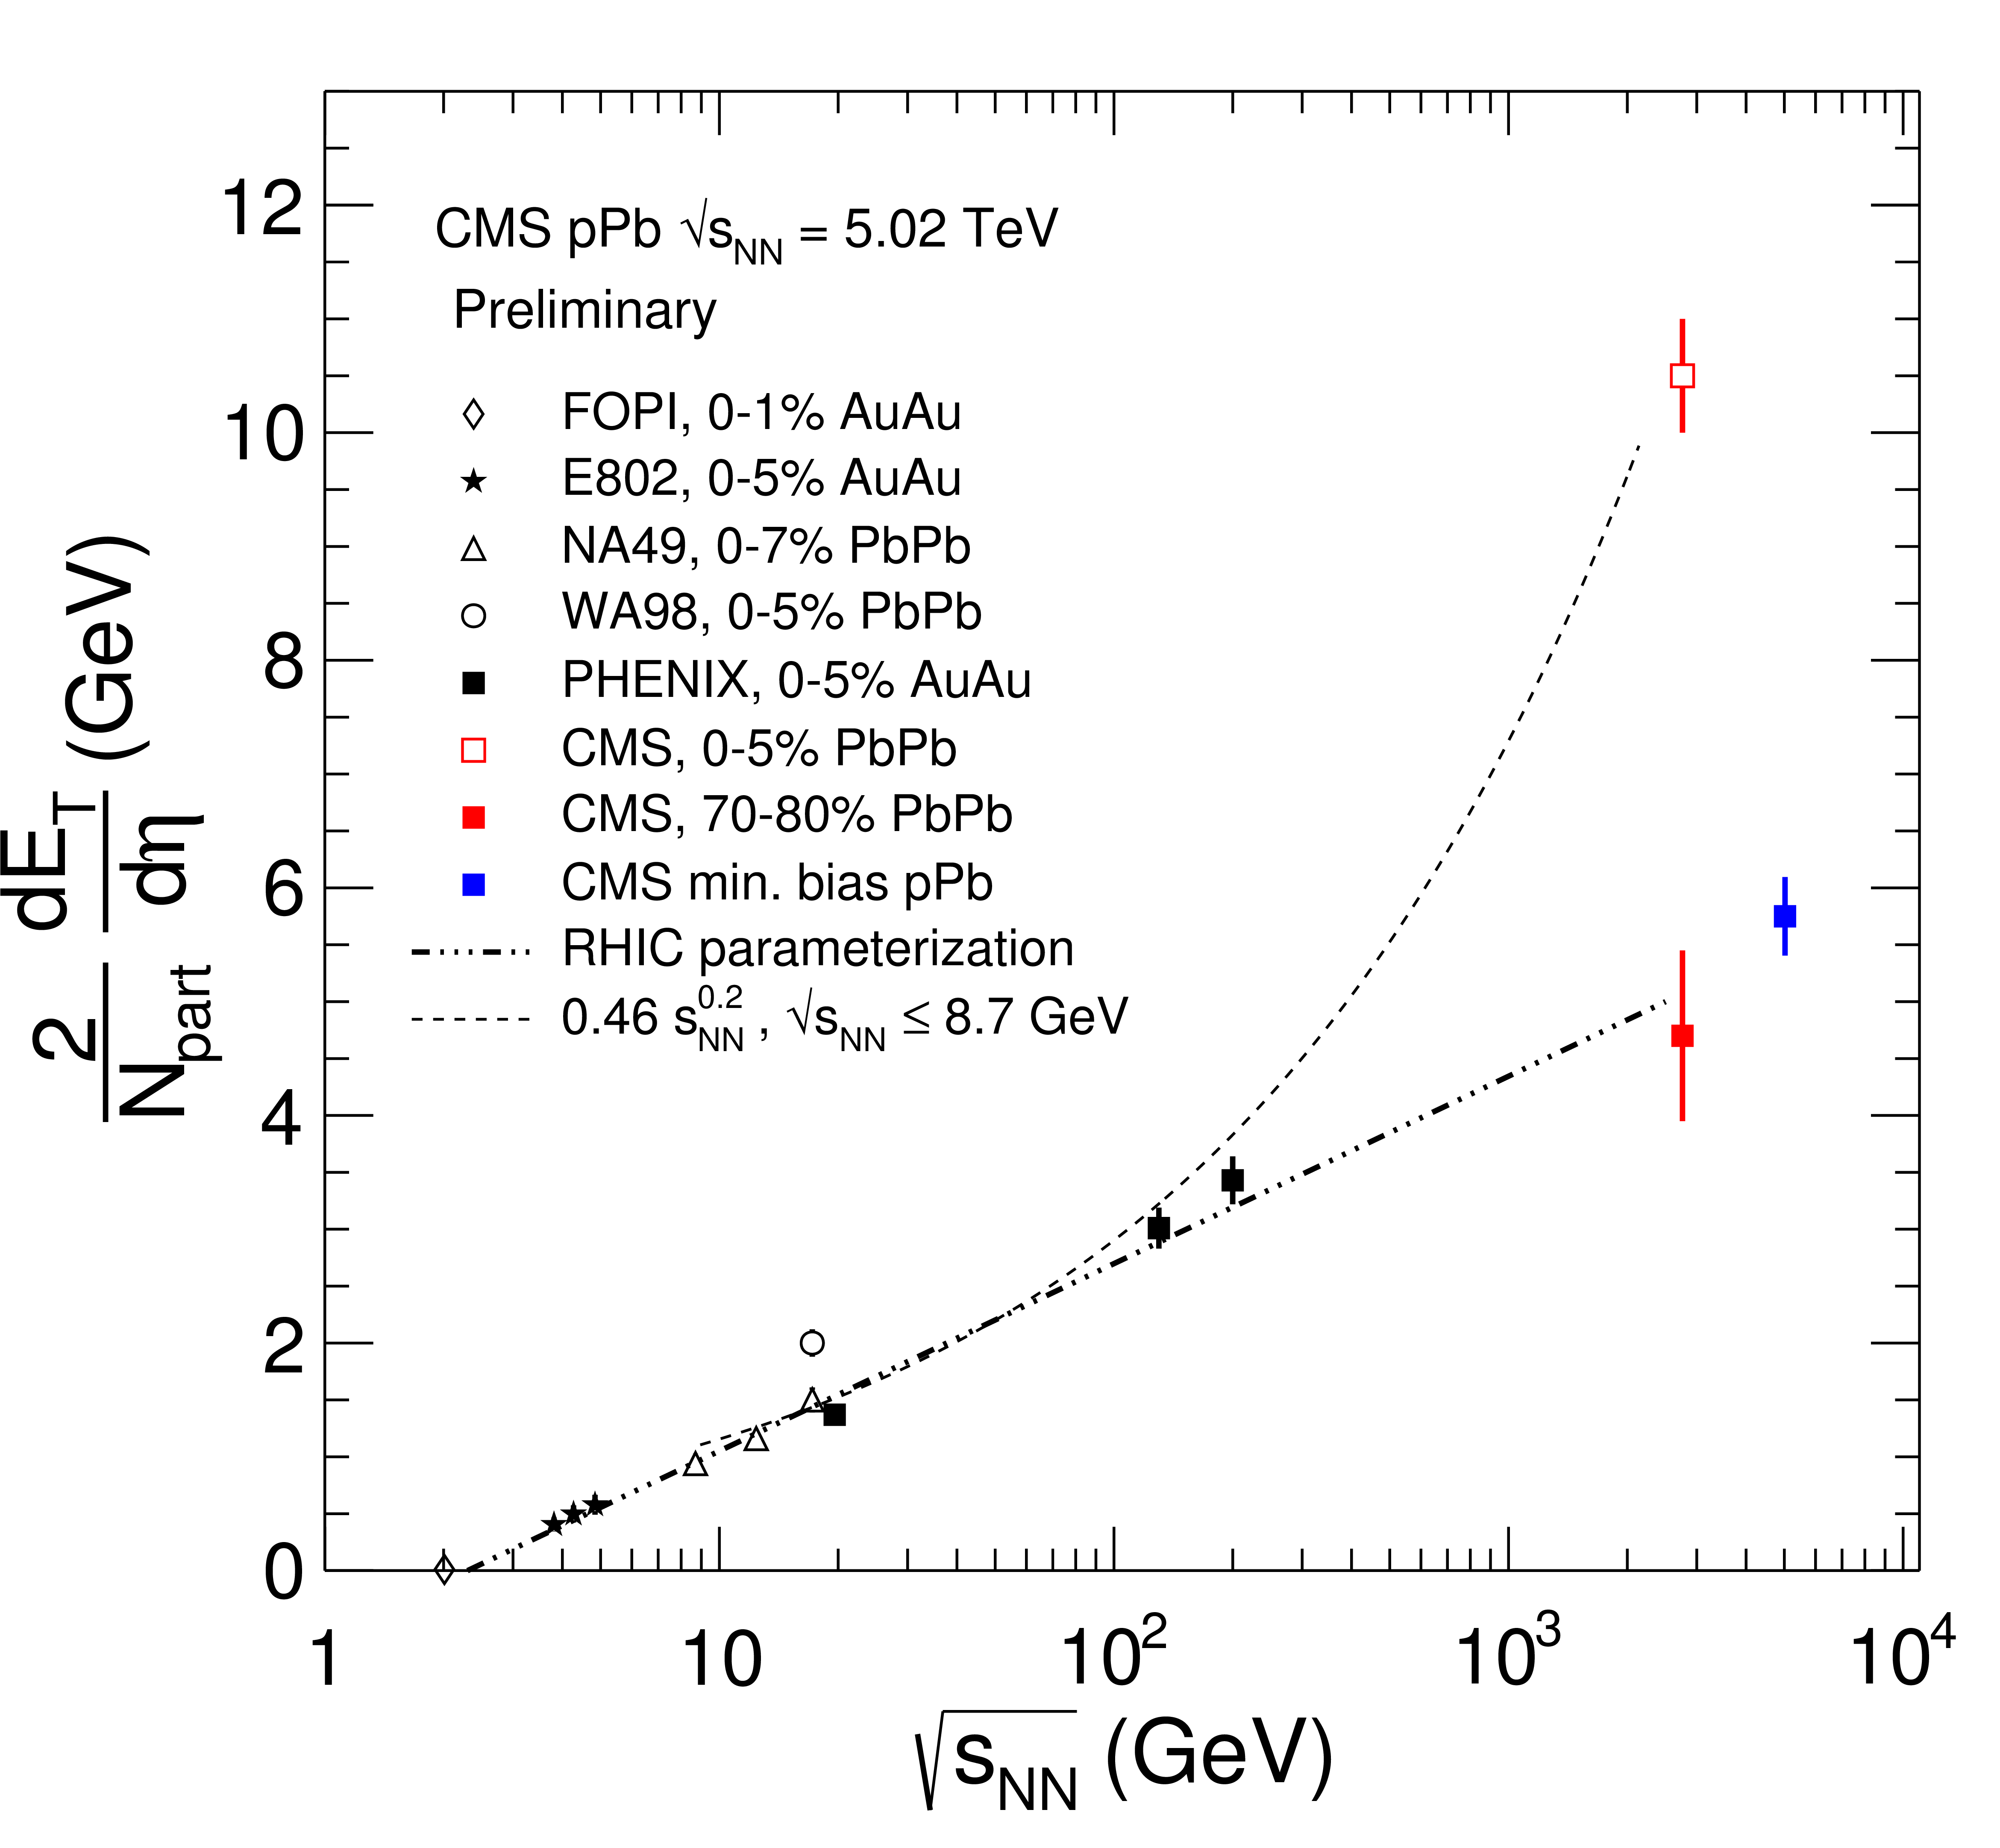
Figure 2:
$\mathrm{d}E_T/\mathrm{d}\eta \, 1/(0.5 \, N_{\rm part})$ versus $\sqrt {s_{\rm NN}}$ for AuAu, PbPb and pPb collisions. The RHIC parametrization (dashed-dotted) is extended to higher energies to guide the eye. |

png ; pdf |
Figure 3:
$(1/N)\mathrm{d}E_T/\mathrm{d}\eta $ versus $\eta $ and centrality from 5.02 TeV pPb collisions for HF-double (left), HF-single (center), and $N_{\rm Track}$ (right) centrality definitions for data EPOS-LHC and HIJING, for central collisions (top), 30 - 40% (middle), and 70-80% (bottom). The gray bands show the systematic errors on the data. These are largely correlated point to point. |
png ; pdf |
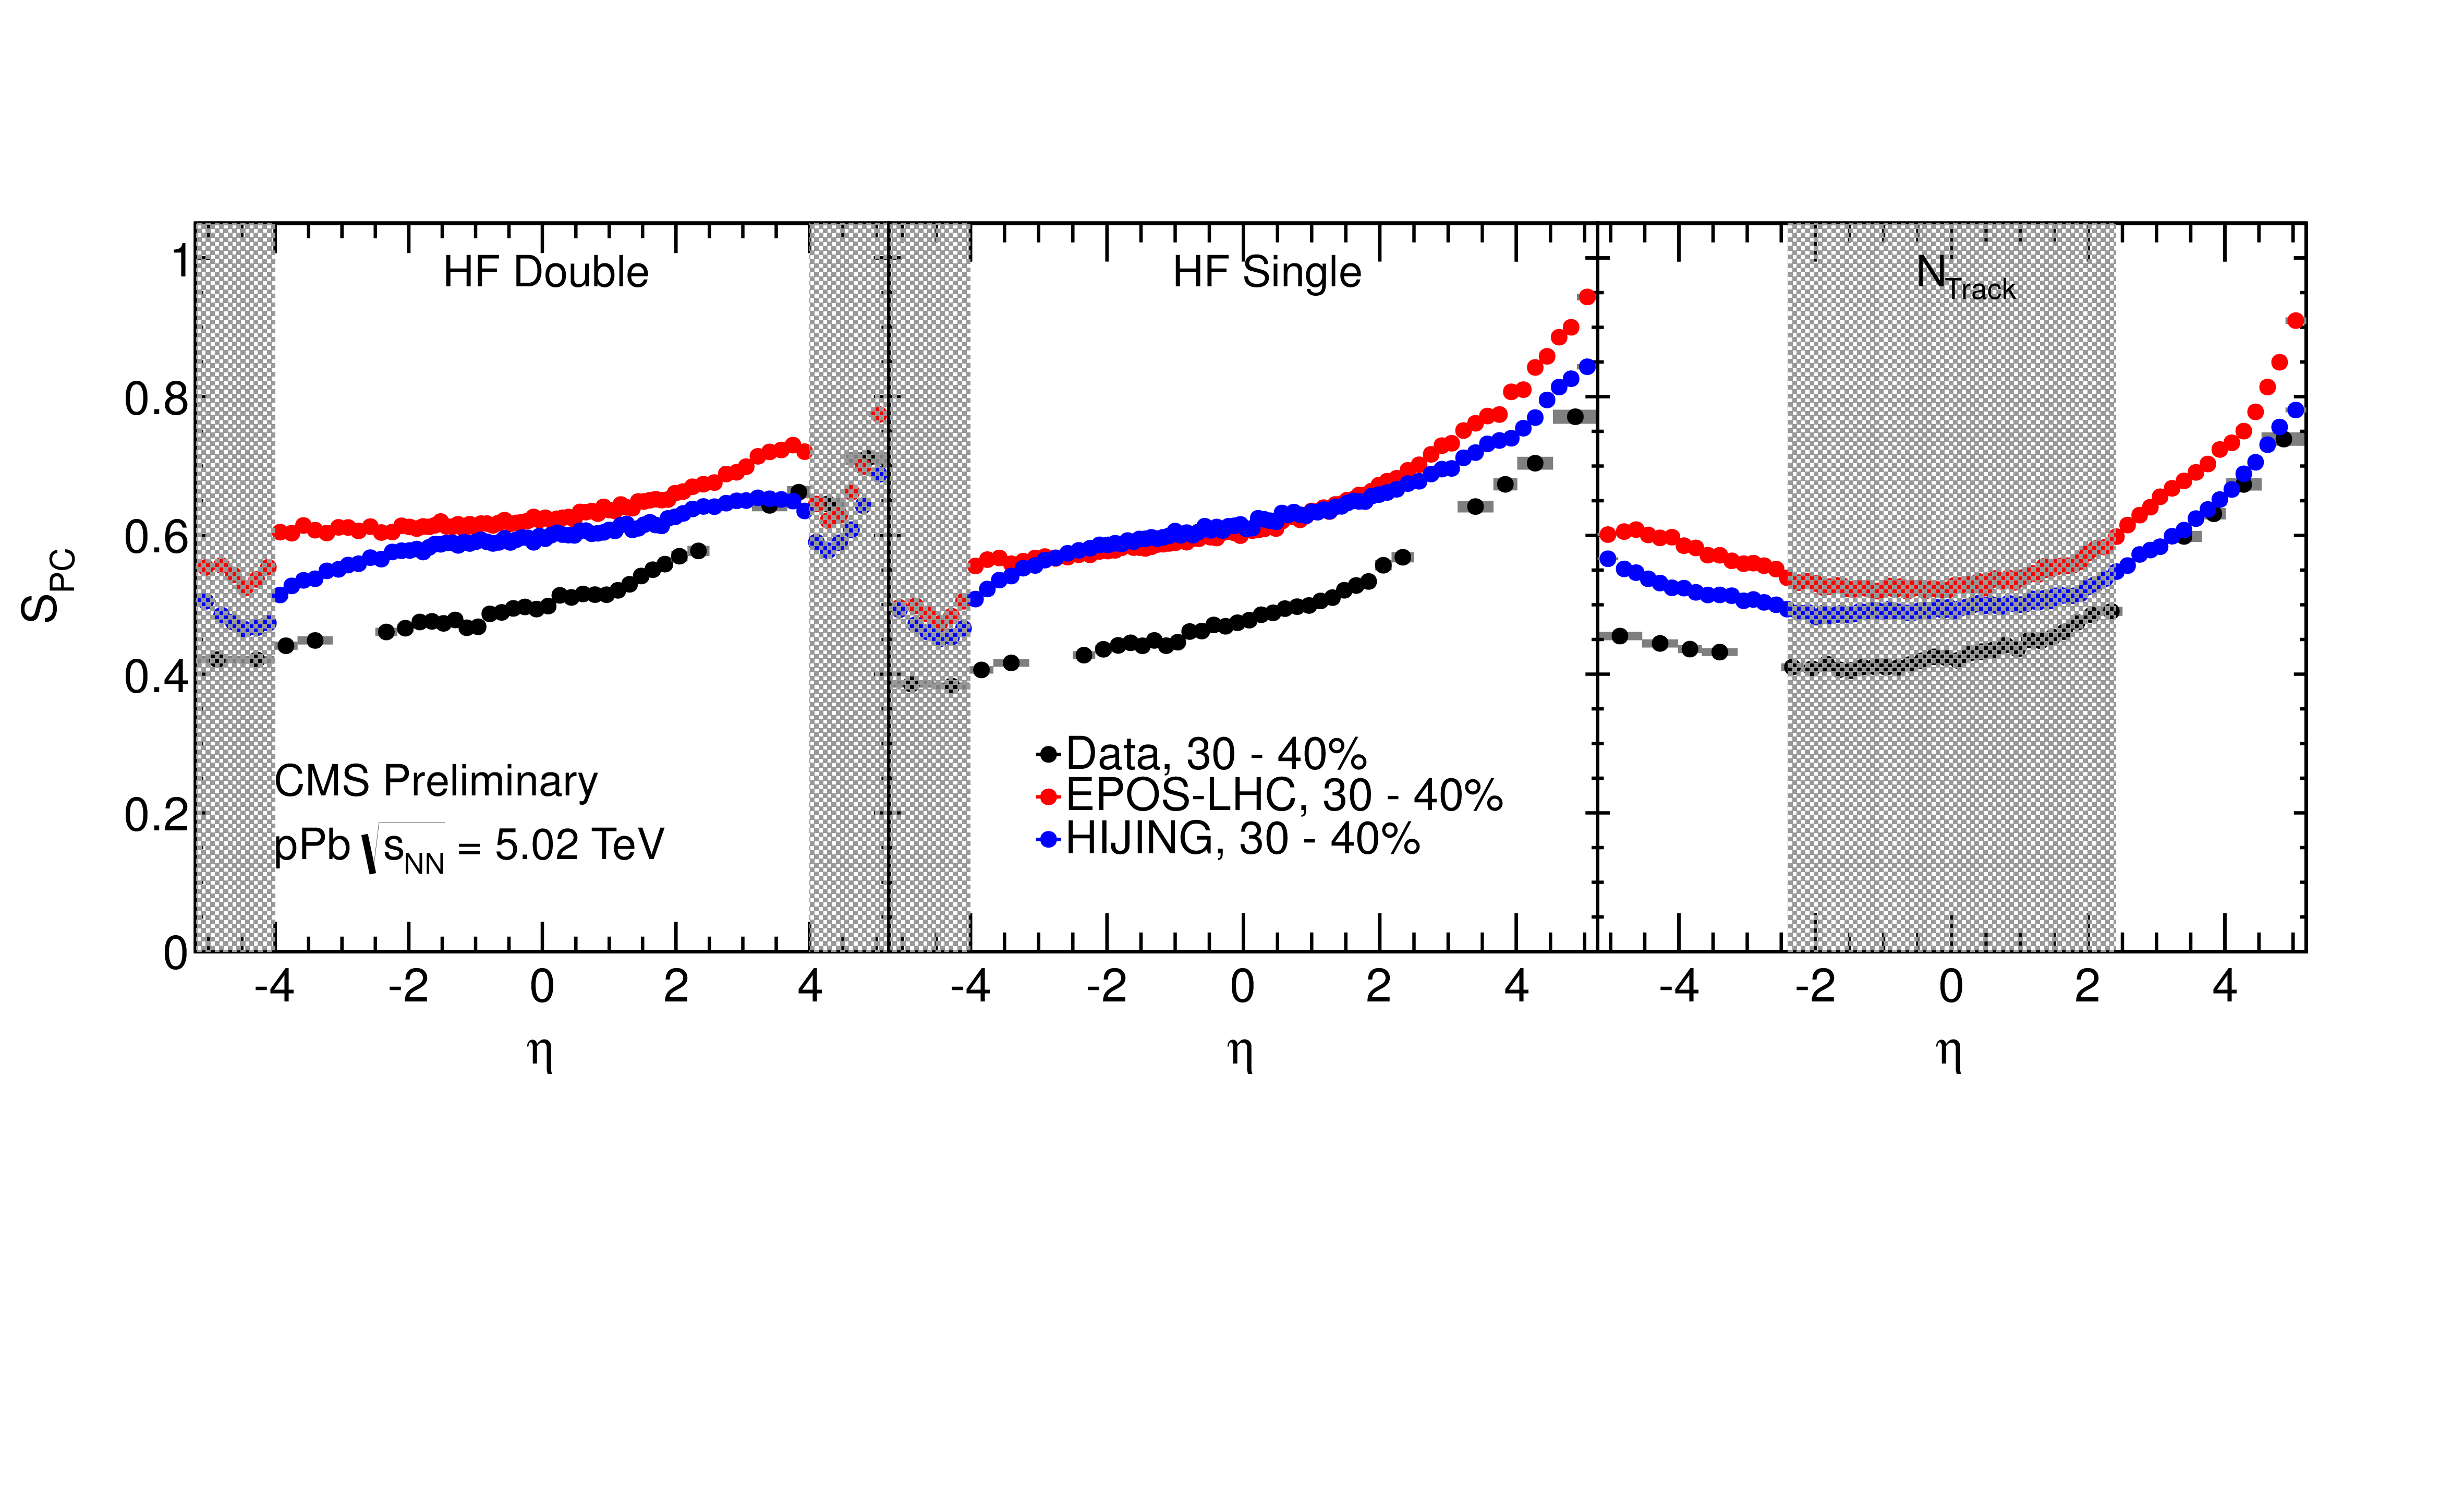
Figure 4:
$S_{PC}$ as a function of $\eta $ for events in the centrality range 30--40% selected by the HF-Double (left), HF-Single (middle) and $N_{\rm Track}$ (right) centrality definitions. The generated $S_{PC}$ for EPOS-LHC and HIJING are also shown . The vertical bands represent the $\eta $ region used to define centrality. |
png ; pdf |
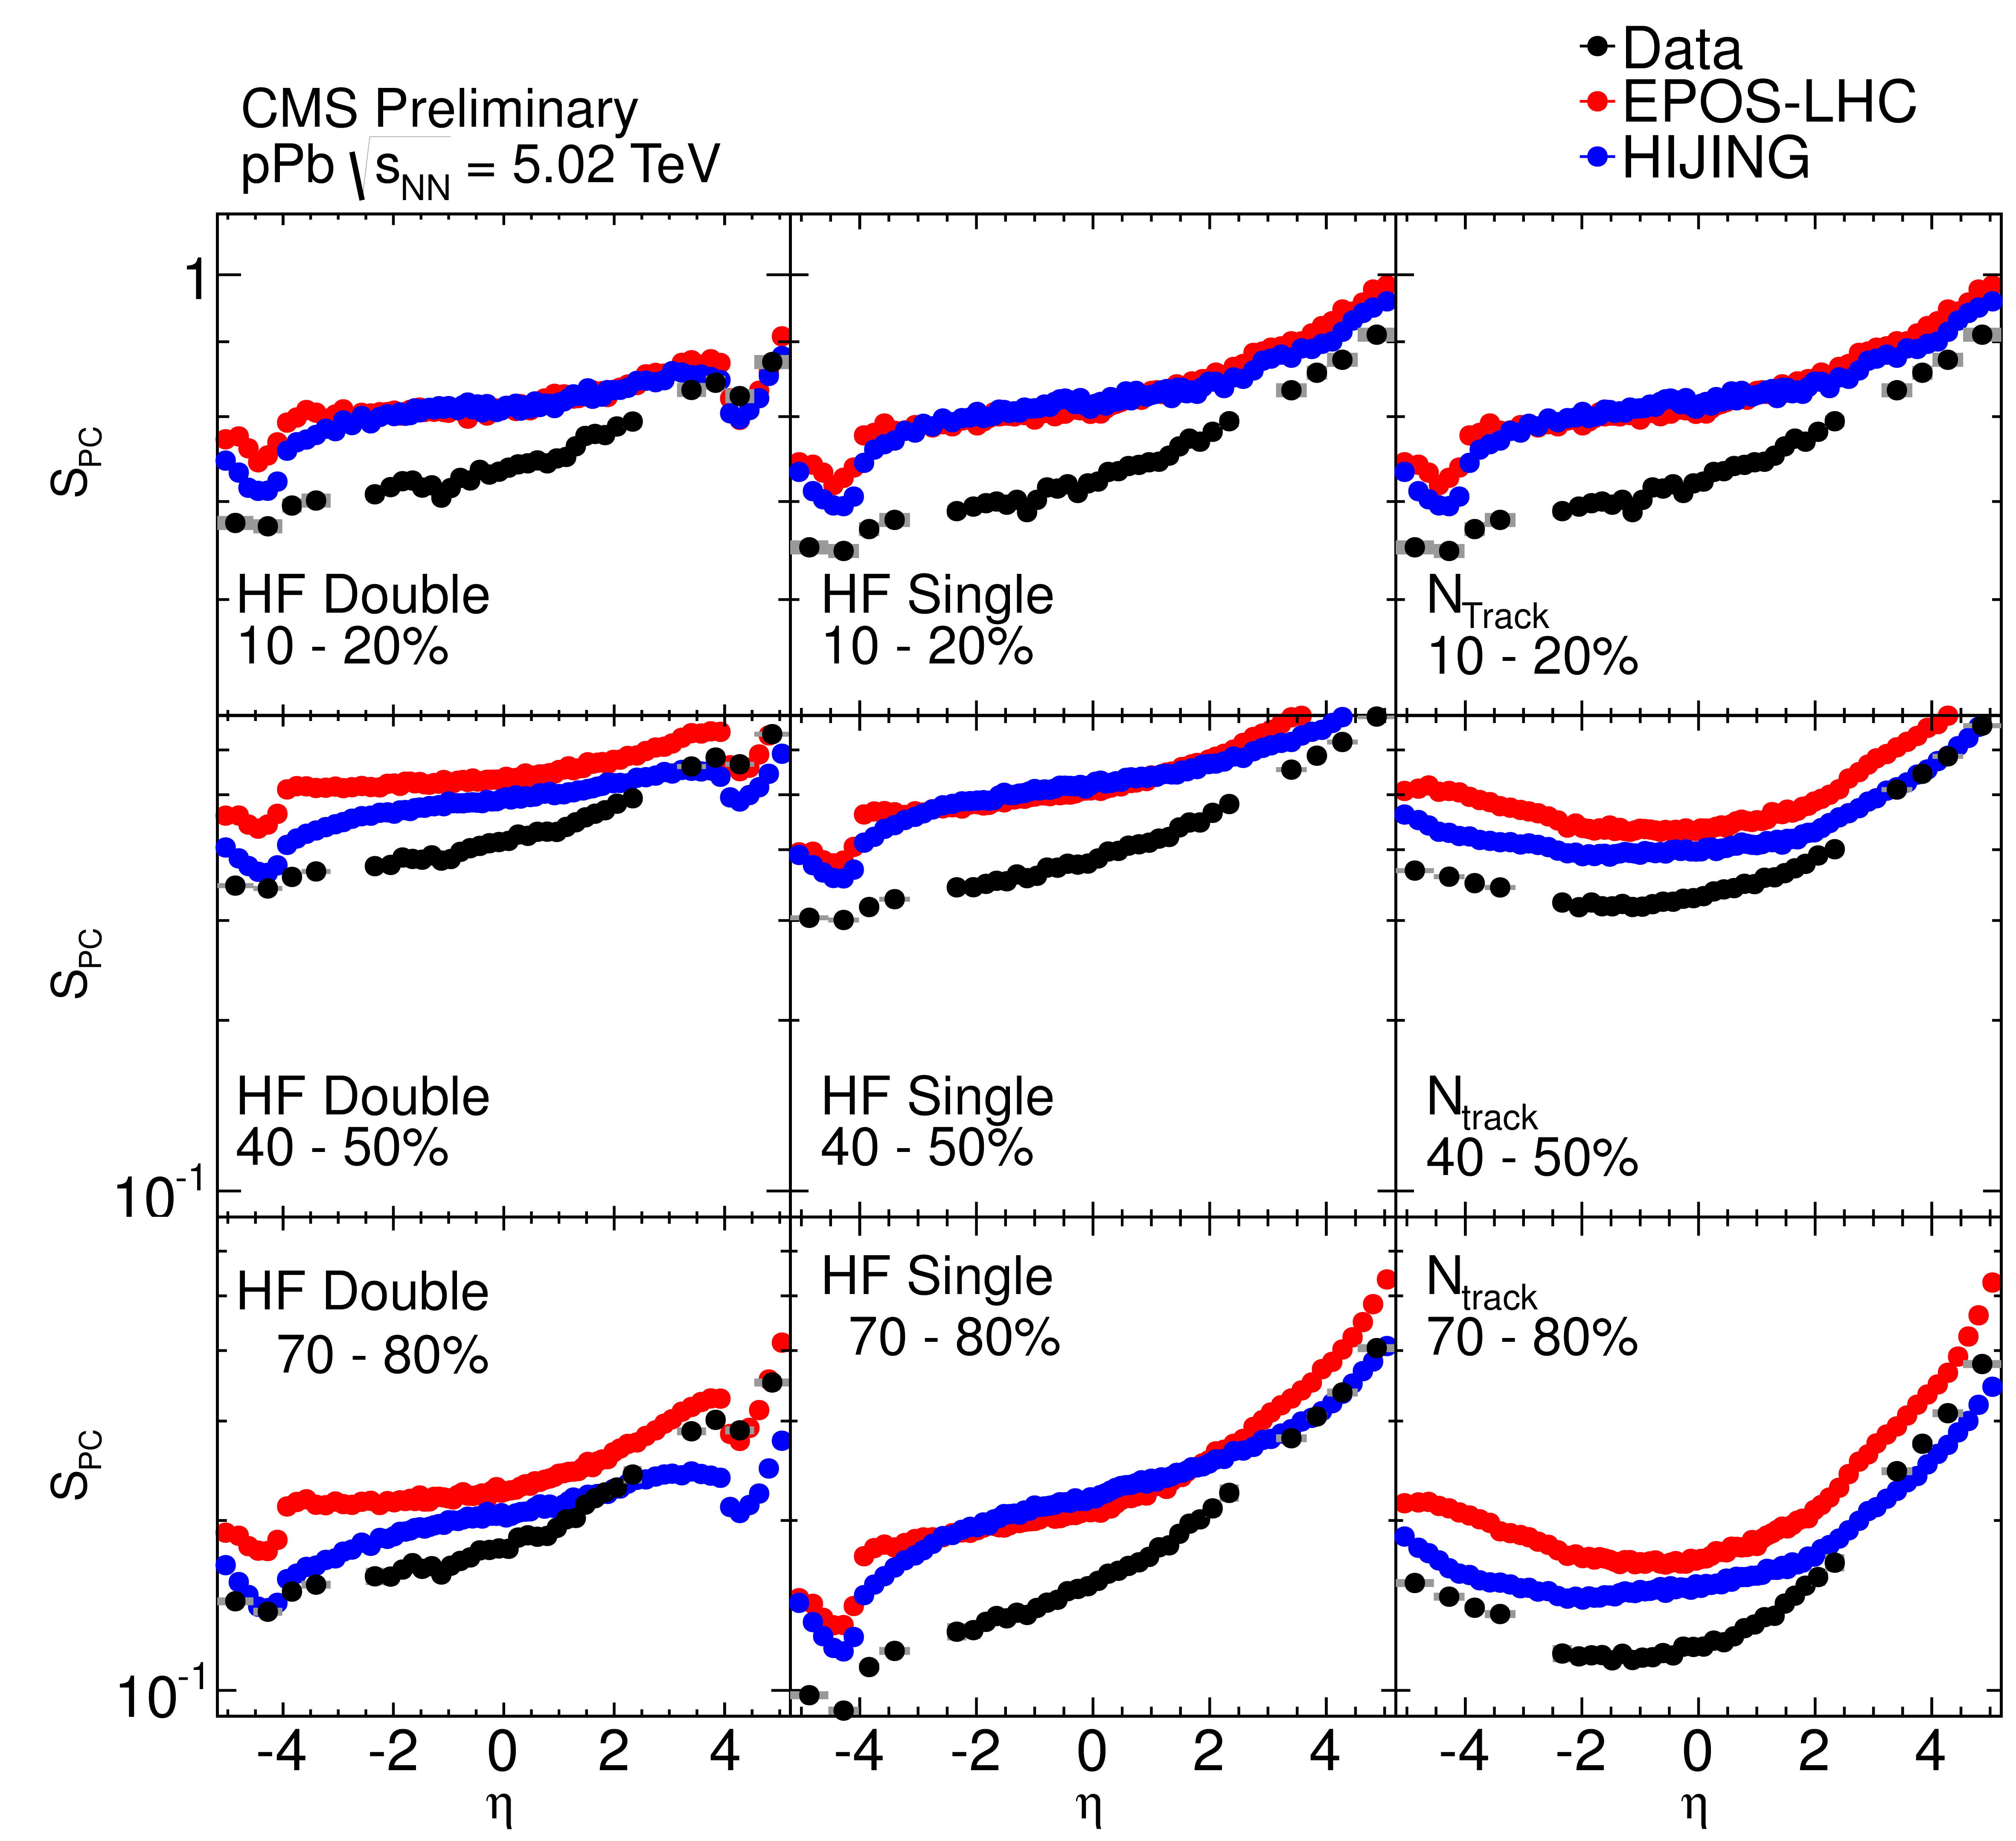
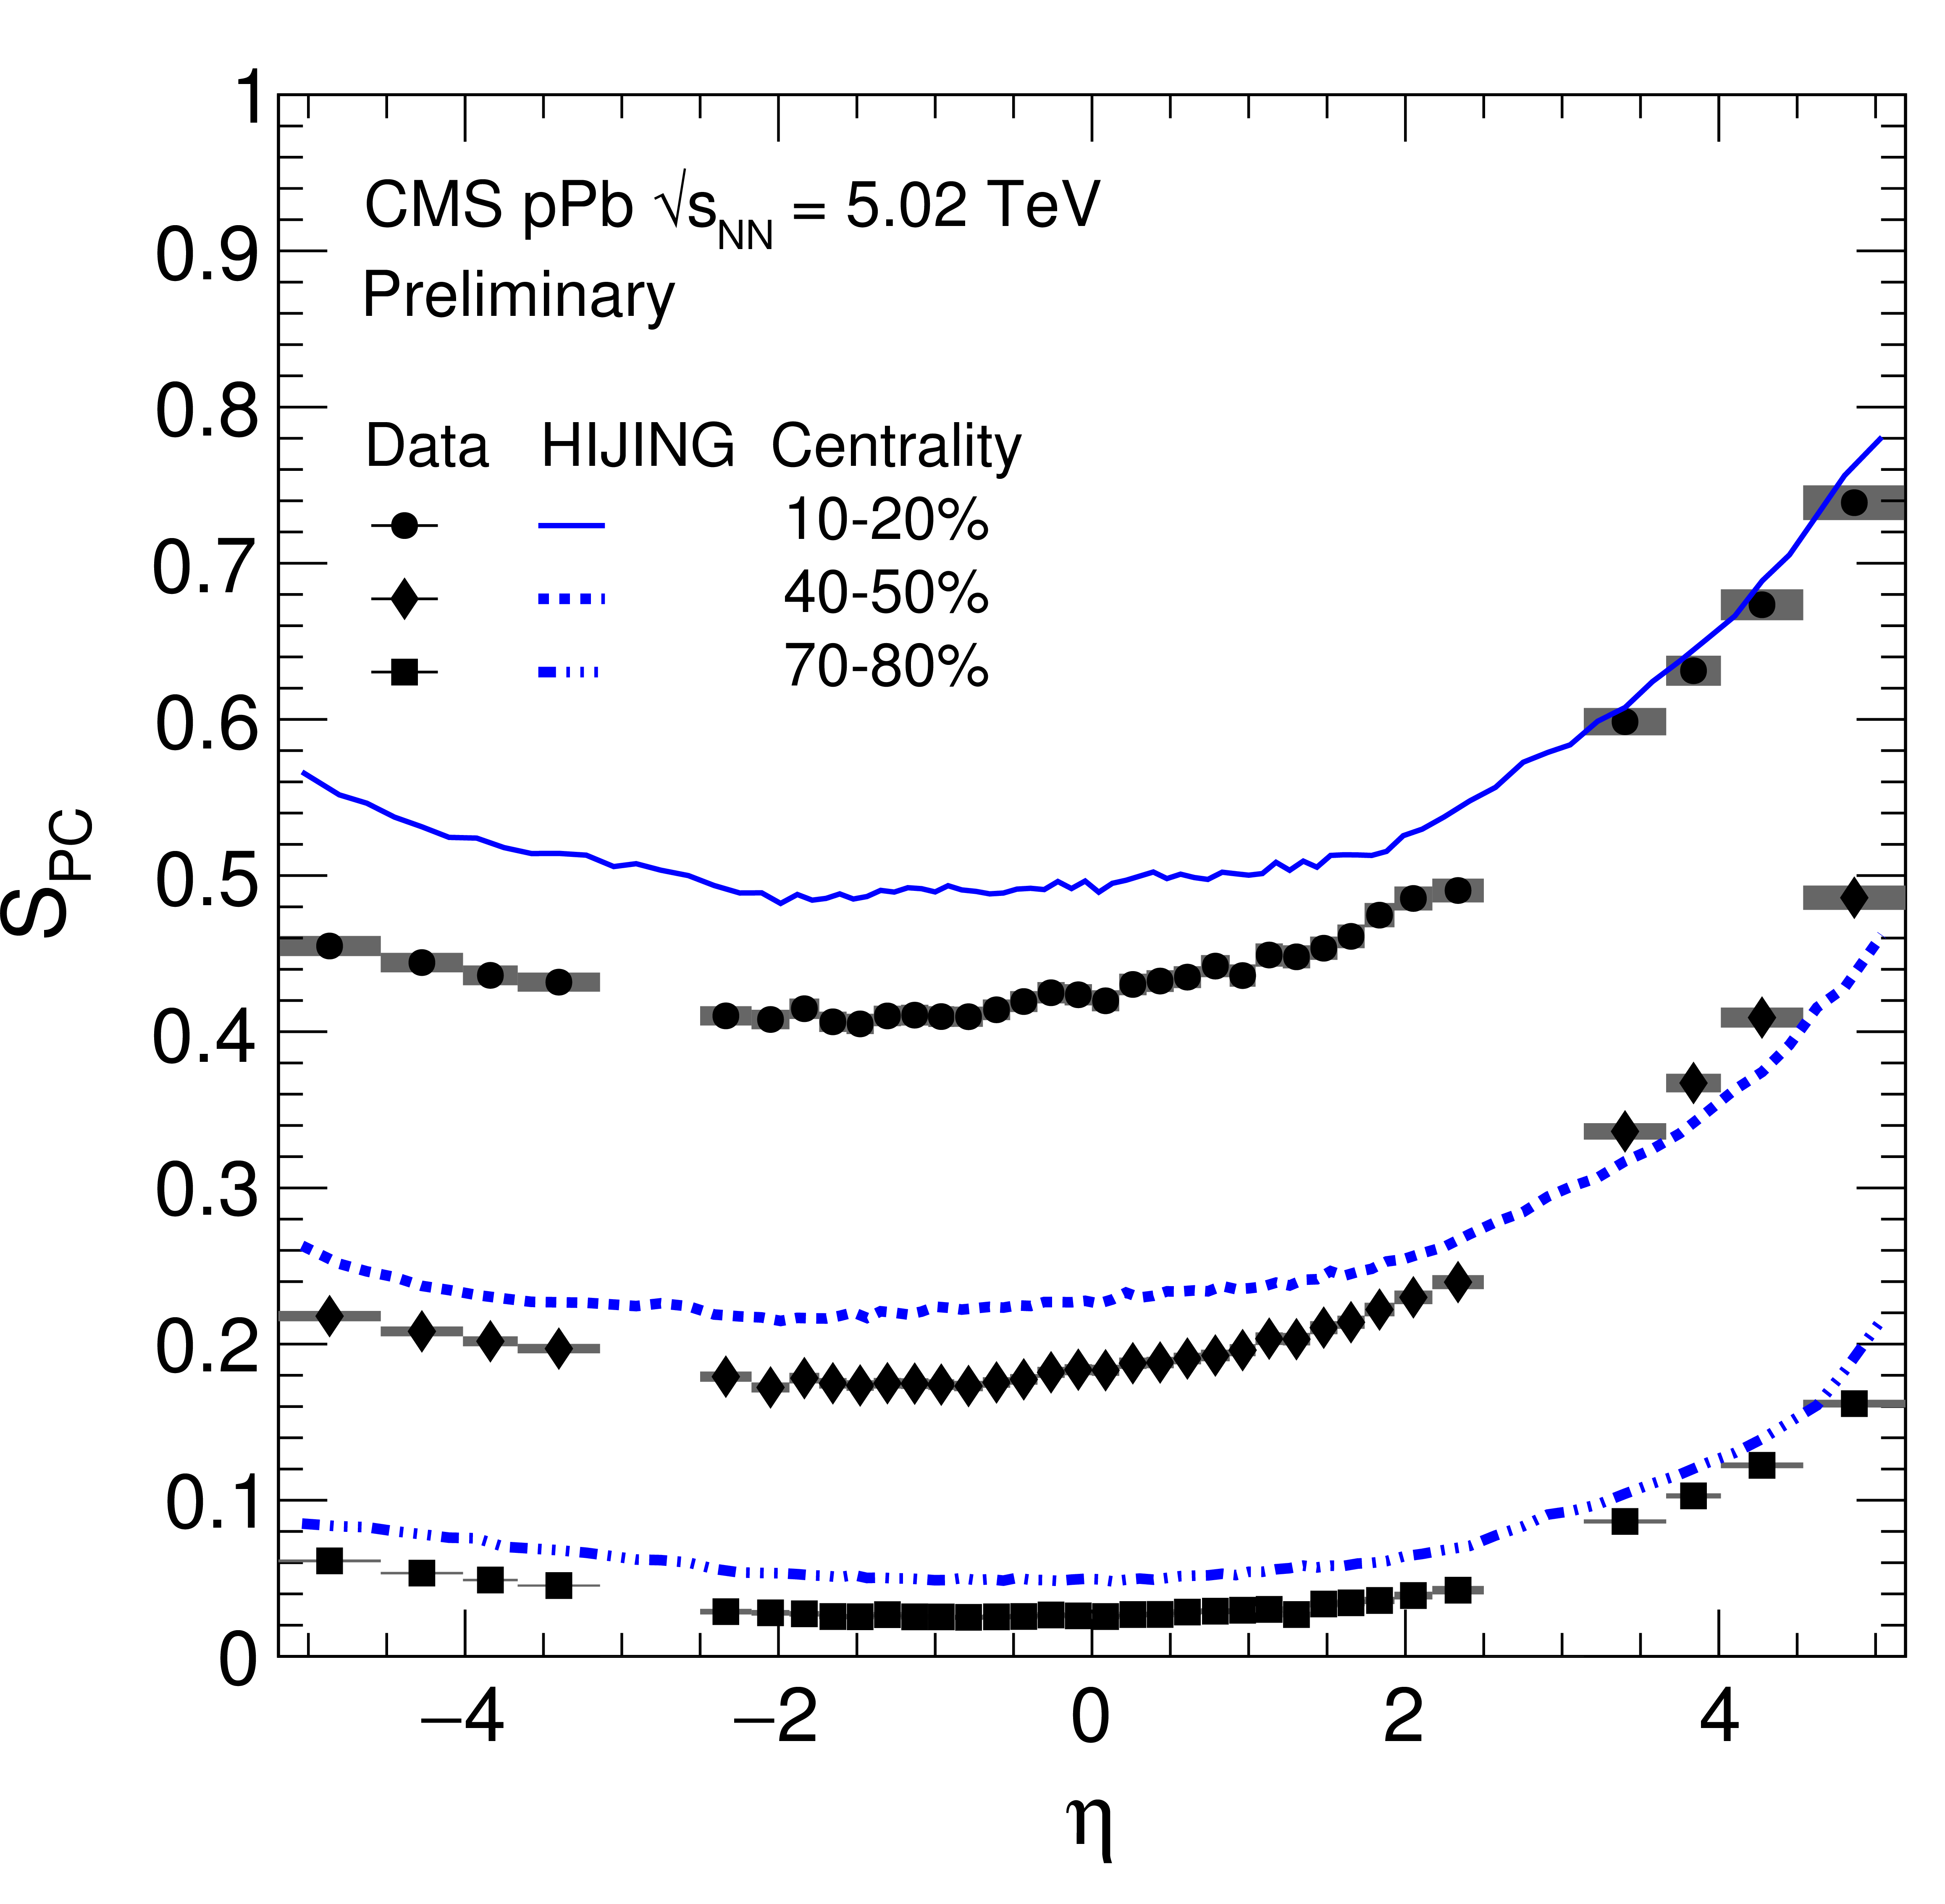
Figure 5:
$S_{PC}$ as a function of $\eta $ for 3 centrality ranges for HF-Double (left), HF-Single (middle) and $N_{\rm Track}$ (right) for data, EPOS-LHC and HIJING. The statistical errors are shown by lines and the systematic errors by gray error bands. The systematic errors are largely correlated point to point. |
png ; pdf |
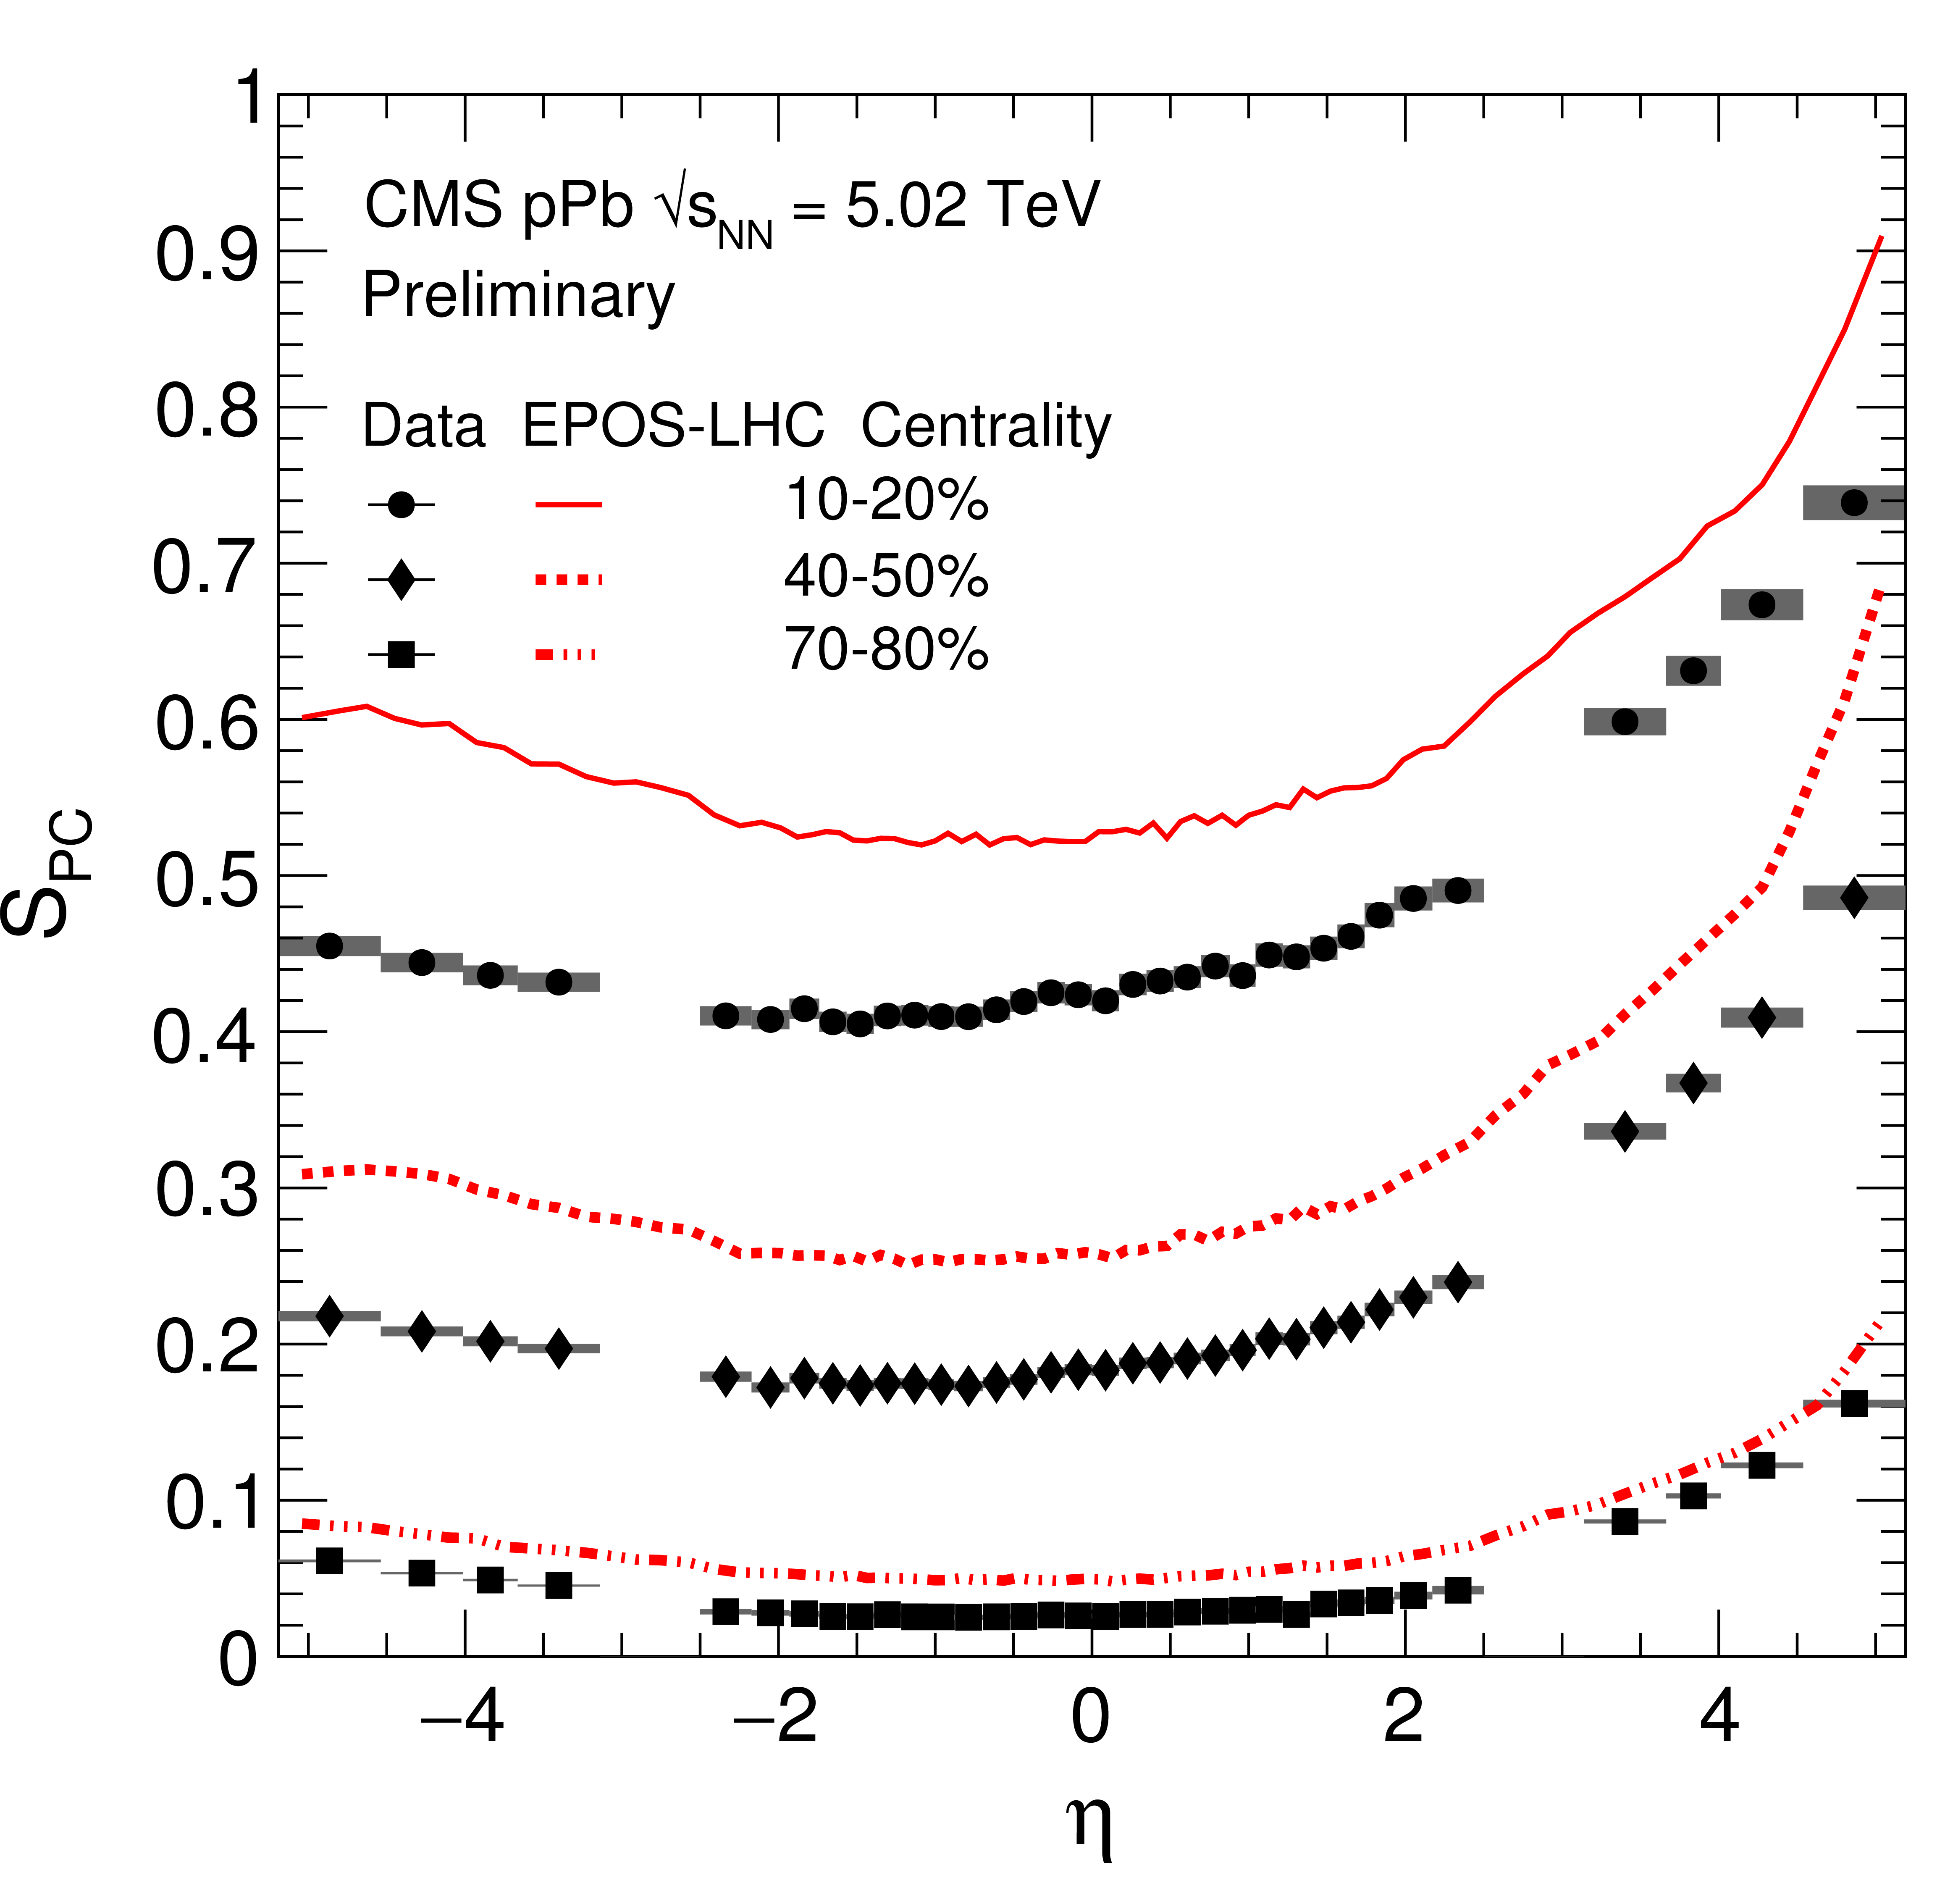
Figure 6-a:
$S_{PC}$ for the $N_{\rm Track}$ centrality definition as a function of $\eta $ for data and EPOS-LHC (a) and data and HIJING (b). The error bars represent the statistical errors while the bands represent the systematic errors. |
png ; pdf |
Figure 6-b:
$S_{PC}$ for the $N_{\rm Track}$ centrality definition as a function of $\eta $ for data and EPOS-LHC (a) and data and HIJING (b). The error bars represent the statistical errors while the bands represent the systematic errors. |
| Tables | |

png ; pdf |
Table 1:
Systematic errors on $(1/N)\mathrm{d}E_T/\mathrm{d}\eta $ for the tracker region $|\eta | < 2.5$. |

png ; pdf |
Table 2:
Systematic errors on $S_{pc}$ for $|\eta | < 2.5$. |

png ; pdf |
Table 3:
Systematic errors on $S_{pc}$ for the HF region, i.e. $3.0< |\eta | < 5.2 $. |
|
|
Compact Muon Solenoid LHC, CERN |
|

|

|

|

|

|