

Compact Muon Solenoid
LHC, CERN
| CMS-PAS-HIN-14-009 | ||
| $\mathrm{J}/\psi$ production in pPb collisions | ||
| CMS Collaboration | ||
| August 2015 | ||
| Abstract: This document reports on the measurement of the prompt and non-prompt $\mathrm{J}/\psi$ in proton-lead collisions at a center-of-mass energy per nucleon pair of 5.02 TeV with an integrated luminosity of 34.6 nb$^{-1}$ recorded by the CMS experiment at the LHC in 2013. Prompt $\mathrm{J}/\psi$ and non-prompt $\mathrm{J}/\psi$ from b-hadron decays are measured and investigated separately, via their $ \mu^{+} \mu^{-} $ decay mode. The differential production cross section is presented in the range 2 $< p_{\mathrm T} <$ 30 GeV/$c$ and rapidity -2.87 $< y_{CM} <$ 1.93 in the proton-nucleon center-of-mass frame. The ratio of the forward and backward production yields is measured in bins of $p_{\mathrm T}$, rapidity and a variable describing the event activity. The prompt and non-prompt $\mathrm{J}/\psi$ yields at forward rapidities are smaller than those at backward rapidities, with a dependence on the event activity. These results point to the presence of cold nuclear matter effects expected for pPb collisions. | ||
|
Links:
CDS record (PDF) ;
Public twiki page ;
CADI line (restricted) ; Figures are also available from the CDS record. These preliminary results are superseded in this paper, EPJC 77 (2017) 269. The superseded preliminary plots can be found here. |
||
| Figures | |
png ; pdf |
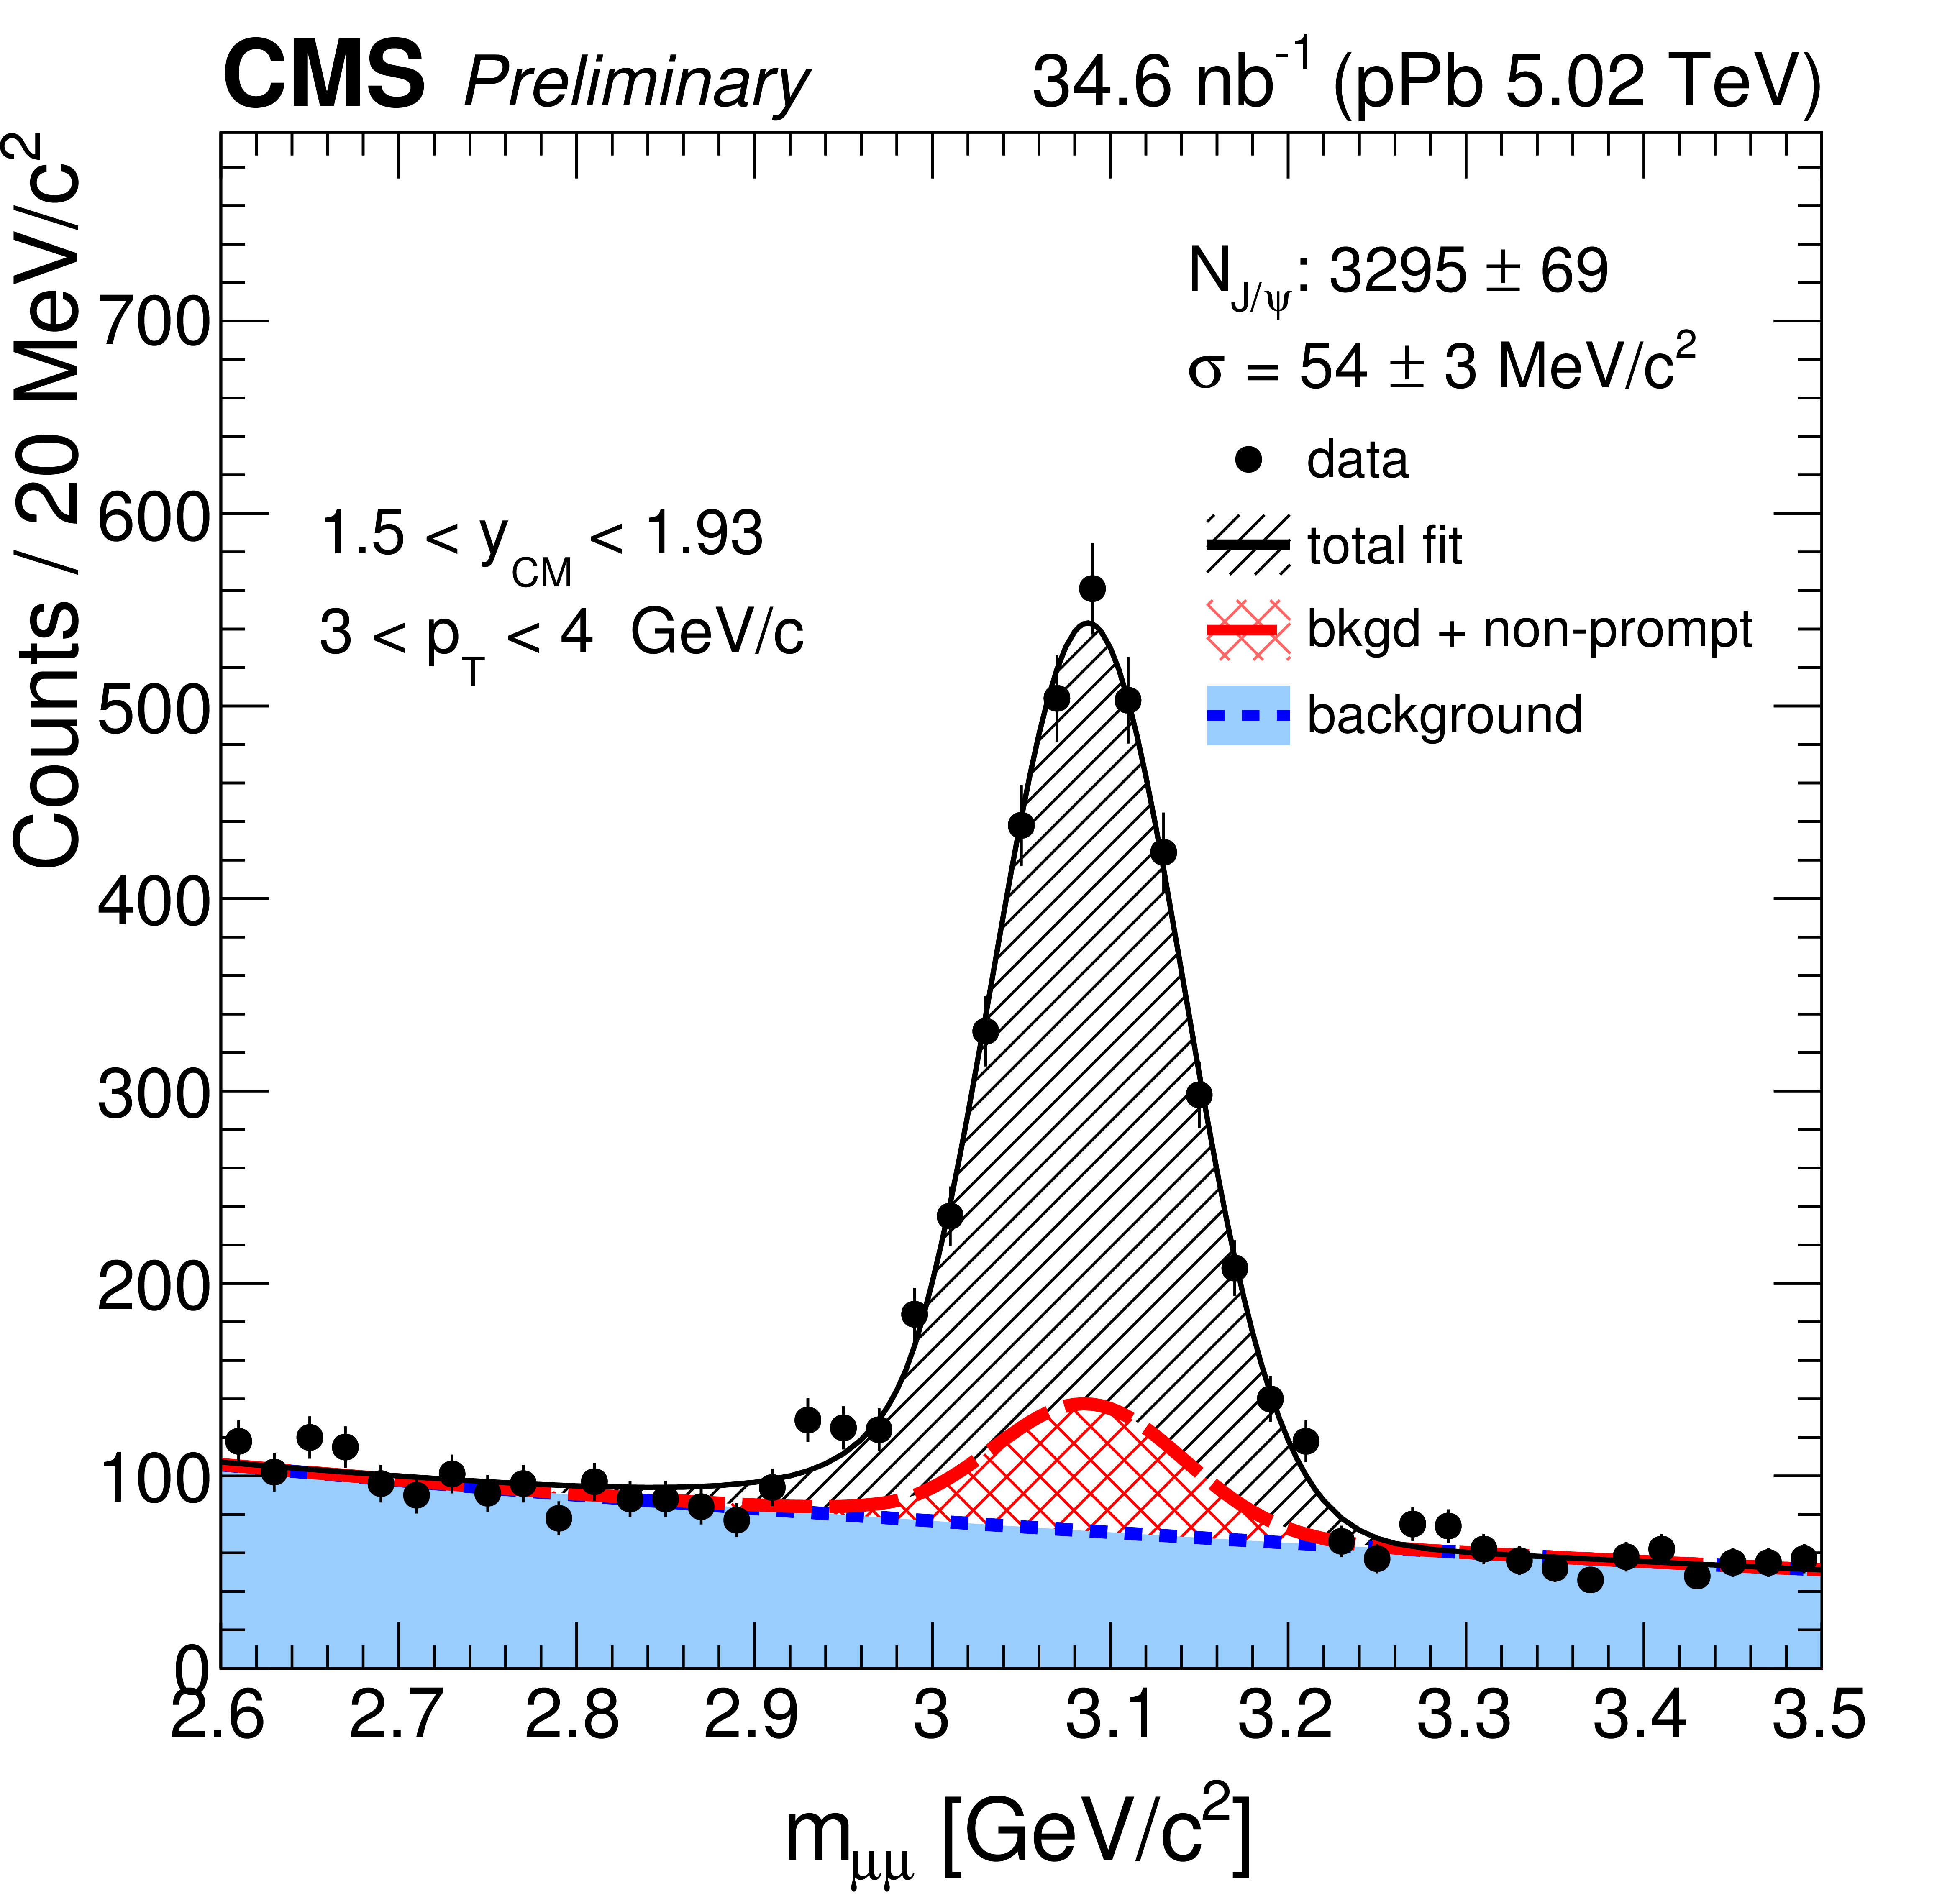
Figure 1-a:
Invariant-mass (a) and pseudo-proper decay length distributions (b) of $ {\mu ^+\mu ^-} $ pairs for two analysis bins. The projections of the 2D fit function onto the respective axes are overlaid as black solid lines. The red dashed lines show the fitted contribution of non-prompt $ \mathrm{J} / \psi $. The fitted background contributions are shown by blue dotted lines. |
png ; pdf |
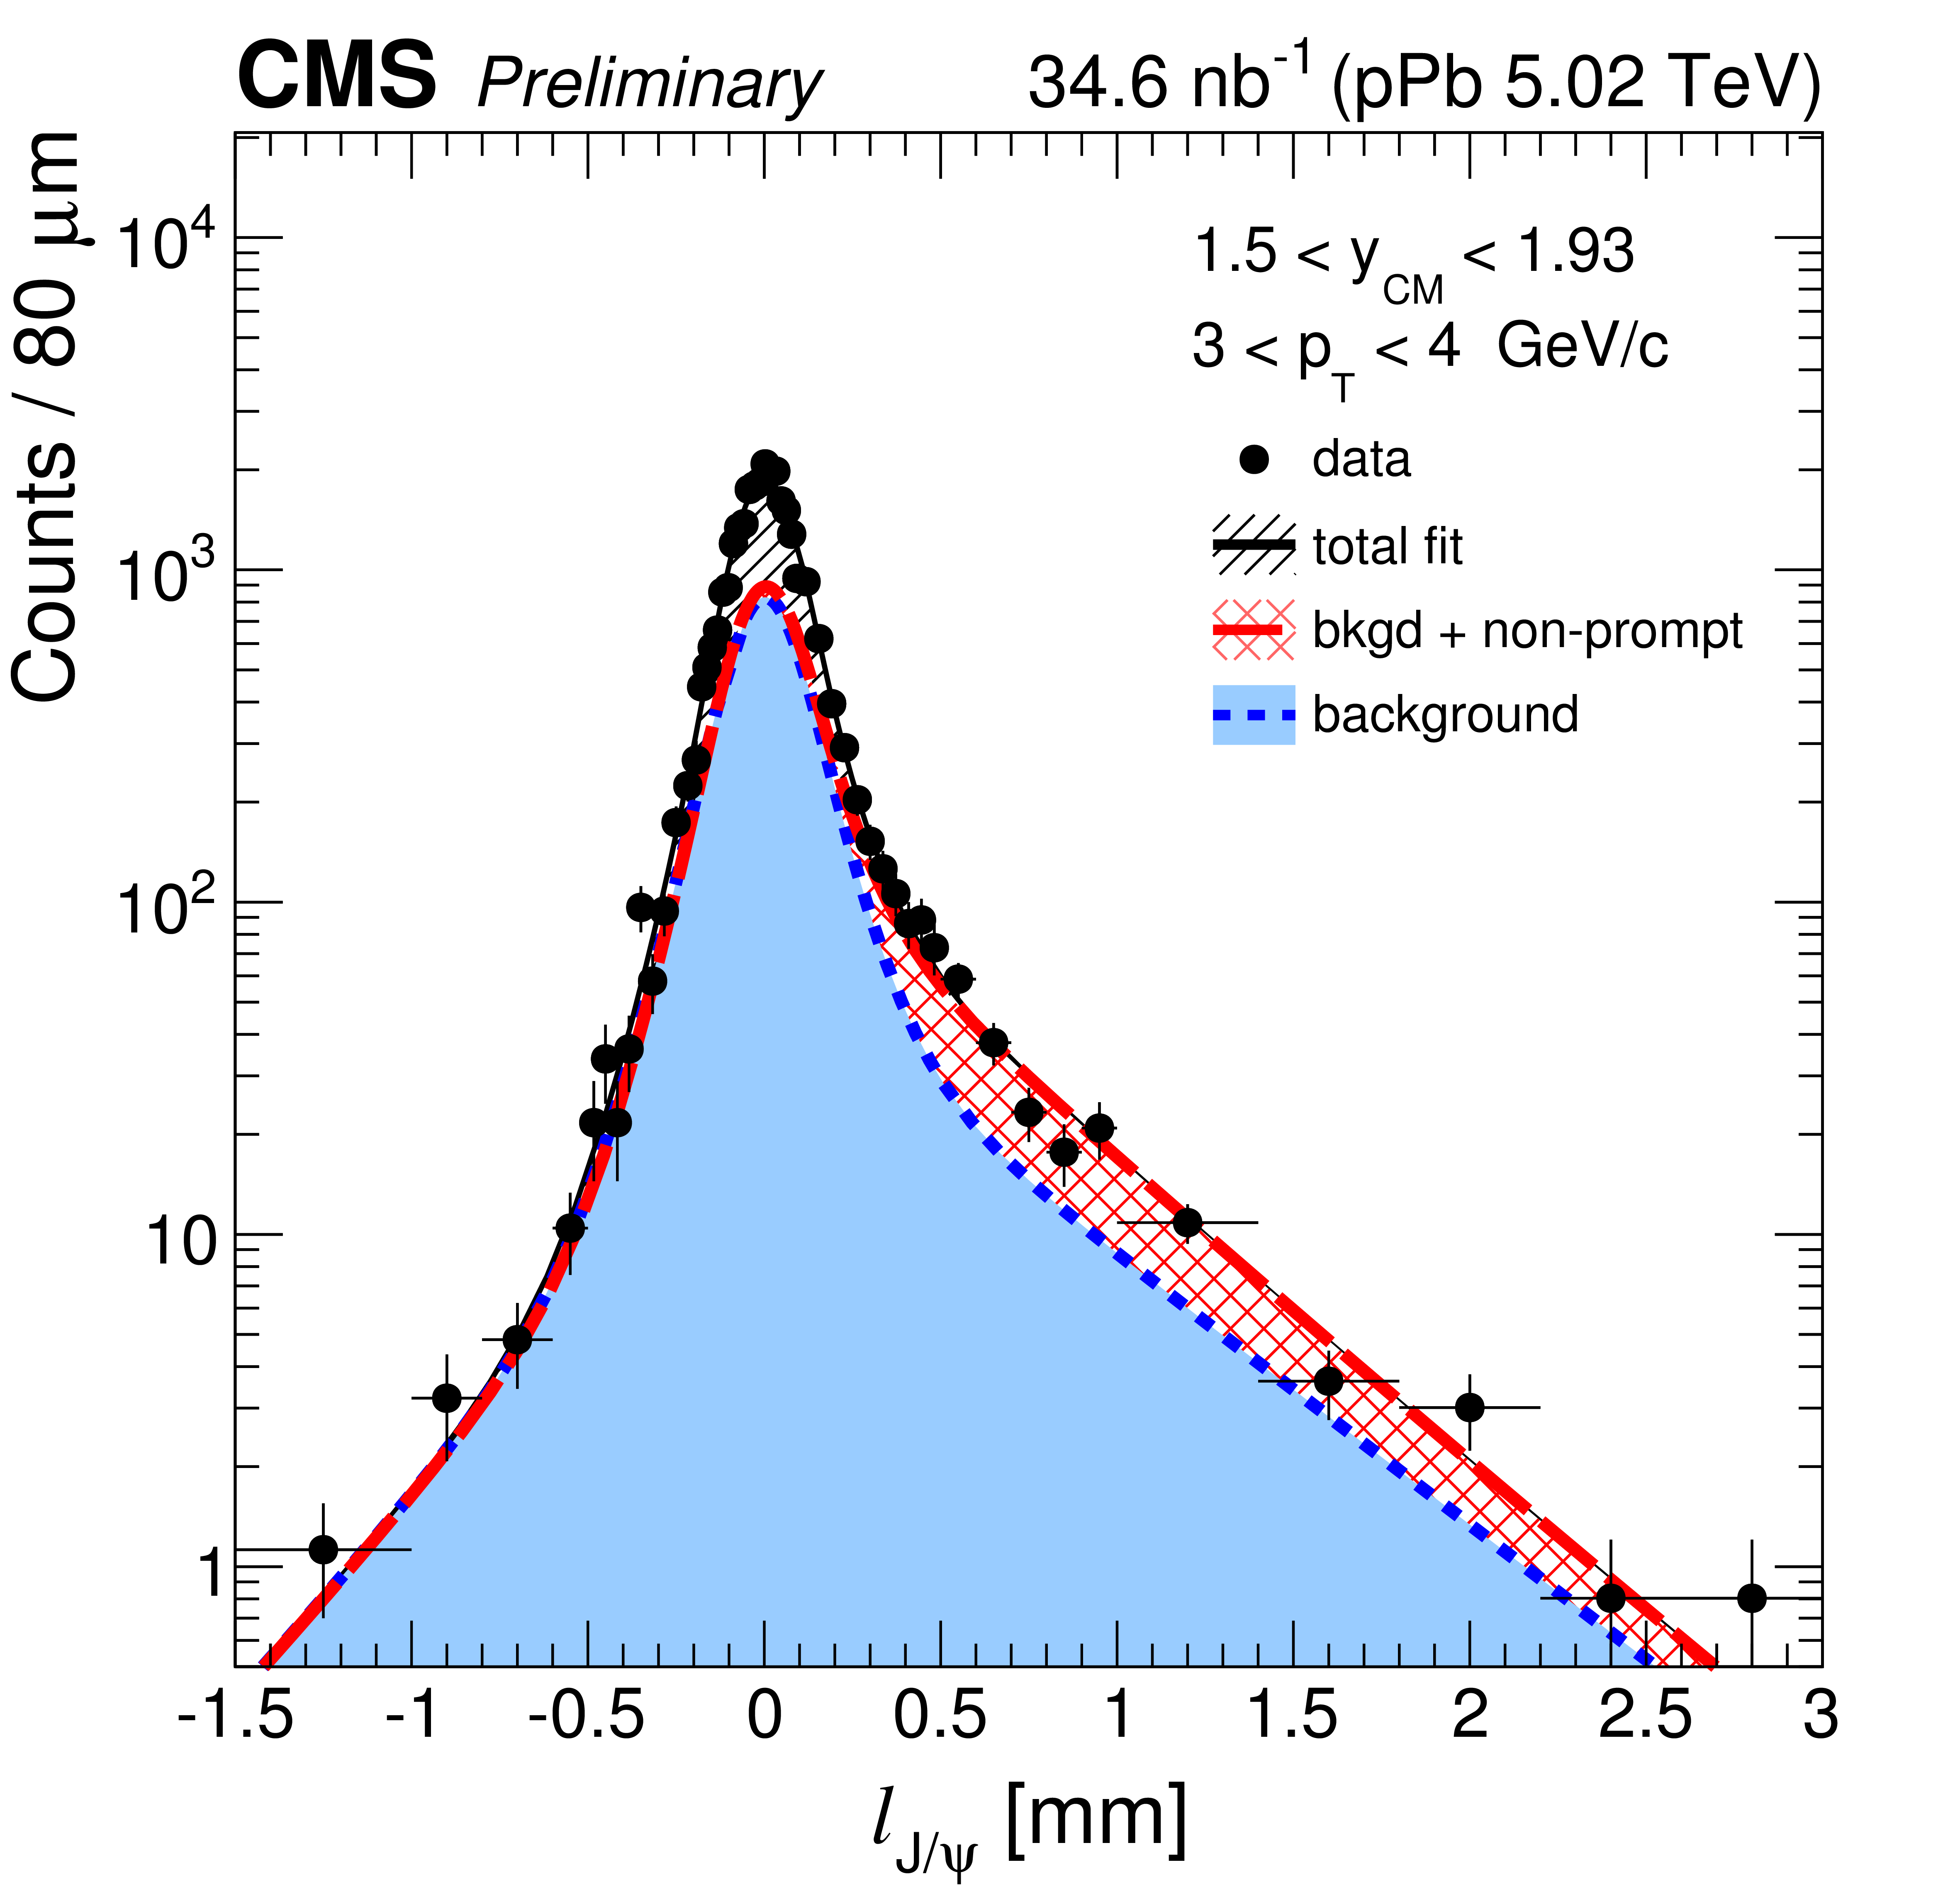
Figure 1-b:
Invariant-mass (a) and pseudo-proper decay length distributions (b) of $ {\mu ^+\mu ^-} $ pairs for two analysis bins. The projections of the 2D fit function onto the respective axes are overlaid as black solid lines. The red dashed lines show the fitted contribution of non-prompt $ \mathrm{J} / \psi $. The fitted background contributions are shown by blue dotted lines. |

png ; pdf |
Figure 1-c:
Invariant-mass (a) and pseudo-proper decay length distributions (b) of $ {\mu ^+\mu ^-} $ pairs for two analysis bins. The projections of the 2D fit function onto the respective axes are overlaid as black solid lines. The red dashed lines show the fitted contribution of non-prompt $ \mathrm{J} / \psi $. The fitted background contributions are shown by blue dotted lines. |

png ; pdf |
Figure 1-d:
Invariant-mass (a) and pseudo-proper decay length distributions (b) of $ {\mu ^+\mu ^-} $ pairs for two analysis bins. The projections of the 2D fit function onto the respective axes are overlaid as black solid lines. The red dashed lines show the fitted contribution of non-prompt $ \mathrm{J} / \psi $. The fitted background contributions are shown by blue dotted lines. |
png ; pdf |
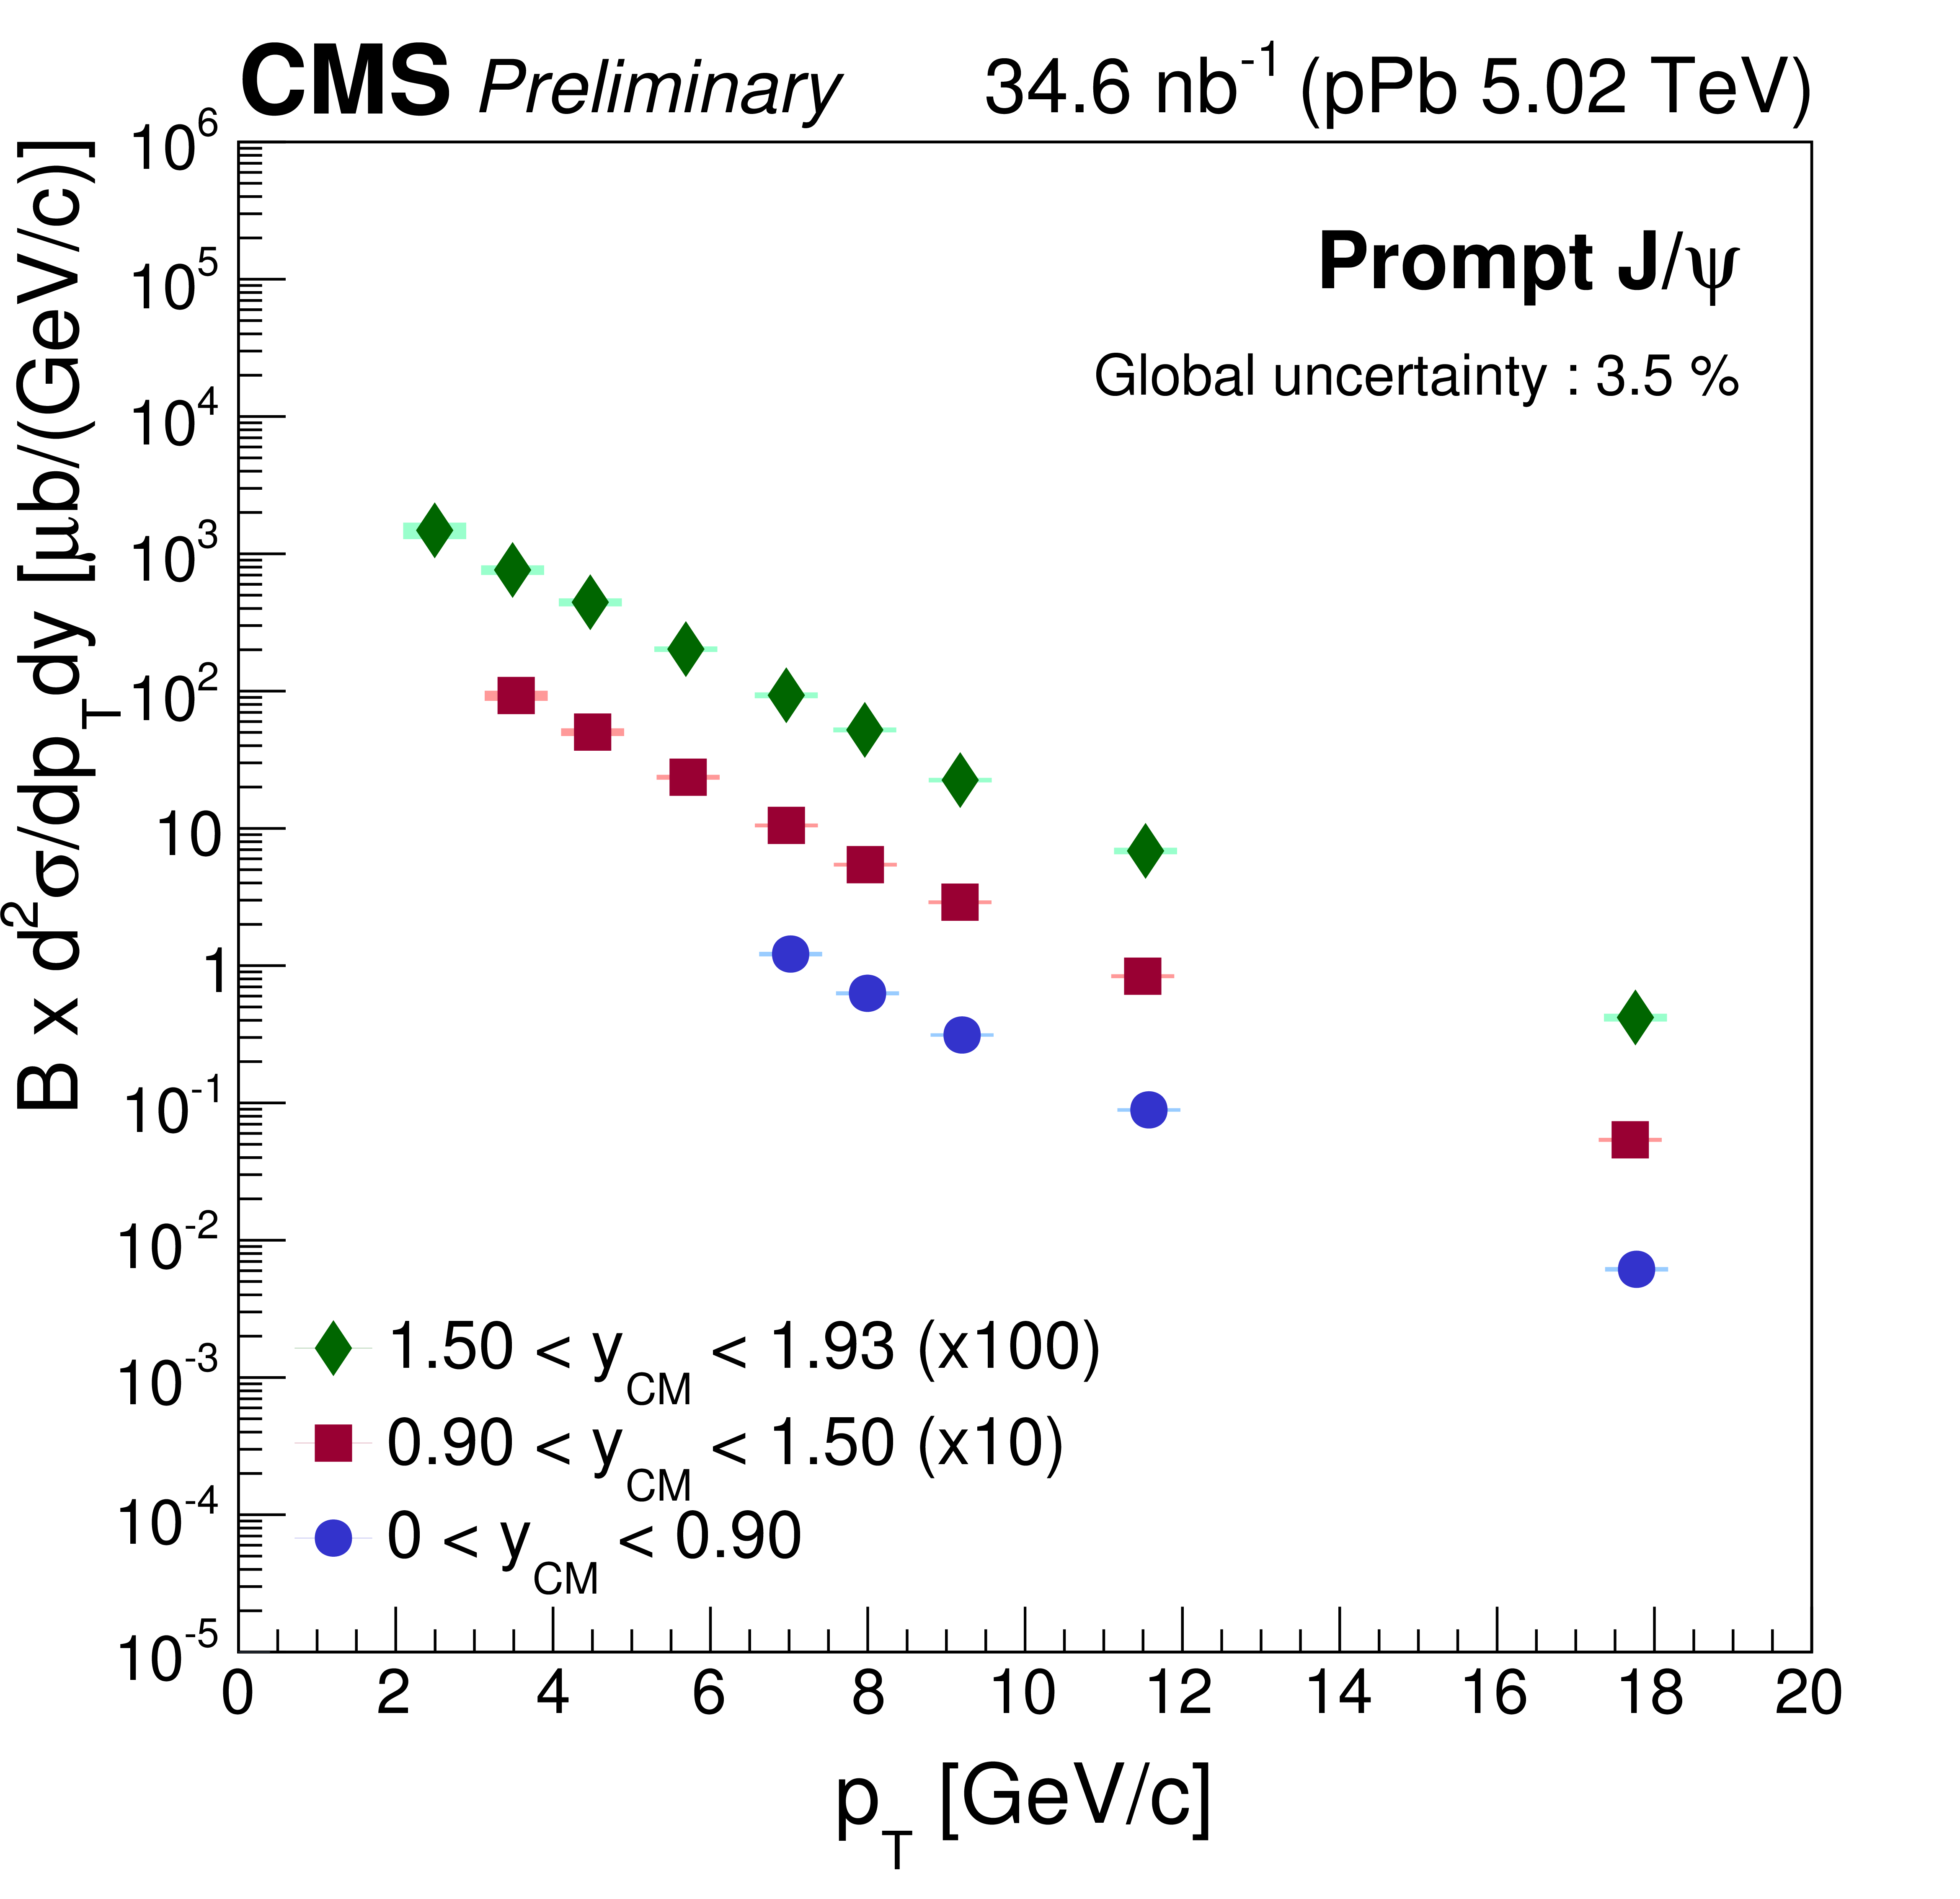
Figure 2-a:
Differential cross section of prompt $ \mathrm{J} / \psi $ in three forward rapidity bins (a) and in five backward rapidity bins (b). The error bars represent the statistical uncertainties, and the shaded boxes show the quadratic sum of systematic uncertainties. The global uncertainty is not included in the point-by-point uncertainties. |
png ; pdf |
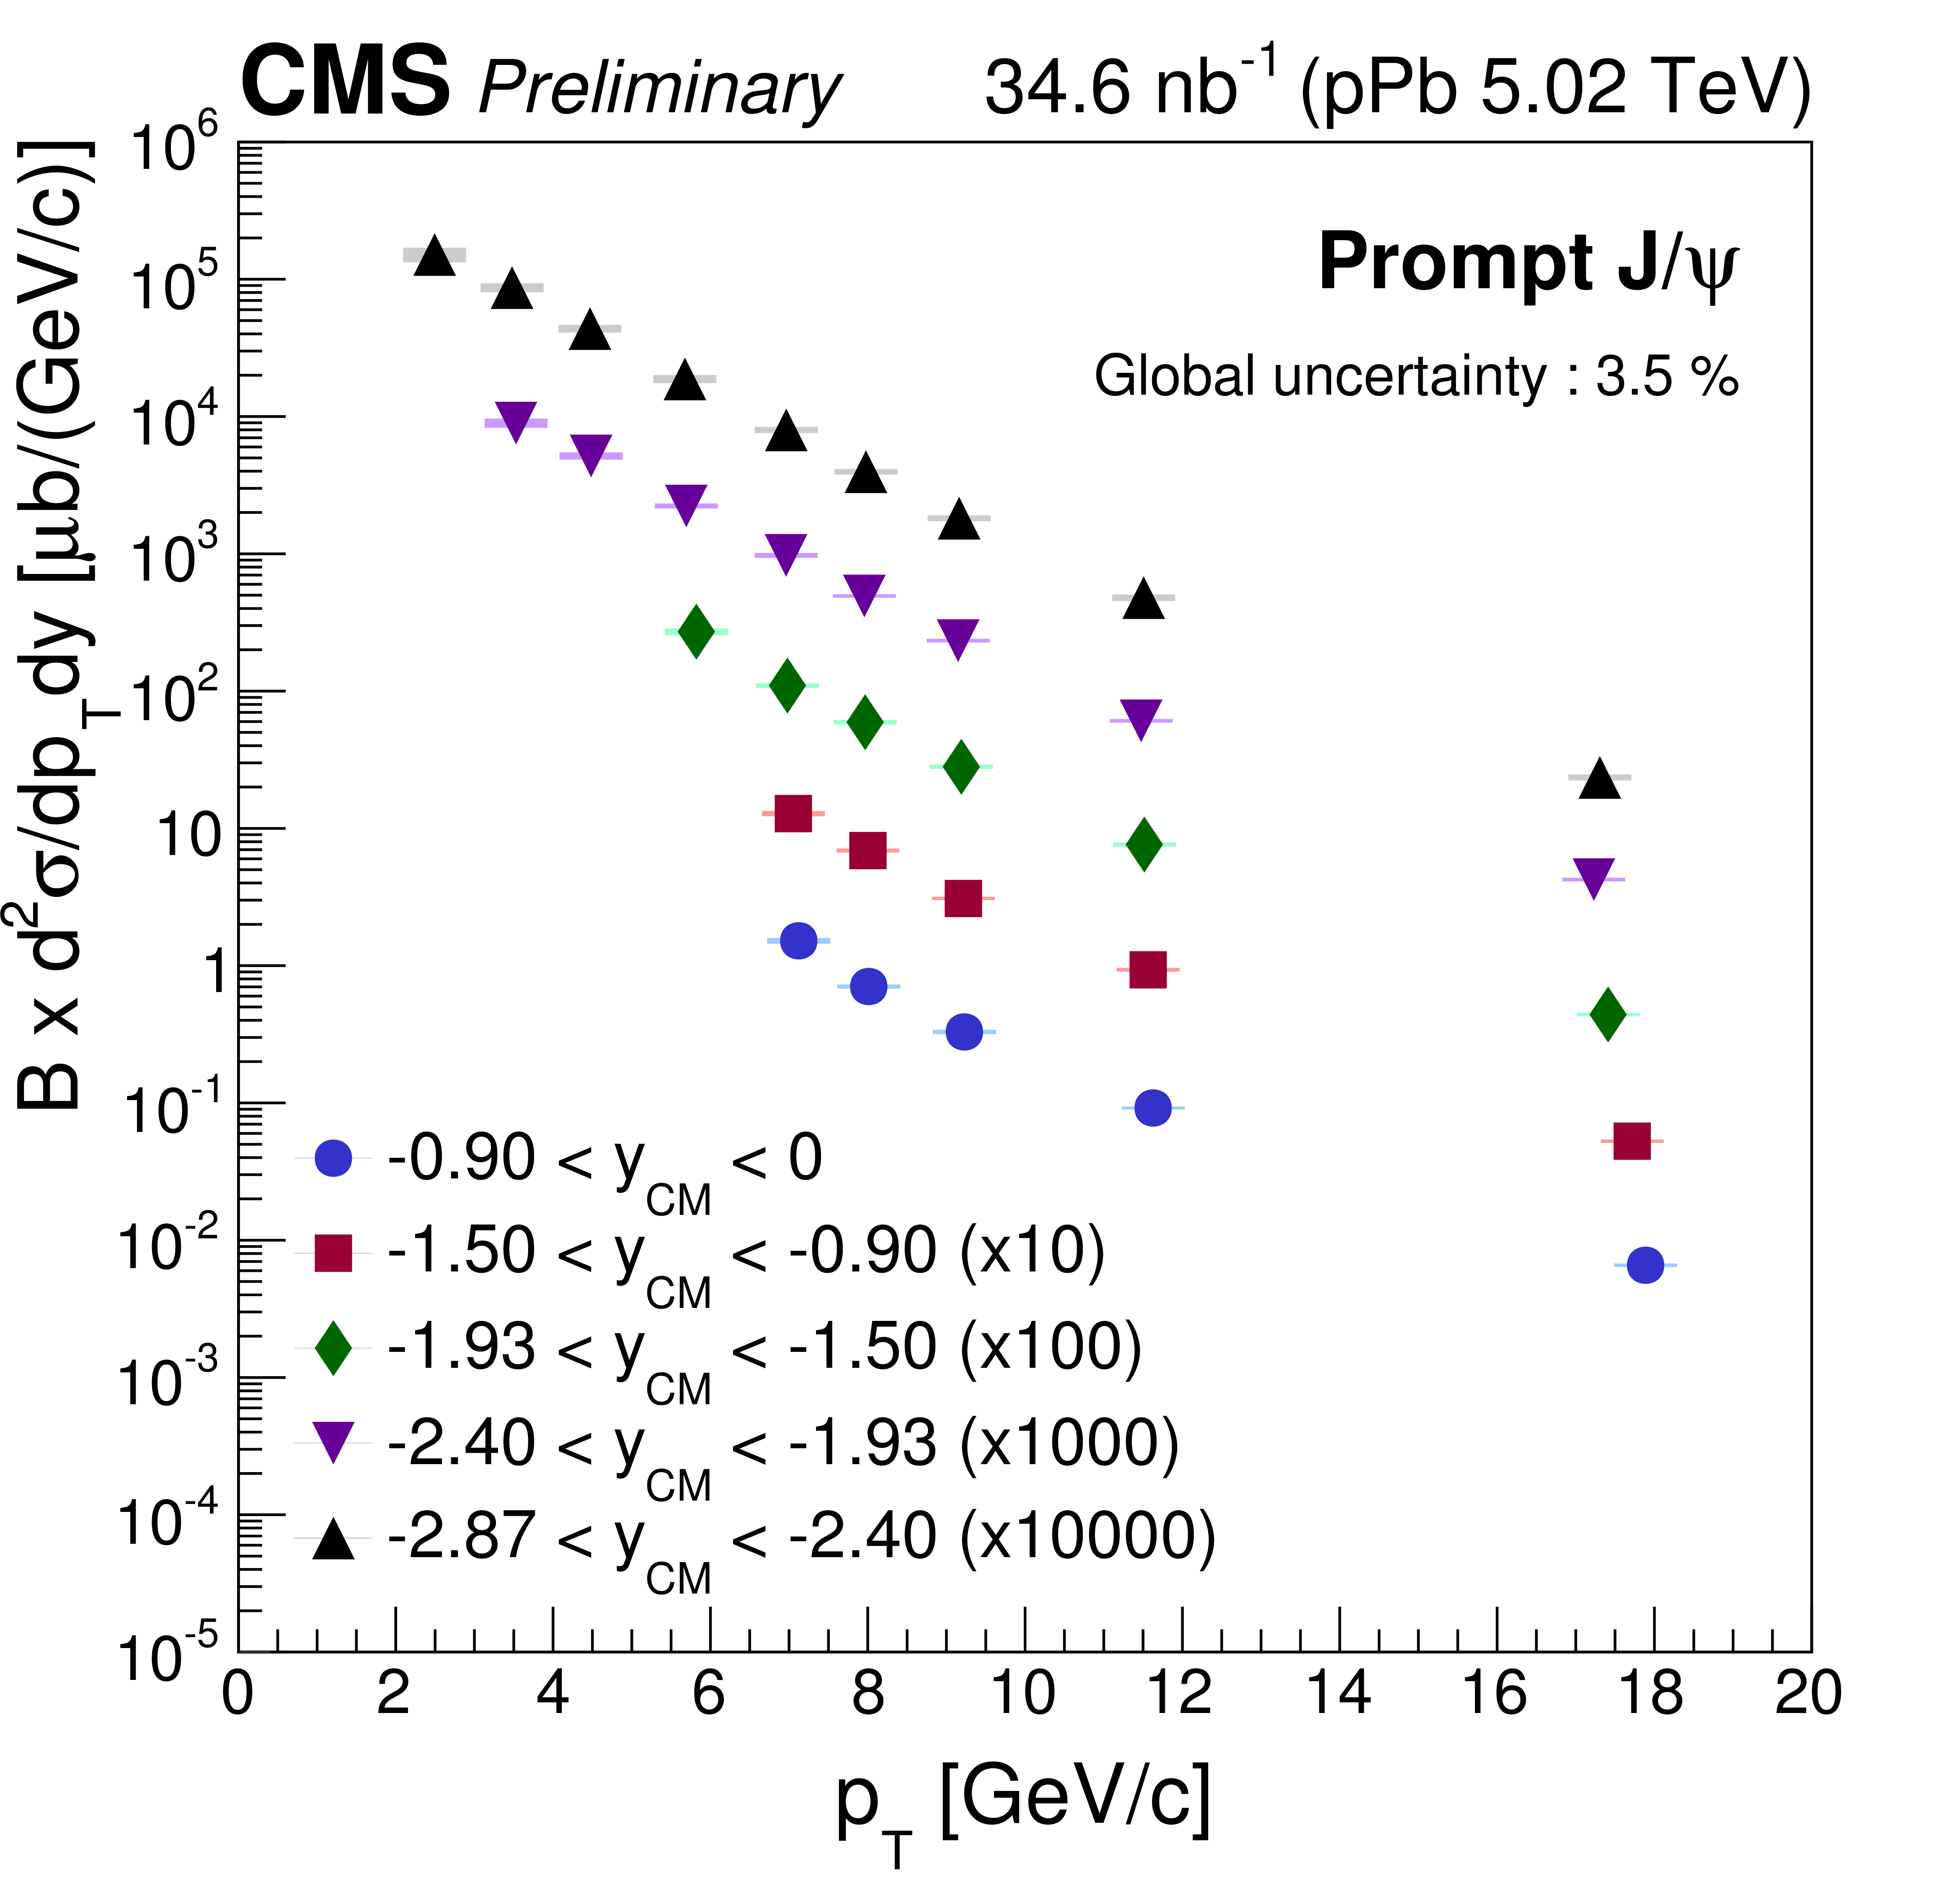
Figure 2-b:
Differential cross section of prompt $ \mathrm{J} / \psi $ in three forward rapidity bins (a) and in five backward rapidity bins (b). The error bars represent the statistical uncertainties, and the shaded boxes show the quadratic sum of systematic uncertainties. The global uncertainty is not included in the point-by-point uncertainties. |
png ; pdf |
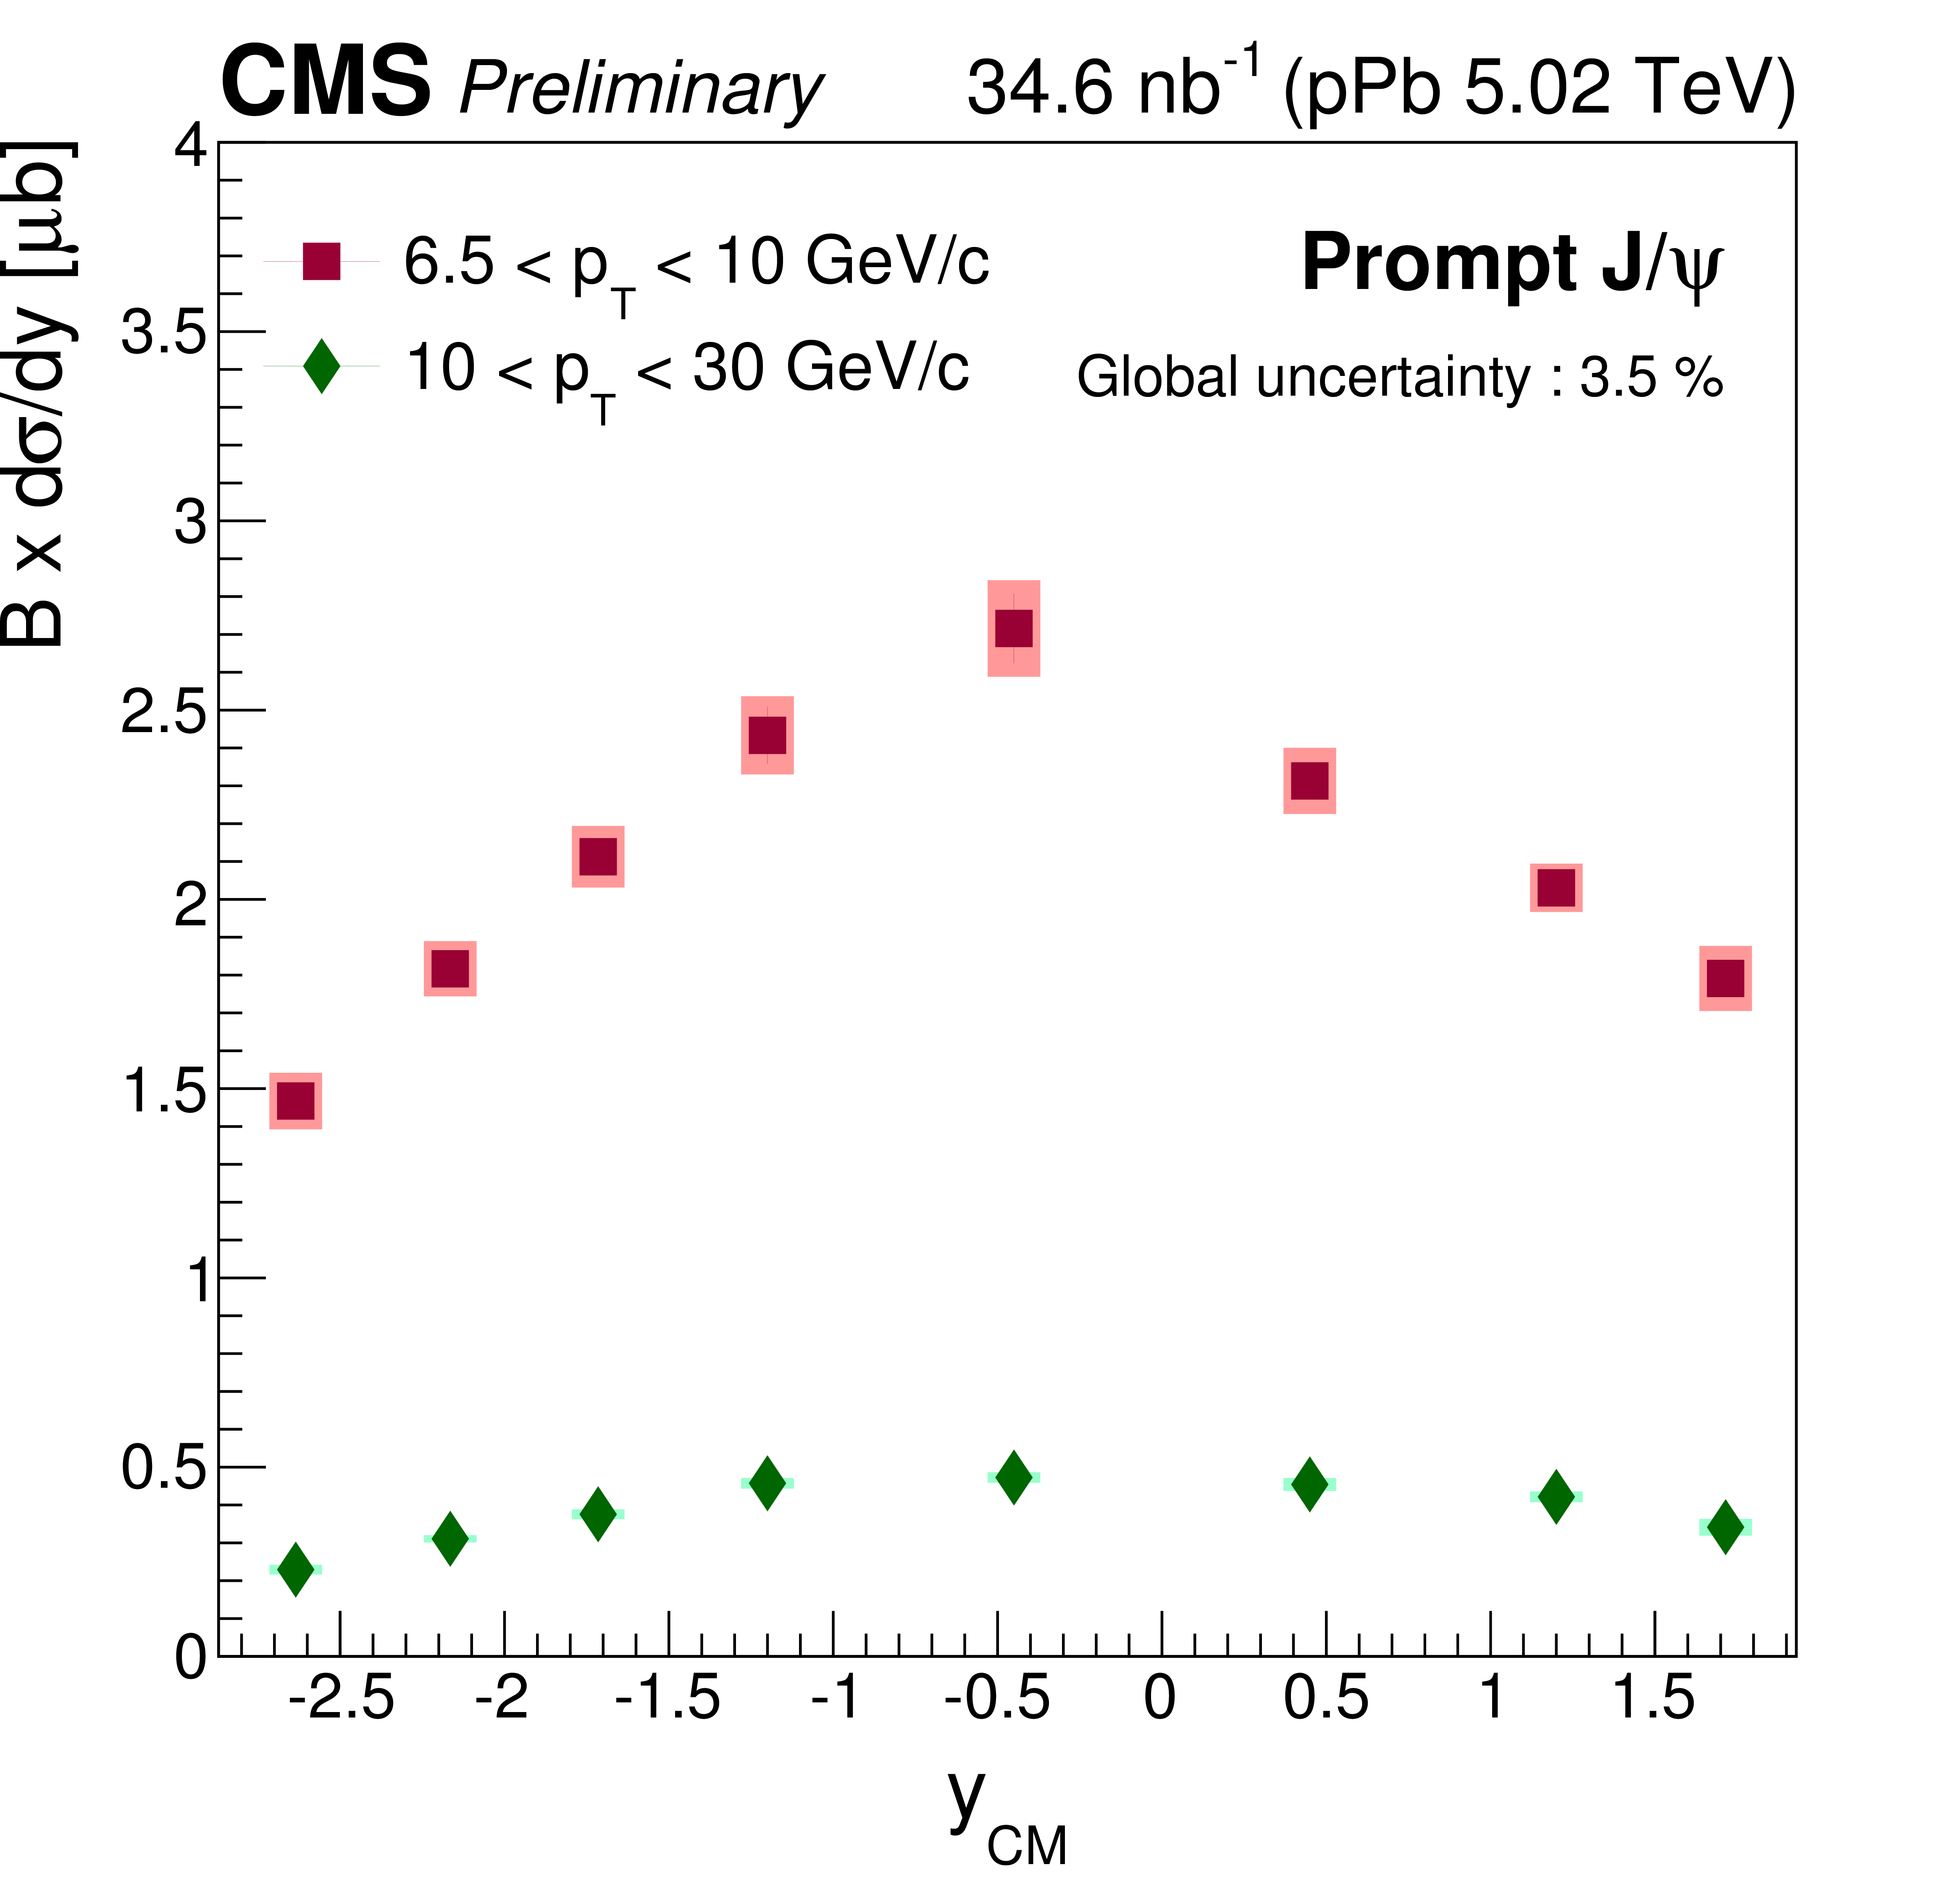
Figure 3:
Rapidity dependence of the cross section for prompt $ \mathrm{J} / \psi $ in the $ {p_{\mathrm {T}}} $ intervals of 6.5 $< {p_{\mathrm {T}}} <$ 10 GeV/$c$ (red squares) and 10 $< {p_{\mathrm {T}}} <$ 30 GeV/$c$ (green diamonds). The error bars represent the statistical uncertainties, and the shaded boxes show the quadratic sum of systematic uncertainties. The global uncertainty is not included in the point-by-point uncertainties. |
png ; pdf |
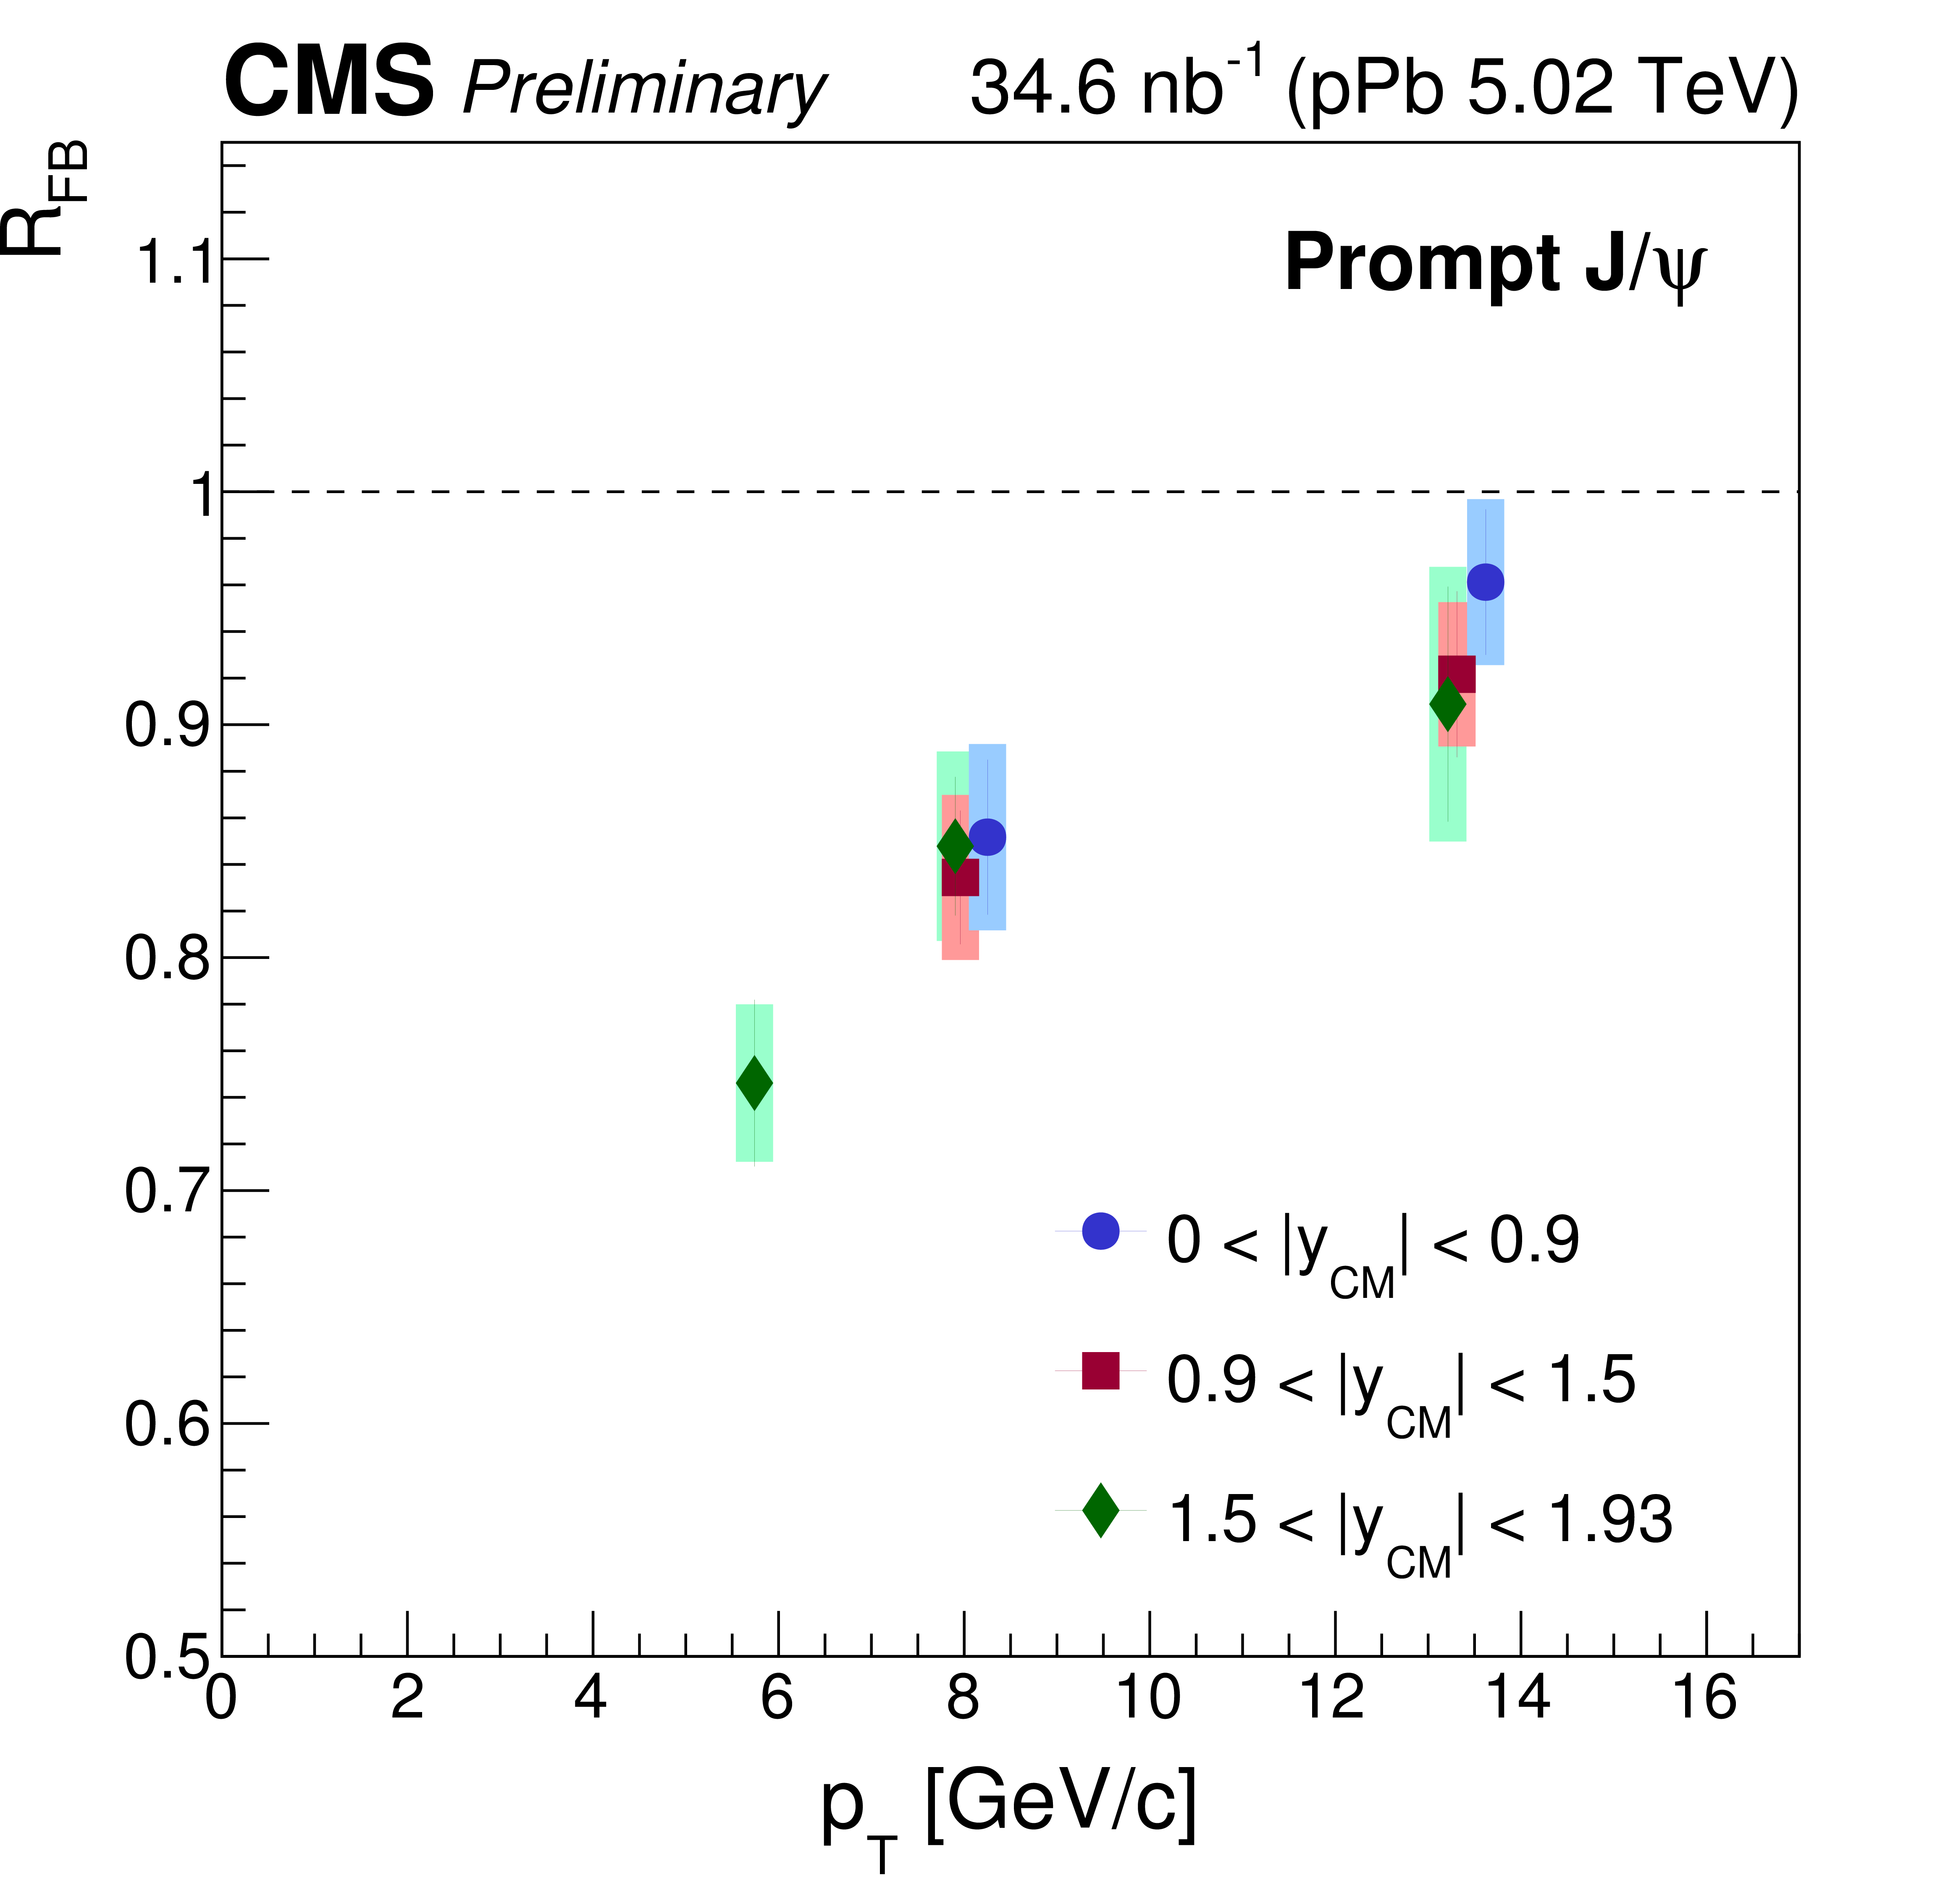
Figure 4:
$ {p_{\mathrm {T}}} $ dependences of $ {R_{FB}} $ for prompt $ \mathrm{J} / \psi $ in three different rapidity ranges. The error bars represent the statistical uncertainties, and the shaded boxes show the quadratic sum of systematic uncertainties. |
png ; pdf |
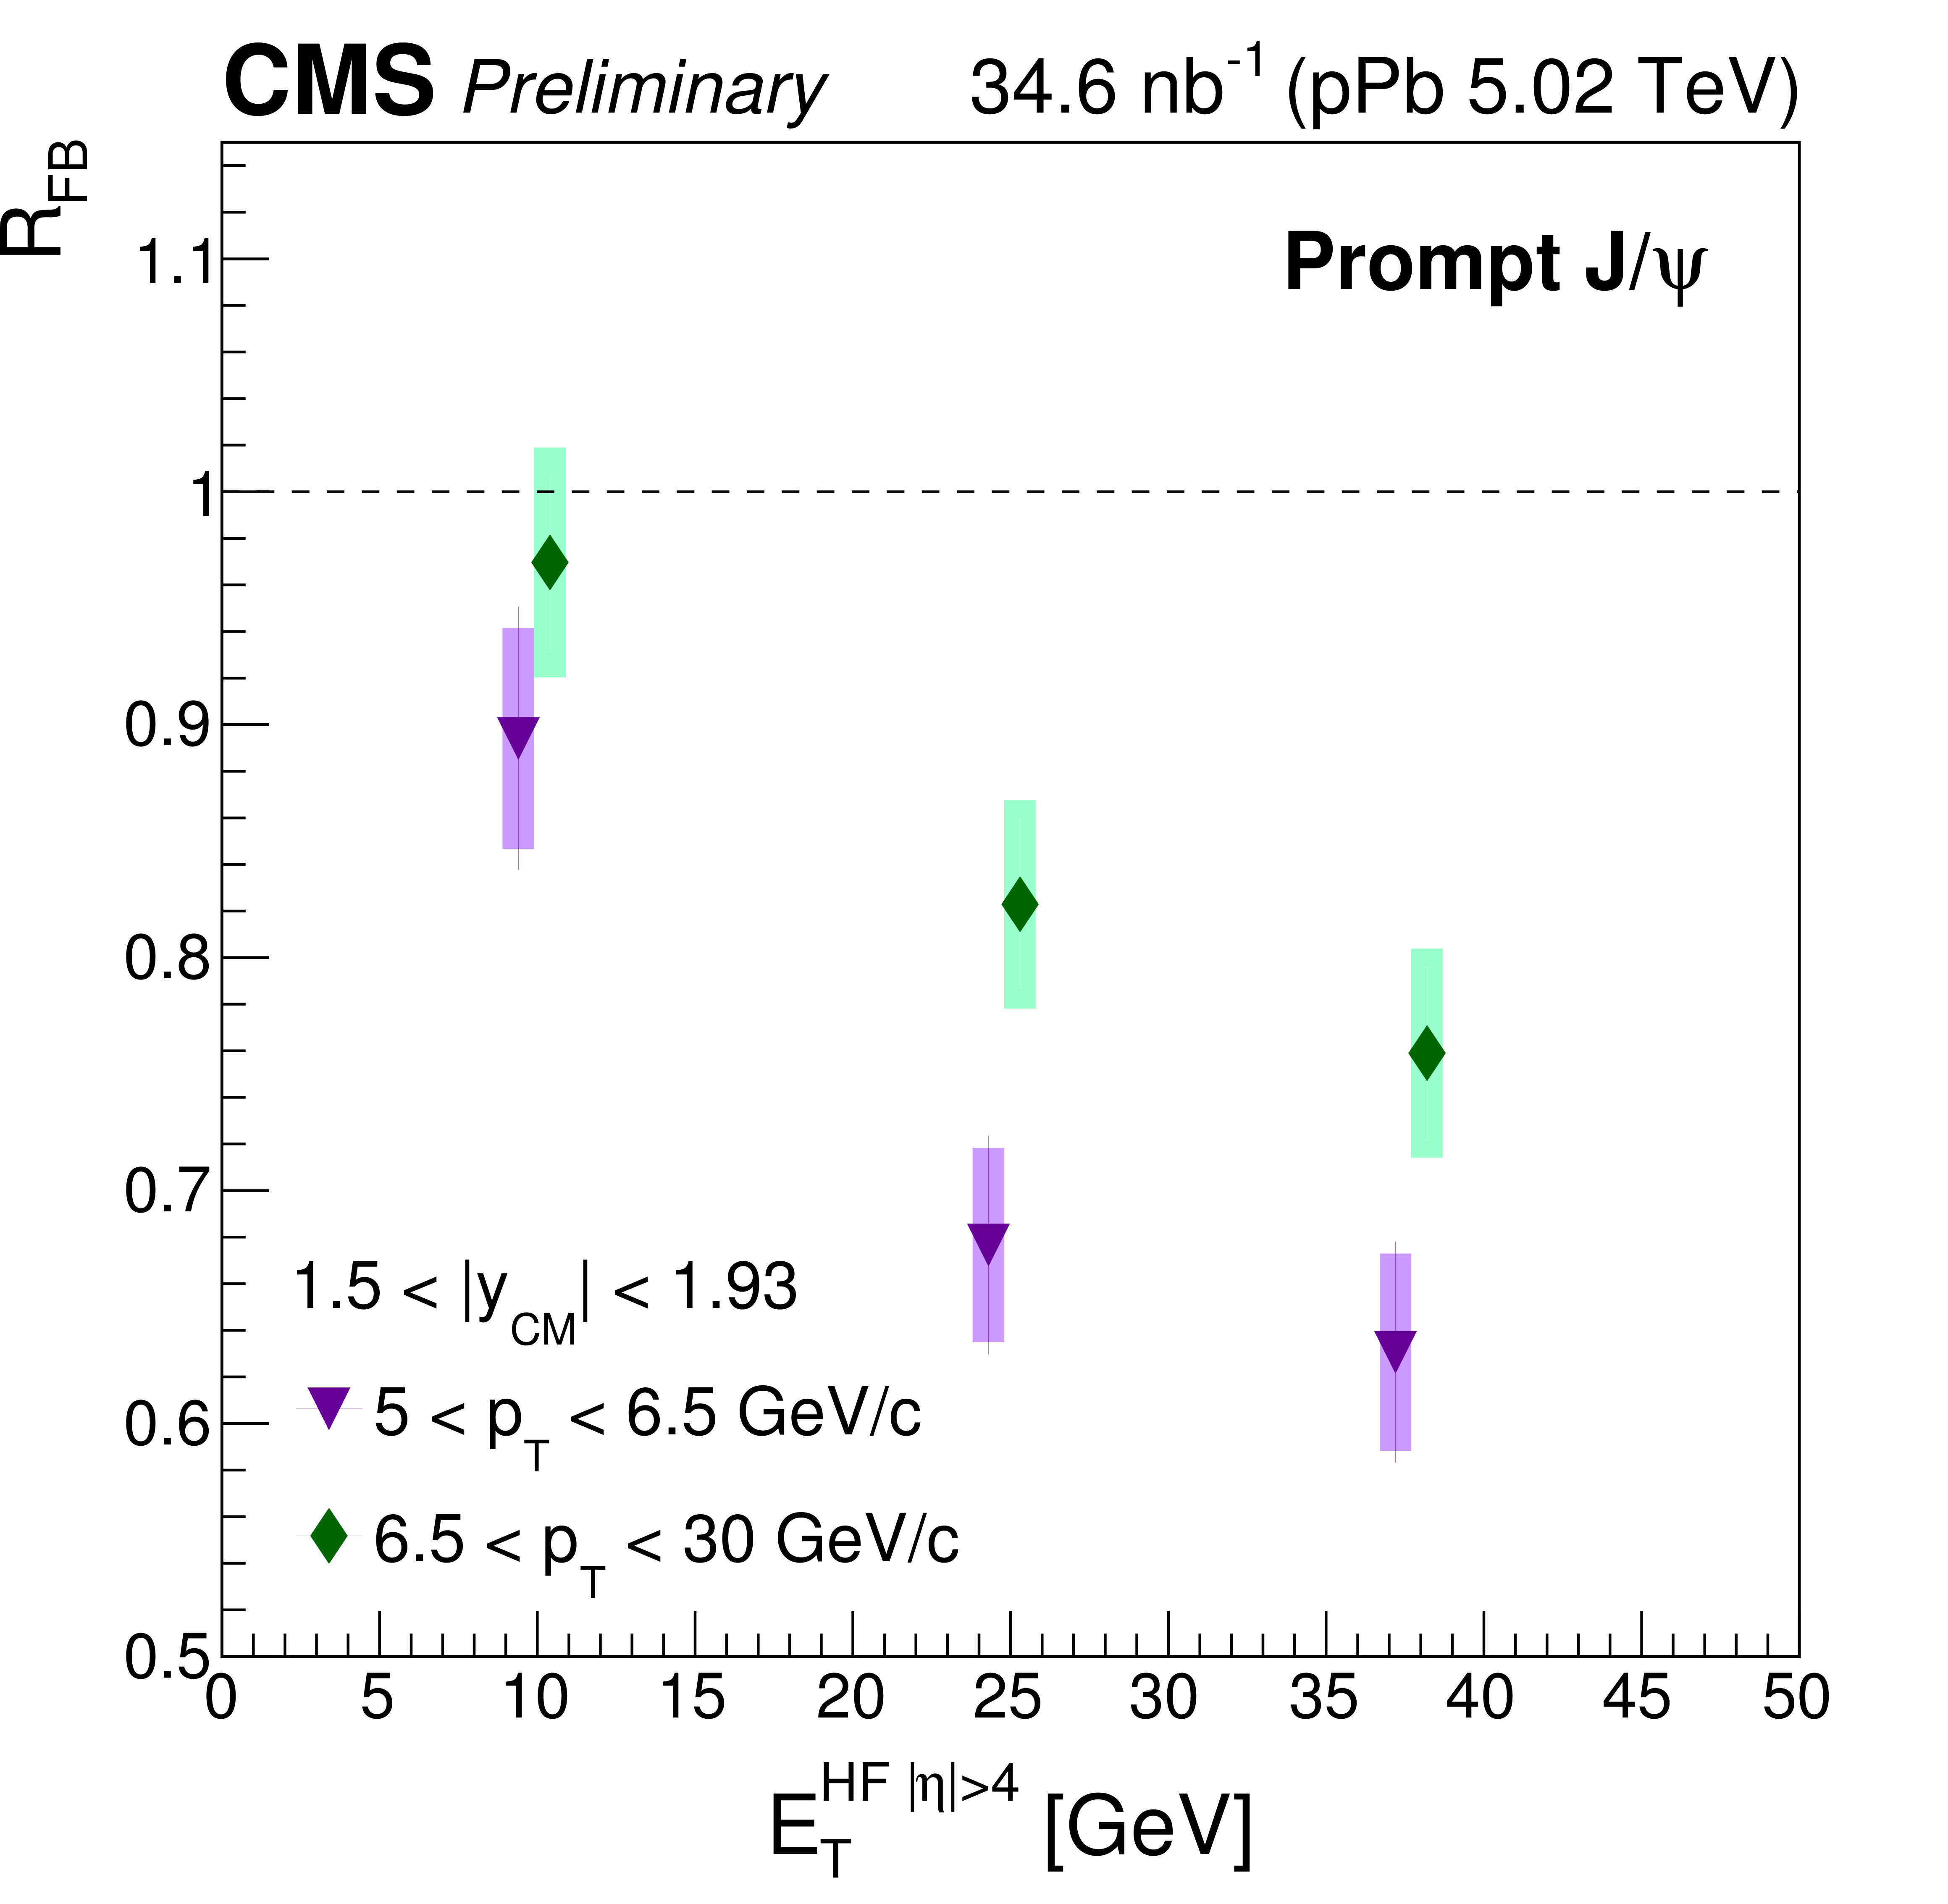
Figure 5-a:
${E_{\mathrm T}^{\mathrm{HF}|\eta |> 4}} $ dependence of $ {R_{FB}} $ for prompt $ \mathrm{J} / \psi $ with two different $ {p_{\mathrm {T}}} $ ranges in the most forward-backward region (a), and with the same $ {p_{\mathrm {T}}} $ range in three different rapidity ranges (b). For higher $ {p_{\mathrm {T}}} $ (a) or higher rapidity ranges (b), the bin abscissae are slightly shifted so that they do not overlap with each other. The error bars represent the statistical uncertainties, and the shaded boxes show the quadratic sum of systematic uncertainties. |

png ; pdf |
Figure 5-b:
${E_{\mathrm T}^{\mathrm{HF}|\eta |> 4}} $ dependence of $ {R_{FB}} $ for prompt $ \mathrm{J} / \psi $ with two different $ {p_{\mathrm {T}}} $ ranges in the most forward-backward region (a), and with the same $ {p_{\mathrm {T}}} $ range in three different rapidity ranges (b). For higher $ {p_{\mathrm {T}}} $ (a) or higher rapidity ranges (b), the bin abscissae are slightly shifted so that they do not overlap with each other. The error bars represent the statistical uncertainties, and the shaded boxes show the quadratic sum of systematic uncertainties. |
png ; pdf |
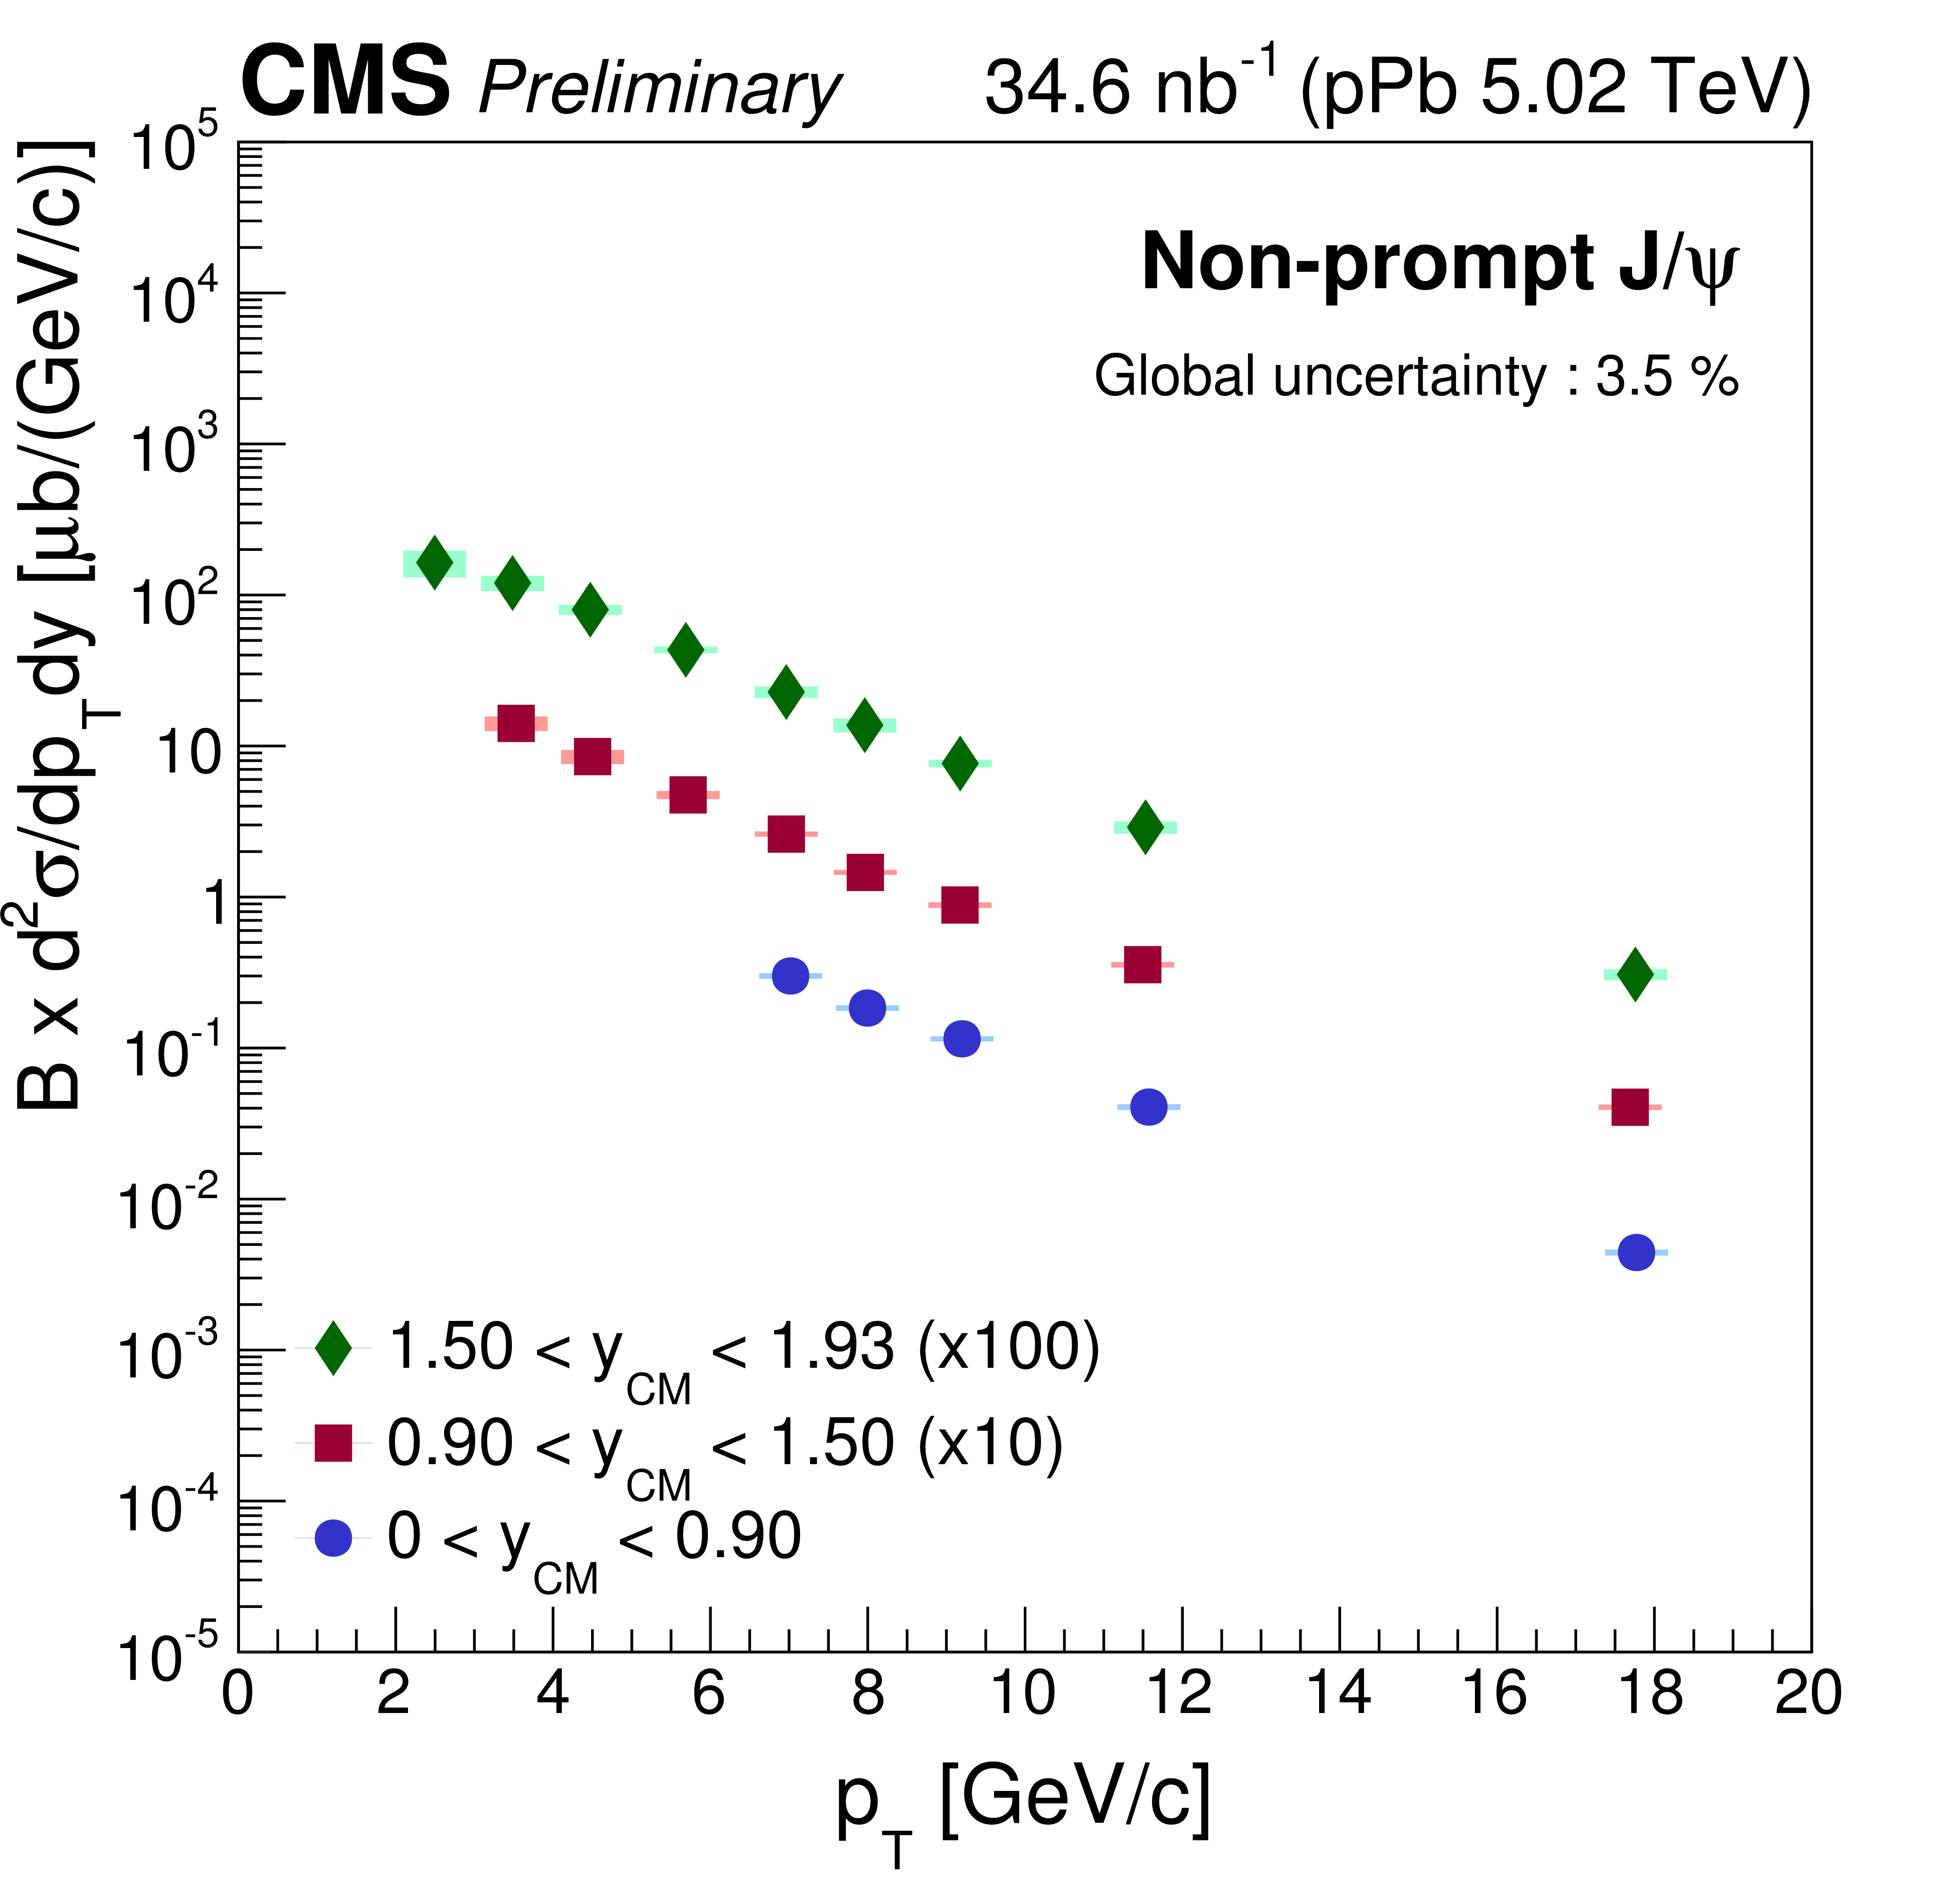
Figure 6-a:
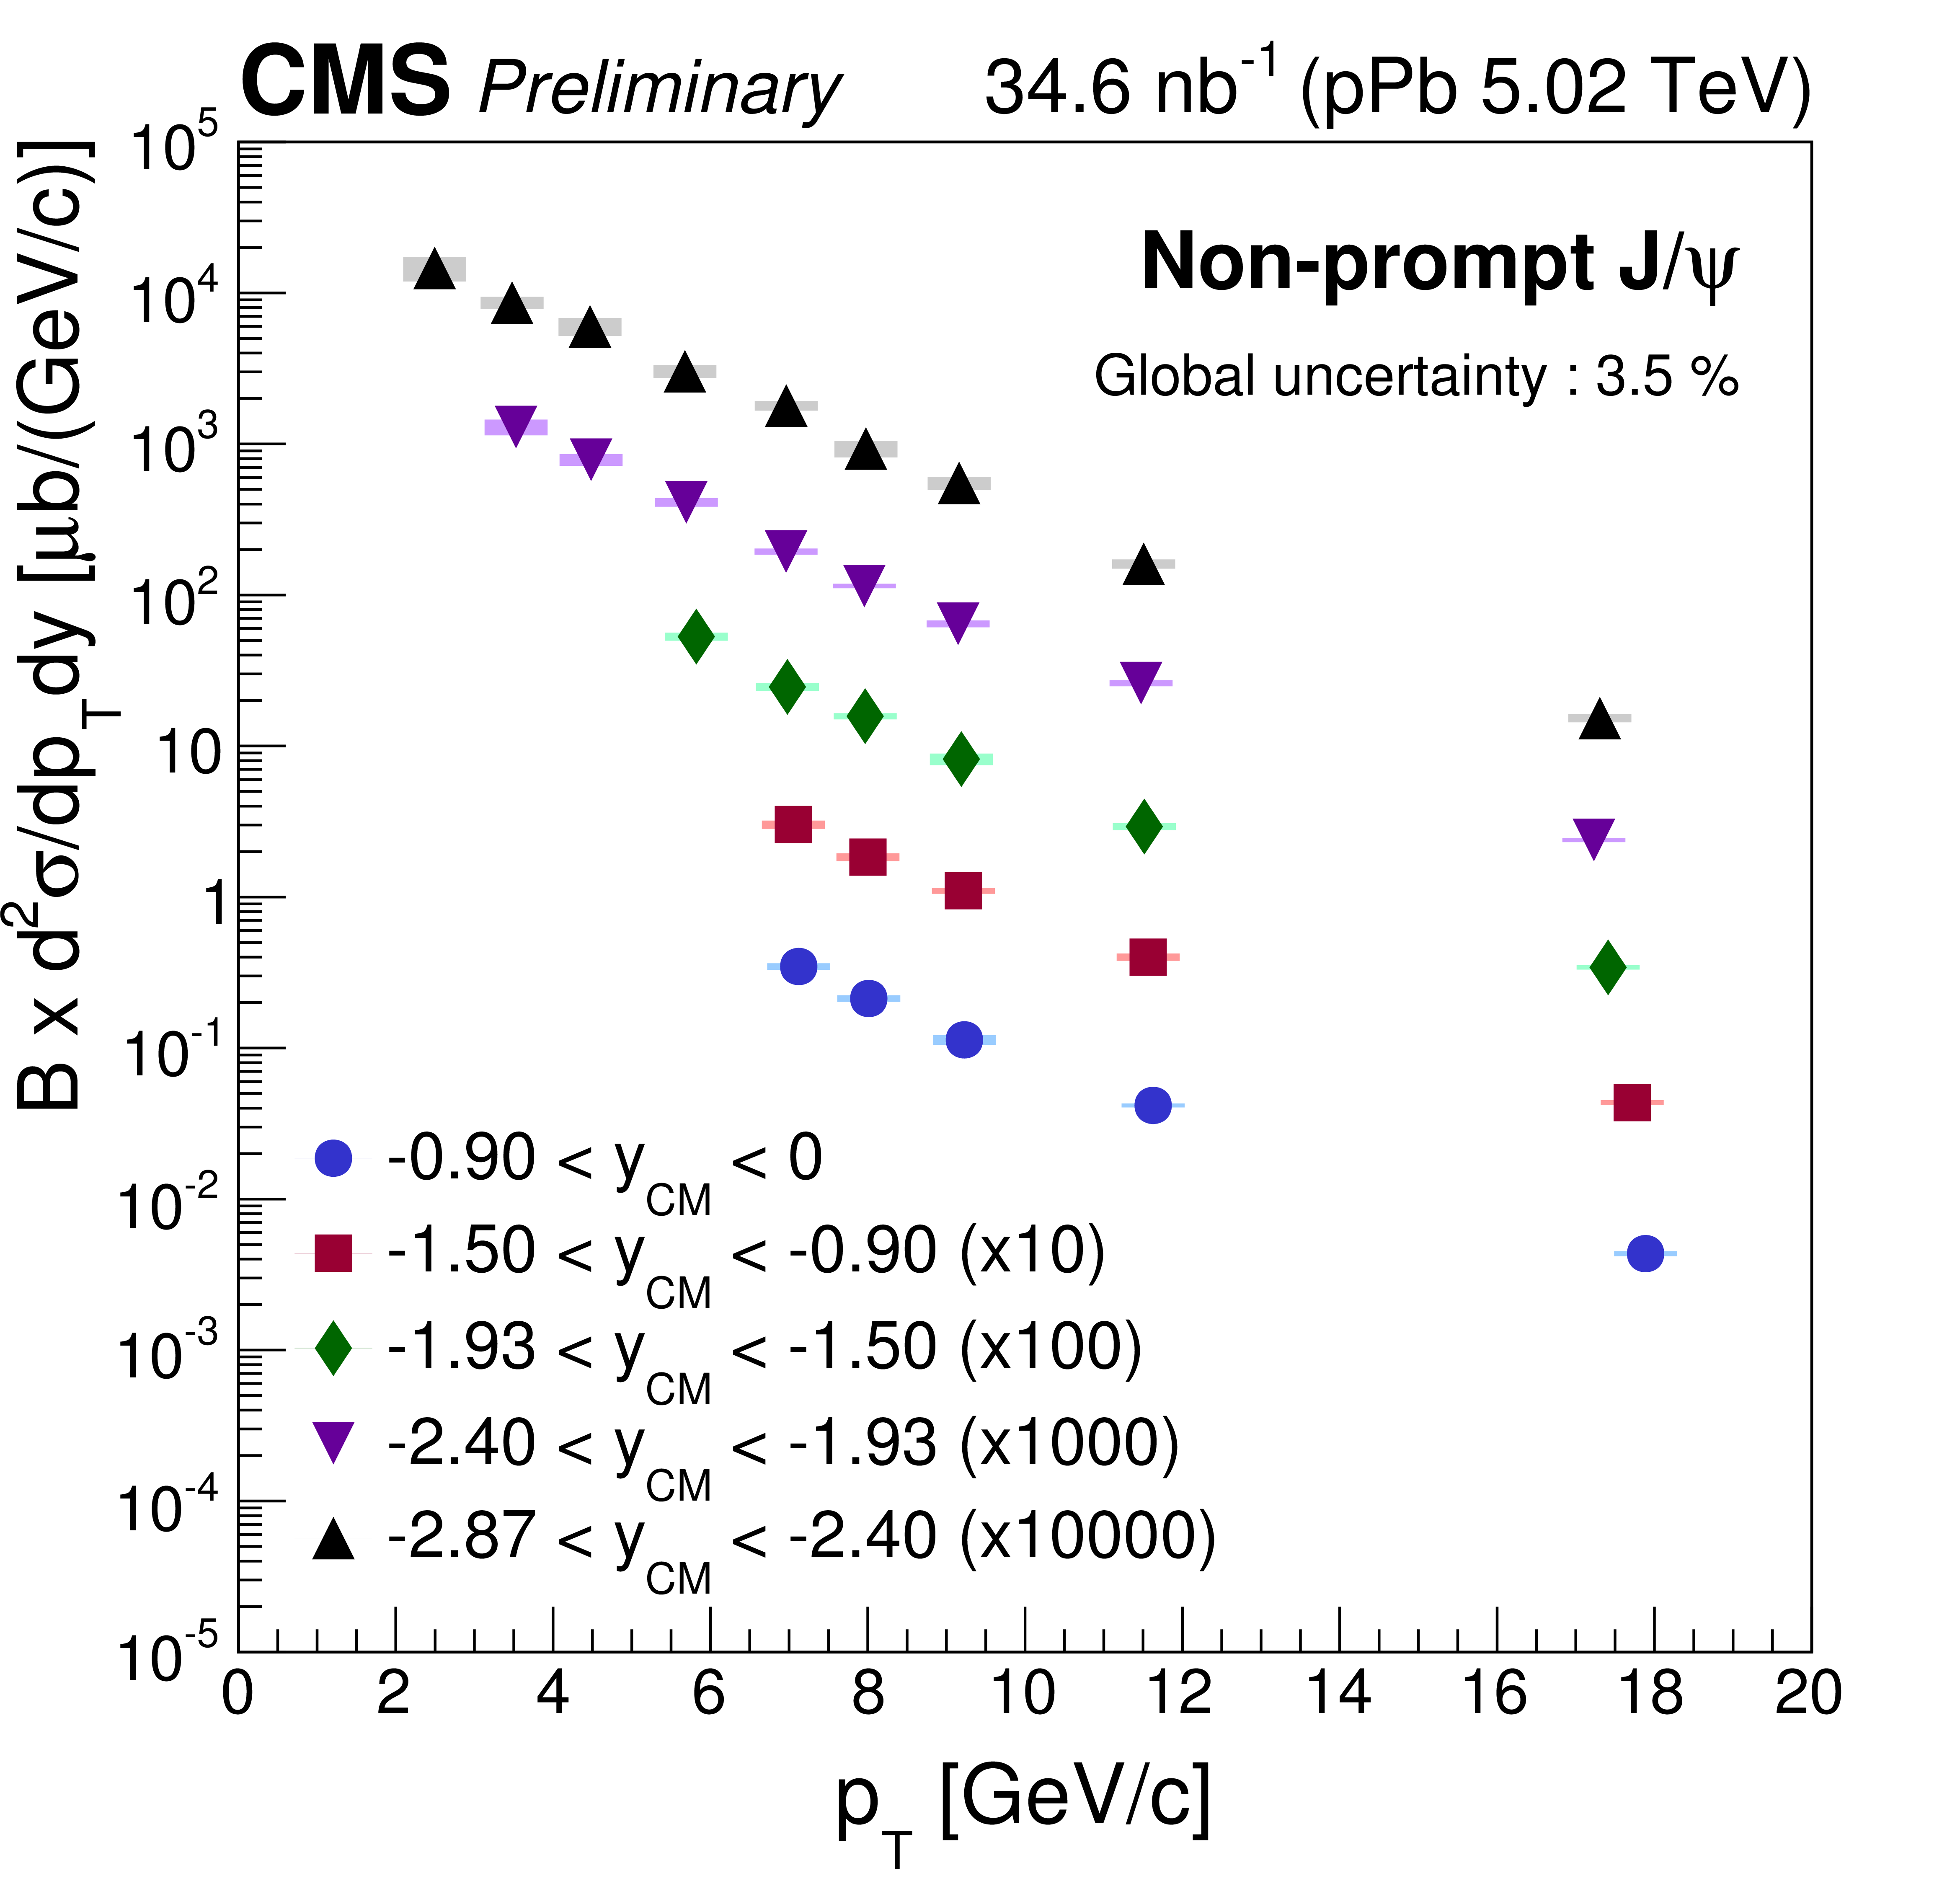
Differential cross section of non-prompt $ \mathrm{J} / \psi $ in three forward rapidity bins (a) and in five backward rapidity bins (b). The error bars represent the statistical uncertainties, and the shaded boxes show the quadratic sum of systematic uncertainties. The global uncertainty is not included in the point-by-point uncertainties. |
png ; pdf |
Figure 6-b:
Differential cross section of non-prompt $ \mathrm{J} / \psi $ in three forward rapidity bins (a) and in five backward rapidity bins (b). The error bars represent the statistical uncertainties, and the shaded boxes show the quadratic sum of systematic uncertainties. The global uncertainty is not included in the point-by-point uncertainties. |

png ; pdf |
Figure 7:
Rapidity dependence of the cross section for non-prompt $ \mathrm{J} / \psi $ (b) in the $ {p_{\mathrm {T}}} $ intervals of 6.5 $< {p_{\mathrm {T}}} <$ 10 GeV/$c$ (red squares) and 10 $< {p_{\mathrm {T}}} <$ 30 GeV/$c$ (green diamonds). The error bars represent the statistical uncertainties, and the shaded boxes show the quadratic sum of systematic uncertainties. The global uncertainty is not included in the point-by-point uncertainties. |
png ; pdf |
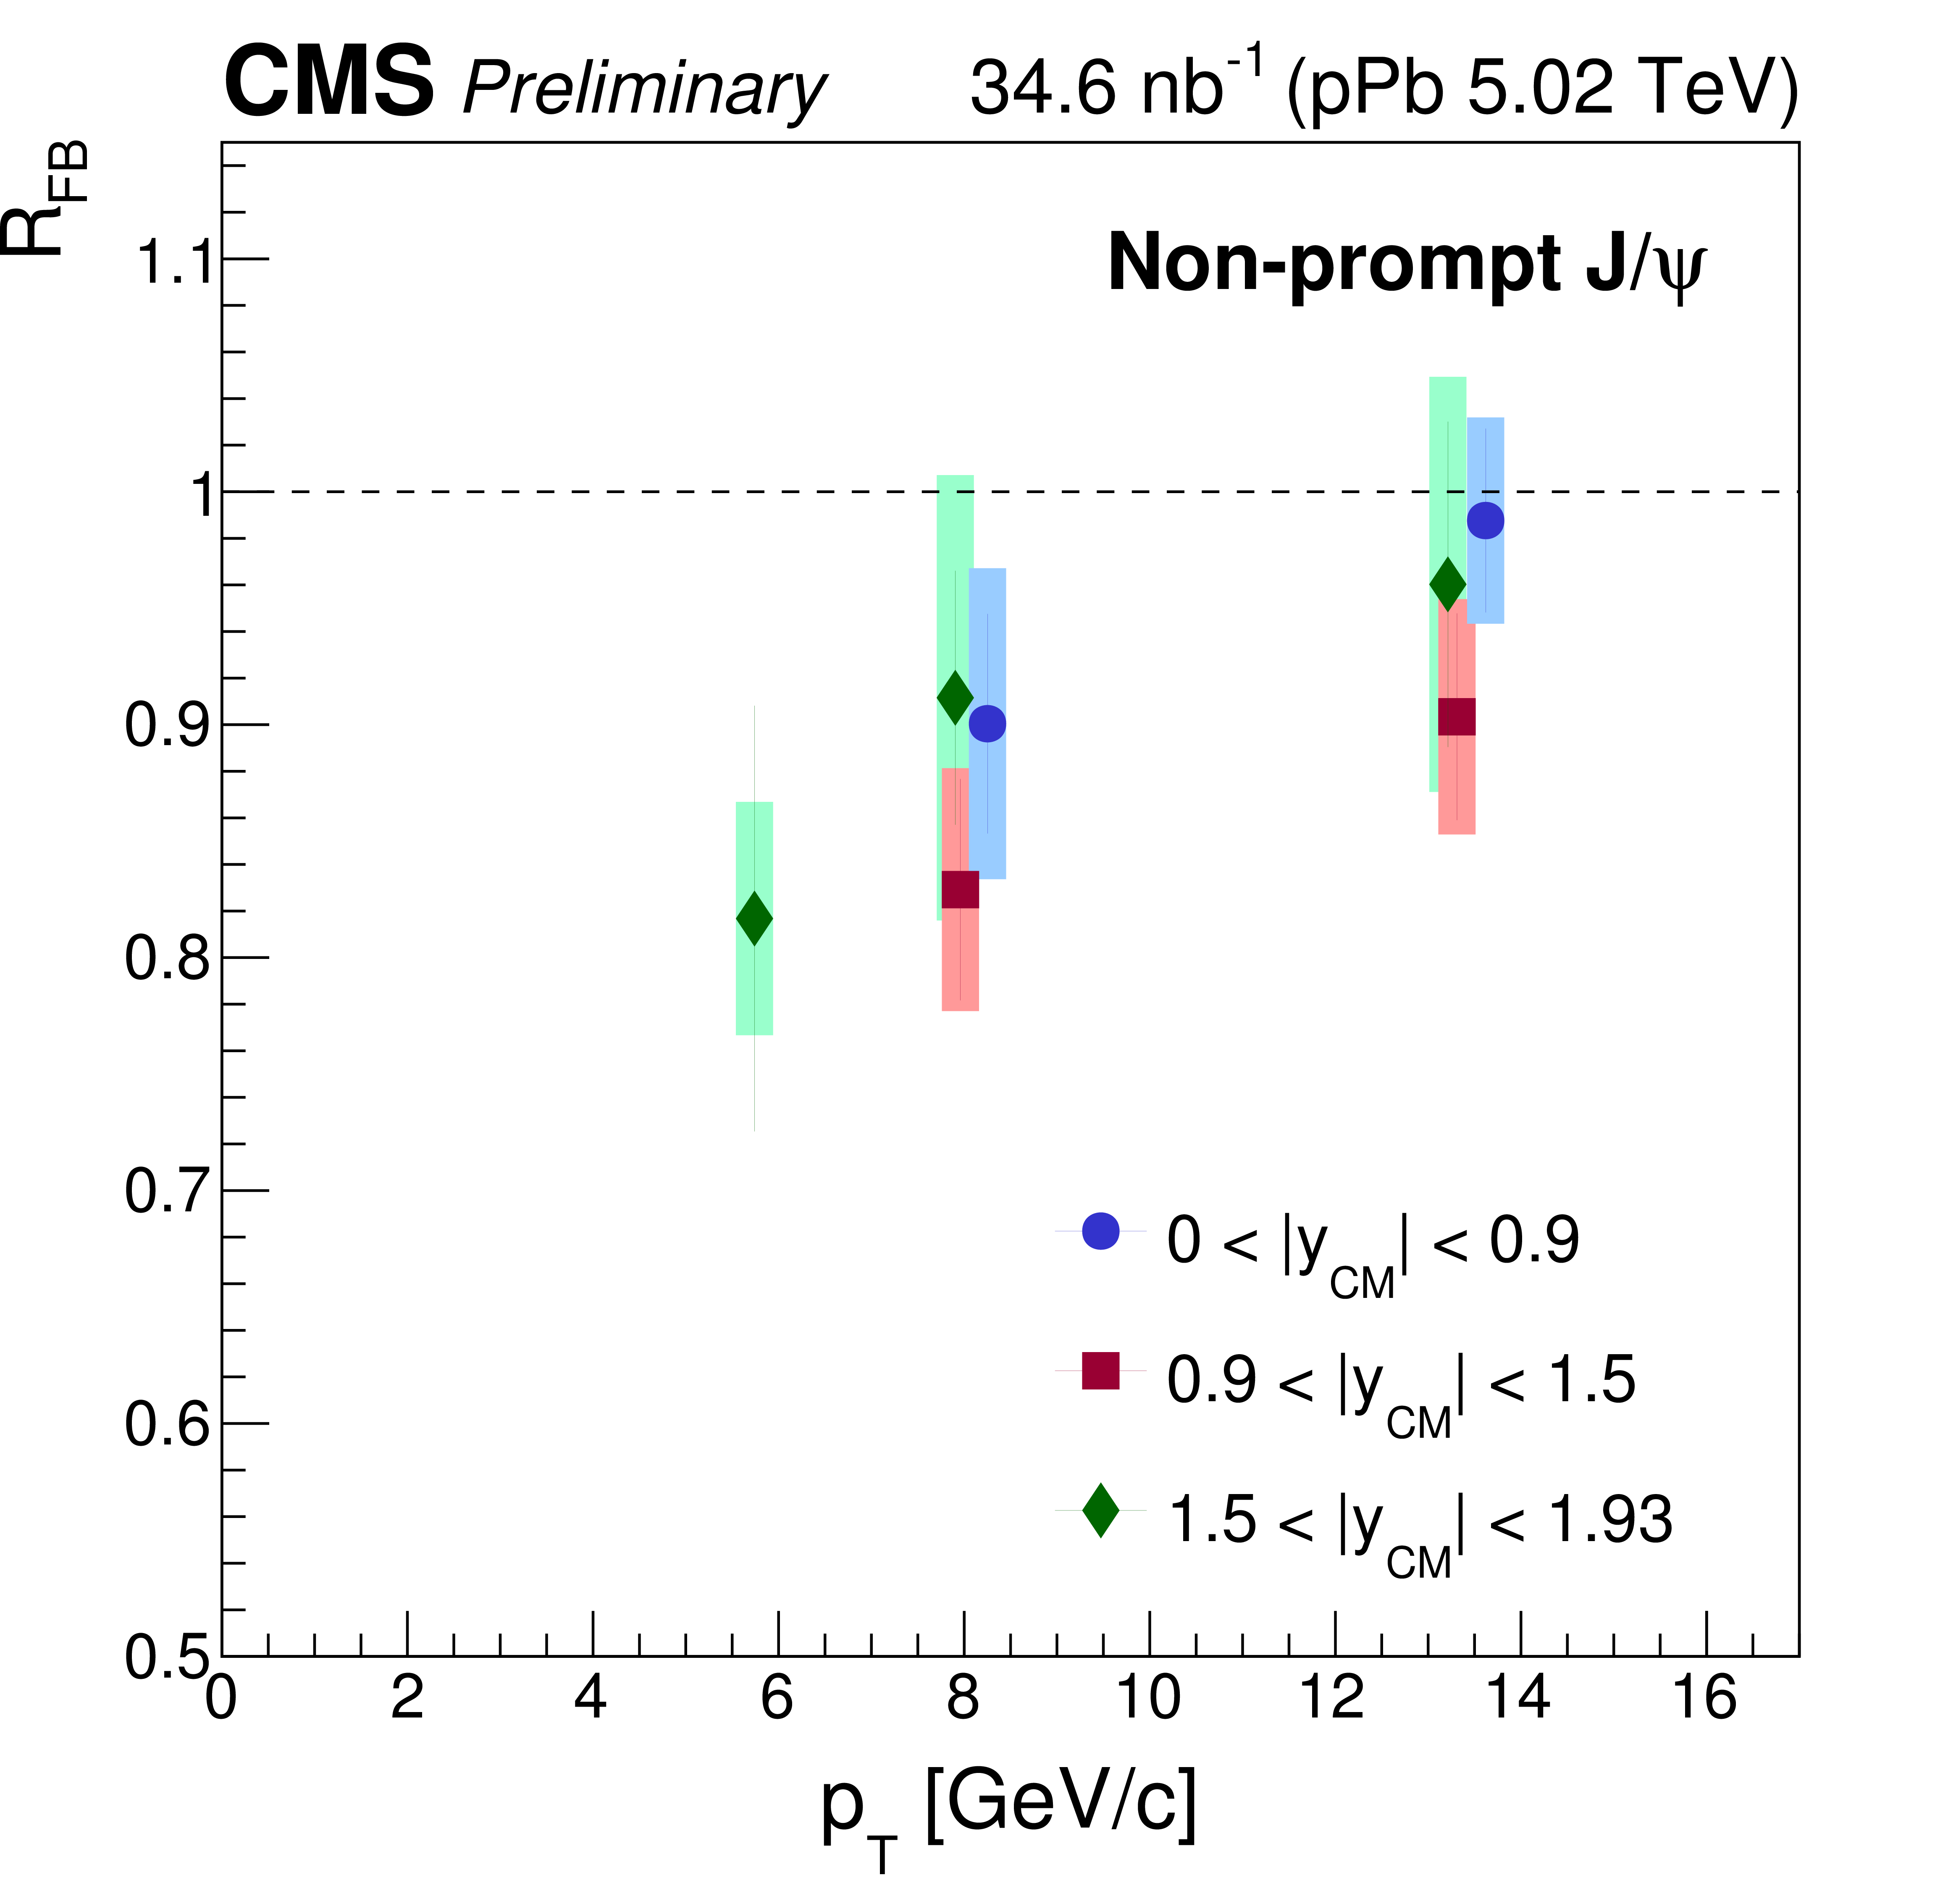
Figure 8:
$ {p_{\mathrm {T}}} $ dependences of $ {R_{FB}} $ for non-prompt $ \mathrm{J} / \psi $ in three different rapidity ranges. The error bars represent the statistical uncertainties, and the shaded boxes show the quadratic sum of systematic uncertainties. |
png ; pdf |
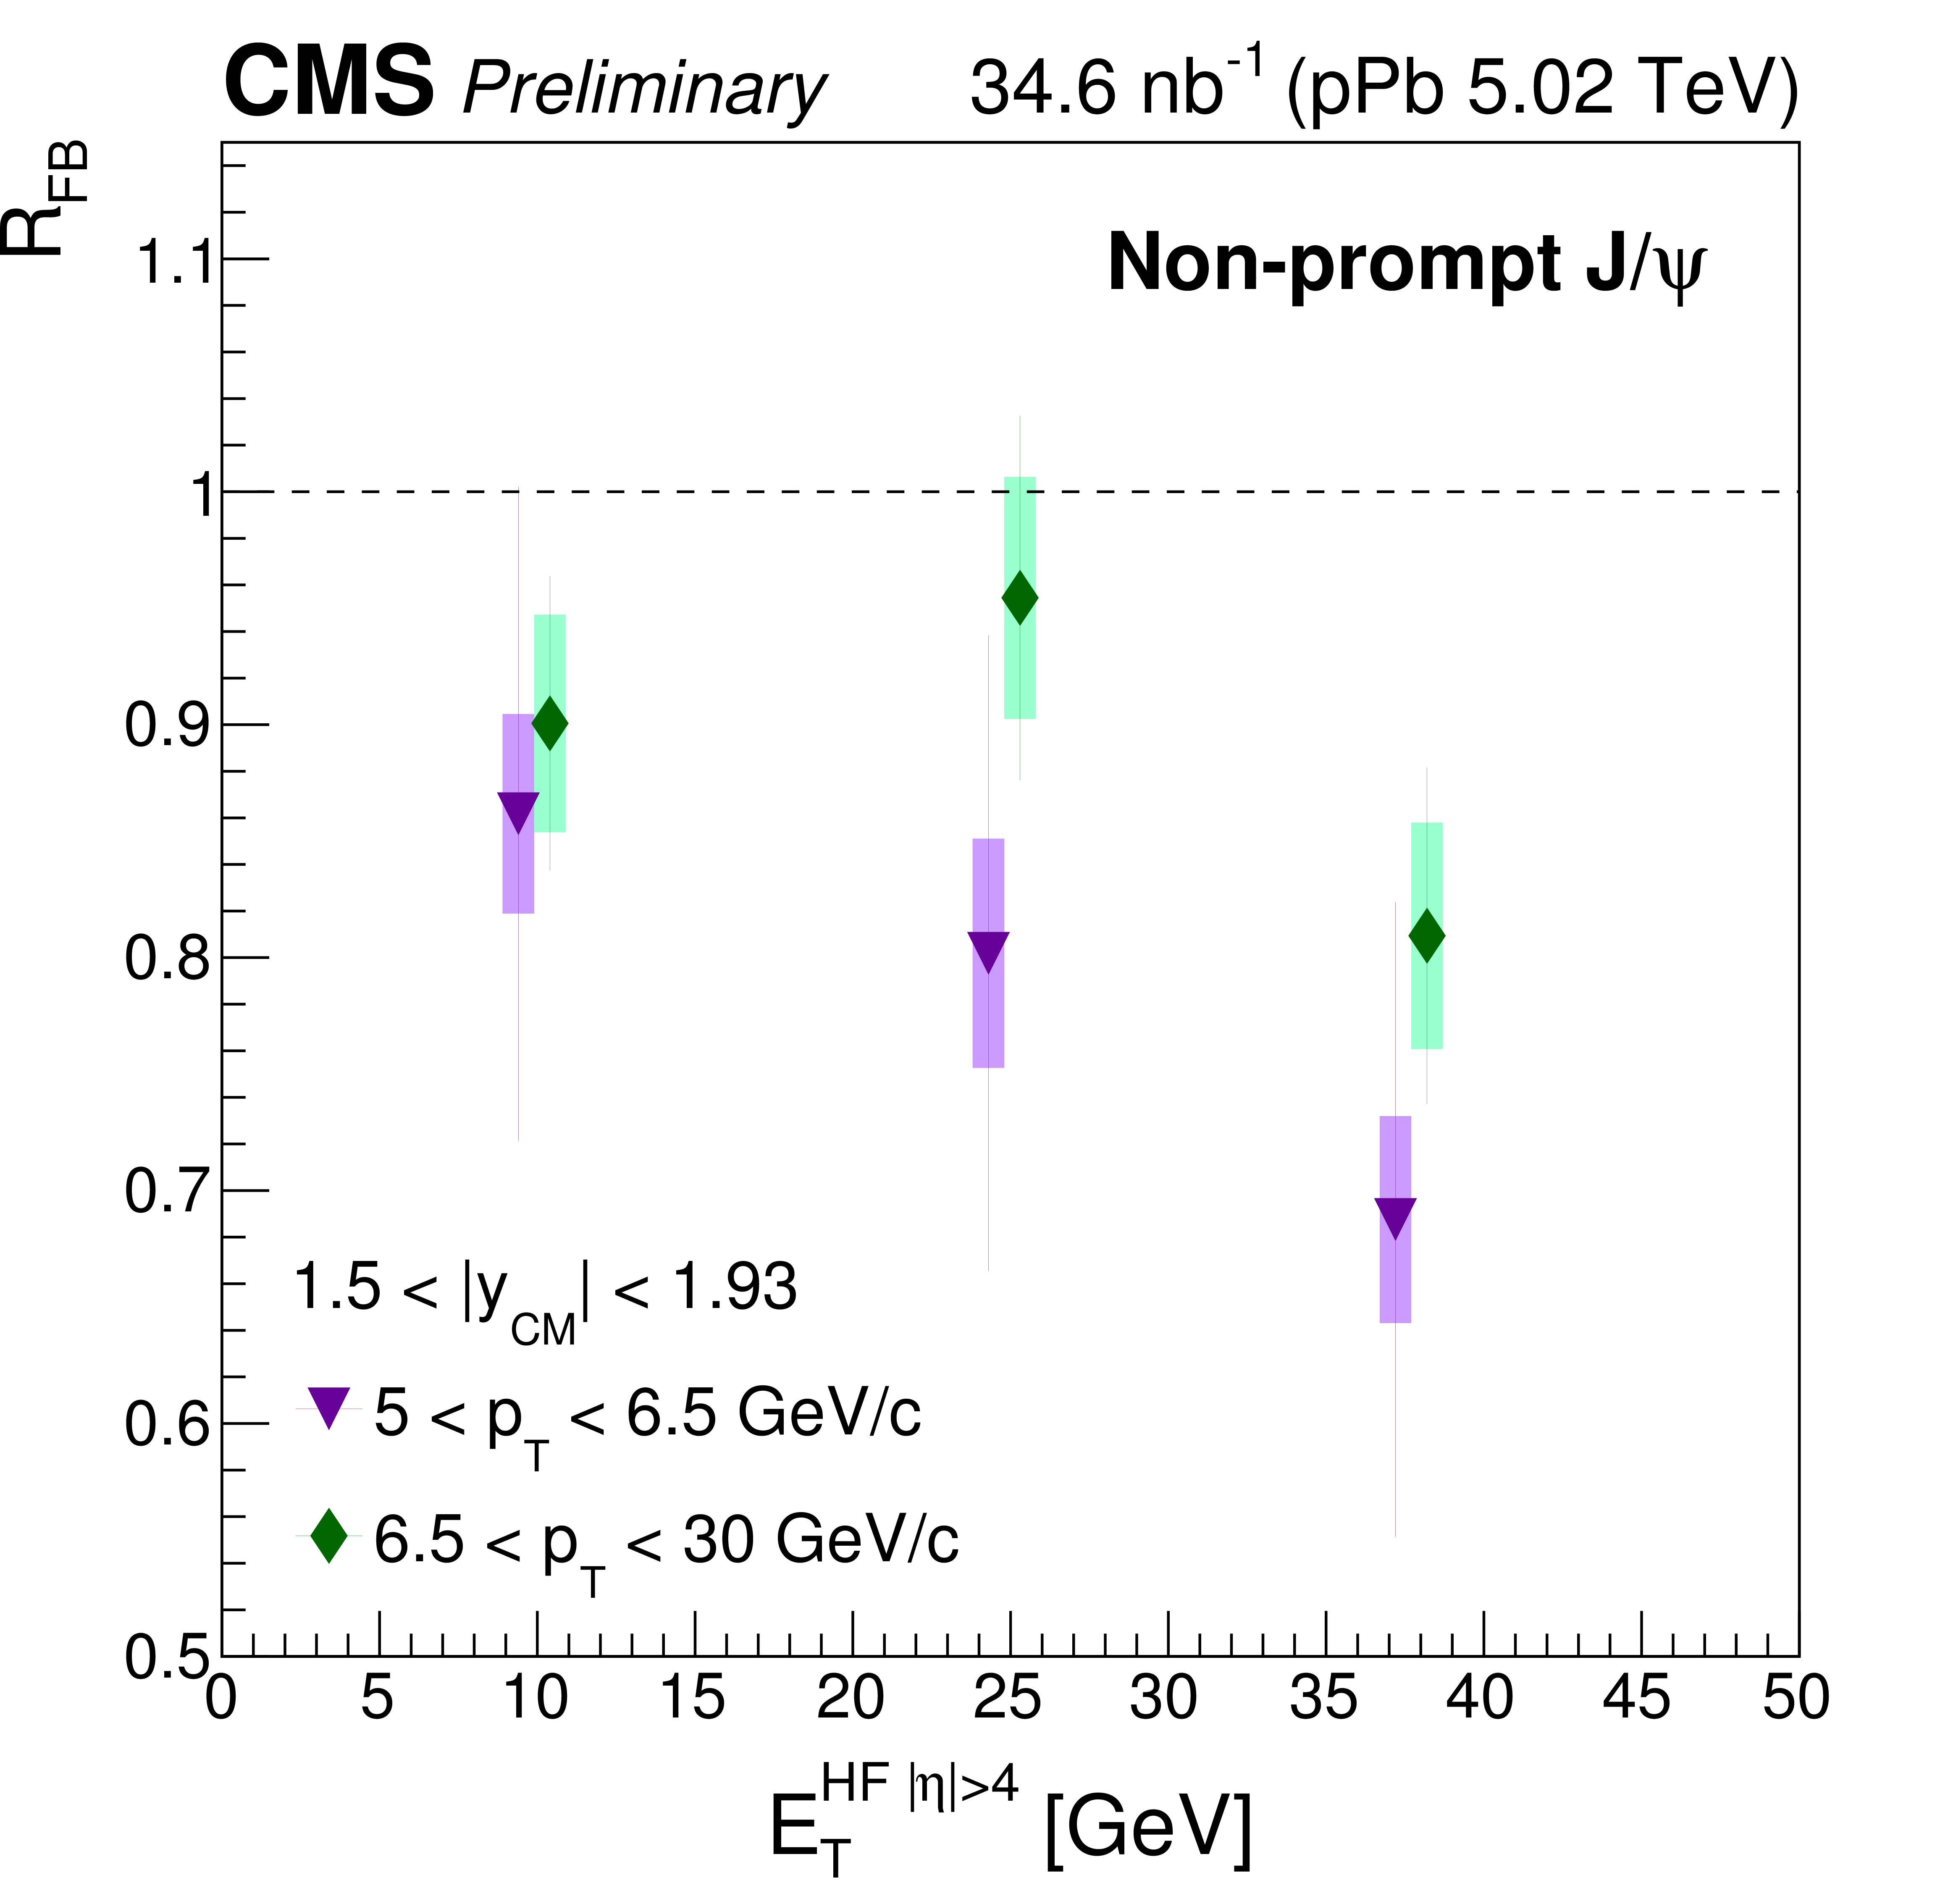
Figure 9-a:
${E_{\mathrm T}^{\mathrm{HF}|\eta |> 4}} $ dependence of $ {R_{FB}} $ for non-prompt $ \mathrm{J} / \psi $ with two different $ {p_{\mathrm {T}}} $ ranges in the most forward-backward region (a), and with the same ${p_{\mathrm {T}}} $ range in three different rapidity ranges (b). For higher $ {p_{\mathrm {T}}} $ (a) or higher rapidity ranges (b), the bin abscissae are slightly shifted so that they do not overlap with each other. The error bars represent the statistical uncertainties, and the shaded boxes show the quadratic sum of systematic uncertainties. |
png ; pdf |
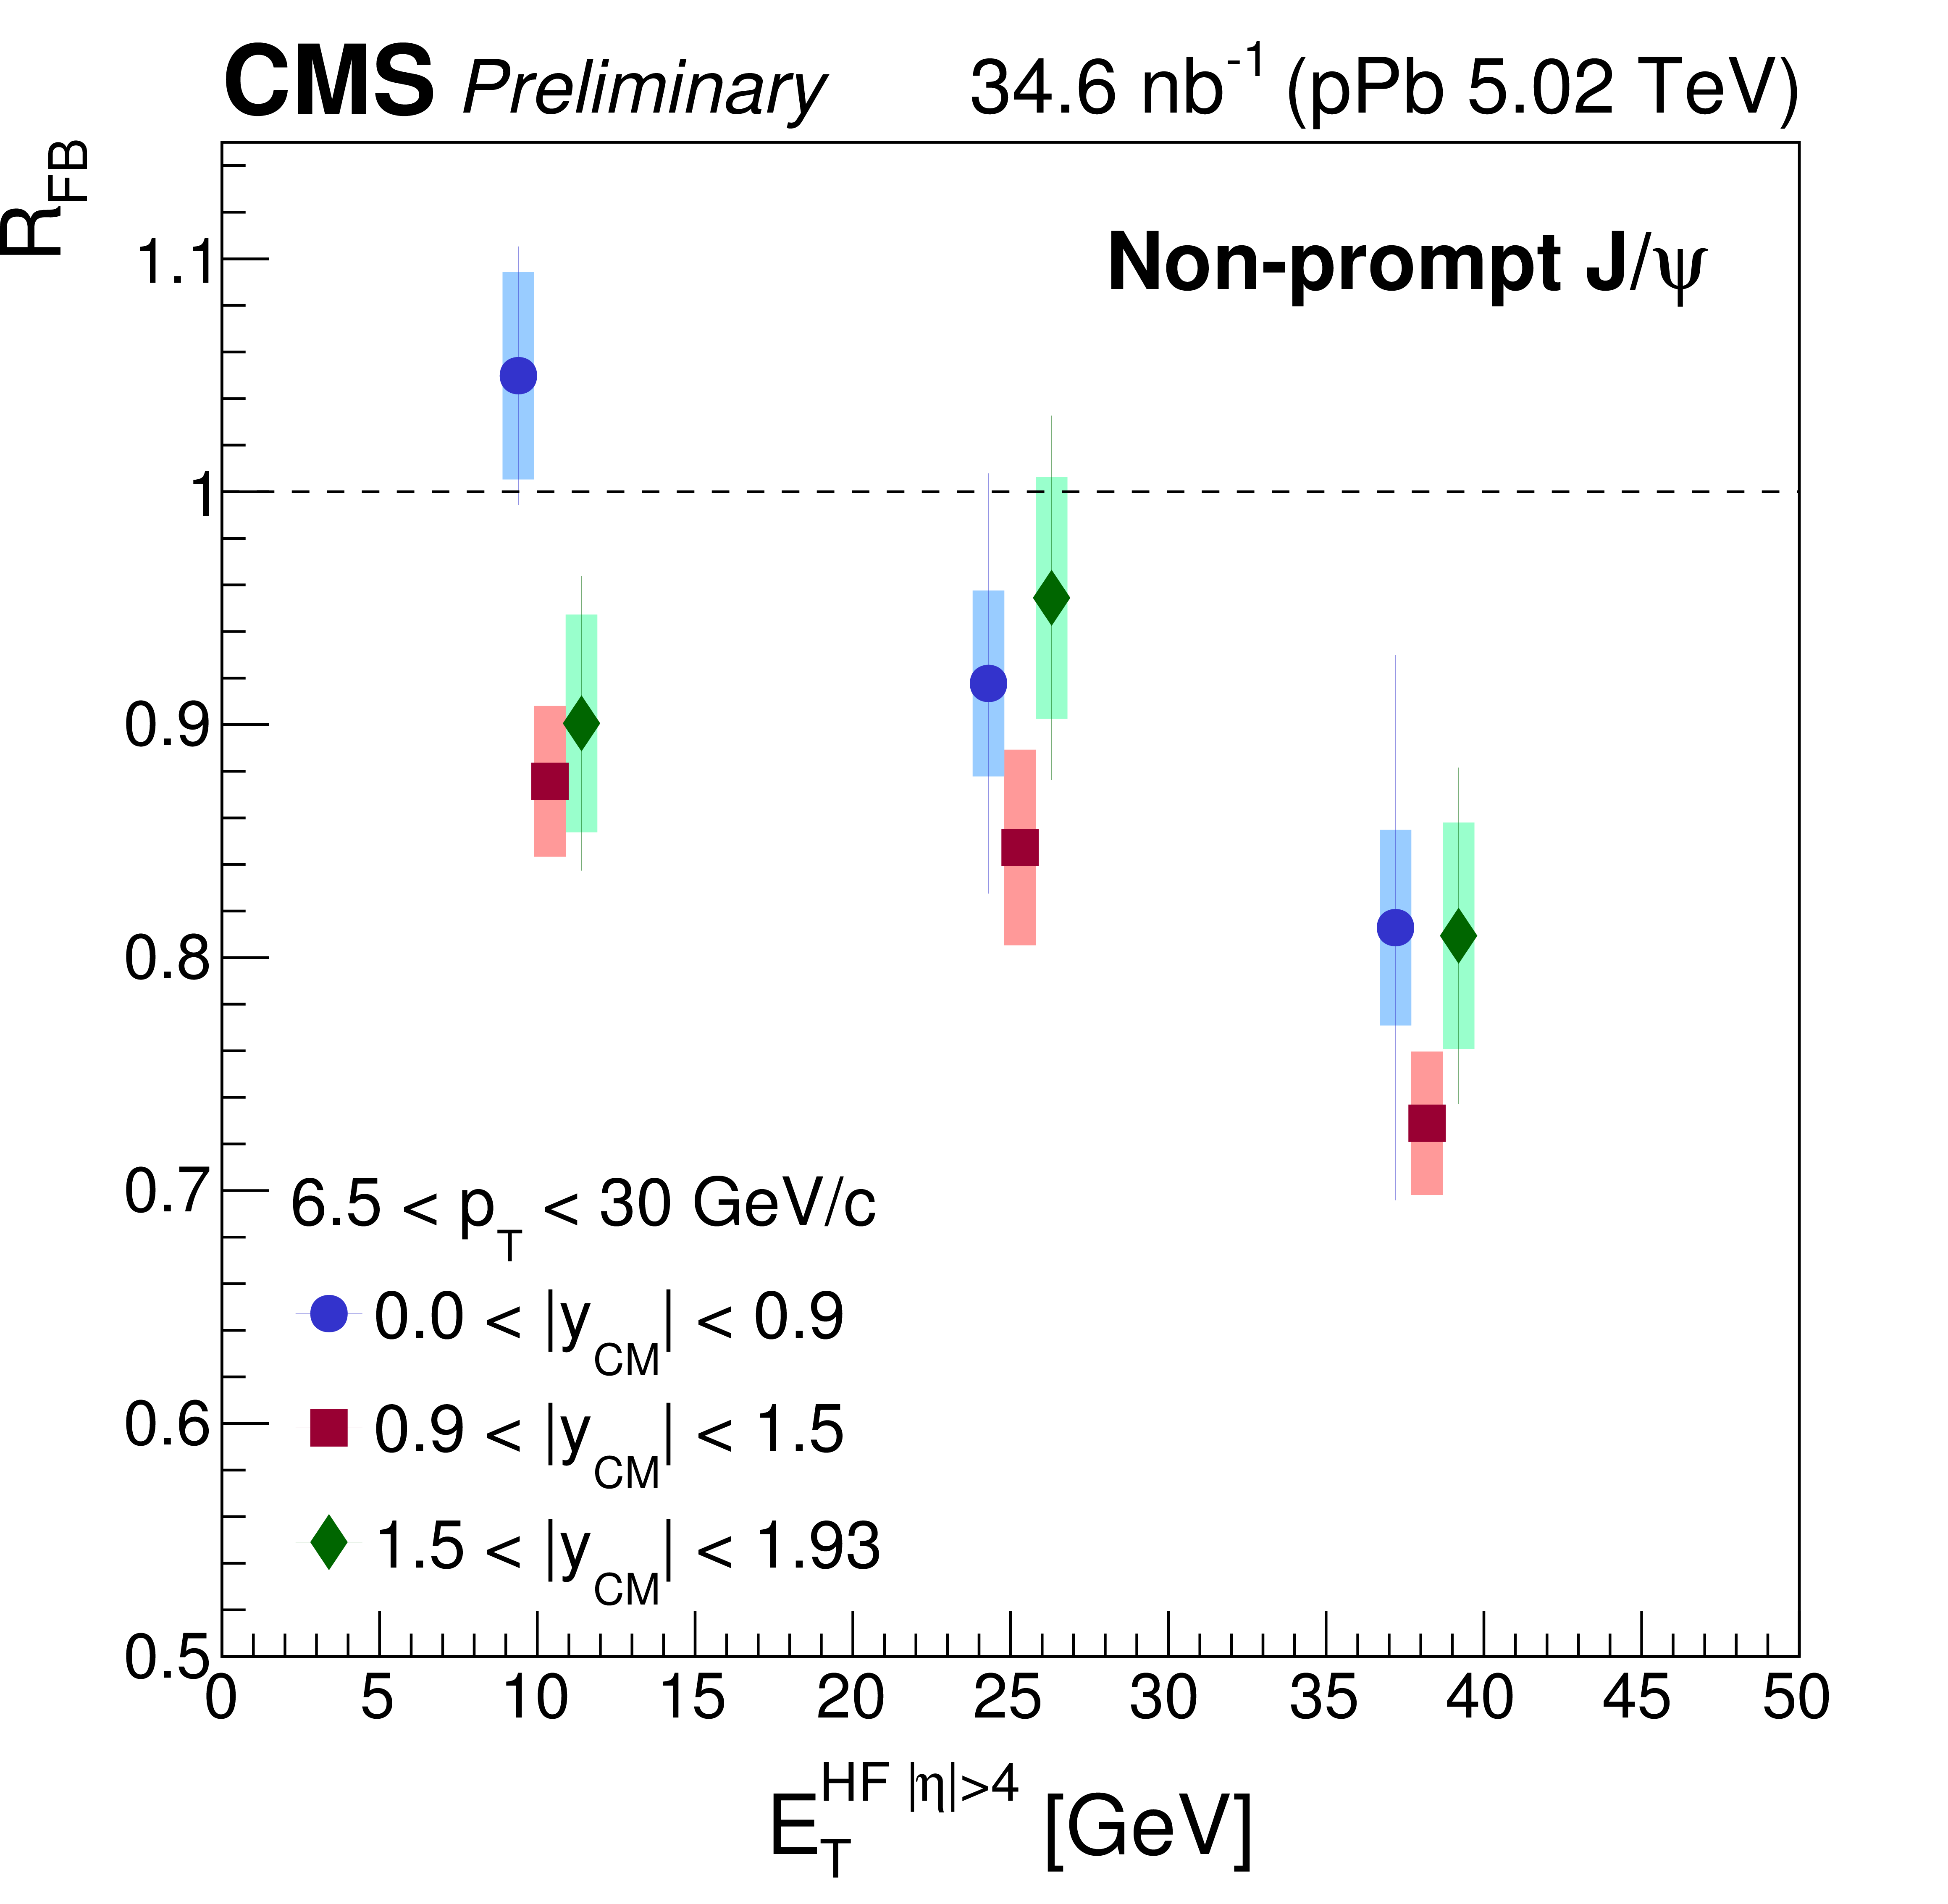
Figure 9-b:
${E_{\mathrm T}^{\mathrm{HF}|\eta |> 4}} $ dependence of $ {R_{FB}} $ for non-prompt $ \mathrm{J} / \psi $ with two different $ {p_{\mathrm {T}}} $ ranges in the most forward-backward region (a), and with the same ${p_{\mathrm {T}}} $ range in three different rapidity ranges (b). For higher $ {p_{\mathrm {T}}} $ (a) or higher rapidity ranges (b), the bin abscissae are slightly shifted so that they do not overlap with each other. The error bars represent the statistical uncertainties, and the shaded boxes show the quadratic sum of systematic uncertainties. |
|
|
Compact Muon Solenoid LHC, CERN |
|

|

|

|

|

|