

Compact Muon Solenoid
LHC, CERN
| CMS-PAS-FSQ-15-006 | ||
| Measurement of the pseudorapidity dependence of the energy and transverse energy density in pp collisions at $\sqrt{s}= $ 13 TeV | ||
| CMS Collaboration | ||
| April 2016 | ||
| Abstract: The measurement of the energy flow is presented in the pseudorapidity range 3.15 $ < |\eta| < $ 6.6 in proton-proton collisions at the LHC for the centre-of-mass energy of $\sqrt{s}=$ 13 TeV. The data have been obtained during several periods of low luminosity operation in 2015. The energy flow, $\mathrm{d}E/\mathrm{d}\eta$, as well as the transverse energy density, $\mathrm{d}E_\mathrm{T}/\mathrm{d}\eta$, are studied as a function of pseudorapidity for soft-inclusive-inelastic and non-single-diffractive-enhanced events. The results are compared to models tuned to describe high-energy hadronic interactions and to earlier pp data at $\sqrt{s}=$ 900 GeV and 7 TeV. Comparison to the earlier data allows to test the hypothesis of the limiting fragmentation. | ||
|
Links:
CDS record (PDF) ;
CADI line (restricted) ;
These preliminary results are superseded in this paper, EPJC 79 (2019) 391. The superseded preliminary plots can be found here. |
||
| Figures | |
png pdf |
Figure 1-a:
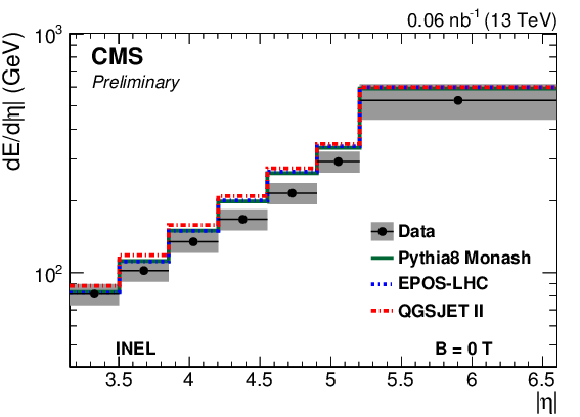
A comparison of energy flow measurements as a function of pseudorapidity at 13 TeV for soft-inclusive-inelastic events to MC models at particle level defined as $\xi >10^{-6}$. The gray band shows the total systematic uncertainty correlated across pseudorapidity bins. The lower panel shows the ratio of measured data to MC predictions. |
png pdf |
Figure 1-b:
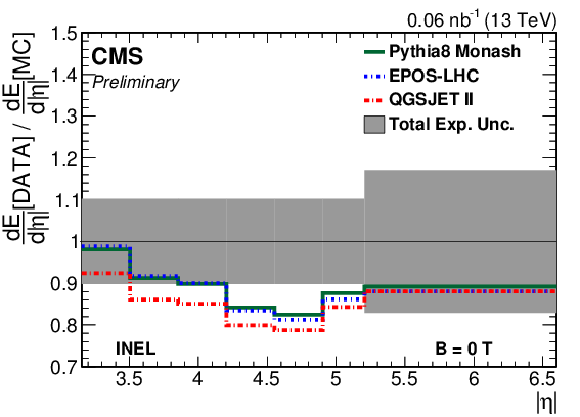
A comparison of energy flow measurements as a function of pseudorapidity at 13 TeV for soft-inclusive-inelastic events to MC models at particle level defined as $\xi >10^{-6}$. The gray band shows the total systematic uncertainty correlated across pseudorapidity bins. The lower panel shows the ratio of measured data to MC predictions. |

png pdf |
Figure 2-a:
A comparison of energy flow measurements as a function of pseudorapidity at 13 TeV for soft-inclusive-inelastic events to MC models at particle level defined as $\xi >10^{-6}$. The gray band shows the total systematic uncertainty correlated across pseudorapidity bins. The red band corresponds to the envelope of the uncertainties of the tune parameters of pythia-8 cuetp8s1 tune. The lower panel shows the ratio of measured data to MC predictions. |

png pdf |
Figure 2-b:
A comparison of energy flow measurements as a function of pseudorapidity at 13 TeV for soft-inclusive-inelastic events to MC models at particle level defined as $\xi >10^{-6}$. The gray band shows the total systematic uncertainty correlated across pseudorapidity bins. The red band corresponds to the envelope of the uncertainties of the tune parameters of pythia-8 cuetp8s1 tune. The lower panel shows the ratio of measured data to MC predictions. |
png pdf |
Figure 3-a:
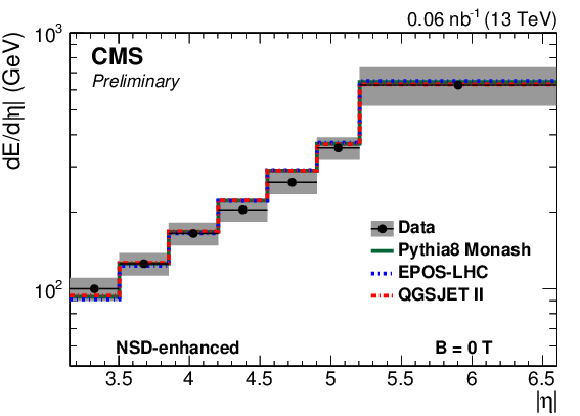
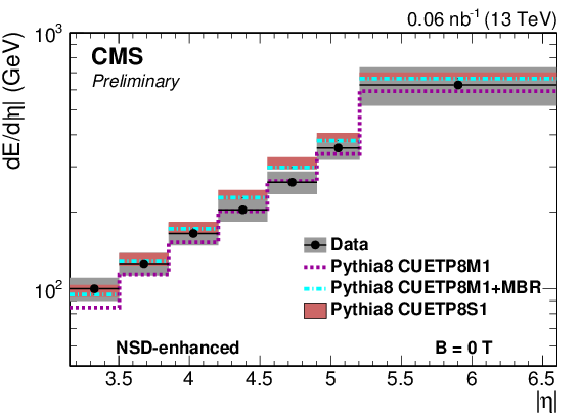
A comparison of energy flow measurements as a function of pseudorapidity at 13 TeV for non-single-diffractive-enhanced events to MC models at particle level defined with a requirement of at least two either charged or neutral particles in the range 3.15 $< |\eta | <$ 5.20, one on each side with respect to the interaction point. The gray band shows the total systematic uncertainty correlated across pseudorapidity bins. The lower panel shows the ratio of measured data to MC predictions and, as a solid black line, ratio of results for non-single-diffractive-enhanced (NSD-enhanced) and soft-inclusive-inelastic (INEL) events. |
png pdf |
Figure 3-b:
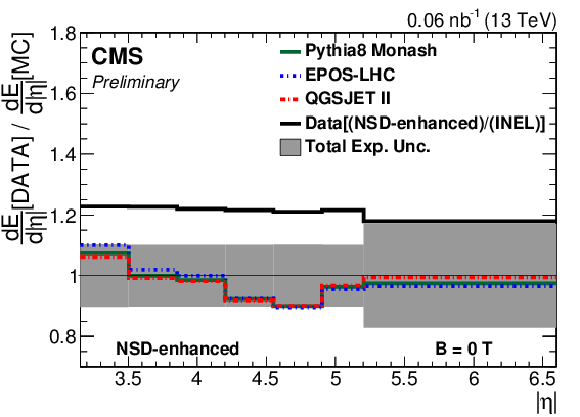
A comparison of energy flow measurements as a function of pseudorapidity at 13 TeV for non-single-diffractive-enhanced events to MC models at particle level defined with a requirement of at least two either charged or neutral particles in the range 3.15 $< |\eta | <$ 5.20, one on each side with respect to the interaction point. The gray band shows the total systematic uncertainty correlated across pseudorapidity bins. The lower panel shows the ratio of measured data to MC predictions and, as a solid black line, ratio of results for non-single-diffractive-enhanced (NSD-enhanced) and soft-inclusive-inelastic (INEL) events. |
png pdf |
Figure 4-a:
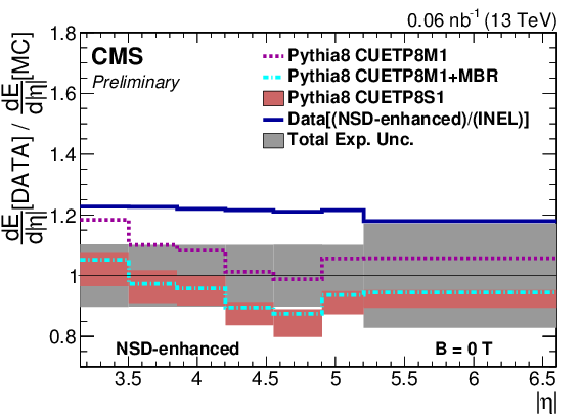
A comparison of energy flow measurements as a function of pseudorapidity at 13 TeV for non-single-diffractive-enhanced events to MC models at particle level defined with a requirement of at least two either charged or neutral particles in the range 3.15 $< |\eta | <$ 5.20, one on each side with respect to the interaction point. The gray band shows the total systematic uncertainty correlated across pseudorapidity bins. The red band corresponds to the envelope of the uncertainties of the tune parameters of pythia-8 cuetp8s1 tune. The lower panel shows the ratio of measured data to MC predictions and, as a solid blue line, ratio of results for non-single-diffractive-enhanced (NSD-enhanced) and soft-inclusive-inelastic (INEL) events. |
png pdf |
Figure 4-b:
A comparison of energy flow measurements as a function of pseudorapidity at 13 TeV for non-single-diffractive-enhanced events to MC models at particle level defined with a requirement of at least two either charged or neutral particles in the range 3.15 $< |\eta | <$ 5.20, one on each side with respect to the interaction point. The gray band shows the total systematic uncertainty correlated across pseudorapidity bins. The red band corresponds to the envelope of the uncertainties of the tune parameters of pythia-8 cuetp8s1 tune. The lower panel shows the ratio of measured data to MC predictions and, as a solid blue line, ratio of results for non-single-diffractive-enhanced (NSD-enhanced) and soft-inclusive-inelastic (INEL) events. |
png pdf |
Figure 5:
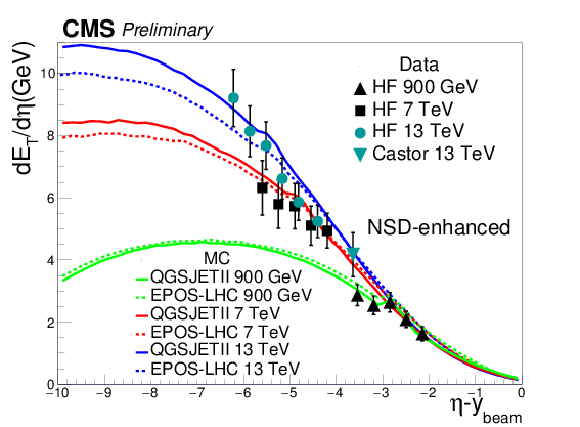
A comparison of measurements of transverese energy flow, $ {\text {d} E_{\text {T}}}/ {\text {d}\eta '}$, as a function of shifted pseudorapidity, $\eta ' = \eta - y_{\text {beam}}$ to MC models and earlier pp data [5] for several centre-of-mass energies for non-single-diffractive-enhanced events. The selection at particle level is defined with a requirement of at least two charged particles in the range 3.9 $< |\eta | <$ 4.4, at least one on each side with respect to the interaction point. The data are shown as points, the error bars indicate the total systematic uncertainties correlated across pseudorapidity bins. |
| Summary |
| To conclude, the measurement of the energy flow is presented in the pseudorapidity range 3.15 $< |\eta| <$ 6.6 in proton-proton collisions for the centre-of-mass energy of $\sqrt{s} =$ 13 TeV. The energy flow is studied as a function of pseudorapidity for soft-inclusive-inelastic and non-single-diffractive events.The results are compared to several PYTHIA-8 tunes, EPOS and QGSJET hadronic interaction models commonly used in cosmic ray physics, and earlier pp data at $\sqrt{s} =$ 900 GeV and 7 TeV. The considered models provide in general reasonable description of the measured energy flow at the highest energy achieved so far at the LHC. The spread of the model predictions for soft-inclusive-inelastic events is large and becomes smaller for non-single-diffractive-enhanced events. The results at different energies are shown to be consistent in terms of shifted pseudorapidity variable, $\eta - y_{\text{beam}} $, and reveal overall consistency with the hypothesis of limiting fragmentation in a wide range of pp collision energies from 900 GeV to 13 TeV. |

|
Compact Muon Solenoid LHC, CERN |

|

|

|

|

|

|