

Compact Muon Solenoid
LHC, CERN
| CMS-PAS-EXO-15-010 | ||
| Searches for Long-lived Charged Particles in Proton-Proton Collisions at $\sqrt{s}= $ 13 TeV | ||
| CMS Collaboration | ||
| December 2015 | ||
| Abstract: The results of searches for heavy stable charged particles produced in pp collisions at $\sqrt{s} =$ 13 TeV corresponding to an integrated luminosity of 2.4 fb$^{-1}$ are presented. Candidates are searched for in data collected with the CMS detector at the CERN LHC by using signatures of anomalously high energy deposition in the silicon tracker and long time-of-flight to the muon detectors. The data are consistent with the expected background and limits on the cross section for production of long-lived gluinos, scalar tops and taus are set. Corresponding lower mass limits, ranging up to 1590 GeV for gluinos, are the most stringent to date. Limits on the cross section for direct pair production of scalar taus and lepton-like long-lived fermions are also set. | ||
|
Links:
CDS record (PDF) ;
CADI line (restricted) ;
These preliminary results are superseded in this paper, PRD 94 (2016) 112004. The superseded preliminary plots can be found here. |
||
| Figures | |
png ; pdf ; |
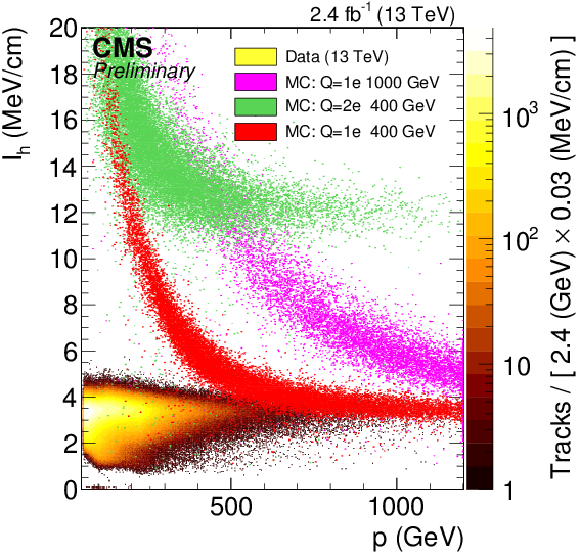
Figure 1:
Distribution of the $\mathrm{d}E/\mathrm{d}x$ estimator, $I_h$, versus particle momentum for 13 TeV data, and for singly or multiply charged HSCP simulation. |
png ; pdf ; |
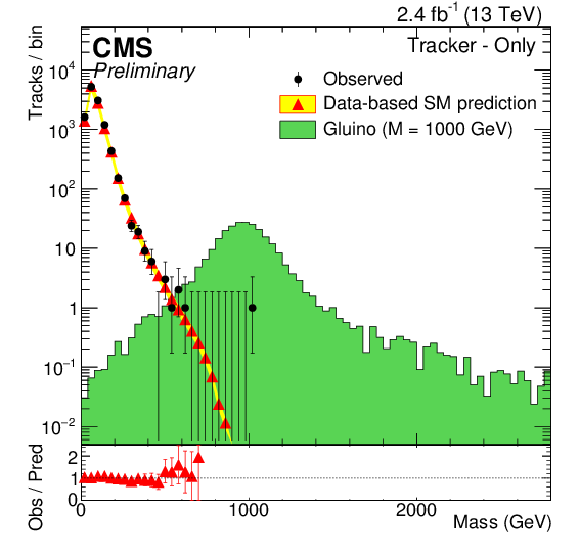
Figure 2-a:
Observed and predicted mass spectra for candidates entering the (tracker-only) (a) and (tracker+TOF) (b) signal region for the loose selection for $\sqrt {s} =$ 13 TeV. The expected distribution for a representative signal is shown in green. |
png ; pdf ; |
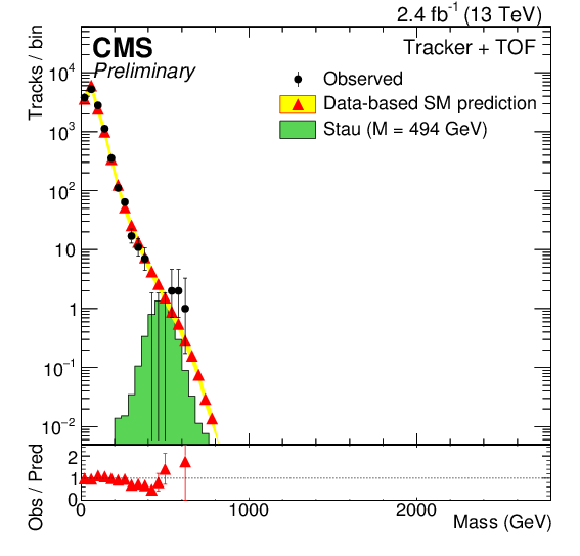
Figure 2-b:
Observed and predicted mass spectra for candidates entering the (tracker-only) (a) and (tracker+TOF) (b) signal region for the loose selection for $\sqrt {s} =$ 13 TeV. The expected distribution for a representative signal is shown in green. |
png ; pdf ; |
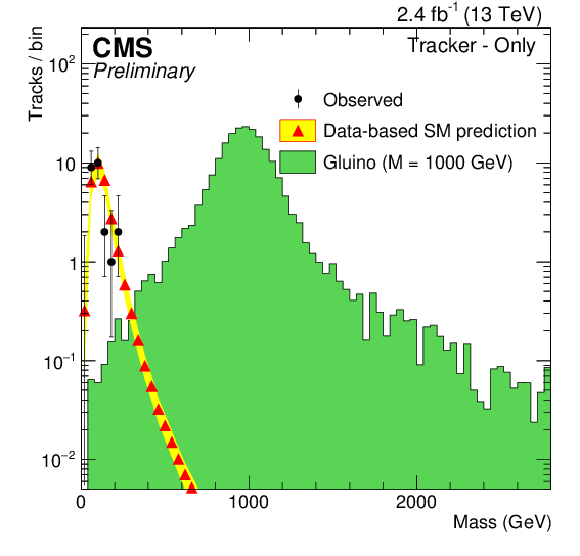
Figure 3-a:
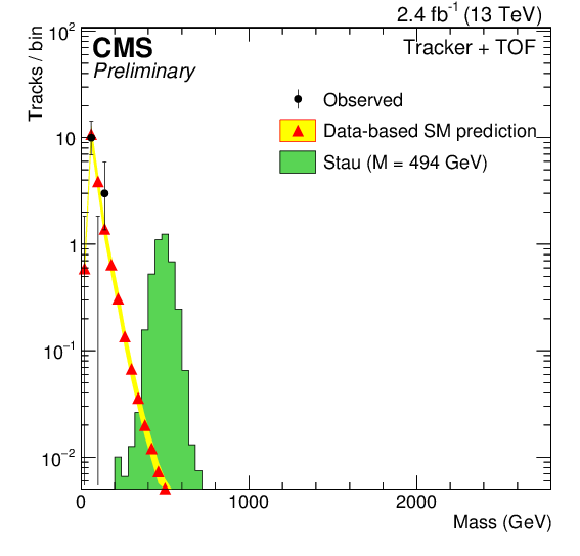
Observed and predicted mass spectra for candidates entering the (tracker-only) (a) or (tracker+TOF) (b) signal region for the final selection. The expected distribution for a representative signal is shown in green. |
png ; pdf ; |
Figure 3-b:
Observed and predicted mass spectra for candidates entering the (tracker-only) (a) or (tracker+TOF) (b) signal region for the final selection. The expected distribution for a representative signal is shown in green. |
png ; pdf ; |
Figure 4-a:
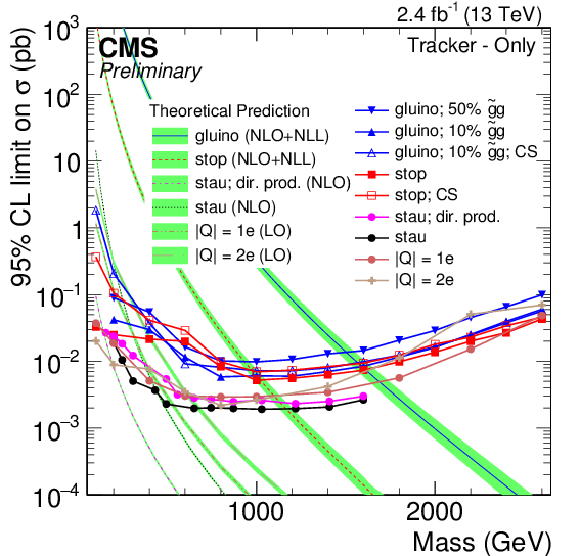
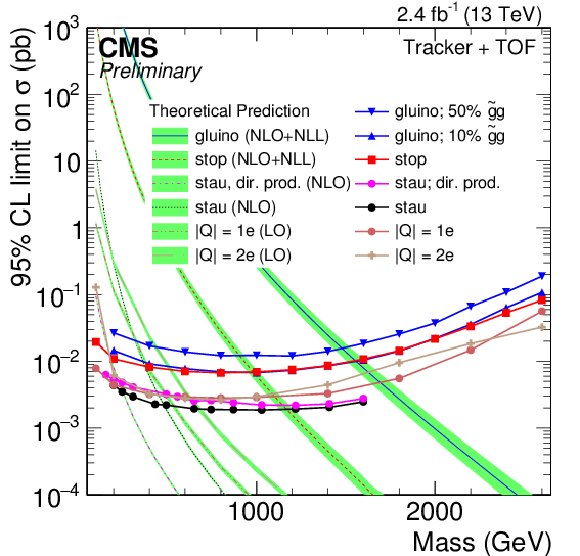
Cross section upper limits at 95% CL on various signal models for the (tracker-only) analysis (a) and (tracker+TOF) analysis (b) at $\sqrt {s} =$ 13 TeV. In the legend, 'CS' stands for charged suppressed interaction model. |
png ; pdf ; |
Figure 4-b:
Cross section upper limits at 95% CL on various signal models for the (tracker-only) analysis (a) and (tracker+TOF) analysis (b) at $\sqrt {s} =$ 13 TeV. In the legend, 'CS' stands for charged suppressed interaction model. |

|
Compact Muon Solenoid LHC, CERN |

|

|

|

|

|

|