

Compact Muon Solenoid
LHC, CERN
| CMS-PAS-EXO-15-006 | ||
| Search for SSM W' production, in the lepton+MET final state at a center-of-mass energy of 13 TeV | ||
| CMS Collaboration | ||
| December 2015 | ||
| Abstract: This note presents the search for new physics in events with an electron or muon and missing transverse energy, using 2.2 fb$^{-1}$ of pp collision data at $\sqrt{s} =$ 13 TeV, collected by the CMS detector during 2015. The focus is set on the potential production of a W' boson, as described by the Sequential Standard Model (SSM). No evidence of an excess relative to the Standard Model expectation is observed and upper limits at 95\% confidence level are set on the production cross section times branching fractions of the SSM W' boson, which are translated into lower limits for the new boson mass. Masses below 4.4 TeV are excluded when both the electron and muon final decay channels are combined together. These results significantly extend previously published limits. | ||
|
Links:
CDS record (PDF) ;
CADI line (restricted) ;
These preliminary results are superseded in this paper, PLB 770 (2017) 278. The superseded preliminary plots can be found here. |
||
| Figures | |
png ; pdf ; |
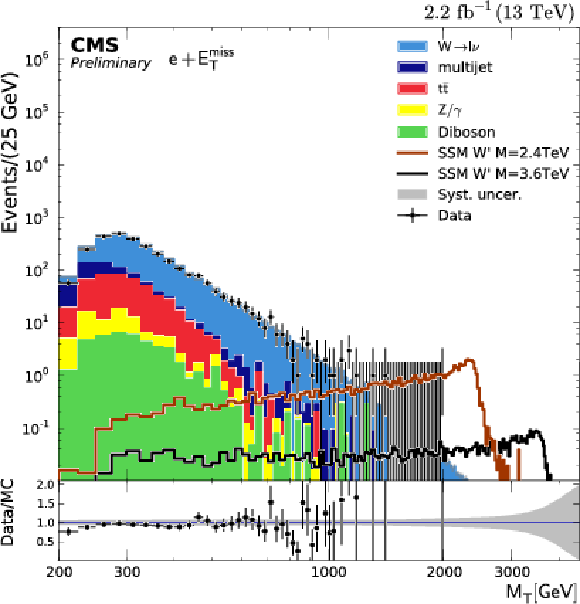
Figure 1-a:
Resulting distributions for data and expected SM backgrounds after kinematic selection in the electron channel: transverse mass $ M_{\mathrm{T}} $ (a) and $M_{\mathrm{T}}$-cumulative (b). The expected signal from the decay of two $\mathrm{ W^\prime }$ bosons with masses $\mathrm{ M(W^\prime) } =$ 2.4 and 3.6 TeV are also shown. The bottom panels in both figures show the ratio of observed data to SM predictions where the band centered around unity accounts for the systematic uncertainty on the background prediction, without including the 4.6% uncertainty in the luminosity. |
png ; pdf ; |
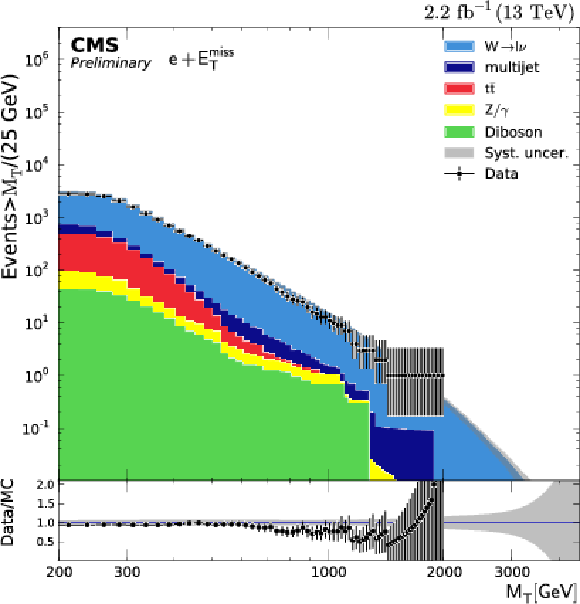
Figure 1-b:
Resulting distributions for data and expected SM backgrounds after kinematic selection in the electron channel: transverse mass $ M_{\mathrm{T}} $ (a) and $M_{\mathrm{T}}$-cumulative (b). The expected signal from the decay of two $\mathrm{ W^\prime }$ bosons with masses $\mathrm{ M(W^\prime) } =$ 2.4 and 3.6 TeV are also shown. The bottom panels in both figures show the ratio of observed data to SM predictions where the band centered around unity accounts for the systematic uncertainty on the background prediction, without including the 4.6% uncertainty in the luminosity. |
png ; pdf ; |
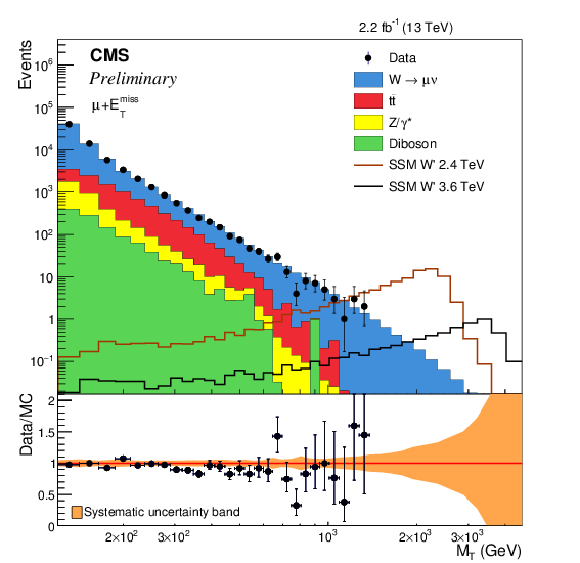
Figure 2-a:
Resulting distributions for data and expected SM backgrounds after kinematic selection in the muon channel: transverse mass $ M_{\mathrm{T}} $ (a) and $M_{\mathrm{T}}$- cumulative (b). The expected signal from the decay of two $\mathrm{ W^\prime }$ bosons with masses $\mathrm{ M(W^\prime) } =$ 2.4 and 3.6 TeV are also shown. The bottom panels in both figures show the ratio of observed data to SM predictions where the band centered around unity accounts for the systematic uncertainty on the background prediction, without including the 4.6% uncertainty in the luminosity. |
png ; pdf ; |
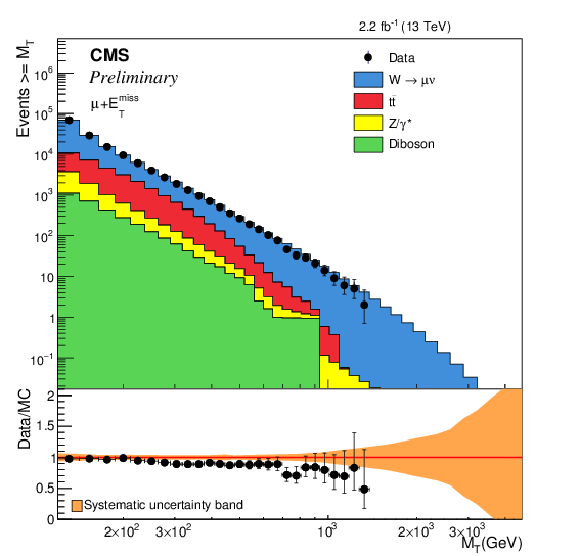
Figure 2-b:
Resulting distributions for data and expected SM backgrounds after kinematic selection in the muon channel: transverse mass $ M_{\mathrm{T}} $ (a) and $M_{\mathrm{T}}$- cumulative (b). The expected signal from the decay of two $\mathrm{ W^\prime }$ bosons with masses $\mathrm{ M(W^\prime) } =$ 2.4 and 3.6 TeV are also shown. The bottom panels in both figures show the ratio of observed data to SM predictions where the band centered around unity accounts for the systematic uncertainty on the background prediction, without including the 4.6% uncertainty in the luminosity. |
png ; pdf ; |
Figure 3-a:
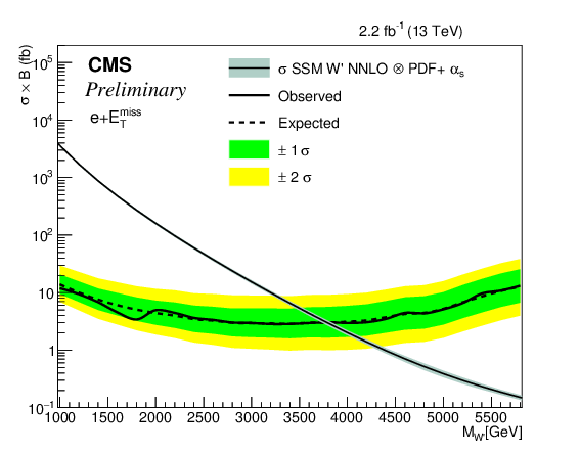
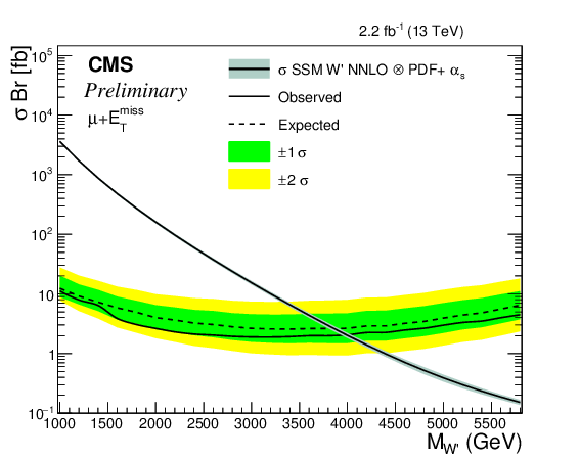
Expected and observed 95% CL limits for the electron (a) and muon (b) channels. The expected (observed) limit are displayed as a dashed (solid) line and the green (yellow) bands represent the one(two) sigma uncertainty bands. The SSM $\mathrm{ W^\prime }$ NNLO cross sections are depicted as a function of $\mathrm{ M(W^\prime) } $. |
png ; pdf ; |
Figure 3-b:
Expected and observed 95% CL limits for the electron (a) and muon (b) channels. The expected (observed) limit are displayed as a dashed (solid) line and the green (yellow) bands represent the one(two) sigma uncertainty bands. The SSM $\mathrm{ W^\prime }$ NNLO cross sections are depicted as a function of $\mathrm{ M(W^\prime) } $. |
png ; pdf ; |
Figure 4:
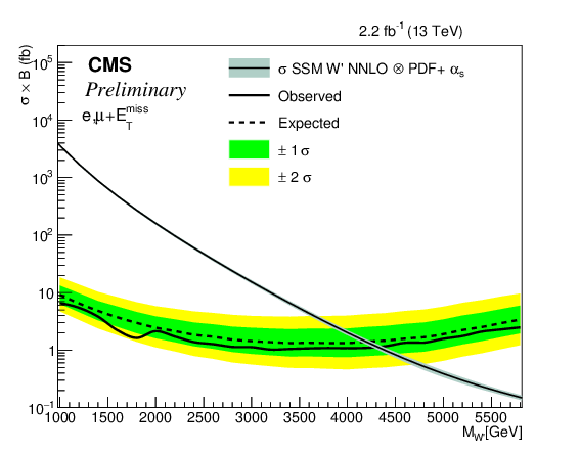
Expected and observed 95% CL limits for the combination of the electron and muon channels. The expected (observed) limit are displayed as a dashed (solid) line and the green (yellow) bands represent the one(two) sigma uncertainty bands. The SSM $\mathrm{ W^\prime }$ NNLO cross sections are depicted as a function of $\mathrm{ M(W^\prime) } $. |

|
Compact Muon Solenoid LHC, CERN |

|

|

|

|

|

|