

Compact Muon Solenoid
LHC, CERN
| CMS-PAS-EXO-14-013 | ||
| Search for top squarks in R-parity violating supersymmetry with dileptons and jets | ||
| CMS Collaboration | ||
| July 2015 | ||
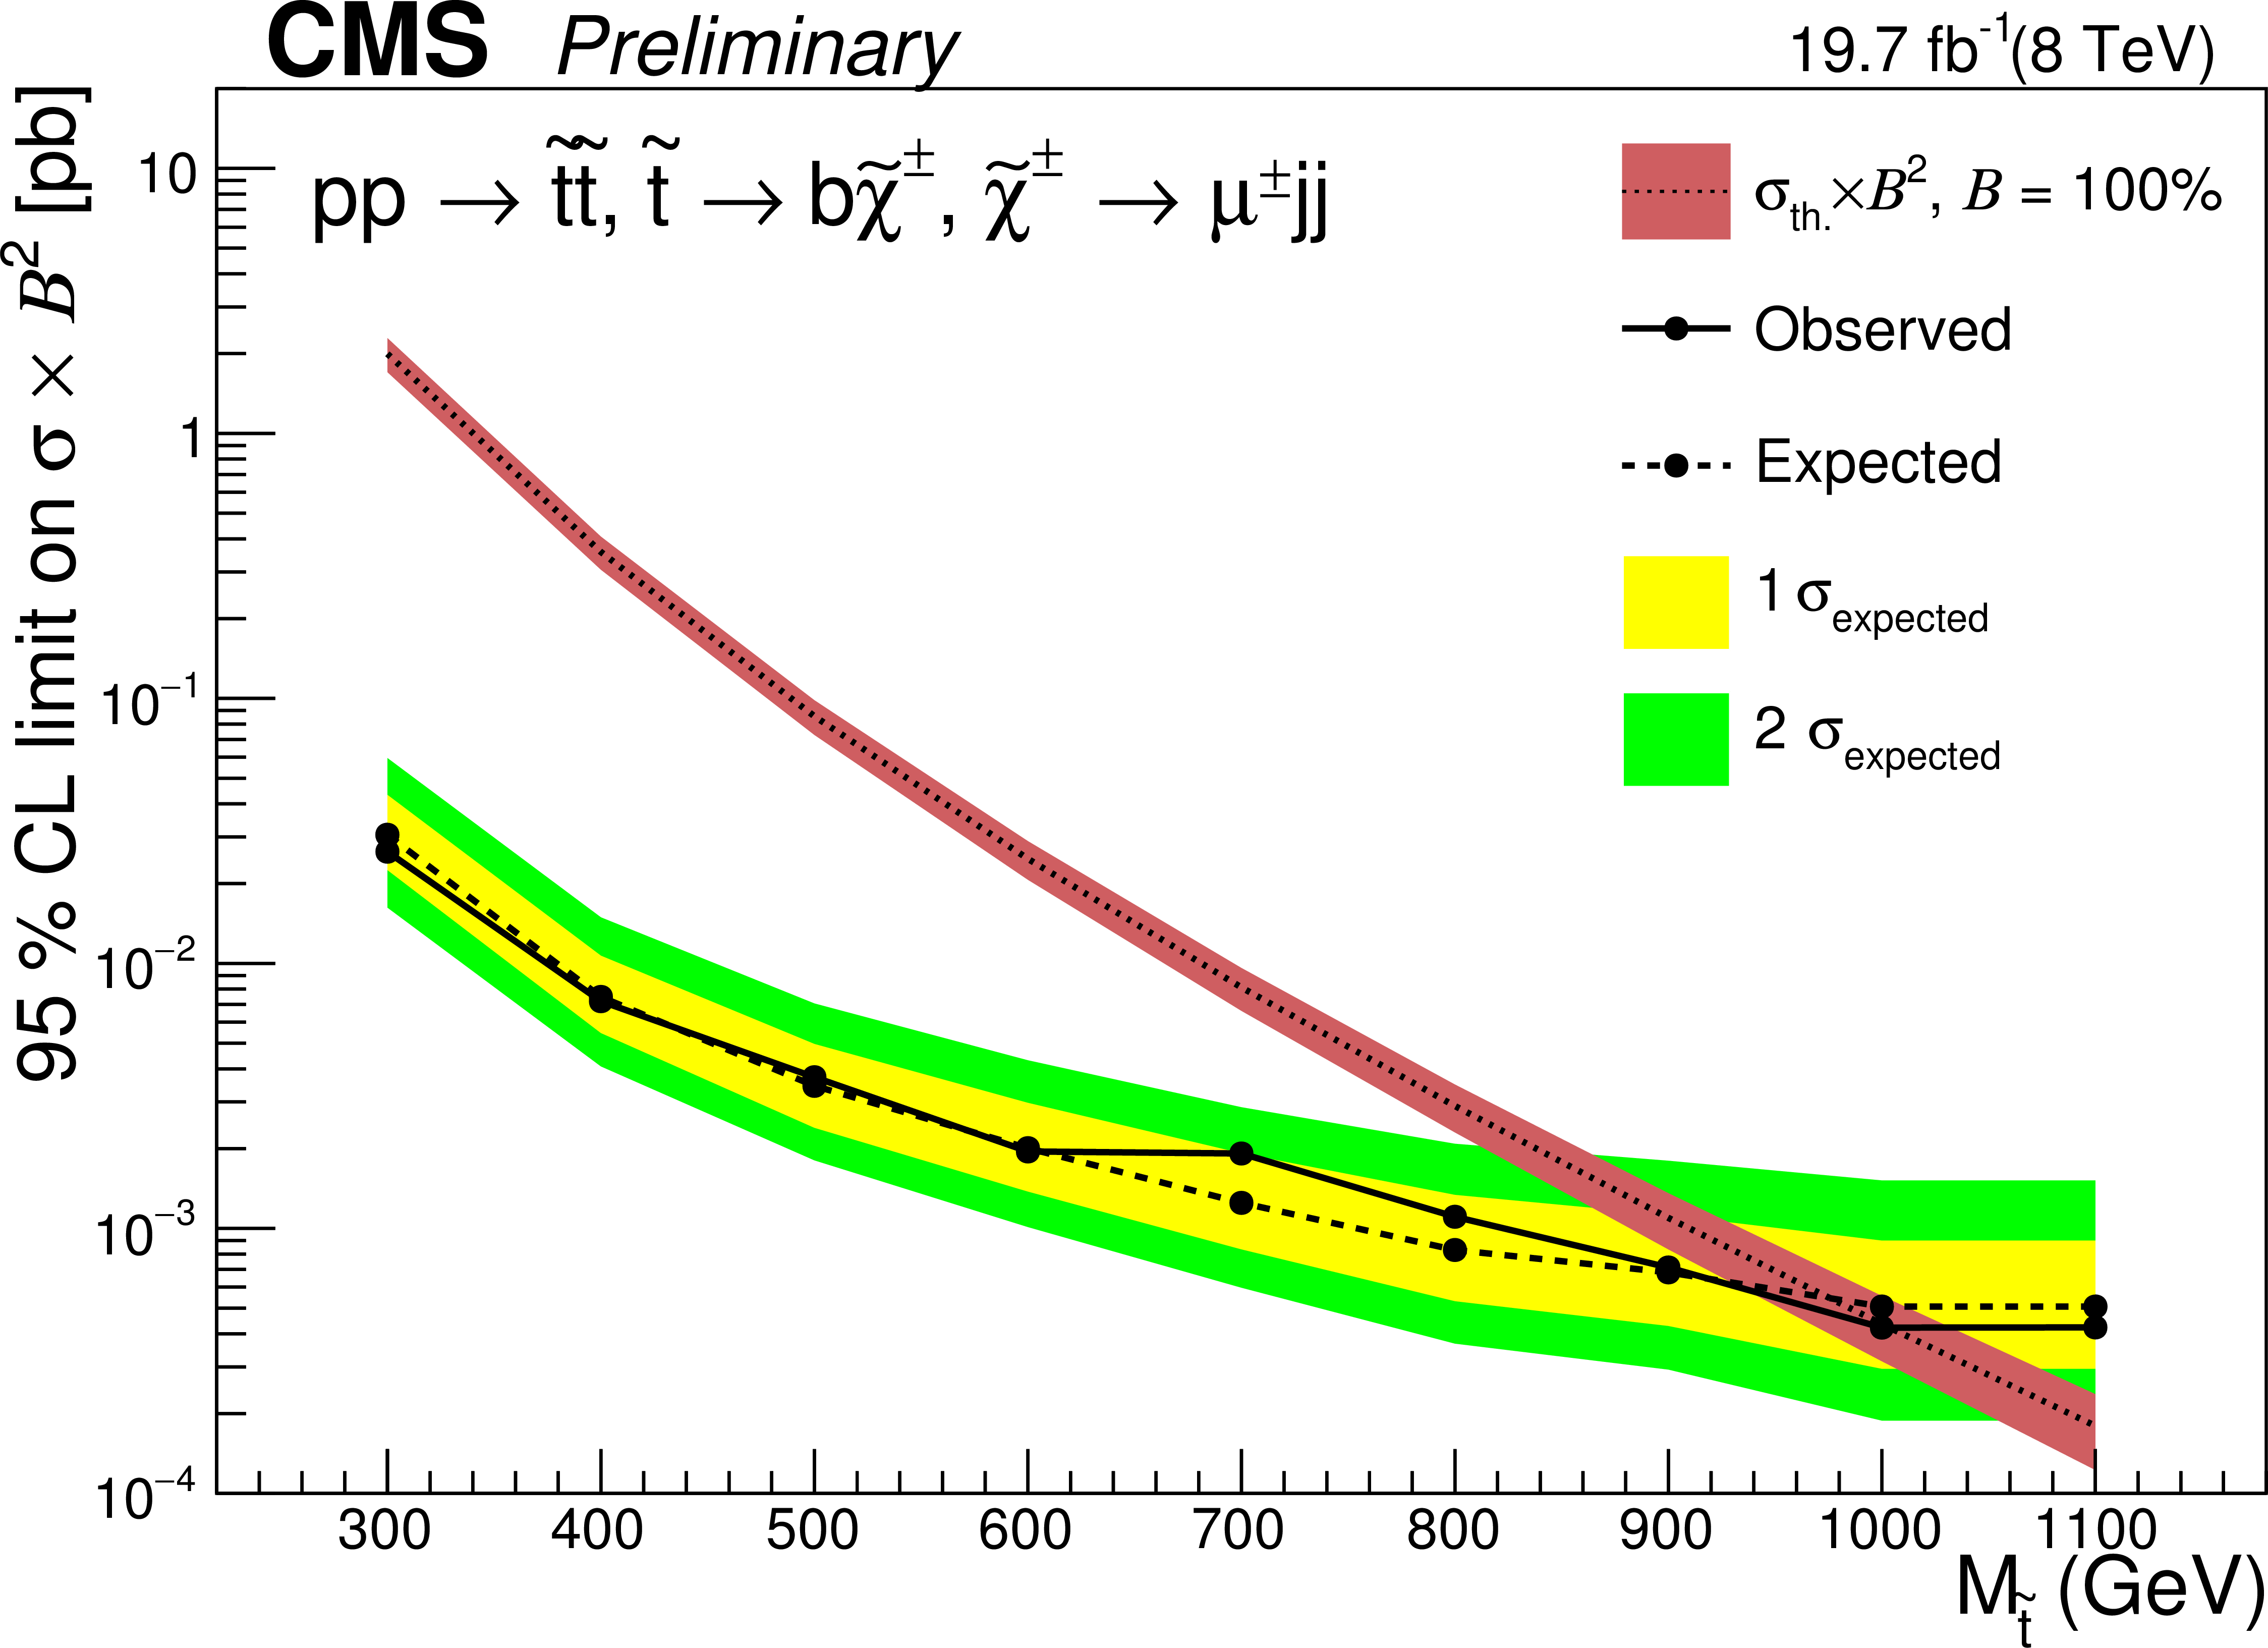
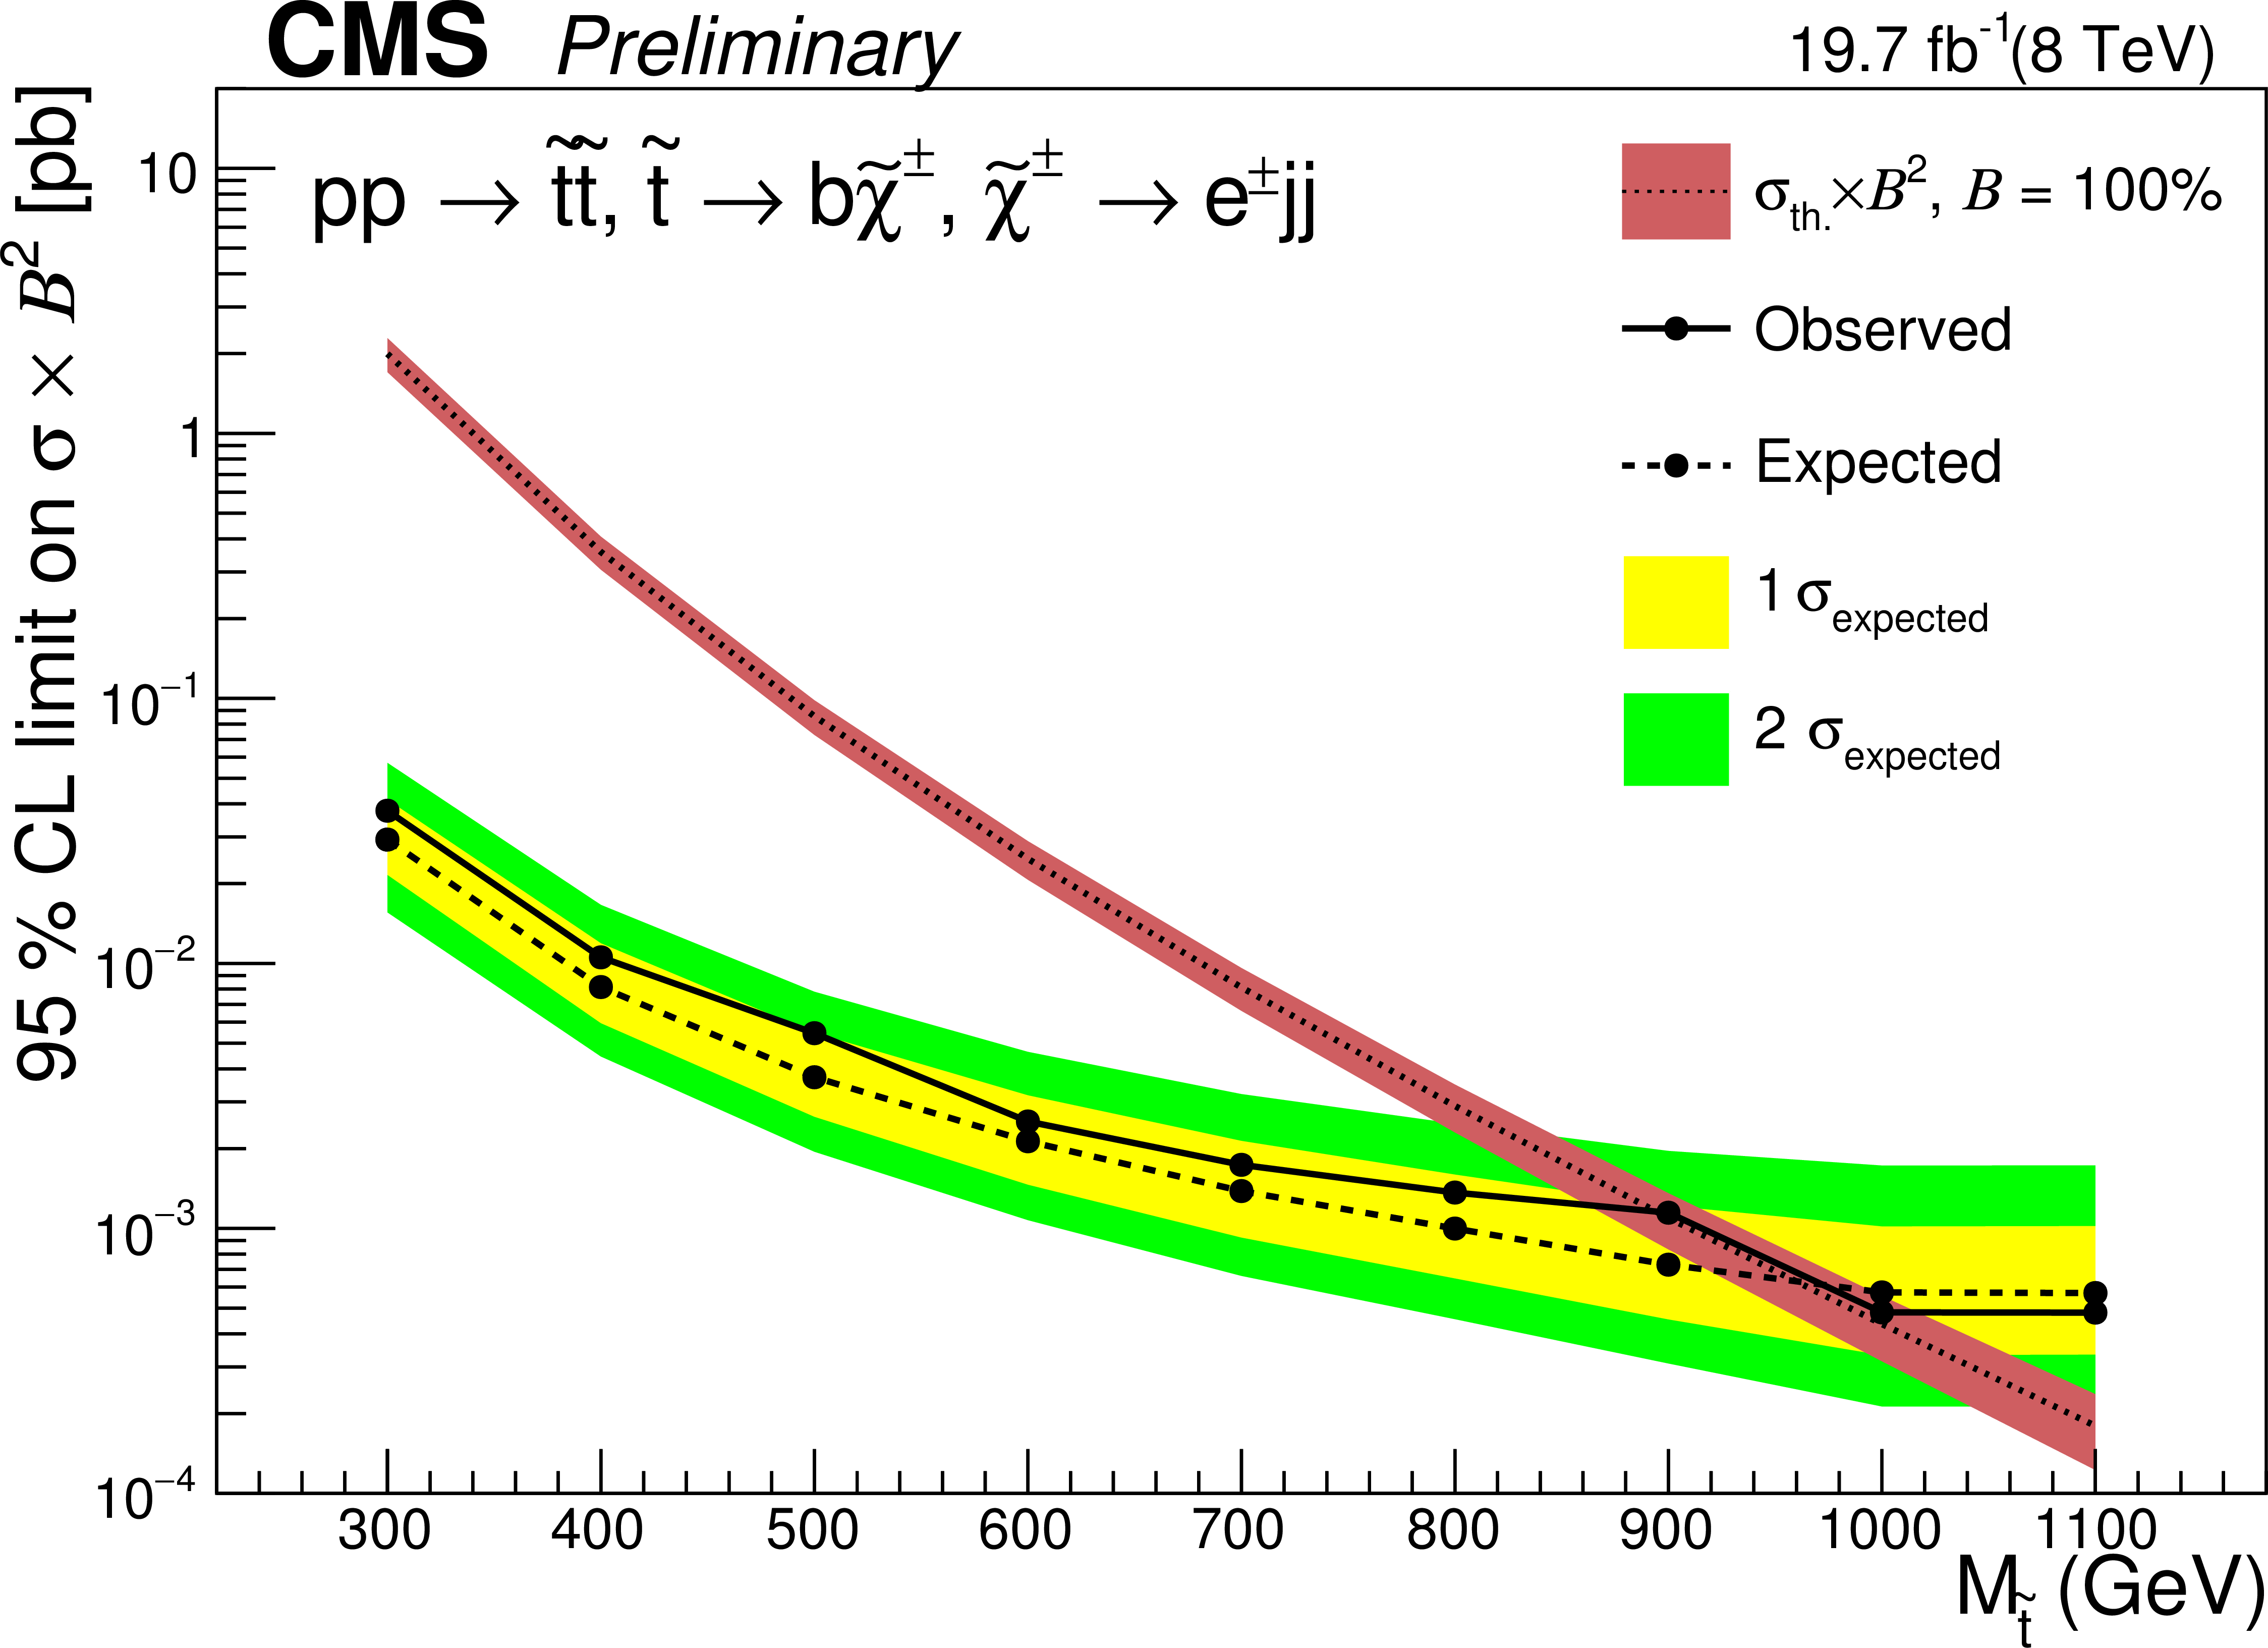
| Abstract: The results of a search for top squark pair production in proton-proton collisions at $\sqrt{s}$ = 8 TeV are presented. The search focuses on R-parity violating chargino-mediated decays of the top squark in final states with low missing transverse momentum, two opposite charge electrons or muons, and at least five jets. The analysis is based on a data sample corresponding to an integrated luminosity of 19.7 fb$^{-1}$ collected with the CMS detector at the LHC in 2012. The data are found to be in agreement with the standard model expectation, and upper limits are placed on the top squark pair production cross section at the 95% confidence level. Top squark masses less than 1000 (890) GeV for the muon (electron) channel are excluded in models with a single non-zero coupling $\lambda^{\prime}_{ijk}$ ($i,j,k\leq$ 2). | ||
|
Links:
CDS record (PDF) ;
Public twiki page ;
CADI line (restricted) ; Figures are also available from the CDS record. These preliminary results are superseded in this paper, PLB 760 (2016) 178. |
||
| Figures | |
png ; pdf |
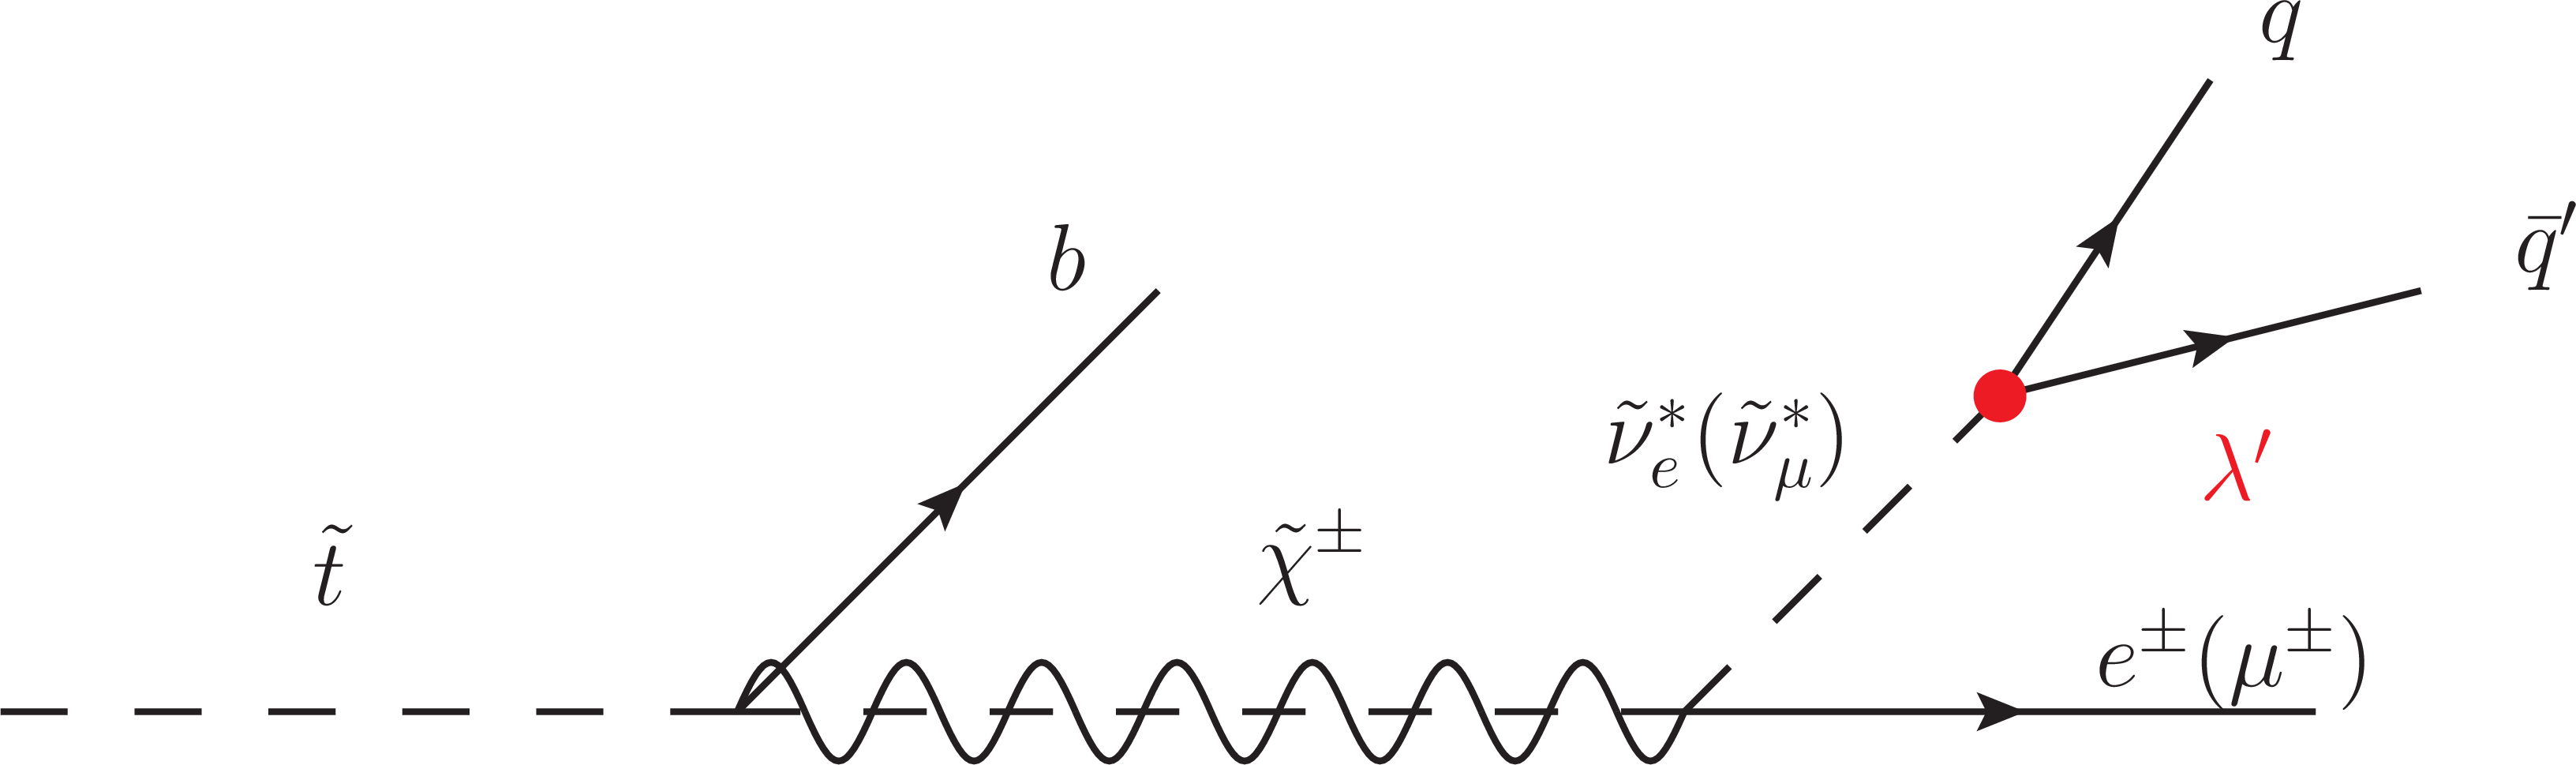
Figure 1:
Diagram for the R-parity violating, chargino-mediated decay of a top squark. The chargino decays to a lepton and two jets via an off-shell sneutrino and non-zero $ {\lambda '} _{ijk}$. |

png ; pdf |
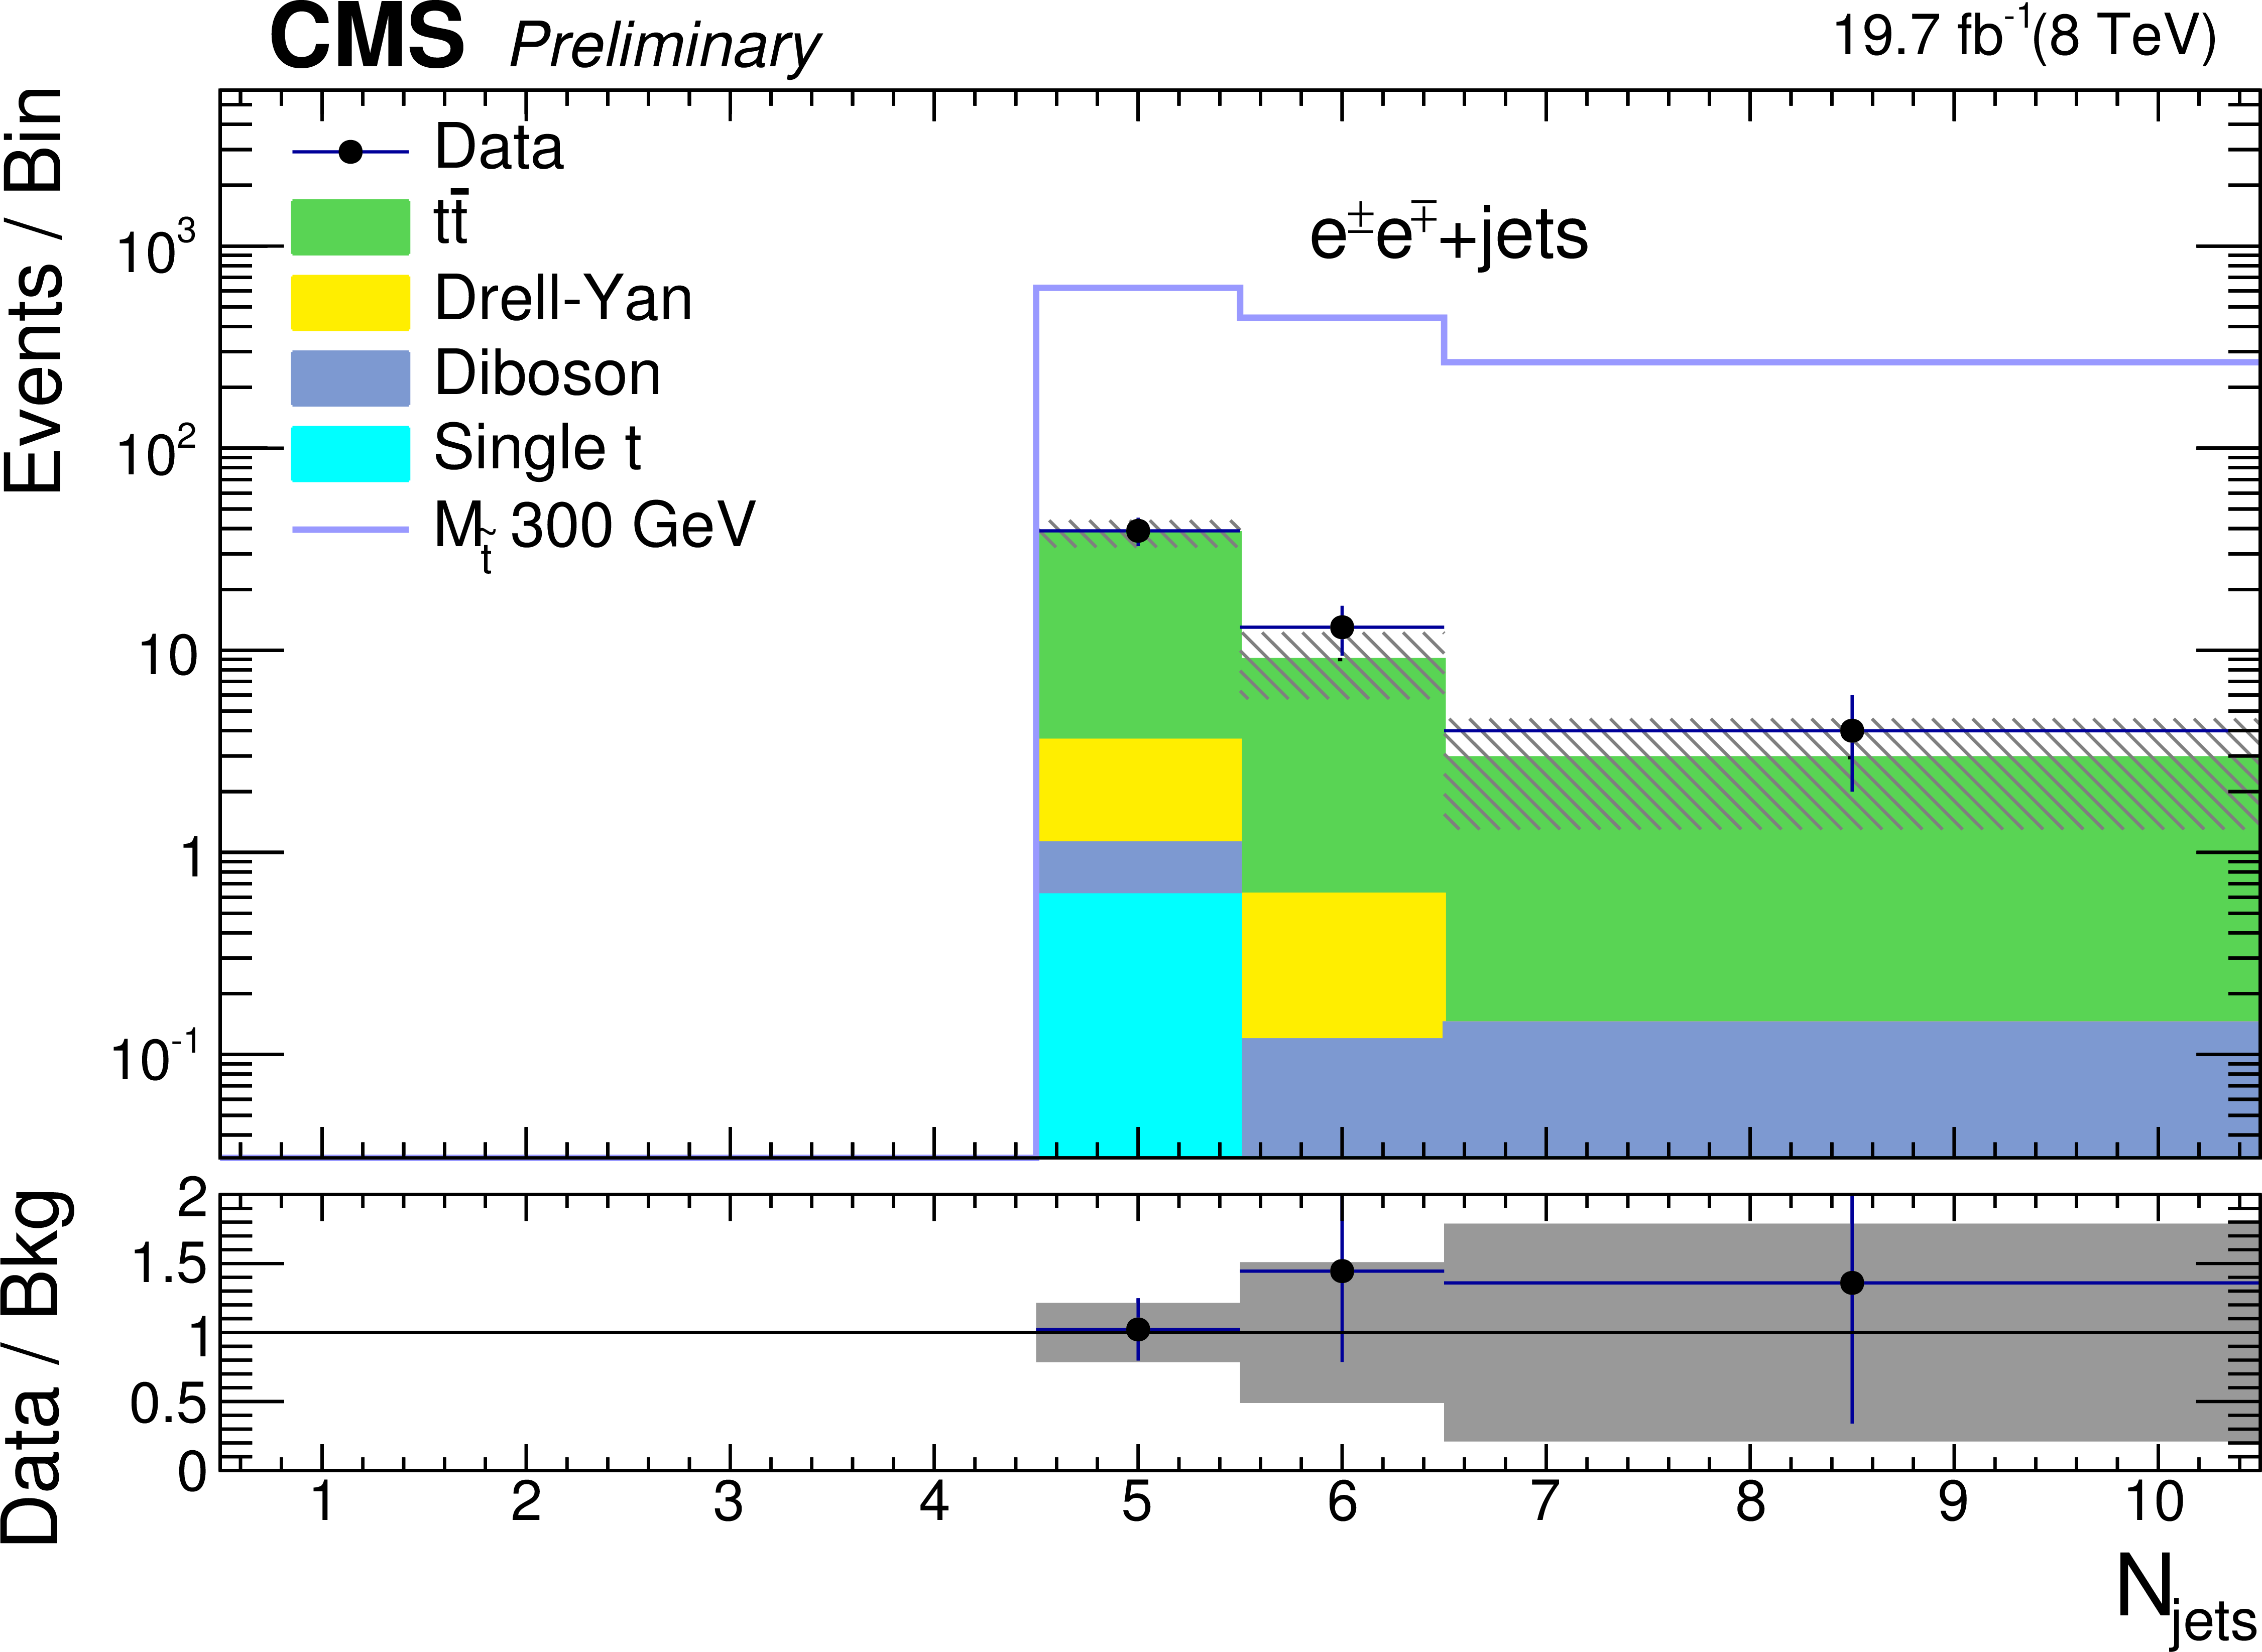
Figure 2-a:
Jet multiplicity distribution for $ {\mu ^{\pm }\mu ^{\mp } } $ (a) and $ {\mathrm {e}^{\pm }\mathrm {e}^{\mp } }$ (b) after $ {S_{\mathrm {T}}^{\mathrm {min}}} $ selection optimized for a $ {M_{\tilde{{\textrm t}}}} $ hypothesis of 300 and 900 GeV. The new physics signal shown by a blue line is superimposed with the expected SM background. The statistical and systematic uncertainties for the SM contributions are shown with the hatched band at the upper plot and with the grey band on the ratio plot below. |
png ; pdf |
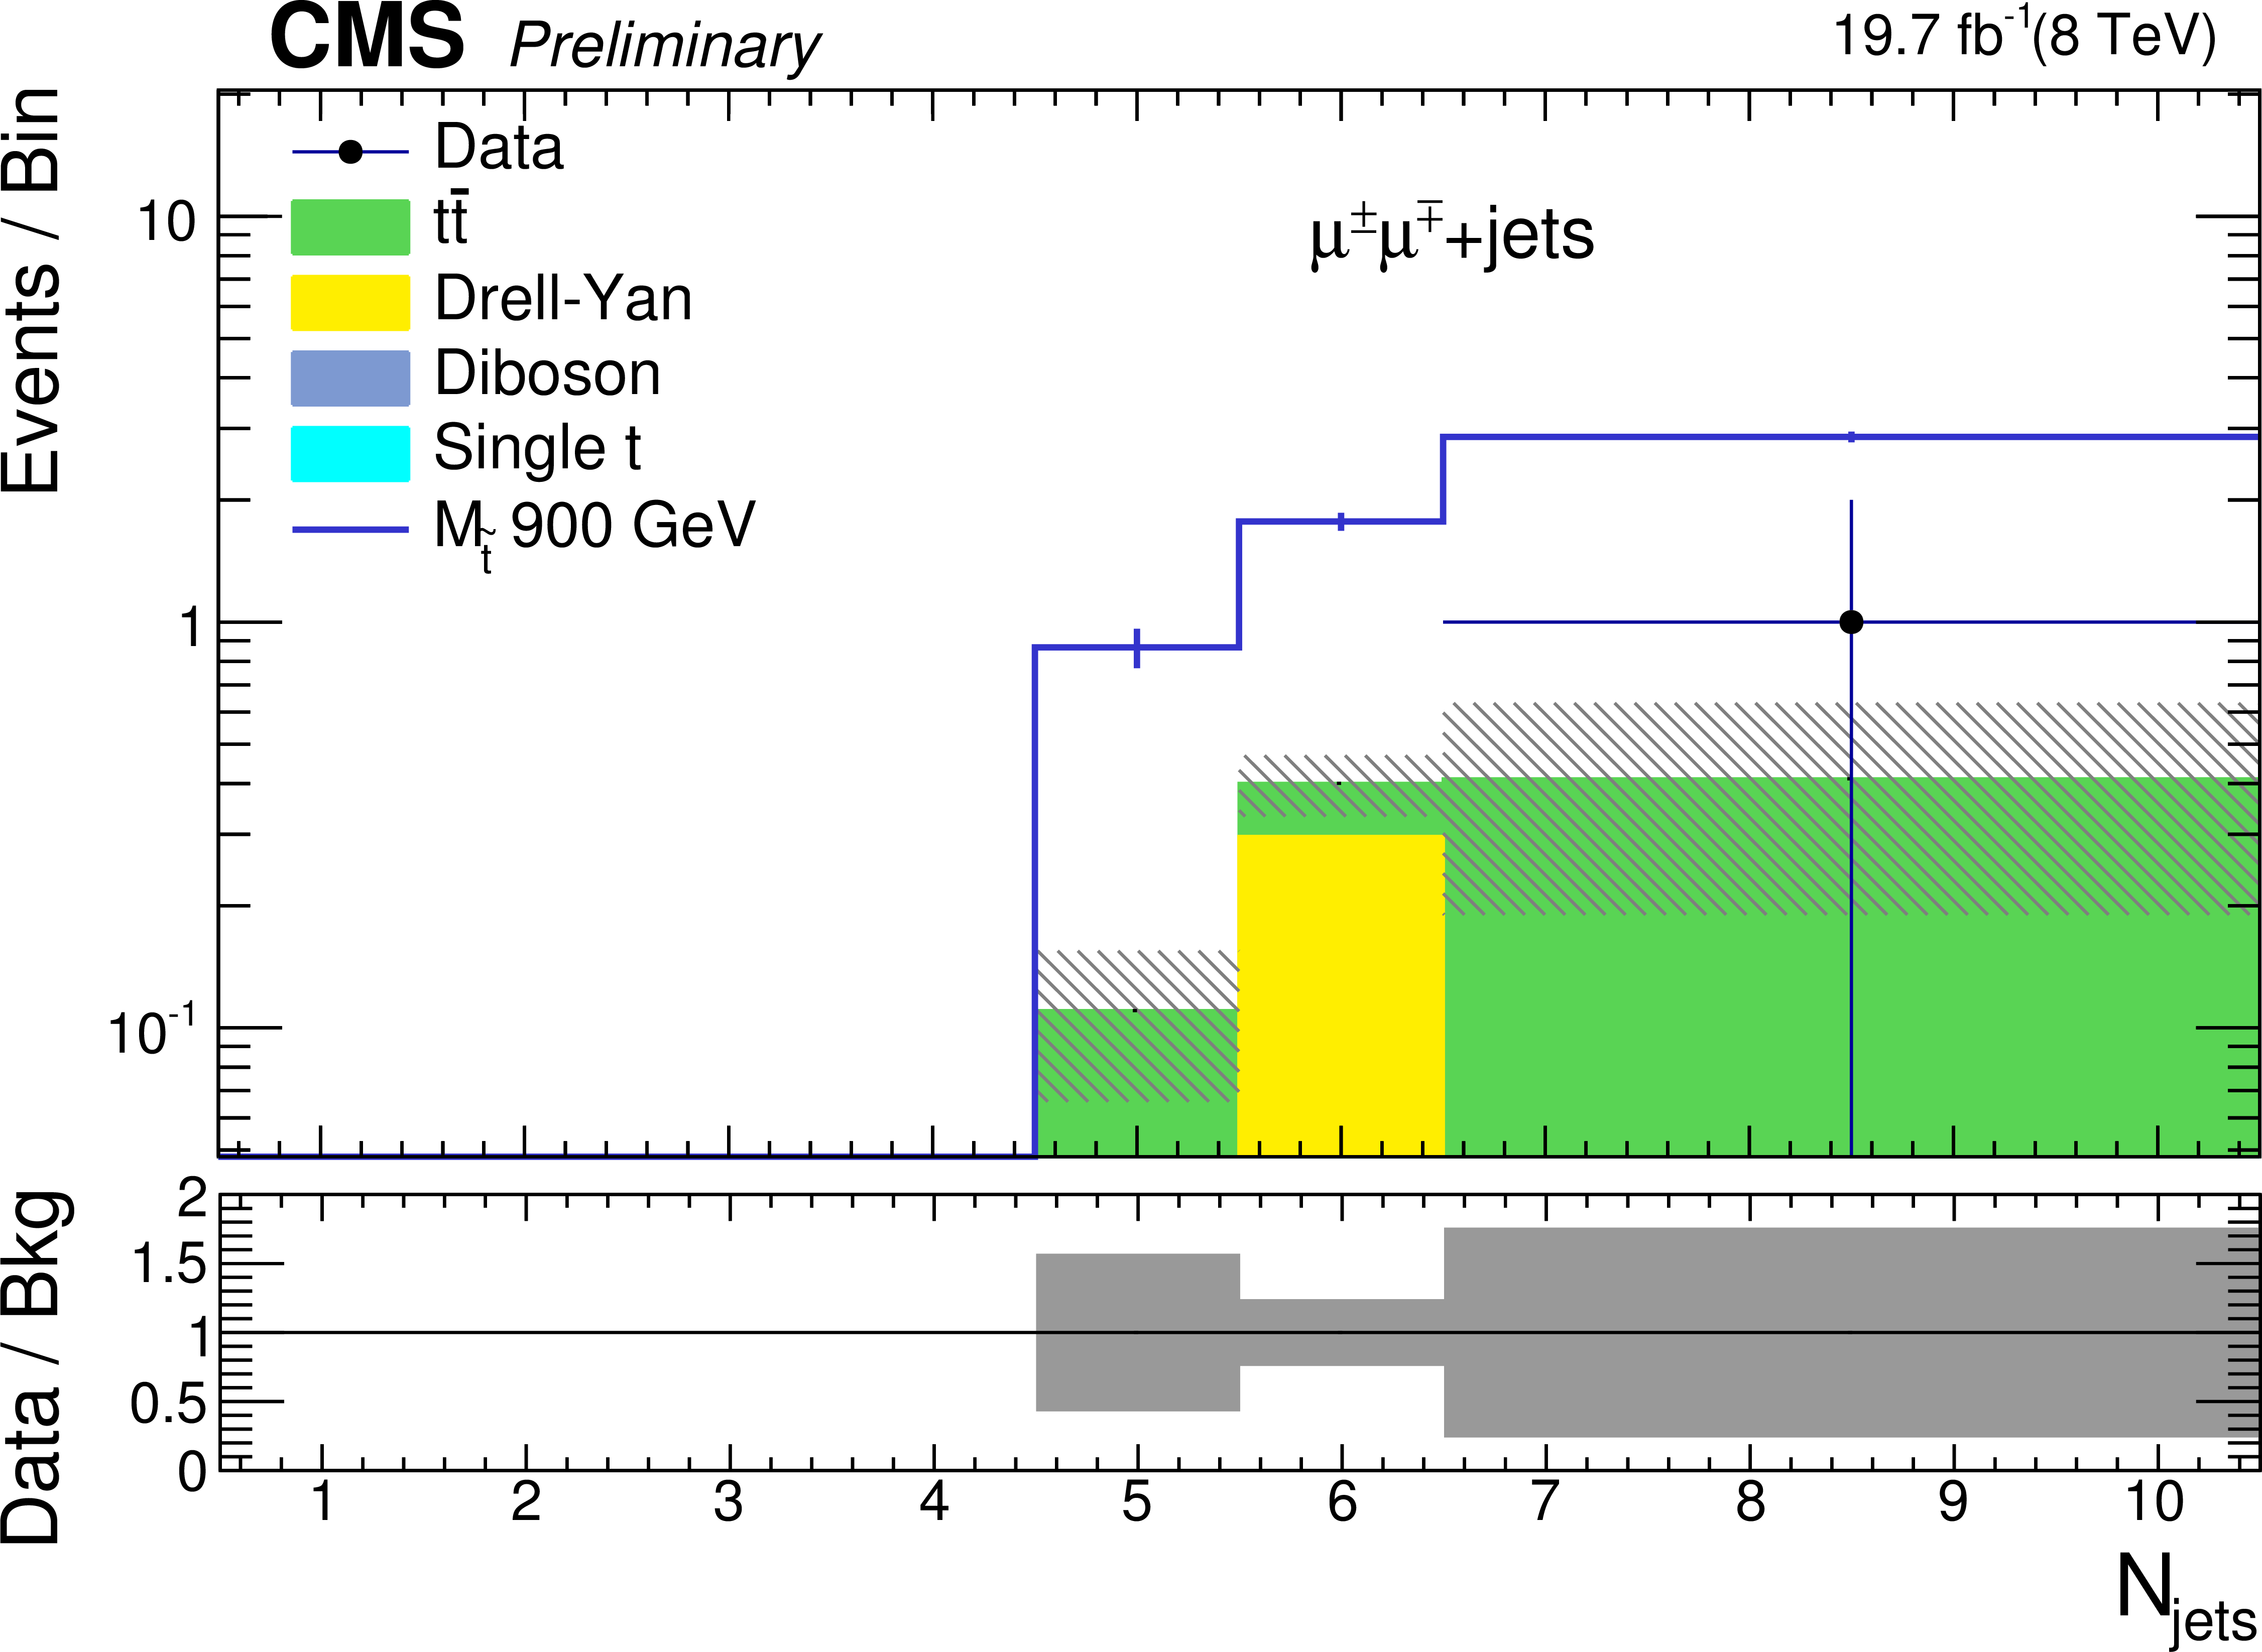
Figure 2-b:
Jet multiplicity distribution for $ {\mu ^{\pm }\mu ^{\mp } } $ (a) and $ {\mathrm {e}^{\pm }\mathrm {e}^{\mp } }$ (b) after $ {S_{\mathrm {T}}^{\mathrm {min}}} $ selection optimized for a $ {M_{\tilde{{\textrm t}}}} $ hypothesis of 300 and 900 GeV. The new physics signal shown by a blue line is superimposed with the expected SM background. The statistical and systematic uncertainties for the SM contributions are shown with the hatched band at the upper plot and with the grey band on the ratio plot below. |
png ; pdf |
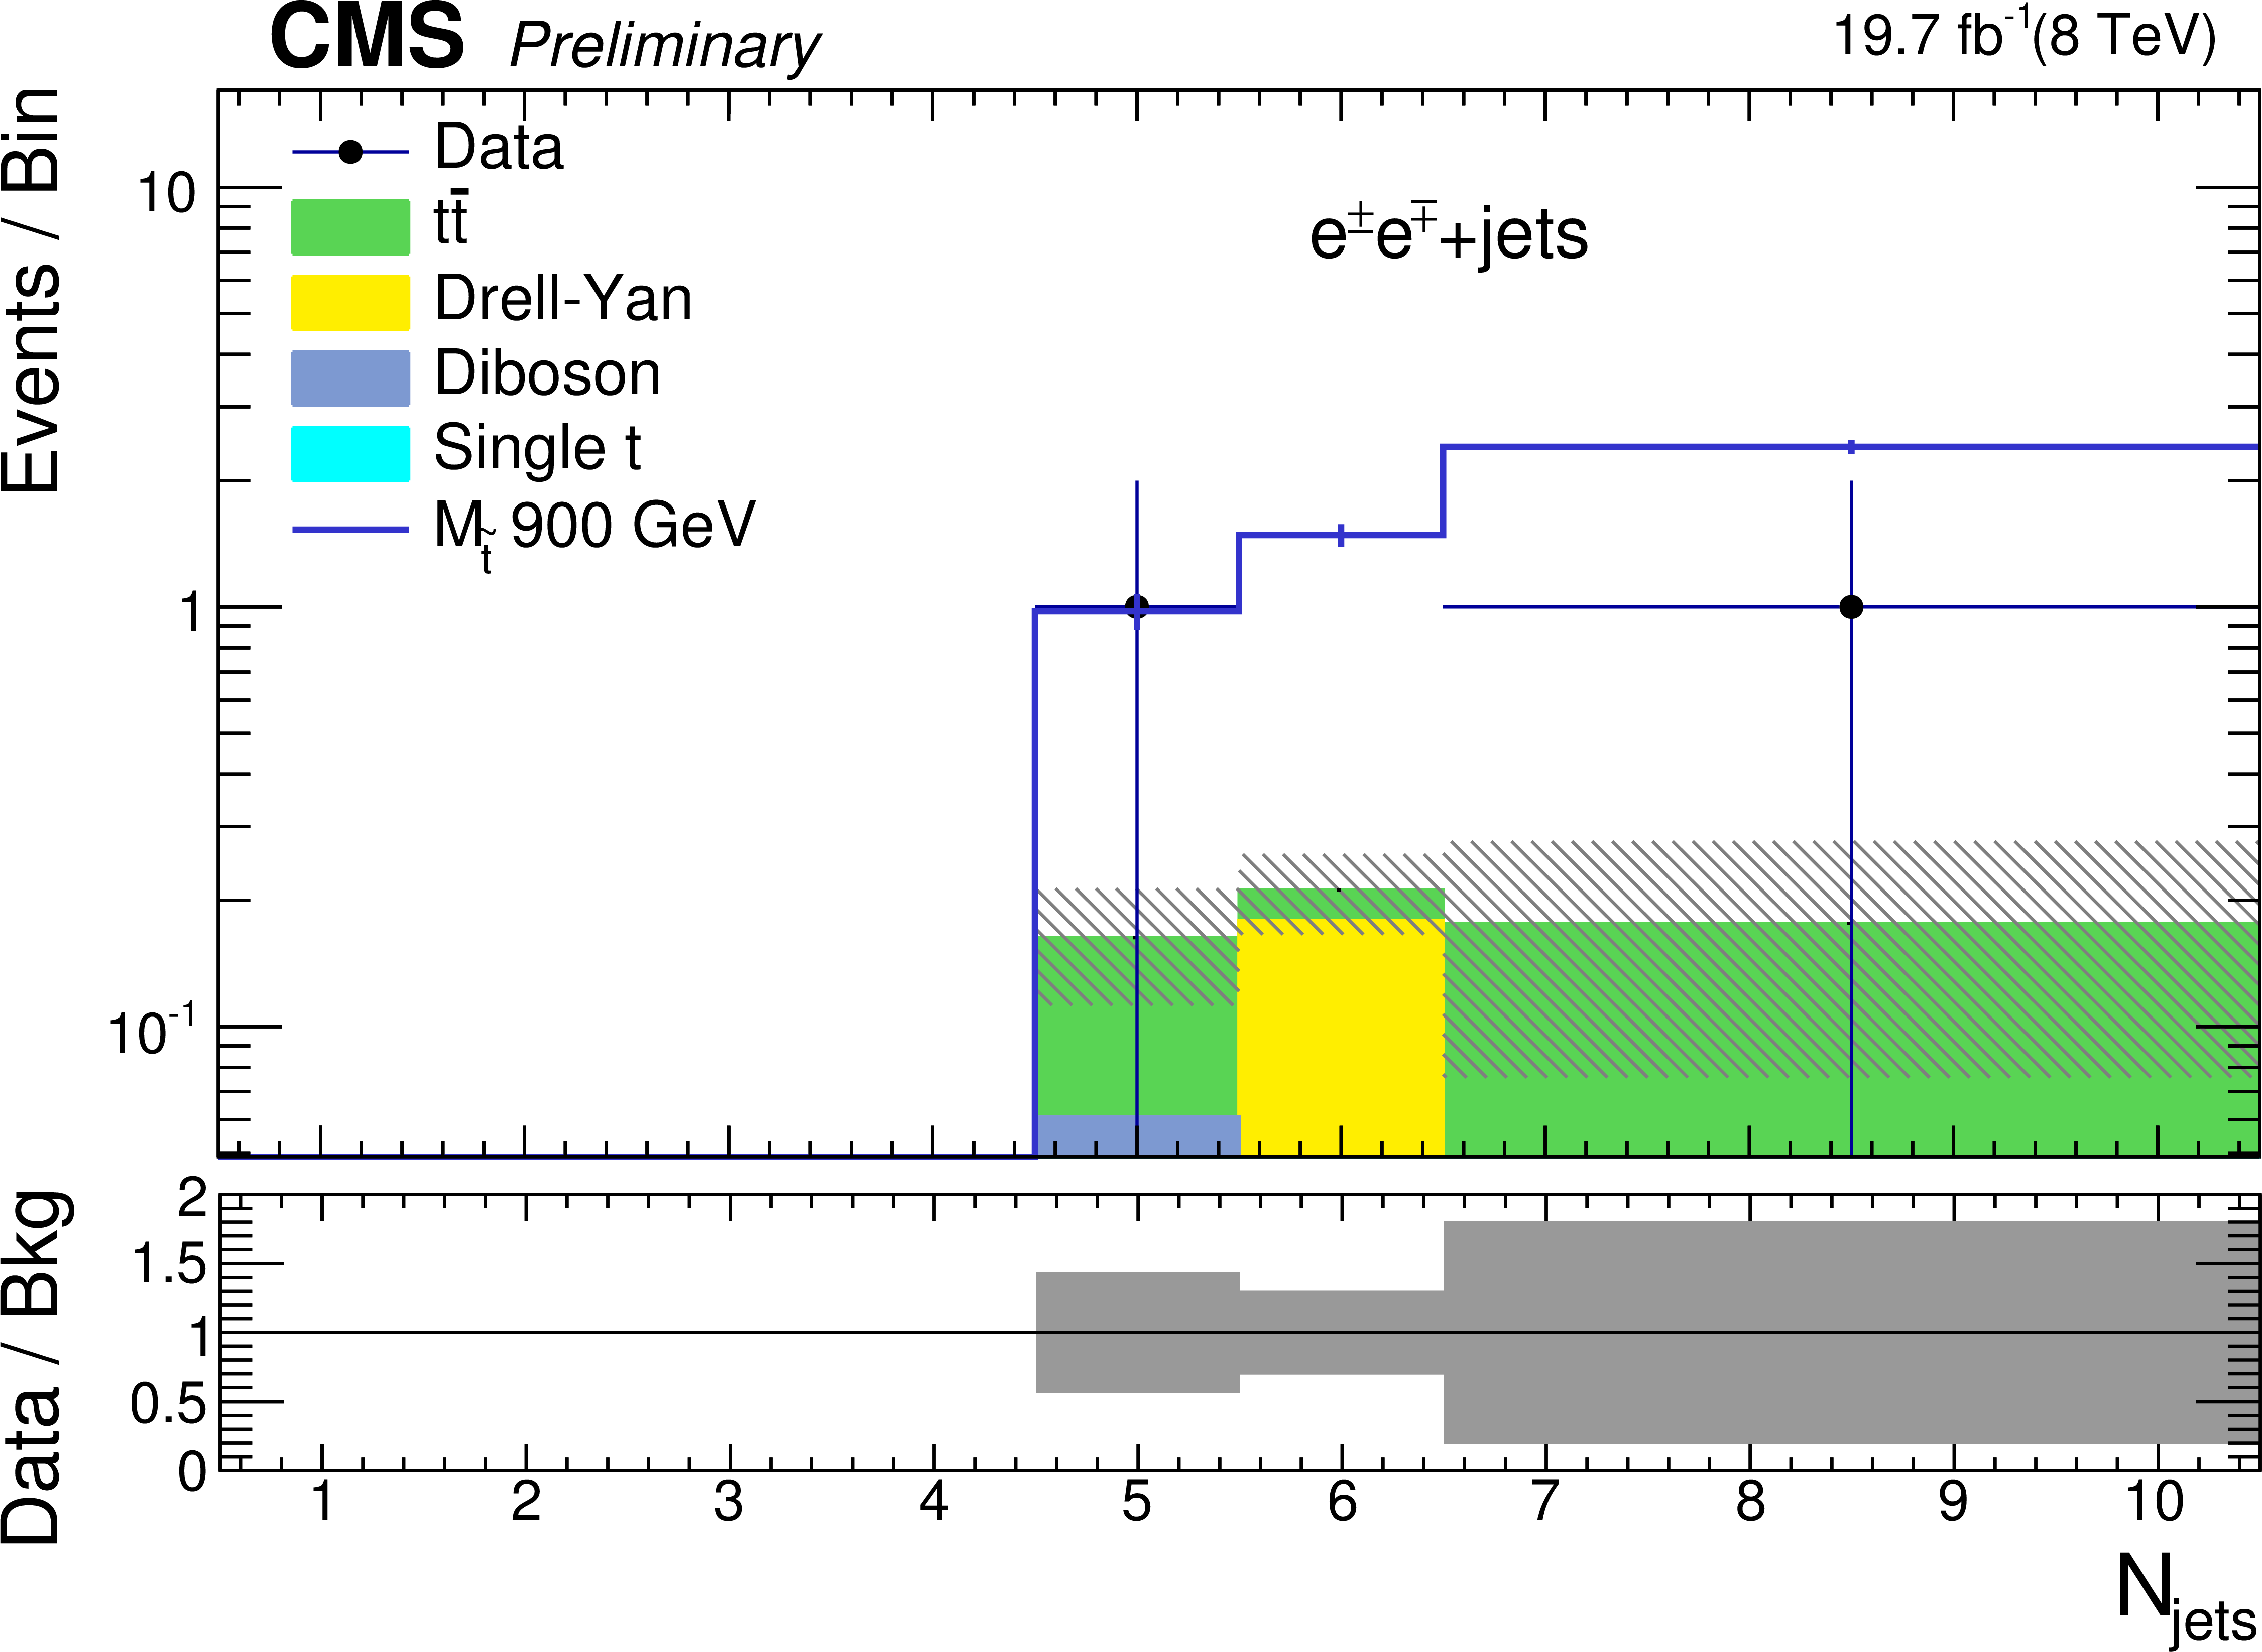
Figure 2-c:
Jet multiplicity distribution for $ {\mu ^{\pm }\mu ^{\mp } } $ (a) and $ {\mathrm {e}^{\pm }\mathrm {e}^{\mp } }$ (b) after $ {S_{\mathrm {T}}^{\mathrm {min}}} $ selection optimized for a $ {M_{\tilde{{\textrm t}}}} $ hypothesis of 300 and 900 GeV. The new physics signal shown by a blue line is superimposed with the expected SM background. The statistical and systematic uncertainties for the SM contributions are shown with the hatched band at the upper plot and with the grey band on the ratio plot below. |
png ; pdf |
Figure 2-d:
Jet multiplicity distribution for $ {\mu ^{\pm }\mu ^{\mp } } $ (a) and $ {\mathrm {e}^{\pm }\mathrm {e}^{\mp } }$ (b) after $ {S_{\mathrm {T}}^{\mathrm {min}}} $ selection optimized for a $ {M_{\tilde{{\textrm t}}}} $ hypothesis of 300 and 900 GeV. The new physics signal shown by a blue line is superimposed with the expected SM background. The statistical and systematic uncertainties for the SM contributions are shown with the hatched band at the upper plot and with the grey band on the ratio plot below. |
png ; pdf |
Figure 3-a:
Observed and median expected cross section limits for $ {\mu ^{\pm }\mu ^{\mp } }$ (a) and ${\mathrm {e}^{\pm }\mathrm {e}^{\mp } }$ (b). The bands denoted 1$\sigma $ and 2$\sigma $ correspond to the change in the expected limit as the uncertainties are varied by 1-2 $\sigma $. The theory cross section line shows the expected top squark cross section computed at NLO+NLL. |
png ; pdf |
Figure 3-b:
Observed and median expected cross section limits for $ {\mu ^{\pm }\mu ^{\mp } }$ (a) and ${\mathrm {e}^{\pm }\mathrm {e}^{\mp } }$ (b). The bands denoted 1$\sigma $ and 2$\sigma $ correspond to the change in the expected limit as the uncertainties are varied by 1-2 $\sigma $. The theory cross section line shows the expected top squark cross section computed at NLO+NLL. |
|
|
Compact Muon Solenoid LHC, CERN |
|

|

|

|

|

|