

Compact Muon Solenoid
LHC, CERN
| CMS-PAS-EXO-14-006 | ||
| Search for leptophobic Z' decaying into four leptons in the final state at $\sqrt{s} =$ 8 TeV | ||
| CMS Collaboration | ||
| March 2016 | ||
| Abstract: A search for heavy narrow resonances decaying into four-lepton final states in events that contain no identified $ \mathrm{Z} \to \ell^+ \ell^- $ decays has been performed with an integrated luminosity of 19.7 fb$^{-1}$ of proton-proton collision data at $\sqrt{s} =$ 8 TeV collected by the CMS experiment. No excess of events over the standard model expectation is observed. Upper limits for a model-independent scenario and comparison with the predictions of a benchmark model on the fiducial cross section times branching fraction for the production of these heavy narrow resonances are presented. | ||
|
Links:
CDS record (PDF) ;
CADI line (restricted) ;
These preliminary results are superseded in this paper, PLB 773 (2017) 563. The superseded preliminary plots can be found here. |
||
| Figures | |

png |
Figure 1:
Four-lepton Z' resonance diagram at a hadron collider. |
png pdf |
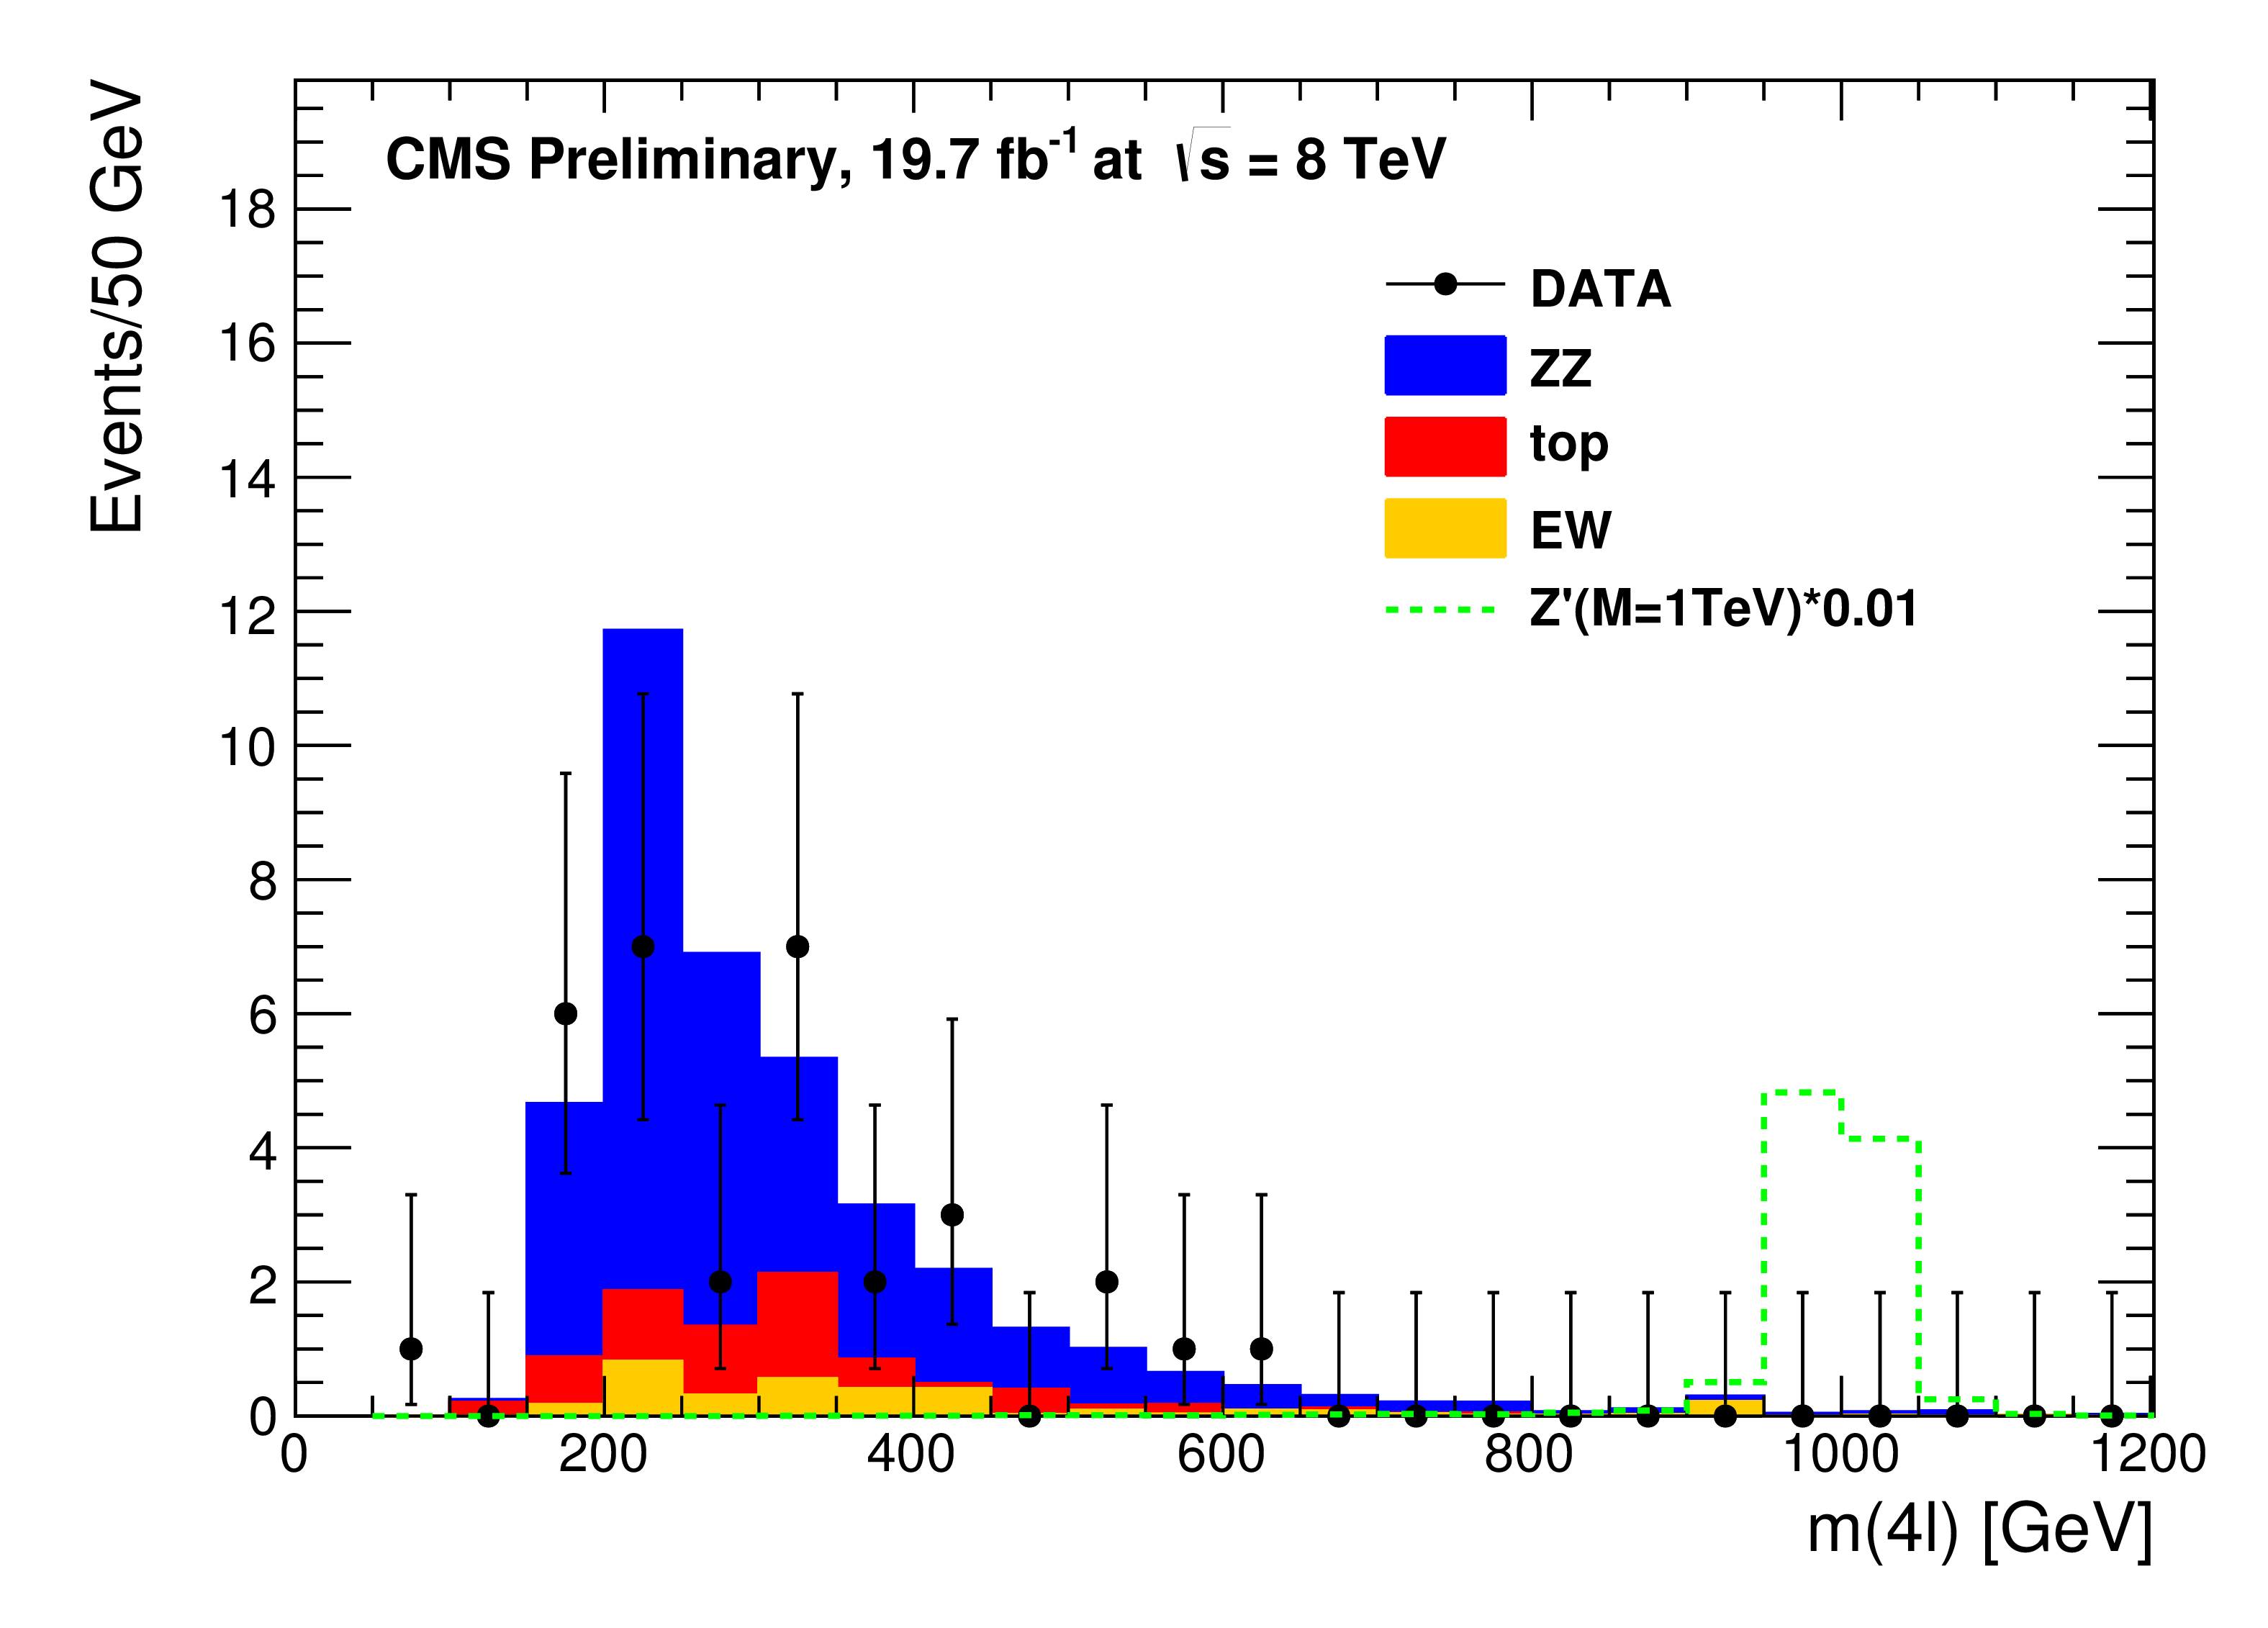
Figure 2:
The four-lepton invariant mass spectrum for the combination of the five studied channels. The points with error bars represent the data; the histograms represent the expectations from SM processes. ``top'' denotes the sum of the events for $ \mathrm{ t \bar{t} } $, tW, ${\mathrm { \bar{t} W }}$, ${\mathrm { t \bar{t} Z }}$ and ``EW'' denotes the sum of the events from WW, WZ, WW$\gamma $, WWZ, WZZ and ZZZ. Dashed (green) histogram shows the expectation from the benchmark signal model at $M =$ 1 TeV with $M(\Phi _{\ell\ell}) =$ 50 GeV scaled down by a factor 100. |
png pdf |
Figure 3-a:
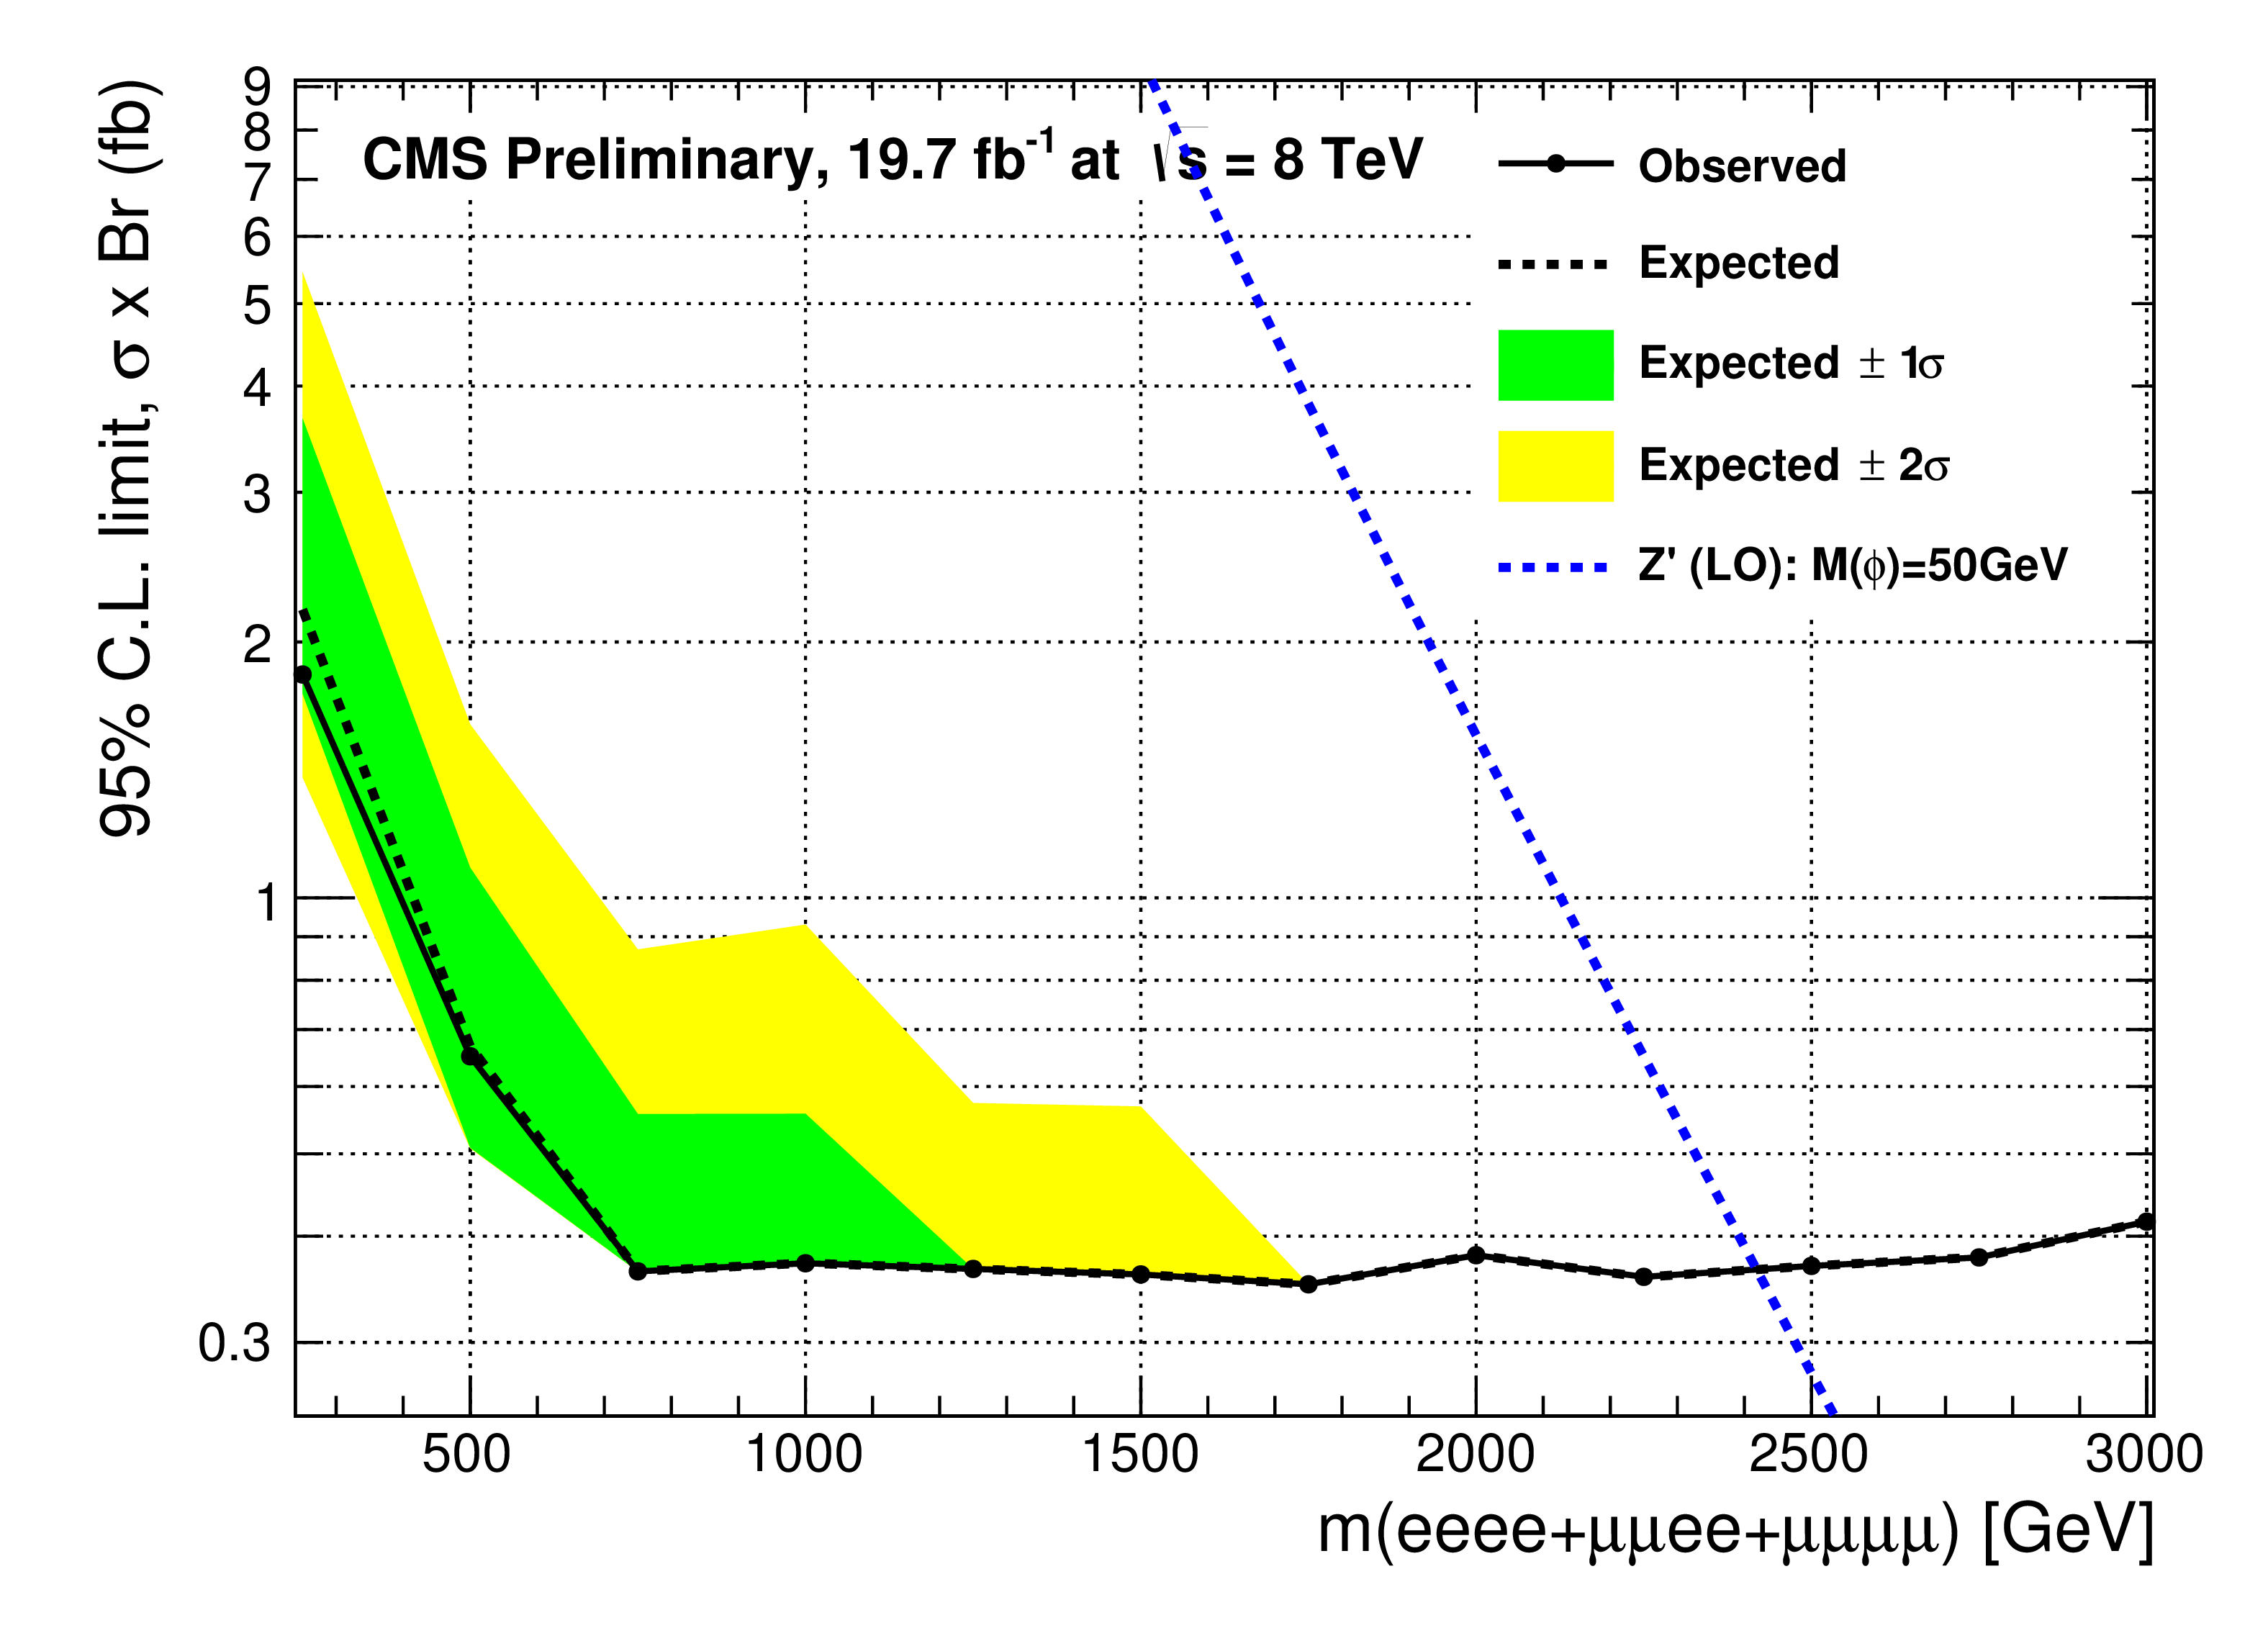
The 95% C.L. upper limit on the cross section times branching fraction as a function of the four lepton invariant mass for the combination of the LFC conserved channels (top left), the LFV channels (top right), and all five studied channels (bottom). Shaded green (yellow) band indicates the one and two sigma uncertainty bands on the expected limits. The blue dotted line represents the theoretical predictions for $M(\Phi _{\ell\ell}) =$ 50 GeV. |
png pdf |
Figure 3-b:
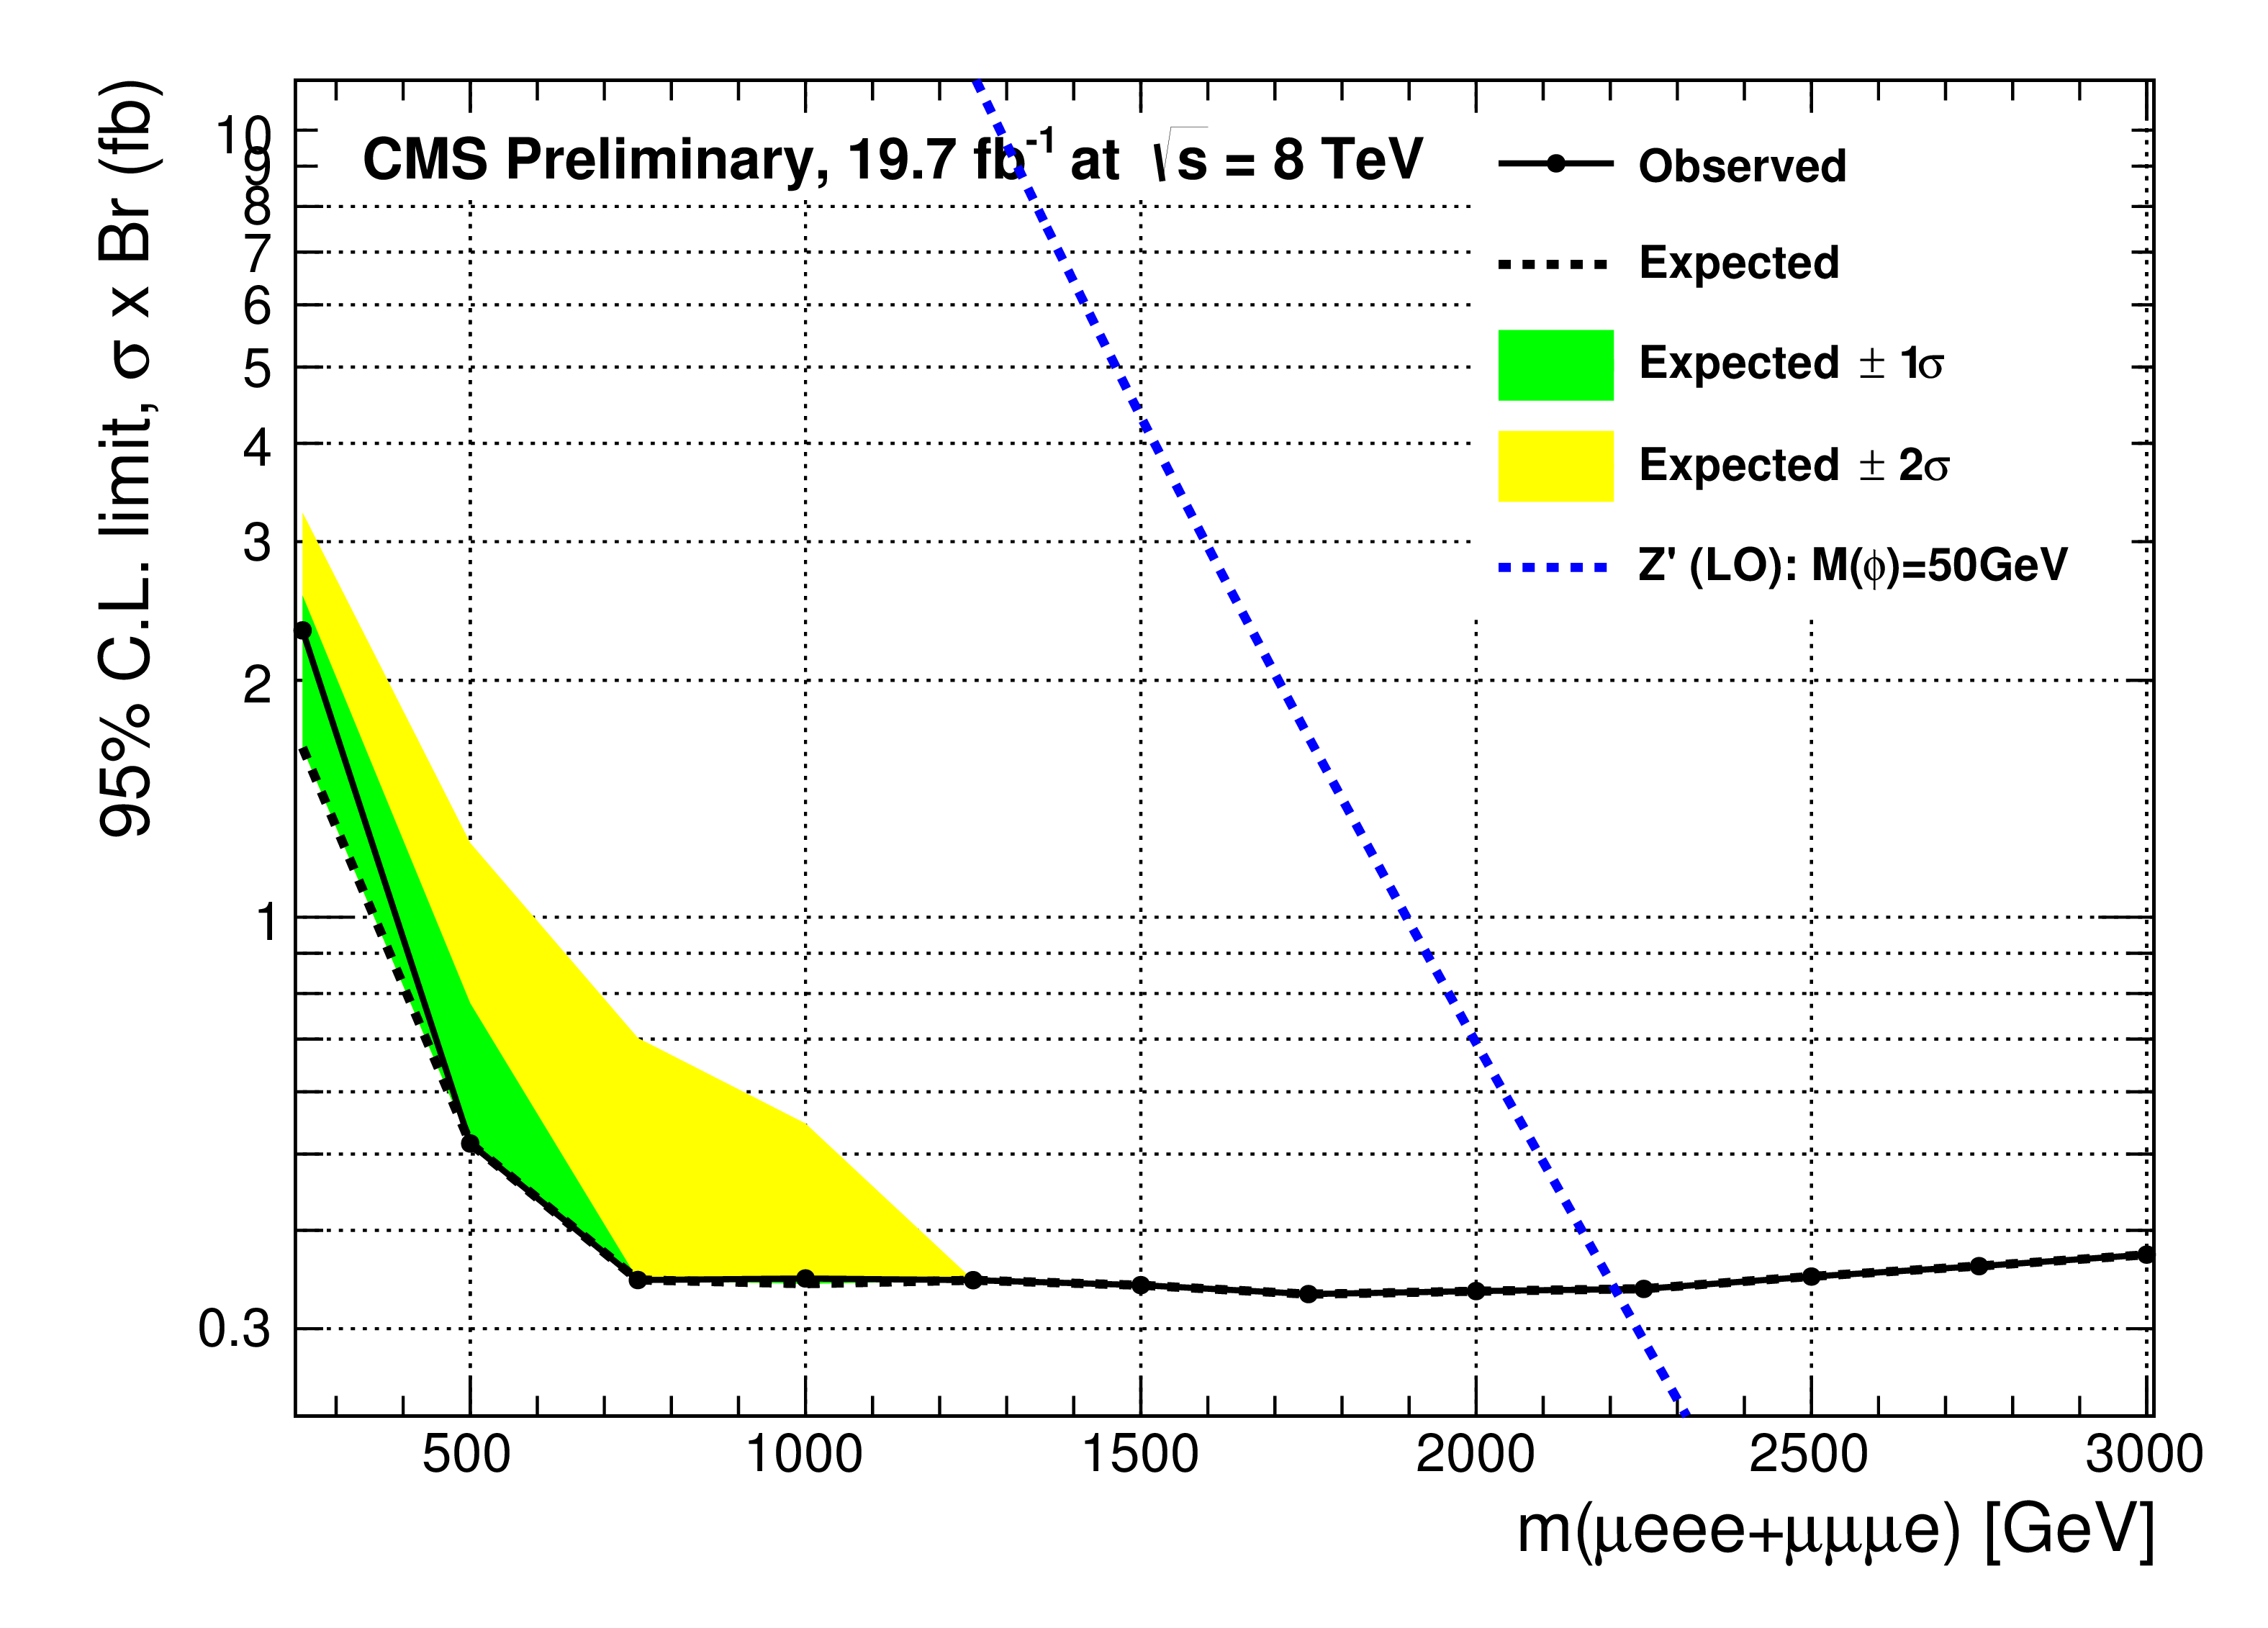
The 95% C.L. upper limit on the cross section times branching fraction as a function of the four lepton invariant mass for the combination of the LFC conserved channels (top left), the LFV channels (top right), and all five studied channels (bottom). Shaded green (yellow) band indicates the one and two sigma uncertainty bands on the expected limits. The blue dotted line represents the theoretical predictions for $M(\Phi _{\ell\ell}) =$ 50 GeV. |
png pdf |
Figure 3-c:
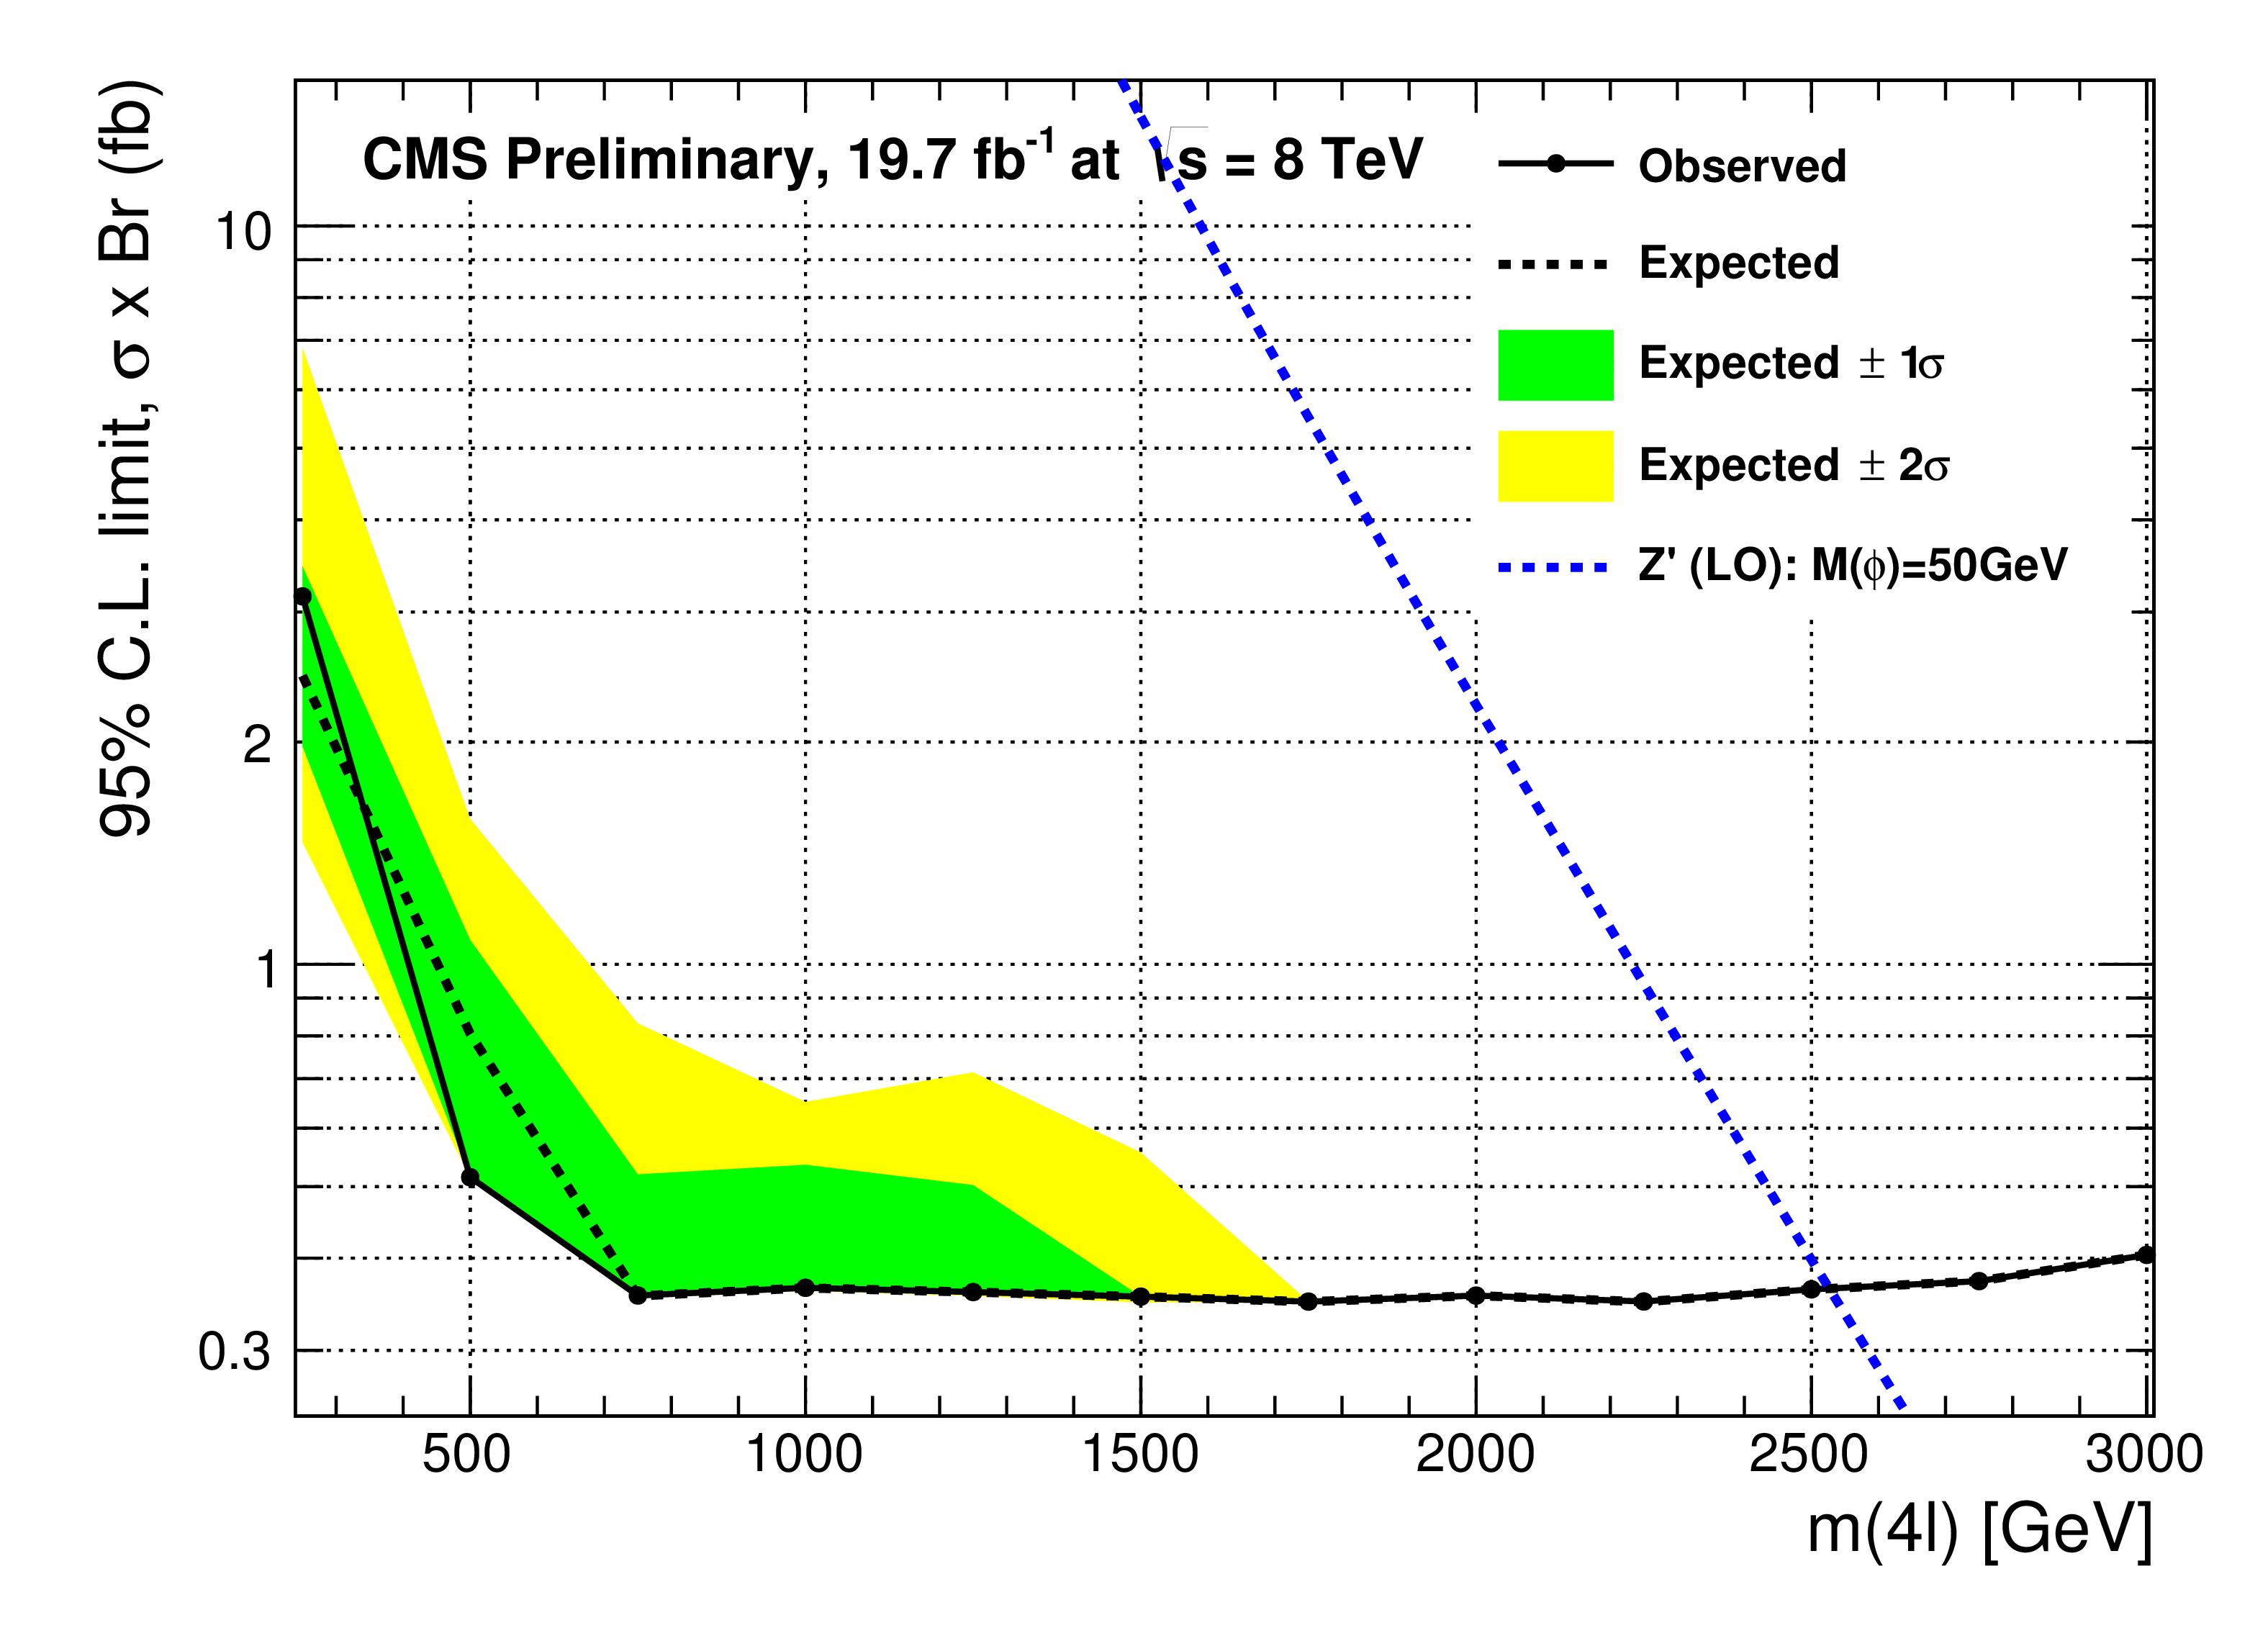
The 95% C.L. upper limit on the cross section times branching fraction as a function of the four lepton invariant mass for the combination of the LFC conserved channels (top left), the LFV channels (top right), and all five studied channels (bottom). Shaded green (yellow) band indicates the one and two sigma uncertainty bands on the expected limits. The blue dotted line represents the theoretical predictions for $M(\Phi _{\ell\ell}) =$ 50 GeV. |
| Tables | |

png pdf |
Table 1:
Summary of observed yield and expected backgrounds for all channels, where $\mathrm {N_{obs} }$ is the number of observed events in the data. The total backgrounds ($\mathrm {N_{tot}}$) are sum of three different backgrounds estimated using MC simulation: $\mathrm {N_{ZZ}}$ is ZZ background, $\mathrm {N_{top}}$ is backgrounds from $ \mathrm{ t \bar{t} } $, single top and $\mathrm{ t \bar{t} Z } $, and $\mathrm {N_{EW}}$ is backgrounds from WW and WZ and triple gauge coupling processes. Errors are statistical uncertainty only. |
png pdf |
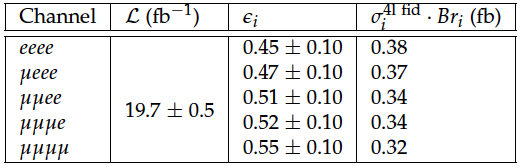
Table 2:
Limits at 95% C.L. on the product of cross section and branching fraction for the five studied channels. $\mathcal {L}$ is the integrated luminosity, $\epsilon _i$ is the selection efficiency for each channel (obtained using $ M(\mathrm{Z^\prime }) =$ 3 TeV benchmark signal MC samples), $i = \mathrm{eeee}, \mathrm{\mu eee}, \mathrm{\mu \mu ee}, \mathrm{\mu \mu \mu e}, {\mu \mu \mu \mu }$, $\sigma ^{\mathrm {4\ell fid}}$ is the cross section in the fiducial region, an $Br$ is the branching fraction. |

png pdf |
Table 3:
The 95% C.L. limit calculation in the $M(\Phi _{\ell\ell})$ vs $M(4\ell)$ plane for each channel and for the combination of all channels. It is evaluated using the benchmark signal MC samples with six different scenarios $(M(\Phi _{\ell\ell}) =$ 50 GeV and 5%, 10%, 20%, 30%, and 40% of $M(\mathrm{Z^\prime }))$. |
|
|
Compact Muon Solenoid LHC, CERN |
|

|

|

|

|

|