

Compact Muon Solenoid
LHC, CERN
| CMS-PAS-B2G-15-008 | ||
| Search for single production of a vector-like T quark decaying to a Higgs boson and a leptonically decaying top quark | ||
| CMS Collaboration | ||
| April 2016 | ||
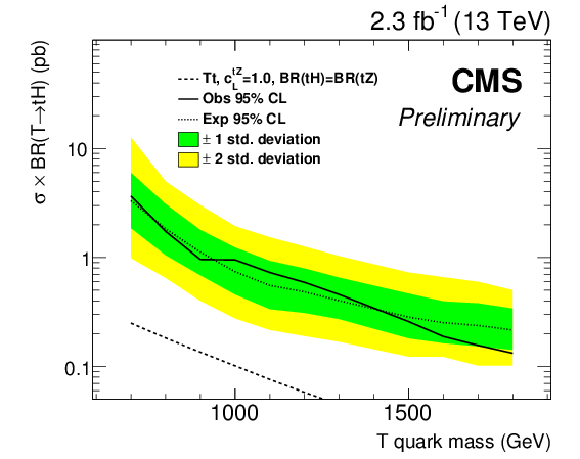
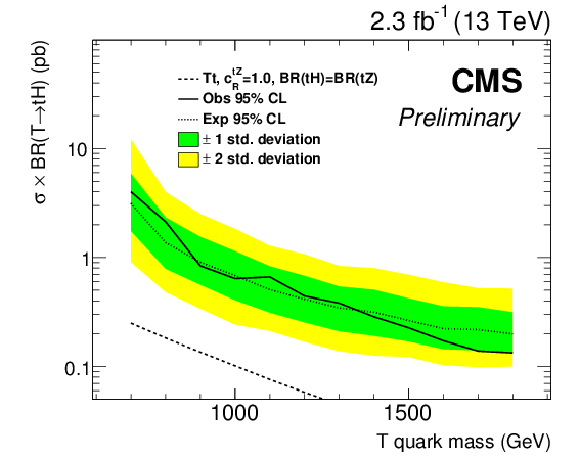
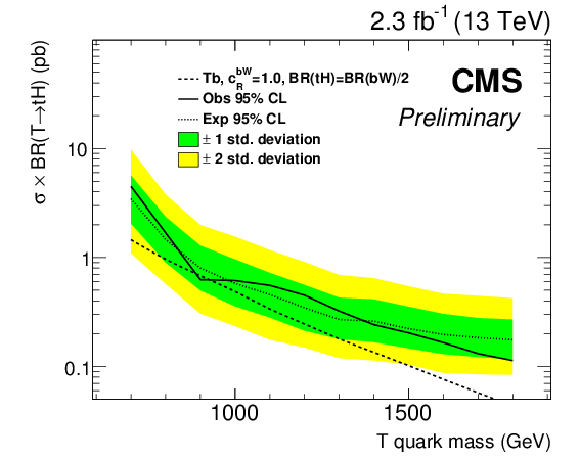
| Abstract: We search for singly produced vector-like top quark partners (T) in pp collisions at a center-of-mass energy of 13 TeV with the CMS experiment at the LHC. This is of particular interest, as the rate of single production of TeV-scale vector-like quarks increases faster than the rate of pair production with increasing centre-of-mass energy. The decay of a vector-like T quark into a Higgs boson and a top quark is searched for. The top quark decay includes an electron or a muon and the Higgs boson decays into a pair of b quarks. No significant excess over standard model backgrounds is observed. Exclusion limits on the production cross section times branching fraction, as well as exclusion limits on T quark coupling parameters are derived in the mass-range of 700 GeV to 1800 GeV. For a mass of 1000 GeV, we exclude production cross section times branching fractions above 0.9 pb and 0.6 pb at 95% confidence level, assuming left and right handed coupling of the T quark to standard model particles, respectively. | ||
|
Links:
CDS record (PDF) ;
CADI line (restricted) ;
These preliminary results are superseded in this paper, PLB 771 (2017) 80. The superseded preliminary plots can be found here. |
||
| Figures | |

png pdf |
Figure 1:
Production and decay mechanisms of a vector-like top quark partner, as targeted in this analysis. |
png pdf |
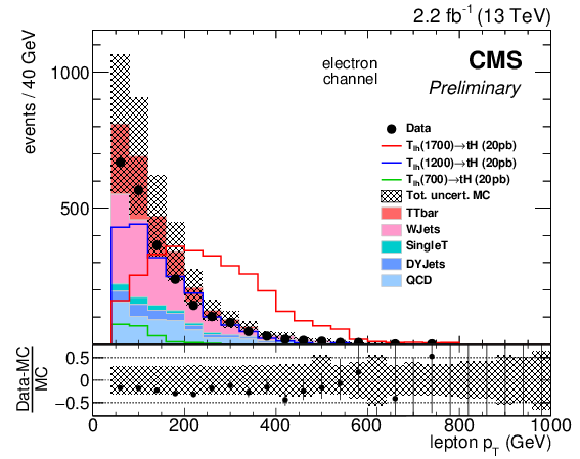
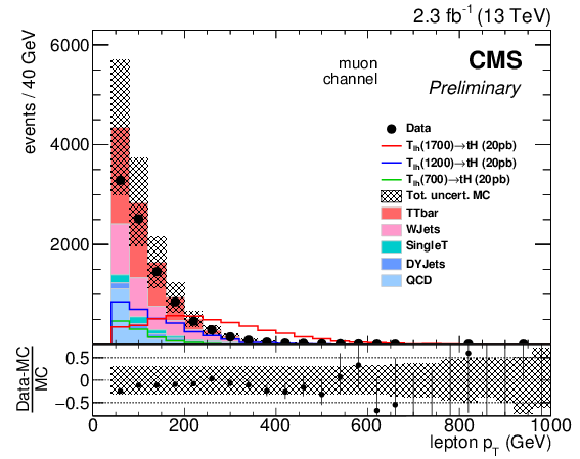
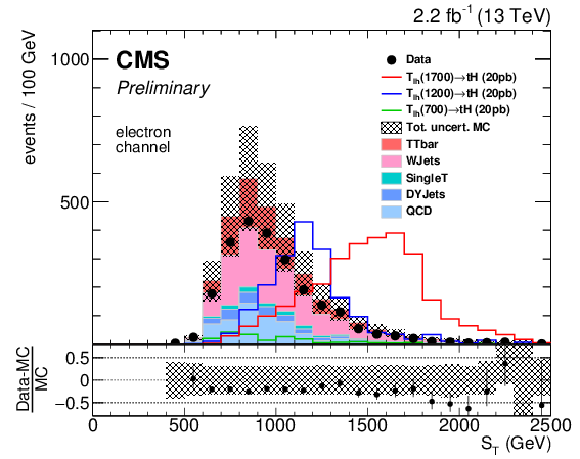
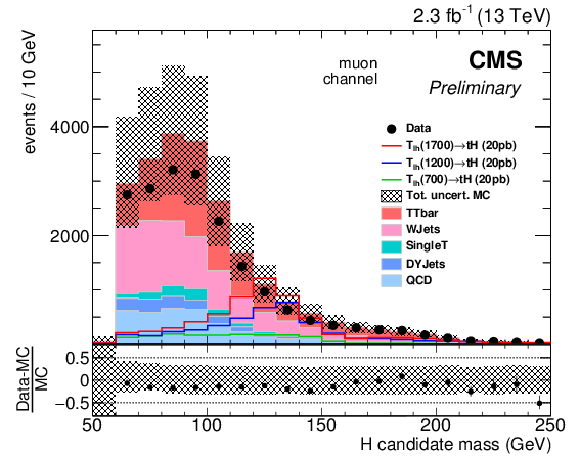
Figure 2-a:
Distributions of physics object quantities after the `baseline' event selection (see Sec. 5). Electron and muon $ {p_{\mathrm {T}}} $ distributions are depicted in the (a) and (b) graphs. The (c) graph shows $S_{\rm T}$ in the electron channel and the soft-drop mass of the Higgs boson candidate in the muon channel is depicted in the (d) graph. |
png pdf |
Figure 2-b:
Distributions of physics object quantities after the `baseline' event selection (see Sec. 5). Electron and muon $ {p_{\mathrm {T}}} $ distributions are depicted in the (a) and (b) graphs. The (c) graph shows $S_{\rm T}$ in the electron channel and the soft-drop mass of the Higgs boson candidate in the muon channel is depicted in the (d) graph. |
png pdf |
Figure 2-c:
Distributions of physics object quantities after the `baseline' event selection (see Sec. 5). Electron and muon $ {p_{\mathrm {T}}} $ distributions are depicted in the (a) and (b) graphs. The (c) graph shows $S_{\rm T}$ in the electron channel and the soft-drop mass of the Higgs boson candidate in the muon channel is depicted in the (d) graph. |
png pdf |
Figure 2-d:
Distributions of physics object quantities after the `baseline' event selection (see Sec. 5). Electron and muon $ {p_{\mathrm {T}}} $ distributions are depicted in the (a) and (b) graphs. The (c) graph shows $S_{\rm T}$ in the electron channel and the soft-drop mass of the Higgs boson candidate in the muon channel is depicted in the (d) graph. |
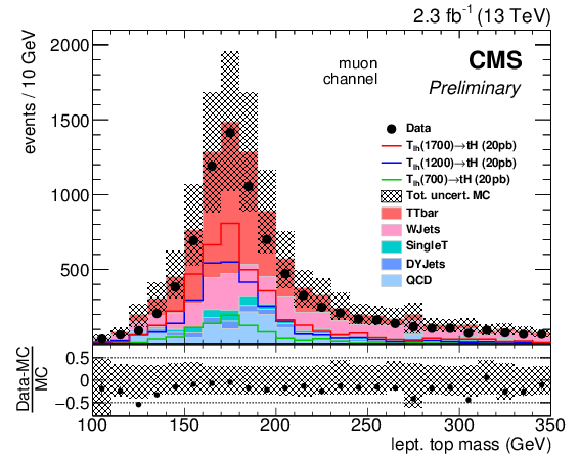
png pdf |
Figure 3-a:
Mass and $ {p_{\mathrm {T}}} $ distributions of the reconstructed top quark candidate in the muon channel on the (a) and (b) graph, respectively. The `baseline' event selection is applied. |
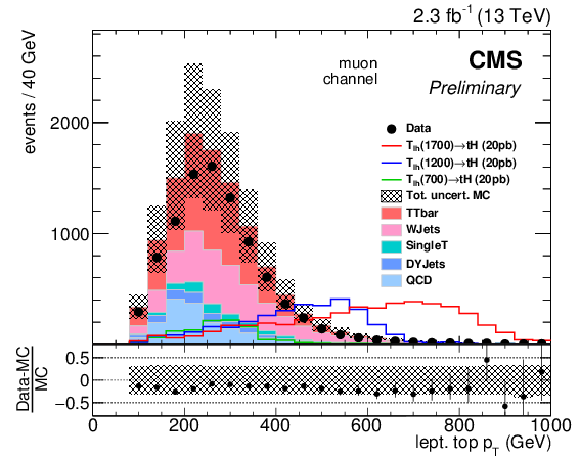
png pdf |
Figure 3-b:
Mass and $ {p_{\mathrm {T}}} $ distributions of the reconstructed top quark candidate in the muon channel on the (a) and (b) graph, respectively. The `baseline' event selection is applied. |
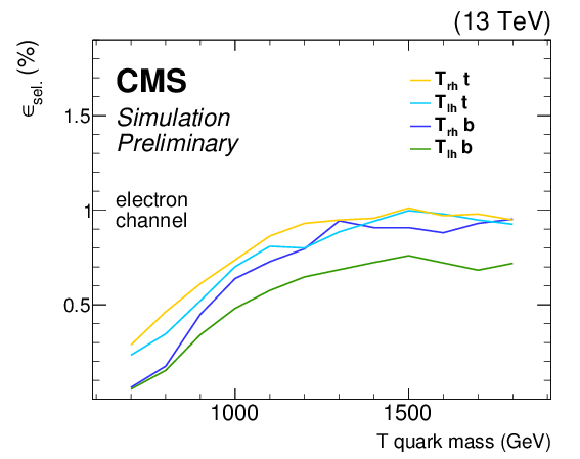
png pdf |
Figure 4-a:
Selection efficiency for the signal samples. The denominator of the efficiency includes all decay modes of the top quark and the Higgs boson. On the (a) graph, the electron channel is depicted, the muon channel is shown on the (b) graph. Left (right) handed coupling of the T quark to standard model particles is denoted by a lh (rh) subscript. |
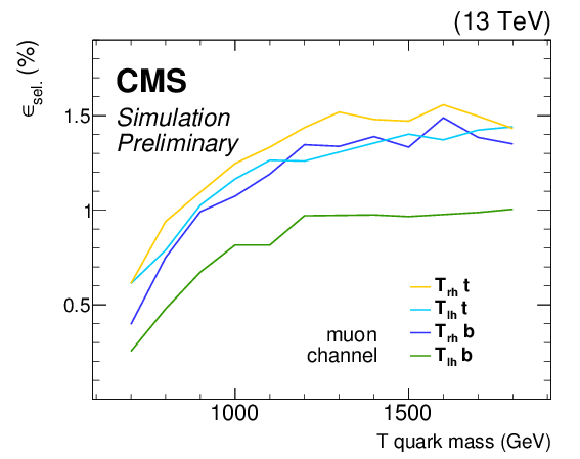
png pdf |
Figure 4-b:
Selection efficiency for the signal samples. The denominator of the efficiency includes all decay modes of the top quark and the Higgs boson. On the (a) graph, the electron channel is depicted, the muon channel is shown on the (b) graph. Left (right) handed coupling of the T quark to standard model particles is denoted by a lh (rh) subscript. |
png pdf |
Figure 5-a:
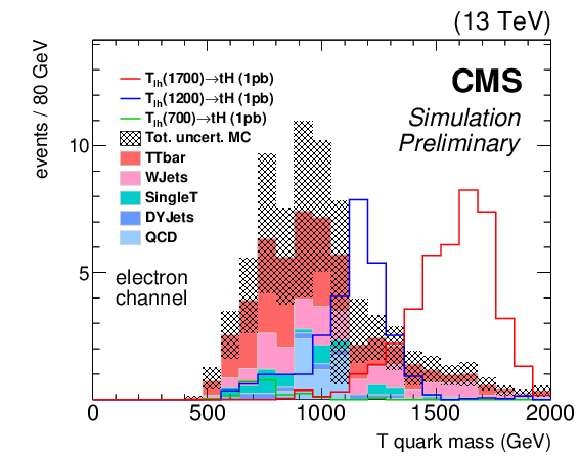
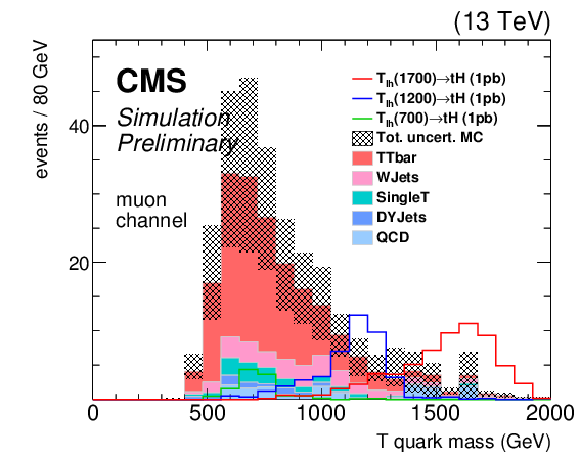
Vector-like T quark mass in the signal region. The electron channel is depicted on the (a) graph and the muon channel on the (b) graph. |
png pdf |
Figure 5-b:
Vector-like T quark mass in the signal region. The electron channel is depicted on the (a) graph and the muon channel on the (b) graph. |
png pdf |
Figure 6-a:
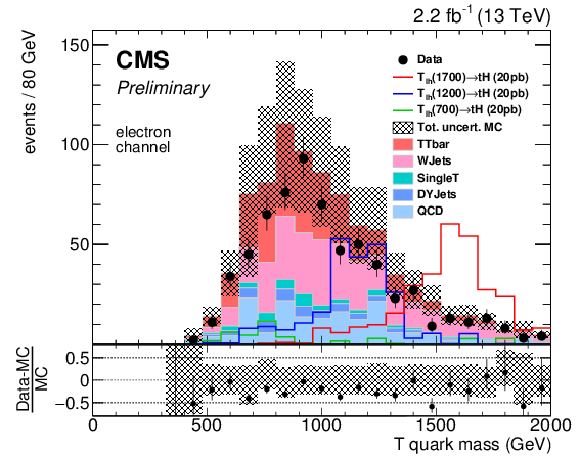
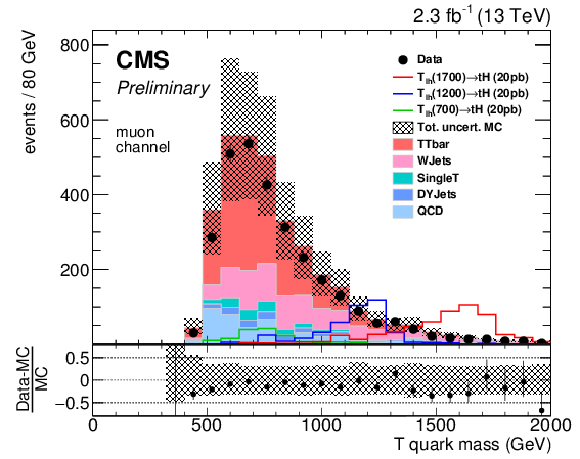
Vector-like T quark mass in the sideband region. The shape information encoded in the data histogram constitutes the background estimate. The electron channel is depicted on the (a) graph and the muon channel on the (b) graph. |
png pdf |
Figure 6-b:
Vector-like T quark mass in the sideband region. The shape information encoded in the data histogram constitutes the background estimate. The electron channel is depicted on the (a) graph and the muon channel on the (b) graph. |

png pdf |
Figure 7-a:
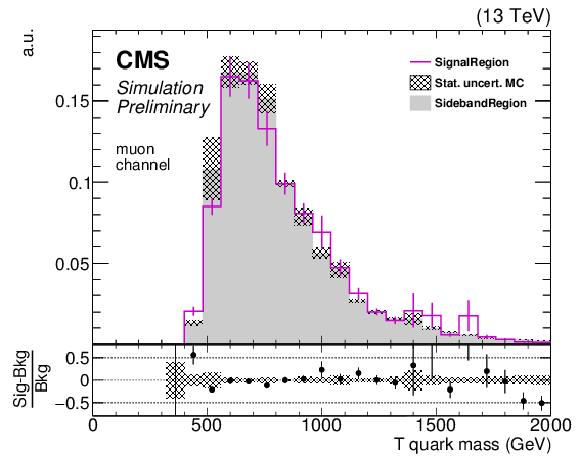
Comparison of vector-like T quark mass in the signal and sideband regions. The distributions show the sum of all background samples in the simulation. The electron channel is depicted on the (a) graph and the muon channel on the (b) graph. |
png pdf |
Figure 7-b:
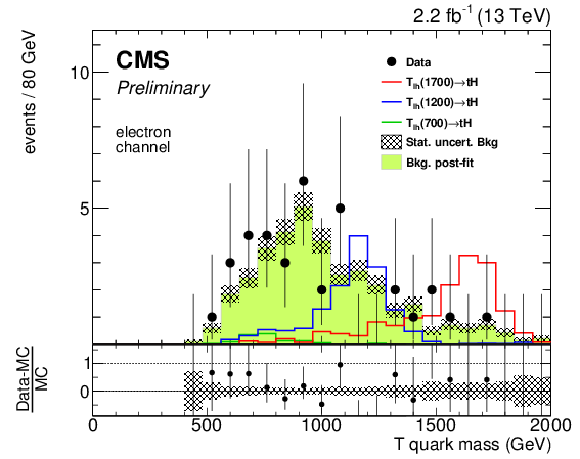
Comparison of vector-like T quark mass in the signal and sideband regions. The distributions show the sum of all background samples in the simulation. The electron channel is depicted on the (a) graph and the muon channel on the (b) graph. |
png pdf |
Figure 8-a:
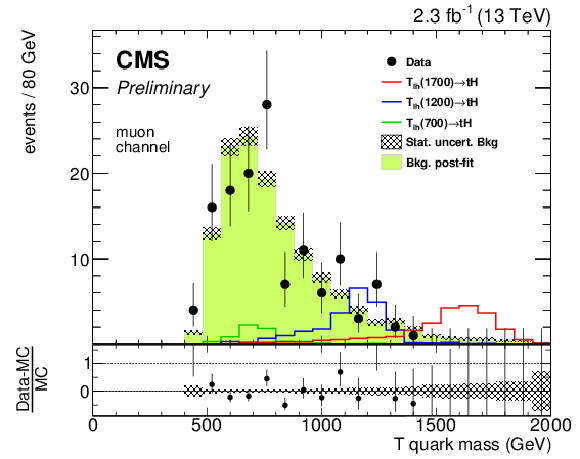
Distribution of $M^{\rm T}$. The normalisation of the background estimate is shown as determined from the fit described in Sec. 8. The electron channel is found in (a), the muon channel in (b), and the sum of both channels is shown in (c). |
png pdf |
Figure 8-b:
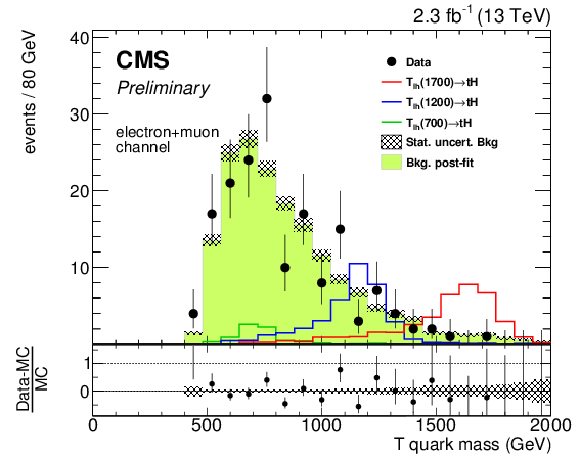
Distribution of $M^{\rm T}$. The normalisation of the background estimate is shown as determined from the fit described in Sec. 8. The electron channel is found in (a), the muon channel in (b), and the sum of both channels is shown in (c). |
png pdf |
Figure 8-c:
Distribution of $M^{\rm T}$. The normalisation of the background estimate is shown as determined from the fit described in Sec. 8. The electron channel is found in (a), the muon channel in (b), and the sum of both channels is shown in (c). |
png pdf |
Figure 9-a:
Exclusion limits on the cross section times branching ratio for left-handed and right-handed vector-like T quarks on (a,c) and (b,d), respectively. Electron and muon channels are combined. Associated T production with a t- or b-quark is shown in the figures (a,b) and (c,d), respectively. |
png pdf |
Figure 9-b:
Exclusion limits on the cross section times branching ratio for left-handed and right-handed vector-like T quarks on (a,c) and (b,d), respectively. Electron and muon channels are combined. Associated T production with a t- or b-quark is shown in the figures (a,b) and (c,d), respectively. |

png pdf |
Figure 9-c:
Exclusion limits on the cross section times branching ratio for left-handed and right-handed vector-like T quarks on (a,c) and (b,d), respectively. Electron and muon channels are combined. Associated T production with a t- or b-quark is shown in the figures (a,b) and (c,d), respectively. |
png pdf |
Figure 9-d:
Exclusion limits on the cross section times branching ratio for left-handed and right-handed vector-like T quarks on (a,c) and (b,d), respectively. Electron and muon channels are combined. Associated T production with a t- or b-quark is shown in the figures (a,b) and (c,d), respectively. |

png pdf |
Figure 10-a:
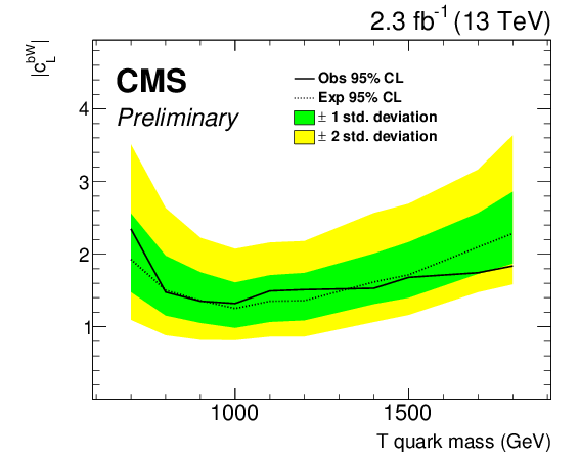
Coupling parameter exclusion limits for left-handed and right-handed vector-like T quarks on (a,c) and (b,d), respectively. Electron and muon channels are combined. Associated T production with a t- or b-quark is shown in the figures (a,b) and (c,d), respectively. |
png pdf |
Figure 10-b:
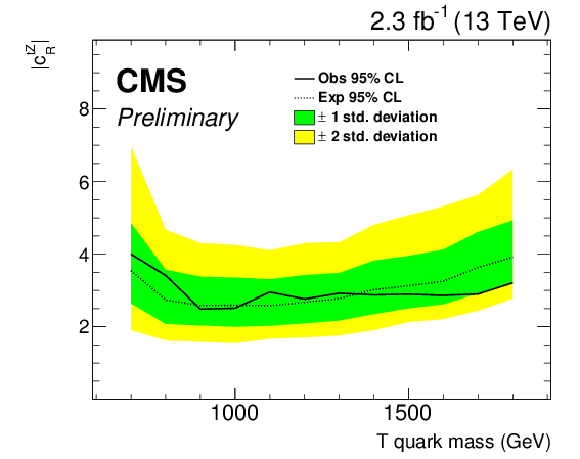
Coupling parameter exclusion limits for left-handed and right-handed vector-like T quarks on (a,c) and (b,d), respectively. Electron and muon channels are combined. Associated T production with a t- or b-quark is shown in the figures (a,b) and (c,d), respectively. |
png pdf |
Figure 10-c:
Coupling parameter exclusion limits for left-handed and right-handed vector-like T quarks on (a,c) and (b,d), respectively. Electron and muon channels are combined. Associated T production with a t- or b-quark is shown in the figures (a,b) and (c,d), respectively. |

png pdf |
Figure 10-d:
Coupling parameter exclusion limits for left-handed and right-handed vector-like T quarks on (a,c) and (b,d), respectively. Electron and muon channels are combined. Associated T production with a t- or b-quark is shown in the figures (a,b) and (c,d), respectively. |
| Tables | |
png pdf |
Table 1:
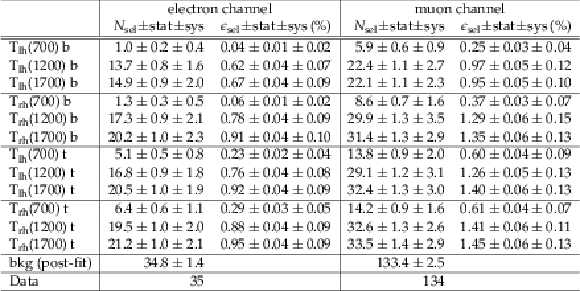
Selection efficiency and number of selected events for the signal region. For the background, we quote the post-fit value as determined by the fit (see Sec. 6 and 8). The left (right) handed T quark coupling to standard model particles is denoted by a lh (rh) subscript. T quark production in association with a bottom quark (b) is given in the first six table rows, and the associated production with a top quark (t) in the next six rows. All signal samples are normalised to a cross section of 1 pb and include all decay modes of the top quark and the Higgs boson. |

png pdf |
Table 2:
Event selection criteria for the signal and sideband regions. |

png pdf |
Table 3:
Impacts of the largest systematic uncertainties on the signal event yields. Left-handed Tb production signal samples are shown. The uncertainties on the forward jet and lepton isolation and trigger are rate uncertainties, all other uncertainties are evaluated bin-by-bin. For the background estimate, the posterior uncertainty of the fit of a signal plus background model to the data distribution (Sec. 8) on the event rate is 12%. All values are reported as percentages. |
| Summary |
| A search for a vector-like T quark decaying to top quark and Higgs boson is presented, where the top quark decay involves an electron or muon and the Higgs boson decays into a pair of b quarks. For every event, a four momentum of the potential vector-like T quark is reconstructed and its mass is evaluated. No excess over the estimated backgrounds is observed and 95% CL upper limits are placed on the cross section times branching ratio for vector-like T quarks and its coupling to third generation standard model quarks in the mass range of 700 GeV to 1800 GeV. Complementing the pair production searches for vector-like T quarks, this is the first analysis setting exclusion limits on the cross section and coupling parameters of singly produced vector-like T quarks at a centre-of-mass energy of 13 TeV. |

|
Compact Muon Solenoid LHC, CERN |

|

|

|

|

|

|