

Compact Muon Solenoid
LHC, CERN
| CMS-HIG-14-025 ; CERN-PH-EP-2015-131 | ||
| Search for exotic decays of a Higgs boson into undetectable particles and photons | ||
| CMS Collaboration | ||
| 2 July 2015 | ||
| Phys. Lett. B 753 (2016) 363 | ||
| Abstract: A search is presented for exotic decays of a Higgs boson into undetectable particles and one or two isolated photons in pp collisions at a center-of-mass energy of 8 TeV. The data correspond to an integrated luminosity of up to 19.4 fb$^{-1}$ collected with the CMS detector at the LHC. Higgs bosons produced in gluon-gluon fusion and in association with a Z boson are investigated, using models in which the Higgs boson decays into a gravitino and a neutralino or a pair of neutralinos, followed by the decay of the neutralino to a gravitino and a photon. The selected events are consistent with the background-only hypothesis, and limits are placed on the product of cross sections and branching fractions. Assuming a standard model Higgs boson production cross-section, a 95% confidence level upper limit is set on the branching fraction of a 125 GeV Higgs boson decaying into undetectable particles and one or two isolated photons as a function of the neutralino mass. For neutralino masses from 1 to 120 GeV an upper limit in the range of 7 to 13% is obtained. Further results are given as a function of the neutralino lifetime, and also for a range of Higgs boson masses. | ||
| Links: e-print arXiv:1507.00359 [hep-ex] (PDF) ; CDS record ; inSPIRE record ; CADI line (restricted) ; | ||
| Figures & Tables | Summary | Additional Figures | CMS Publications |
|---|
| Figures | |

png pdf |
Figure 1-a:
Feynman diagrams for the $ {\mathrm {H}} \to \text {undetectable}+\gamma $ final state produced via $ {\mathrm {g}} {\mathrm {g}} {\mathrm {H}} $ (a) and $ {\mathrm {Z}} {\mathrm {H}} $ (b). |

png pdf |
Figure 1-b:
Feynman diagrams for the $ {\mathrm {H}} \to \text {undetectable}+\gamma $ final state produced via $ {\mathrm {g}} {\mathrm {g}} {\mathrm {H}} $ (a) and $ {\mathrm {Z}} {\mathrm {H}} $ (b). |

png pdf |
Figure 2-a:
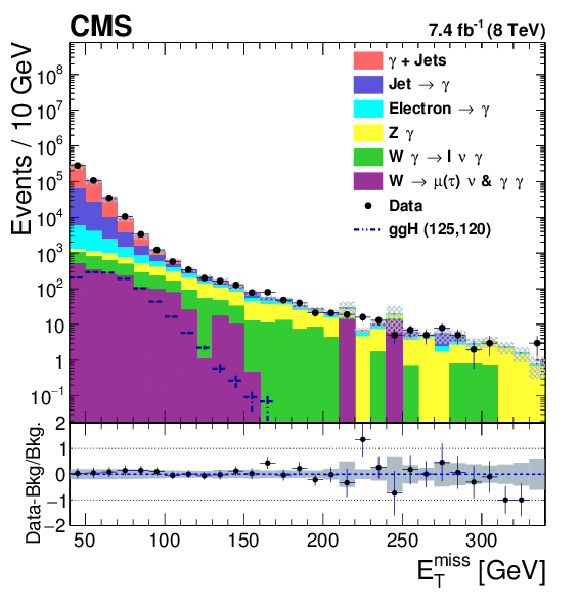
The $ {m_{\mathrm {T}}^{\ell \ell {E_{\mathrm {T}}^{\text {miss}}} }}$ and $ {E_{\mathrm {T}}^{\text {miss}}} $ distributions for data, background estimates, and signal after the model-independent selection for the $ {\mathrm {g}} {\mathrm {g}} {\mathrm {H}} $ channel. The bottom panels in each plot show the ratio of (data$-$background)/background and the gray band includes both the statistical and systematic uncertainties in the background prediction. The signal is shown for $ {m_{ {\mathrm {H}} }} = $ 125 GeV and $m_{ {\tilde{\chi}^{0}_{1}} } =$ 120 GeV. |
png pdf |
Figure 2-b:
The $ {m_{\mathrm {T}}^{\ell \ell {E_{\mathrm {T}}^{\text {miss}}} }}$ and $ {E_{\mathrm {T}}^{\text {miss}}} $ distributions for data, background estimates, and signal after the model-independent selection for the $ {\mathrm {g}} {\mathrm {g}} {\mathrm {H}} $ channel. The bottom panels in each plot show the ratio of (data$-$background)/background and the gray band includes both the statistical and systematic uncertainties in the background prediction. The signal is shown for $ {m_{ {\mathrm {H}} }} = $ 125 GeV and $m_{ {\tilde{\chi}^{0}_{1}} } =$ 120 GeV. |
png pdf |
Figure 3:
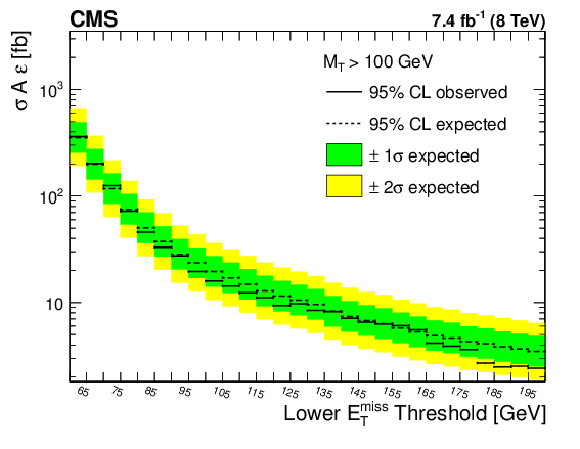
The expected and observed 95% CL upper limit on the product of cross section, acceptance, and efficiency ($\sigma ( {\mathrm {p}} {\mathrm {p}}\to \gamma + {E_{\mathrm {T}}^{\text {miss}}} ) A \epsilon $) for $ {m_{\mathrm {T}}^{\ell \ell {E_{\mathrm {T}}^{\text {miss}}} }}>$ 100 GeV, as function of the $ {E_{\mathrm {T}}^{\text {miss}}} $ threshold for the $ {\mathrm {g}} {\mathrm {g}} {\mathrm {H}} $ channel. |
png pdf |
Figure 4-a:
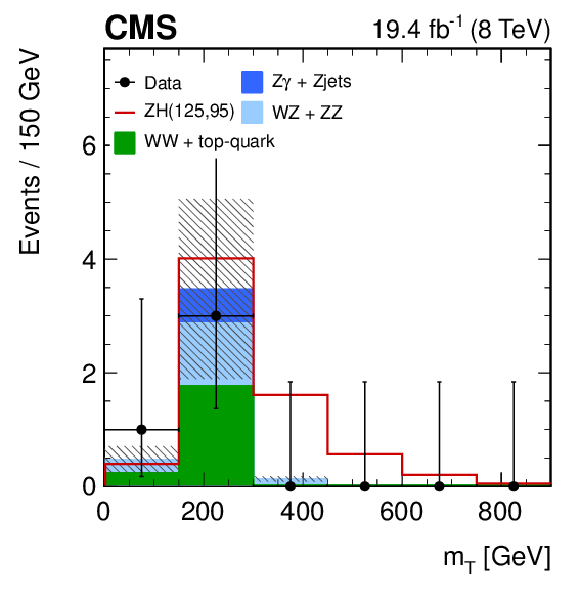
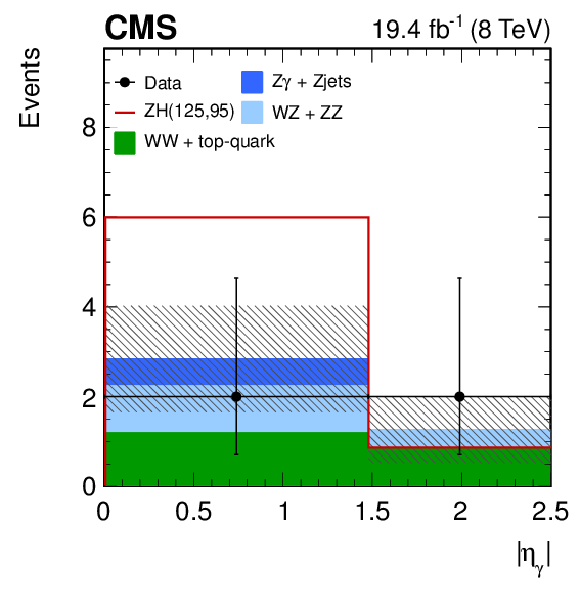
Distributions in signal where $ {m_{ {\mathrm {H}} }} = $ 125 GeV and $m_{ {\tilde{\chi}^{0}_{1}} } =$ 95 GeV, backgrounds and data for $ {m_{\mathrm {T}}^{\ell \ell {E_{\mathrm {T}}^{\text {miss}}} }}$ (a) and $ {| \eta ^\gamma | }$ (b) after applying all requirements. The uncertainty band for the backgrounds includes both statistical and systematic uncertainties. The signal model assumes a SM $ {\mathrm {Z}} {\mathrm {H}} $ production rate for a Higgs boson with $ {m_{ {\mathrm {H}} }} =$ 125 GeV and a 10% branching fraction. |
png pdf |
Figure 4-b:
Distributions in signal where $ {m_{ {\mathrm {H}} }} = $ 125 GeV and $m_{ {\tilde{\chi}^{0}_{1}} } =$ 95 GeV, backgrounds and data for $ {m_{\mathrm {T}}^{\ell \ell {E_{\mathrm {T}}^{\text {miss}}} }}$ (a) and $ {| \eta ^\gamma | }$ (b) after applying all requirements. The uncertainty band for the backgrounds includes both statistical and systematic uncertainties. The signal model assumes a SM $ {\mathrm {Z}} {\mathrm {H}} $ production rate for a Higgs boson with $ {m_{ {\mathrm {H}} }} =$ 125 GeV and a 10% branching fraction. |
png pdf |
Figure 5:
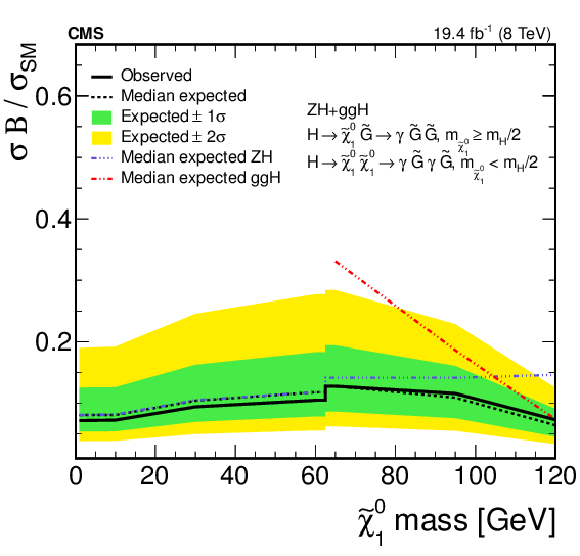
Expected and observed 95% CL upper limits on $\sigma \mathcal {B}/\sigma _{ \mathrm {SM}}$ for $ {m_{ {\mathrm {H}} }} =$ 125 GeV as a function of $m_{ {\tilde{\chi}^{0}_{1}} }$ assuming the SM Higgs boson cross sections, for the $ {\mathrm {Z}} {\mathrm {H}} $ and $ {\mathrm {g}} {\mathrm {g}} {\mathrm {H}} $ channels and their combination, with $\mathcal {B} \equiv \mathcal {B}( {\mathrm {H}} \to {\tilde{\chi}^{0}_{1}} {\tilde{\chi}^{0}_{1}} ) \mathcal {B}( {\tilde{\chi}^{0}_{1}} \to \tilde{ \mathrm {G} } +\gamma )^2$ for $m_{ {\tilde{\chi}^{0}_{1}} } < {m_{ {\mathrm {H}} }} /2$ and $\mathcal {B} \equiv \mathcal {B}( {\mathrm {H}} \to {\tilde{\chi}^{0}_{1}} \tilde{\mathrm {G}} ) \mathcal {B}( {\tilde{\chi}^{0}_{1}} \to \tilde {\mathrm {G}} +\gamma )$ for $m_{ {\tilde{\chi}^{0}_{1}} } \geq {m_{ {\mathrm {H}} }} /2$. |
png pdf |
Figure 6-a:
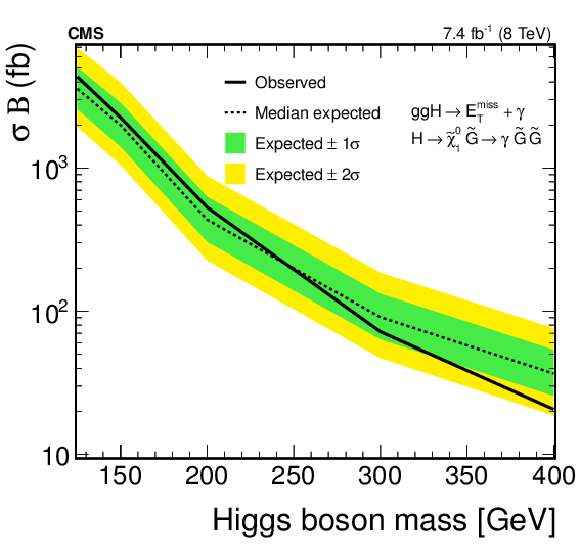
Expected and observed 95% CL upper limits on $\sigma _{gg \to {\mathrm {H}} } \mathcal {B}$ as a function of the Higgs boson mass with $m_{ {\tilde{\chi}^{0}_{1}} } = {m_{ {\mathrm {H}} }} - $ 30 GeV in $ {\mathrm {g}} {\mathrm {g}} {\mathrm {H}} $ channel (a) and in the $ {\mathrm {Z}} {\mathrm {H}} $ channel (b). |

png pdf |
Figure 6-b:
Expected and observed 95% CL upper limits on $\sigma _{gg \to {\mathrm {H}} } \mathcal {B}$ as a function of the Higgs boson mass with $m_{ {\tilde{\chi}^{0}_{1}} } = {m_{ {\mathrm {H}} }} - $ 30 GeV in $ {\mathrm {g}} {\mathrm {g}} {\mathrm {H}} $ channel (a) and in the $ {\mathrm {Z}} {\mathrm {H}} $ channel (b). |
png pdf |
Figure 7:
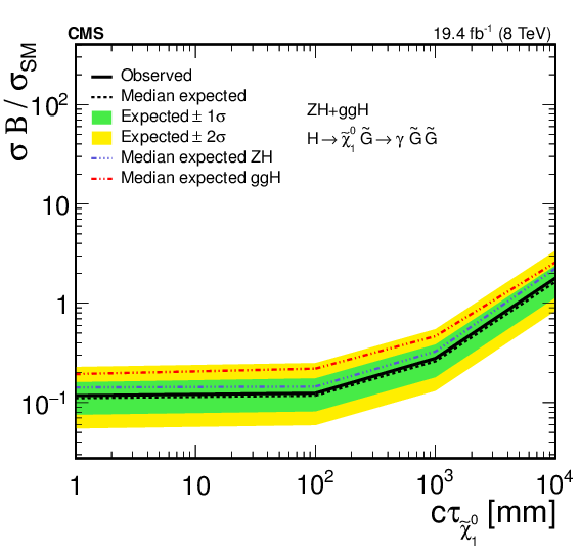
Expected and observed 95% CL upper limits on $\sigma _{ {\mathrm {H}} } \mathcal {B}$ as a function of $c\tau _{ {\tilde{\chi}^{0}_{1}} }$ for $ {m_{ {\mathrm {H}} }} =$ 125 GeV and $m_{ {\tilde{\chi}^{0}_{1}} }=$ 95 GeV, where $\mathcal {B} \equiv \mathcal {B}( {\mathrm {H}} \to {\tilde{\chi}^{0}_{1}} \tilde{\mathrm {G}} ) \mathcal {B}( {\tilde{\chi}^{0}_{1}} \to \tilde {\mathrm {G}} +\gamma )$. |
| Tables | |
png pdf |
Table 1:
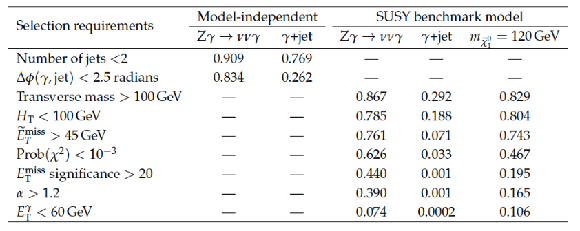
Summary of $ {\mathrm {g}} {\mathrm {g}} {\mathrm {H}} $ selection for both the quasi model-independent analysis and the analysis with the SUSY benchmark model with the cumulative efficiencies of the selection requirements relative to the preselection for $ {\mathrm {Z}} {\gamma }\to {\nu } {\overline {\nu }} {\gamma }$, $ {\gamma }$+jet and for a signal in a SUSY benchmark model with ggH production of a Higgs boson with mass 125 GeV decaying into a neutralino of mass 120 GeV and a photon. |
png pdf |
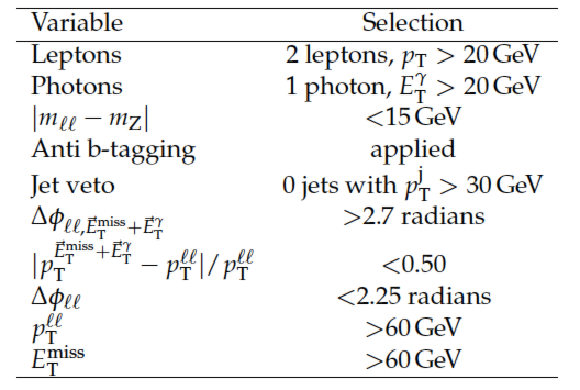
Table 2:
Summary of $ {\mathrm {Z}} {\mathrm {H}} $ selection. |
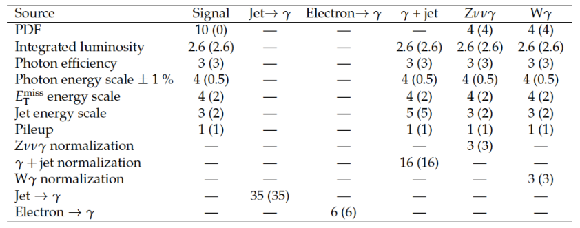
png pdf |
Table 3:
Summary of all relative systematic uncertainties in percent for the signal and background estimates for the Higgs model (model-independent in parenthesis) selection in the $ {\mathrm {g}} {\mathrm {g}} {\mathrm {H}} $ analysis. |
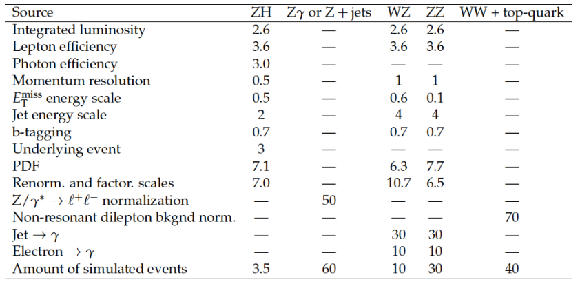
png pdf |
Table 4:
Summary of relative systematic uncertainties in percent for the signal and background estimates in the $ {\mathrm {Z}} {\mathrm {H}} $ analysis. |
png pdf |
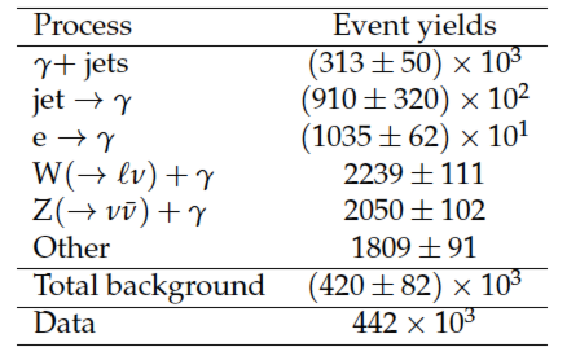
Table 5:
Observed yields and background estimates at 8 TeV in the $ {\mathrm {g}} {\mathrm {g}} {\mathrm {H}} $ channel after the model-independent selection. Statistical and systematic uncertainties are shown. |

png pdf |
Table 6:
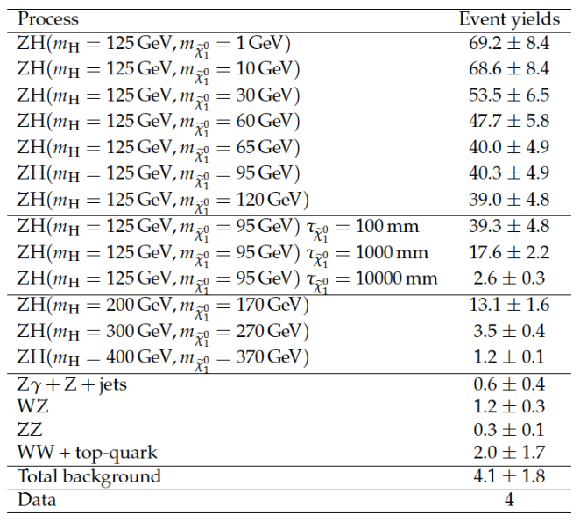
Observed yields, background estimates, and signal predictions at 8 TeV in the $ {\mathrm {g}} {\mathrm {g}} {\mathrm {H}} $ channel for different values of the $m_{ {\tilde{\chi}^{0}_{1}} }$ and for different $c\tau _{ {\tilde{\chi}^{0}_{1}} }$ of the $ {\tilde{\chi}^{0}_{1}} $. These correspond to $\mathcal {B}( {\mathrm {H}} \to \text {undetectable}+\gamma )=$100%, assuming the SM cross section at the given $ {m_{ {\mathrm {H}} }} $ hypothesis. Statistical and systematic uncertainties are shown for the yields. |
png pdf |
Table 7:
Observed yields, background estimates, and signal predictions at 8 TeV in the $ {\mathrm {Z}} {\mathrm {H}} $ channel. The signal predictions correspond to $\mathcal {B}( {\mathrm {H}} \to {\rm undetectable}+\gamma )=$ 100% assuming the SM $ {\mathrm {Z}} {\mathrm {H}} $ cross section at the given $ {m_{ {\mathrm {H}} }} $ hypothesis. Statistical and systematic uncertainties are shown. |
| Summary |
| A search is presented for exotic decays of a Higgs boson into undetectable particles and one or two isolated photons in pp collisions at a center-of-mass energy of 8 TeV. The data correspond to an integrated luminosity of up to 19.4 fb$^{-1}$ collected with the CMS detector at the LHC. Higgs bosons produced in gluon-gluon fusion or in association with a Z boson are investigated. Models including Higgs boson decays into a gravitino and a neutralino or a pair of neutralinos, followed by the neutralino decay to a gravitino and a photon, are tested. The measurements for the selected events in data are consistent with the background only hypothesis, and the results are interpreted as limits on the product of cross sections and branching fractions. Assuming a standard model Higgs production cross-section, a 95% CL upper limit is set on the branching fraction of a 125 GeV Higgs boson decaying into undetectable particles and one or two isolated photons as a function of the neutralino mass. For neutralino masses from 1 to 120 GeV an upper limit in the range of 7 to 13% is obtained. Further results are given as a function of the neutralino lifetime, and also for a range of Higgs boson masses. |
| Additional Figures | |
png pdf |
Additional Figure 1-a:
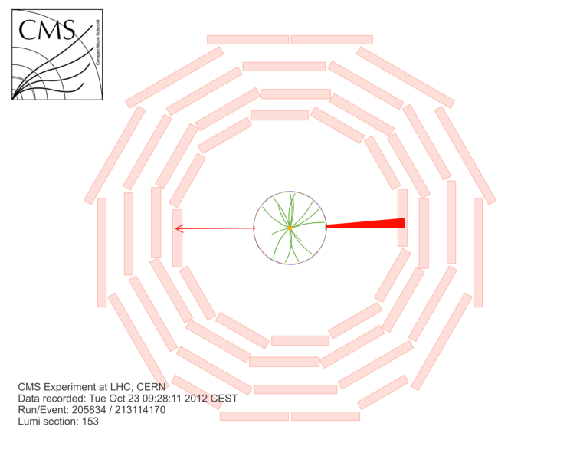
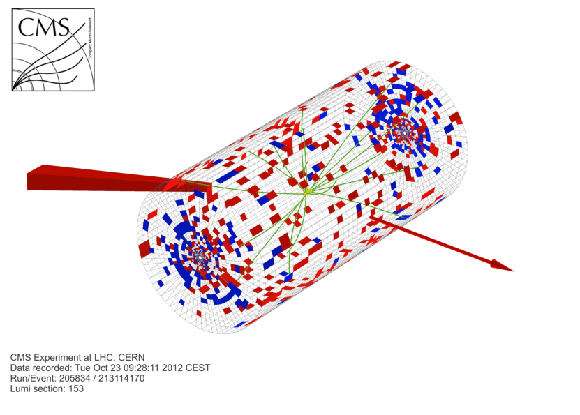
Highest photon transverse energy candidate event for the model independent selection. Only tracks with minimum energy of 2 GeV and jets with minimum transverse momenta of 30 GeV are shown. Photon transverse energy: 1623 GeV; MET = 1671 GeV. a: $\rho$-$\phi$ view; b: 3D tower view. |
png pdf |
Additional Figure 1-b:
Highest photon transverse energy candidate event for the model independent selection. Only tracks with minimum energy of 2 GeV and jets with minimum transverse momenta of 30 GeV are shown. Photon transverse energy: 1623 GeV; MET = 1671 GeV. a: $\rho$-$\phi$ view; b: 3D tower view. |

png pdf |
Additional Figure 2-a:
Highest photon transverse energy candidate event for the SUSY benchmark model selection. Although this event has a track pointing to the electromagnetic cluster, it passes all photon identification selection criteria. A possible background interpretation is that this is likely a W+1 jet event. Only tracks with minimum energy of 2 GeV and jets with minimum transverse momenta of 30 GeV are shown. Photon transverse energy: 60 GeV; MET = 57 GeV. a: $\rho$-$\phi$ view; b: 3D tower view. |

png pdf |
Additional Figure 2-b:
Highest photon transverse energy candidate event for the SUSY benchmark model selection. Although this event has a track pointing to the electromagnetic cluster, it passes all photon identification selection criteria. A possible background interpretation is that this is likely a W+1 jet event. Only tracks with minimum energy of 2 GeV and jets with minimum transverse momenta of 30 GeV are shown. Photon transverse energy: 60 GeV; MET = 57 GeV. a: $\rho$-$\phi$ view; b: 3D tower view. |

png pdf |
Additional Figure 3-a:
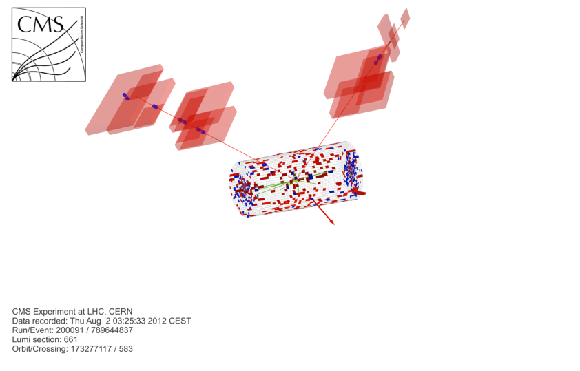
Z($ \to \mu \mu$) H($ \to \gamma$+MET) candidate: two high transverse momentum and isolated muons recoiling against MET and an isolated photon. a: $\rho$-$\phi$ view; b: 3D tower view. |
png pdf |
Additional Figure 3-b:
Z($ \to \mu \mu$) H($ \to \gamma$+MET) candidate: two high transverse momentum and isolated muons recoiling against MET and an isolated photon. a: $\rho$-$\phi$ view; b: 3D tower view. |

|
Compact Muon Solenoid LHC, CERN |

|

|

|

|

|

|