

Compact Muon Solenoid
LHC, CERN
| CMS-PAS-TOP-15-003 | ||
| Measurement of the top quark pair production cross section in proton-proton collisions at $\sqrt{s}=$ 13 TeV with the CMS detector | ||
| CMS Collaboration | ||
| August 2015 | ||
| Abstract: The top-antitop quark ($\mathrm{ t \bar{t} }$) production cross section is measured for the first time by the CMS experiment in proton-proton collisions at $\sqrt{s} =$ 13 TeV at the CERN LHC, using data corresponding to an integrated luminosity of 42 pb$^{-1}$. The measurement is performed by analyzing events with one electron and one muon and at least two jets. The measured cross section is $\sigma_{\mathrm{ t \bar{t} }} =$ 772 $\pm$ 60 (stat) $\pm$ 62 (syst) $\pm$ 93 (lumi) pb, in agreement with the expectations from the standard model. | ||
|
Links:
CDS record (PDF) ;
Public twiki page ;
CADI line (restricted) ; Figures are also available from the CDS record. These preliminary results are superseded in this paper, PRL 116 (2016) 052002. |
||
| Figures | |
png ; pdf |
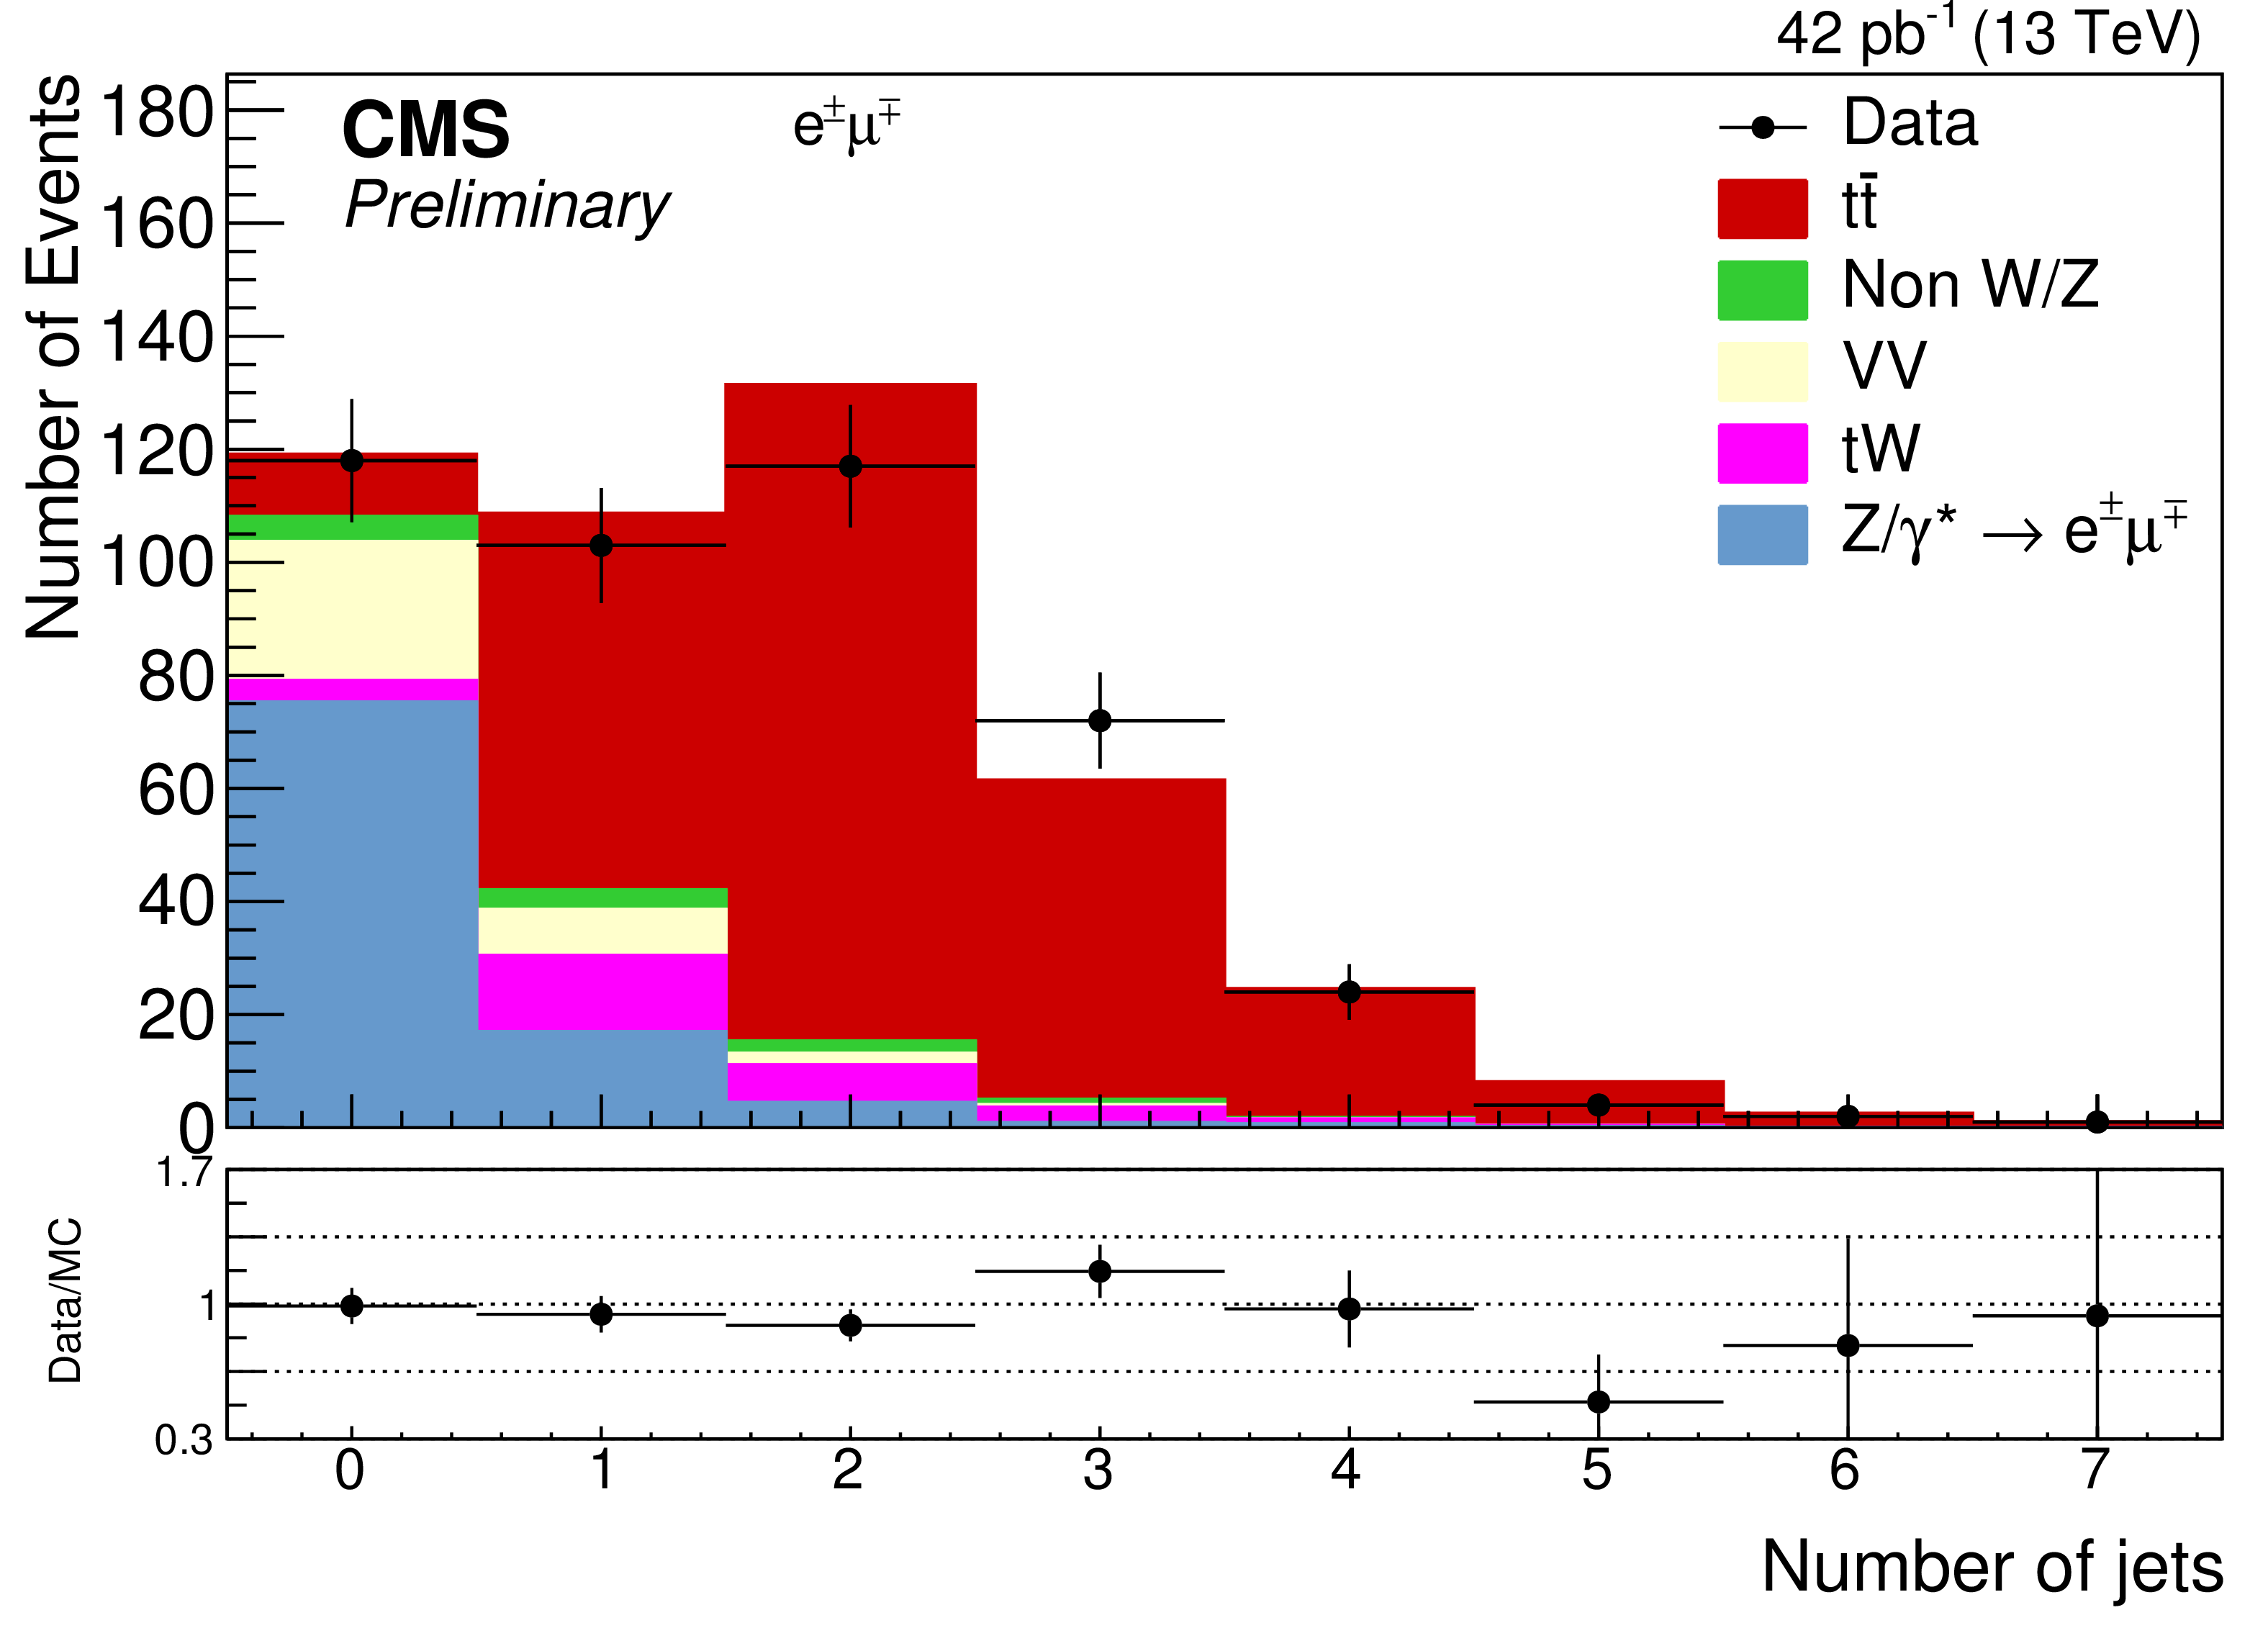
Figure 1-a:
The distributions for (a) the jet multiplicity and (b) $H_{\mathrm{T}}$ in events passing the dilepton criteria. The expected distributions for $ \mathrm{ t \bar{t} } $ signal and individual backgrounds are shown after data-based corrections are applied; the last bin contains the overflow events. The ratios of data to the sum of the expected yields are given at the bottom of each panel. |
png ; pdf |
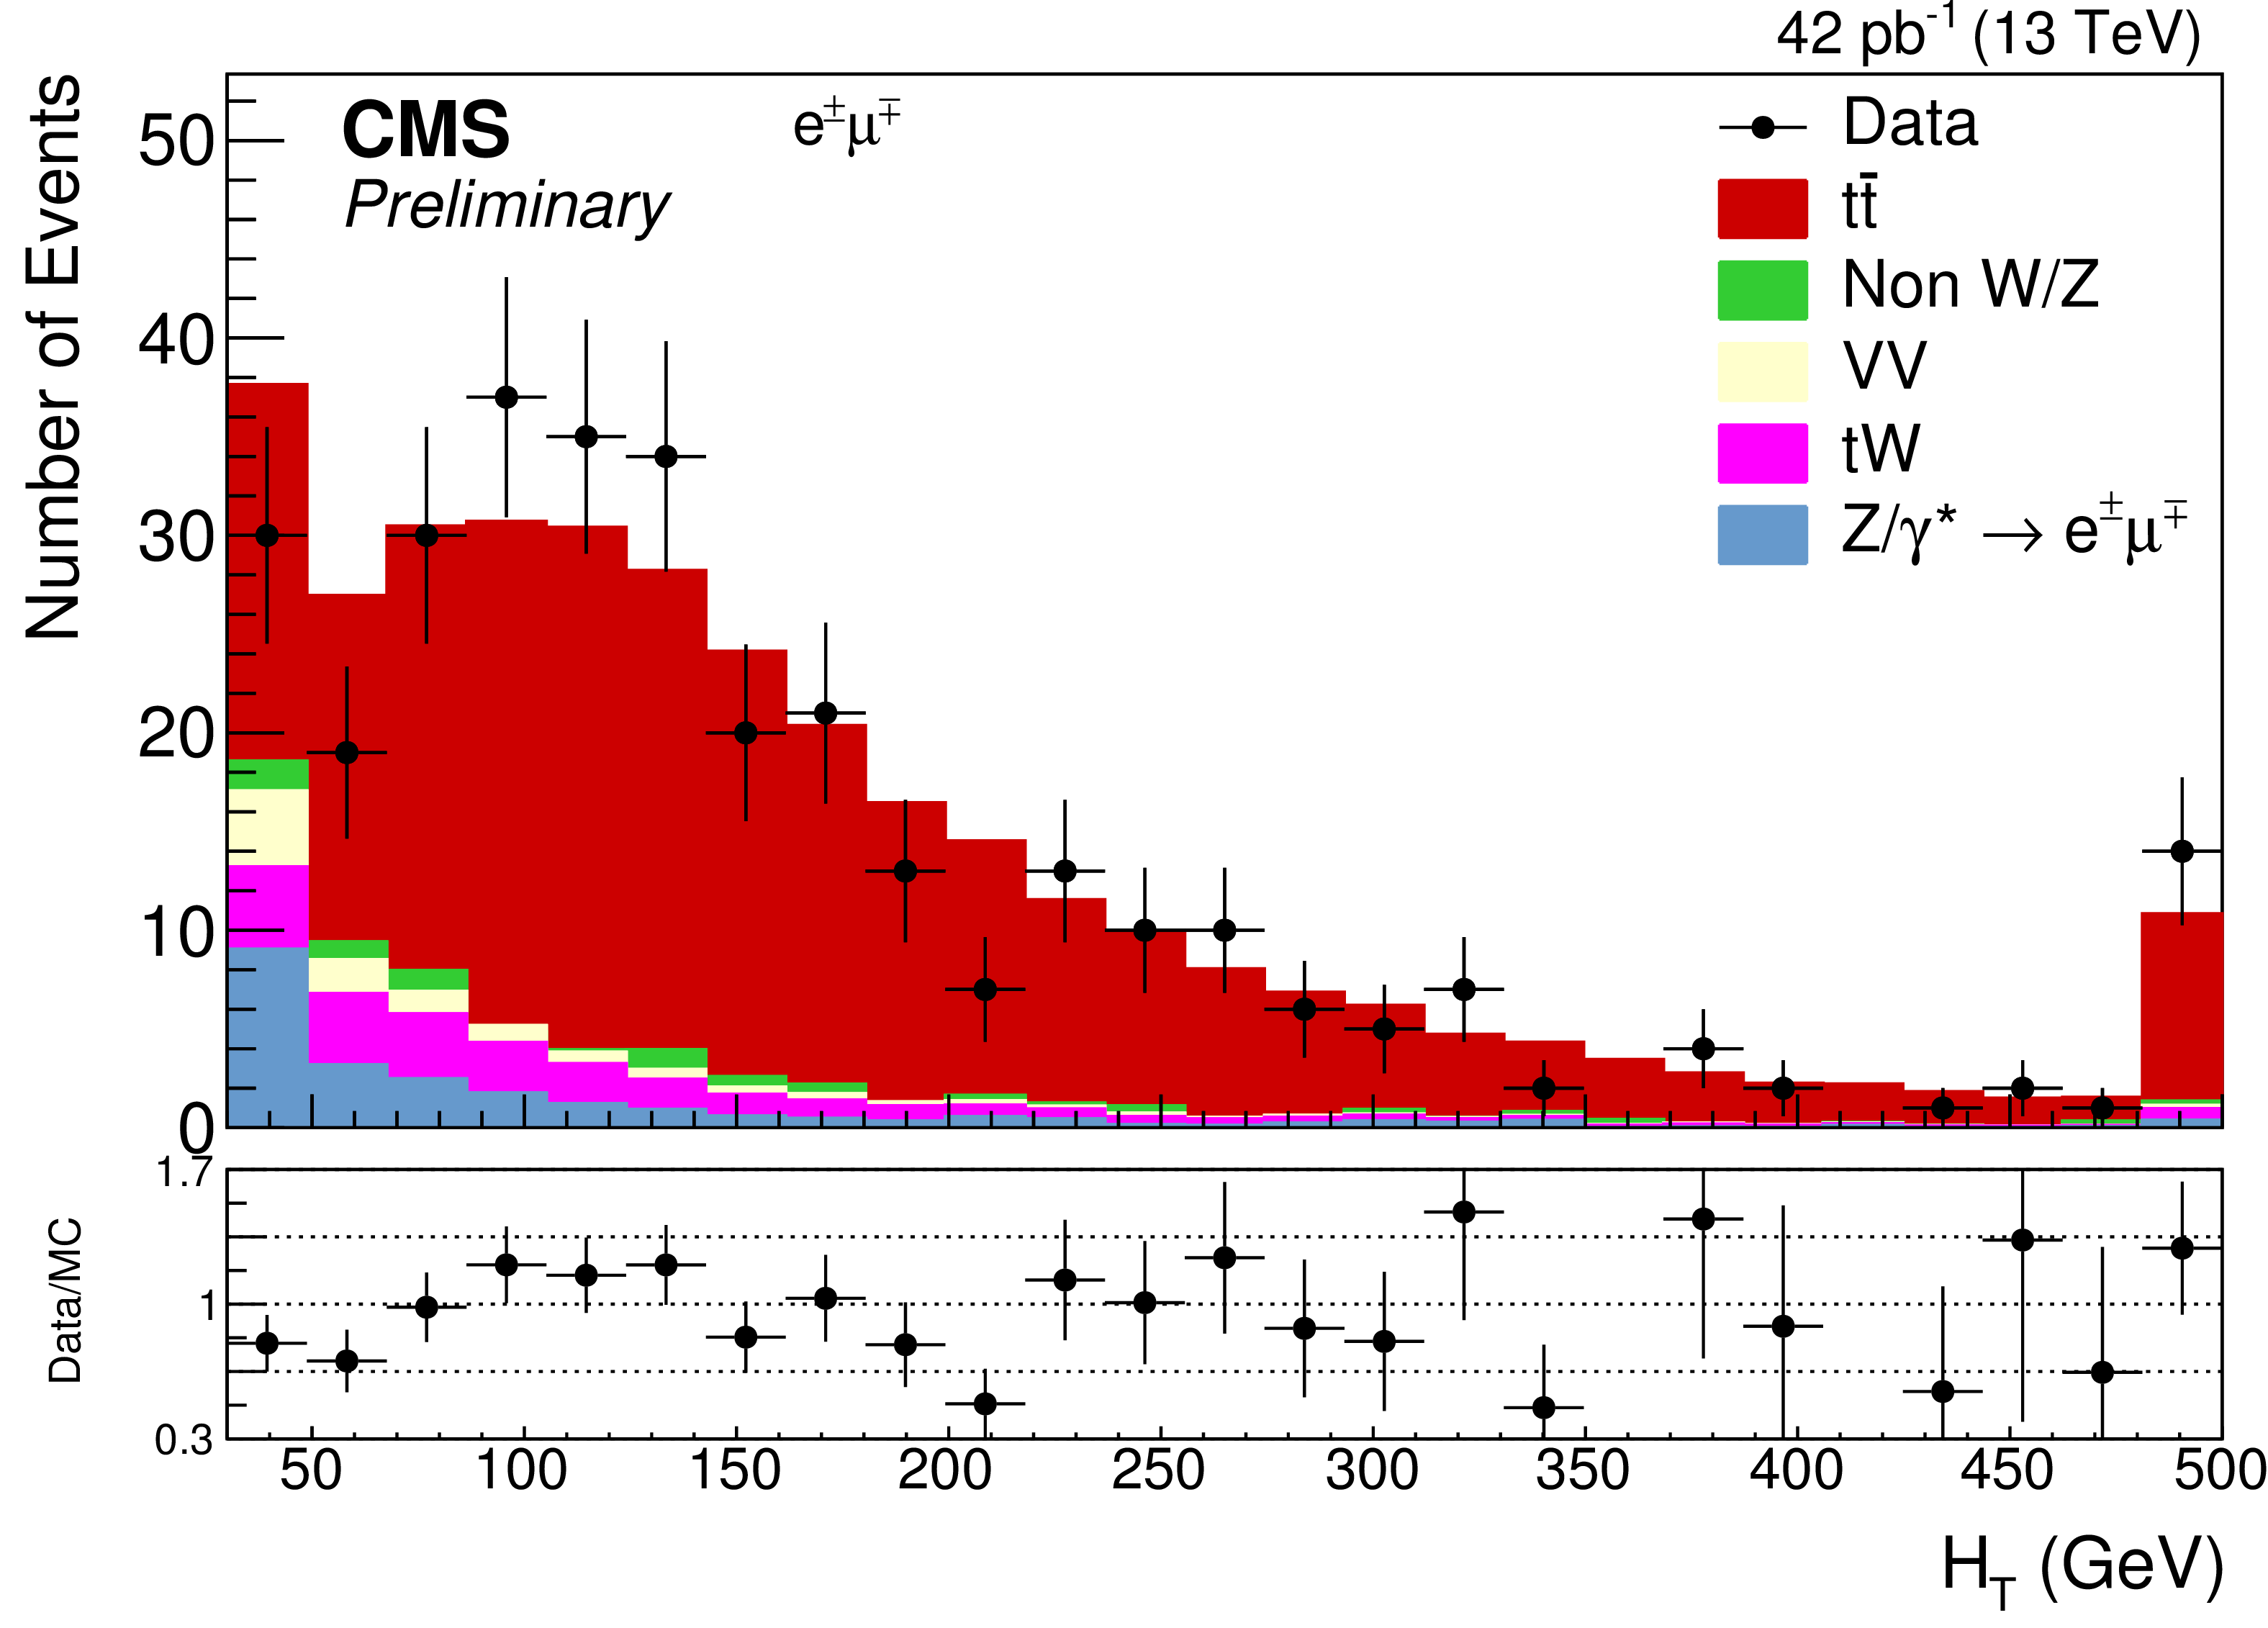
Figure 1-b:
The distributions for (a) the jet multiplicity and (b) $H_{\mathrm{T}}$ in events passing the dilepton criteria. The expected distributions for $ \mathrm{ t \bar{t} } $ signal and individual backgrounds are shown after data-based corrections are applied; the last bin contains the overflow events. The ratios of data to the sum of the expected yields are given at the bottom of each panel. |
png ; pdf |
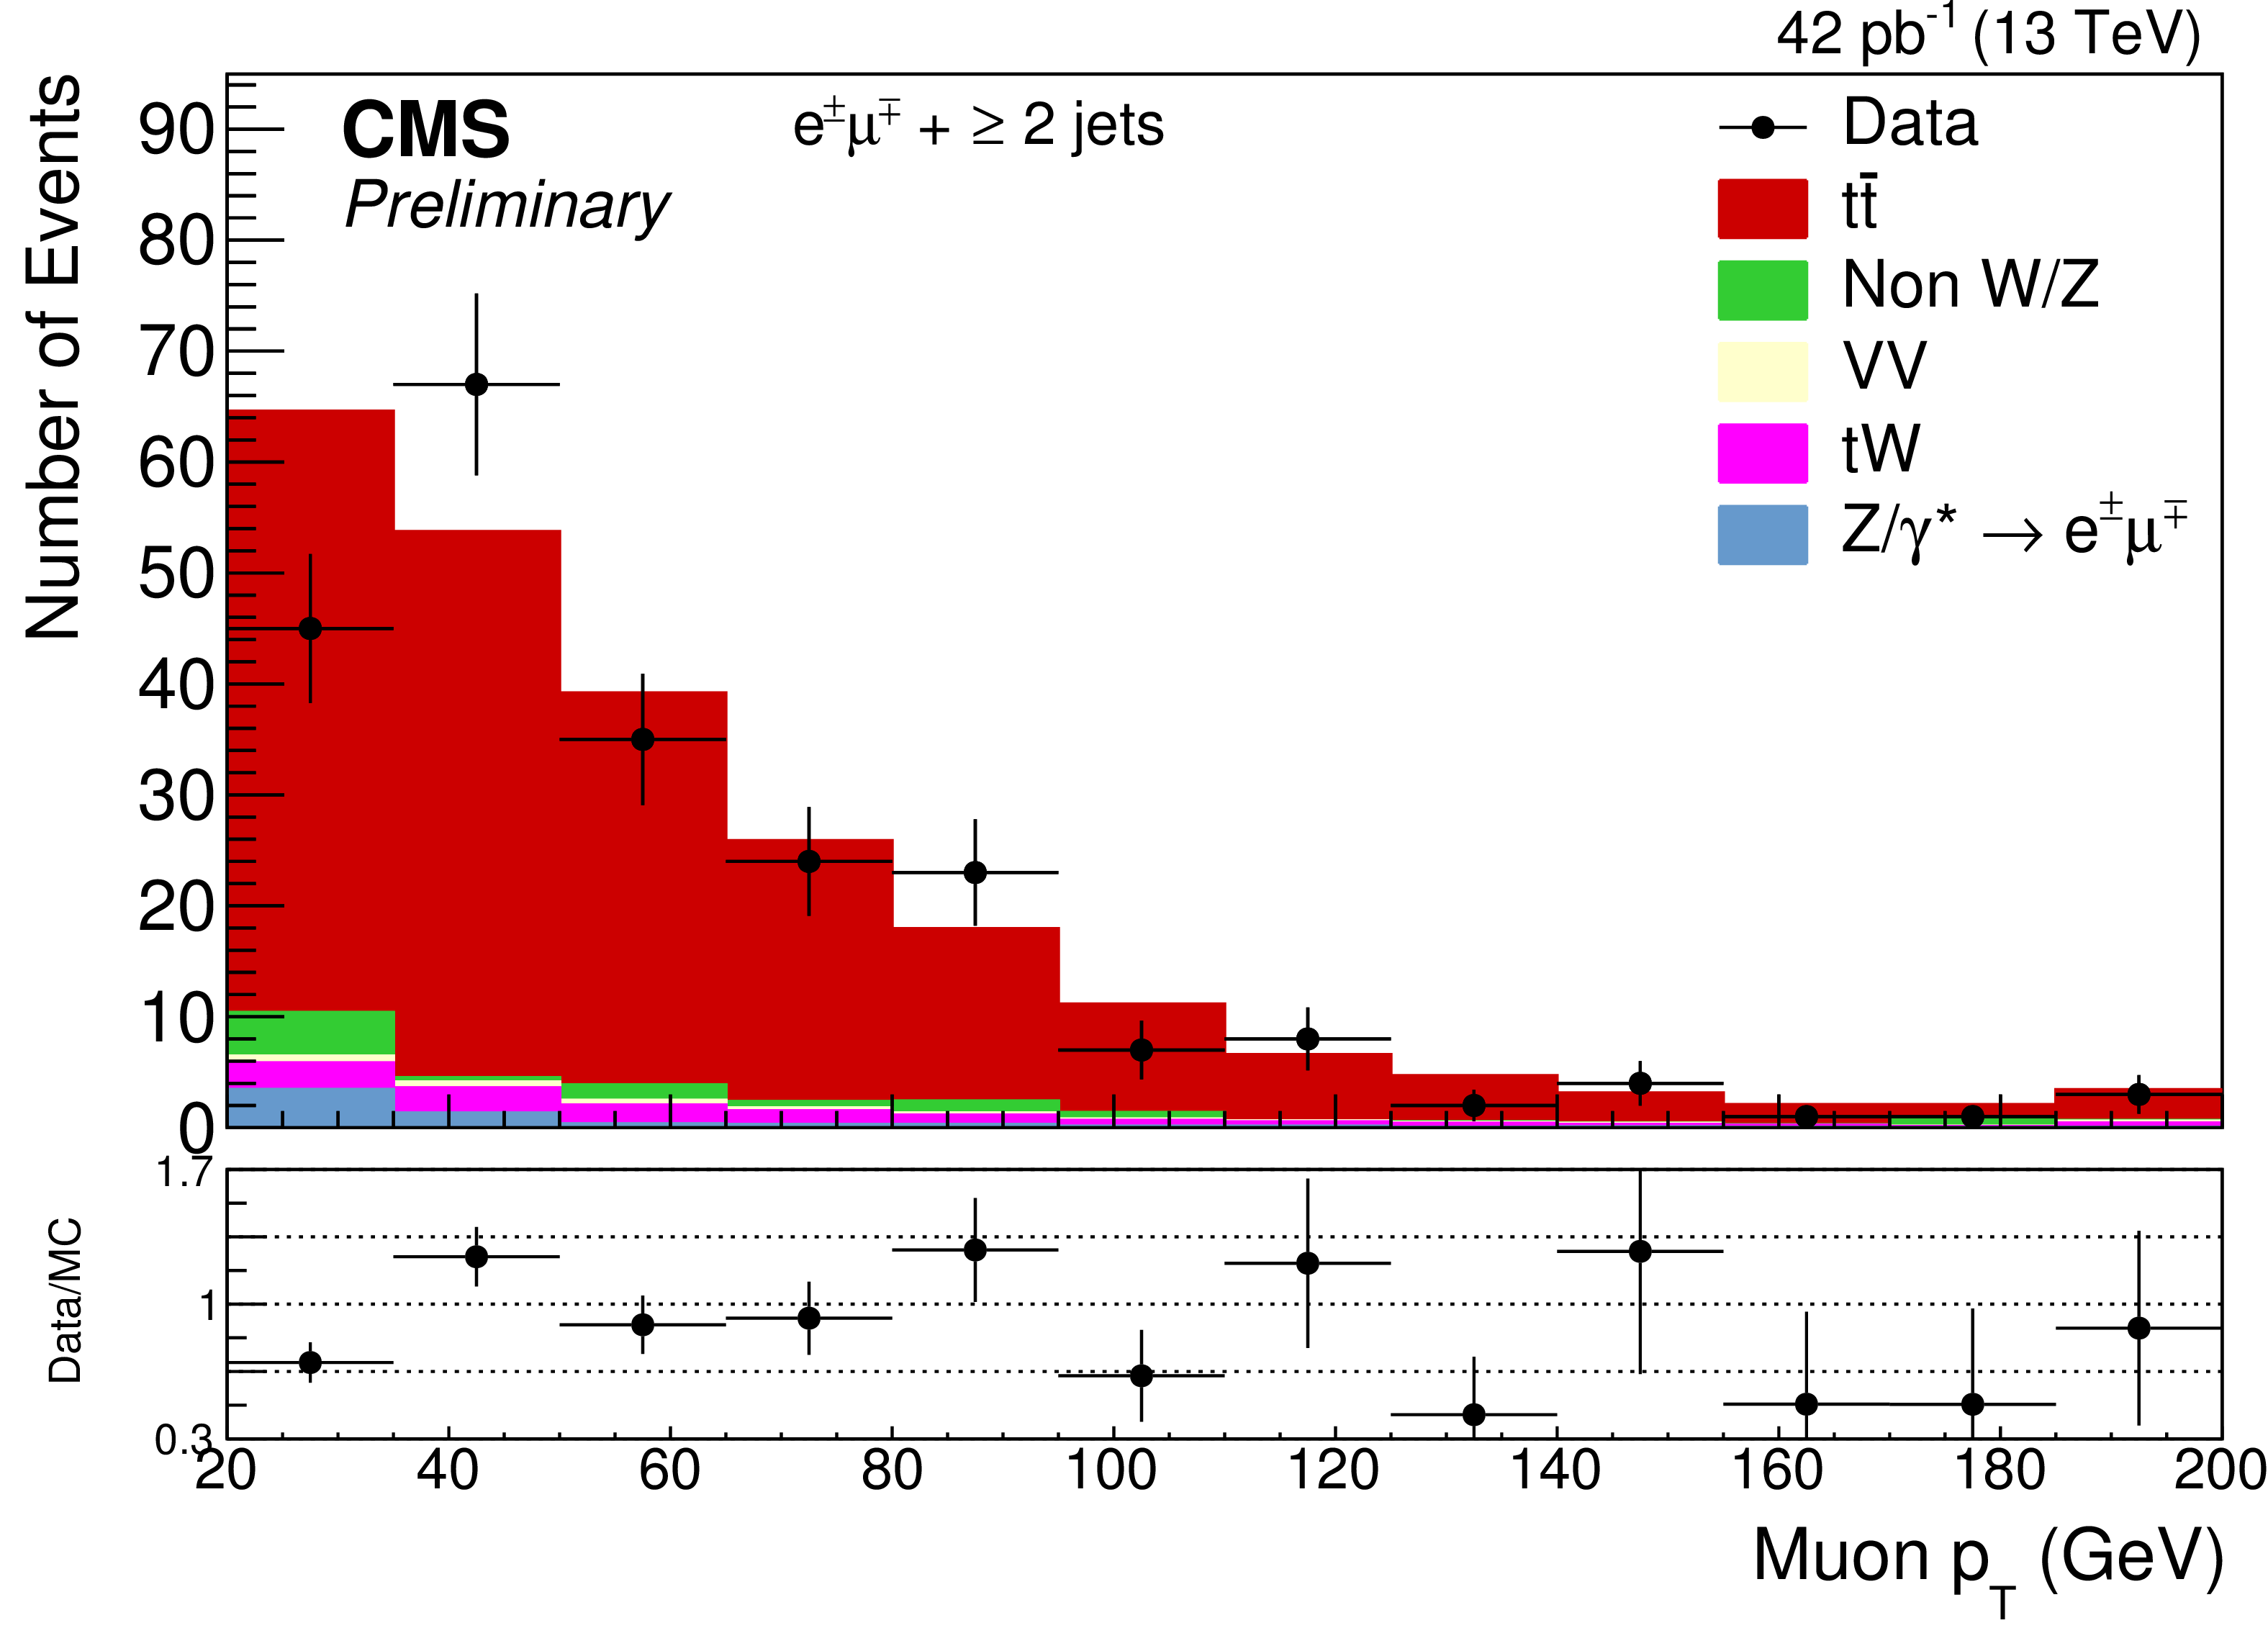
Figure 2-a:
The distributions for (a) $ {p_{\mathrm {T}}} $ and (b) $\eta $ for the highest-$ {p_{\mathrm {T}}} $ muon, and for (c) $ {p_{\mathrm {T}}} $ and (d) $\eta $ for the leading electron after all selections. The expected distributions for $ \mathrm{ t \bar{t} } $ signal and individual backgrounds are shown after data-based corrections are applied; for the left plots (a,c) the last bin contains the overflow events. The ratios of data to the sum of the expected yields are given at the bottom of each panel. |
png ; pdf |
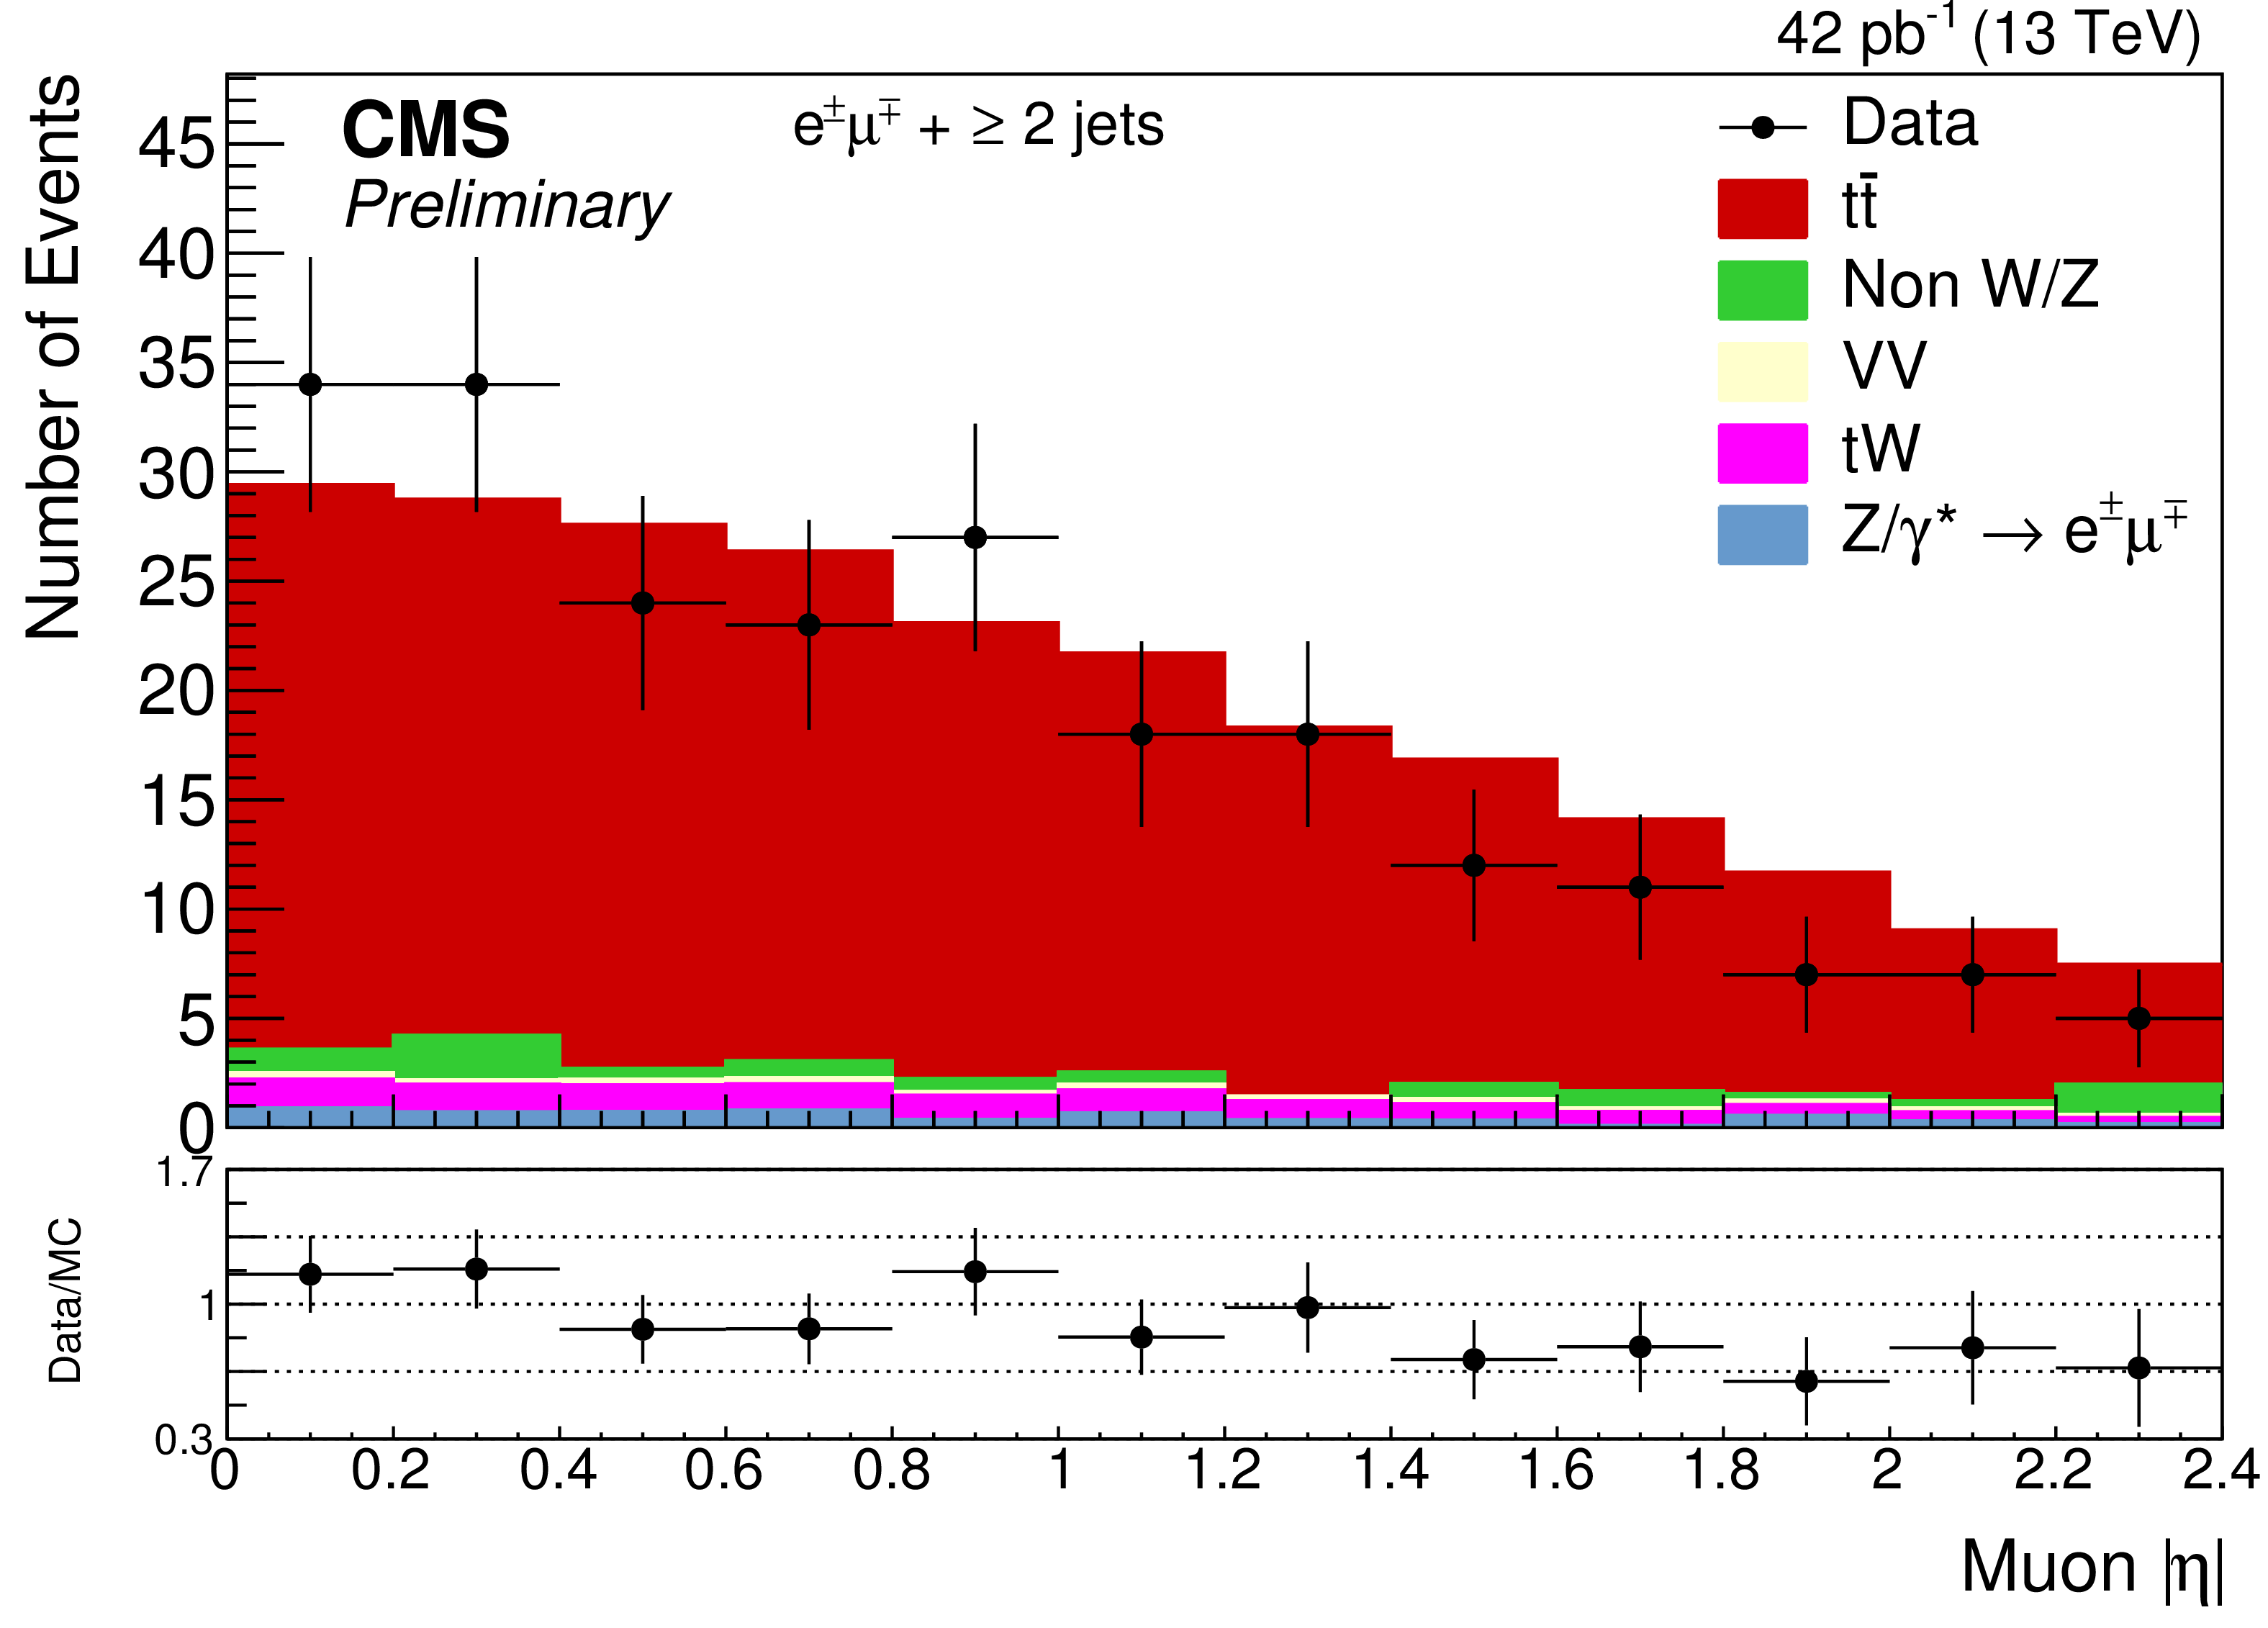
Figure 2-b:
The distributions for (a) $ {p_{\mathrm {T}}} $ and (b) $\eta $ for the highest-$ {p_{\mathrm {T}}} $ muon, and for (c) $ {p_{\mathrm {T}}} $ and (d) $\eta $ for the leading electron after all selections. The expected distributions for $ \mathrm{ t \bar{t} } $ signal and individual backgrounds are shown after data-based corrections are applied; for the left plots (a,c) the last bin contains the overflow events. The ratios of data to the sum of the expected yields are given at the bottom of each panel. |
png ; pdf |
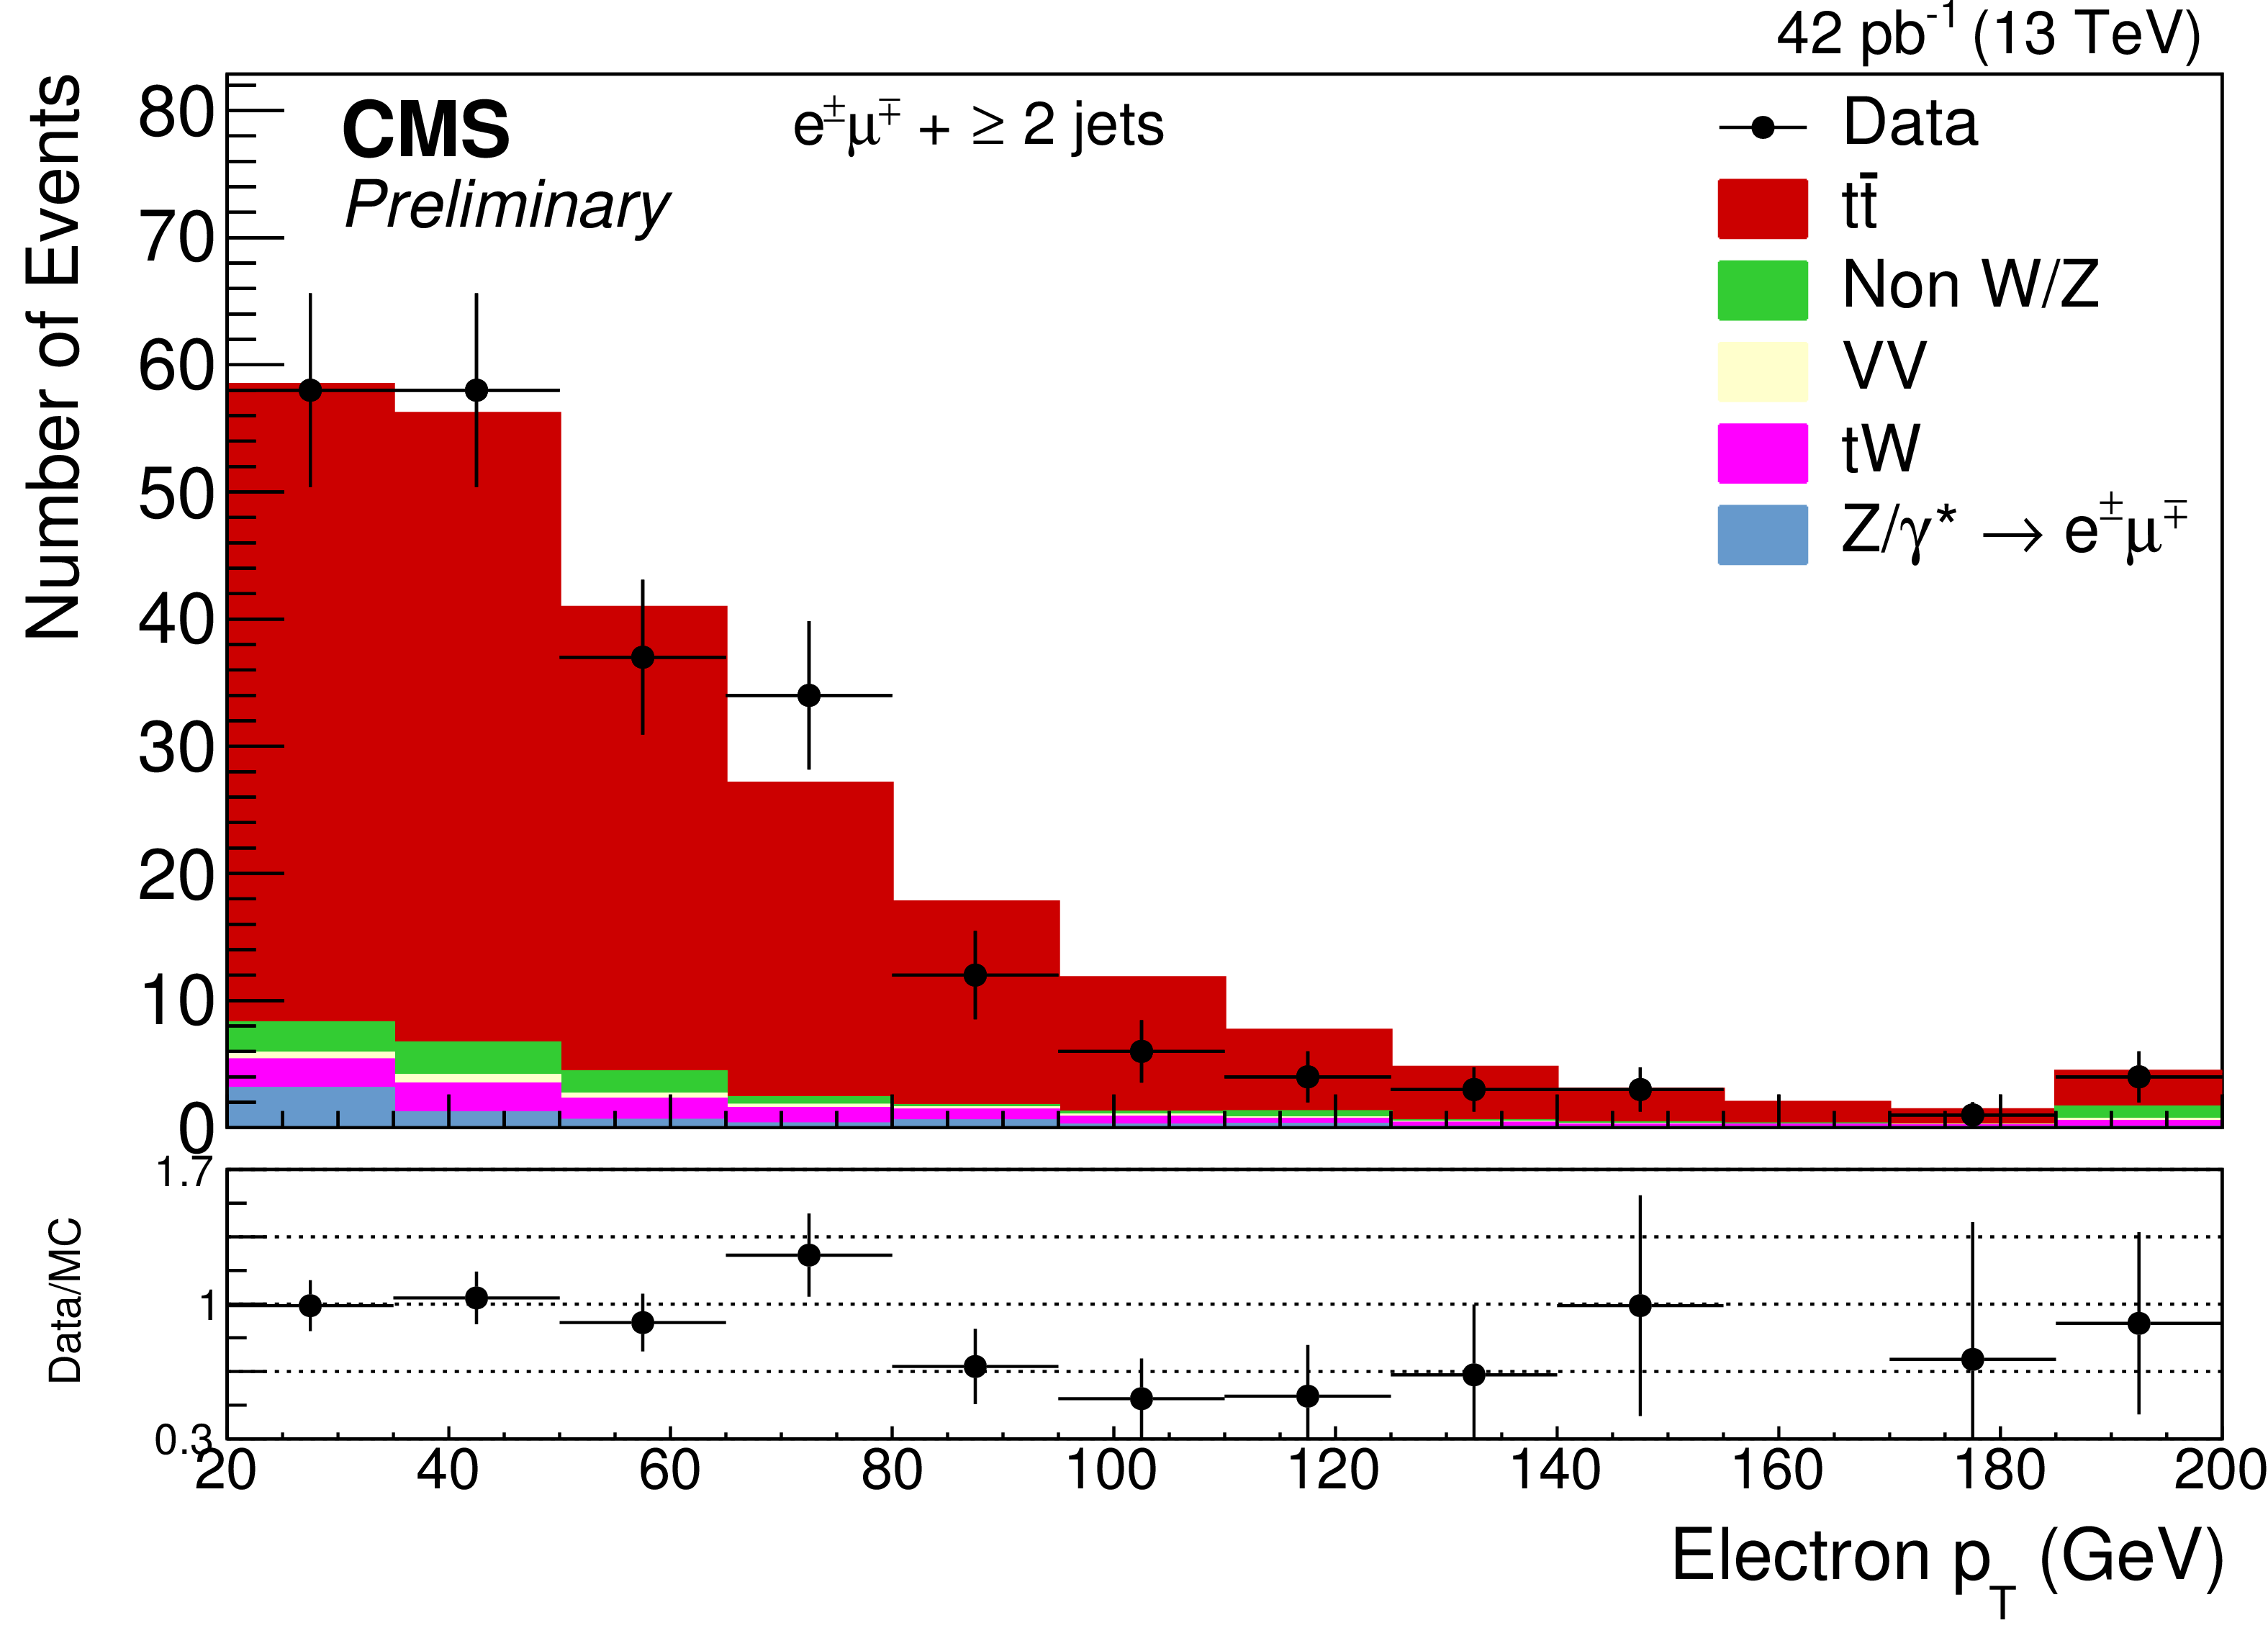
Figure 2-c:
The distributions for (a) $ {p_{\mathrm {T}}} $ and (b) $\eta $ for the highest-$ {p_{\mathrm {T}}} $ muon, and for (c) $ {p_{\mathrm {T}}} $ and (d) $\eta $ for the leading electron after all selections. The expected distributions for $ \mathrm{ t \bar{t} } $ signal and individual backgrounds are shown after data-based corrections are applied; for the left plots (a,c) the last bin contains the overflow events. The ratios of data to the sum of the expected yields are given at the bottom of each panel. |
png ; pdf |
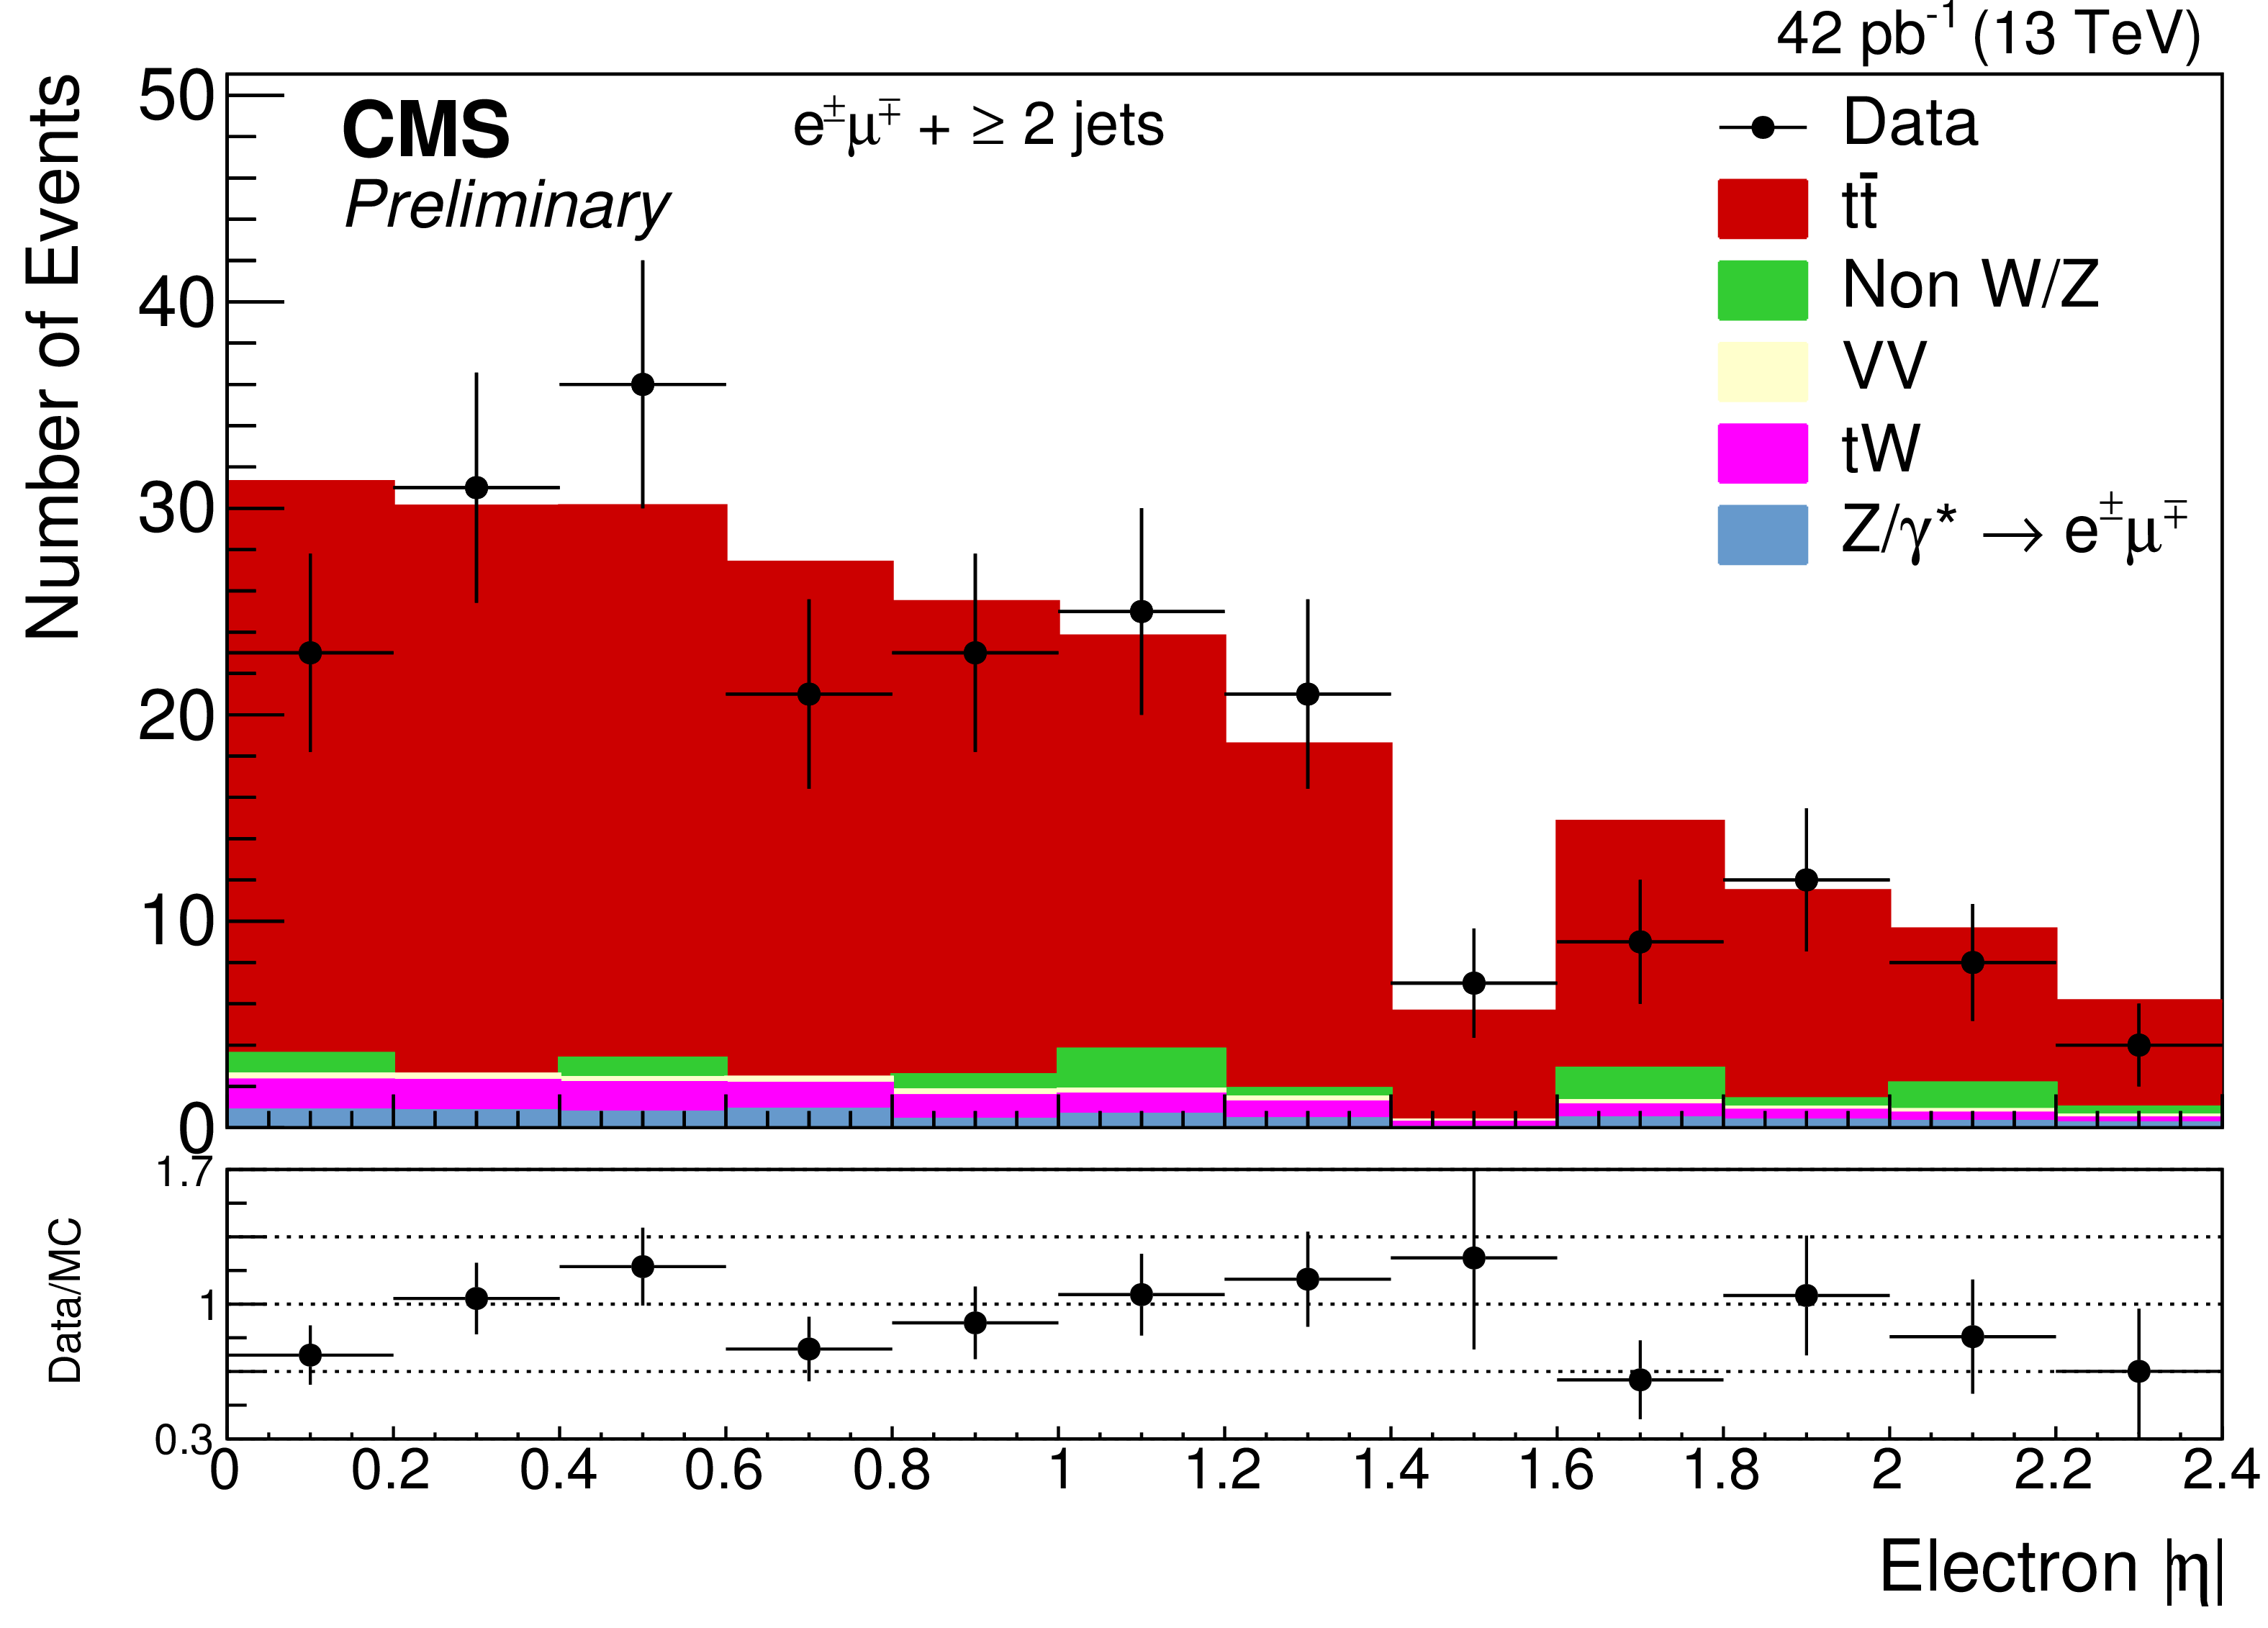
Figure 2-d:
The distributions for (a) $ {p_{\mathrm {T}}} $ and (b) $\eta $ for the highest-$ {p_{\mathrm {T}}} $ muon, and for (c) $ {p_{\mathrm {T}}} $ and (d) $\eta $ for the leading electron after all selections. The expected distributions for $ \mathrm{ t \bar{t} } $ signal and individual backgrounds are shown after data-based corrections are applied; for the left plots (a,c) the last bin contains the overflow events. The ratios of data to the sum of the expected yields are given at the bottom of each panel. |
png ; pdf |
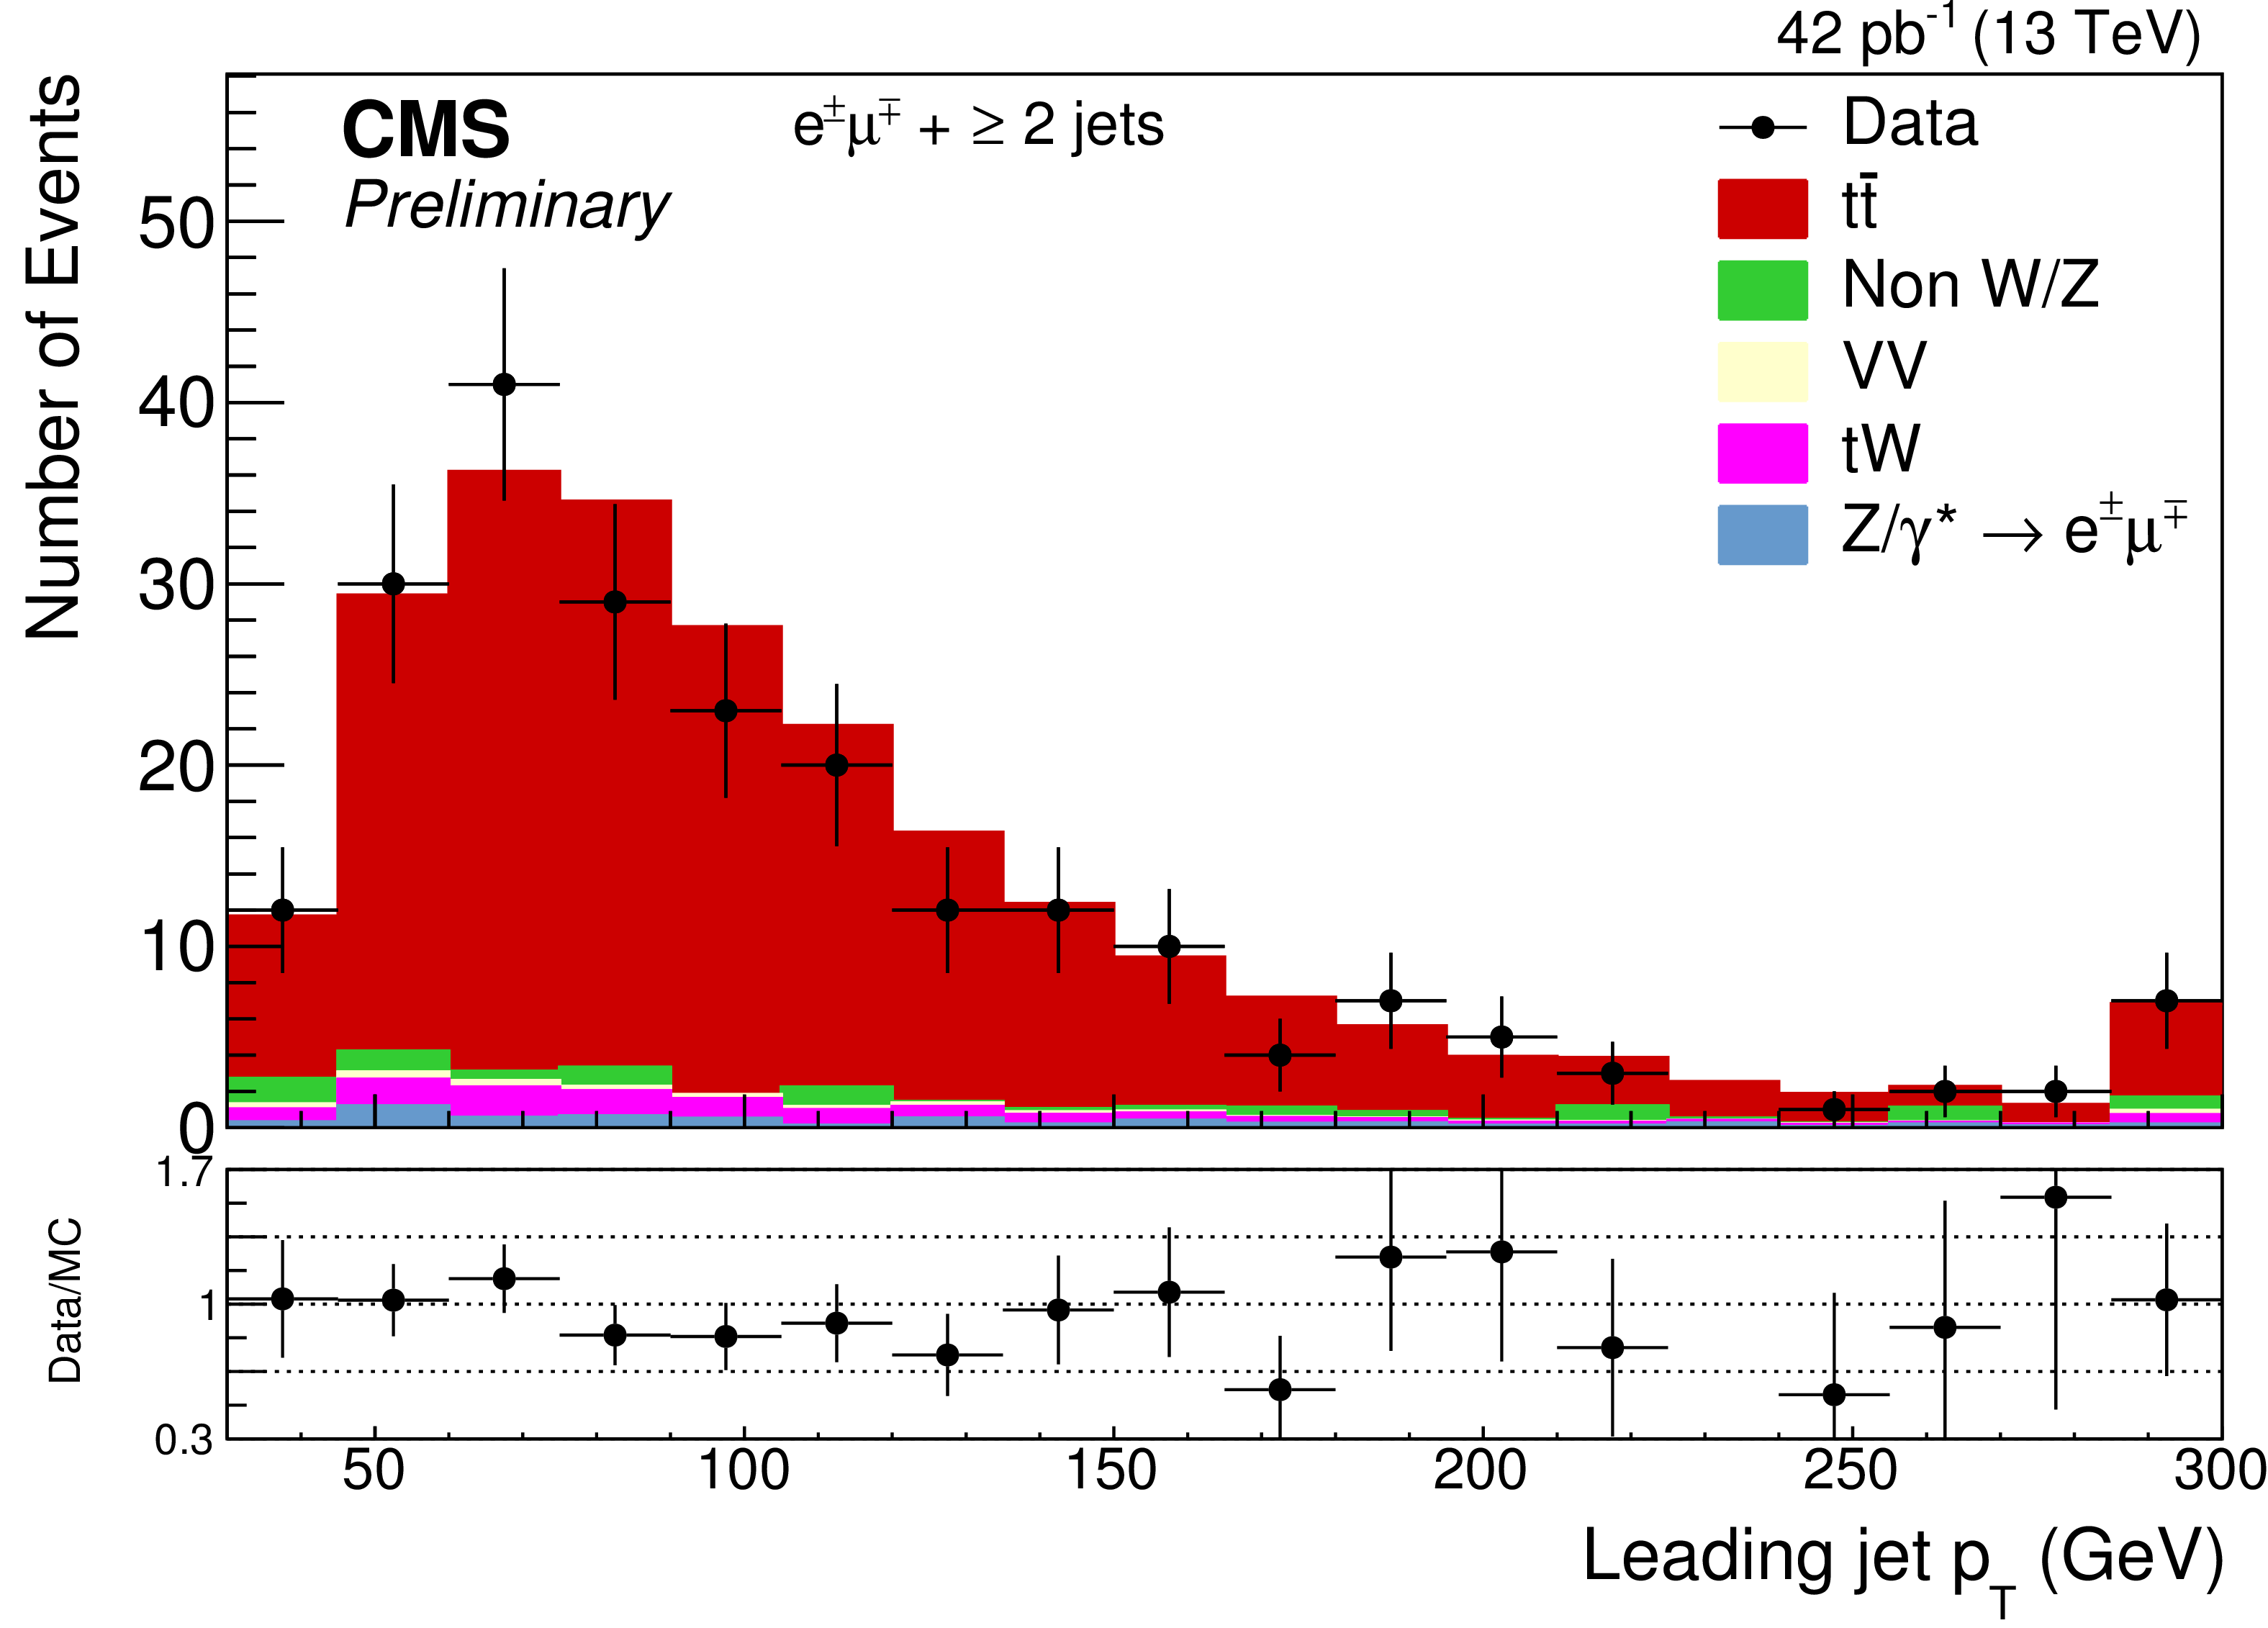
Figure 3-a:
The distributions for (a) $ {p_{\mathrm {T}}} $ and (b) $\eta $ for the highest-$ {p_{\mathrm {T}}} $ jet, and for (c) $ {p_{\mathrm {T}}} $ and (d) $\eta $ for the second highest-$ {p_{\mathrm {T}}} $ jet after all selections. The expected distributions for $ \mathrm{ t \bar{t} } $ signal and individual backgrounds are shown after data-based corrections are applied; for the left plots (a,c) the last bin contains the overflow events. The ratios of data to the sum of the expected yields are given at the bottom of each panel. |
png ; pdf |
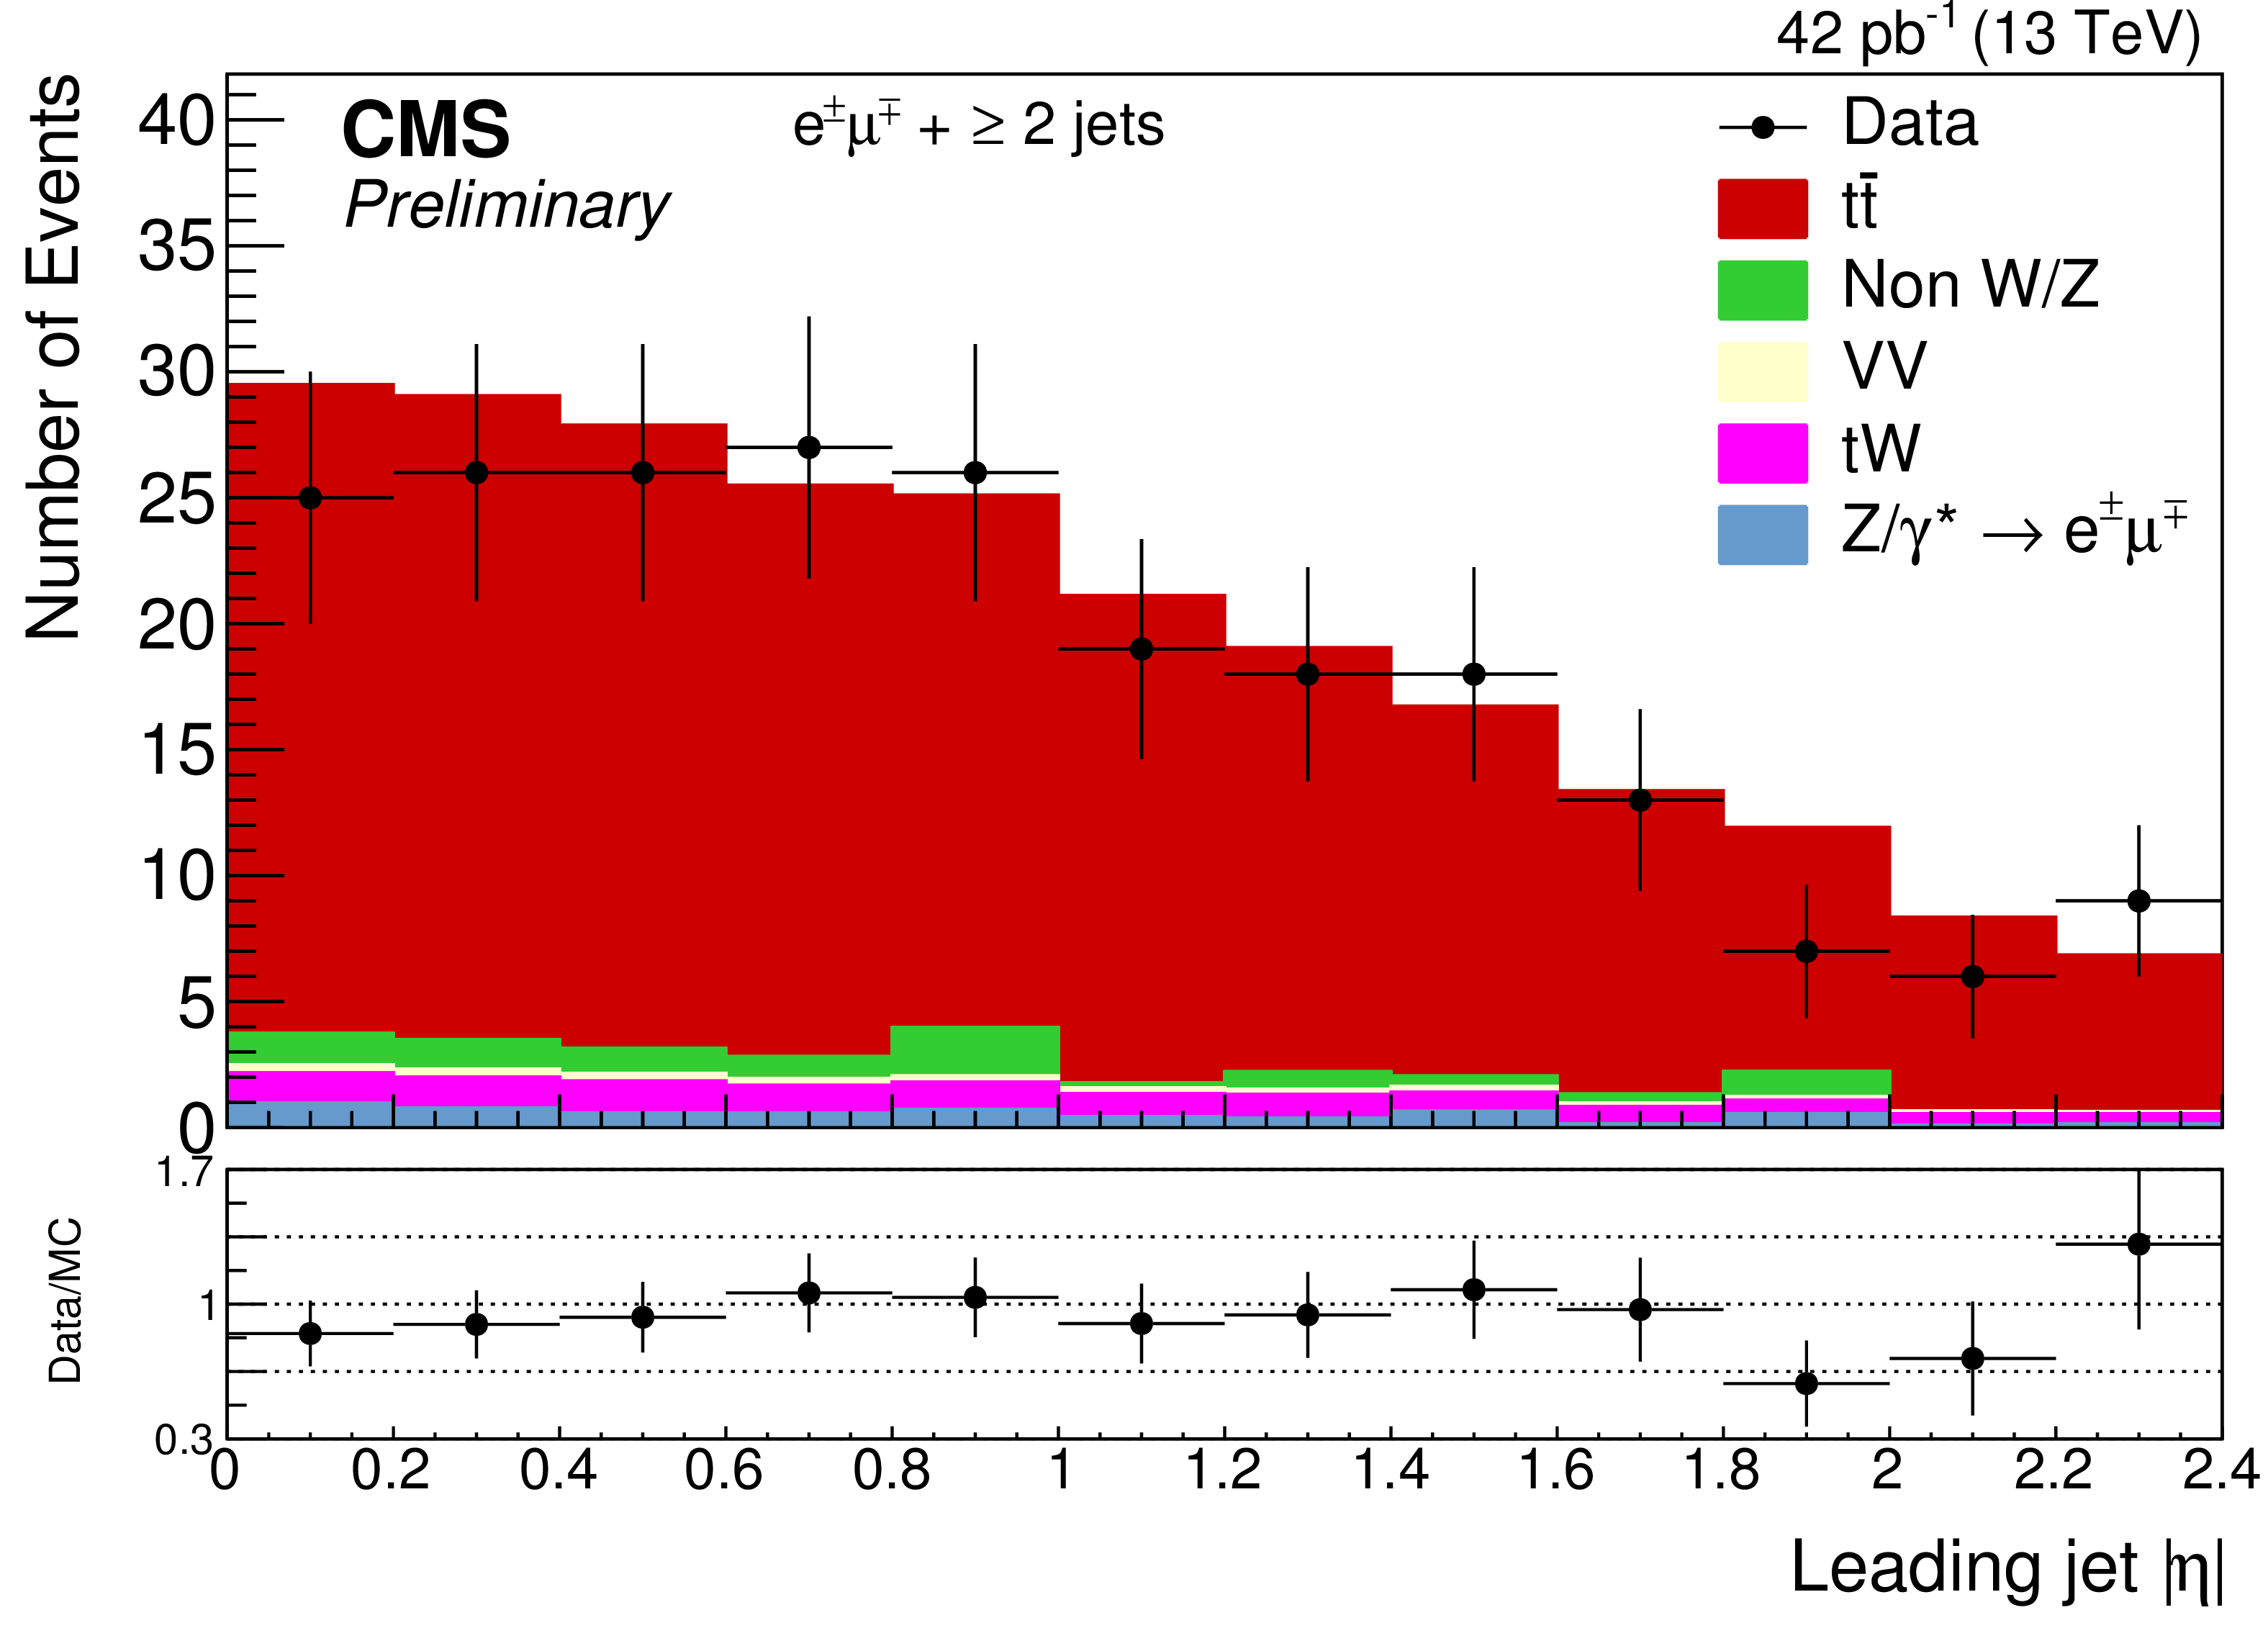
Figure 3-b:
The distributions for (a) $ {p_{\mathrm {T}}} $ and (b) $\eta $ for the highest-$ {p_{\mathrm {T}}} $ jet, and for (c) $ {p_{\mathrm {T}}} $ and (d) $\eta $ for the second highest-$ {p_{\mathrm {T}}} $ jet after all selections. The expected distributions for $ \mathrm{ t \bar{t} } $ signal and individual backgrounds are shown after data-based corrections are applied; for the left plots (a,c) the last bin contains the overflow events. The ratios of data to the sum of the expected yields are given at the bottom of each panel. |
png ; pdf |
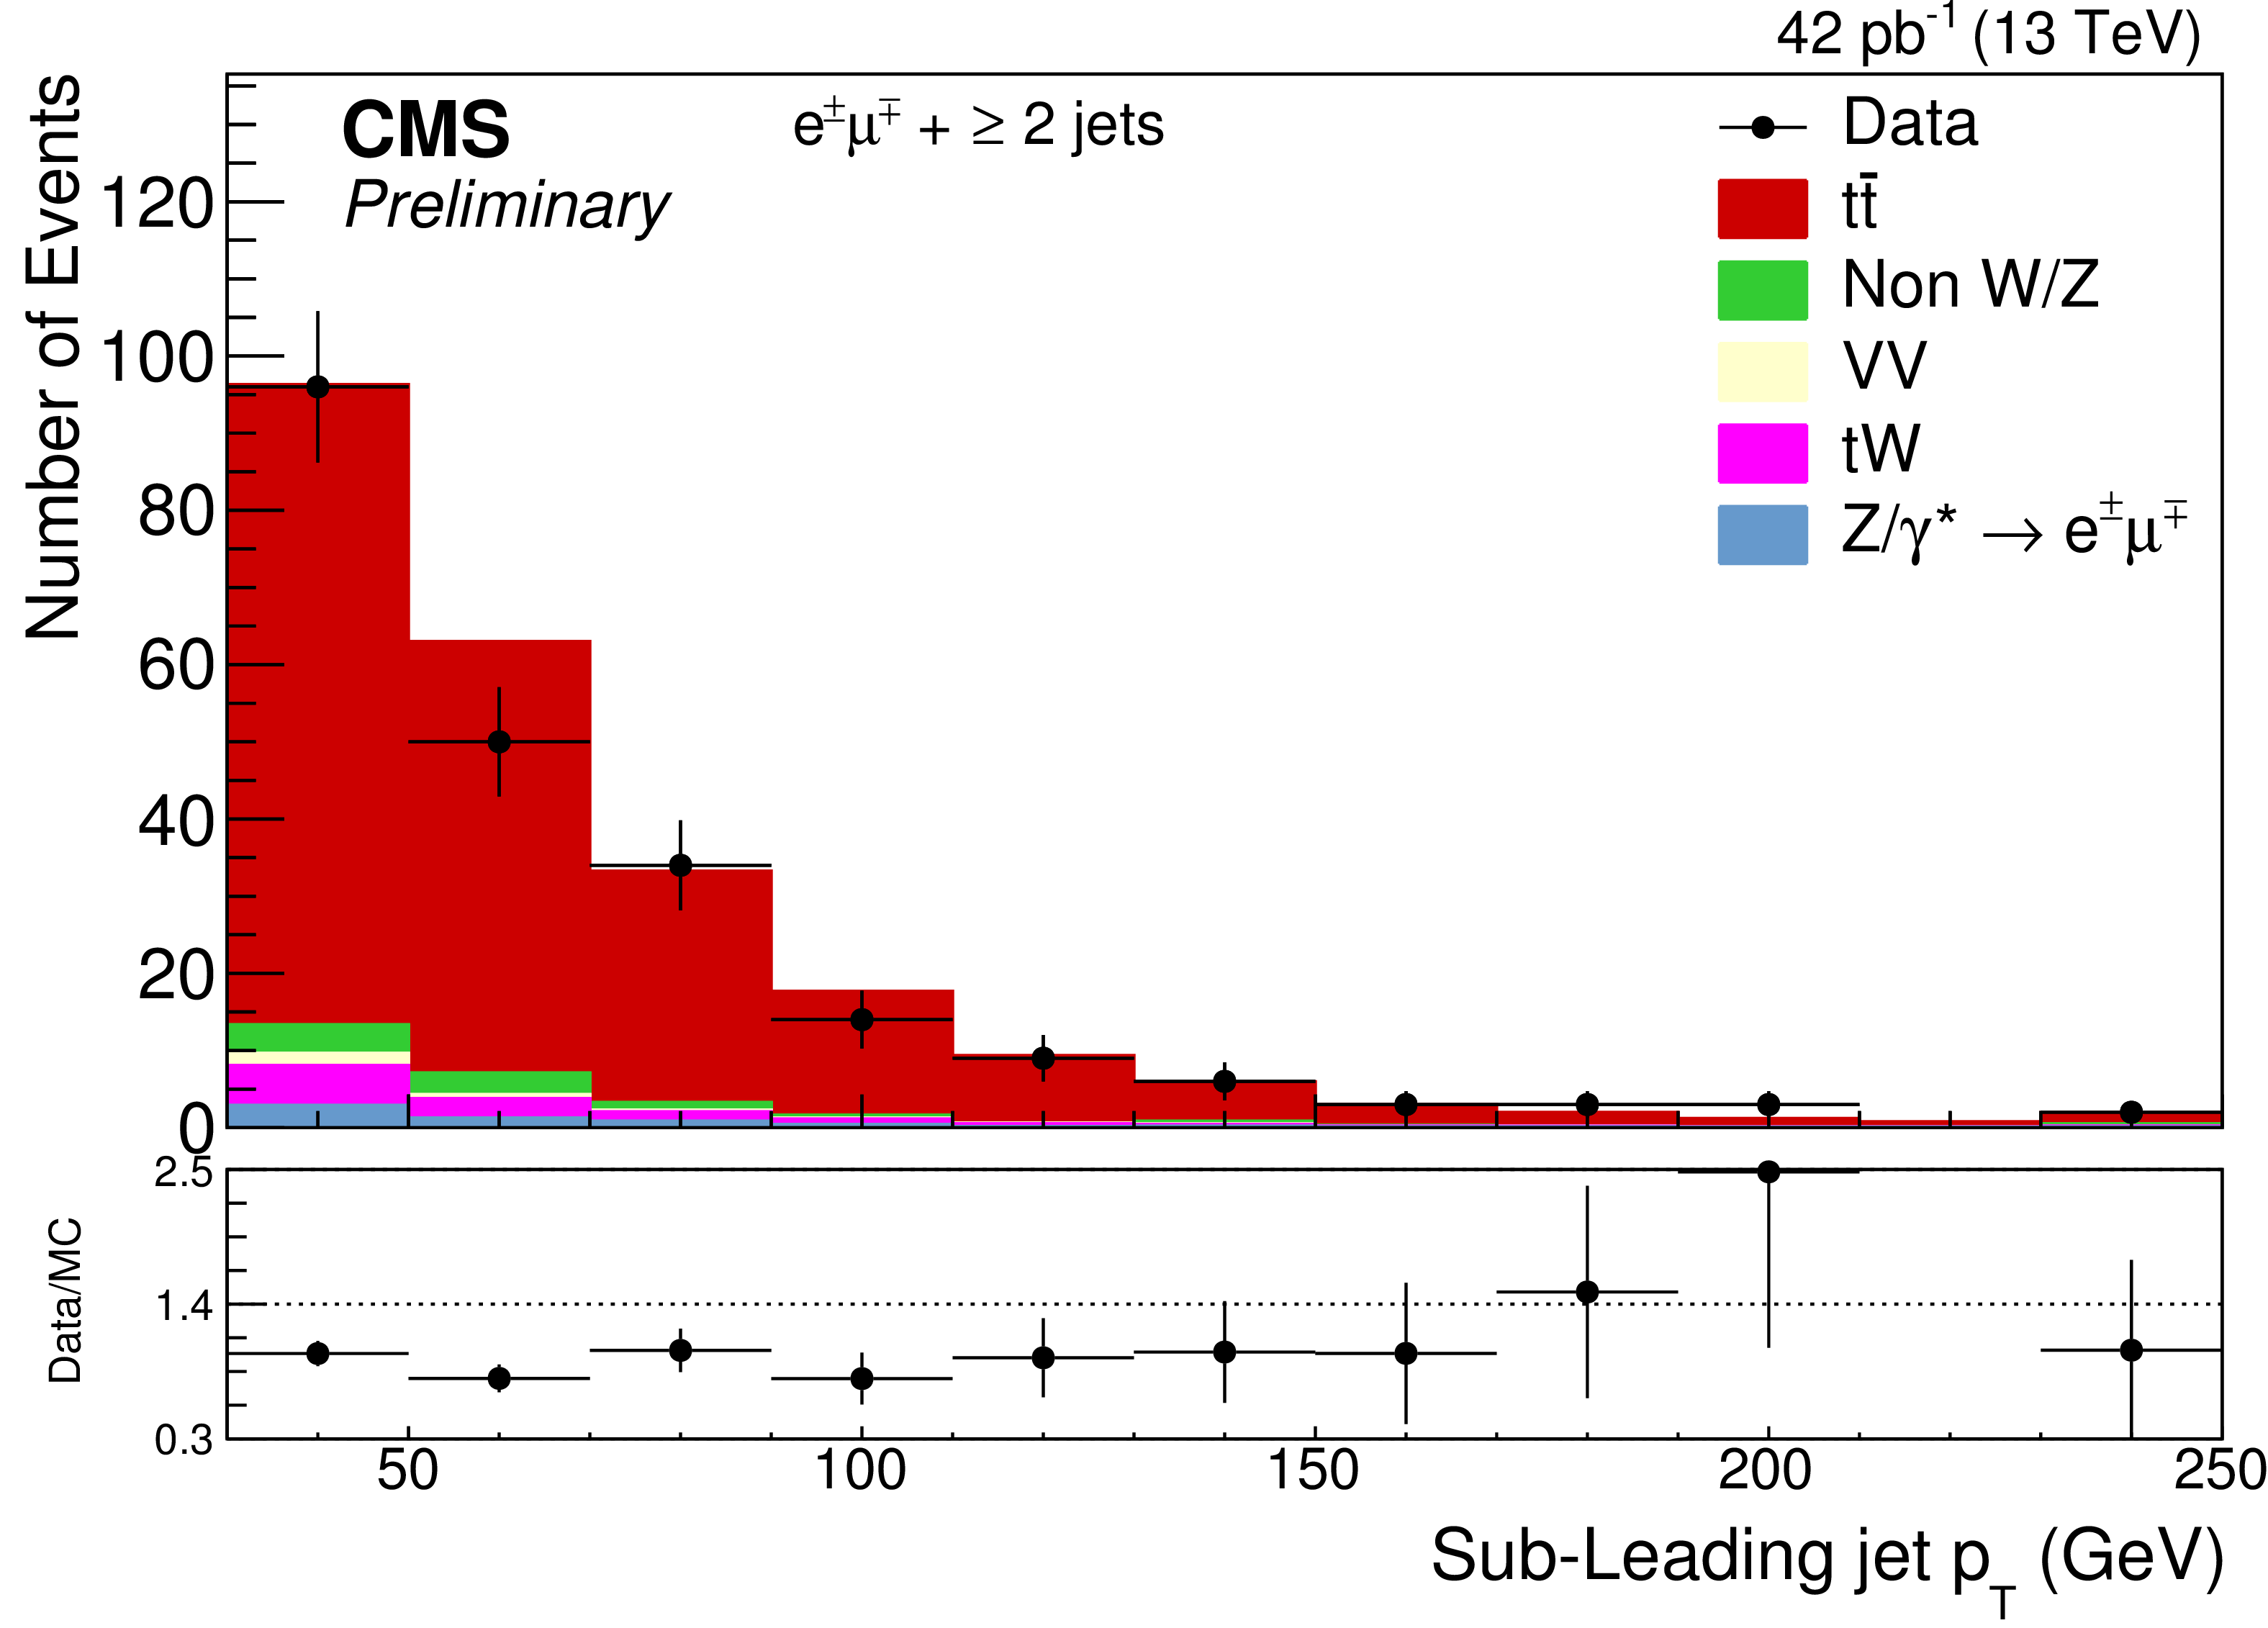
Figure 3-c:
The distributions for (a) $ {p_{\mathrm {T}}} $ and (b) $\eta $ for the highest-$ {p_{\mathrm {T}}} $ jet, and for (c) $ {p_{\mathrm {T}}} $ and (d) $\eta $ for the second highest-$ {p_{\mathrm {T}}} $ jet after all selections. The expected distributions for $ \mathrm{ t \bar{t} } $ signal and individual backgrounds are shown after data-based corrections are applied; for the left plots (a,c) the last bin contains the overflow events. The ratios of data to the sum of the expected yields are given at the bottom of each panel. |
png ; pdf |
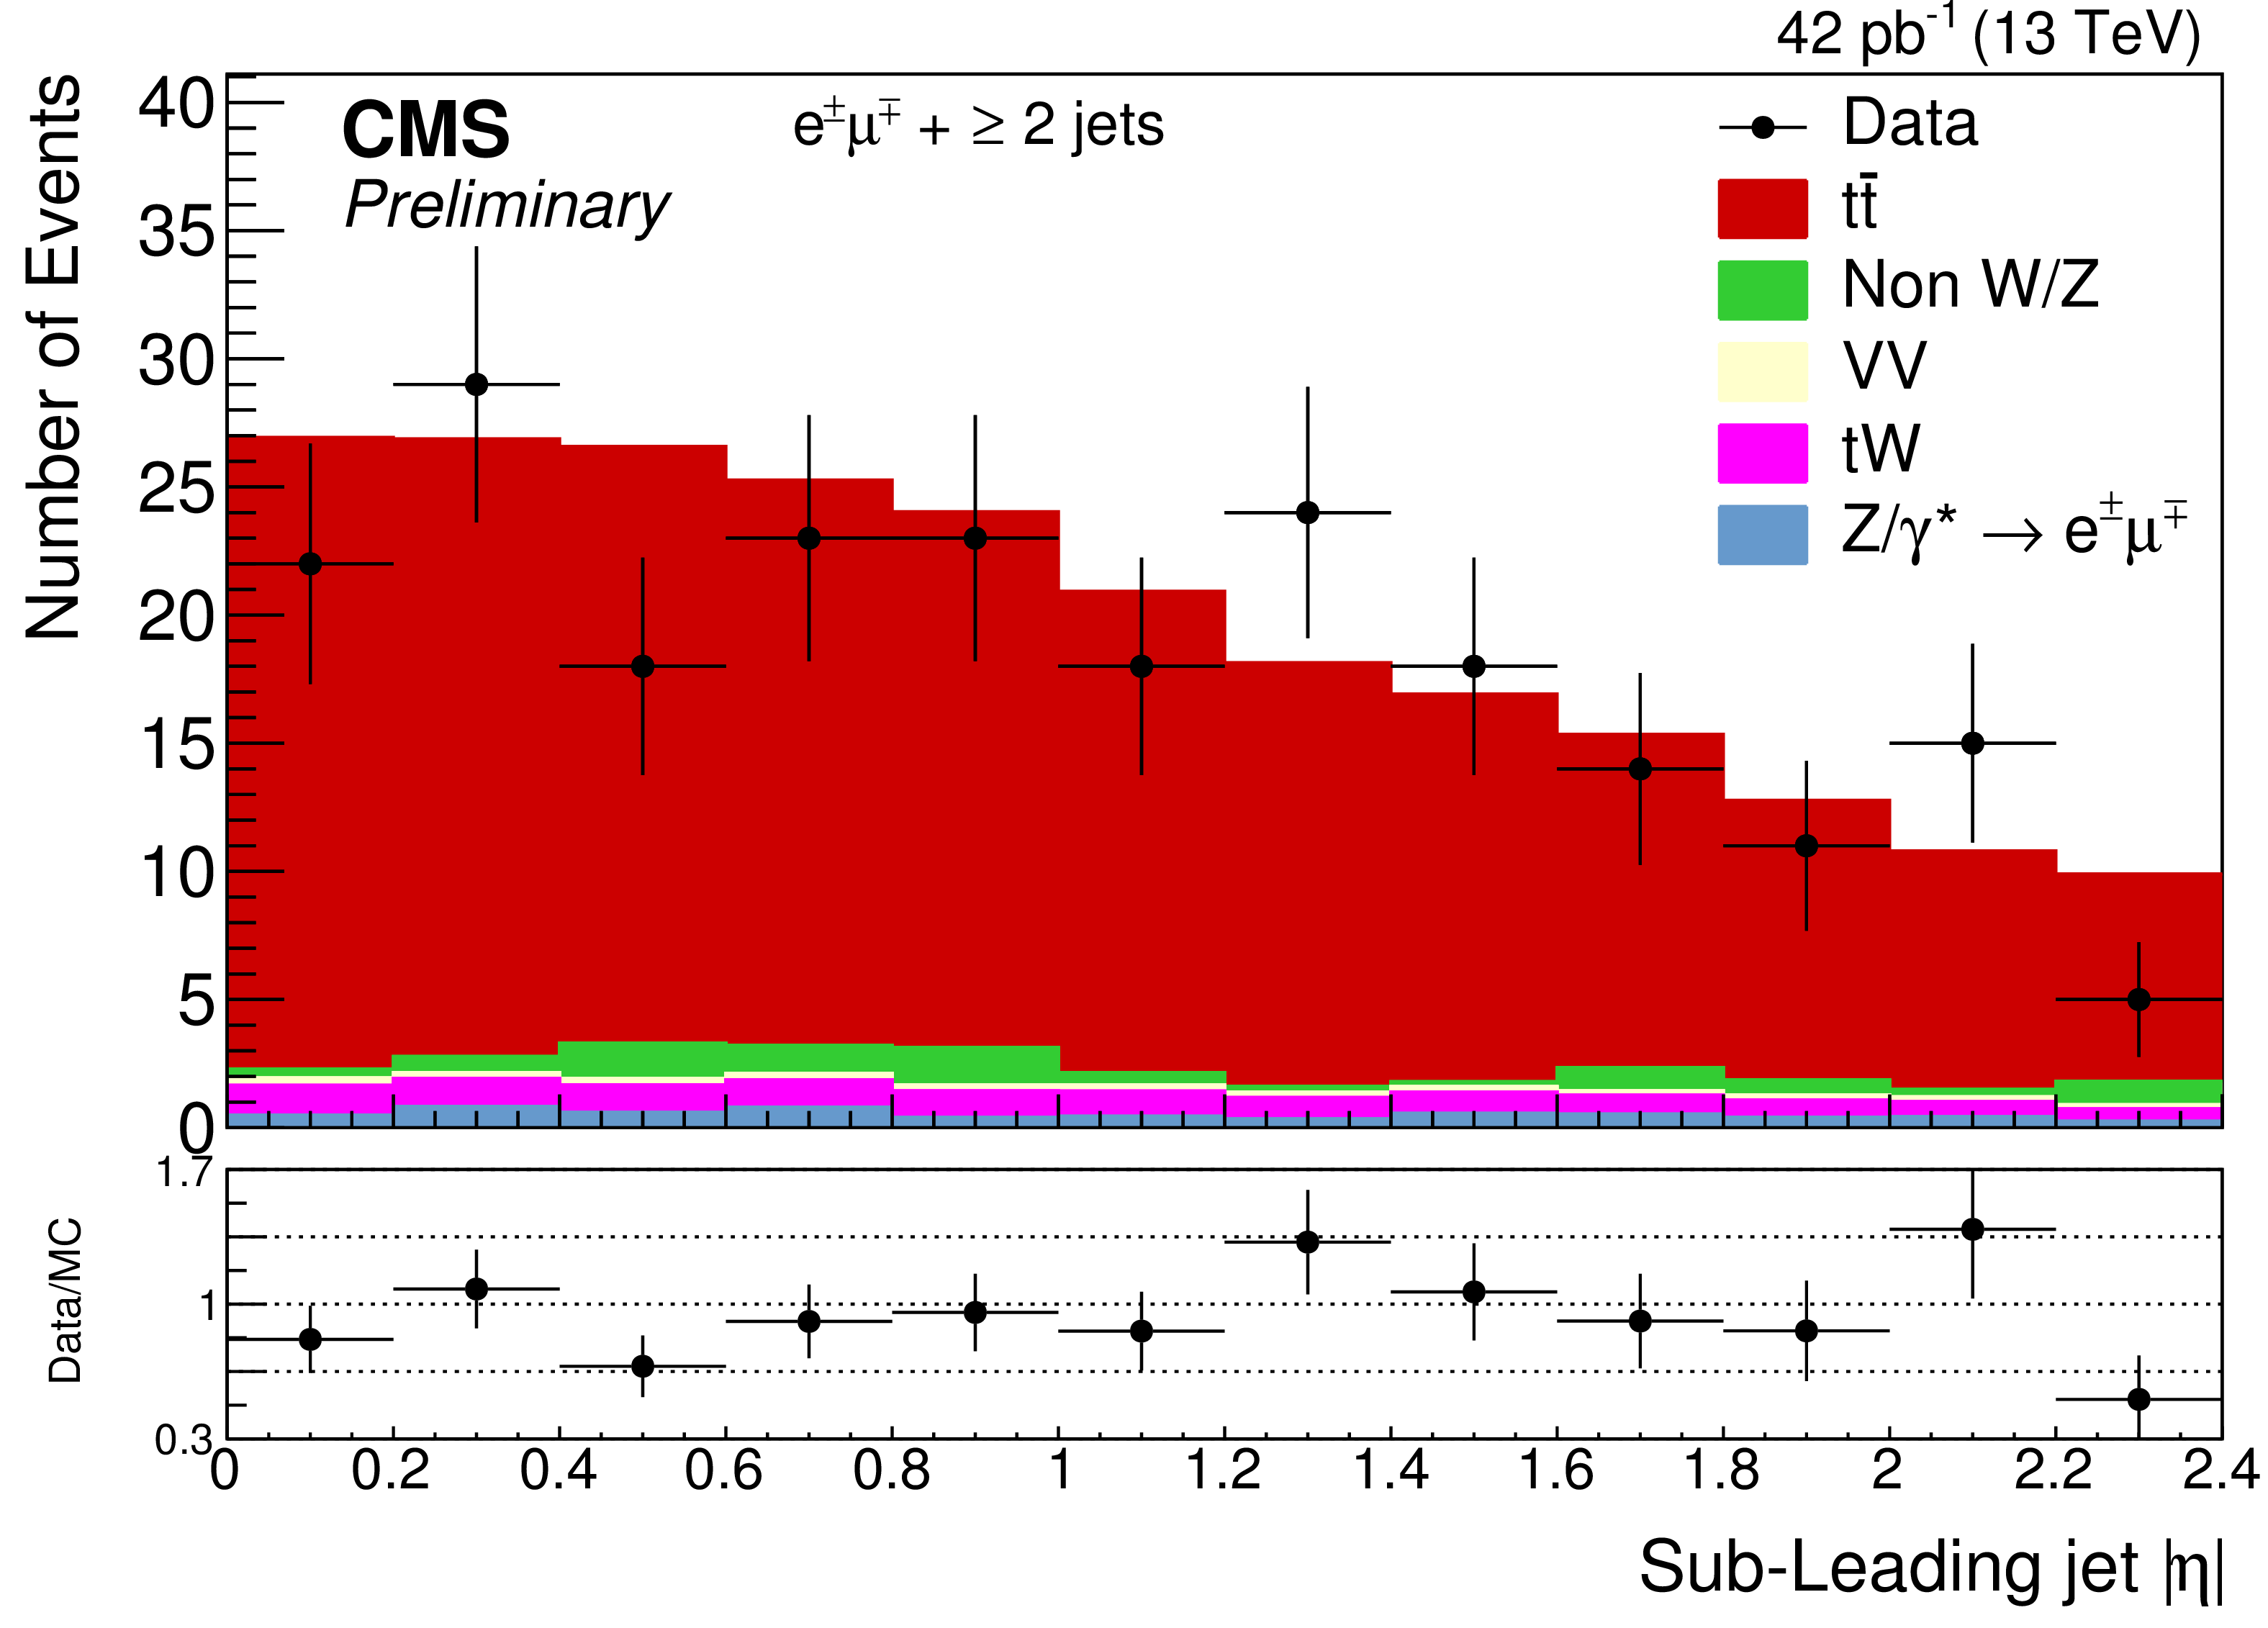
Figure 3-d:
The distributions for (a) $ {p_{\mathrm {T}}} $ and (b) $\eta $ for the highest-$ {p_{\mathrm {T}}} $ jet, and for (c) $ {p_{\mathrm {T}}} $ and (d) $\eta $ for the second highest-$ {p_{\mathrm {T}}} $ jet after all selections. The expected distributions for $ \mathrm{ t \bar{t} } $ signal and individual backgrounds are shown after data-based corrections are applied; for the left plots (a,c) the last bin contains the overflow events. The ratios of data to the sum of the expected yields are given at the bottom of each panel. |
png ; pdf |
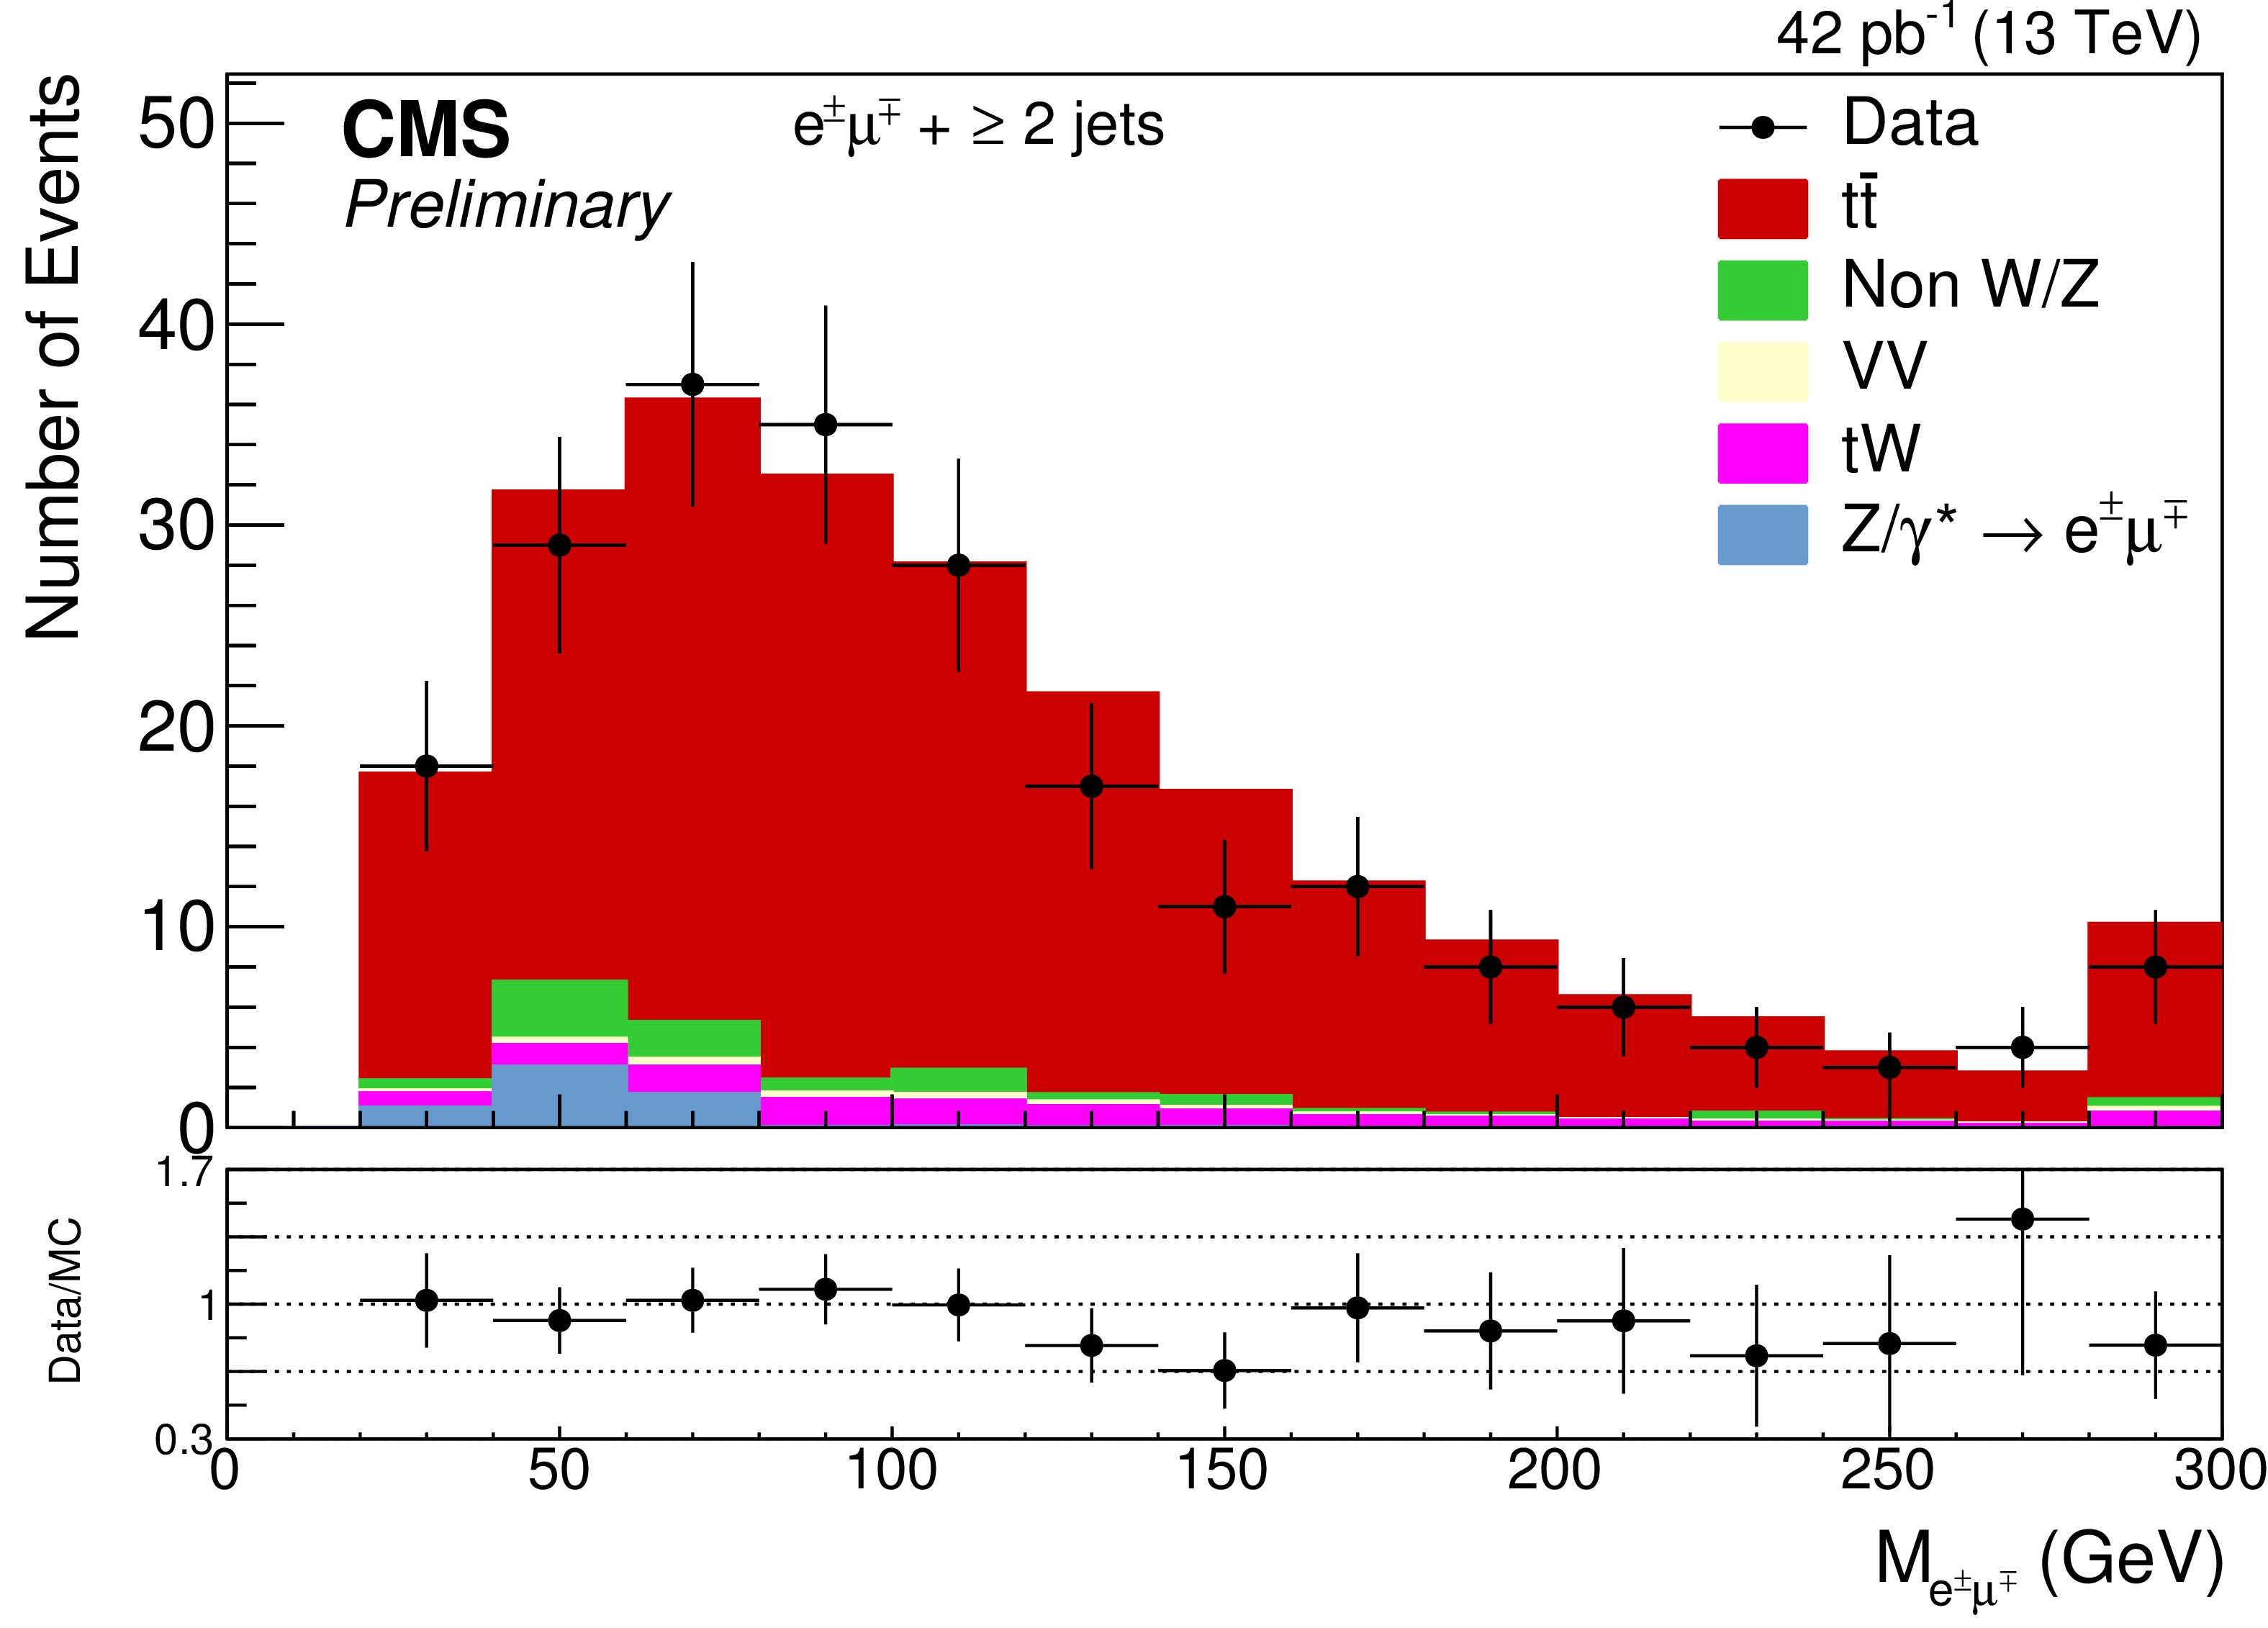
Figure 4-a:
Distributions in (a) the dilepton invariant mass, and (b) the difference in the azimuthal angle between the two selected leptons, after all selections. For the first plot the last bin contains the overflow events. The ratios of data to the sum of the expected yields are given at the bottom. |
png ; pdf |
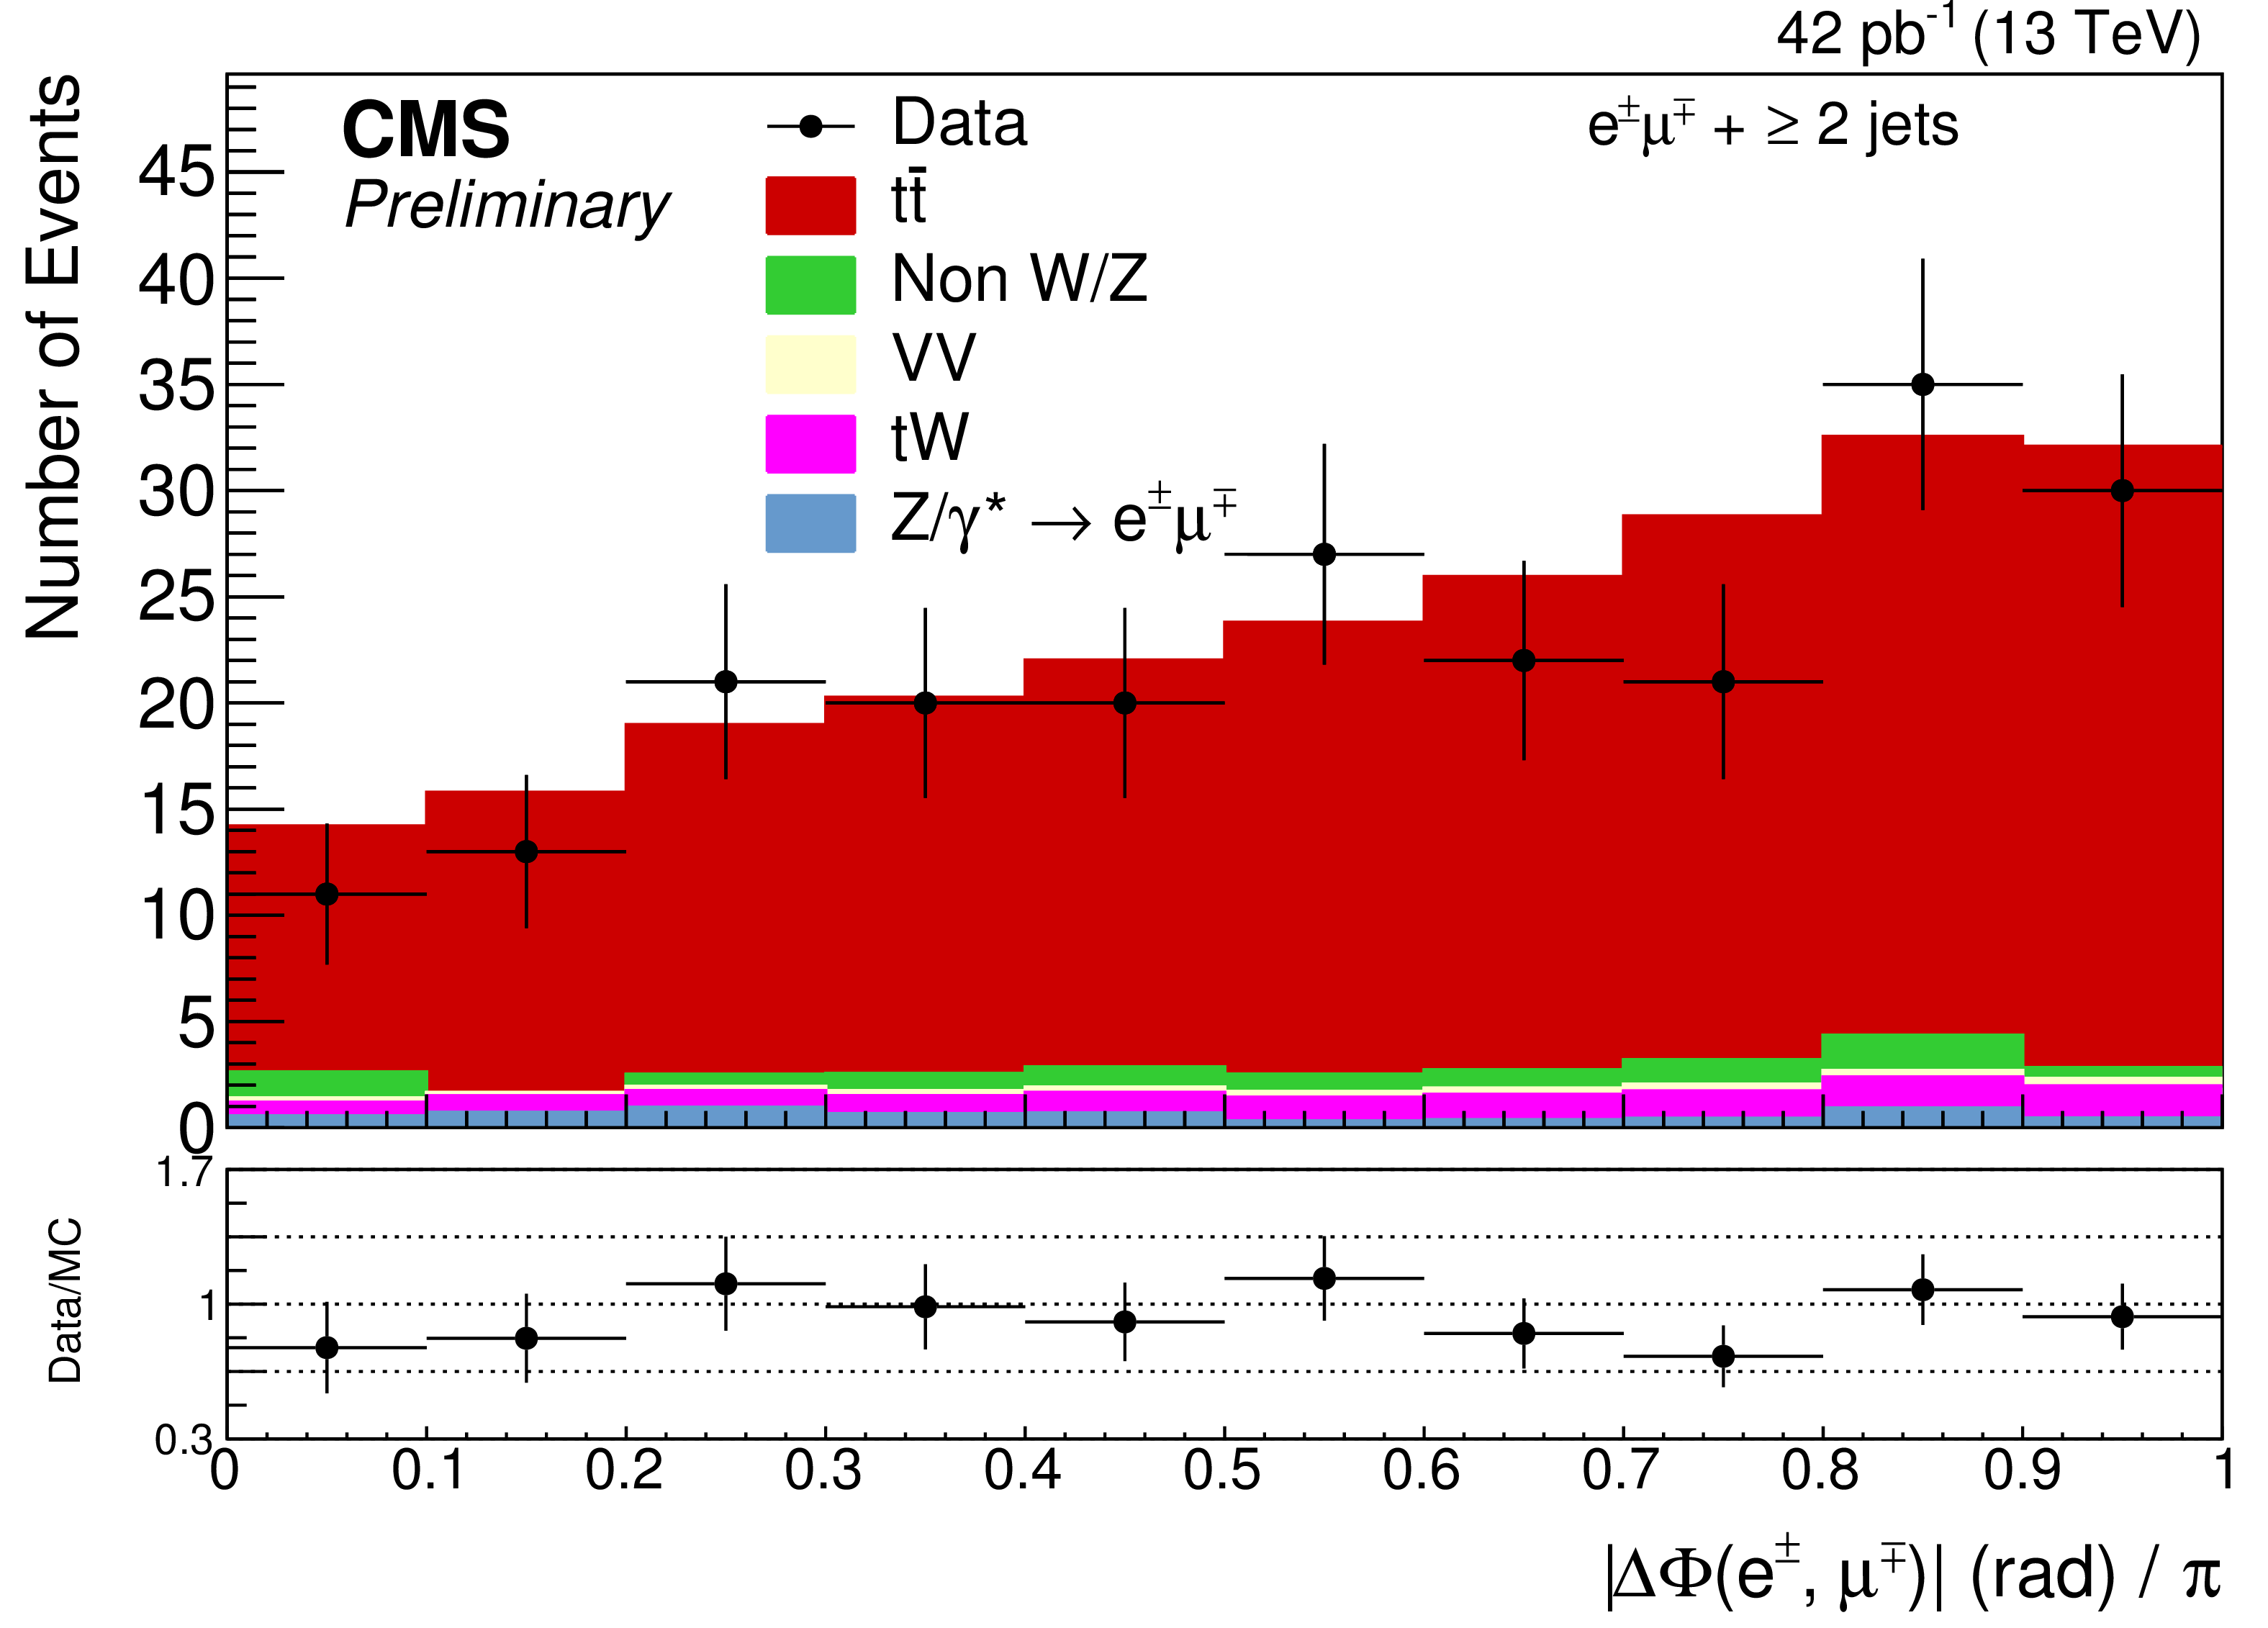
Figure 4-b:
Distributions in (a) the dilepton invariant mass, and (b) the difference in the azimuthal angle between the two selected leptons, after all selections. For the first plot the last bin contains the overflow events. The ratios of data to the sum of the expected yields are given at the bottom. |
png ; pdf |
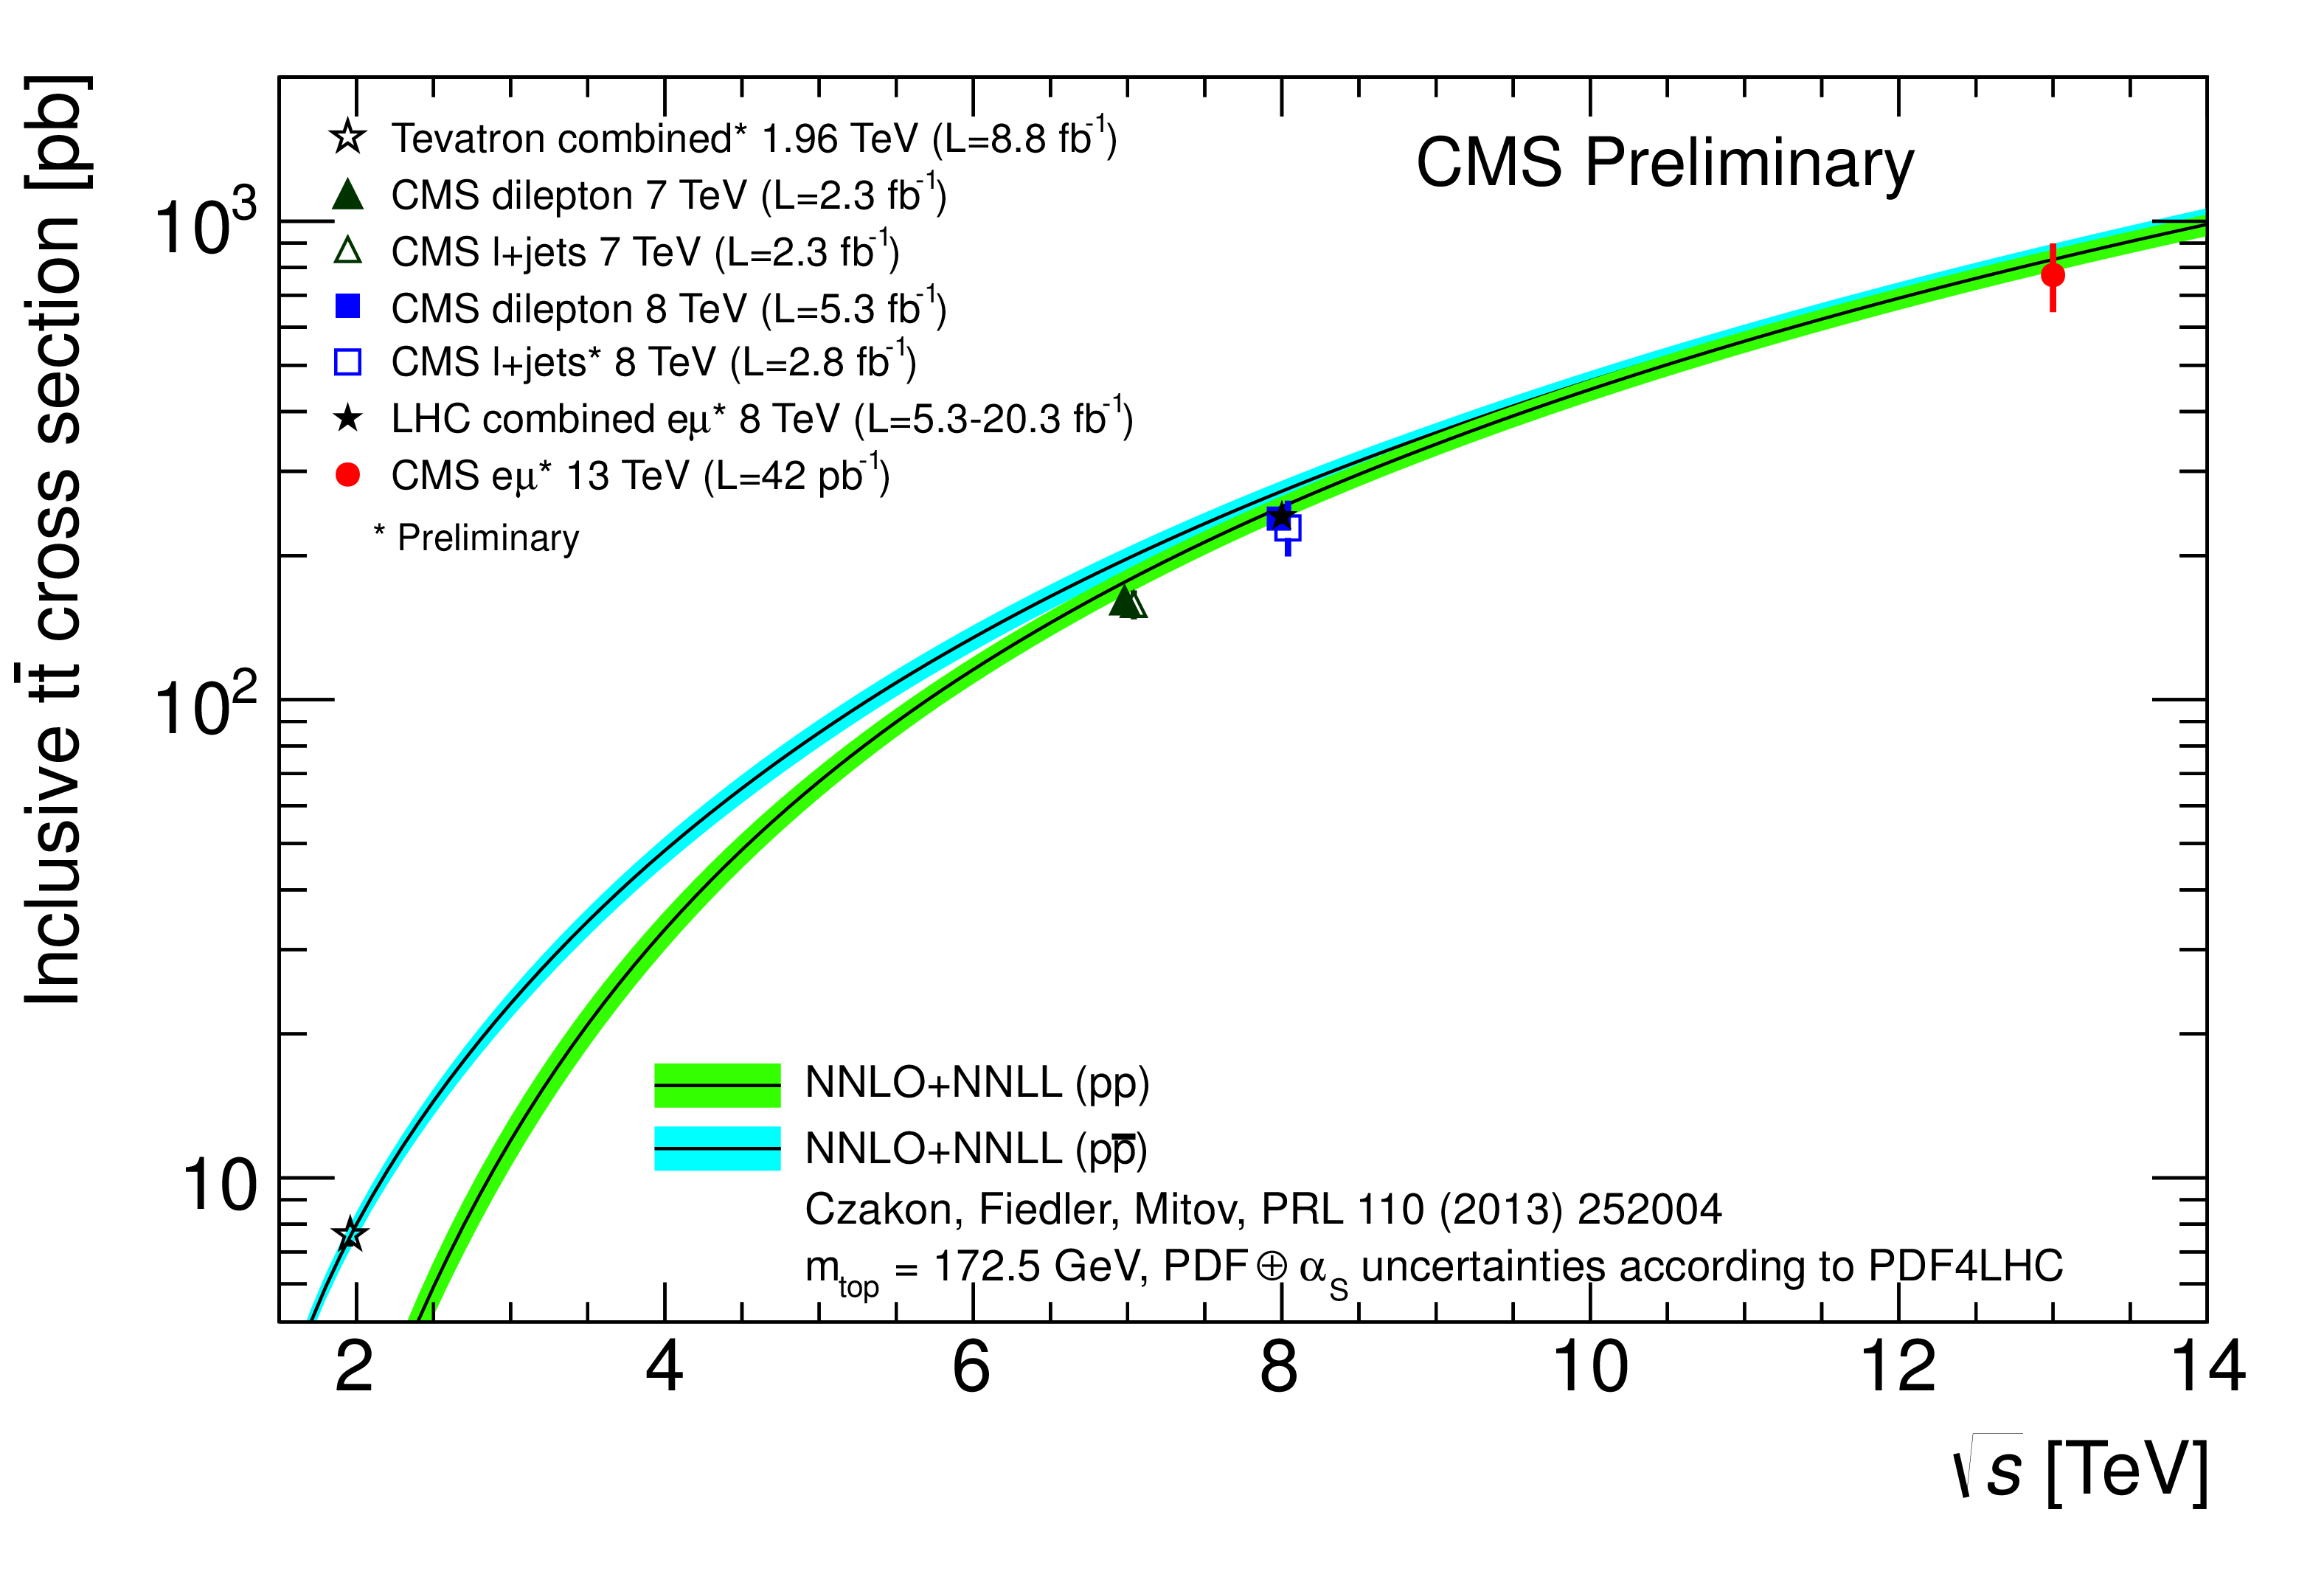
Figure 5:
Top quark pair production cross section in $\mathrm{ p \bar{p} } $ and $\mathrm{ p p } $ collisions as a function of CME. The Tevatron combination at $\sqrt {s}=$ 1.96 TeV are displayed, as well as CMS results at 7 and 8 TeV in the dilepton and semileptonic (``$\ell$+jets'') channels. For the $\mathrm{e}\mu$ channel, the LHC combination at 8 TeV and the CMS result at 13 TeV is shown. The measurements are compared to the NNLO+NNLL theory predictions. |
| Tables | |
png ; pdf |
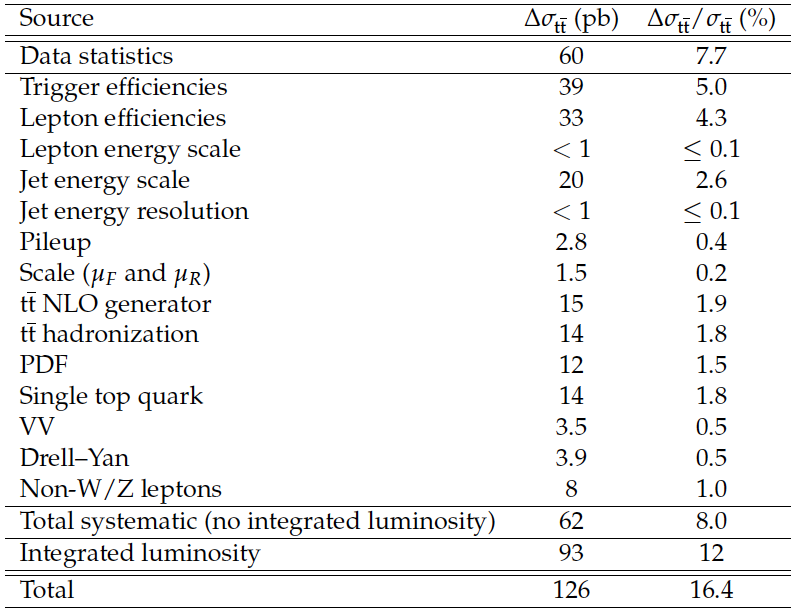
Table 1:
Summary of the individual contributions to the systematic uncertainty on the $\sigma _{ \mathrm{ t \bar{t} } } $ measurement. The uncertainties are given in pb and as relative uncertainties. The statistical uncertainty and the total uncertainty on the result are also given. |
png ; pdf |
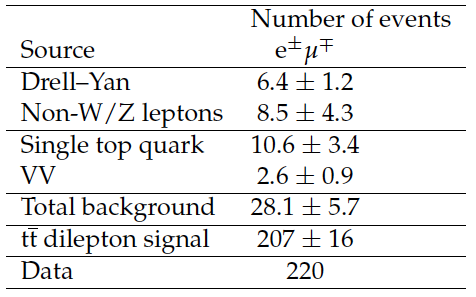
Table 2:
Number of dilepton events obtained after applying the full selection. The results are given for the individual sources of background, $ \mathrm{ t \bar{t} } $ signal with a top quark mass of 172.5 GeV and $\sigma _{ \mathrm{ t \bar{t} } }^{\rm NNLO+NNLL} =$ 832$^{+40}_{-46}$ pb, and data. The uncertainties correspond to the statistical and systematic components added in quadrature. |
| Summary |
| A measurement of the tt production cross section in proton-proton collisions at $\sqrt{s} =$ 13 TeV is presented for events containing an electron-muon pair and at least two jets. The measurement is obtained through an event-counting analysis based on a data sample corresponding to an integrated luminosity of 42 pb$^{-1}$. The result obtained is $\sigma_{\mathrm{t \bar{t}}} =$ 772 $\pm$ 60 (stat) $\pm$ 2 (syst) $\pm$ 93 (lumi) pb, resulting in a total relative uncertainty of 16.4%. This measurement is consistent with the SM prediction of $\sigma^{\text{NNLO+NNLL}}_{\mathrm{ t \bar{t } } } =$ 832$^{+40}_{-46}$ pb for a top quark mass of 172.5 GeV and with a recent measurement from the ATLAS Collaboration. |
|
|
Compact Muon Solenoid LHC, CERN |
|

|

|

|

|

|